Article

Extrusion-Based Additively Manufactured PAEK and PAEK/CF Polymer Composites Performance: Role of Process Parameters on Strength, Toughness and Deflection at Failure

1
Department of Mechanical Engineering, Center for Composite Materials, University of Delaware, Newark, DE 19711, USA
2
Weapons Sciences Division, DEVCOM ARL, Aberdeen Proving Ground, Harford County, MD 21005, USA
*
Author to whom correspondence should be addressed.
J. Compos. Sci. 2023, 7(4), 157; https://doi.org/10.3390/jcs7040157
Submission received: 1 March 2023 / Revised: 29 March 2023 / Accepted: 4 April 2023 / Published: 11 April 2023
(This article belongs to the Special Issue Additive Manufacturing of Advanced Composites)

Abstract

:
Poly aryl-ether-ketone (PAEK) belongs to a family of high-performance semicrystalline polymers exhibiting outstanding material properties at high temperatures, making them suitable candidates for metallic part replacement in different industries such as aviation, oil and gas, chemical, and biomedical. Fused filament fabrication is an additive manufacturing (AM) method that can be used to produce intricate PAEK and PAEK composite parts and to tailor their mechanical properties such as stiffness, strength and deflection at failure. In this work, we present a methodology to identify the layer design and process parameters that will have the highest potential to affect the mechanical properties of additively manufactured parts, using our previously developed multiscale modeling framework. Five samples for each of the ten identified process conditions were fabricated using a Roboze-Argo 500 version 2 with heated chamber and dual extruder nozzle. The manufactured PAEK and PAEK/carbon fiber samples were tested until failure in an Instron, using a video extensometer system. Each sample was prepared with a speckle pattern for post analysis using digital image correlation (DIC) to measure the strain and displacement over its entire surface. The raster angle and the presence of fibers had the largest influence on the mechanical properties of the AM manufactured parts, and the resulting properties were comparable to the mechanical properties of injection molded parts.

1. Introduction

Since the advent of 3D printing in different industries, the technology has seen increasing use in the past decade for either prototyping or part replacement. Due to the layer-by-layer manufacturing technique, one can tune the mechanical, biocompatibility or even surface properties at the microscale to tailor macroscale properties at a level not possible with traditional manufacturing methods such as extrusion, injection or compression molding and pultrusion. The material, chemical and physical properties as well as flow behavior and solidification characteristics affect the overall layer properties. 3D printers with environmental temperature control at the layer scale offer the unique capability to ensure thermal stability and layer adhesion while maintaining minimal warpage and shrinkage. Low-temperature materials such as ABS, PLA and PC can be easily used for the purpose of prototyping and proof of concept without the need to optimize print parameters or use sophisticated printers with environment control. Process optimization methods for low-temperature carbon fiber polymer composites such as CF reinforced ABS or PLA with different fiber contents have been the subject of many studies for part replacements [1,2,3,4]. However, there is still a need to optimize mechanical properties for high-temperature materials such as PAEK polymer which can be additively manufactured in temperature-controlled FDM printers [5].
The majority of research conducted in characterizing the behavior of high-temperature polymers is focused on understanding their material behavior, including the rheology, wettability and solidification of the extrudate layers which results in the formation of bead-to-bead bonding and layer-to-layer adhesion [6,7,8,9,10,11,12]. This process is complex due to existence of various challenges affecting material behavior at elevated temperatures, when molten polymer is deposited through a small nozzle orifice with a diameter ranging from 0.1 mm to 1.2 mm. The optimal print speed for a selected print temperature is defined through the relationship between viscosity and temperature [13]. The failure to consider melt flow behavior may result in a wide range of responses, including under-extrusion, nozzle cloggage, a rough surface finish, dimensional inaccuracy and low mechanical performance [10]. Another challenge is to consider the nature of polymer melt due to the orientation of the polymeric chains as soon as it extrudes out of the nozzle. Additionally, it is important to consider the wettability of the polymer chains and their interdiffusion behavior to ensure minimal residual stress and warpage [6]. Other limiting factors are solidification and bond adhesion, which are affected by the polymer chain’s interdiffusion or interlocking phenomena, coupled with ability to form crystallites in the case of semicrystalline polymers in which the cooling rate can greatly affect the degree of crystallinity [14]. In general, higher deposition temperatures are usually favorable due to the lowering of the viscosity, while faster cooling rates such as rapid quenching limit the formation of perfectly ordered crystalline regions [11]. However, the addition of carbon fiber assists mechanical properties but hinders processing at lower temperatures. Thus, the processing conditions that influence the rheological behavior of the material are critical, and should be taken into account to ensure fewer defects and better bond formation [13].
Most widespread applications of PAEK and PAEK with carbon fibers (PAEK/CF) are in the aviation industry, where replacement of metallic parts is favored because AM of composites can save weight, time and cost by avoiding traditional tooling requirements such as injection molds. The challenge is to maintain the equivalent mechanical performance of the PAEK/CF additively manufactured parts. With the emergence of new machines capable of 3D printing PAEK polymer and polymer composites, application of this class of polymers have extended beyond aviation industries to other sectors such as chemical plants, oil and gas and electronic sectors which benefit from the fact that this group of polymers are chemically, biologically and electronically inert [15]. The most recent applications are focused in the biomedical industry, where biocompatible PAEK polymers are FDA approved, with proven high-performance properties in surgical tool manufacturing applications alongside orthopedic implants with tunable properties [3,4,16].
Trial and error AM experimentation for optimizing the process parameters of PAEK polymers during fabrication is an inefficient and time-consuming approach [17,18]. There is a lack of well-defined and comprehensive methods to predict macroscopic response based on microscopic parameters and optimize them to improve mechanical performance [5]. A recent review article [19] indicated a broad experimental approach to improving PAEK mechanical performance by modifying the surface or addition of different reinforcements such as carbon fiber, ceramic or even metallic-based particles. However, layer design and process parameters during AM are not thoroughly considered and investigated. The fused filament additive manufacturing process parameters that will play a role are either environmental or 3D printer parameters such as (1) nozzle diameter, (2) nozzle shape, (3) oven temperature (i.e., bed temperature), (4) deposition speed and (5) fan speed, or slicing parameters such as (1) raster angle (the angle between two consecutive beads), (2) infill density (how much material is deposited in each layer), (3) infill shape (layer architecture and porosity), (4) layer height (thickness of each layer), (5) infill overlap (the overlap between exterior seam for each layer and infill structure), (6) extrusion width (the width of extrudate leaving the nozzle), (7) shells (the number of continuous lines forming perimeter of each layer), and (8) support (the number of homogenous +/−45 degree 100% infill layers at the top and the bottom of each part). Small changes in nozzle shape [20] and diameter have previously been shown to have a negligible effect [11]; therefore, we have not considered them in our analysis. However, we have considered the change in the layer height, which indirectly has a similar effect as the nozzle size. The deposition speed affects the temperature change during processing, and is considered to have a similar effect on mechanical properties as temperature. Therefore, considering the effect of deposition speed and layer height indirectly for oven temperature and nozzle size, only nine out of the thirteen aforementioned parameters are needed to investigate the direct effect on the mechanical performance of fused filament fabricated parts.
Conducting experiments for all nine of these parameters using full fractional factorial with three intensities (low, medium, high) would require 39 (19,683) experiments. Considering the redundancy present in the full factorial design, we decided to employ a screening method to identify critical parameters that have the most influence on the properties. Screening methods based on Plackett–Burman or on Resolution III fractional factorial design focus only on the main parameters or any confounding variables without considering their intensities [21]. For instance, the Plackett–Burman approach suggests the choice of any number of experiments divisible by four, while the Resolution III fractional factorial design only focuses on main factors with correlation factors [22]. Neither of these screening methods are ideal for the present study, as optimizing parameters and their intensities is not feasible considering the required number of experimental studies. Therefore, there is a need for an offline optimization tool to help down-select parameters and their intensities prior to any attempt to design an experiment [23].
Our modeling framework, unlike other methods [24,25,26] which are based on geometry simplification and multiple test trials to define representative volume elements (RVEs) for a specific design, uses the actual geometry of the part and loading conditions to predict the macroscopic response [27]. The other drawbacks of previous modeling methods lie in their applications, which are limited due to the unknown nature of load transfer and interface strength and lack direct correlation between experimental results and the proposed modeling framework. Our formulation is based on a constitutive, phenomenological, continuum-based model which only requires two sets of experiments for calibration; one to define the RVE and one to assign the material model at the RVE level. Then, the calibrated model can be used to optimize the target macro-property. In the current study, the target property chosen is deflection at failure, and it is optimized by varying the processing parameters.
In this paper, by using the proposed modeling framework, we conducted an offline numerical study to design the part and down-select the key processing parameters that have the greatest effect on the target property (deflection at failure). Then, we fabricated ten sets of dog bone samples for experimental characterization. In each set, only one of the ten parameters was varied. We conducted tension tests along with digital image correlation (DIC) for all the samples. This allowed us to determine the differences in elastic properties over the assigned gauge length, and identify the process parameters that have the largest effect on these properties. Finally, the results are presented, followed by discussion and conclusion.

2. Offline Study Using Multiscale Modeling Framework

Using our previously developed multiscale modeling approach [27], we have considered three intensities for each parameter in a sensitivity analysis of a total of six layer design parameters out of nine target parameters, as shown in Table 1. In fact, the effect of environmental parameters such as bed and nozzle temperature as well as fan speed are excluded, because creep studies and crystallization kinetics would be needed to develop a comprehensive FE model to translate the effect of these parameters at multiscale. Therefore, multiscale modeling that uses material properties assigned to the RVE at the microscale, combined with previously set boundary condition (B.C.) in ANSYS software, is used to solve for the deflection at failure for each corresponding process design. The G-code, which defines the processing procedure, is developed using the selected processing parameters and their intensities, with the aim of predicting the resulting deflection at failure.

3. Design of Experiment with Down Selected Parameters

Our multiscale model predictions, as discussed in the previous section, allowed us to identify parameters that most influence the deflection at failure and find their optimal values. Another important objective in our offline analysis was to identify the best combination of parameters to achieve homogenous layer architecture, and therefore properties to produce parts that are more comparable with traditional manufacturing processes such as injection modeling. Using this approach, we conducted an experimental study with the down-selected parameters listed in Table 2.

4. Experimental Method

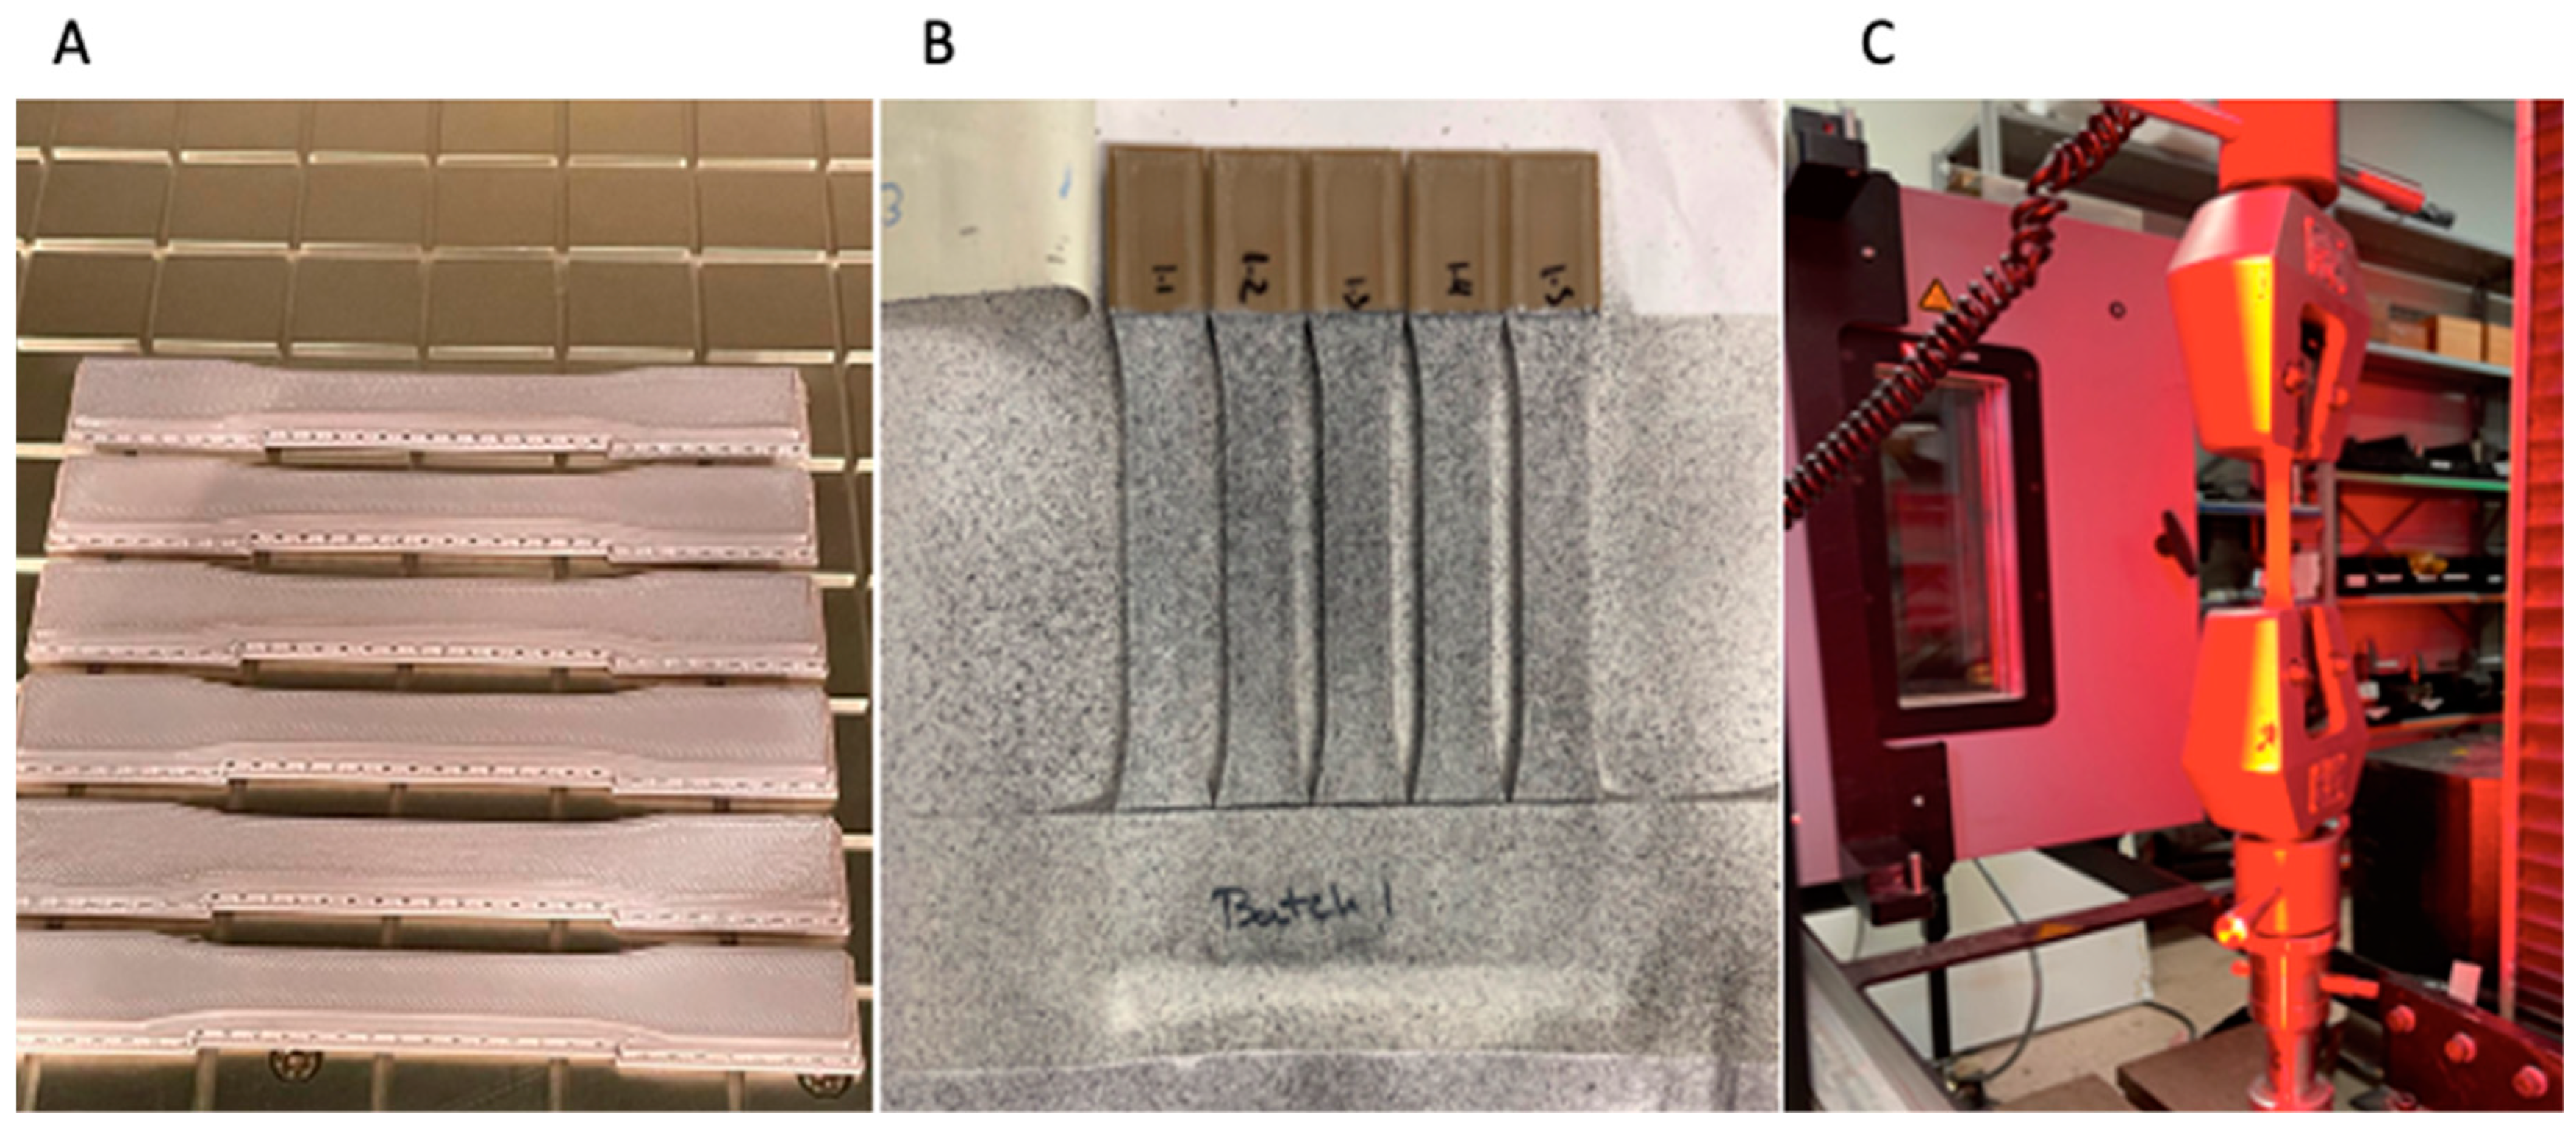
4.1. Preparation of PAEK and PAEK/CF (10% wt.) Samples

A high-temperature Roboze-Argo 500 version 2, AM machine with heated chamber and dual extruder nozzle with 0.4 mm diameter was used to prepare dog bone samples for testing to determine the mechanical properties and deflection at failure. Solidworks software was used to design and prepare the STL digital files to 3D print the samples. Then, the generated STL files were sliced using Simplify3D software to populate the G-code files, which were loaded into the Roboze high temperature 3D printer to additively manufacture the dog bone samples. The nominal dimensions of the samples manufactured for the tensile test are based on ASTM D638-Type V [28], with a thickness of 3.18 mm.

4.2. Material Characterization

The thermal transition and enthalpies of pure PAEK and PAEK/CF filaments as well as thermal history of selected processes are listed in Table 3, alongside the thermogravimetric analysis.

4.2.1. PAEK and PAEK/CF Rheology

Rheological properties are benchmarked from manufacturer thermal analysis results compared to the recently published literature [29] to identify the category of PAEK polymer, which is PAEK-A5. We conducted DSC analysis to compare thermal transitions and confirmed the type of PAEK polymer used, as shown in Figure 1. Published viscoelastic data [29] at 370 °C–390 °C indicate its stability at melt state; however, at temperatures beyond 390 °C, more branching and improvement in processability is expected. TGA analysis was conducted to confirm that processing of 3D printed PAEK or PAEK/CF in the range of 420 °C–450 °C did not show evidence of degradation. To additively manufacture at elevated temperatures, the knowledge of thermal history and the role of cooling rate on degree of crystallinity would be essential.

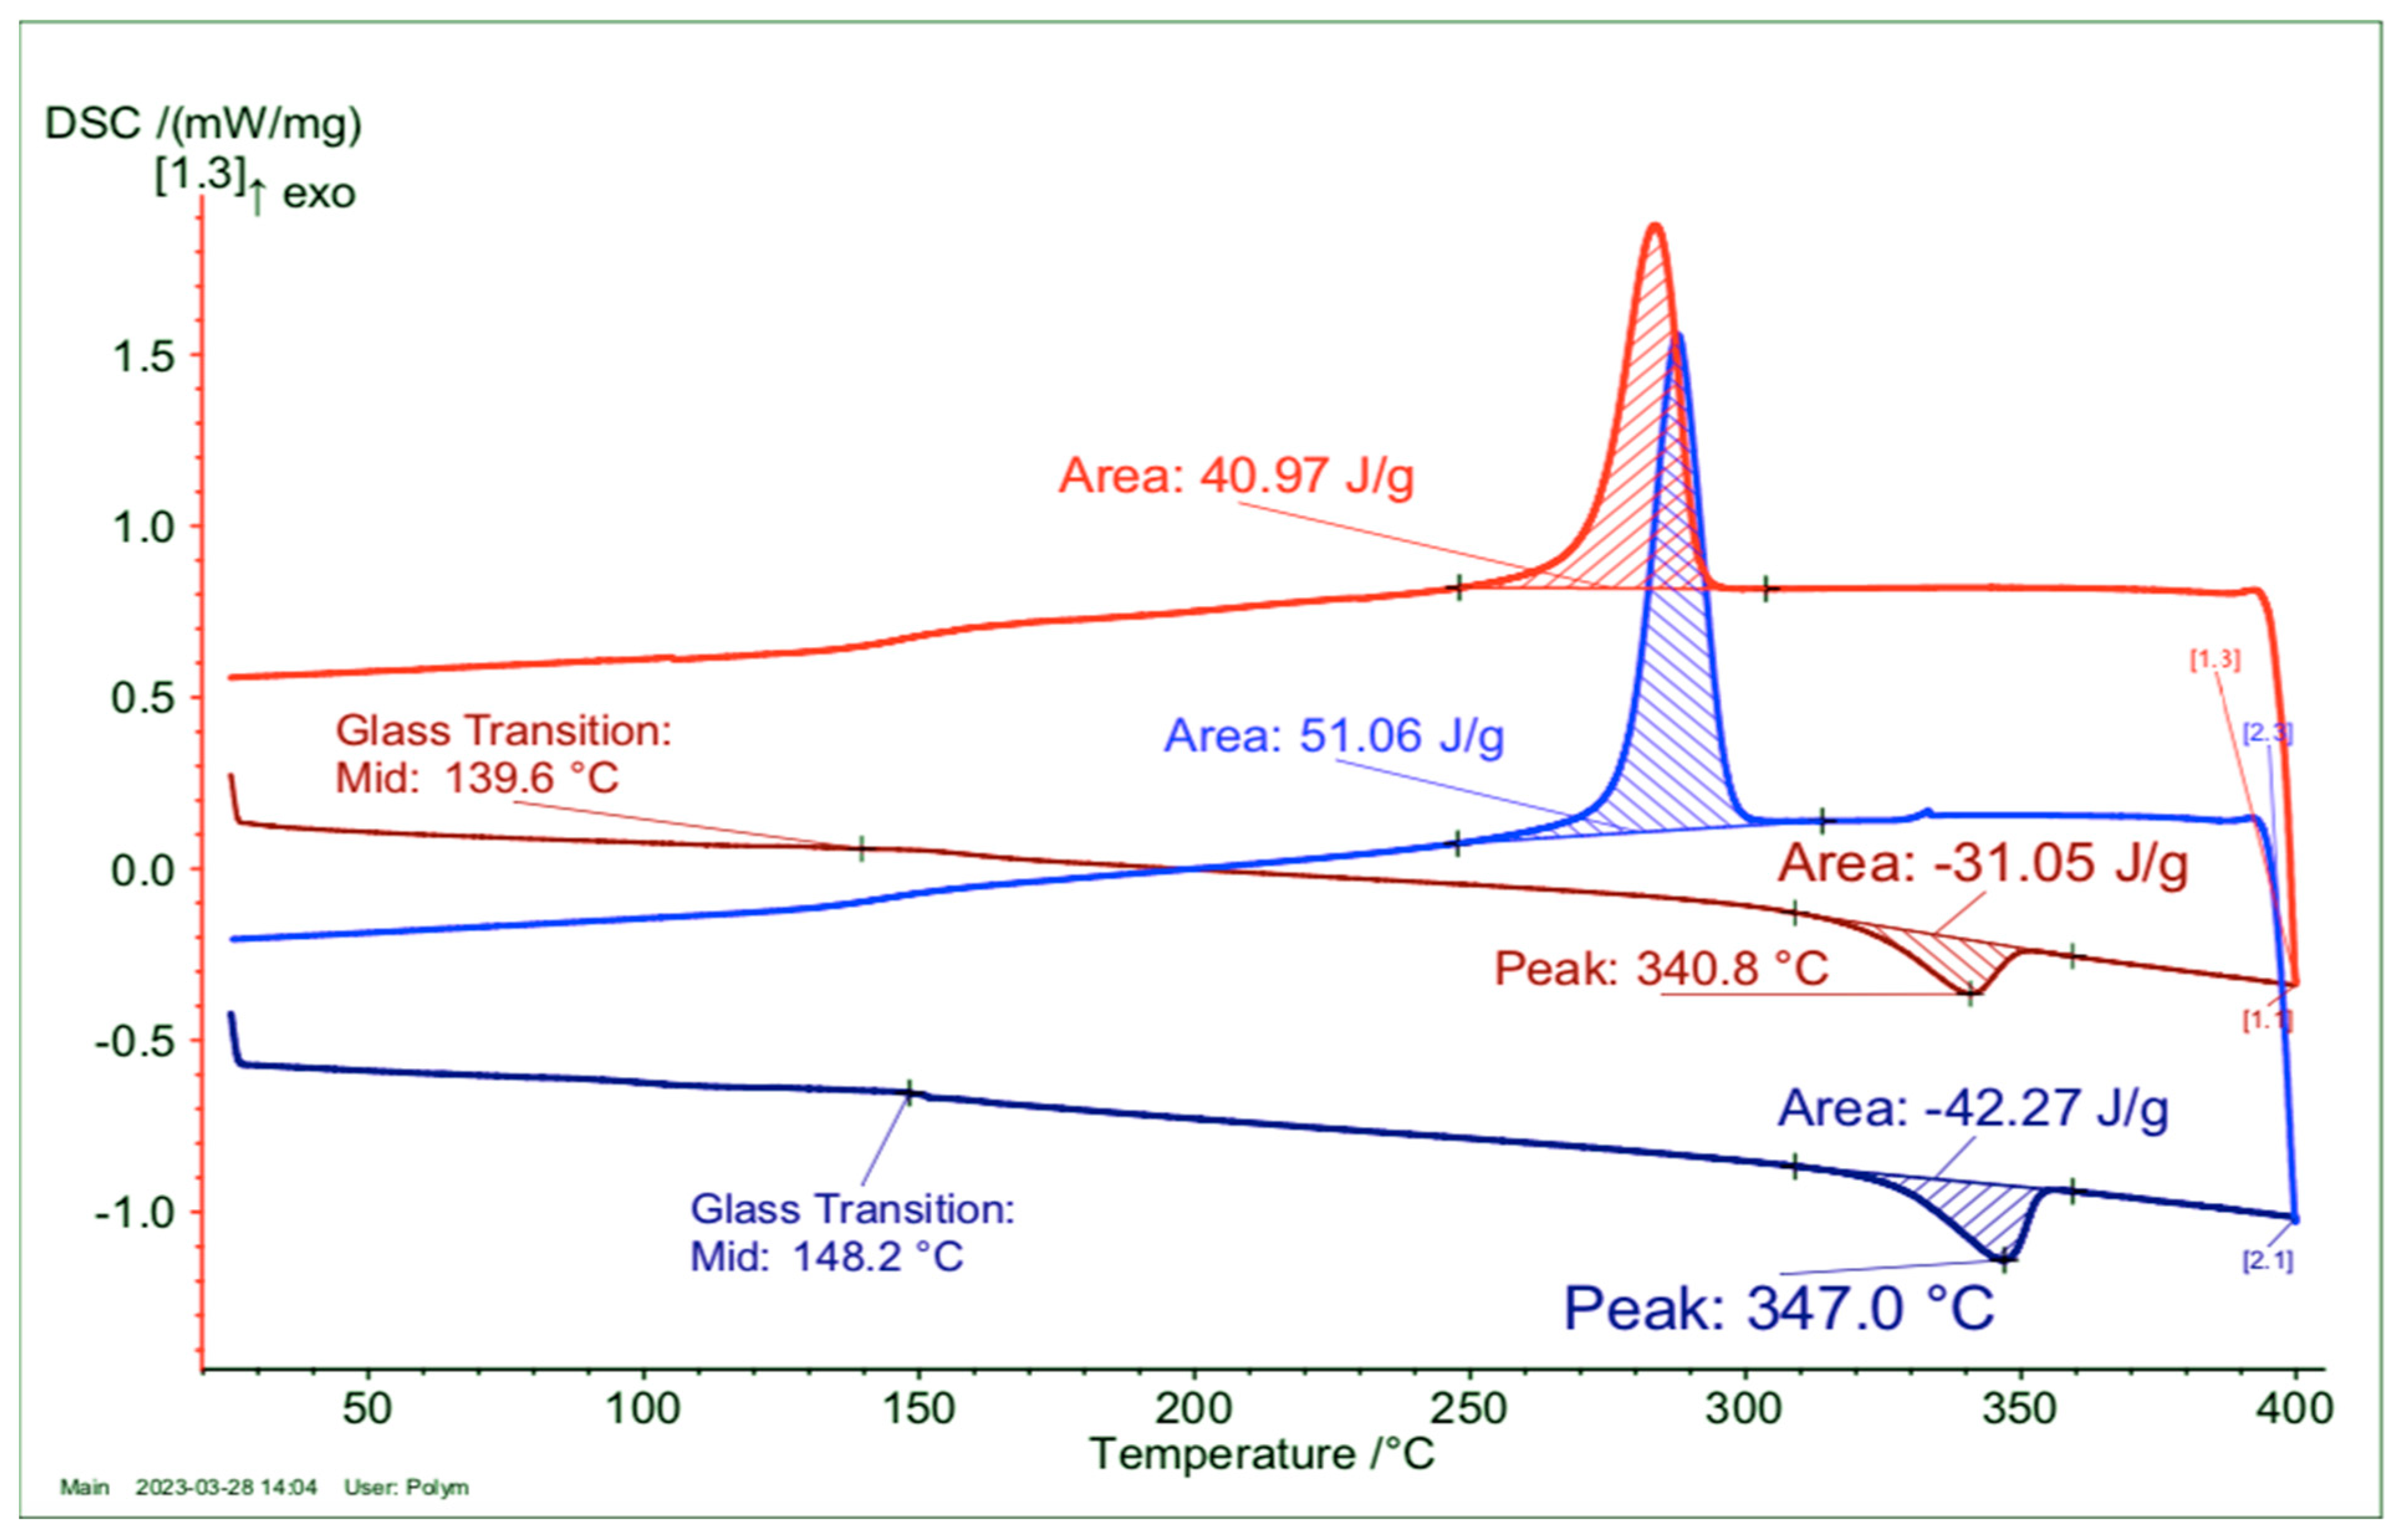
4.2.2. Thermal Analysis Using DSC

DSC analysis is a major characterization technique to study effect of processing parameters as well as cooling rate on degree of crystallinity. Measuring the area under the melting curve is a standard method to evaluate thermal history of printed samples made under different processing conditions shown in Table 2. The effect of cooling rate on degree of crystallinity of PAEK and PAEK/CF samples, shown in Figure 2, can form the basis to develop a crystallization kinetics model but is beyond the scope of this study.
Details of sample preparation: PAEK and PAEK/CF filaments are tested using a DSC Proteous 214 machine using encapsulated samples 9–11 mg in pierced aluminum pans. After heating the samples at 5 K/min from room temperature to 400 °C, followed by a 5 min isothermal step to ensure that samples are completely melted, they are then cooled at 20 K/min under a nitrogen flow rate of 40 mL/min. This procedure was used to obtain the thermal properties of various samples with different thermal histories, as shown in Table 3.
Figure 1 shows the DSC curves for PAEK and PAEK/CF filaments. To calculate the degree of crystallinity, the measured area under the melting curves is divided by heat of fusion for the complete crystalline sample, which is 131.9 J/g, from the Roboze data sheet [30].
Table 3 shows the thermal transitions of filaments from the manufacturer data sheet, which are consistent with the DSC results from Figure 1. The average thermal history of three samples from each material condition is reported in rows 3–9. The results in row 4 compared to row 3 show that increasing the oven temperature from 160 °C to 180 °C, which will promote annealing, has a negligible effect on the degree of crystallinity. On the other hand, the highest degree of crystallinity is obtained for row 5, in which a higher compaction pressure between beads as a result of an increase in extrusion width promoted crystallinity. A similar trend is expected in the case of PAEK/CF, as higher crystallinity merely elevates performance and promotes inhomogeneity in 3D-printed parts, and facilitates flaw-driven phenomena such as fractures, which result in lower deflection at failure and toughness.
Based on our DSC analysis at different cooling rates, as shown in Figure 2, the highest degree of crystallinity is related to the cooling rate of 1 K/min both for PAEK and PAEK/CF filaments. Degree of crystallinity for this set of samples that have undergone repetitive heating and cooling cycles as shown in Figure 2 is lower than the one studied in Table 3 with only one heating and cooling cycle (rows 1 and 2). The lower degree of crystallinity may be due to disrupted polymer chain arrangement specially for PAEK/CF polymer composite which requires further investigation.
Cooling rates slower than 20 K/min is not achievable with the current print speed of 40 mm/s, since it takes less than 40 s for the polymer melt to leave the nozzle. This in fact shows that in the best case scenario at our suggested print speed, as shown in Table 3 for one cycle of heating and cooling of PAEK and PAEK/CF, the degree of crystallinity is 32.0 and 23.5 percent respectively.
To summarize, the cooling rate as well as presence of any additional component such as carbon fiber in the polymer melt can change crystallinity in traditional manufacturing [13] with lower porosity. However, finding a direct correlation between increments in crystallinity with mechanical properties in 3D-printed parts is merely plausible. There is a need for comprehensive study in this field to understand how mechanical properties are affected by crystallinity and interface strength in 3D-printed parts. We believe the presence of an excessive number of voids and weak interfaces cancels the positive impact that improved crystallinity can have. Some other factors such as higher extrusion width can change the pressure inside each layer and elevate crystallinity as well, as seen in the case of process 7 for the PAEK samples.

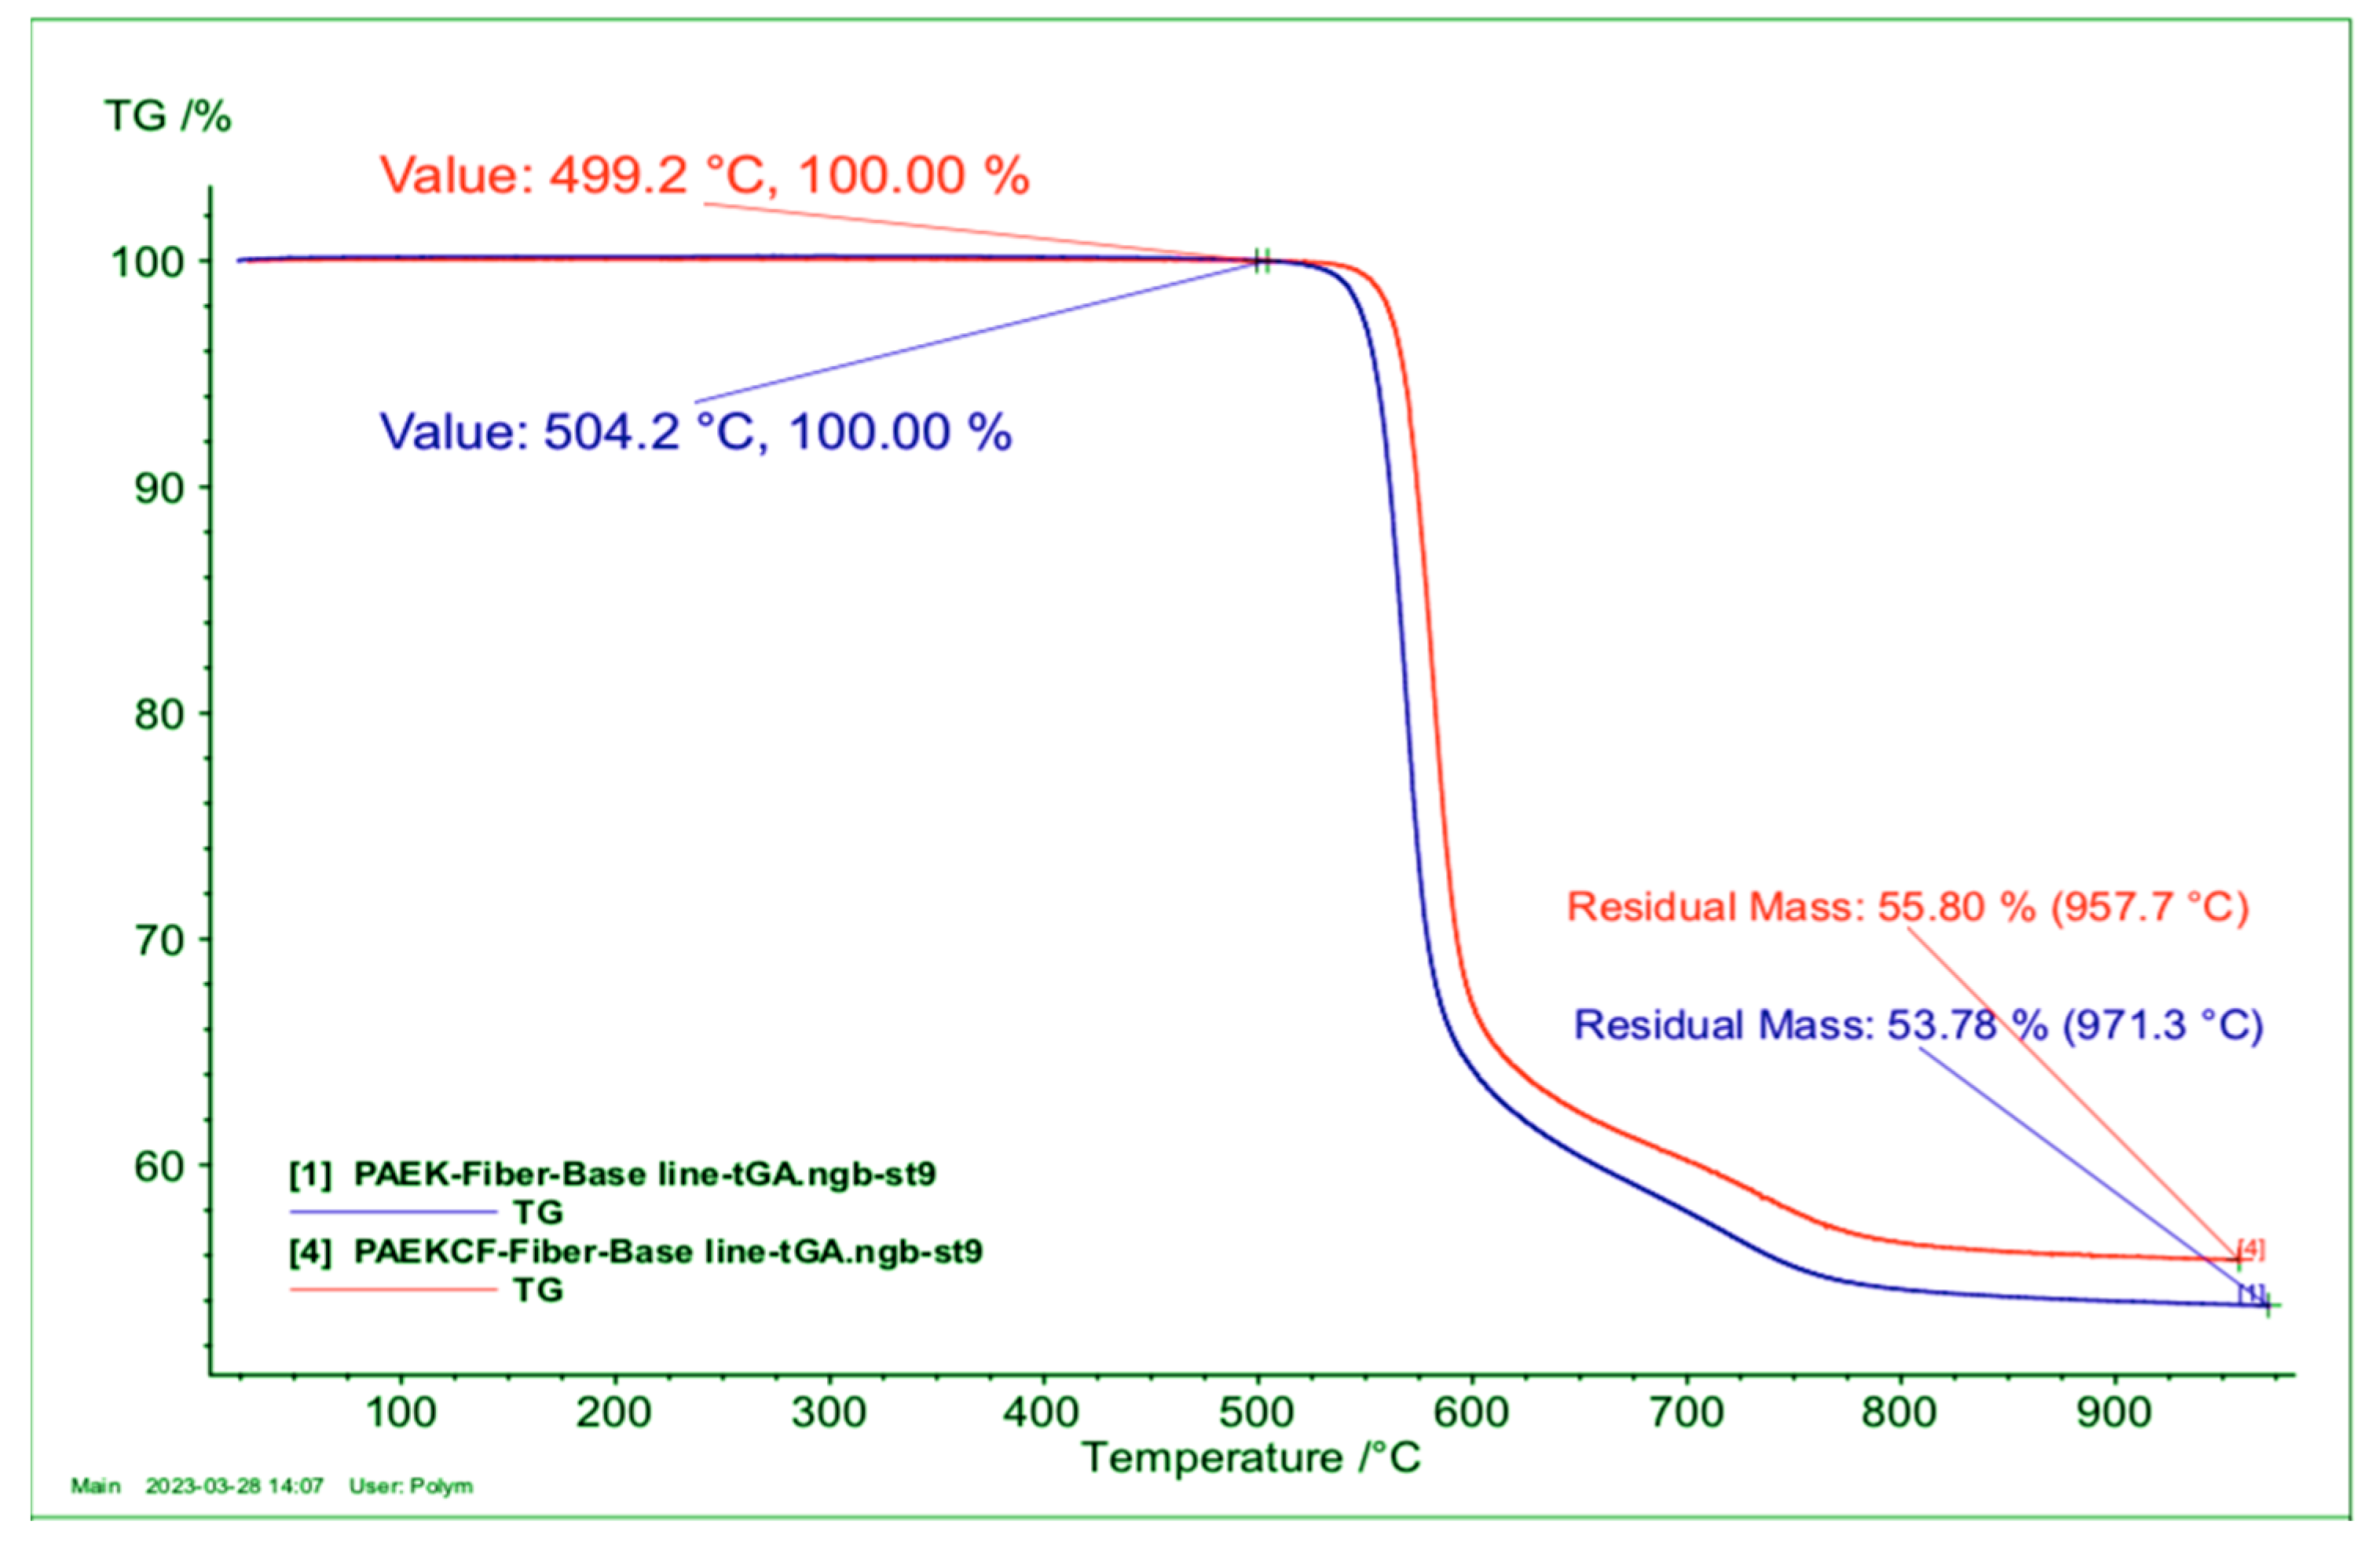
4.2.3. Thermogravimetric Analysis

The evolution of dried PAEK vs. PAEK/CF samples under high-temperature conditions is evaluated through a heat ramp from 250 °C to 1000 °C, at a rate of 10 K/min, using TG209F1 Libra. In both cases, the tests are performed under nitrogen atmospheres at 10 mL.min−1, for 1 h and 40 min. Encapsulated PAEK and PAEK fiber samples ranged from 20 to 30 mg, respectively.
As shown in Figure 3, the initiation of degradation for PAEK and PAEK/CF occurred at 504.2 °C and 499.2 °C, respectively; however, at temperatures beyond 499.2 °C, samples showed 5% loss in weight, which is considered the initiation of degradation. The addition of CF favors degradation by shifting the degradation temperature ~5 degrees, as improved thermal conduction promotes heat absorption. This temperature gap increases to almost 13.6 degrees at the final stage of decomposition, in which more CF ash remains, thereby aiding heat transfer at higher rates. The results show evidence of decomposition at temperatures above 504.2 °C when samples are kept at these temperatures for more than 50 min. In the majority of 3D printing cases, the time it takes for polymeric filaments to stay at deposition temperatures in the range 420 °C–450 °C is less than few minutes. In the case of PAEK/CF composites, it is not advisable to print samples at temperatures above 450 °C due to their complex rheological behavior [29] and the proximity to the degradation temperature. Therefore, decomposition is not of concern within a defined range for nozzle temperature; however, it is essential to know decomposition temperatures and the duration of stability of PAEK polymer composites, due to their application at elevated temperatures.

4.3. Tensile Testing Using DIC-Equipped Instron

A total of five tensile test samples of PAEK polymer from each print condition listed in Table 2 were fabricated. Following addition of carbon fiber to the polymeric matrix, prints for the process 9 and process 10 were replicated, and parts at 470 °C with different raster angles and oven temperatures were printed in order to justify our TGA analysis (Figure 3) and evaluate the performance of parts made beyond our suggested optimum deposition temperature.
The tensile tests were performed using an Instron 4448 machine with a 10 kN load cell capacity at a rate of 1 mm/min. The ASTM standard [31] for V-type samples with which failure happens at less than 5 min suggests using slightly lower strain rates to allow for 3D-printed parts with a high degree of inherent porosity compared to traditional manufacturing to achieve better polymer chain stretching and real application. The lower strain rates help to better understand material behavior at the high temperatures at which polymeric relaxation mechanisms activate.
The local strain was measured with DIC using a video extensometer and following the steps shown in Figure 4; the final values of the deflection at failure were calculated from the Instron displacement data. The Instron’s recorded force and the nominal cross-sectional area of the samples were used to calculate engineering stress at each time step. The video extensometer and digital image correlation (DIC) software was used to measure the true strain of samples, which was then used to calculate the modulus. The average result of the five samples with standard deviations are reported for each process condition. We manufactured and tested only V-type samples. However, we confirmed through our DIC measurements that the strain was uniform across the sample during mechanical testing of the samples until failure. In addition, from Table 3, we can conclude that the effect of thermal history is relatively small.

5. Results and Discussion

5.1. Effect of Temperature and Deposition Speed on PAEK Polymer Composites

Most of the reported process optimization efforts in the literature are limited to evaluating the effect of temperature and print speed, and do not consider optimizing the layer parameters; this motivates us to further broaden our study in this field. In those studies, the elastic modulus for PAEK is reported to be between 2.3 and 3.0 GPa, with 4.3 to 4.9 +/− 0.24 mm elongation at break [5] and a flexural modulus of 2.43 GPa [3], based on the processing parameters such as raster angle and print speed that were used. Additionally, as suggested by the authors, the best 3D-printed parts are processed at 400 °C, with a maximum modulus of 3.0 GPa and a strength of 77 MPa, compared to the injection molded parts with a maximum modulus and a strength of 3.6 GPa and 98 MPa, respectively [5]. Another important factor that affects the part performance discussed in the literature is annealing, in which the annealed parts showed comparable results to injection molded parts, with a maximum modulus of 3.55 GPa and 97 MPa strength [5] for the samples with a lower degree of crystallinity; however, we have not studied the effect of annealing in manufactured parts. Although the effect of temperature on crystallinity and degradation in PAEK and PAEK-CF polymer composites and their performance has been broadly studied [32], the role of deposition speed is widely neglected because it can be corelated to the temperature change. At higher deposition speeds, parts remain in a molten state for an extended time, considering the constant cooling rate. Although the addition of the next layer at elevated temperatures favors better interlayer adhesion and bond strength [33], there is concern for the possibility of degradation at temperatures beyond 450 °C, as shown in TGA; degradation is seen after 50 min at 499.2 °C. Therefore, to achieve better dimensional accuracy and to avoid degradation, for parts that are made at higher temperatures beyond 400 °C, a lower deposition speed is advisable to improve bond adhesion and aide in decreasing the entrapped air during the printing of PAEK polymer composites.

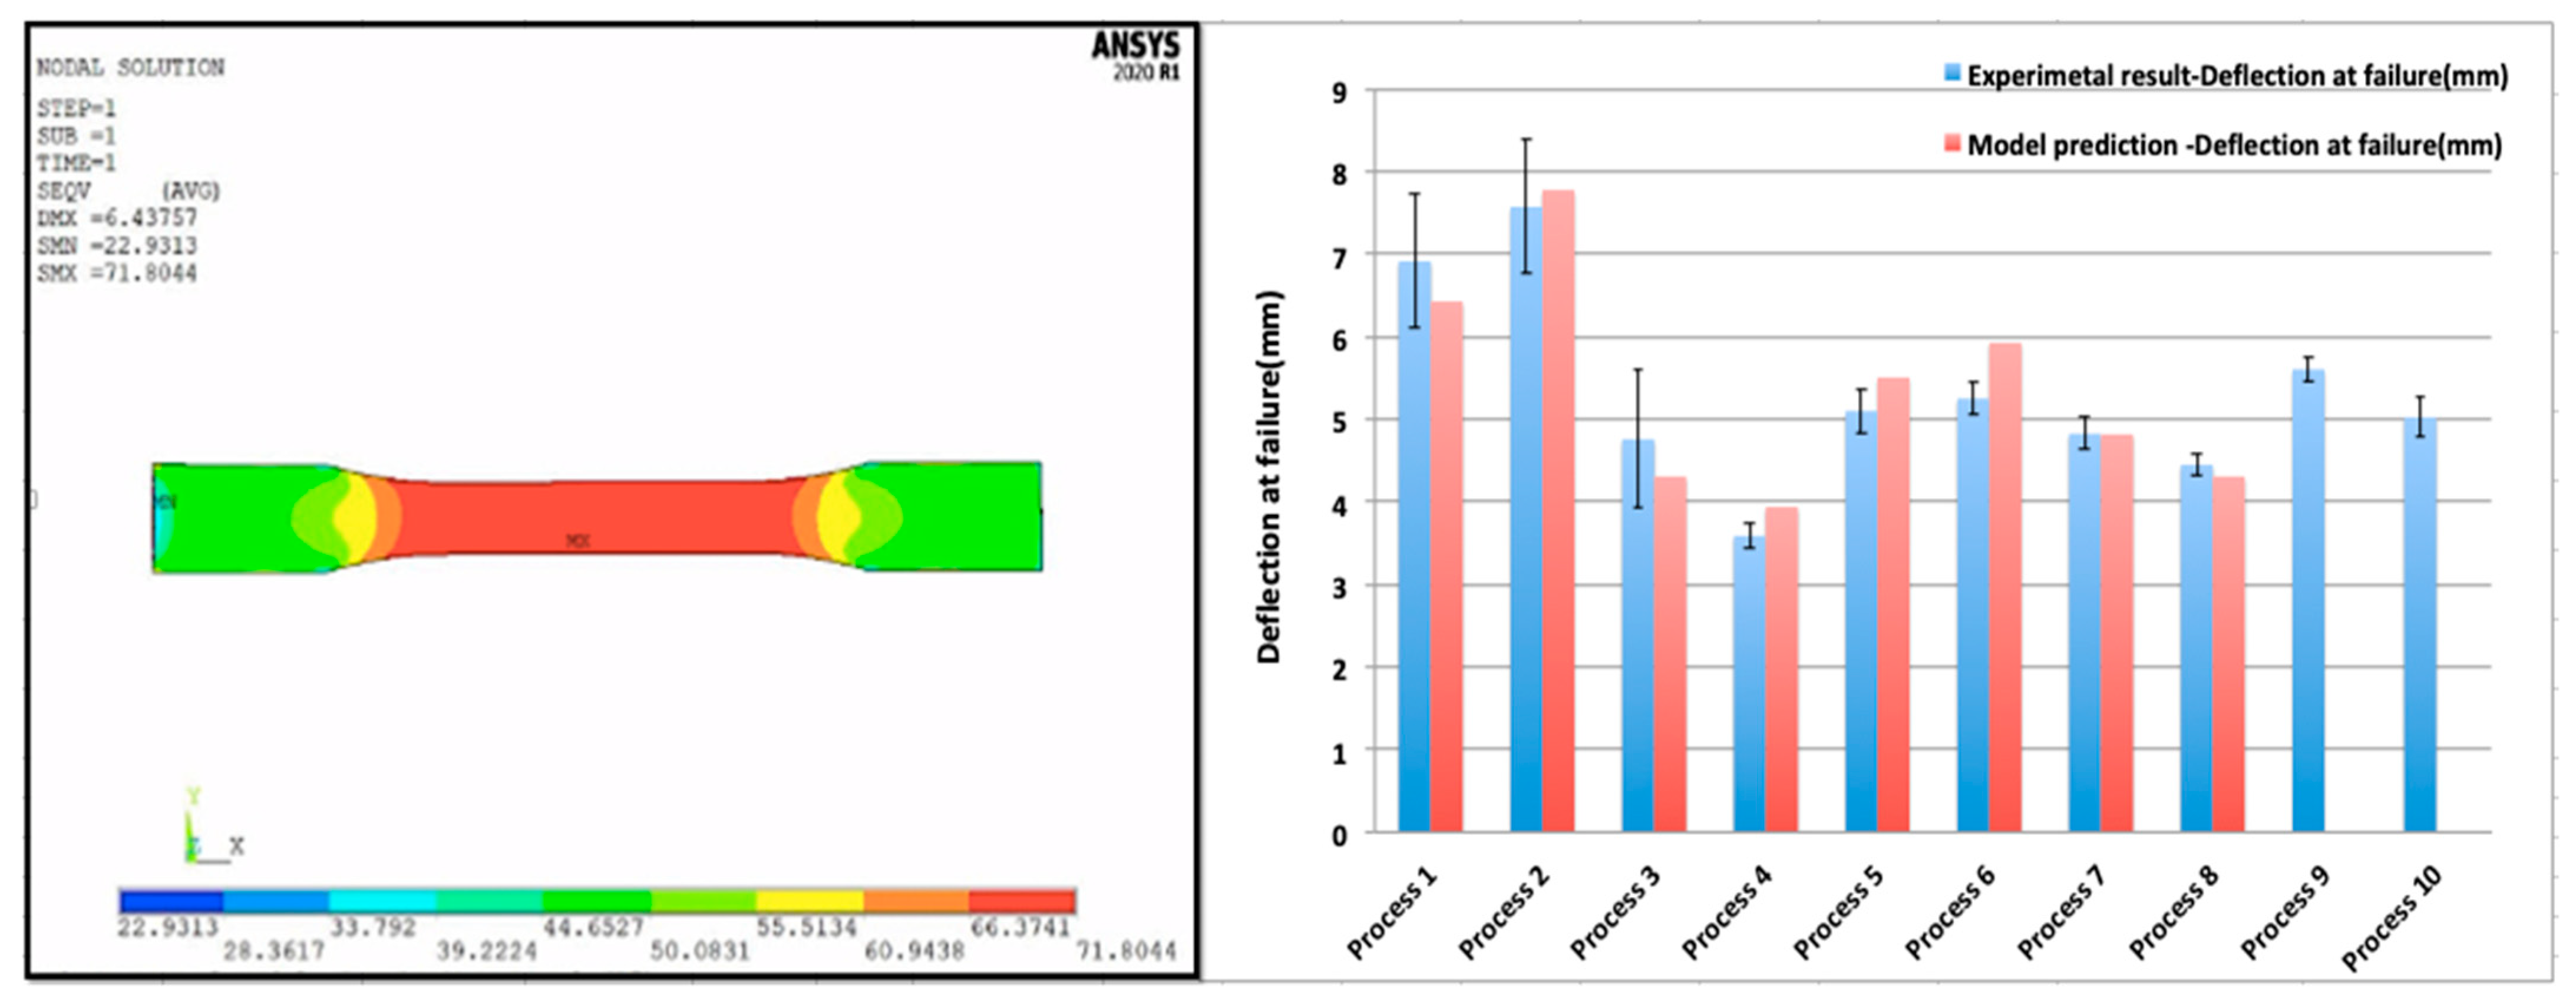
5.2. Multiscale Modeling for Layer Design Optimization

The proposed modeling framework [27] can be applied to any printer once it is characterized, and our main contribution is the development of a methodology to down-select and relate the important processing conditions to mechanical properties. The model prediction results for each process condition, shown in Table 2 and used as an optimum method for down-selecting parameters, are shown in Figure 5 and compared with the outcomes of our experimental studies. Two particular parameters, i.e., the number of outline shells and support layers which we had optimized using our proposed multiscale modeling, are not varied in this study to ensure greater part homogeneity. All optimized values for parameters are used in process condition 1 as a baseline, and other process conditions are defined by varying one parameter at a time, as listed in Table 2. For instance, for process condition 2, only the raster angle is changed from the 0/90th degree in process 1 to the 45/−45th degree, which results in higher toughness and deflection at failure.
Infill density and shape, introduced in process condition 3 and 4, affect the amount of material incorporated into each layer, which impacts mechanical properties. In general, some infill patterns such as full hexagonal (HC) are chosen to introduce a higher degree of porosity compared to the compact rectilinear shape (RC). The higher infill density in RC suggests higher strength and stiffness due to lower porosity.
The role of the interfaces formed between layers in 3D-printed parts, which act similarly to weld lines in traditional manufacturing, is not well studied. By changing the layer height or nozzle size, the number of interfaces formed is determined for a particular thickness part. Considering the relationship between layer height and nozzle diameter, the optimum value for layer height is in the range of [50–60%] of the nozzle size. For instance, the optimum layer height for the 0.4 mm nozzle to achieve high strength and adhesion is between (0.2–0.24) mm. In general, the greater the number of weld lines, the lower the part’s strength and stiffness. Therefore, larger layer height implies higher strength for the same thickness of the part. Raster angle and layer height can change the shape of voids and number of weld lines formed at each cross-section, as represented in Figure 6. The top section of this figure is related to a sample made with a finer layer height at 0/90 alternating degrees (process 5; Table 2), while the bottom part shows the sample with 45/−45 alternating angles as well as a larger layer height. A higher strength and stiffness as well as deflection at failure were achieved for the bottom image (process 2; Table 2) with a lower number of weld lines.
The parameter studied in process condition 7, referred to as extrusion width in the slicing software, Simplify3D, controls the amount of extrudate deposited at each location; it is controlled by nozzle diameter and extrudate rheology. A higher percentage of extrudate width improves the die-swelling effect in polymers and bead-to-bead compaction; DSC results show that samples made under this condition have higher crystallinity. Another parameter introduced in process condition 8, which is inversely correlated with extrusion width, is infill overlap, a higher value of which provides higher local deposition; therefore, a generally better part performance is implied. A poor choice of values for this parameter can cause inhomogeneity through the thickness, resulting in premature failure and lower overall mechanical properties, as shown in Figure 7.

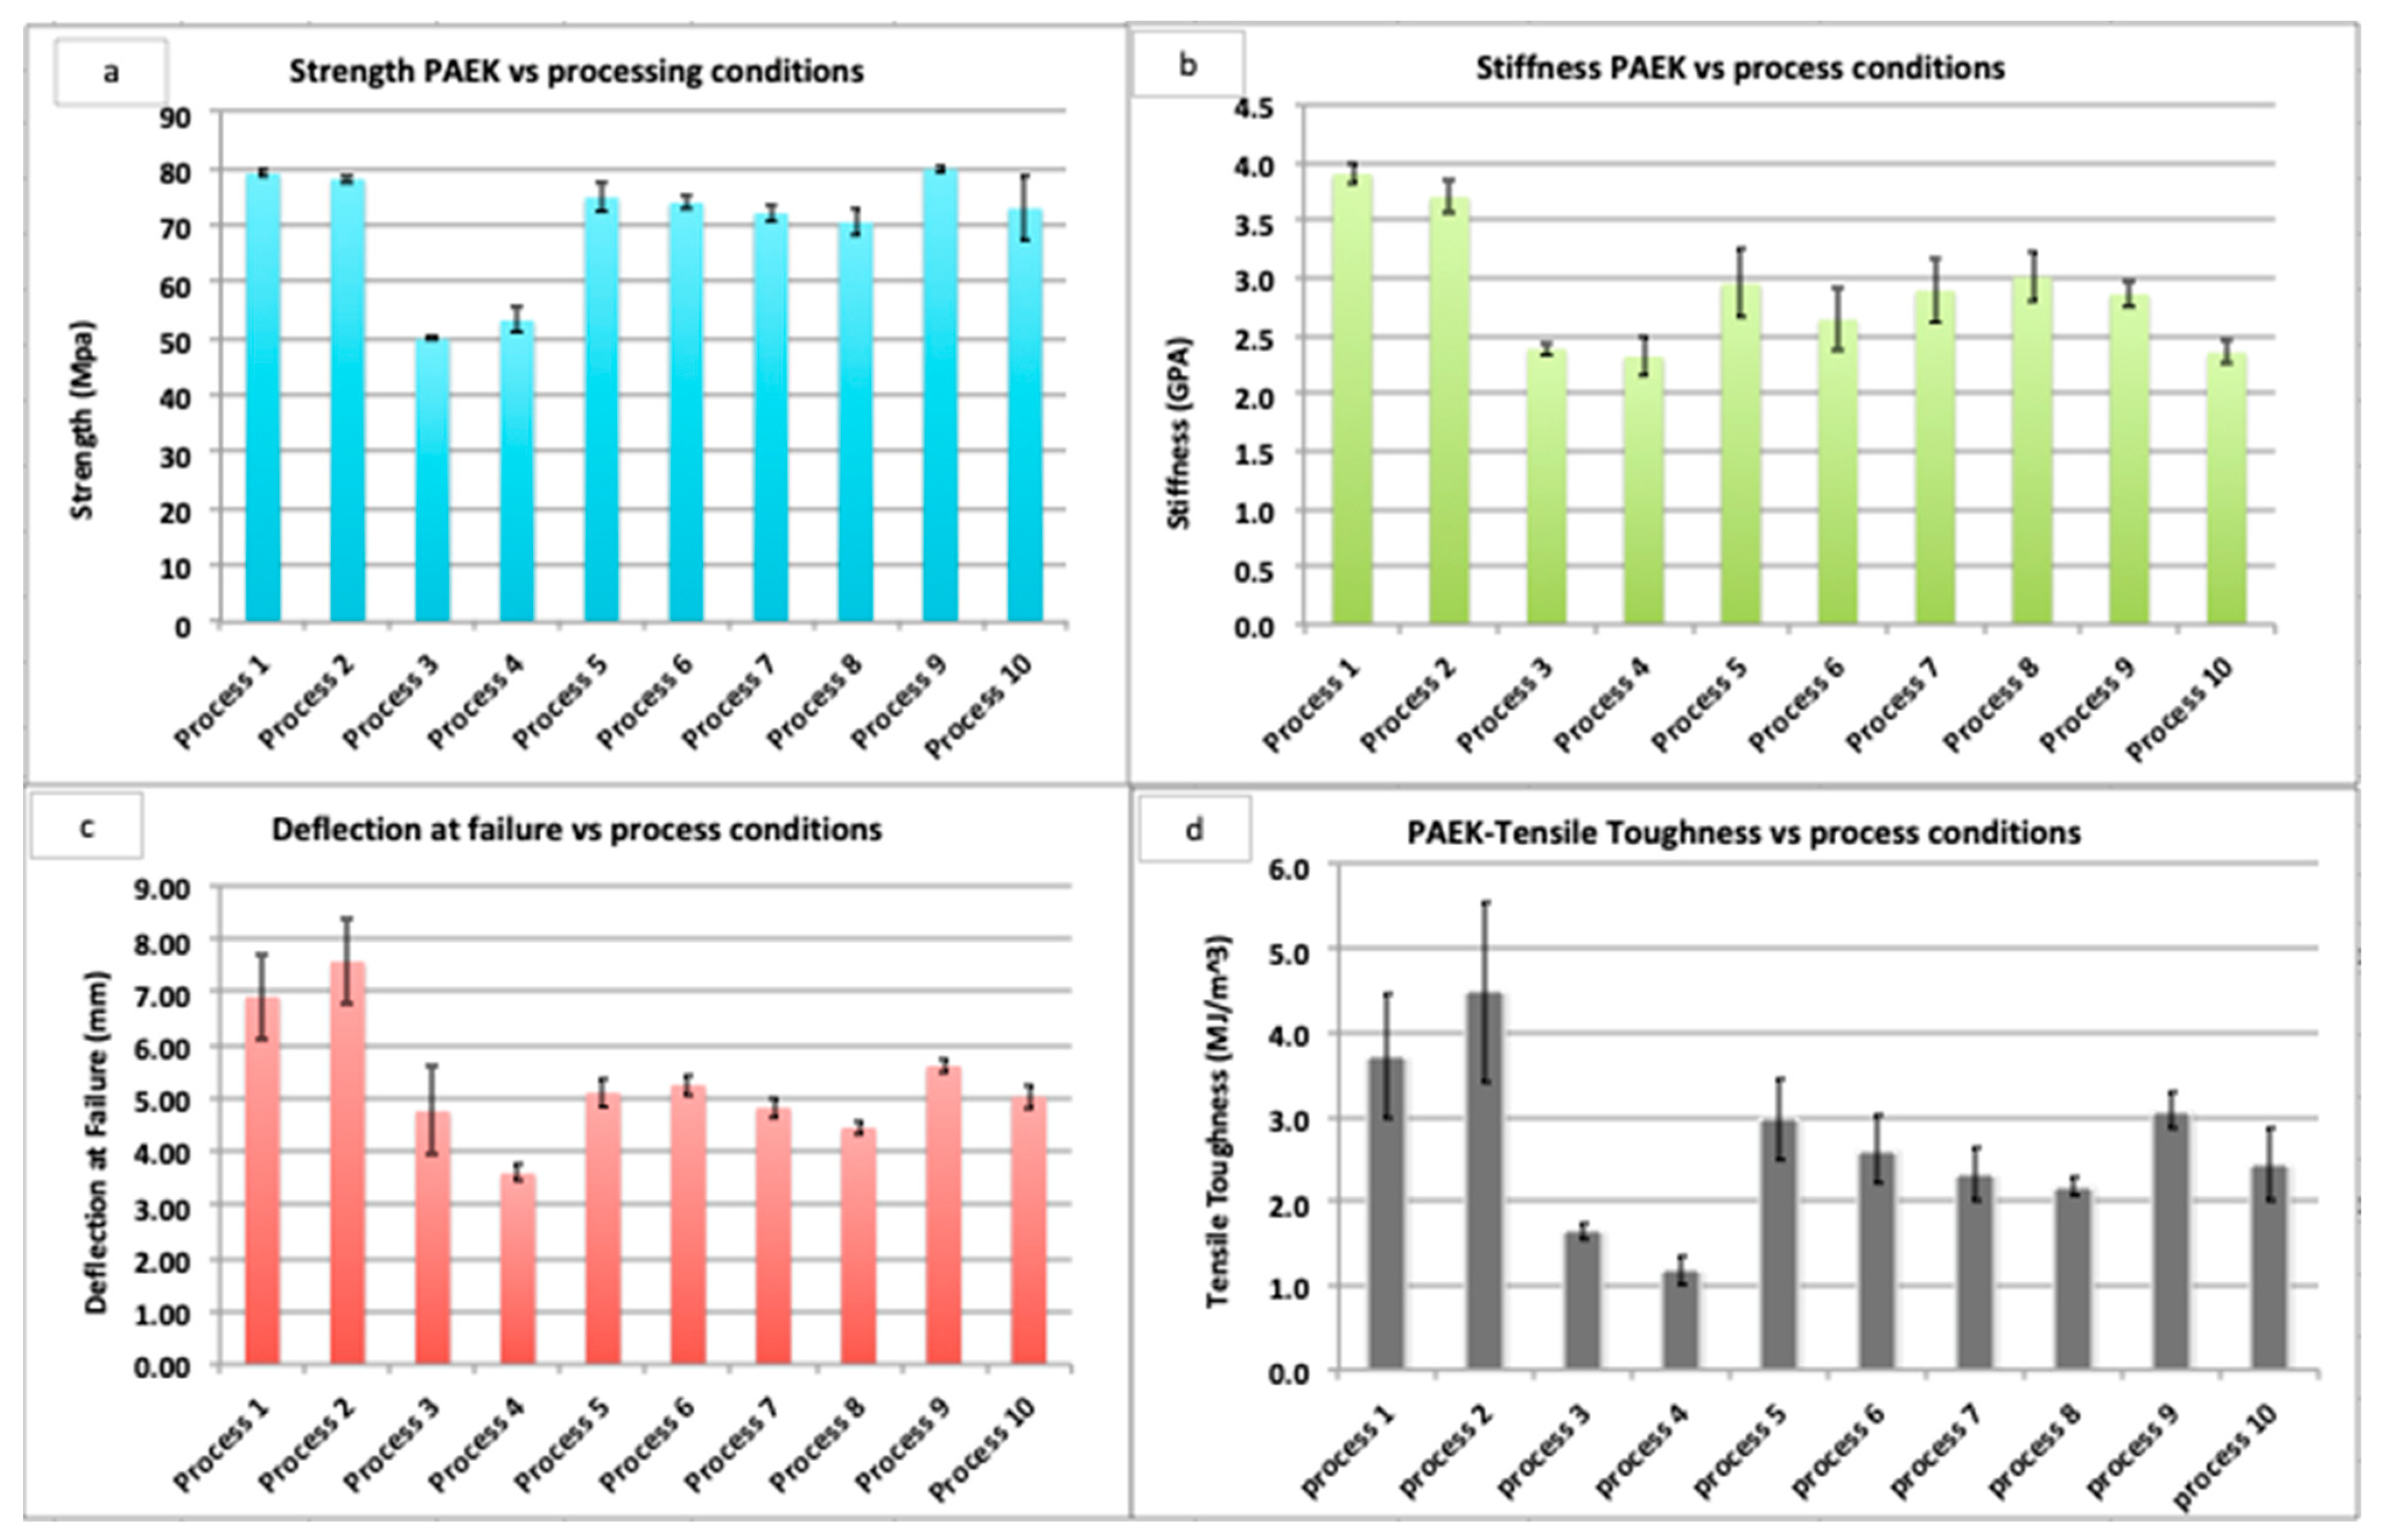
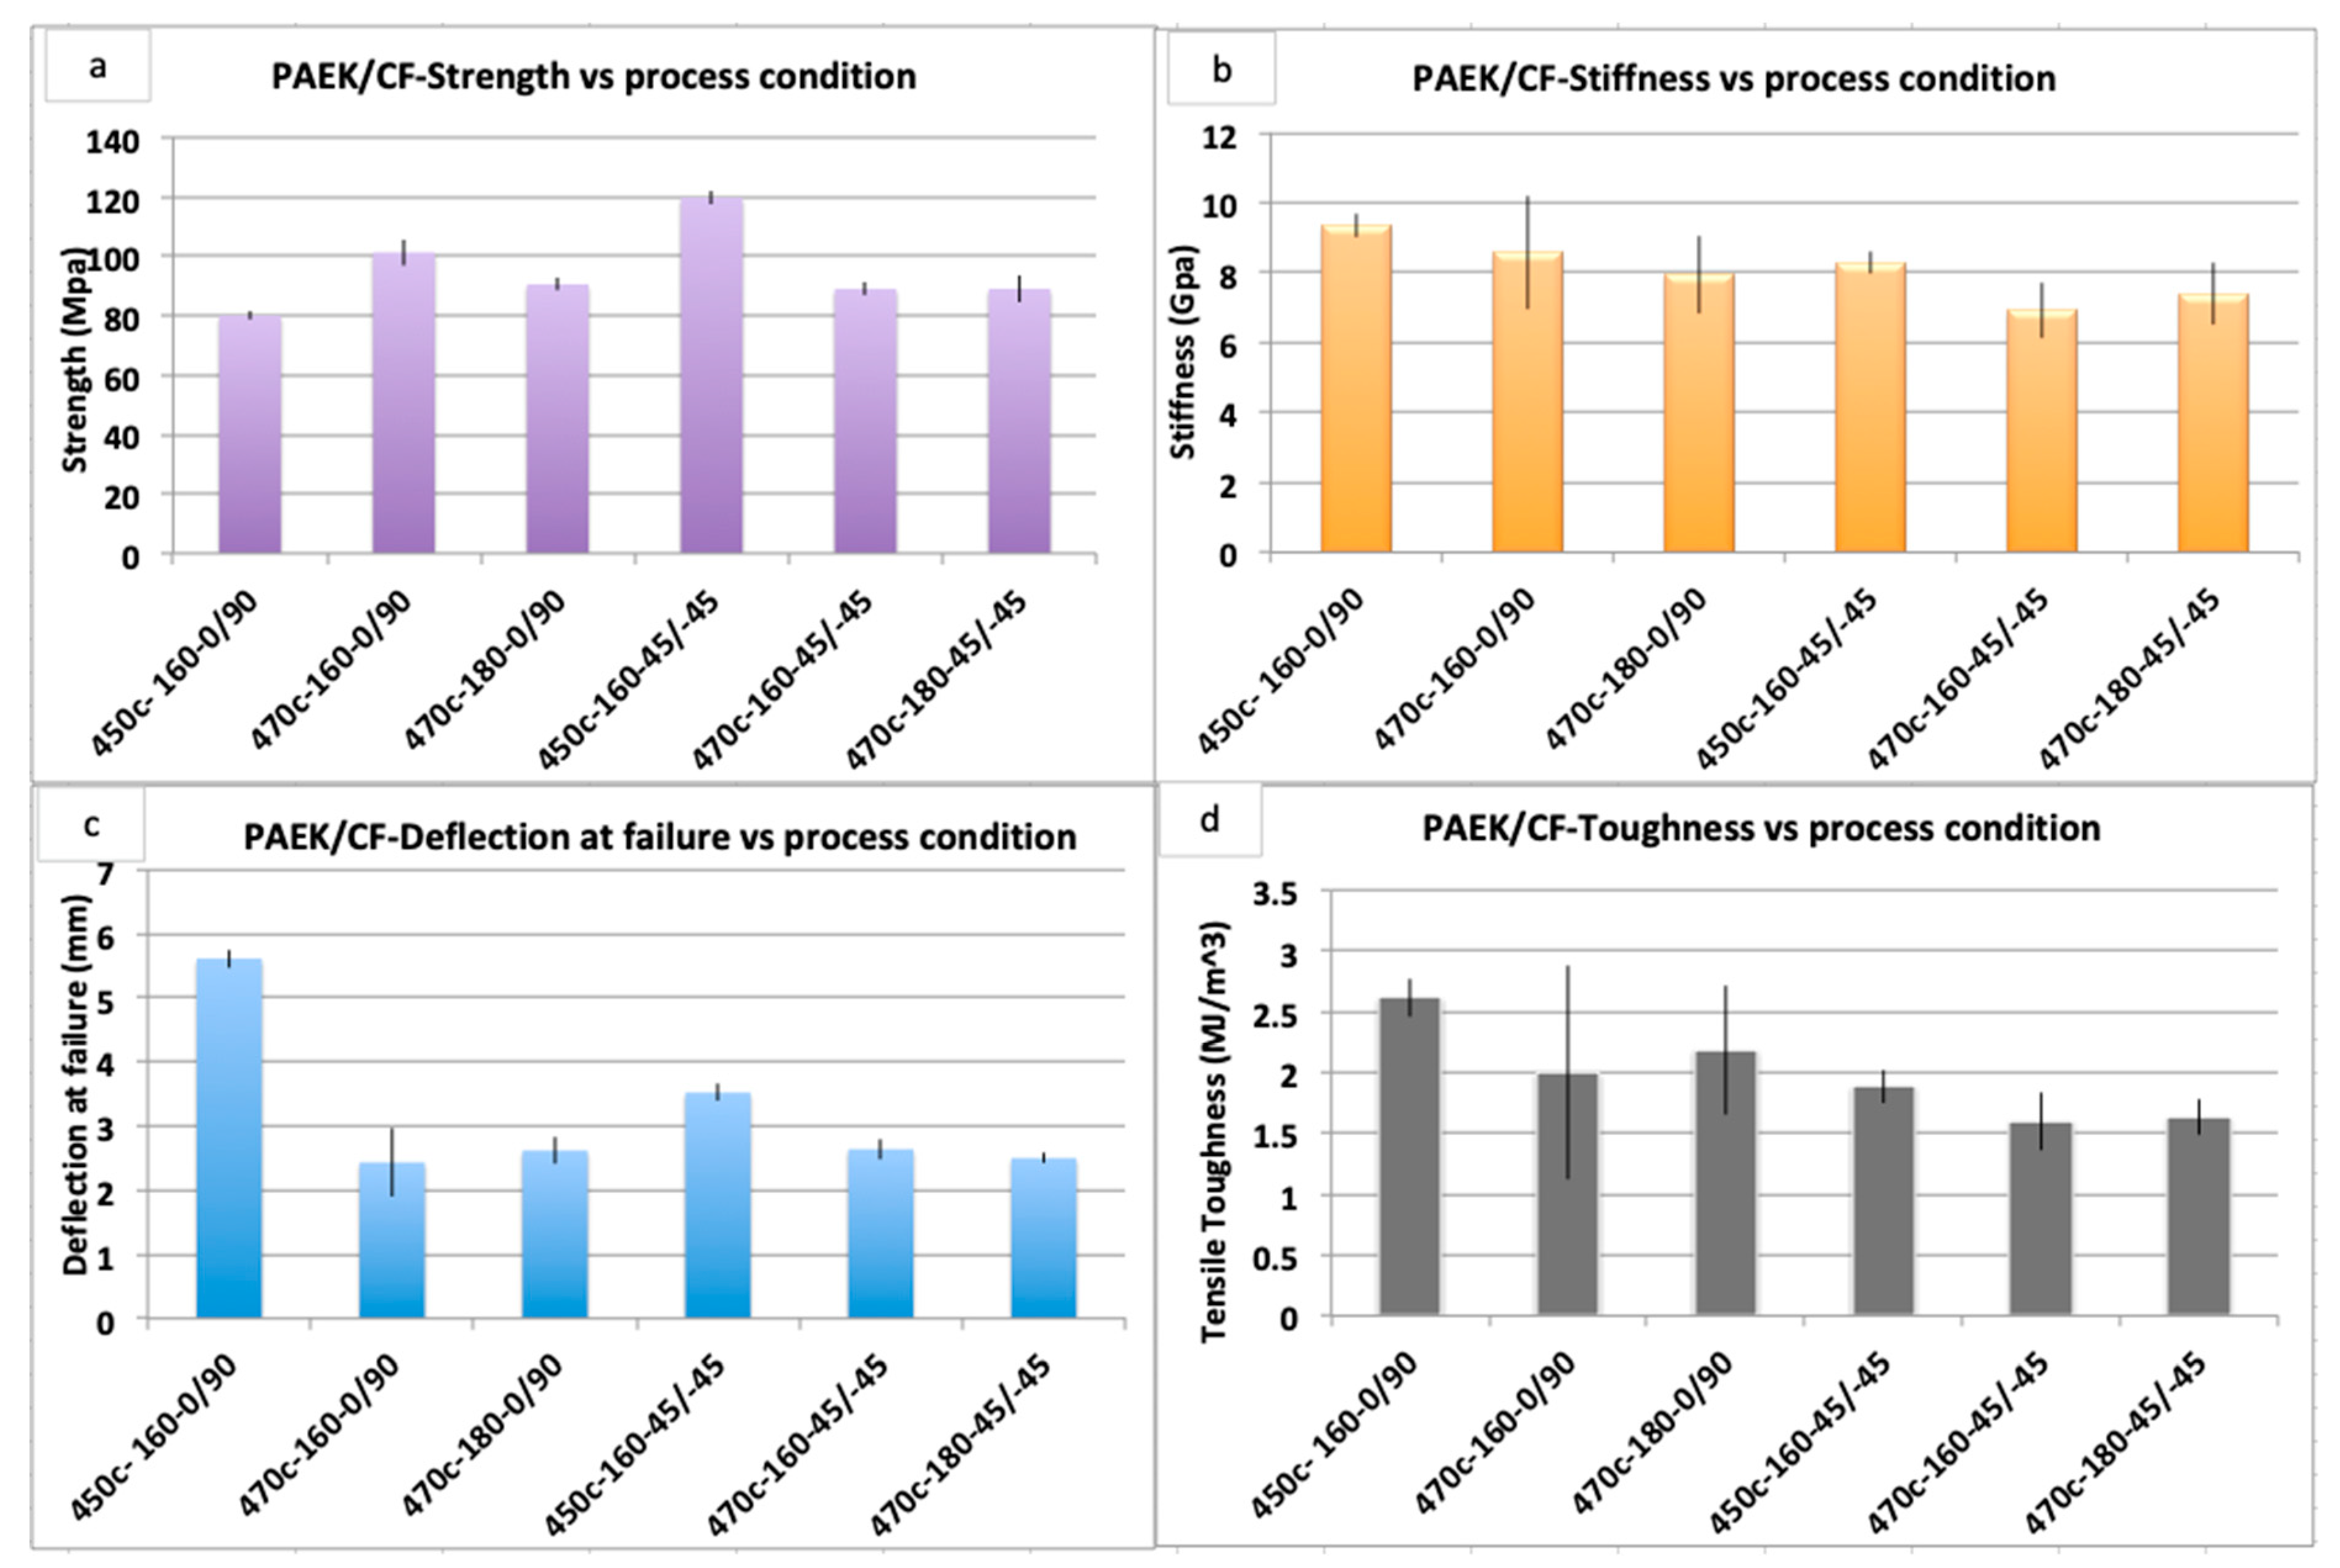
5.3. Change of Mechanical Properties with Layer Design Parameters

Changes in processing parameters such as infill percentage (process condition 3) and pattern shape (process condition 4) can affect void content by introducing more gaps between the beads, and this can result in a dramatic drop in all aspects of mechanical properties, as shown in Figure 8. Another important aspect of part performance is interface strength, the effect of which is studied by changing the layer height or infill overlap. The former parameter affects the number of interfaces between consecutive layers, and the latter parameter affects the bond formation and adhesion. A 57% decrease in layer height is shown to cause a 10% reduction in overall strength, a 30% decrease in deflection at failure and 20% reduction in tensile toughness. Another contributing factor in void content is the possibility of entrapping air during layer-by-layer deposition. The wider extrusion width used in process condition 7 may contribute to this phenomenon by delaying the cooling process, which results in improved crystallinity, as shown in Table 3. In contrast, increasing deposition temperature, as in process conditions in 9 and 10, helps to reduce viscosity with a similar degree of crystallinity compared to process 7, allowing the release of entrapped air, thereby lowering porosity. This in turn improves strength, toughness, and deflection at failure, and has been shown to have little or no effect on the stiffness, as shown in Figure 8. PAEK polymer is a semicrystalline polymer, and similar to other high-temperature polymers, its toughness reduces with increasing crystallinity [22]. The PAEK polymer processed at 430 °C shows higher ductility and deflection at failure compared to the sample processed at 450 °C. Raster angle, unlike temperature, has a negligible effect on strength of PAEK, and the 0/90 angle has shown consistency in improving strength (~0.5%) compared to the 45/−45th degree.
The PEAK coupons fabricated at 450 °C show little effect due to change in raster angle (80 ± 1.2 ) MPa. The strength of PAEK polymer parts changes significantly with change in layer density, and less so with a change in raster angle and temperature, as can be seen from Figure 8. Samples with raster angles of 0/90 that are made at 450 °C show the highest strength of (120 ± 2.5 )  MPa. The deflection at failure is reduced by 50% compared to the PAEK sample made in optimal conditions, as shown in Figure 8, to (3.52 ± 0.012 ) m m , because of brittleness caused by a higher degree of crystallinity [8].

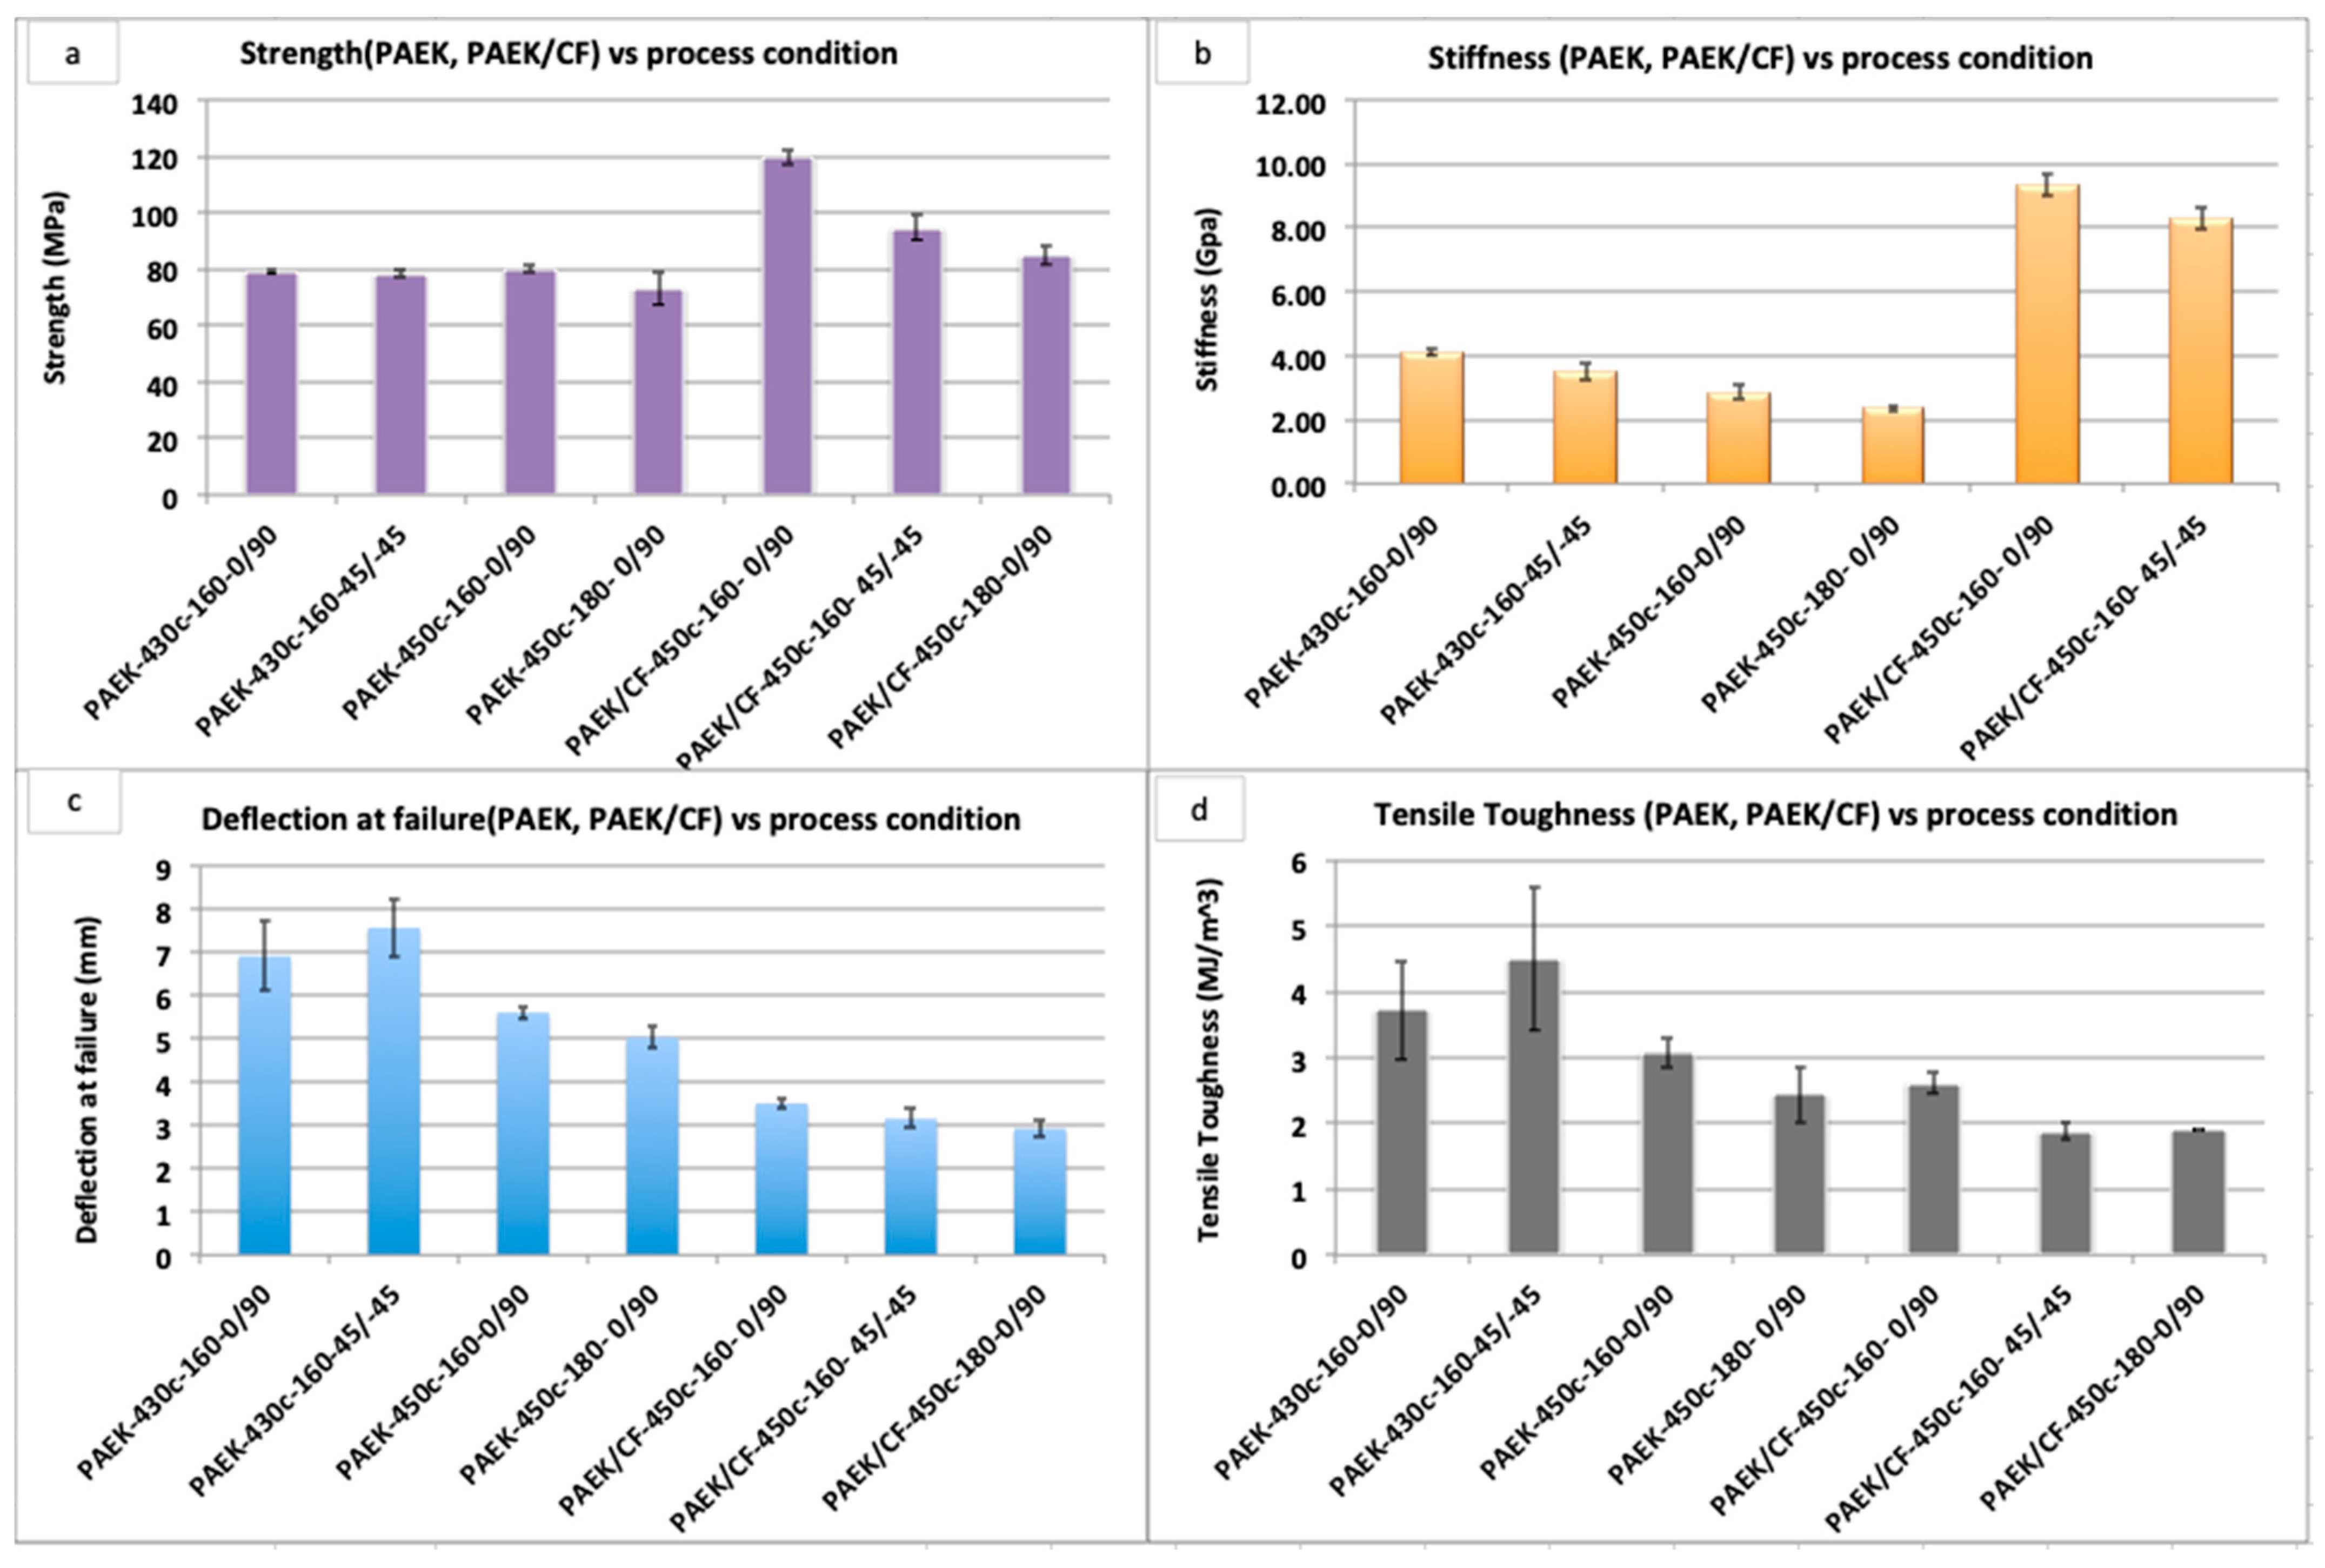
5.4. Change of Mechanical Properties with Addition of Carbon Fiber and Role of Temperature

The addition of carbon fiber acts as reinforcement for the PAEK matrix, and as expected, increases the stiffness and strength when processing temperature is optimum. As shown in Figure 9, the addition of 10 wt% carbon fiber reinforcement (with an aspect ratio of 26.3) to the PAEK polymer improved mechanical stiffness and strength by 50% and 60%, respectively, over the neat PAEK polymer at 430 °C for raster angles of 0/90 and +−45. This results in a quasi-brittle behavior, with the addition of PAEK/CF showing a lower deflection at failure and toughness compared to neat PAEK samples.
On the other hand, the effect of an optimum choice of range of processing temperatures for PAEK/CF polymer composites is shown in Figure 10 to be an essential element impacting mechanical properties. At 450 °C, PAEK/CF samples showed the highest mechanical properties compared to samples made at 470 °C, with increases in strength of 15% and 40% for raster angles +−45 and 0/90, respectively. However, samples made at 470 °C with a 45/−45 raster angle at a lower oven temperature 160 °C showed a 20% improvement in strength compared to PAEK CF made at 450 °C with the same raster angle and oven temperature. However, samples made at 450 °C and with a 45/−45 raster angle at 160 °C oven temperature have the highest strength of all the different conditions.
Considering the mechanical performance of PAEK/CF samples made at 470 °C, we believe PAEK/CF filaments undergo complex rheological behavior during deposition at this temperature; entrapment of more air with a fast speed of deposition results in initiation of a higher degree of porosity and poorer mechanical performance. However, further analysis using characterization methods such as Micro CT and SEM is essential to verify our claim.

6. Conclusions

PAEK polymers and their composites have comparable properties to metallic parts, which make them good candidates for weight reduction in many applications. Additive manufacturing of PAEK composites has opened up the possibility of producing complex shapes, with control over their internal features and architecture achievable through the use of multiple processing parameters through slicing software such as Simplify3D to define layer architecture and assembly. To obtain the greatest benefit from AM manufacturing of PAEK polymers, there is a need to control parameters based on the target application to achieve optimum performance. Our modeling framework can relate processing details to local material properties, which can in turn be used to fabricate parts with preferred macro-properties and high repeatability. We have conducted an offline numerical design study using our multiscale modeling approach to identify the effect of each parameter on deflection at failure, and to optimize processing parameters and their intensities prior to the designing of the experiments. The main goal for this step was to achieve maximum homogeneity in the combination of parameters, while obtaining comprehensive knowledge on how to tailor mechanical properties at microscale to achieve high stiffness and strength at the macroscale. Using the optimized process, condition 1, as the baseline process, we down-selected ten experimental process conditions to check their effects on stiffness, strength, toughness and failure. Parameters such as infill density and infill shape as well as higher bed temperature can have an adverse effect on toughness by reducing deflection at failure and stiffness; however, strength has been shown to be relatively independent of porosity and adhesion. The higher content of porosity induced by infill shape or lower infill percentage can also negatively impact the strength of material. In general, failure is driven by both strength along the loading direction and interface adhesion, which are related to the density of material [5], and the number of interfaces and resulting porosity through the thickness. All of these are affected by the control of the manufacturing process.

Author Contributions

Conceptualization, S.S.; Methodology, S.S.; Software, S.S.; Validation, S.S., S.G.A. and M.H.S.; Formal Analysis, S.S., M.H.S. and S.G.A.; Data Curation, S.S.; Writing—Original Draft Preparation, S.S.; Writing—Review & Editing, S.G.A., M.H.S. and J.G.; Visualization, S.S.; Supervision, S.G.A. and M.H.S.; Funding Acquisition, J.G. and S.G.A. All authors have read and agreed to the published version of the manuscript.

Funding

This research was sponsored by DEVCOM ARL and was accomplished under Cooperative Agreement Number W911NF-18-2-0299. The views and conclusions contained in this document are those of the authors and should not be interpreted as representing the official policies, either expressed or implied, of DEVCOM ARL or the U.S. Government. The U.S. Government is authorized to reproduce and distribute re-prints for Government purposes notwithstanding any copyright notation herein.

Data Availability Statement

Data is unavailable to the public due to privacy restrictions.

Acknowledgments

The authors would like to express gratitude to Aristedes Yiournas for his invaluable assistance in extracting the DIC result data. Additionally, thanks to Nicola Caringella, Nic Cantwell, and Josh Elmer from the Roboze Company for their help in troubleshooting the Roboze 3D printer and printing some of the samples.

Conflicts of Interest

The authors have no conflict of interest to declare. All co-authors have seen and agree with the contents of the manuscript. We certify that the submission is original work and is not under review at any other publication.

References

  1. Honigmann, P.; Sharma, N.; Okolo, B.; Popp, U.; Msallem, B.; Thieringer, F.M. Patient-specific surgical implants made of 3D printed PEEK: Material, technology, and scope of surgical application. BioMed Res. Int. 2018, 2018, 4520636. [Google Scholar] [CrossRef] [Green Version]
  2. Harding, M.J.; Brady, S.; O’Connor, H.; Lopez-Rodriguez, R.; Edwards, M.D.; Tracy, S.; Dowling, D.; Gibson, G.; Girard, K.P.; Ferguson, S. 3D printing of PEEK reactors for flow chemistry and continuous chemical processing. React. Chem. Eng. 2020, 5, 728–735. [Google Scholar] [CrossRef]
  3. Vaezi, M.; Yang, S. Extrusion-based additive manufacturing of PEEK for biomedical applications. Virtual Phys. Prototyp. 2015, 10, 123–135. [Google Scholar] [CrossRef]
  4. Kurtz, S.M. Chapter 15—Development and Clinical Performance of PEEK Intervertebral Cages. In Plastics Design Library, 2nd ed.; Kurtz, S.M., Ed.; William Andrew Publishing: Norwich, NY, USA, 2019; pp. 263–280. ISBN 978-0-12-812524-3. [Google Scholar]
  5. El Magri, A.; El Mabrouk, K.; Vaudreuil, S.; Chibane, H.; Touhami, M.E. Optimization of printing parameters for improvement of mechanical and thermal performances of 3D printed poly (ether ether ketone) parts. J. Appl. Polym. Sci. 2020, 137, 49087. [Google Scholar] [CrossRef]
  6. Liu, P.; Kunc, V. Effect of 3D printing conditions on the micro- and macrostructure and properties of high-performance thermoplastic composites. In Woodhead Publishing Series in Composites Science and Engineering; Friedrich, K., Walter, R., Soutis, C., Advani, S.G., Fiedler, I.H.B., Eds.; Woodhead Publishing: Sawston, CA, USA, 2020; pp. 65–86. ISBN 978-0-12-819535-2. [Google Scholar]
  7. Lepoivre, A.; Boyard, N.; Levy, A.; Sobotka, V. Heat Transfer and Adhesion Study for the FFF Additive Manufacturing Process. Procedia Manuf. 2020, 47, 948–955. [Google Scholar] [CrossRef]
  8. Yang, D.; Cao, Y.; Zhang, Z.; Yin, Y.; Li, D. Effects of crystallinity control on mechanical properties of 3D-printed short-carbon-fiber-reinforced polyether ether ketone composites. Polym. Test. 2021, 97, 107149. [Google Scholar] [CrossRef]
  9. Mackay, M.E. The importance of rheological behavior in the additive manufacturing technique material extrusion. J. Rheol. 2018, 62, 1549–1561. [Google Scholar] [CrossRef]
  10. Das, A.; Gilmer, E.L.; Biria, S.; Bortner, M.J. Importance of polymer rheology on material extrusion additive manufacturing: Correlating process physics to print properties. ACS Appl. Polym. Mater. 2021, 3, 1218–1249. [Google Scholar] [CrossRef]
  11. de Paula Santos, L.F.; Alderliesten, R.; Kok, W.; Ribeiro, B.; de Oliveira, J.B.; Costa, M.L.; Botelho, E.C. The influence of carbon nanotube buckypaper/poly (ether imide) mats on the thermal properties of poly (ether imide) and poly (aryl ether ketone)/carbon fiber laminates. Diam. Relat. Mater. 2021, 116, 108421. [Google Scholar] [CrossRef]
  12. Das, A.; Chatham, C.A.; Fallon, J.J.; Zawaski, C.E.; Gilmer, E.L.; Williams, C.B.; Bortner, M.J. Current understanding and challenges in high temperature additive manufacturing of engineering thermoplastic polymers. Addit. Manuf. 2020, 34, 101218. [Google Scholar] [CrossRef]
  13. Bonmatin, M.; Chabert, F.; Bernhart, G.; Djilali, T. Rheological and crystallization behaviors of low processing temperature poly(aryl ether ketone). J. Appl. Polym. Sci. 2021, 138, 51402. [Google Scholar] [CrossRef]
  14. Yi, N.; Davies, R.; Chaplin, A.; McCutchion, P.; Ghita, O. Slow and fast crystallising poly aryl ether ketones (PAEKs) in 3D printing: Crystallisation kinetics, morphology, and mechanical properties. Addit. Manuf. 2021, 39, 101843. [Google Scholar] [CrossRef]
  15. Francis, J.N.; Banerjee, I.; Chugh, A.; Singh, J. Additive manufacturing of polyetheretherketone and its composites: A review. Polym. Compos. 2022, 43, 5802–5819. [Google Scholar] [CrossRef]
  16. Berg-Johansen, B.; Lovald, S.; Altiok, E.; Kurtz, S.M. Chapter 17—Applications of Polyetheretherketone in Arthroscopy. In Plastics Design Library, 2nd ed.; Kurtz, S.M., Ed.; William Andrew Publishing: Norwich, NY, USA, 2019; pp. 291–300. ISBN 978-0-12-812524-3. [Google Scholar]
  17. Wang, P.; Zou, B.; Ding, S.; Li, L.; Huang, C. Effects of FDM-3D printing parameters on mechanical properties and microstructure of CF/PEEK and GF/PEEK. Chin. J. Aeronaut. 2021, 34, 236–246. [Google Scholar] [CrossRef]
  18. Miri, S.; Kalman, J.; Canart, J.-P.; Spangler, J.; Fayazbakhsh, K. Tensile and thermal properties of low-melt poly aryl ether ketone reinforced with continuous carbon fiber manufactured by robotic 3D printing. Int. J. Adv. Manuf. Technol. 2022, 122, 1041–1053. [Google Scholar] [CrossRef]
  19. Pazhamannil, R.V.; Edacherian, A. Property enhancement approaches of fused filament fabrication technology: A review. Polym. Eng. Sci. 2022, 62, 1356–1376. [Google Scholar] [CrossRef]
  20. Papon, M.E.A.; Haque, A.; Sharif, M.A.R. Effect of nozzle geometry on melt flow simulation and structural property of thermoplastic nanocomposites in fused deposition modeling. In Proceedings of the American Society for Composites, Thirty-Second Technical Conference, Tucson, AZ, USA, 22–25 October 2017. [Google Scholar]
  21. Samuels, M.L.; Witmer, J.A.; Schaffner, A.A. Statistics for the Life Sciences, 7th ed.; Pearson: London, UK, 2016. [Google Scholar]
  22. Mehmet-Alkan, A.A.; Hay, J.N. The crystallinity of poly (ether ether ketone). Polymer 1992, 33, 3527–3530. [Google Scholar] [CrossRef]
  23. Oehlert, G. A First Course in Design and Analysis of Experiments; W.H Freeman&Co: New York, NY, USA, 2000. [Google Scholar]
  24. Hasanov, S.; Gupta, A.; Alifui-Segbaya, F.; Fidan, I. Hierarchical homogenization and experimental evaluation of functionally graded materials manufactured by the fused filament fabrication process. Compos. Struct. 2021, 275, 114488. [Google Scholar] [CrossRef]
  25. Nasirov, A.; Hasanov, S.; Fidan, I. Prediction of mechanical properties of fused deposition modeling made parts using multiscale modeling and classical laminate theory. In Proceedings of the 30th Annual International Solid Freeform Fabrication Symposium-An Additive Manufacturing Conference, Austin, TX, USA, 12–14 August 2019; Volume 1376. [Google Scholar]
  26. Nasirov, A.; Gupta, A.; Hasanov, S.; Fidan, I. Three-scale asymptotic homogenization of short fiber reinforced additively manufactured polymer composites. Compos. Part B Eng. 2020, 202, 108269. [Google Scholar] [CrossRef]
  27. Sharafi, S.; Santare, M.H.; Gerdes, J.; Advani, S.G. A multiscale modeling approach of the Fused Filament Fabrication process to predict the mechanical response of 3D printed parts. Addit. Manuf. 2022, 51, 102597. [Google Scholar] [CrossRef]
  28. ASTM D638-14; Standard Test Method for Tensile Properties of Plastics. ASTM International: West Conshohocken, PA, USA, 2014.
  29. White, K.; Sue, H.-J.; Bremner, T. Rheological characterization and differentiation in PAEK materials. In Proceedings of the High Performance Thermoplastics and Composites for Oil and Gas Applications, Houston, TX, USA, 11–12 October 2011. [Google Scholar]
  30. Roboze. The Highest Performing Super Polymers and Composites in the World. Available online: https://www.roboze.com/en/3d-printing-materials/ (accessed on 10 October 2022).
  31. ASTM D6671/D6671M-19; Standard Test Method for Mixed Mode I-Mode II Interlaminar Fracture Toughness of Unidirectional Fiber Reinforced Polymer Matrix Composites. ASTM International: West Conshohocken, PA, USA, 2019. Available online: www.astm.org (accessed on 1 May 2021).
  32. Wang, P.; Zou, B.; Ding, S.; Huang, C.; Shi, Z.; Ma, Y.; Yao, P. Preparation of short CF/GF reinforced PEEK composite filaments and their comprehensive properties evaluation for FDM-3D printing. Compos. Part B Eng. 2020, 198, 108175. [Google Scholar] [CrossRef]
  33. Sharafi, S.; Santare, M.H.; Gerdes, J.; Advani, S.G. A review of factors that influence the fracture toughness of extrusion-based additively manufactured polymer and polymer composites. Addit. Manuf. 2021, 38, 101830. [Google Scholar] [CrossRef]
Figure 1. DSC curves for PAEK and PAEK/CF filaments at a heating rate of 5 K/min are shown in red and blue, respectively, followed by cooling curves at 20 K/min. The area under the melting curve can be used to calculate the degree of crystallinity.
Jcs 07 00157 g001
Figure 2. The percent crystallinity for different cooling rates is calculated by measuring the area under the curve as shown in Figure 1 (J/g).
Jcs 07 00157 g002
Figure 3. TGA curves of PAEK vs. PAEK/CF from 25 to 1000 C at 10 K/min in an inert atmosphere.
Jcs 07 00157 g003
Figure 4. (A) printed dog bone coupons; (B) coupons were painted with a dot pattern so DIC could measure strain variations; (C) DIC-equipped Instron to measure strain using a video extensometer.
Jcs 07 00157 g004
Figure 5. Simulation results for predicted deflection at failure for process is shown on the left (6.44 mm) and other processes are similarly modeled and compared with experimental results, as shown on the right; however, processes 9 and 10 are left out, as the effect of temperature is not considered due to lack of creep studies. Simulation results are based on a material model which may have a 1 to 7.5% error [27].
Jcs 07 00157 g005
Figure 6. Cross-section of a sample made with 0.12 mm layer height and a 0/90 raster angle, contrasted with a part made with 0.21 mm layer height and a 45/45 raster angle.
Jcs 07 00157 g006
Figure 7. The simulation result for homogenous layer design (b2) compared with DIC from experimental results (b1). In contrast, DIC for experimental results of the inhomogeneous layer design (a1) is compared with simulation results (a2).
Jcs 07 00157 g007
Figure 8. Measured (a) strength, (b) stiffness, (c) deflection at failure, and (d) toughness, with standard deviations. The X-axis label refers to the different process conditions, as listed in Table 2.
Jcs 07 00157 g008
Figure 9. PAEK and PAEK/CF composites’ mechanical properties: (a) strength, (b) stiffness, (c) deflection at failure, and (d) toughness. The X-axis label shows the performance of PAEK or PAEK/CF at nozzle temeparatures (430 °C and 450 °C) and oven temperatures (160 °C & 180 °C) for different raster angles (45/−45 & 0/90).
Jcs 07 00157 g009
Figure 10. PAEK/CF samples made at 470 °C show a drop in mechanical properties, (a) strength, (b) stiffness, (c) deflection at failure, and (d) toughness, compared to samples made at 450 °C. The X-axis label shows the performance of PAEK or PAEK/CF at different nozzle temeparatures (430 °C and 450 °C) and oven temperatures (160 °C & 180 °C), for different raster angles (45/−45 & 0/90).
Jcs 07 00157 g010
Table 1. Optimized layer design parameters using multiscale modeling for three intensities, in which the one in bold is chosen as the optimum intensity.
ParametersIntensityDefection at Failure (mm)
Extrusion width %606.25
1057.5
1208.4
Infill overlap %1012.7
907.5
6010.1
Layer height (nozzle size) mm0.17.98
0.257.58
0.37.44
Infill shapeWiggle6.95
Rectilinear6.63
Full honeycomb7.83
Solid layers37.2
08.67
27.82
No. of shells211.31
38.43
013.12
Table 2. The highlighted parameter is the only one changed for ten experimental process conditions. The first process condition is conducted with optimal intensity.
Condition
Process
Temp
Nozzle
°C
Speed
(mm/s)
Raster
Angle
(∠)
Density
Infill
(%)
Infill
Shape
Layer
Height
(mm)
Infill
Overlap
Extrusion
Width
(%)
Bed
Temp
°C
Number
of
Shells
1430 °C22000/90100%Rectilinear0.2190%105160 °C3
2430 °C2200+−45100%Rectilinear0.2190%105160 °C3
3430 °C22000/9070%Rectilinear0.2190%105160 °C3
4430 °C22000/90100%Full Honeycomb0.2190%105160 °C3
5430 °C22000/90100%Rectilinear0.1290%105160 °C3
6430 °C22000/90100%Rectilinear0.2110%105160 °C3
7430 °C22000/90100%Rectilinear0.2190%120160 °C3
8430 °C22000/90100%Rectilinear0.2190%105200 °C3
9450 °C22000/90100%Rectilinear0.2190%105160 °C3
10450 °C22000/90100%Rectilinear0.2190%105200 °C3
Table 3. Average thermal transitions and enthalpies for PAEK and PAEK/CF and their thermal history under different processing conditions. All samples were manufactured with oven temperature of 160 °C, except process 4, for which the oven temperature was 180 °C.
#Material ConditionGlass TransitionMelting PointΔHf (J/g)χc (%)
1PAEK Filament
(1.75 mm diameter)
146.0 °C338.0 °C42.332.0
2PAEK/CF Filament (10 wt%)
(1.75 mm diameter)
138.0 °C345.0 °C31.123.5
3Process 1-PAEK-sample146.2 °C339.5 °C35.326.7
4Process 1-PAEK-sample146.5 °C341.6 °C32.724.7
5Process 7-PAEK-sample149.3 °C341.7 °C40.530.7
6Process 9-PAEK-sample147.5 °C340.0 °C34.025.8
7Process 10-PAEK-sample148.2 °C340.8 °C36.928.0
8Process 9-PAEK/CF-sample143.5 °C340.1 °C36.027.2
9Process 10-PAEK/CF-sample143.9 °C340.8 °C38.229.0
Disclaimer/Publisher’s Note: The statements, opinions and data contained in all publications are solely those of the individual author(s) and contributor(s) and not of MDPI and/or the editor(s). MDPI and/or the editor(s) disclaim responsibility for any injury to people or property resulting from any ideas, methods, instructions or products referred to in the content.

