
Surface Optimization of Components Obtained by Fused Deposition Modeling for Air-Plasma-Sprayed Ceramic Coatings


Abstract
:1. Introduction
2. Materials and Methods
- Arithmetic mean height, Sa—this is defined as the arithmetic mean of the absolute value of the height, Z(x,y), within a sampling area (A):
- Root mean square height, Sq—this is the root mean square value of the surface departures within the sampling area:
- Kurtosis, Sku—this is a measure of the sharpness of the surface height distribution and is the ratio of the mean of the fourth power of the height values and the fourth power of Sq within the sampling area:
- Number of peaks per unit area, Spd;
- Developed interfacial area ratio, Sdr—this is expressed as the percentage of the additional surface area contributed by the texture as compared to an ideal plane with the size of the measurement region:
3. Results
4. Discussion
5. Conclusions
- The adhesion of the coating to the substrate increased with its roughness;
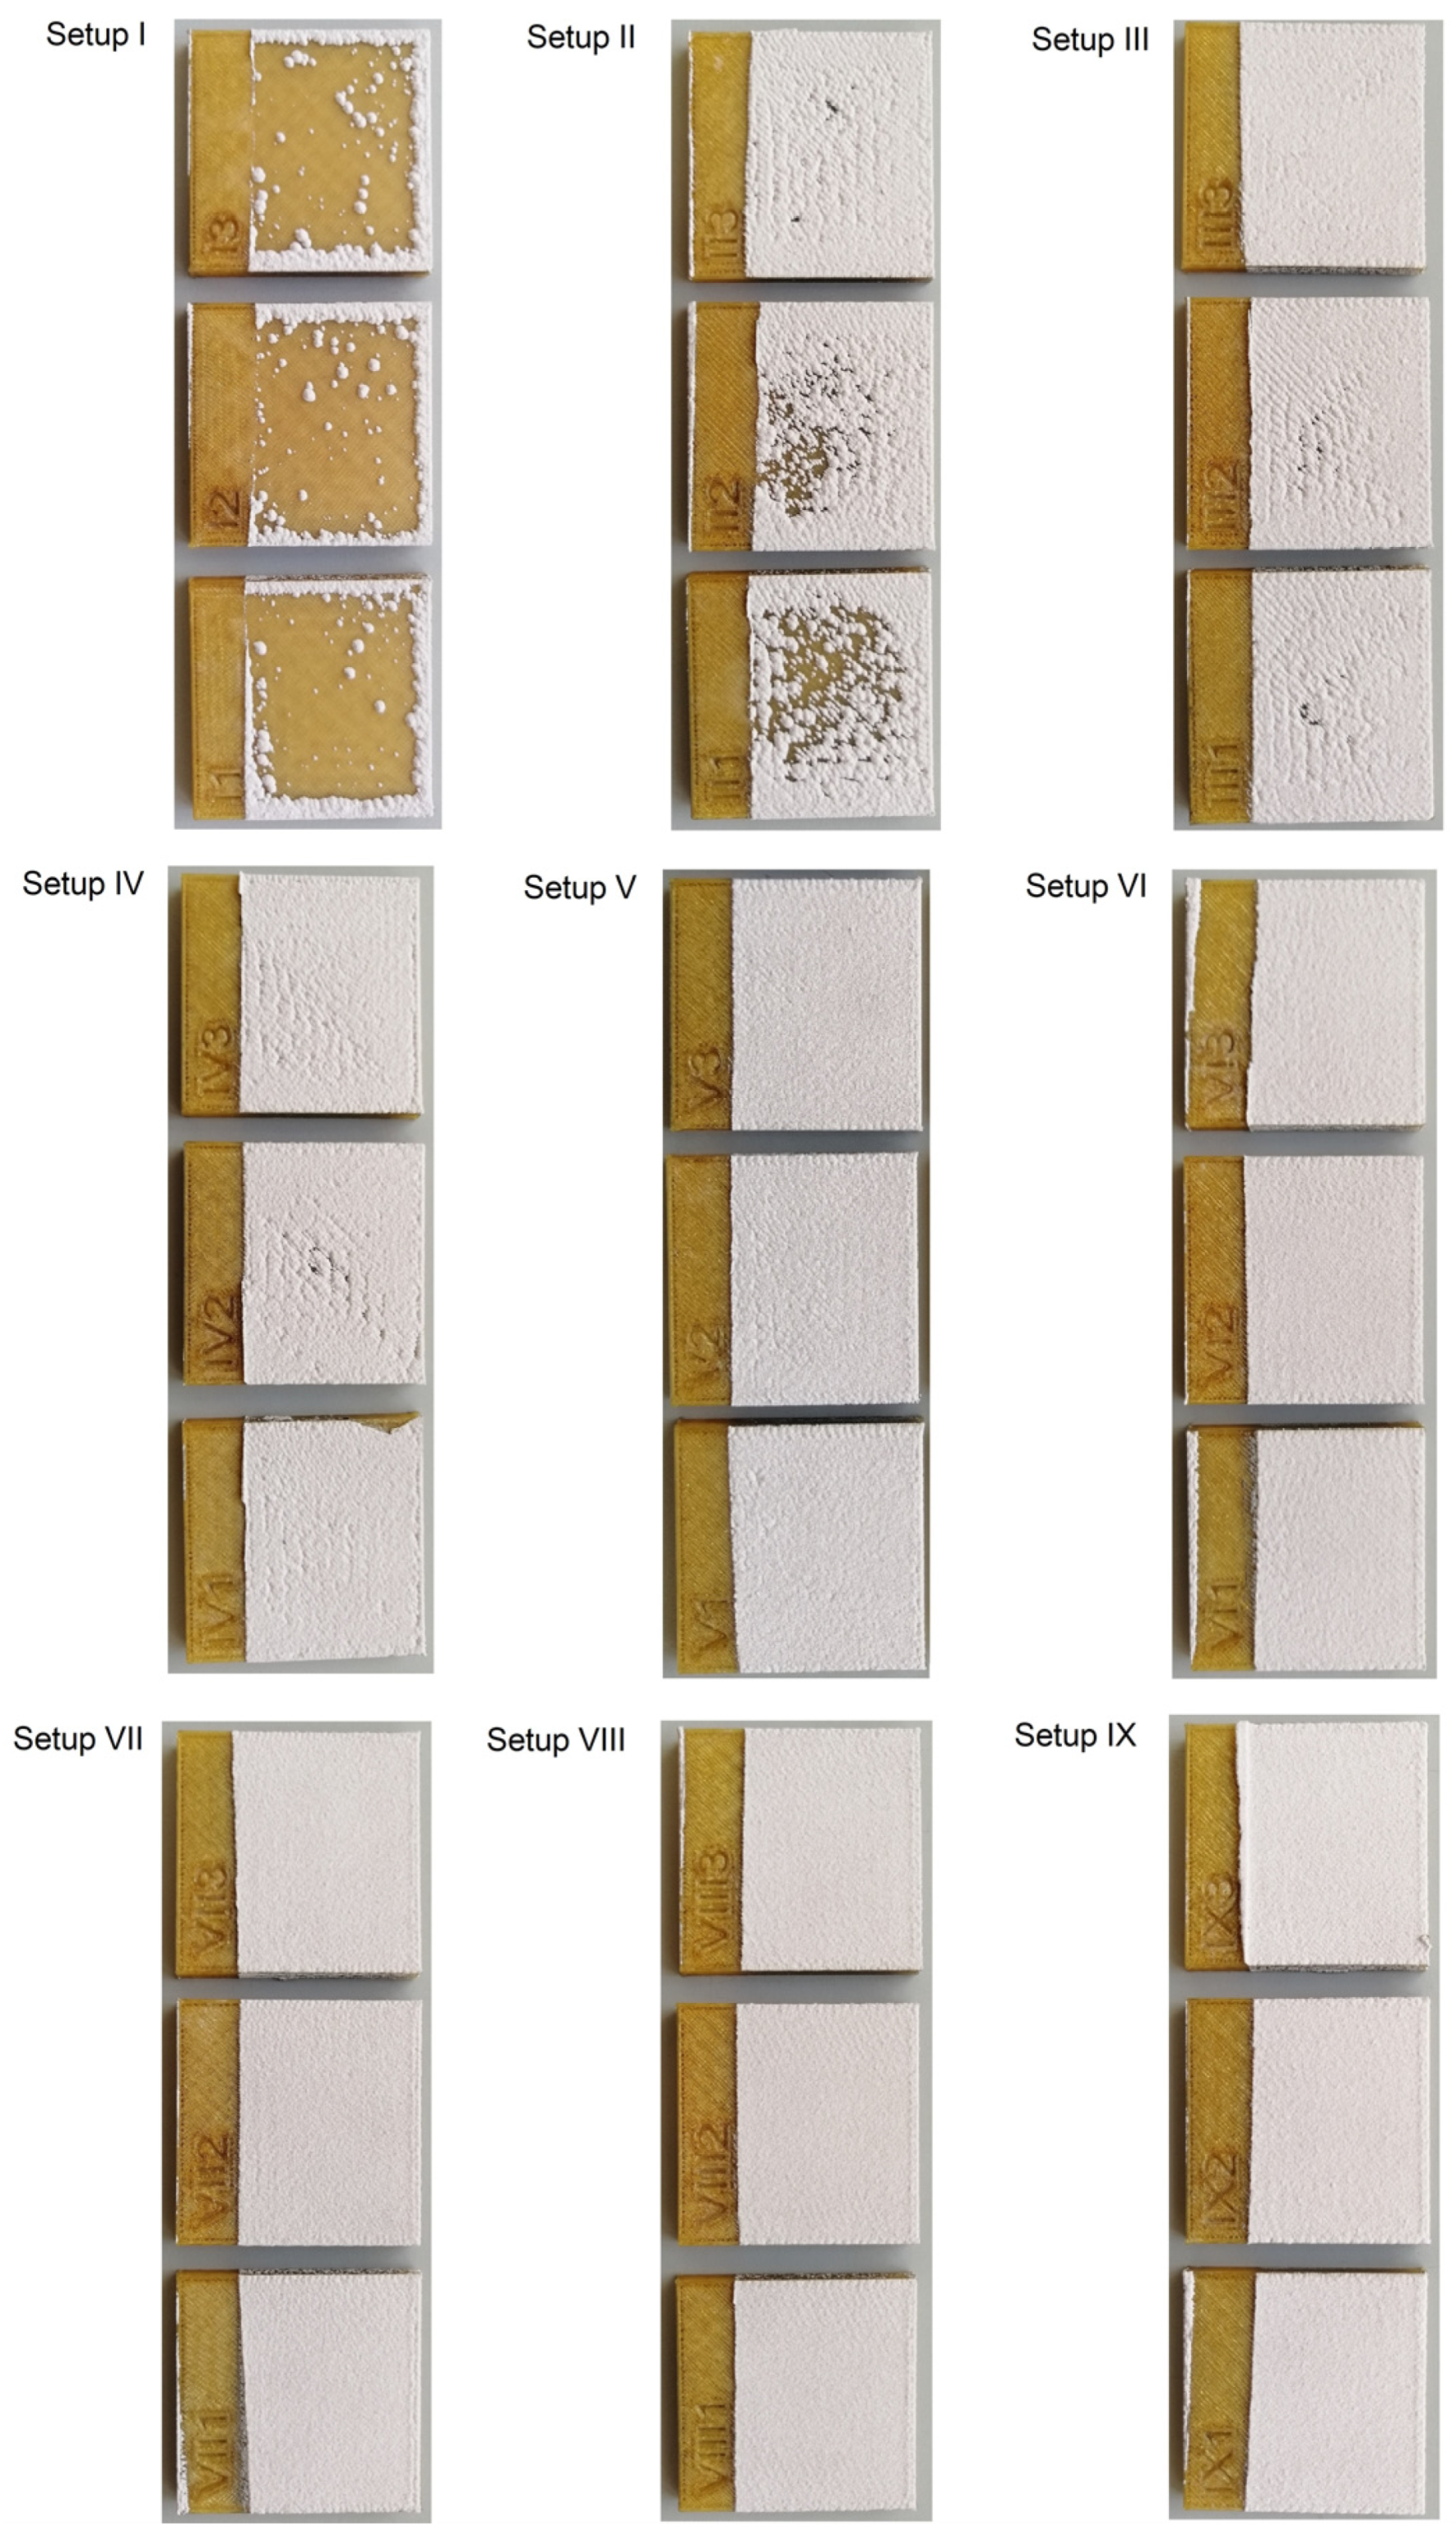
- No coating or defective adhesion were found for setups I and II, respectively. This was a consequence of the texture produced by a very good surface finishing, which promoted the bouncing of the ceramic particles on the substrate;
- Starting from setup III, the coating was uniform on the FDM surfaces. They presented a complex texture and a surface with higher peaks that promoted the deposition;
- The coating thickness for the best setup was about 0.54 mm, and the powder could enter the valleys of the texture since they presented a smaller size compared to the horizontal distance between two consecutive peaks.
Author Contributions
Funding
Data Availability Statement
Conflicts of Interest
References
- Praveena, B.A.; Lokesh, N.; Buradi, A.; Santhosh, N.; Praveena, B.L.; Vignesh, R. A Comprehensive Review of Emerging Additive Manufacturing (3D Printing Technology): Methods, Materials, Applications, Challenges, Trends and Future Potential. Proc. Mater. Today: Proc. 2022, 52, 1309–1313. [Google Scholar]
- Chen, N.; He, C.; Pang, S. Additive Manufacturing of Energetic Materials: Tailoring Energetic Performance via Printing. J. Mater. Sci. Technol. 2022, 127, 29–47. [Google Scholar] [CrossRef]
- Ngo, T.D.; Kashani, A.; Imbalzano, G.; Nguyen, K.T.Q.; Hui, D. Additive Manufacturing (3D Printing): A Review of Materials, Methods, Applications and Challenges. Compos. Part B Eng. 2018, 143, 172–196. [Google Scholar] [CrossRef]
- Bhushan, B.; Caspers, M. An Overview of Additive Manufacturing (3D Printing) for Microfabrication. Microsyst. Technol. 2017, 23, 1117–1124. [Google Scholar] [CrossRef]
- Jyothish Kumar, L.; Pandey, P.M.; Wimpenny, D.I. 3D Printing and Additive Manufacturing Technologies; Springer: Singapore, 2018; ISBN 9789811303050. [Google Scholar]
- Kumar, S.; Czekanski, A. Roadmap to Sustainable Plastic Additive Manufacturing. Mater. Today Commun. 2018, 15, 109–113. [Google Scholar] [CrossRef]
- Huang, S.H.; Liu, P.; Mokasdar, A.; Hou, L. Additive Manufacturing and Its Societal Impact: A Literature Review. Int. J. Adv. Manuf. Technol. 2013, 67, 1191–1203. [Google Scholar] [CrossRef]
- Novakova-Marcincinova, L.; Novak-Marcincin, J.; Barna, J.; Torok, J. Special Materials Used in FDM Rapid Prototyping Technology Application. In Proceedings of the INES 2012—IEEE 16th International Conference on Intelligent Engineering Systems, Lisbon, Portugal, 13–15 June 2012. [Google Scholar]
- Suffo, M.; Revenga, C. Biomechanical Analysis of Non-Metallic Biomaterial in the Manufacture of a New Knee Prosthesis. Materials 2021, 14, 5951. [Google Scholar] [CrossRef] [PubMed]
- ULTEMTM 1010 Resin. Available online: https://www.stratasys.com/materials/search/ultem1010 (accessed on 27 March 2023).
- Wu, H.; Sulkis, M.; Driver, J.; Saade-Castillo, A.; Thompson, A.; Koo, J.H. Multi-Functional ULTEMTM1010 Composite Filaments for Additive Manufacturing Using Fused Filament Fabrication (FFF). Addit. Manuf. 2018, 24, 298–306. [Google Scholar] [CrossRef]
- Taylor, G.; Wang, X.; Mason, L.; Leu, M.C.; Chandrashekhara, K.; Schniepp, T.; Jones, R. Flexural Behavior of Additively Manufactured Ultem 1010: Experiment and Simulation. Rapid Prototyp. J. 2018, 24, 1003–1011. [Google Scholar] [CrossRef]
- Taylor, G.; Anandan, S.; Murphy, D.; Leu, M.; Chandrashekhara, K. Fracture Toughness of Additively Manufactured ULTEM 1010. Virtual Phys. Prototyp. 2019, 14, 277–283. [Google Scholar] [CrossRef]
- Liu, Y.; Zhang, D.; Geng, D.; Shao, Z.; Zhou, Z.; Sun, Z.; Jiang, Y.; Jiang, X. Ironing Effect on Surface Integrity and Fatigue Behavior during Ultrasonic Peening Drilling of Ti-6Al-4 V. Chinese J. Aeronaut. 2022; in press. [Google Scholar] [CrossRef]
- Sun, Z.; Geng, D.; Zheng, W.; Liu, Y.; Liu, L.; Ying, E.; Jiang, X.; Zhang, D. An Innovative Study on High-Performance Milling of Carbon Fiber Reinforced Plastic by Combining Ultrasonic Vibration Assistance and Optimized Tool Structures. J. Mater. Res. Technol. 2023, 22, 2131–2146. [Google Scholar] [CrossRef]
- Xie, P.; Chen, J.; Ye, B.; Wang, R.; Dang, K.; Yang, W.; Ostrikov, K. Plasma Sprayed Thermal Barrier Coatings: Effects of Polyamide Additive on Injection Molding Part Quality. J. Appl. Polym. Sci. 2022, 139, 51980. [Google Scholar] [CrossRef]
- Gonzalez, R.; Ashrafizadeh, H.; Lopera, A.; Mertiny, P.; McDonald, A. A Review of Thermal Spray Metallization of Polymer-Based Structures. J. Therm. Spray Technol. 2016, 25, 897–919. [Google Scholar] [CrossRef] [Green Version]
- Kumar, V.; Kandasubramanian, B. Processing and Design Methodologies for Advanced and Novel Thermal Barrier Coatings for Engineering Applications. Particuology 2016, 27, 1–28. [Google Scholar] [CrossRef]
- Gong, X.; Chen, R.R.; Yang, Y.H.; Wang, Y.; Ding, H.S.; Guo, J.J.; Su, Y.Q.; Fu, H.Z. Effect of Mo on Microstructure and Oxidation of NiCoCrAlY Coatings on High Nb Containing TiAl Alloys. Appl. Surf. Sci. 2018, 431, 81–92. [Google Scholar] [CrossRef]
- Liu, Q.; Huang, S.; He, A. Composite Ceramics Thermal Barrier Coatings of Yttria Stabilized Zirconia for Aero-Engines. J. Mater. Sci. Technol. 2019, 35, 2814–2823. [Google Scholar] [CrossRef]
- Dhomne, S.; Mahalle, A.M. Thermal Barrier Coating Materials for SI Engine. J. Mater. Res. Technol. 2019, 8, 1532–1537. [Google Scholar] [CrossRef]
- Jude, S.A.A.; Jappes, J.T.W.; Adamkhan, M. Thermal Barrier Coatings for High-Temperature Application on Superalloy Substrates—A Review. Mater. Today Proc. 2022, 60, 1670–1675. [Google Scholar] [CrossRef]
- Sun, G.; He, X.; Jiang, J.; Sun, Y.; Zhong, Y. A Study on the Deposition of Al2O3 Coatings on Polymer Substrates by a Plasma Spray/Micro-Arc Oxidation Two-Step Method. J. Therm. Spray Technol. 2013, 22, 27–35. [Google Scholar] [CrossRef]
- Huang, Y.-J.; Guo, F.-Q.; Zhang, H.; Yang, Z.-J. An Efficient Computational Framework for Generating Realistic 3D Mesoscale Concrete Models Using Micro X-Ray Computed Tomography Images and Dynamic Physics Engine. Cem. Concr. Compos. 2022, 126, 104347. [Google Scholar] [CrossRef]
- Huang, Y.; Yang, Z.; Ren, W.; Liu, G.; Zhang, C. 3D Meso-Scale Fracture Modelling and Validation of Concrete Based on in-Situ X-Ray Computed Tomography Images Using Damage Plasticity Model. Int. J. Solids Struct. 2015, 67–68, 340–352. [Google Scholar] [CrossRef]
- Landis, E.N. Microplanes and Microstructure: Connecting Abstractions and Reality. Eng. Fract. Mech. 2018, 200, 42–49. [Google Scholar] [CrossRef]
- Marșavina, L.; Vălean, C.; Mărghitaș, M.; Linul, E.; Razavi, S.M.J.; Berto, F.; Brighenti, R. Effect of the Manufacturing Parameters on the Tensile and Fracture Properties of FDM 3D-Printed PLA Specimens. Eng. Fract. Mech. 2022, 274, 108766. [Google Scholar] [CrossRef]
- Cuiffo, M.A.; Snyder, J.; Elliott, A.M.; Romero, N.; Kannan, S.; Halada, G.P. Impact of the Fused Deposition (FDM) Printing Process on Polylactic Acid (PLA) Chemistry and Structure. Appl. Sci. 2017, 7, 579. [Google Scholar] [CrossRef] [Green Version]
- Coppola, A.; Impero, F.; Ruggiero, C.; Scala, F.; Squillace, A. Set-up of an Experimental Procedure for the Surface Smoothing of FDM Parts through Acetone Vapor. In Key Engineering Materials; Trans Tech Publications Ltd.: Bäch, Switzerland, 2019; Volume 813, pp. 447–452. [Google Scholar]
- Han, P.; Tofangchi, A.; Deshpande, A.; Zhang, S.; Hsu, K. An Approach to Improve Interface Healing in FFF-3D Printed Ultem 1010 Using Laser Pre-Deposition Heating. Procedia Manuf. 2019, 34, 672–677. [Google Scholar] [CrossRef]
- Pandelidi, C.; Maconachie, T.; Bateman, S.; Kelbassa, I.; Piegert, S.; Leary, M.; Brandt, M. Parametric Study on Tensile and Flexural Properties of ULTEM 1010 Specimens Fabricated via FDM. Rapid Prototyp. J. 2021, 27, 429–451. [Google Scholar] [CrossRef]


| Mechanical properties | ||
| Tensile strength, Yield (ASTM D638) [MPa] | 64 (XZ) 41 (ZX) |  |
| Tensile strength, Ultimate (ASTM D638) [MPa] | 81 (XZ) 48 (ZX) | |
| Tensile modulus (ASTM D638) [GPa] | 2.77 (XZ) 2.20 (ZX) | |
| Tensile elongation at break (ASTM D638) [%] | 3.3 (XZ) 2.0 (ZX) | |
| IZOD impact, Notched (ASTM D256) [J/m] | 41 (XZ) 24 (ZX) | |
| Compressive strength, Yield (ASTM D695) [MPa] | 134 (XZ) 107 (ZX) | |
| Compressive strength, Ultimate (ASTM D695) [MPa] | No break (XZ) 1.125 (ZX) | |
| Compressive modulus (ASTM D695) [GPa] | 10.00 (XZ) 1.12 (ZX) | |
| Thermal properties | ||
| Heat deflection at 264 psi (ASTM D648) [°C] | 213 | |
| Glass transition temperature (DSC) [°C] | 215 | |
| Coefficient of thermal expansion (ASTM E831) [µm/(m·°C)] | 47 | |
| Other | ||
| Specific gravity (ASTM D792) [g/cm3] | 1.27 | |
| Parameter | Value | ||
|---|---|---|---|
| Enhanced visible rasters [mm] | 0.3556 | 0.5431 | 0.7306 |
| Visible raster air gap [mm] | −0.0254 | 0.0381 | 0.1016 |
| Enhanced internal rasters [mm] | 0.3556 | ||
| Internal raster air gap [mm] | 0 | ||
| Raster angle [°] | 45 | ||
| Contour width [mm] | 0.3556 | ||
| Number of contours | 2 (On the visible surface, the default single contour was used) | ||
| Setup | EVR | VRAG |
|---|---|---|
| I | −1 | −1 |
| II | 0 | −1 |
| III | 1 | −1 |
| IV | −1 | 0 |
| V | 0 | 0 |
| VI | 1 | 0 |
| VII | −1 | 1 |
| VIII | 0 | 1 |
| IX | 1 | 1 |
| Nomenclature | Morphological Surface Parameter |
|---|---|
| Sa | Arithmetic mean height (height parameter) |
| Sq | Root mean square height (height parameter) |
| Sku | Kurtosis (height parameter) |
| Spd | Number of peaks per unit area (feature parameter) |
| Sdr | Developed interfacial area ratio (hybrid parameter) |
| PA | Peak area (areal parameter) |
| DA | Dale area (areal parameter) |
| Setup | Average [mm] | Standard Deviation [mm] |
|---|---|---|
| I | 0.024 | 0.011 |
| II | 0.425 | 0.055 |
| III | 0.543 | 0.011 |
| IV | 0.501 | 0.035 |
| V | 0.514 | 0.033 |
| VI | 0.509 | 0.011 |
| VII | 0.483 | 0.012 |
| VIII | 0.488 | 0.021 |
| IX | 0.498 | 0.011 |
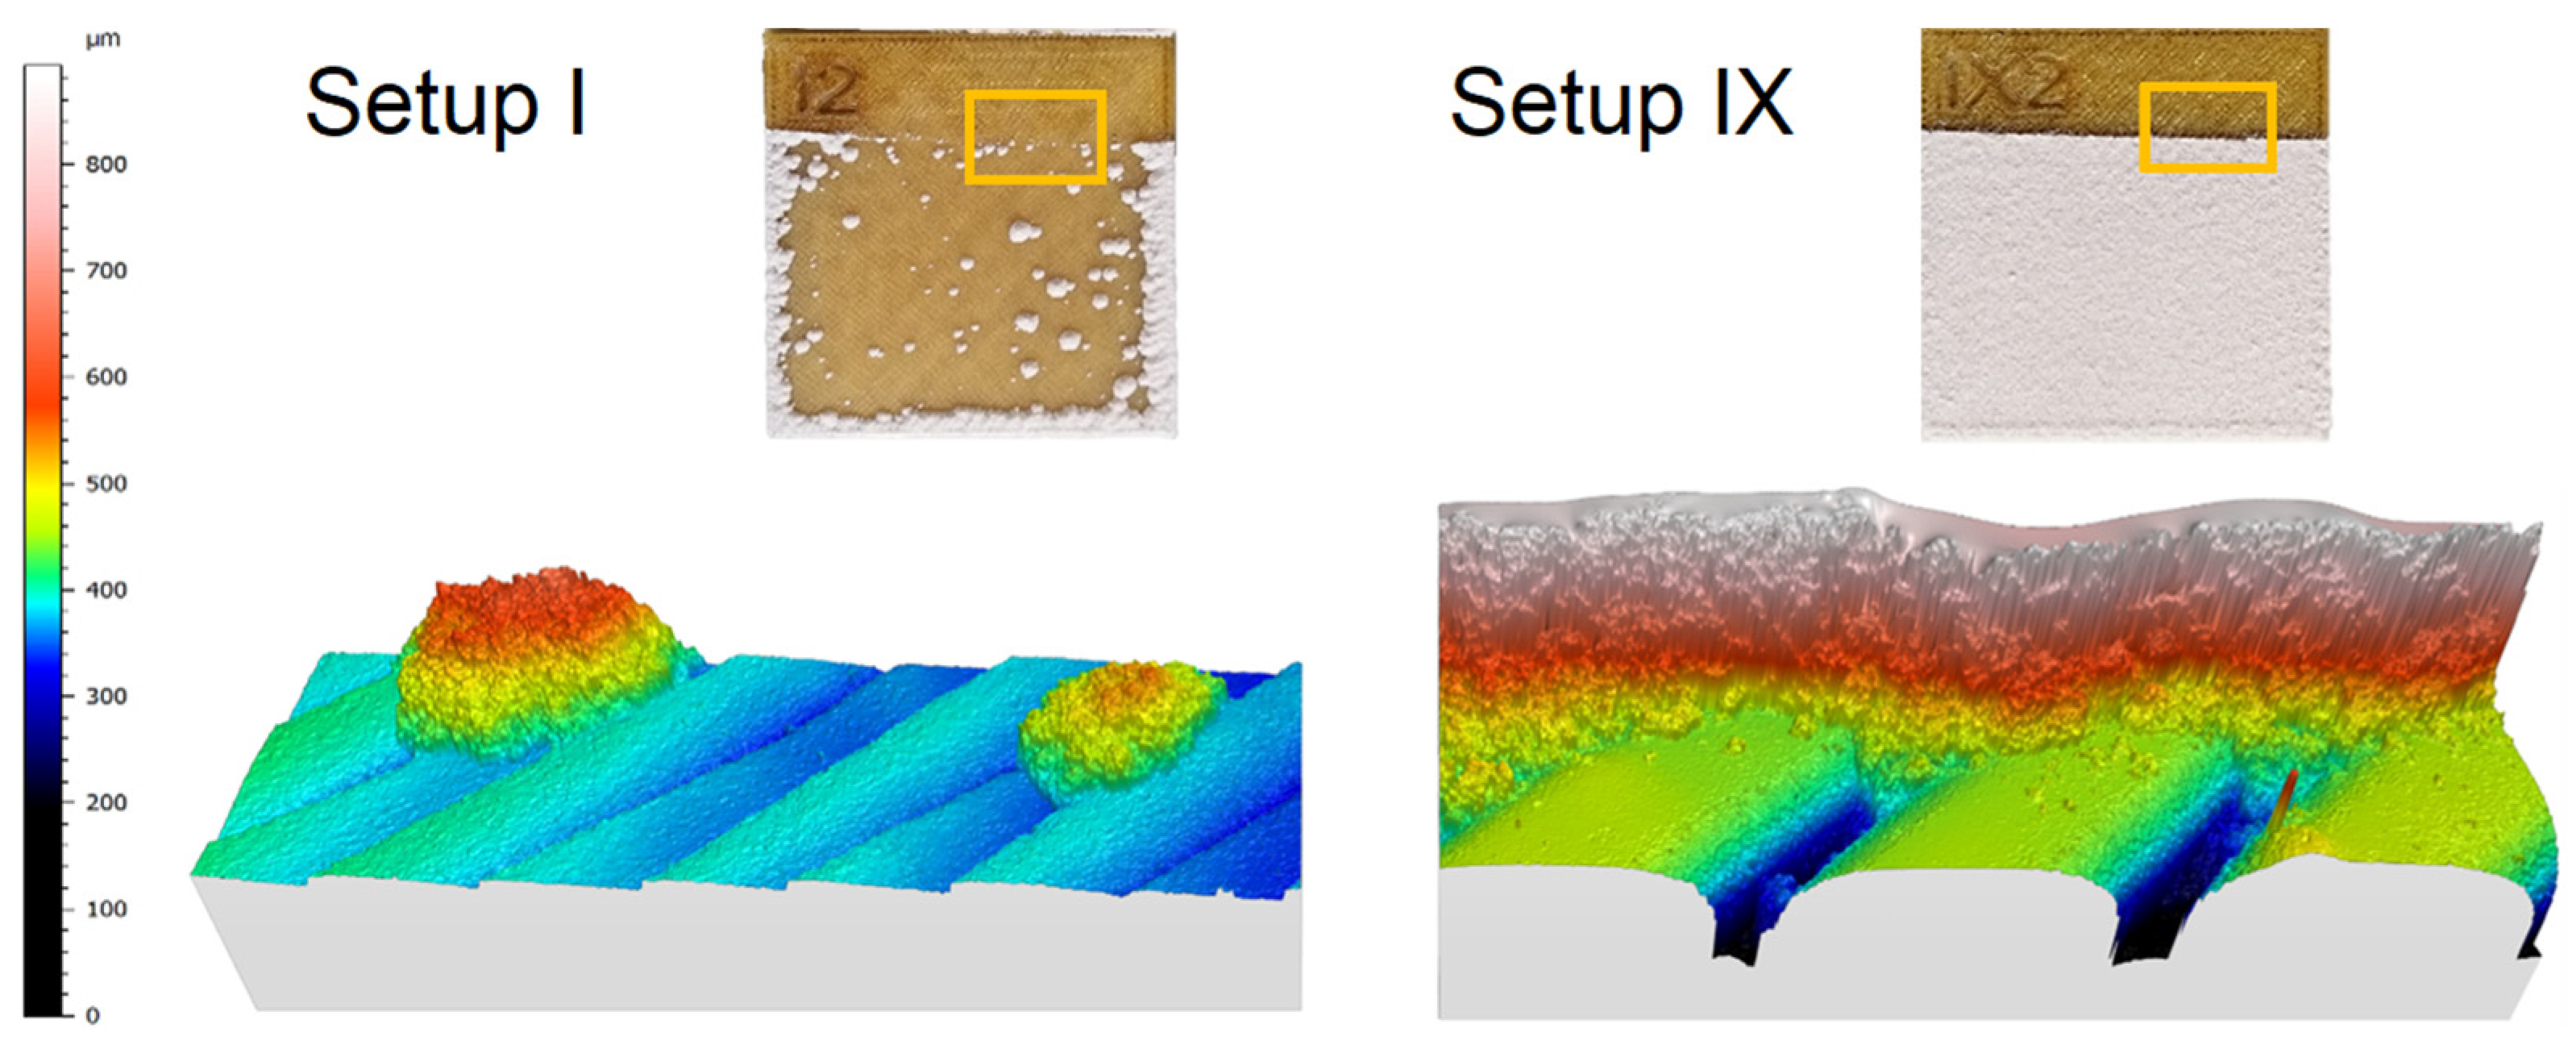
| Morphological Surface Parameter | Setup I | Information | Setup IX | Information |
|---|---|---|---|---|
| Sa [μm] | 10.39 | Low average roughness | 110.81 | High average roughness |
| Sq [μm] | 2.51 | Low roughness variability | 28.33 | High roughness variability |
| Sku [–] | 61.28 | Spiked peaks and dales | 2.58 | Flat peaks and dales |
| Spd [1/mm2] | 0.57 | Few peaks | 6.31 | Many peaks |
| Sdr [%] | 18.64 | Uniform texture | 132.12 | Complex texture |
| PA [mm2] | 10.65 | Smaller peaks area | 12.45 | Larger peaks area |
| DA [mm2] | 10.45 | Larger dales area | 8.78 | Smaller dales area |
Disclaimer/Publisher’s Note: The statements, opinions and data contained in all publications are solely those of the individual author(s) and contributor(s) and not of MDPI and/or the editor(s). MDPI and/or the editor(s) disclaim responsibility for any injury to people or property resulting from any ideas, methods, instructions or products referred to in the content. |
© 2023 by the authors. Licensee MDPI, Basel, Switzerland. This article is an open access article distributed under the terms and conditions of the Creative Commons Attribution (CC BY) license (https://creativecommons.org/licenses/by/4.0/).
Share and Cite
Formisano, A.; Boccarusso, L.; Langella, A. Surface Optimization of Components Obtained by Fused Deposition Modeling for Air-Plasma-Sprayed Ceramic Coatings. J. Compos. Sci. 2023, 7, 158. https://doi.org/10.3390/jcs7040158
Formisano A, Boccarusso L, Langella A. Surface Optimization of Components Obtained by Fused Deposition Modeling for Air-Plasma-Sprayed Ceramic Coatings. Journal of Composites Science. 2023; 7(4):158. https://doi.org/10.3390/jcs7040158
Chicago/Turabian StyleFormisano, Antonio, Luca Boccarusso, and Antonio Langella. 2023. "Surface Optimization of Components Obtained by Fused Deposition Modeling for Air-Plasma-Sprayed Ceramic Coatings" Journal of Composites Science 7, no. 4: 158. https://doi.org/10.3390/jcs7040158