Article

Impact of Injection Molding Parameters on Material Acoustic Parameters

1
DTU Construct —Produktionstorvet Building, 427 2800 Lyngby, Denmark
2
DTU Physics—Fysikvej Building, 309 2800 Lyngby, Denmark
*
Authors to whom correspondence should be addressed.
J. Manuf. Mater. Process. 2023, 7(6), 222; https://doi.org/10.3390/jmmp7060222
Submission received: 12 September 2023 / Revised: 21 November 2023 / Accepted: 5 December 2023 / Published: 6 December 2023
(This article belongs to the Special Issue Advances in Injection Molding: Process, Materials and Applications)

Abstract

:
Understanding the relationship between injection molding parameters and the acoustic properties of polymers is crucial for optimizing the design and performance of acoustic-based polymer devices. In this work, the impact of injection molding parameters, such as the injection velocity and packing pressure, on the acoustic parameters of polymers, namely the elastic moduli, is studied. The measurements lead to calculating material parameters, such as the Young’s modulus and Poisson’s ratio, that can be swiftly measured and determined thanks to this method. Polymethyl methacrylate (PMMA) was used as the molding material, and using PMMA LG IG 840, the parts were simulated and injection molded, applying a ‘design of experiment’ (DOE) statistical method. The results indicated a correlation between the injection molding process parameters and the acoustic characteristics, such as the elastic moduli, and a specifically decreasing trend with increase in the injection velocity. Notably, a relative decrease in the Young’s modulus by 1 % was observed when increasing the packing pressure from 90 MPa to 120 MPa . Similarly, a decrease in the Poisson’s ratio of 2.9 % was observed when the injection velocity was increased from 16 mm / s to 40 mm / s . This method can be used to fine-tune the material properties according to the needs of a given application and to facilitate the characterization of different polymer acoustic properties essential for acoustic-based polymer devices.

1. Introduction

Injection molding (IM) is a cost-effective way to mass-produce plastic parts with specific shapes [1,2,3]. To maintain quality and ensure consistency, it is essential to carefully control the various stages of the process, including metering, filling, packing, and cooling [4]. It is common to conduct initial studies on the material, the conditions, and the process parameters to achieve such consistency using various methods [5]. In recent years, IM has found significant applications in the biomedical industry, for example, in microfluidics and lab-on-a-chip devices [6]. Acoustic lab-on-a-chip systems, which utilize ultrasonic waves to manipulate biological samples, have increased in prominence due to their potential for non-invasive and accurate sample processing. Manufacturing these devices requires intricate designs and precise dimensional tolerances, which injection molding is ideally suited for. Given the critical nature of these applications, the relationship between the molding parameters and the material acoustic properties becomes paramount, providing the foundation for the present study [7].
However, before diving deep into understanding these acoustic properties, it is essential to establish a robust and consistent IM process. Even minor inconsistencies in IM can introduce variations in material properties that can drastically affect the quality of the parts to be analyzed acoustically [8]. In essence, and assuming that there is a relationship between the process settings of IM and the final acoustic properties, without proper optimization, there is a risk of compromising the repeatability and reliability of the acoustic tests on the IM parts, hindering accurate insights into the actual influence of IM on acoustic behaviors. Given the precision required in biomedical applications, particularly for acoustic lab-on-a-chip systems, ensuring the reliability of the IM process is a prerequisite for any substantive acoustic investigation [9].
Optimizing the conditions and process parameters could prove challenging due to the number of factors involved [10]. This process is paramount for getting the best out of IM as an effective manufacturing tool. Numerous studies have investigated the value of optimizing the IM process parameters and have led to the introduction of valuable methods from different perspectives. Numerical simulations using commercial software, analytical methods with mathematical tools, extracting data using production sensors, and post-production analysis represent some of these optimization paths [11,12,13,14].
Numerical simulation, as one of the robust tools for optimization, greatly supports companies in setting up their production quickly and easily.
Where the intricacies of injection molding and the resulting properties of molded parts have been studied, notable insights have been provided in previous works. In [9], the acoustophoresis of microparticles in a polymer chip microchannel is detailed, highlighting the importance of resonance modes. The influence of the injection parameters on the mechanical properties of ABS moldings was investigated in [15], utilizing Taguchi’s L9(34) orthogonal array design. Moreover, the challenges of recycling non-biodegradable materials and the impact of the processing parameters on the mechanical properties of recycled plastic parts were explored in [16]. These studies emphasize the significance of the relationship between the molding parameters and the polymer properties.
Several commercial software tools are available nowadays that allow the reliable simulation of manufacturing processes. These take advantage of mathematical models based on given boundary conditions and relevant governing equations for predicting the real-life behavior of the component under production [17]. Combined with the design of experiment (DOE) methodology, the simulation software offers deep insights into the process parameters and their interactions [18].
Post-production data analysis is another crucial layer in optimizing injection-molded polymer parts. Quality assurance (QA) steps are a vital piece of this process. The data gathered from assessments of the dimensions, shrinkage, warpage, and tensile stress are always useful indicators [19,20,21,22,23]. Conventionally, a correlation analysis of such parameters with the primary process parameters, such as the mold temperature, melt temperature, injection velocity, and packing pressure can provide insight into how the part can be manufactured with higher quality [24]. In the work by Moon et al. [25], this combination was put into practice with a case study, with an IM quality investigation method incorporating IM simulations, DOE, and post-production analysis. Inspired by the same methodology, a recent study was undertaken by our group where the focus was on the IM simulation, production, and QA analysis of an LOC molded with PMMA LG IG 840, as this grade was available both for production and in the archive of MOLDEX3D ® software. This laid the groundwork for designing the experiments for the current study, where acoustic tests of the optimized IM parts were performed after QA and residual stress analysis using a novel test established by Bodé et al. [26]. The incorporation of the acoustics of polymers in injection molding is an essential area of research due to its potential to improve the quality and consistency of parts produced through this manufacturing technique. To date, studies carried out have looked into the acoustic emission (AE) during molding and correlating these AE signals with the process parameters [27,28,29].
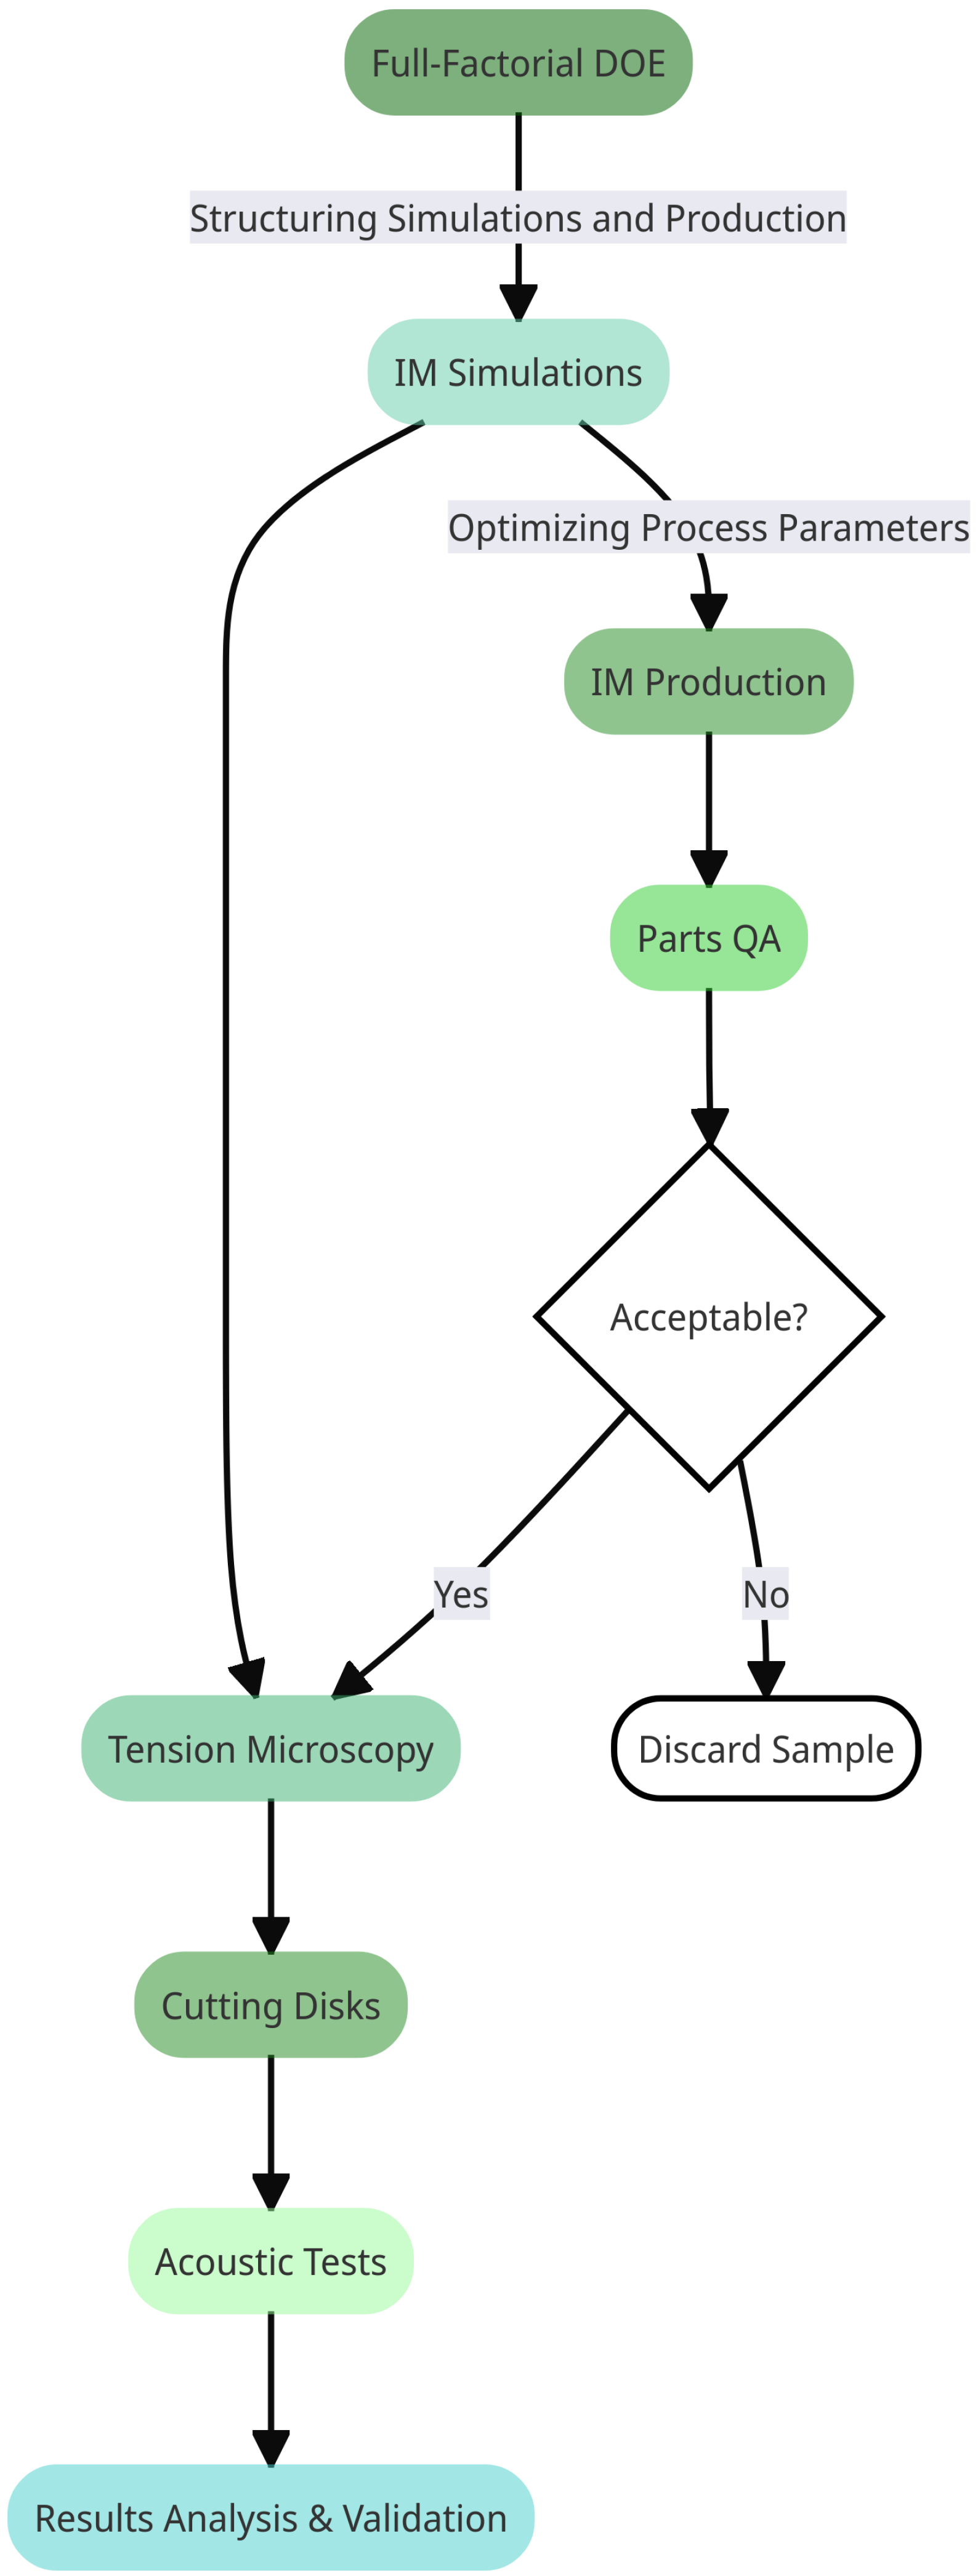
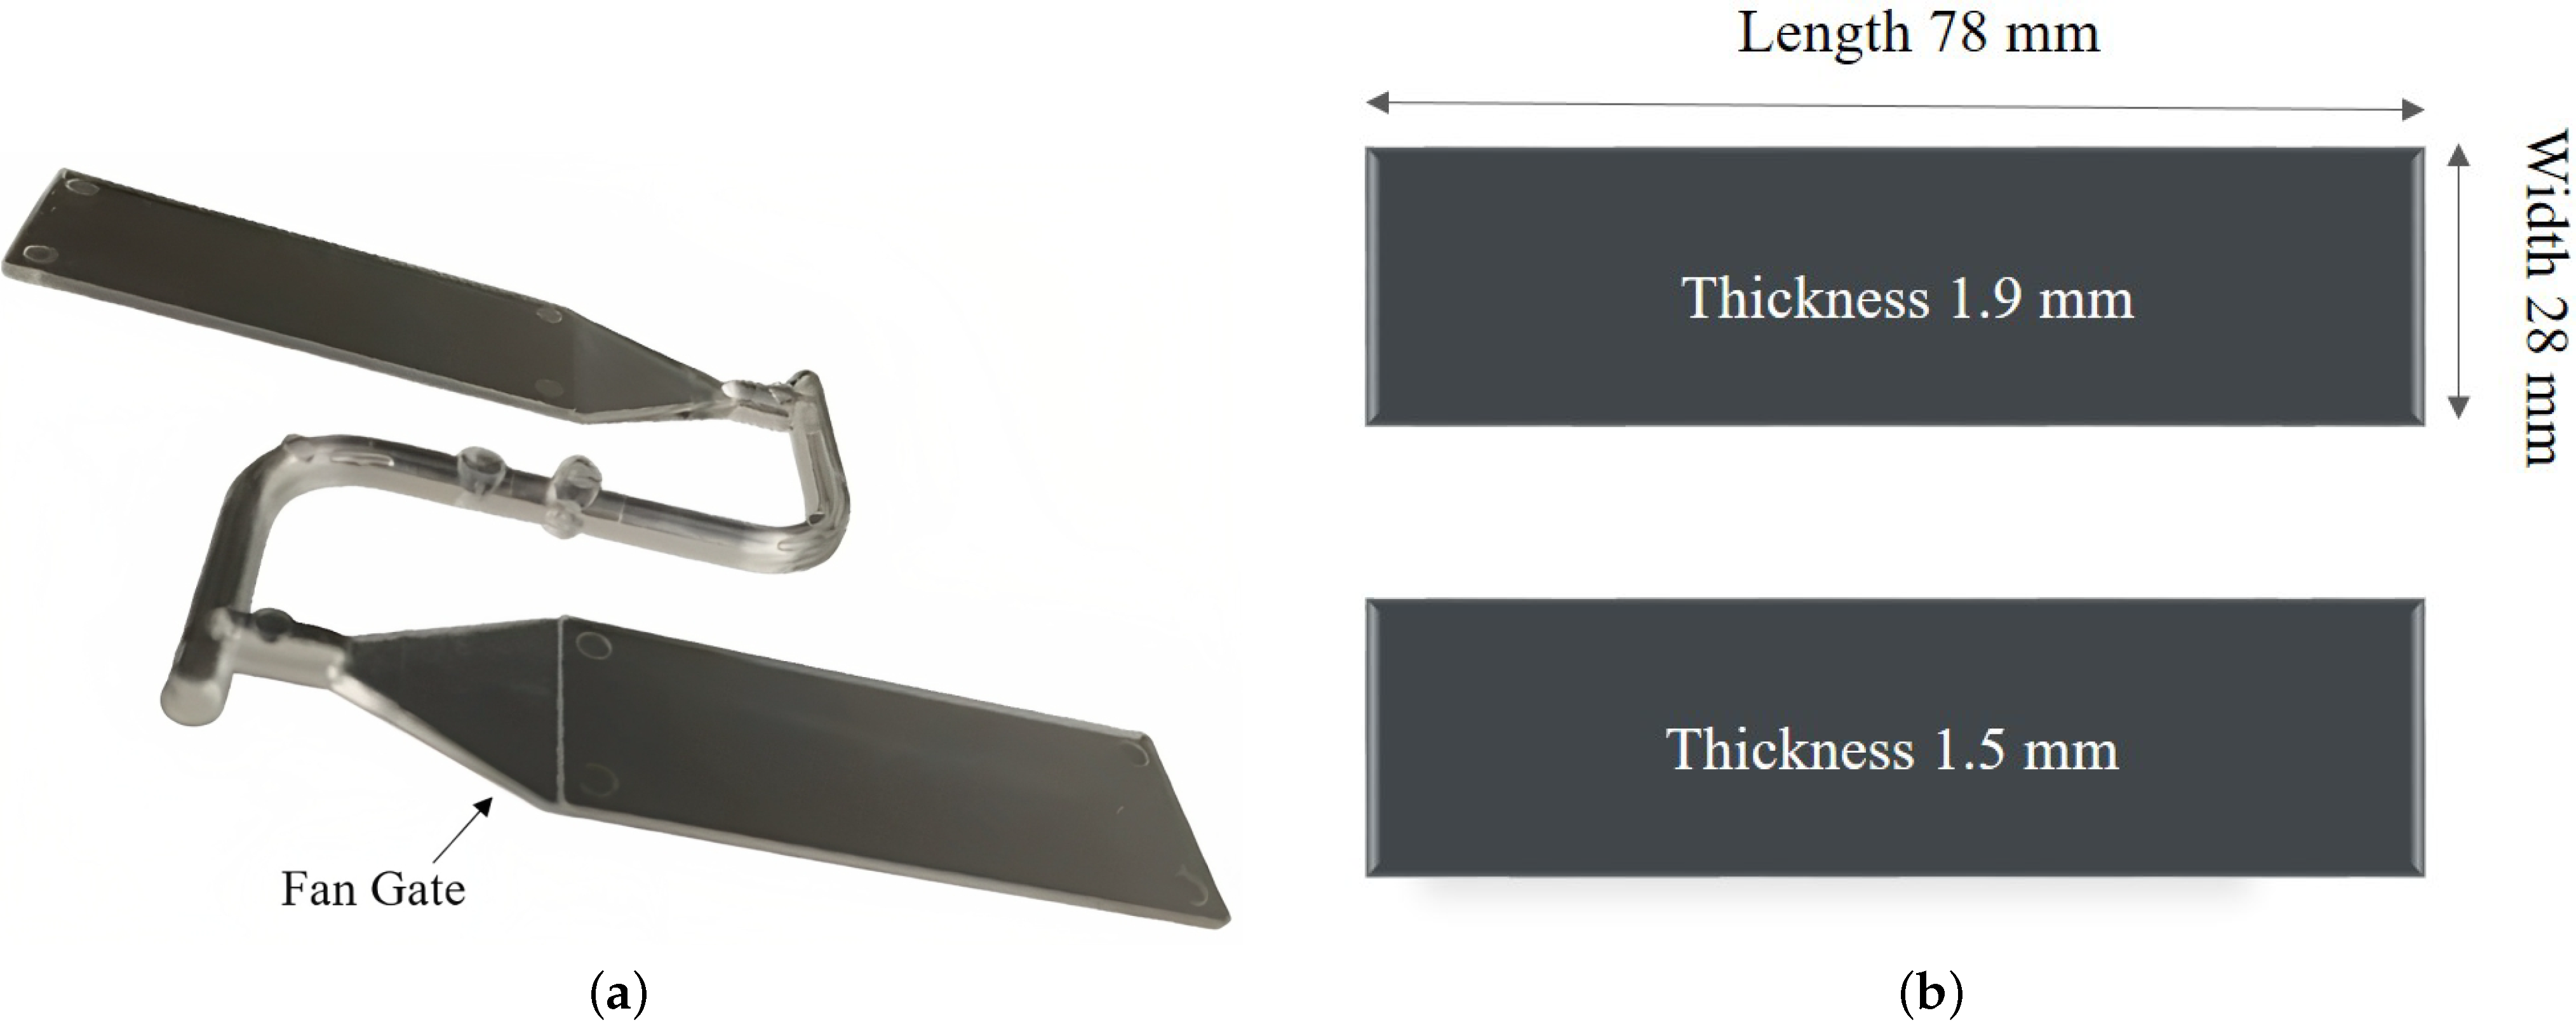
In the present work, the focus is turned towards testing the acoustic parameters of the parts after they are molded. A simple two-cavity design was selected for manufacture and analysis. To provide a structured and conclusive account of the simulations, a virtual DOE was established and used for establishing and optimizing the process settings [30]. The parts were then molded and inspected to provide a preliminary account of the status. The polarized microscopy of the parts contributed to a deeper understanding of the residual stress in the parts. Together with the simulations, this enabled decision if a part was unsuitable for the acoustic analysis at a subsequent stage. Ultimately, the acoustic tests were carried out on the same parts to investigate the possible correlations and patterns between the acoustic parameters of the material and the IM process settings, information that a database of the materials typically lacks. The paper goes full circle from discussing the theories regarding the acoustics of the polymers to consideration of the experimental production, IM simulations, acoustic testing, and the correlation analysis using a DOE to provide a comprehensive view of each of the elements and examines how the novel acoustic test method’s data can present the field with new possibilities. Figure 1 shows the sequential details of all the aforementioned steps, providing a summary of the study.

2. Theory

2.1. Injection Molding and Polymer Acoustics

The interplay between injection molding and the polymer acoustics field can provide valuable information for the production of lab-on-a-chips (LOCs) and the field of acoustofluidics, which is the study and manipulation of fluids using acoustic waves, especially at the microscale [31]. It can help unravel the complexities of how polymers influence sound propagation and optimize the production of high-performing acoustic products, such as polymer-based LOCs. Before proceeding to the study’s theoretical and experimental support, it is enlightening to consider an overview of why creating such a link between the two fields is essential, and to elaborate on the approach taken throughout this research to establish such a link. The present work aims to use the novel acoustic test developed by Bodé et al. [26] to gather data on the acoustic parameters of polymethyl methacrylate (PMMA) chips manufactured with the help of a DOE, as a case study, and to analyze and identify correlations between the injection molding process parameters and the acoustic parameters of the material. The work follows the methodology depicted in Figure 1, comprising theoretical elements, simulations, experimental production, acoustic tests, and correlation analysis. The flowchart depicts the study’s trajectory, starting with refinement of the IM process parameters, moving to the collection of acoustic data, and finally analyzing the potential relationship between the IM process configurations and the acoustic properties of the chosen material. Additionally, the chart hints at a potential future alignment of the IM simulation results with the acoustic parameter values based on the IM process settings used in the simulations, as will be explained in the following sections.
The work of Bodé et al. [26] on ultrasound spectroscopy introduced an innovative approach to evaluating the complex-valued elastic moduli of polymers. Their method of ultrasound electrical-impedance spectroscopy (UEIS) employs a piezoelectric disk that induces vibrations in an attached polymer ring, facilitating the characterization of the ring’s complex-valued elastic compressional and shear moduli. Central to our study is the concept of linear elastic media, which pertains to materials (like PMMA) that undergo reversible deformations under the influence of external forces and which return to their original state once these forces are removed [32]. PMMA, as a linear elastic medium, exhibits consistent mechanical behavior under small deformations, allowing for predictable and repeatable acoustic tests. Additionally, the electrical impedance of a piezoelectric plays a pivotal role in UEIS; it represents the opposition a piezoelectric material offers to the flow of electric current, which, when varied with frequency, provides valuable insights into the acoustic parameters of the connected sample [33]. In the subsequent sections, we consider the intricate calculations and principles underlying these concepts, setting the stage for our investigation into PMMA’s acoustic characteristics.

2.2. Linear Elastic Media

The mechanical stress tensor σ in a linear elastic solid is related to the mechanical strain tensor s via the stiffness tensor C ,
σ = C : s .
For isotropic materials, such as the injection-molded polymer sample studied in this work, the stiffness tensor can be written in Voigt notation as,
C = C 11 C 12 C 12 0 0 0 C 12 C 11 C 12 0 0 0 C 12 C 12 C 11 0 0 0 0 0 0 C 44 0 0 0 0 0 0 C 44 0 0 0 0 0 0 C 44 .
For isotropic materials the relationship C 12 = C 11 2 C 44 further reduces the number of unknown material parameters to the two complex-valued coefficients C 11 = C 11 + i C 11 and C 44 = C 44 + i C 44 . The imaginary parts C i k express the longitudinal and transverse attenuation in this formulation. The Young’s modulus E and the Poisson’s ratio ν can be calculated from the real parts C i k of the stiffness tensor by
E = C 44 ( 3 C 11 4 C 44 ) C 11 C 44 ,
ν = C 11 2 C 44 2 C 11 2 C 44 .

2.3. Electrical Impedance

The electrical impedance Z of a piezoelectric transducer can be measured or numerically computed based on the difference in the electrical potential φ diff = φ top φ bot between the electrical current flowing into the transducer,
Z e l e c Z = φ diff I .
In this work, the magnitude of the impedance spectrum | Z ( f ) | of a mechanically loaded piezoelectric transducer is measured for frequencies f in the range from 500 Hz to 5 MHz. This impedance spectrum enables determination of a polymer sample’s four unknown material parameters using UEIS. This technique is described in detail in [26] and will be briefly explained in Section 3.3.

3. Materials and Methods

3.1. Fabrication of Polymer Samples

The chips were manufactured by an injection molding machine, Allrounder 370A, from Arburg GmbH, Lossburg, Germany. The machine offers a maximum clamping force of 600 kN, a maximum injection pressure of 250 MPa, and a maximum injection speed of 300 mm/s. The parts were molded from PMMA LG IG 840. The machine benefits from a reciprocating screw with a diameter of 18 mm and a length-to-diameter ratio of 24.5. As illustrated in Figure 2, the part produced contains two separate but almost identical chips that are only different in thickness. For each set of settings in the DOE, we first molded 50 parts to allow the machine to stabilize, followed by molding an additional 20–30 parts. From this batch, a single specimen was then selected for the acoustic tests, ensuring a consistent and repeatable production process.
The dimensions on one of the molded parts are 78 mm × 28 mm × 1.5 mm, and the others are 78 mm × 28 mm × 1.9 mm. As shown in Figure 2, the selected gate for the design is a fan-gate. This gate type offers the best packing conditions and is commonly used when there are high demands for part flatness. After molding, the part has to be separated from the gate by machinery.
A DOE was developed to organize the production. Table 1 shows the values (levels) used for each of the two varying injection molding parameters (factors). The complete full-factorial design used to generate the list of process settings is available in Table A2 in Appendix B. Based on a previous study by Saeedabadi et al. [34], the optimal set of process parameters was established for PMMA LG IG 840. The optimized parameters were as follows:
  • Mold temperature = 65 ° C
  • Melt temperature = 210 ° C
  • Injection velocity = 60 mm/s
  • Packing pressure = 120 MPa
Since this study sought to extend the optimal process window to evaluate the effects of the changes in the IM process parameters on the acoustic characteristics of the material, three levels for the packing pressure and the injection velocity were introduced. With these additions, the expectation was to produce polymer parts with different stress levels and to compare them with the reference set of parameters.
For the first investigation and in order to study the effect of packing pressure variation on the acoustic parameters, the mold temperature was kept at 65  ° C, the melt temperature at 220  ° C, and the injection velocity at 20 mm/s, while three levels of 90, 105, and 120 MPa were used for the packing pressure. For the second batch, the focus was shifted to the injection velocity. Hence, the mold temperature was set at 65  ° C, the melt temperature at 220  ° C, and the packing pressure at 90 MPa, while three levels of 16, 20, and 40 mm/s were used for the injection velocity. It should be noted that in order to ensure stability during production and high replication fidelity, 50 parts were first molded as a test every time a process parameter was changed.

3.2. Residual Stress Analysis

As a crucial part of every polymer micro-manufacturing process, the injection molded parts undergo a post-production quality assessment using conventional microscopy methods. As indicated in the flowchart shown in Figure 1, the parts whose quality met the standard moved to the next stage to be used and further scrutinized. Since the study aimed to investigate the parts’ residual stress and acoustic characteristics, the investigation of the residual stress using polarization microscopy to inspect the parts’ surface was selected before the acoustic test stage. As such, nine samples, corresponding to our nine process settings in Table A2, were observed.
As explained in Section 3.3, one ring was cut from the center of each chip [26]. The position of the place where the disk was cut was kept the same for all the samples since the properties of an IM part could be affected differently depending on the distance from the gate [35]. Though the rings were the parts tested for acoustic characterization, the polarization imaging examined the entire chip before and after ring extraction.
Residual stress is the inherent tension remaining in a molded part after ejection in the absence of external loads. This stress can be primarily attributed to two sources: flow-induced and thermally induced residual stresses [36]. To visualize these stresses within the polymer samples, a Dino-Lite Edge AM7515MZT Microscope was employed, complemented by a Dino-Lite BL-ZW1 backlight. In Figure 3, black lines, indicative of residual stress within the polymer, were observed, representing the induced residual stresses. Upon careful analysis of the rings from each sample, locations exhibiting heightened residual stress were identified, high-stress regions around the circumference of the cut rings were delineated, and stress surrounding the observable polymer artifacts on the surface was noted. From these preliminary observations, defective parts were effectively excluded from the acoustic tests, and the foundation for a rigorous comparative analysis in Section 4 was established.

3.3. Ultrasound Electrical Impedance Spectroscopy

In order to obtain the four unknown coefficients C 11 , C 11 , C 44 , and C 44 in the ultrasonic frequency range up to 5 MHz, the UEIS technique can be utilized. This technique is presented and explained in detail in ref. [26]. Compared to conventional approaches for obtaining the elastic moduli of polymer samples, the UEIS technique enables simple and low-cost determination of the elastic moduli in the frequency range relevant to many ultrasonic applications. The technique relies on measuring the electrical impedance spectrum of an unloaded piezoelectric transducer and a second measurement of the same transducer loaded with a polymer ring. In this work, the electrical impedance spectra were measured using a Vector Network Analyzer Bode 100 (OMICRON Electronics GmbH, Klaus, Austria). Afterwards, an inverse fitting procedure using the finite-element software COMSOL Multiphysics and an optimization algorithm, using a gradient-free direct search implemented in MATLAB [26], was used to obtain the elastic moduli of the ring.
In our experiments, disk-shaped piezoelectric Pz27 transducers (Meggitt A/S, Kvistgaard, Denmark) made from lead zirconate titanate (PZT) were used, Figure 4. Rings were cut out from an injection-molded polymer sample and glued to the Pz27 transducer via the UV-curable adhesive NOA 86H (Norland Products, Jamesburg, NJ, USA). All the dimensions of the transducer and the polymer-glue-transducer stack were measured before and after assembly of the stack. The measured dimensions are listed in Table A1 in Appendix A.

3.4. Moldex3dTM Simulations

The simulations were conducted with the Moldex3DTM Studio 2021, using PMMA (LG IG 840). A global mesh size of 3 mm was set, forming a total of 30.000 elements for the entire part. The aim was to replicate the same conditions as those of the production, and hence, the same process settings (Table A2) and the same IM machine model were selected. As shear stress is a reasonable indicator of the parts’ residual stress and can be investigated by comparing to tensile measurement images [37], the average was extracted for all nine simulations (Table A2). The results of the simulations, an example of which is illustrated in Figure 5, were only used to verify the residual stress analysis performed on the parts and to provide insight into the differences in the parts throughout the sets of process parameters employed.

4. Results and Discussion

Before considering the characterization of the acoustic parameters through UEIS and examining the influence of the various IM process parameters, as outlined in the flowchart shown in 
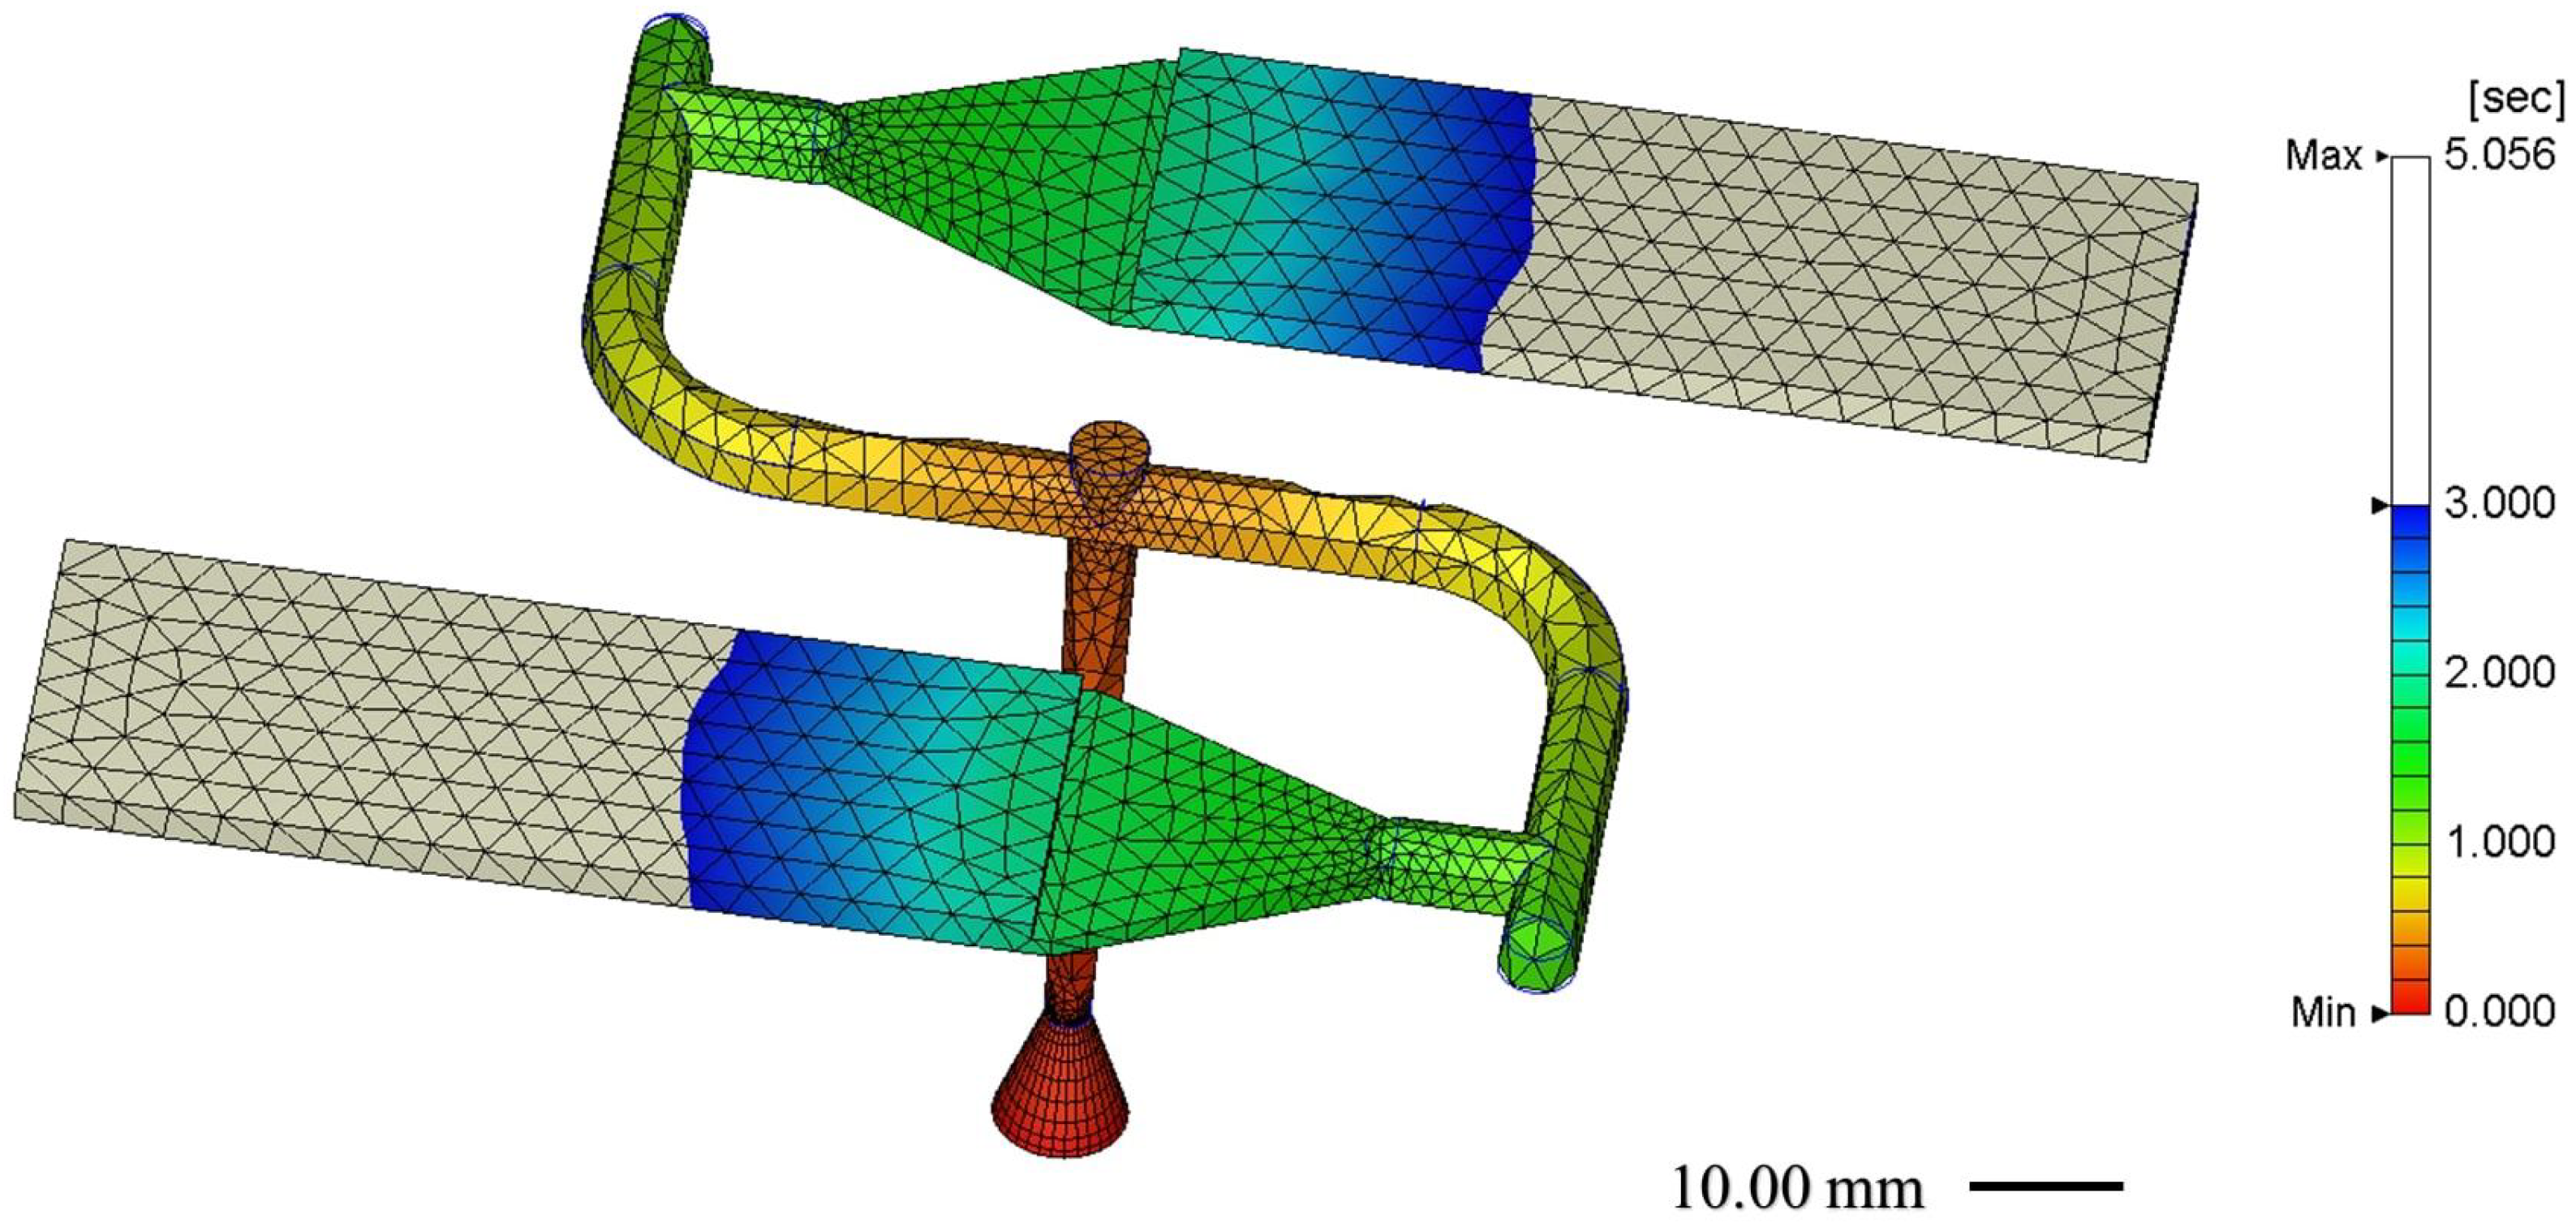
Figure 1, the parts underwent a thorough analysis using IM simulations and polarized imaging. The virtual DOE helped simulate the same molded process parameters applying in the production. The response of the simulations was stress. Then, using the polarized images of the parts and the sheer stress data acquired from the simulations, a pair of simulations and molded parts were formed, which helped to compare the residual stress and to verify the consistency of the results between the simulations and the experiments.
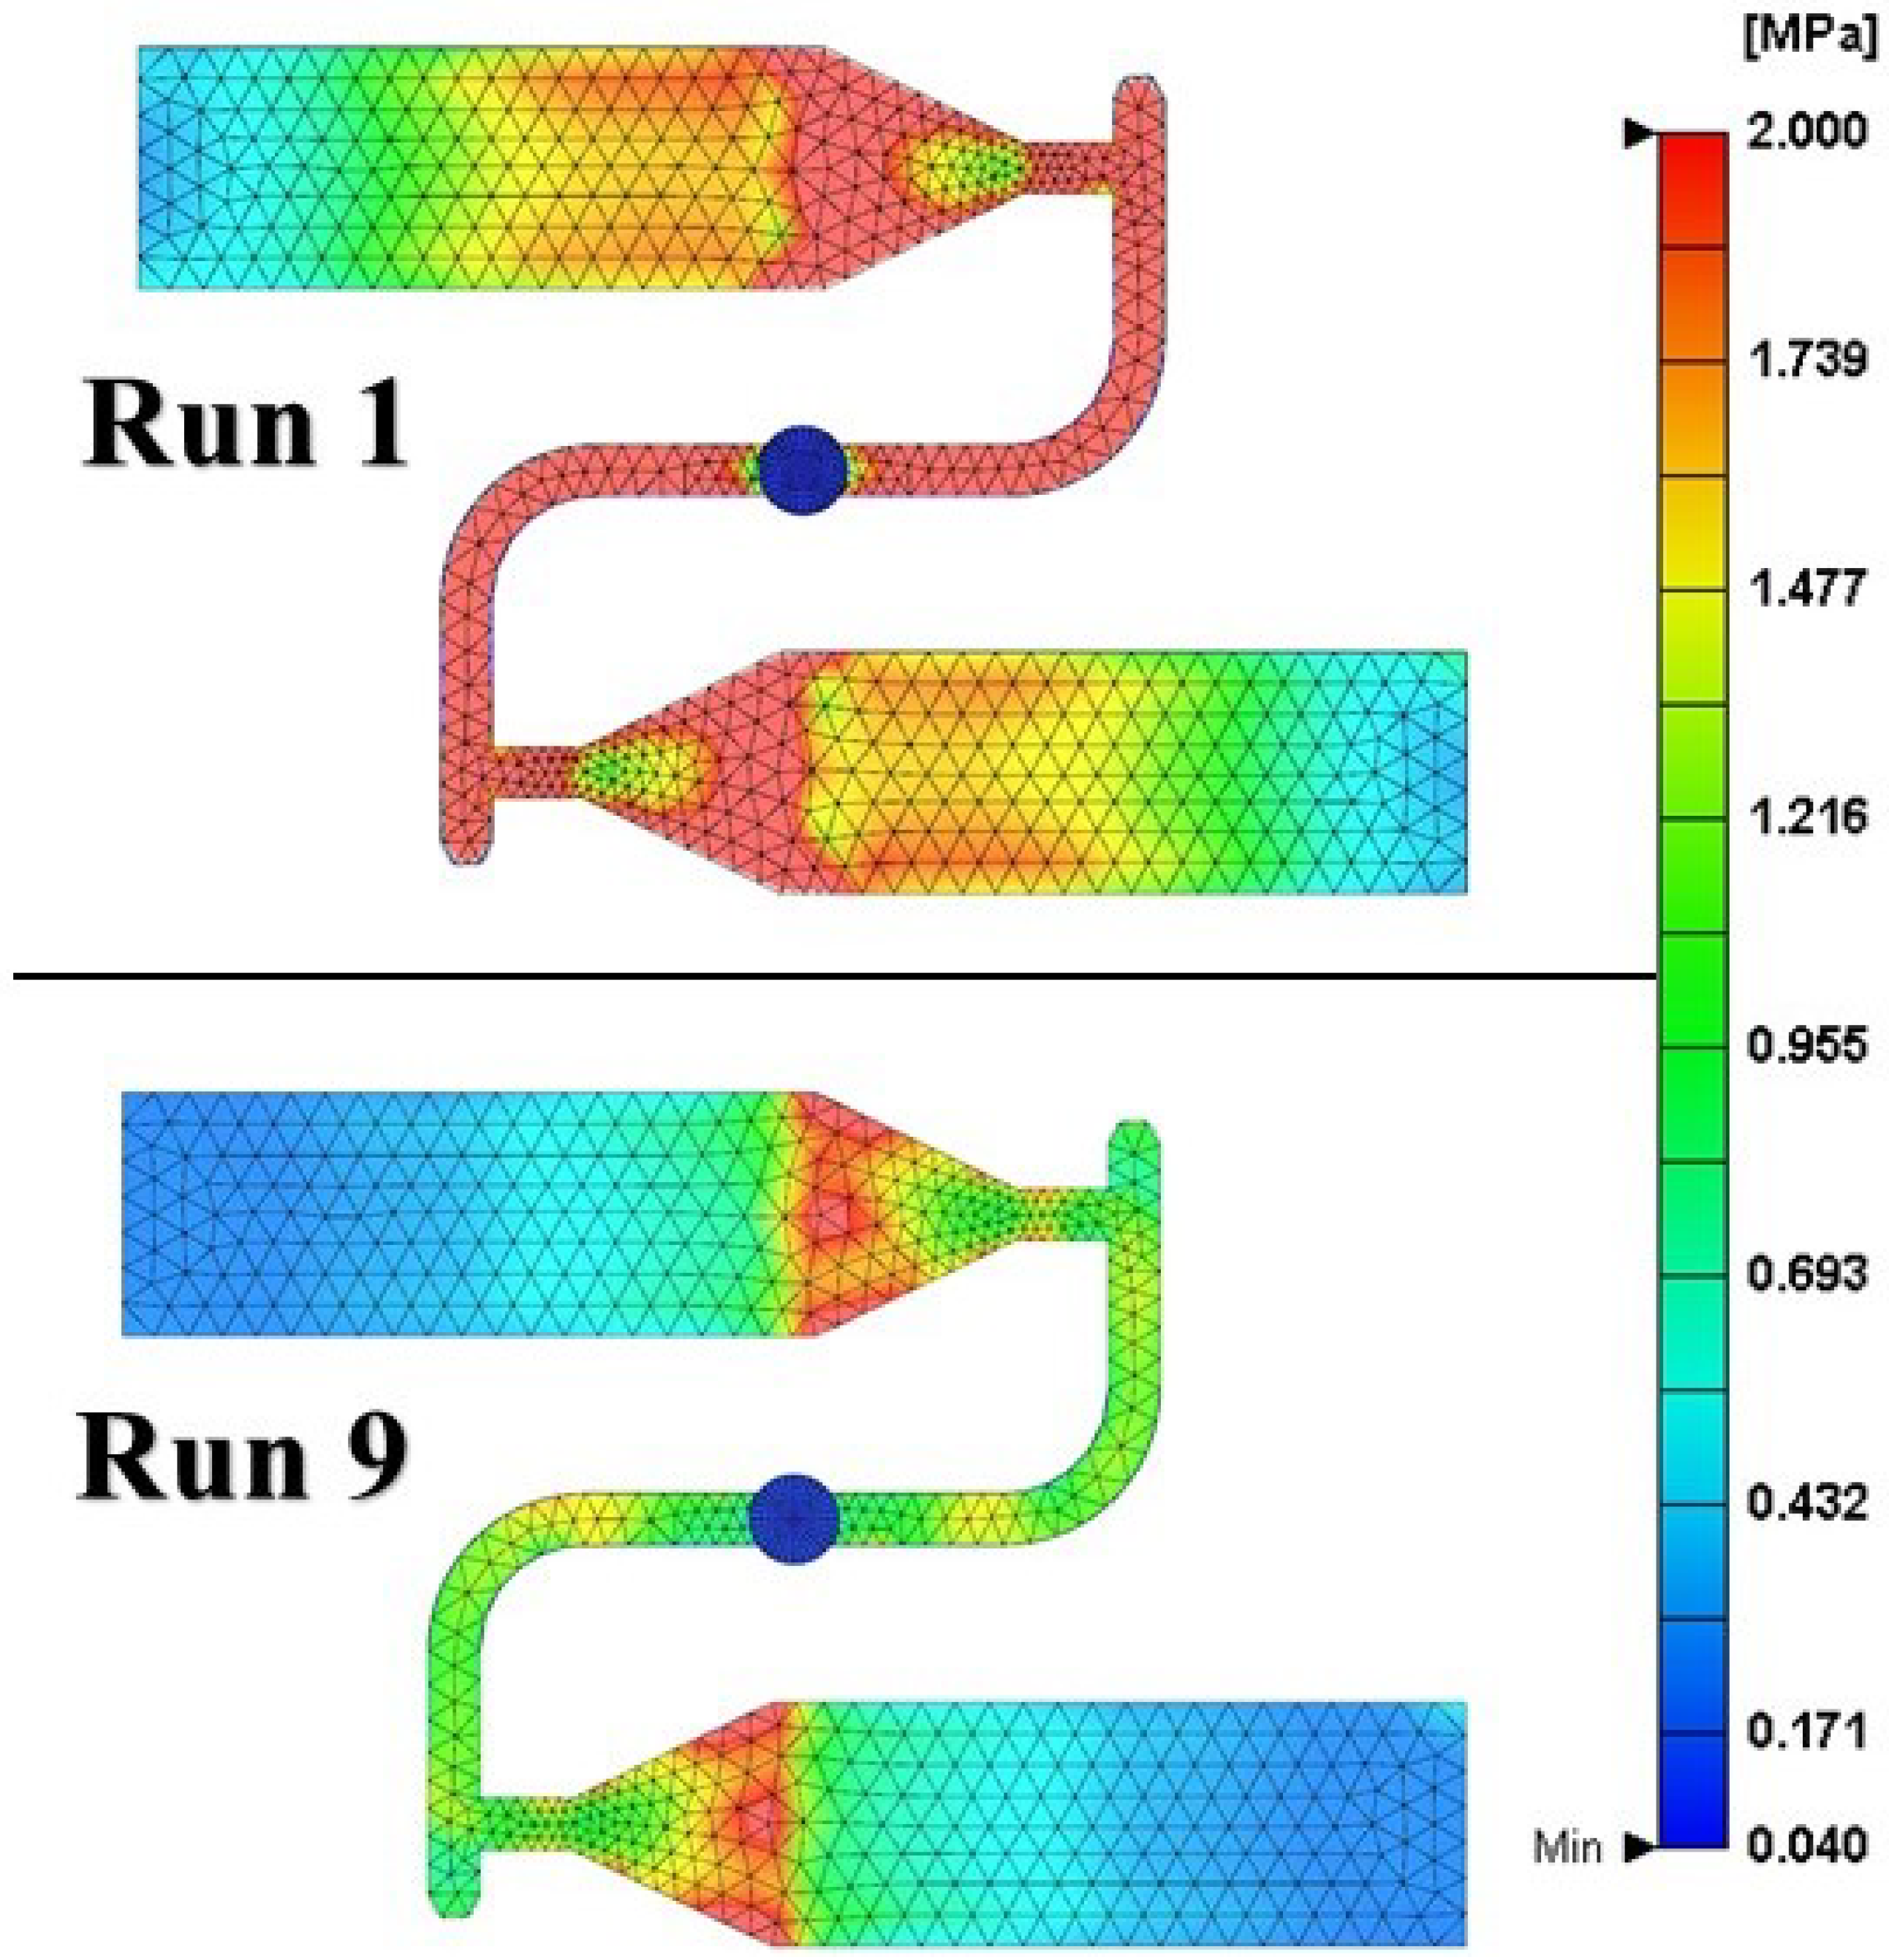
Figure 6, in particular, captures the difference between the highest recorded shear stress during the filling stage in the simulations using a DOE. As presented in Table A2, the DOE employed a full-factorial design incorporating two critical factors that play a pivotal role in determining the shear stress during molding: the packing pressure and the injection velocity.
From Table A2, it is clear that as the injection velocity increased from 16 mm / s to 40 mm / s 
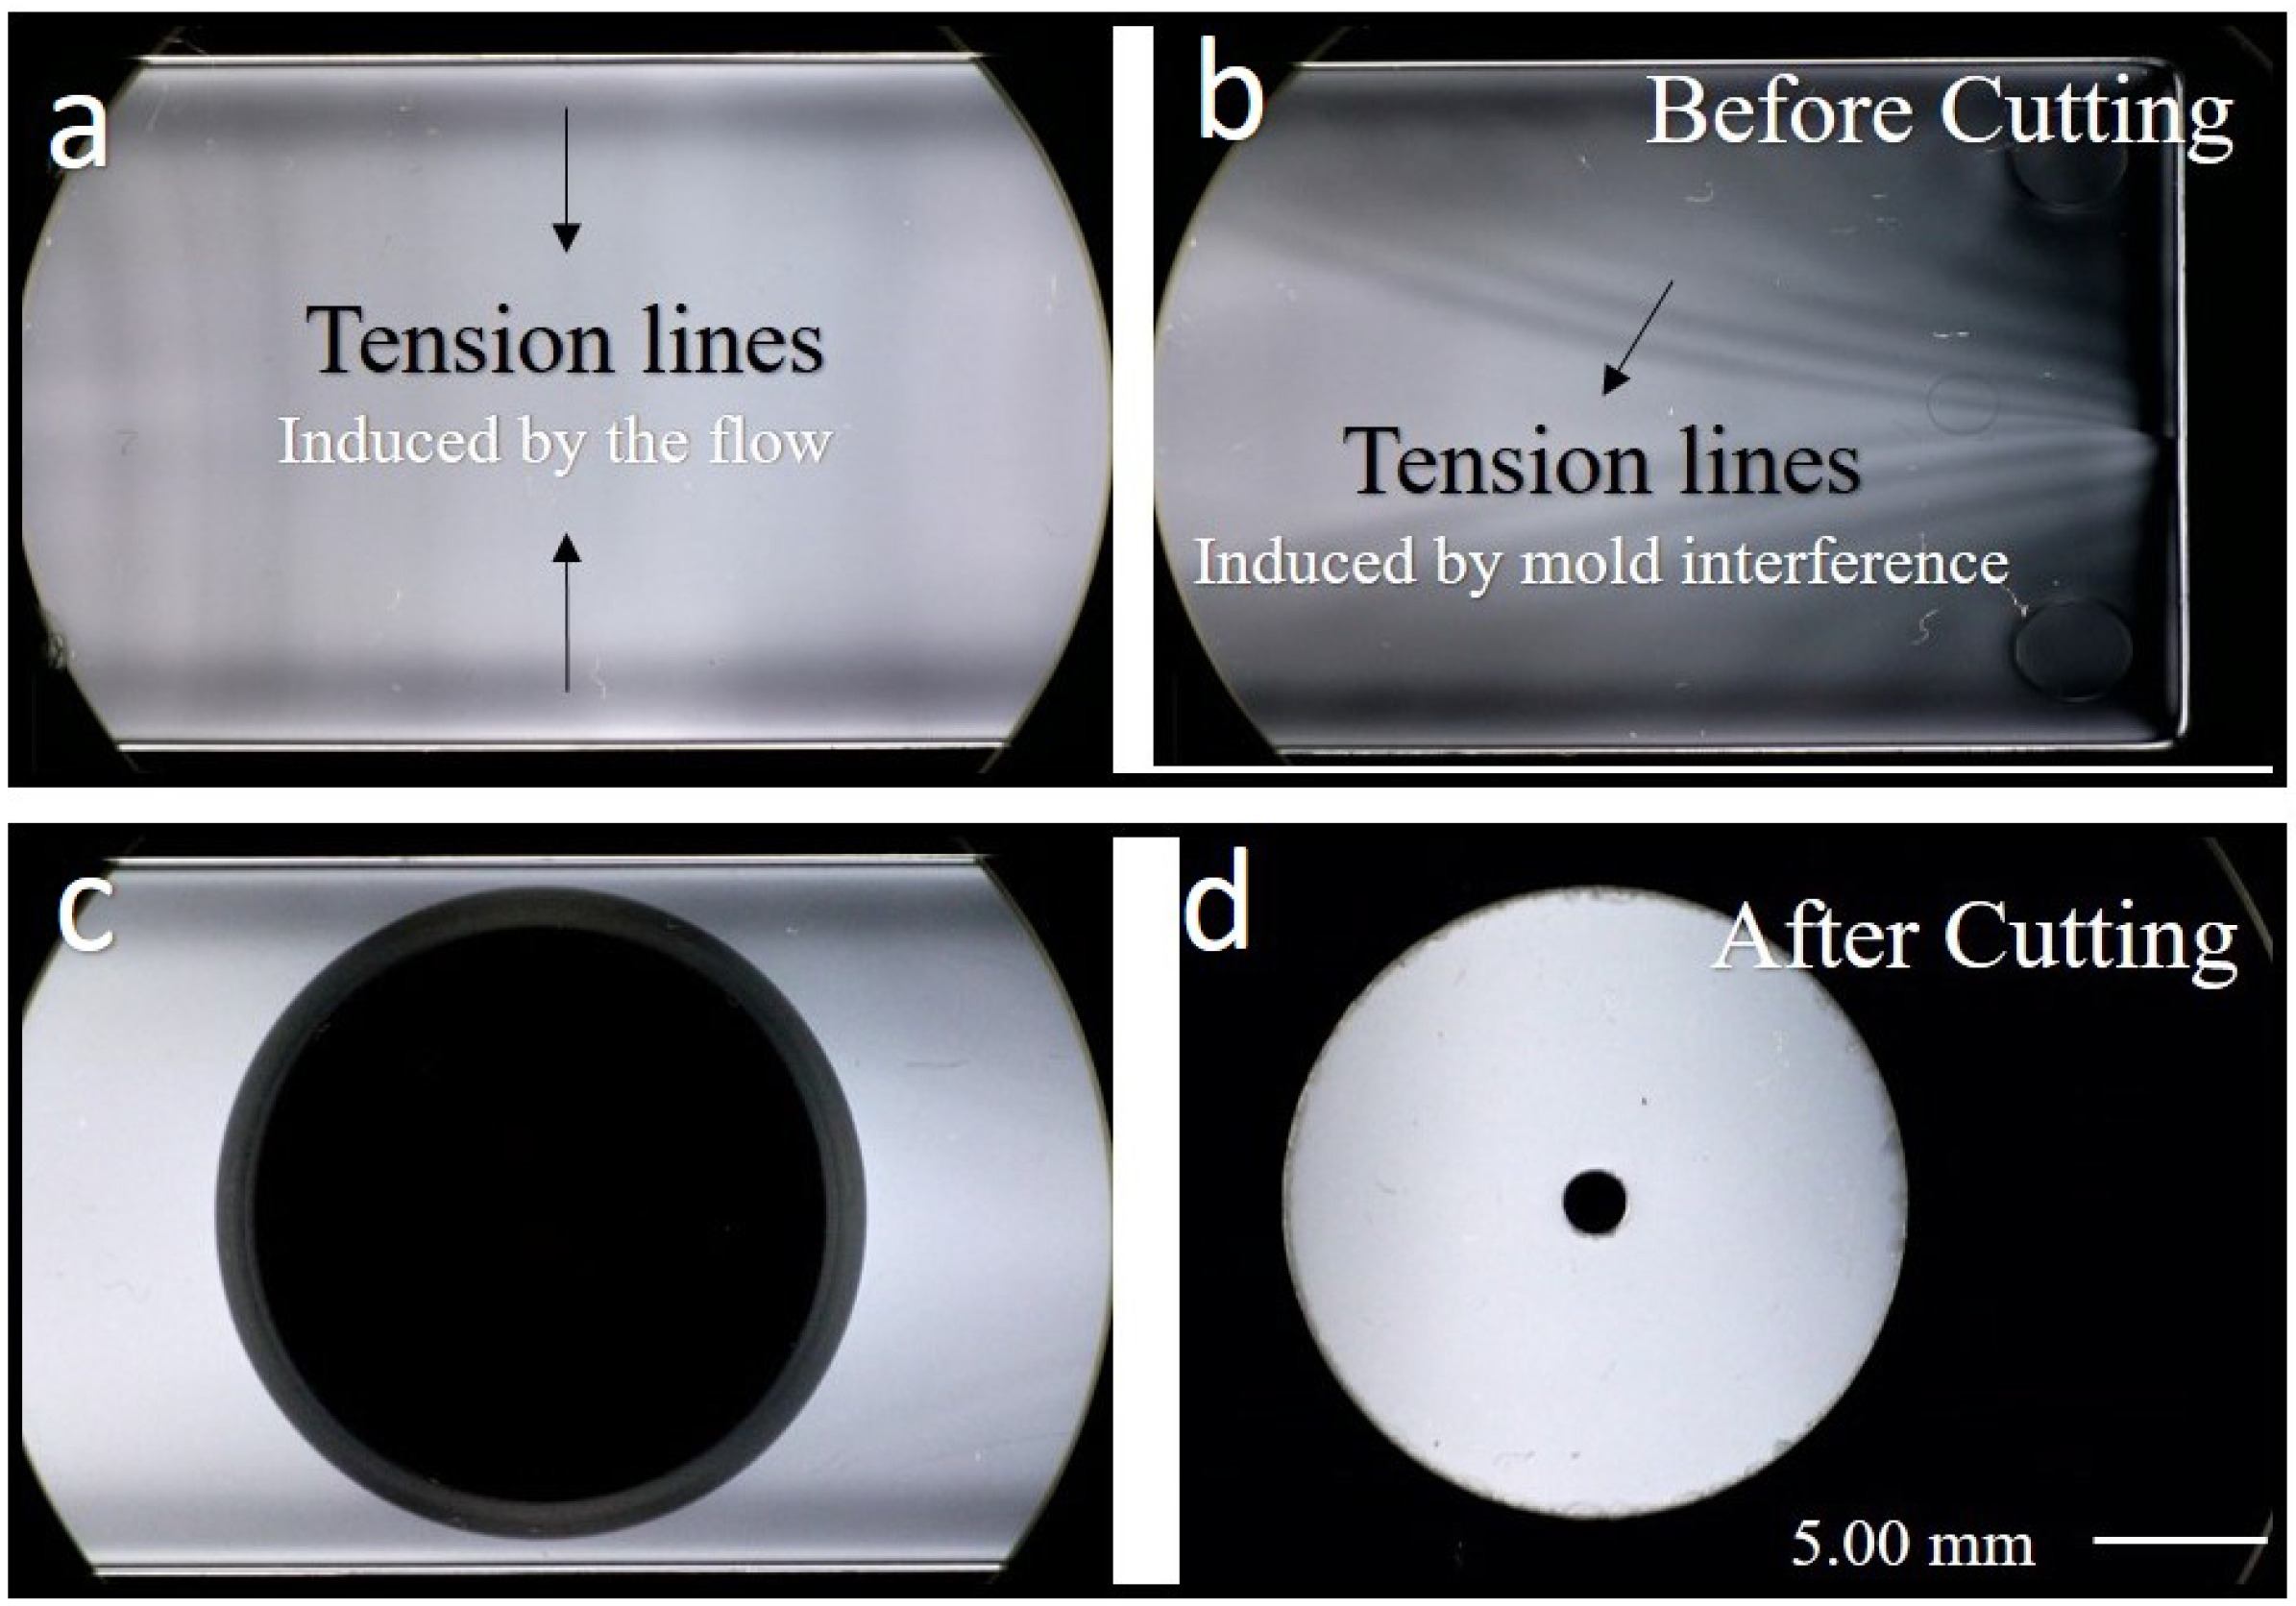
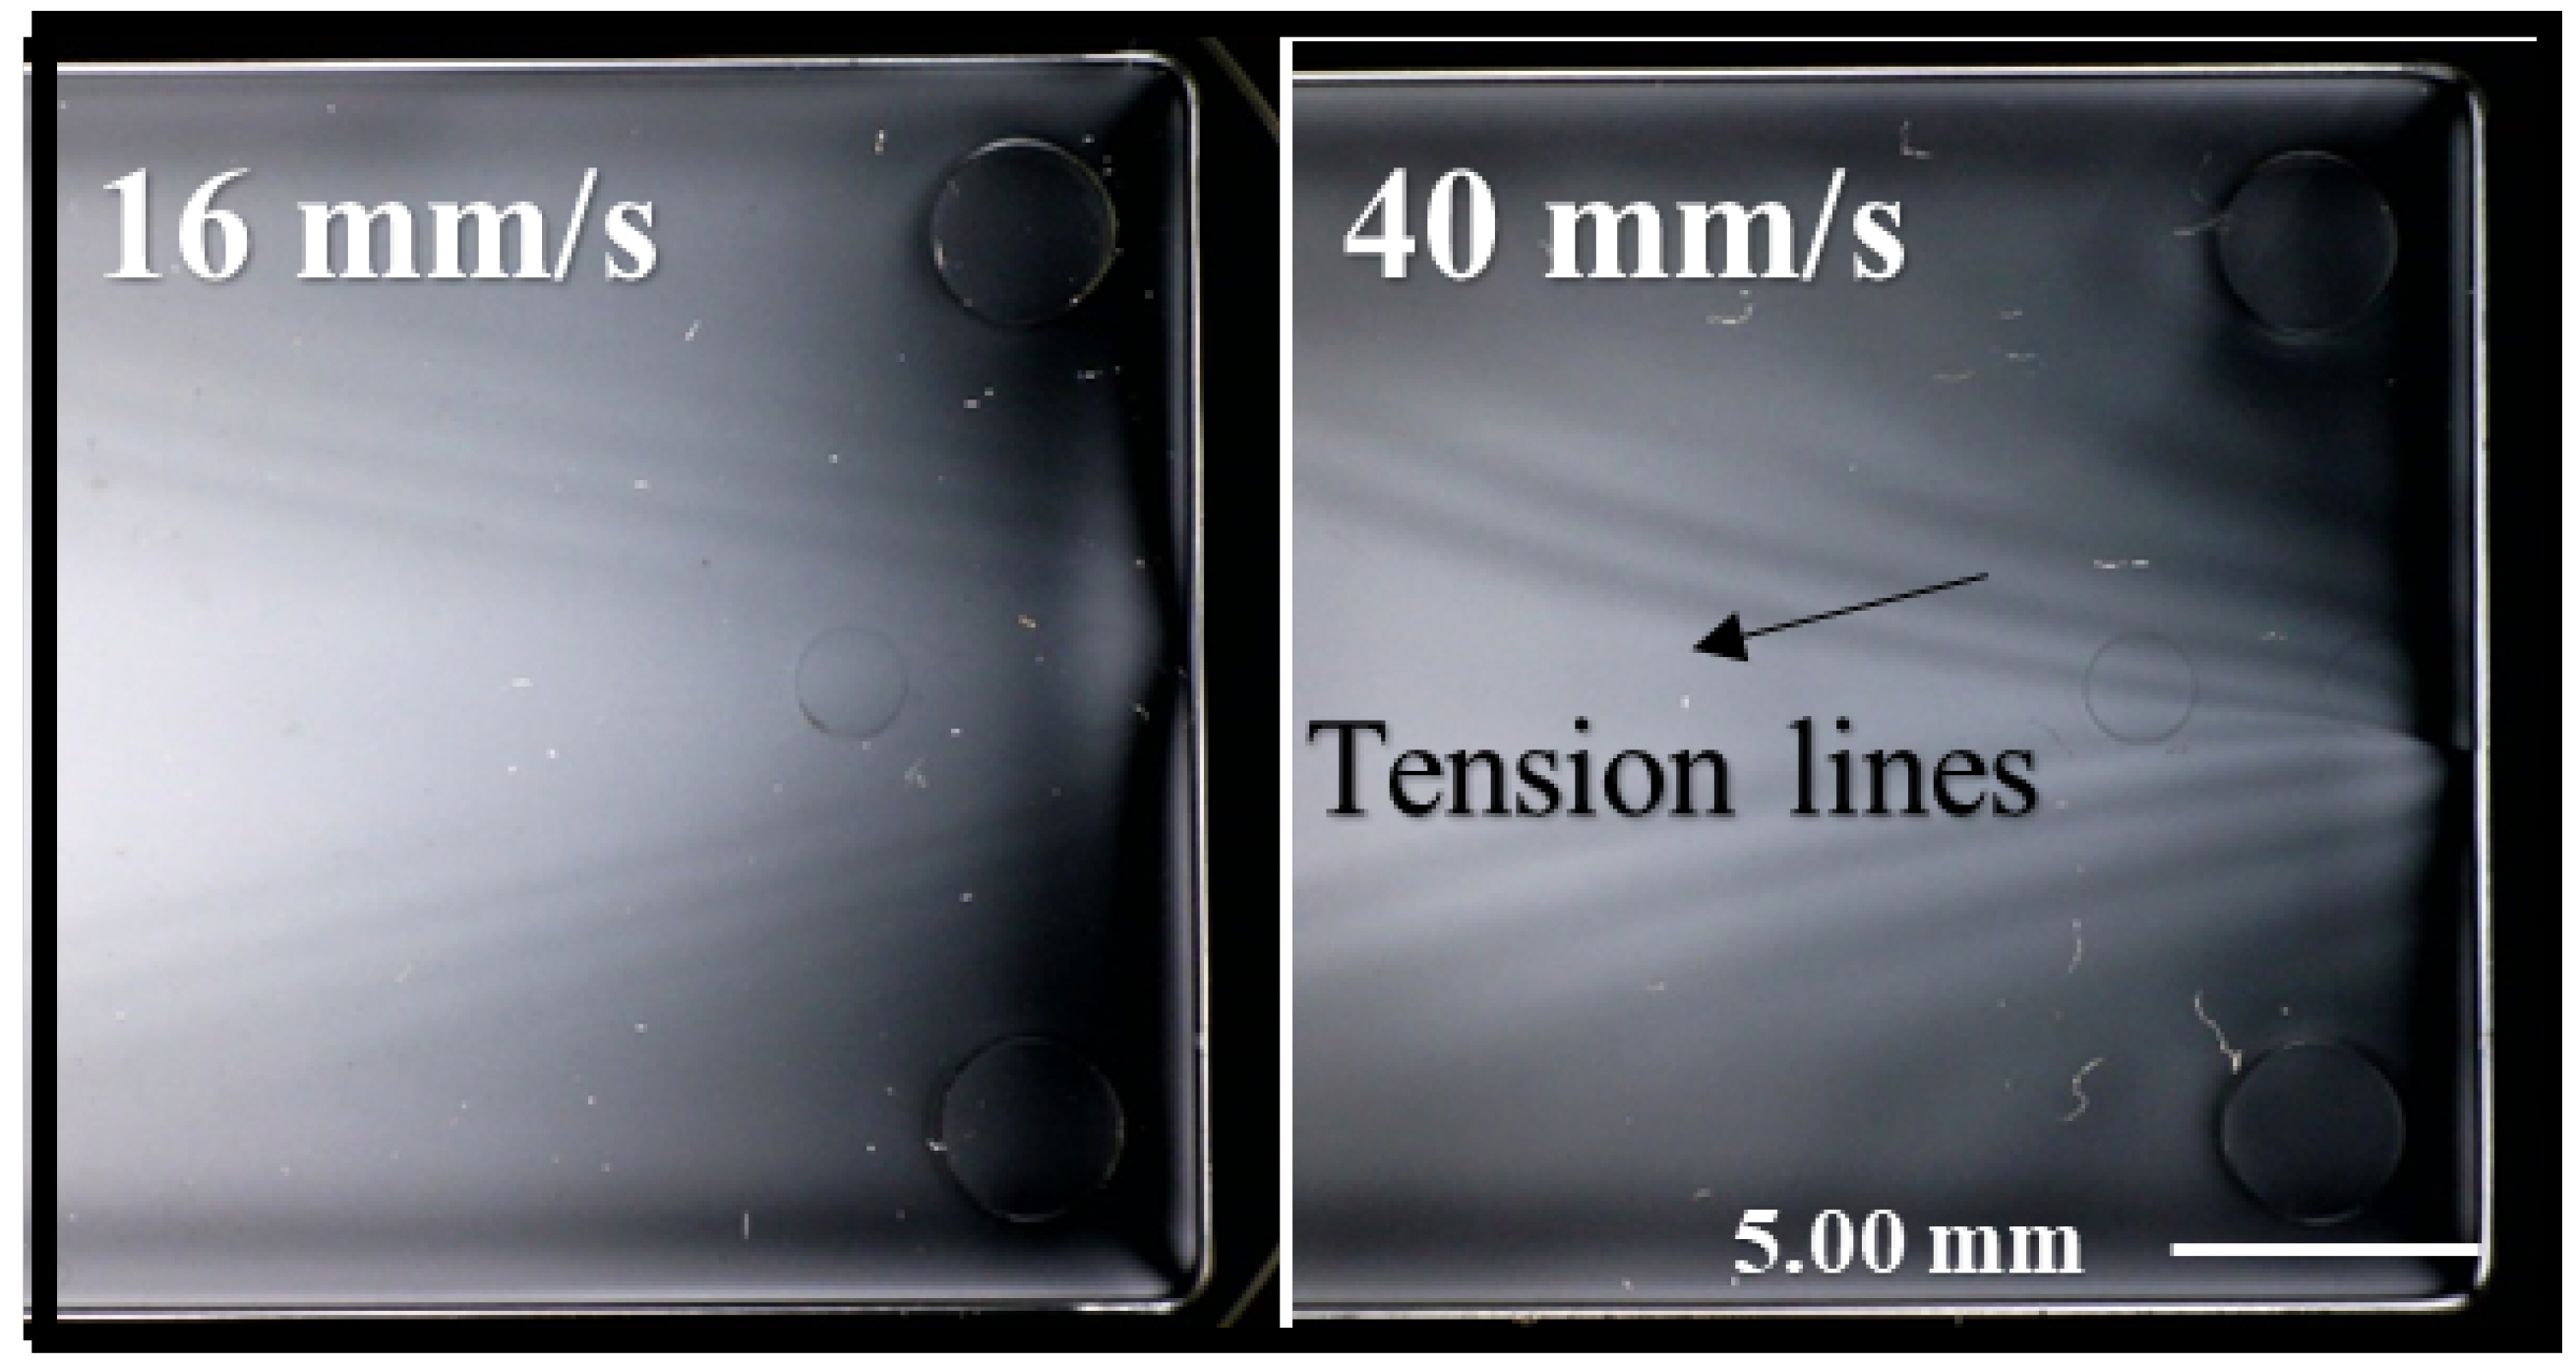
, there was a significant decrease in the average shear stress during the filling stage. This reduction in the shear stress due to higher injection velocities aligns well with the observations from Figure 7, which shows contrasts in the residual stress lines of the two molded samples. These samples only differed in their injection velocities, 16 mm / s and 40 mm / s , further supporting the findings presented in Figure 6.
Moreover, the points validated by the figures can be further expanded based on the DOE results:
  • The injection velocity has a pronounced impact on the shear stress of the parts, with higher velocities generally leading to reduced shear stresses during filling.
  • The central region of the part from which the rings were cut remains relatively unaffected by drastic changes in the residual stress, regardless of the varied injection velocities or other process parameters.
  • The consistency in the shear stresses across identical settings in different runs (like Run 1, Run 4, and Run 7) reinforces the reliability of our simulations and the process repeatability.
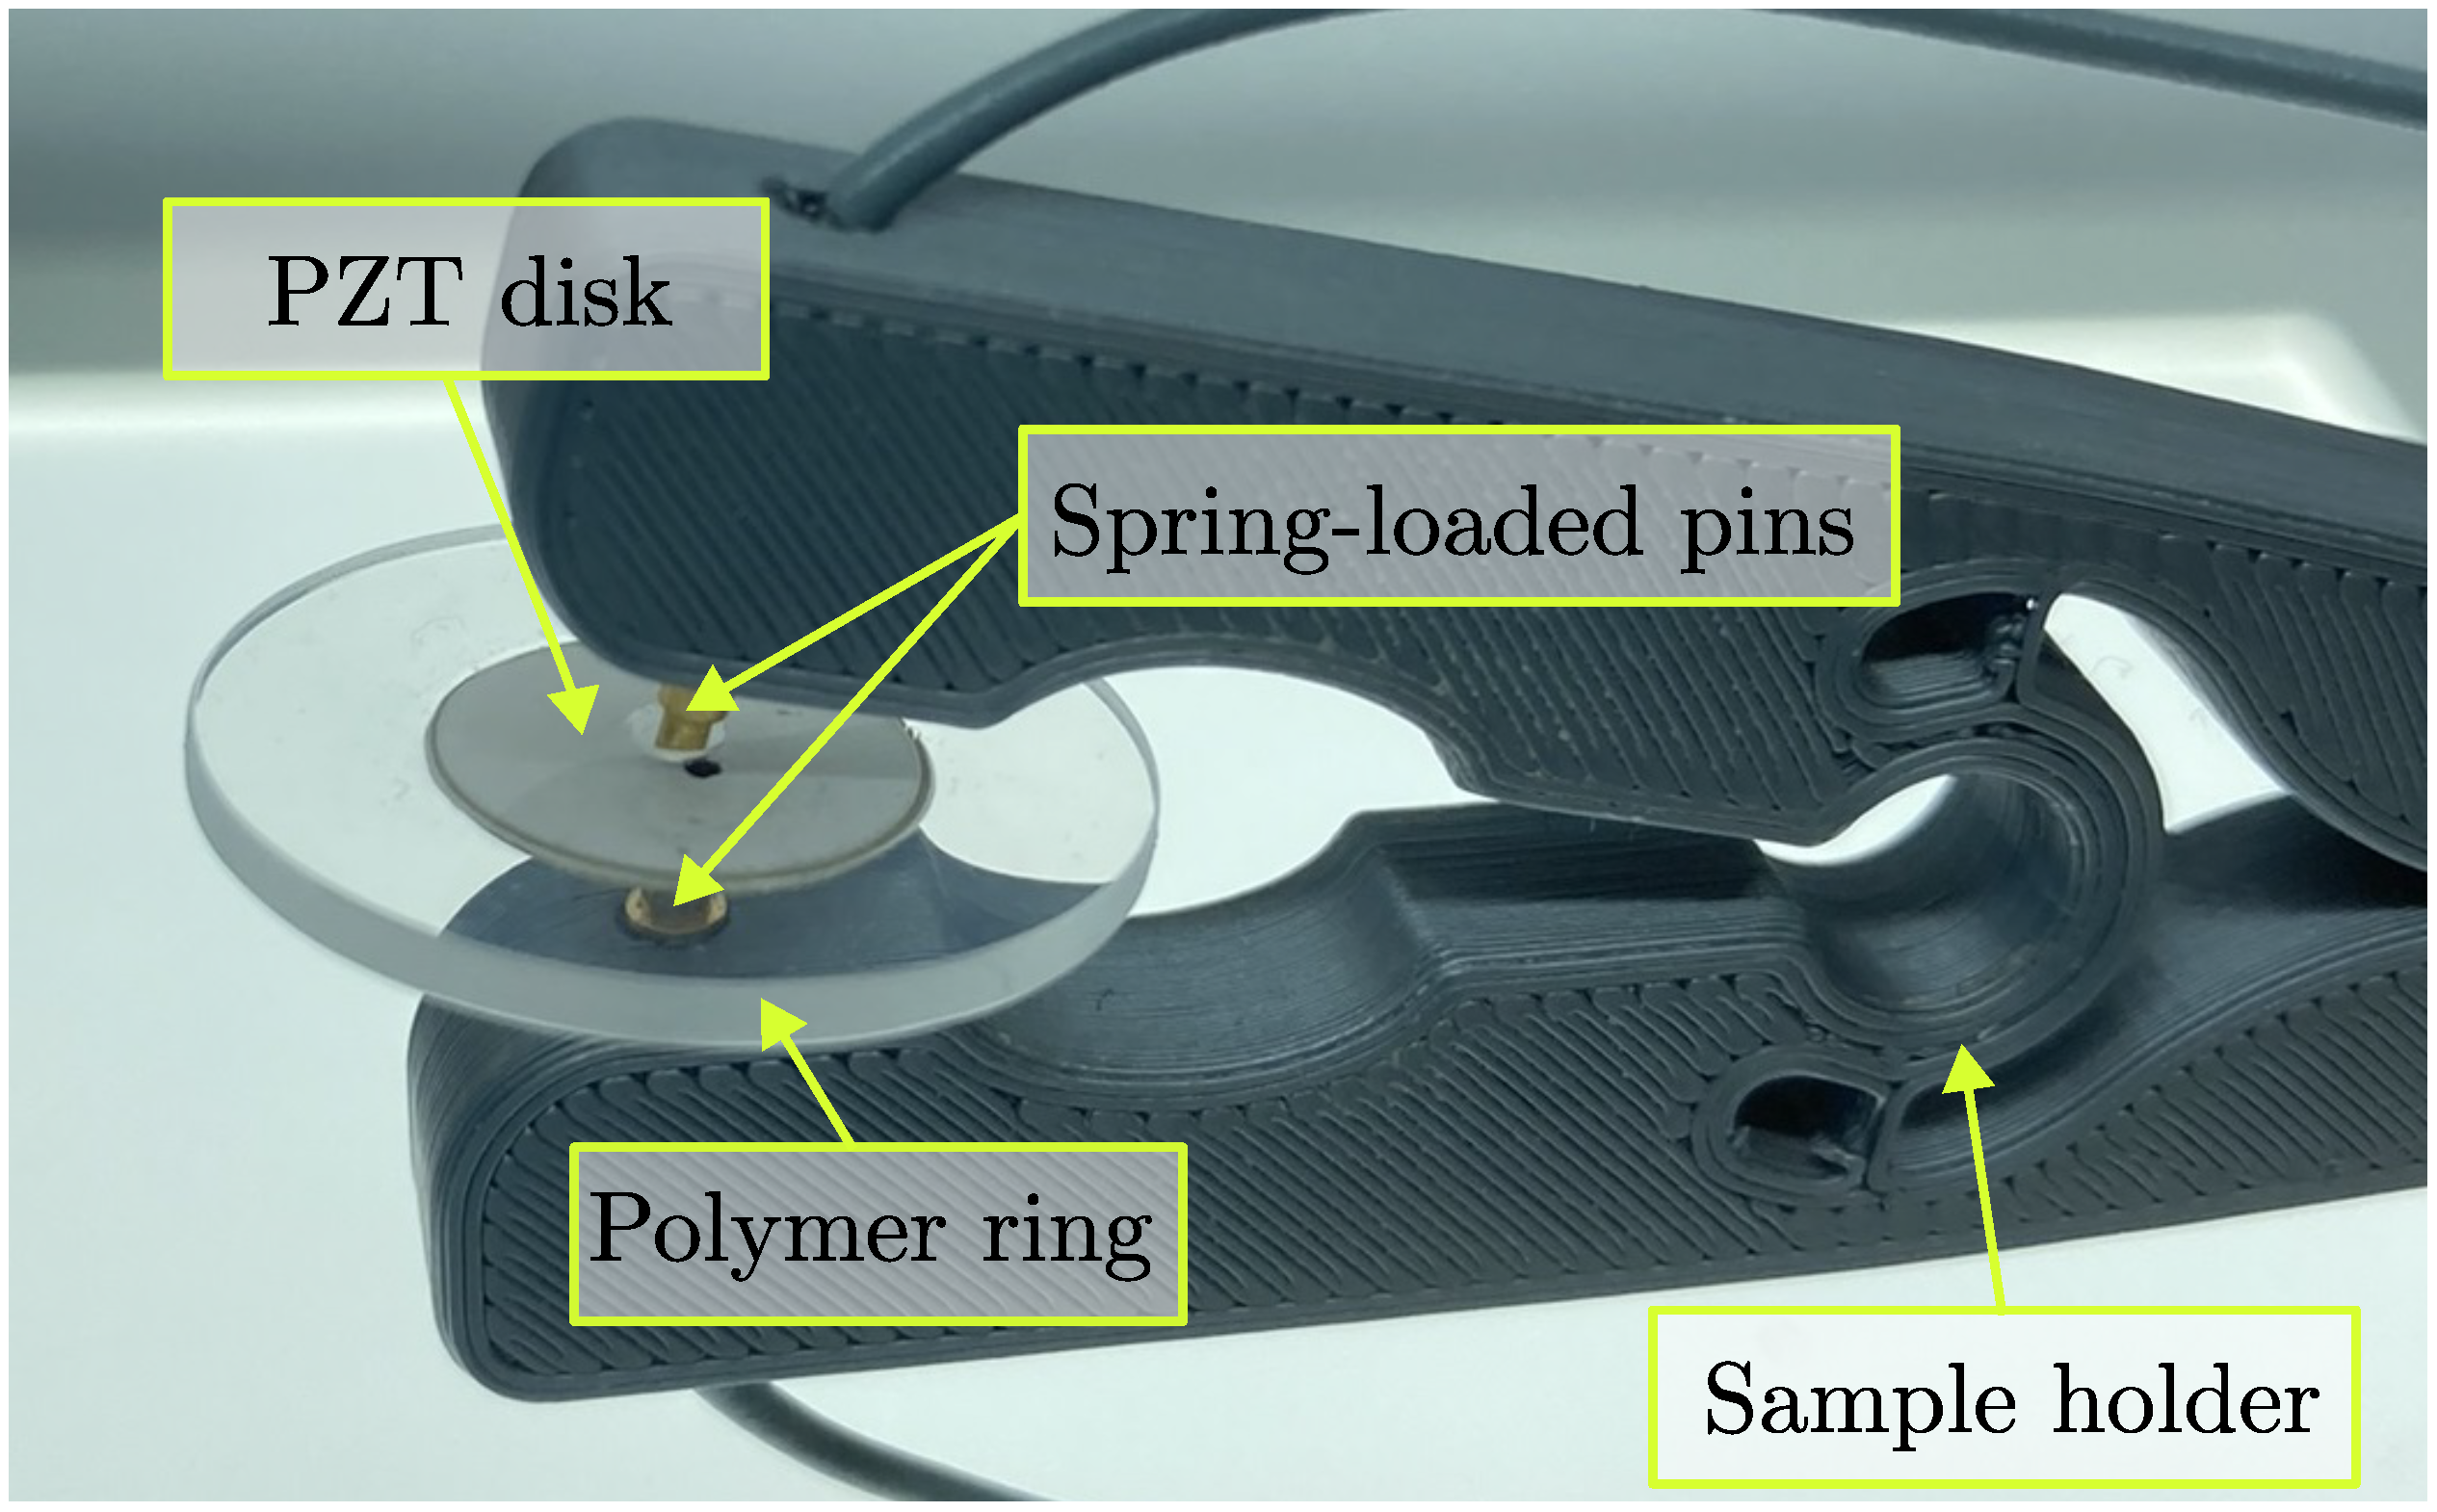
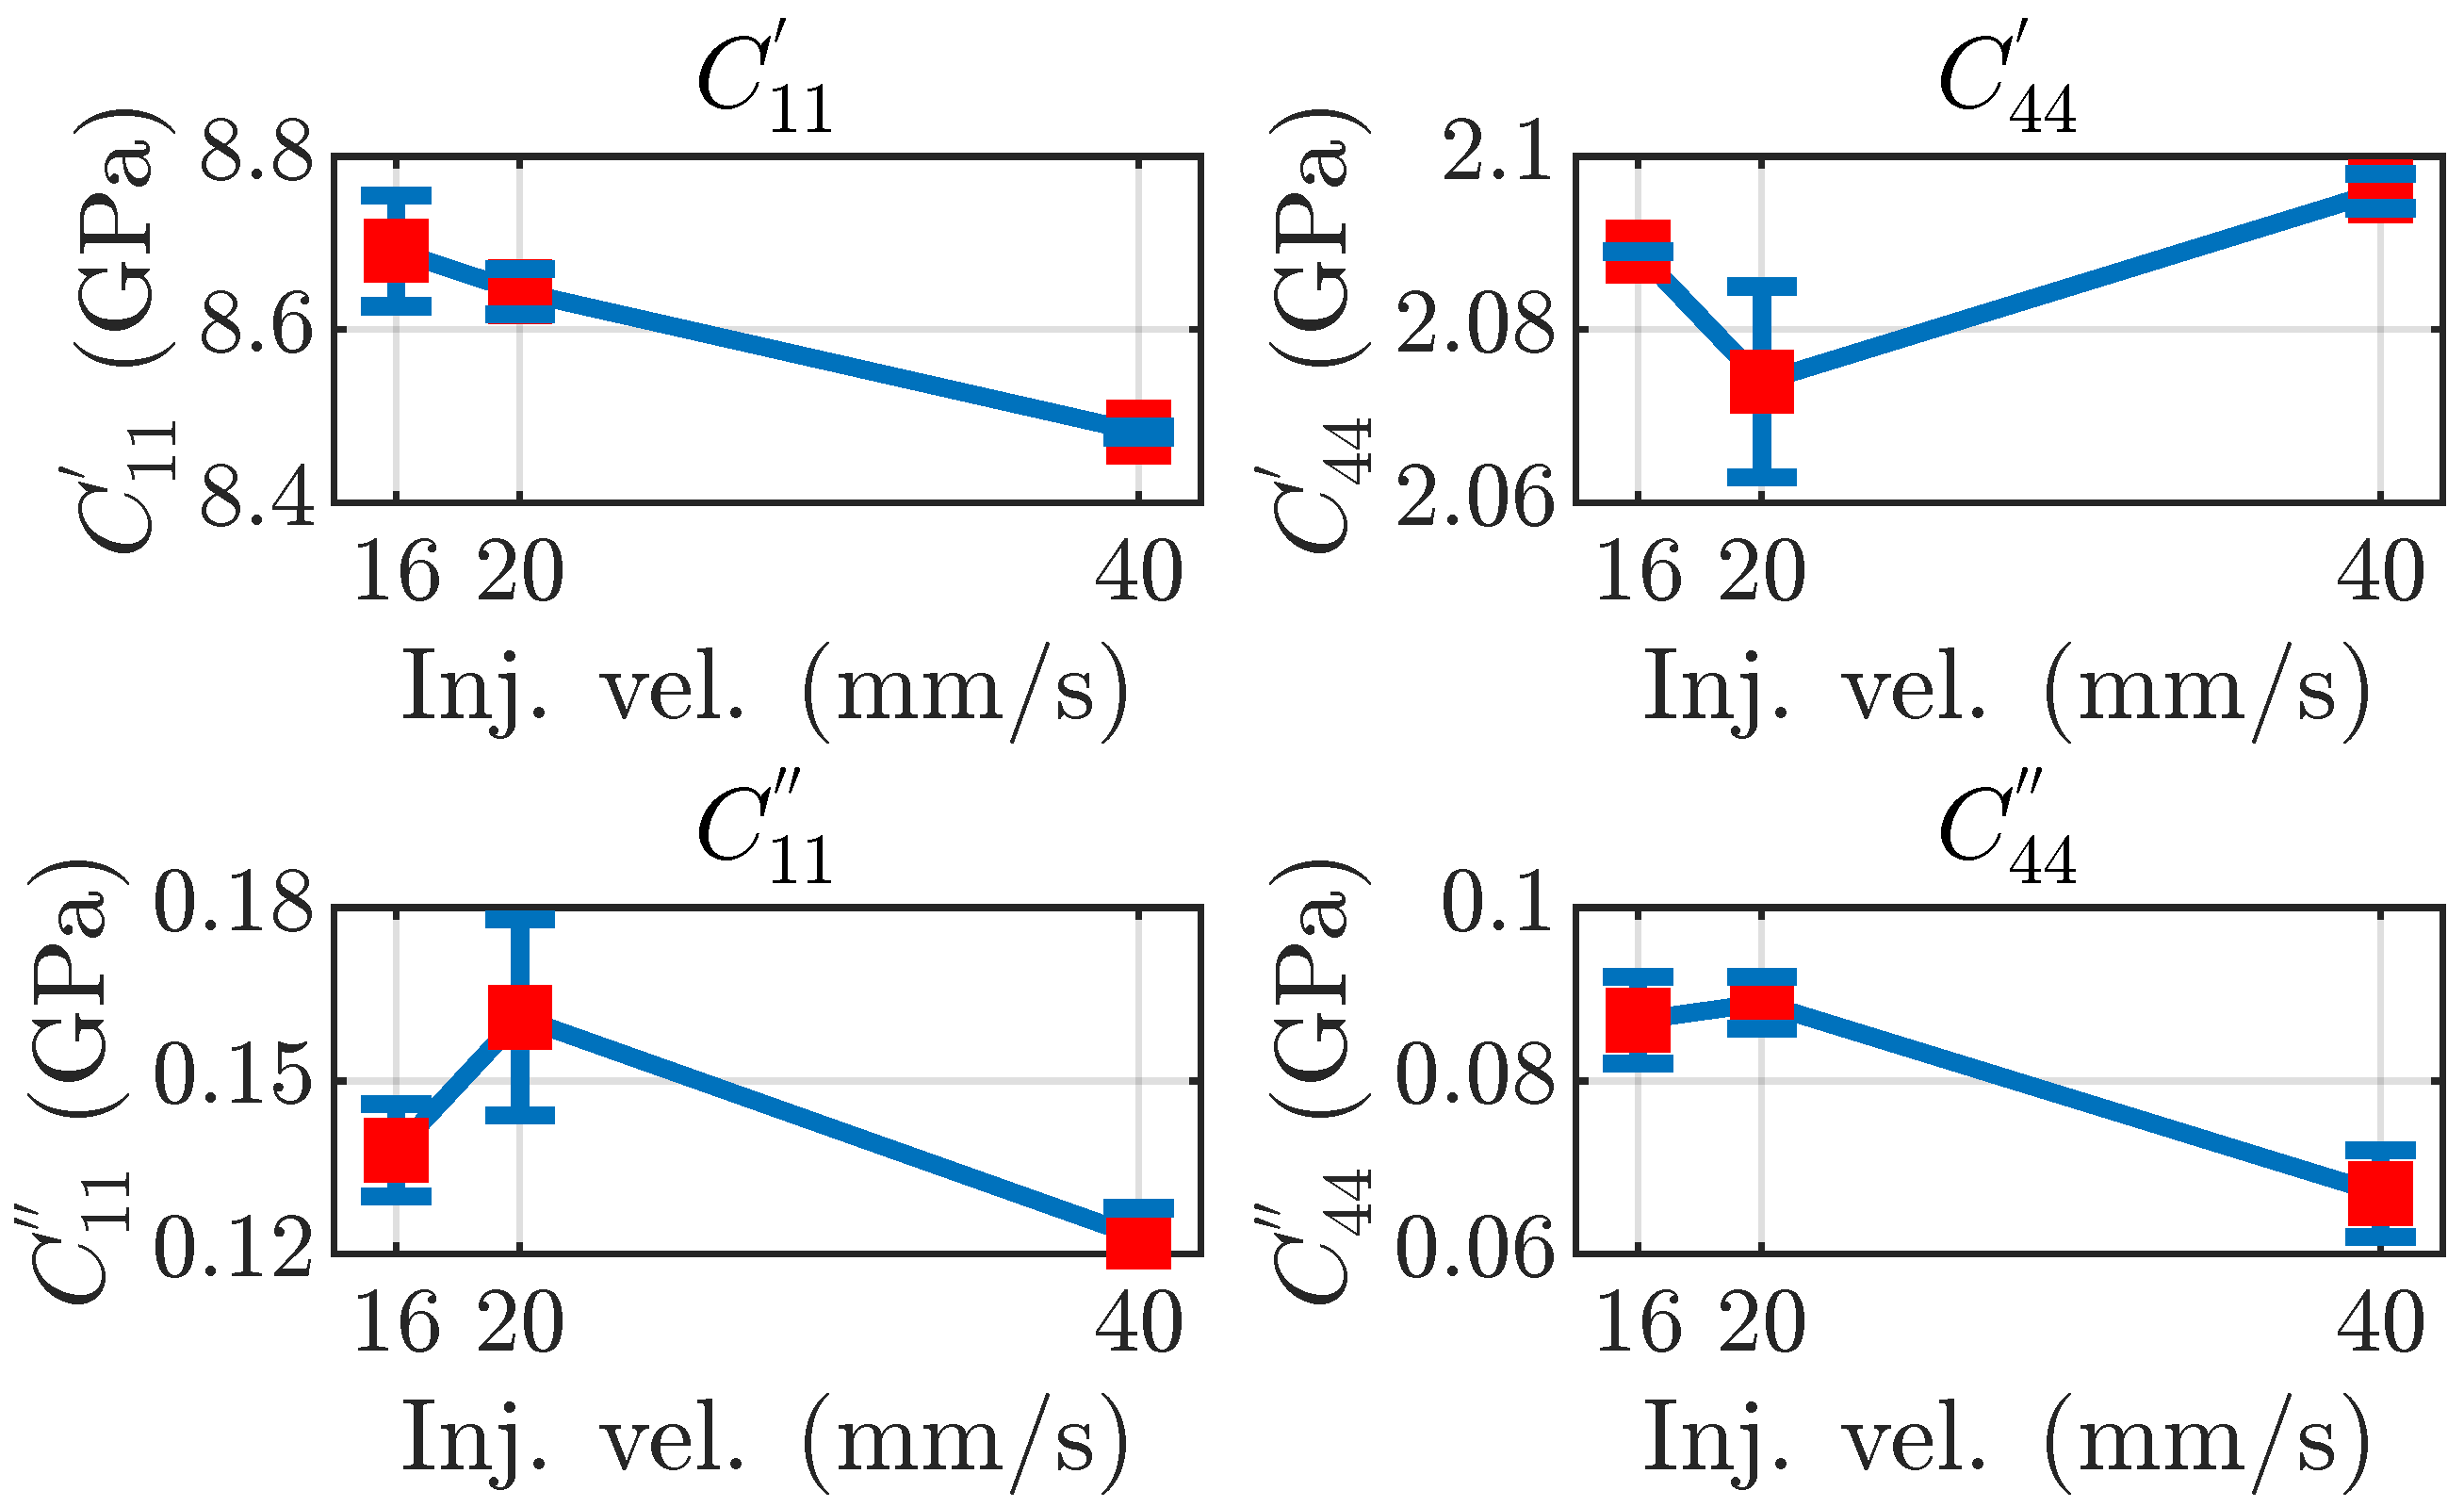
Moving on to the UEIS tests, the four elastic moduli C i k of the nine samples molded with the settings at Table A2 were measured.
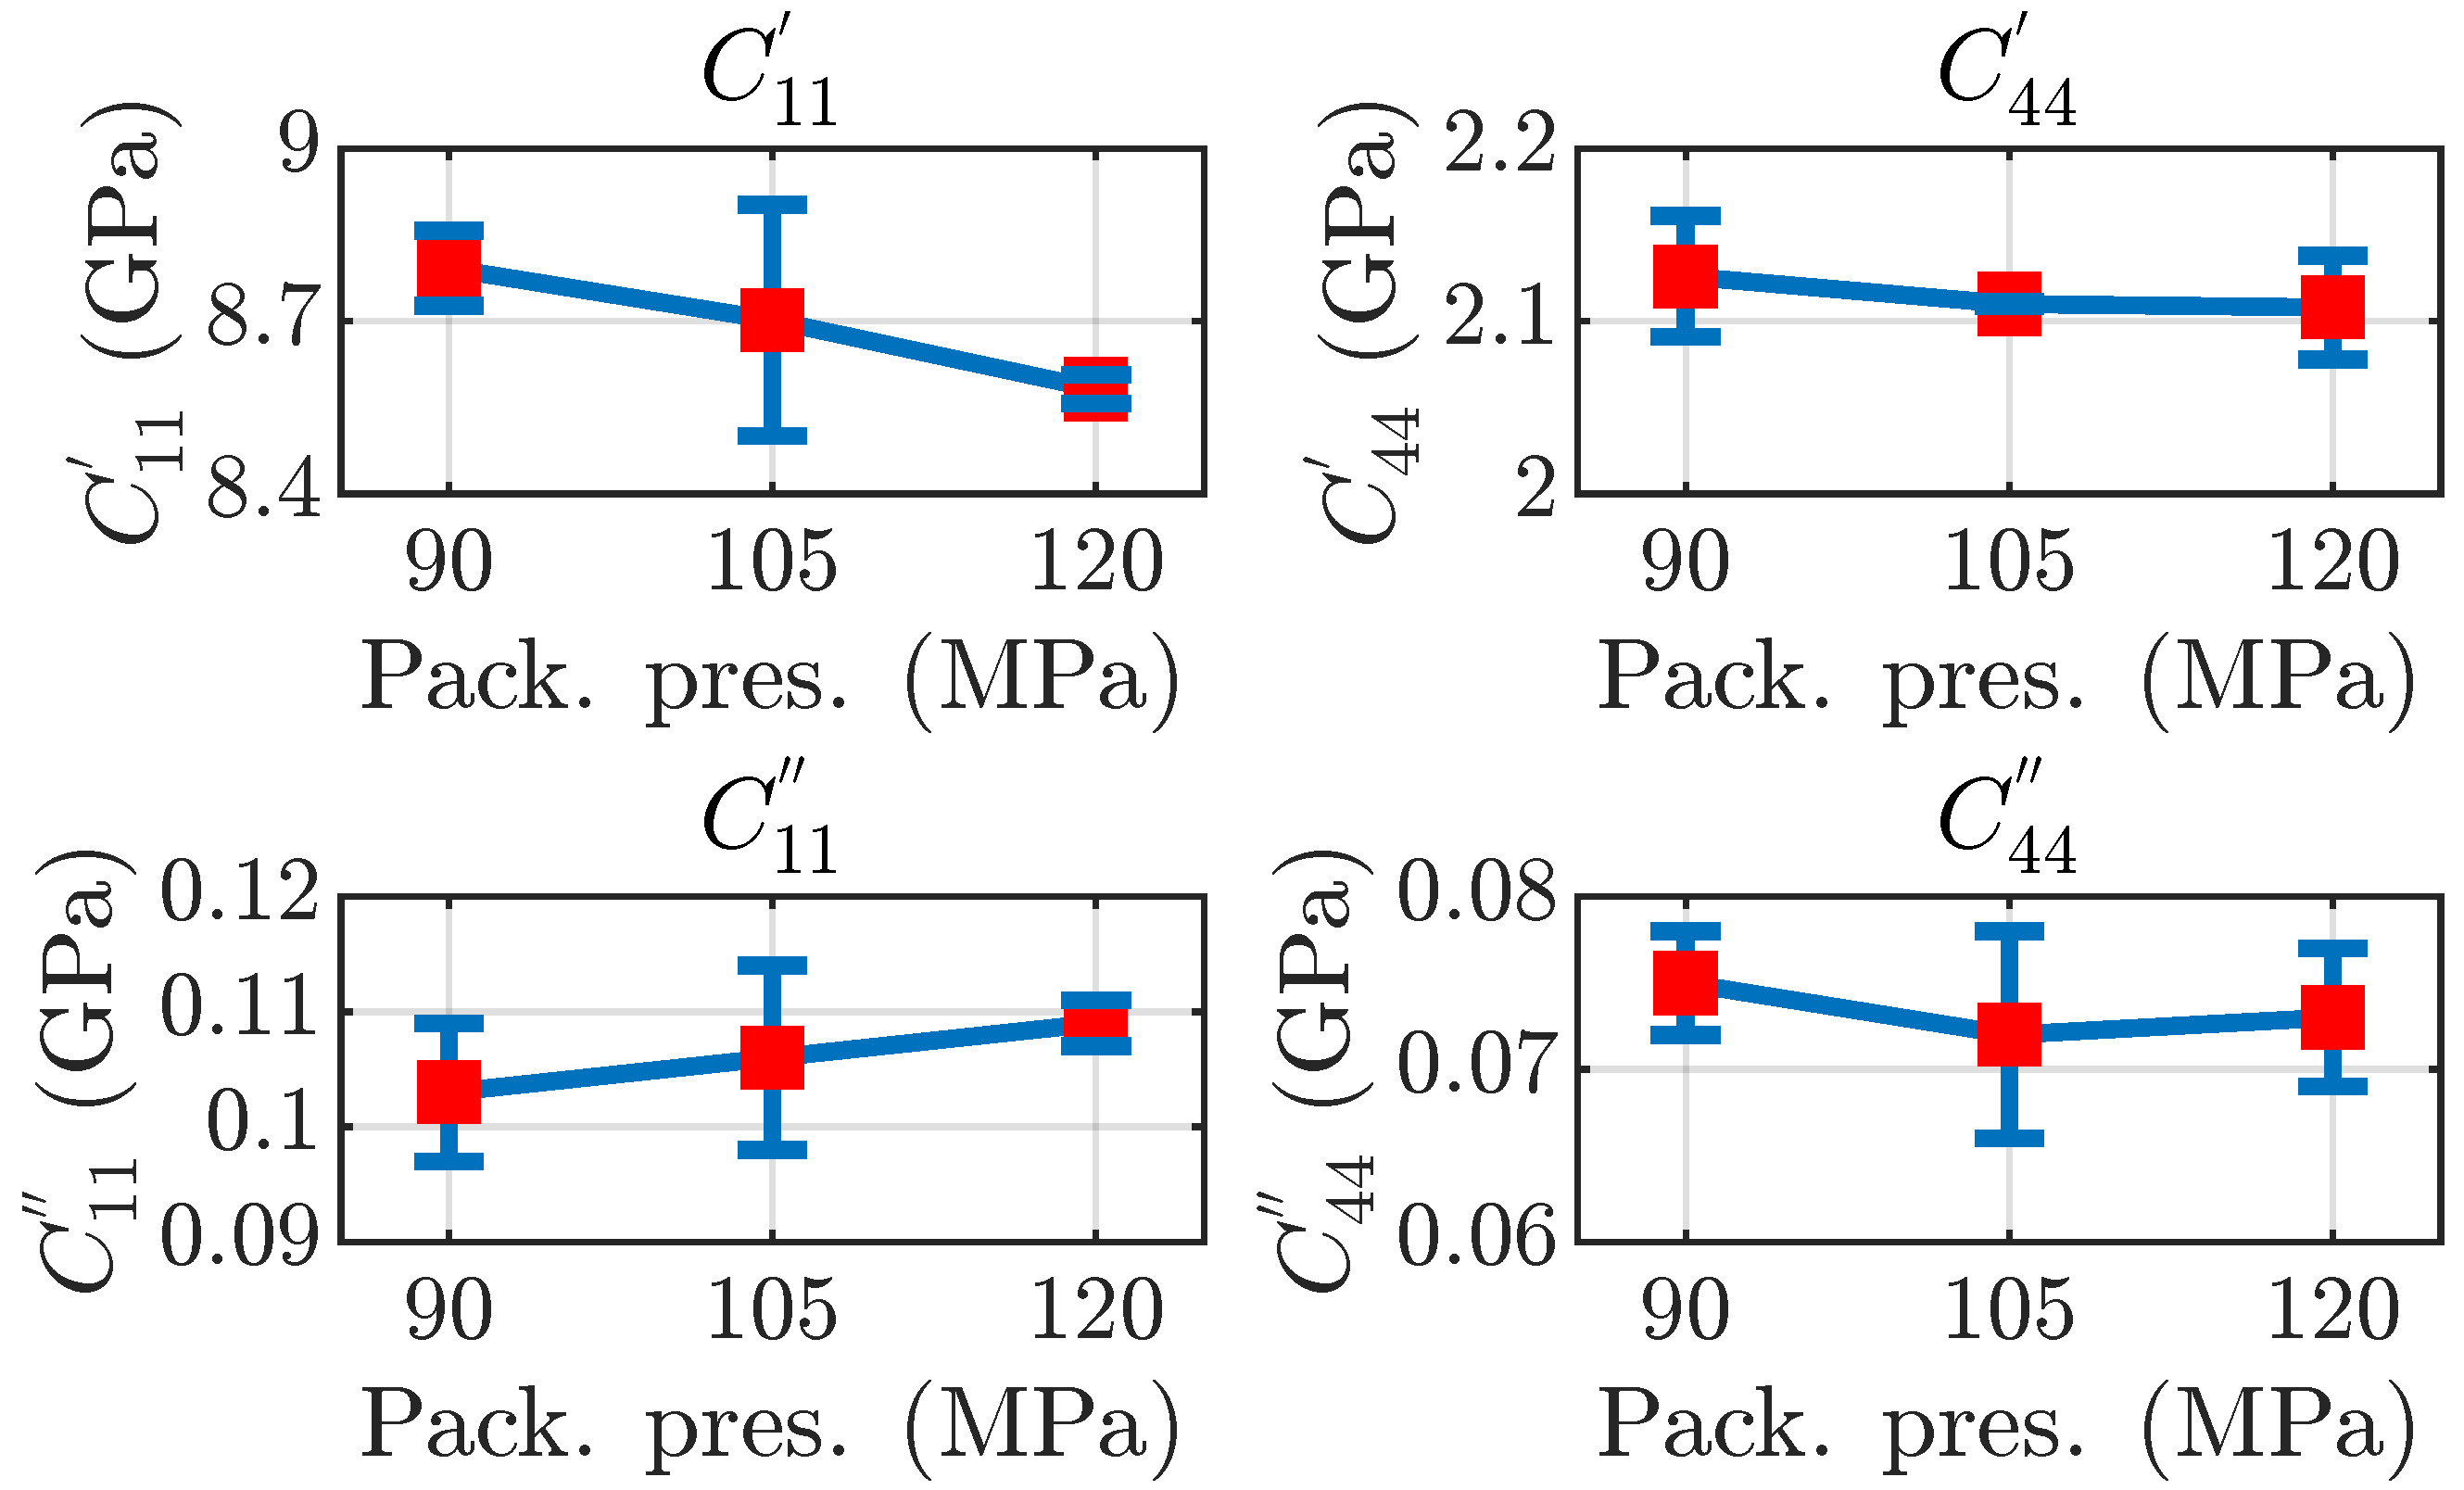
 Figure 8 and Figure 9 display the packing pressure effect plots and the injection velocity plots for the measured elastic moduli, respectively. The diagrams show a dependence between the elastic moduli and the process parameters. In particular, C 11 in Figure 9 indicates a clearly decreasing trend as the injection velocity increases.
Looking into the specifics of the packing pressure, as depicted in Figure 8, an incremental increase in the packing pressure from 90 MPa to 120 MPa resulted in a discernible decrease in C 11 and a slight decrease in C 44 . Concurrently, the imaginary components of C 11 and C 44 displayed minor fluctuations. The consistency in the pattern suggests that rise in the packing pressure may have beeen responsible for the enhanced compressibility and rigidity of the material.
Focusing on the influence of the injection velocity, as illustrated in Figure 9, an augmentation in the injection velocity from 16 m/s to 40 m/s was linked with a reduction in C 11 while C 44 remained relatively stable. The imaginary components for both the moduli exhibited some variances. It can be inferred that the injection velocity plays a pivotal role in determining the inherent acoustic properties of the molded parts.
This study and the UEIS analysis demonstrate that this technique can be employed to examine the impacts of the IM process parameters on the acoustic parameters of the materials much faster and more easily than the available measurement techniques, such as resonant ultrasound spectroscopy [33,38] or laser vibrometry and triangulation [39], to name a few. For example, this methodology and the presented technique could be immensely beneficial to the field of acoustofluidics [9], where researchers can tune their material parameter data to more precise values. Conventionally, the research community uses the polymer acoustic data provided by the manufacturers that are generic and not available for each specific grade of that material. This technique helps with an agile characterization of these parameters, i.e., the Young’s modulus and Poisson’s ratio, which generally are presented as an overall value for the polymer category.
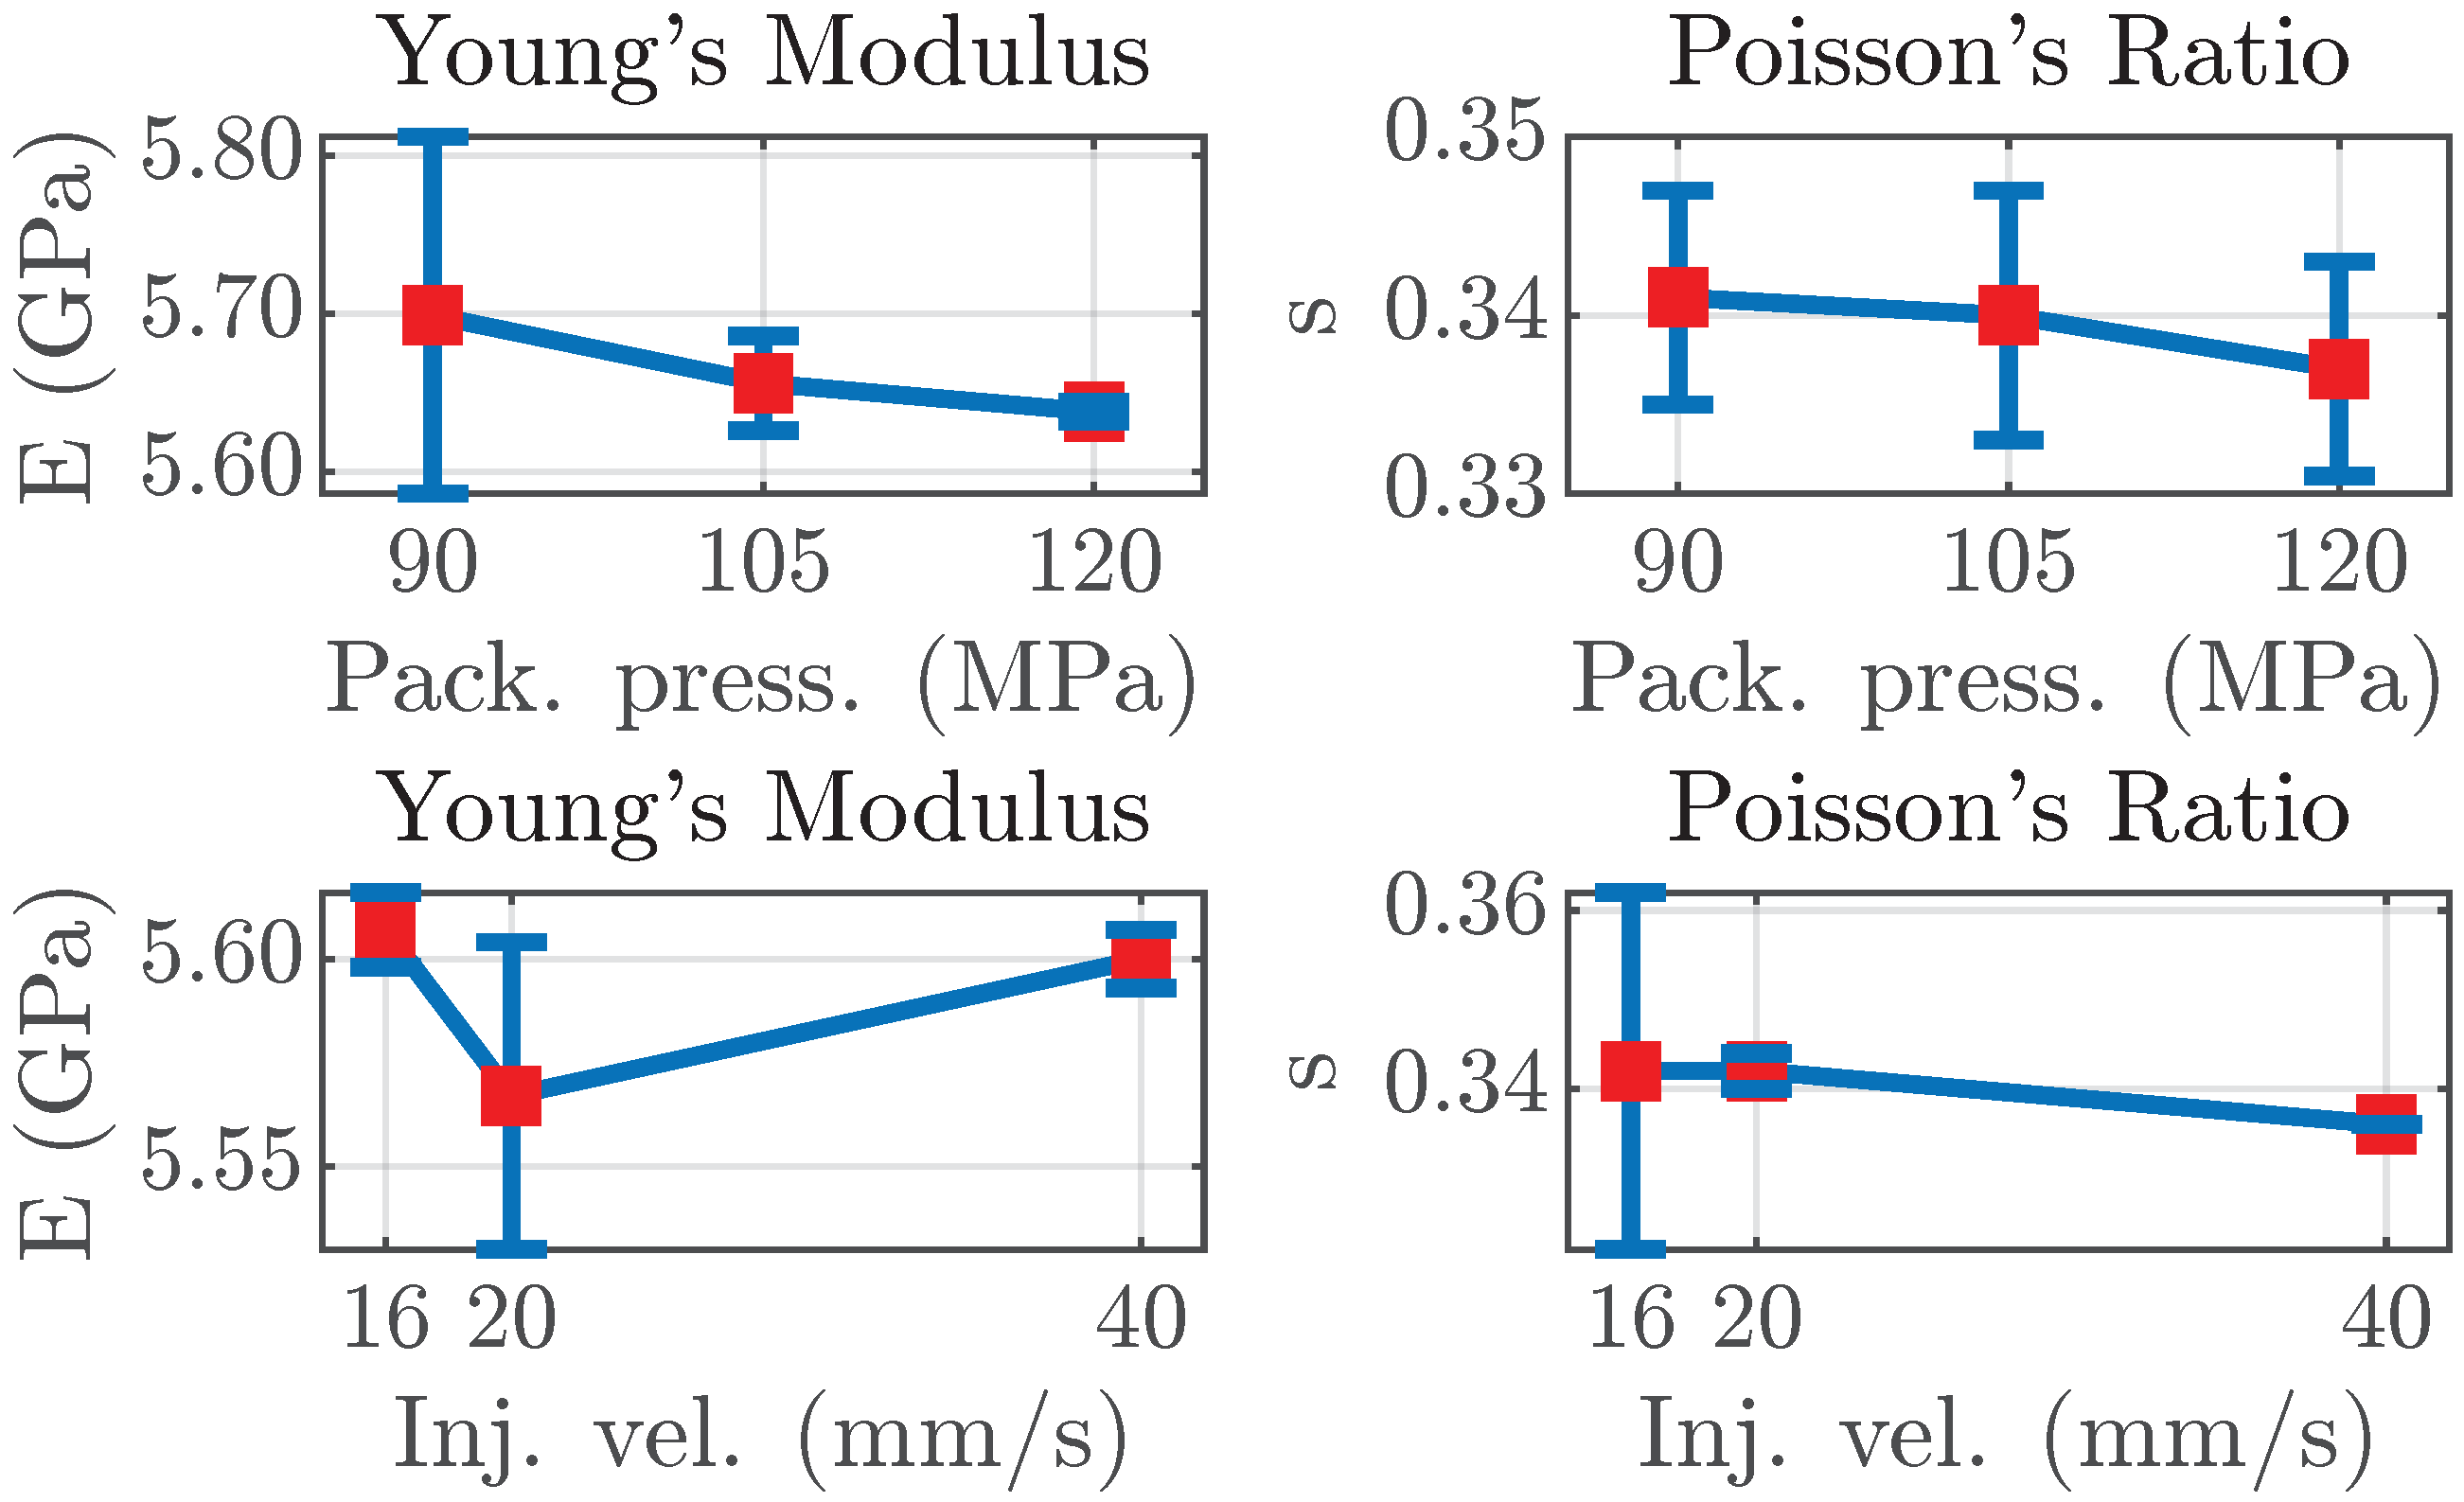
As shown in Figure 10, by using the real parts of C i k that were measured in the previous step, the Young’s moduli and Poisson’s ratios were calculated for each of the six tested samples. Upon first look, the measurements coincide with the given range of values for PMMA [26]. In the case of varying the packing pressure (Figure 10), the Young’s moduli show a strong linear correlation with an R 2 value of approximately 0.96, indicating a significant relationship between the packing pressure and the Young’s modulus. The Poisson’s ratios exhibit a moderate correlation, with an R 2 value of 0.75. The maximum relative percentage difference (RPD) for the Young’s modulus is 1%, and for the Poisson’s ratios, it is 2.9%. The increased standard error for the Young’s modulus and the Poisson’s ratio at the lowest packing pressure and injection velocity, respectively, were likely a result of increased variation in the glue layer thickness for the corresponding measurements, as seen in Table A1 in Appendix A. The Young’s modulus demonstrates a lower correlation, with an R 2 of 0.12, suggesting a weak linear relationship regarding the samples where the injection velocity was changed. At the same time, the Poisson’s ratio showed a very high correlation, with an R 2 of approximately 0.97. A maximum RPD of 0.7% for the Young’s modulus and 2.9% for the Poisson’s ratios was observed in this case. (See Table 2 and Table 3 for the detailed RPD data.)
Conventional methods, like the “dog-bone” tensile test, measure parameters such as the Young’s modulus through static measurements, failing to provide insights into frequency-dependent behavior. In contrast, the UEIS technique characterizes these parameters in the high-frequency domain, reaching several mega-Hertz. This approach offers a unique way to determine the acoustic properties of IM parts. The UEIS method is anticipated to be instrumental in various ultrasound applications related to polymers, including polymer characterization [26], studying aging and degradation [40], and evaluating ultrasonically welded joints [41], to name a few. Such advancements will further bolster the use of IM in high-frequency applications, notably in systems like LOC.

5. Conclusions

The objective of this paper was to deliver a breakdown analysis of the effects of the process parameters of IM on the acoustic properties of polymers. As such, PMMA LG IG 840 parts were molded with nine sets of process parameters where the mold and melt temperature were kept constant, and the packing pressure and the injection velocity were changed with the help of a full-factorial DOE. The exact process settings were utilized to simulate the parts and provide a deeper analysis. To prepare the parts for UEIS tests, rings with identical radii were cut from the nine different chips, and the exact location on the surface in terms of how the distance from the gate in the IM affects the mechanical characteristics was determined.
The UEIS tests were performed on each chip, and the elastic moduli C i k were measured. The effects of the packing pressure and the injection velocity, as changing factors, on the moduli were analyzed and discussed. The results showed a dependence between the elastic moduli and the process parameters. In particular, C 11 indicated a clearly decreasing trend with increase in the injection velocity value, while increase in the packing pressure from 90 MPa to 120 MPa resulted in a noticeable decrease in C 11 and a slight decrease in C 44 . The two essential properties of the Young’s modulus and the Poisson’s ratio, which are generally measured with tensile tests, such as the dog-bone test, were calculated using the real parts of C i k . To establish more robust correlations, future studies on more polymer materials using this methodology could be undertaken to substantiate the findings. Nevertheless, the study has demonstrated that this technique offers a novel and agile method to characterize the acoustic parameters of polymer materials in high-frequency domains. Secondly, a clear dependence between the IM process settings and the acoustic parameters was demonstrated, which opens a new gate for researchers to characterize the polymer parts more quickly and efficiently for high-frequency applications, such as acoustic LOCs.
The real parts of the elastic moduli allow for tuning of the polymer resonances, while the imaginary parts define the attenuation of the polymer. For applications within acoustofluidics, it is highly beneficial to decrease the acoustic attenuation in the microfluidic chip to obtain higher energy densities within the fluidic channels. This work has demonstrated that the injection molding parameters offer precise control over these acoustic parameters, and, therefore, allow engineering of the polymer sample towards the desired acoustic properties.

Author Contributions

Conceptualization , K.S. and F.L.; methodology, K.S. and F.L.; software, K.S.; validation, K.S. and F.L.; formal analysis, K.S. and F.L.; investigation, K.S.; resources, K.S., F.L., H.B., G.T. and M.C.; data curation, K.S. and F.L.; writing—original draft preparation, K.S. and F.L.; writing—review and editing, K.S., G.T. and M.C.; visualization, K.S. and F.L.; supervision, H.B., G.T. and M.C.; project administration, H.B., G.T. and M.C. All authors have read and agreed to the published version of the manuscript.

Funding

This work is part of the Eureka Eurostars-2 E!113461 AcouPlast project funded by Innovation Fund Denmark, grant no. 9046-00127B, and Vinnova, Sweden’s Innovation Agency, grant no. 2019-04500.

Data Availability Statement

All the primary measurements and data are reported in the manuscript and the Appendices Appendix A and Appendix B. The excel sheets that include all the relevant measurements will be submitted along with this draft.

Conflicts of Interest

The authors declare no conflict of interest.

Abbreviations

The following abbreviations are used in this manuscript:
IMInjection molding
QAQuality assurance
DOEDesign of experiment
PMMAPolymethyl methacrylate
UEISUltrasound electrical-impedance spectroscopy
LOCLab-on-a-chip
PZTLead zirconate titanate

Appendix A

Table A1. Measured dimensions of the piezoelectric disk and the polymer rings: diameter of the Pz27 disk ( d pzt ), the thickness of the Pz27 disk ( t pzt ), the diameter of the polymer ring ( d polymer ), the thickness of the polymer ring ( t polymer ), the inner diameter of the polymer ring ( d inner ), and the thickness of the glue layer ( t glue ). Three measurements (A, B, C) at three different packing pressures (PP1, PP2, PP3) and injection velocities (IV1, IV2, IV3) were performed. The values in brackets denote one standard deviation.
Sample d pzt (mm) t pzt (mm) d polymer (mm) t polymer (mm) d inner / t glue (mm)
PP1(A)10.033(7)0.490(1)20.007(4)1.422(4)1.91(2)/0.03(2)
PP1(B)10.043(5)0.528(4)19.999(1)1.425(7)1.91(1)/0.015(6)
PP1(C)10.047(3)0.509(4)19.999(1)1.422(5)1.91(1)/0.021(7)
PP2(A)10.041(7)0.524(3)19.999(1)1.424(4)1.95(2)/0.004(7)
PP2(B)10.030(7)0.517(6)19.997(2)1.422(3)1.92(1)/0.006(5)
PP2(C)10.045(4)0.526(4)20.001(2)1.428(4)1.92(1)/0.036(2)
PP3(A)10.033(5)0.510(1)19.999(3)1.424(3)1.90(1)/0.007(2)
PP3(B)10.037(5)0.521(3)20.000(3)1.423(4)1.91(1)/0.008(6)
PP3(C)10.038(3)0.516(5)19.999(1)1.426(3)1.92(1)/0.012(3)
IV1(A)10.038(5)0.509(5)20.06(1)1.921(2)1.98(1)/0.014(6)
IV1(B)10.041(4)0.508(3)19.999(8)1.919(1)1.96(1)/0.025(6)
IV1(C)10.03(1)0.521(4)19.99(1)1.922(3)1.99(1)/0.012(6)
IV2(A)10.042(1)0.502(6)19.96(1)1.911(5)1.98(1)/0.015(6)
IV2(B)10.040(6)0.506(3)19.99(1)1.913(3)1.98(1)/0.015(5)
IV2(C)10.033(6)0.513(4)20.00(1)1.915(2)1.95(1)/0.009(7)
IV3(A)10.045(5)0.522(3)20.01(2)1.908(2)1.95(1)/0.007(6)
IV3(B)10.043(6)0.530(4)19.998(4)1.913(2)1.96(1)/0.007(6)
IV3(C)10.030(4)0.508(5)19.87(1)1.915(3)1.96(1)/0.006(6)

Appendix B

Table A2. The full-factorial DOE used for the IM process with packing pressure and injection velocity as the factors and shear stresses in the filling and packing stage as the responses.
RunMelt Temp. ( ° C)/Mold Temp. ( ° C)/Packing Pressure (MPa)/Injection Velocity (mm/s)Avg. Shear Stress (Filling) (MPa)Avg. Shear Stress (Packing) (MPa)
Run 1220/65/90/160.380.10
Run 2220/65/90/200.310.12
Run 3220/65/90/400.190.14
Run 4220/65/105/160.380.10
Run 5220/65/105/200.310.12
Run 6220/65/105/400.190.14
Run 7220/65/120/160.380.10
Run 8220/65/120/200.310.12
Run 9220/65/120/400.190.14

References

  1. Piccolo, L.; Puleo, K.; Sorgato, M.; Lucchetta, G.; Masato, D. Modeling the replication of submicron-structured surfaces by micro injection molding. Mater. Des. 2021, 198, 109272. [Google Scholar] [CrossRef]
  2. Vieten, T.; Stahl, D.; Schilling, P.; Civelek, F.; Zimmermann, A. Feasibility Study of Soft Tooling Inserts for Injection Molding with Integrated Automated Slides. Micromachines 2021, 12, 730. [Google Scholar] [CrossRef] [PubMed]
  3. Fareh, F.; Demers, V.; Demarquette, N.R.; Turenne, S.; Scalzo, O. Molding Properties of Inconel 718 Feedstocks Used in Low-Pressure Powder Injection Molding. Adv. Mater. Sci. Eng. 2016, 2016, 7078045. [Google Scholar] [CrossRef]
  4. Liou, G.Y.; Su, W.J.; Cheng, F.J.; Chang, C.H.; Tseng, R.H.; Hwang, S.J.; Peng, H.S.; Chu, H.Y. Optimize Injection-Molding Process Parameters and Build an Adaptive Process Control System Based on Nozzle Pressure Profile and Clamping Force. Polymers 2023, 15, 610. [Google Scholar] [CrossRef] [PubMed]
  5. Lee, H.; Ryu, K.; Cho, Y. A Framework of a Smart Injection Molding System Based on Real-time Data. Procedia Manuf. 2017, 11, 1004–1011. [Google Scholar] [CrossRef]
  6. Mortelmans, T.; Kazazis, D.; Werder, J.; Kristiansen, P.M.; Ekinci, Y. Injection Molding of Thermoplastics for Low-Cost Nanofluidic Devices. Acs Appl. Nano Mater. 2022, 5, 17758–17766. [Google Scholar] [CrossRef]
  7. Ma, X.; Li, R.; Jin, Z.; Fan, Y.; Zhou, X.; Zhang, Y. Injection molding and characterization of PMMA-based microfluidic devices. Microsyst. Technol.-Micro Nanosyst. Inf. Storage Process. Syst. 2020, 26, 1317–1324. [Google Scholar] [CrossRef]
  8. Su, C.W.; Su, W.J.; Cheng, F.J.; Liou, G.Y.; Hwang, S.J.; Peng, H.S.; Chu, H.Y. Optimization process parameters and adaptive quality monitoring injection molding process for materials with different viscosity. Polym. Test. 2022, 109, 107526. [Google Scholar] [CrossRef]
  9. Lickert, F.; Ohlin, M.; Bruus, H.; Ohlsson, P. Acoustophoresis in polymer-based microfluidic devices: Modeling and experimental validation. J. Acoust. Soc. Am. 2021, 149, 4281–4291. [Google Scholar] [CrossRef]
  10. Ayun, A.H.Q.; Triyono, J.; Pujiyanto, E. Optimization of Injection Molding Simulation of Bioabsorbable Bone Screw Using Taguchi Method and Particle Swarm Optimization. Jordan J. Mech. Ind. Eng. 2022, 16, 319–325. [Google Scholar]
  11. Alvarado-Iniesta, A.; García-Alcaraz, J.L.; Del Valle-Carrasco, A.; Pérez-Domínguez, L.A. Multi-objective optimization of an injection molding process. Stud. Comput. Intell. 2017, 663, 391–407. [Google Scholar] [CrossRef]
  12. Lee, H.; Ryu, K. Process parameters optimization using knowledge based control and a classification model for smart injection molding. Icic Express Lett. Part Appl. 2018, 9, 1083–1090. [Google Scholar] [CrossRef]
  13. Yu, S.; Zhang, T.; Zhang, Y.; Huang, Z.; Gao, H.; Han, W.; Turng, L.S.; Zhou, H. Intelligent setting of process parameters for injection molding based on case-based reasoning of molding features. J. Intell. Manuf. 2022, 33, 77–89. [Google Scholar] [CrossRef]
  14. Tofteberg, T.; Andreassen, E. Multiscale simulation of injection molding of parts with low aspect ratio microfeatures. Int. Polym. Process. 2010, 25, 63–74. [Google Scholar] [CrossRef]
  15. Ozcelik, B.; Ozbay, A.; Demirbas, E. Influence of injection parameters and mold materials on mechanical properties of ABS in plastic injection molding. Int. Commun. Heat Mass Transf. 2010, 37, 1359–1365. [Google Scholar] [CrossRef]
  16. Mehat, N.M.; Kamaruddin, S. Investigating the Effects of Injection Molding Parameters on the Mechanical Properties of Recycled Plastic Parts Using the Taguchi Method. Mater. Manuf. Process. 2011, 26, 202–209. [Google Scholar] [CrossRef]
  17. Rosli, M.U.; Termizi, S.N.A.A.; Khor, C.Y.; Nawi, M.A.M.; Omar, A.A.; Ishak, M.I. Simulation Based Optimization of Thin Wall Injection Molding Parameter Using Response Surface Methodology. IOP Conf. Ser. Mater. Sci. Eng. 2020, 864, 012193. [Google Scholar] [CrossRef]
  18. Loaldi, D.; Regi, F.; Baruffi, F.; Calaon, M.; Quagliotti, D.; Zhang, Y.; Tosello, G. Experimental validation of injection molding simulations of 3D microparts and microstructured components using virtual design of experiments and multi-scale modeling. Micromachines 2020, 11, 614. [Google Scholar] [CrossRef]
  19. Giannekas, N.; Zhang, Y.; Tosello, G. Investigation on Product and Process Fingerprints for Integrated Quality Assurance in Injection Molding of Microstructured Biochips. J. Manuf. Mater. Process. 2018, 2, 79. [Google Scholar] [CrossRef]
  20. Wang, M.W.; Arifin, F.; Vu, V.H. The Study of Optimal Molding of a LED Lens with Grey Relational Analysis and Molding Simulation. Period. Polytech. Mech. Eng. 2019, 64, 278–294. [Google Scholar] [CrossRef]
  21. Chen, J.; Cui, Y.; Liu, Y.; Cui, J. Design and Parametric Optimization of the Injection Molding Process Using Statistical Analysis and Numerical Simulation. Processes 2023, 11, 414. [Google Scholar] [CrossRef]
  22. El Bahra, S.; Ludwig, K.; Samran, A.; Freitag-Wolf, S.; Kern, M. Linear and volumetric dimensional changes of injection-molded PMMA denture base resins. Dent. Mater. 2013, 29, 1091–1097. [Google Scholar] [CrossRef] [PubMed]
  23. Zhang, H.; Fang, F.; Gilchrist, M.D.; Zhang, N. Precision replication of micro features using micro injection moulding: Process simulation and validation. Mater. Des. 2019, 177, 107829. [Google Scholar] [CrossRef]
  24. Giannekas, N. Precision Injection Moulding of Microfeatures Using Integrate Process and Product Quality Assurance. Ph.D. Thesis, Technical University of Denmark, Lyngby, Denmark, 2018; pp. 1–2. [Google Scholar] [CrossRef]
  25. Moon, J.S.; Choi, B.H. Modeling and validation of the effects of processing parameters on the dimensional stability of an injection-molded polypropylene plate. J. Mech. Sci. Technol. 2018, 32, 5623–5630. [Google Scholar] [CrossRef]
  26. Bodé, W.N.; Lickert, F.; Augustsson, P.; Bruus, H. Determination of the Complex-Valued Elastic Moduli of Polymers by Electrical-Impedance Spectroscopy for Ultrasound Applications. Phys. Rev. Appl. 2022, 18, 064078. [Google Scholar] [CrossRef]
  27. Kek, T.; Kusic, D.; Hancic, A.; Grum, J. Acoustic emission crack detection in injection molding. In Proceedings of the VIIIth International Workshop NDT in Progress (NDTP2015), Prague, Czech Republic, 12–14 October 2015; pp. 81–88. [Google Scholar]
  28. Kusić, D.; Kek, T.; Slabe, J.M.; Svečko, R.; Grum, J. The impact of process parameters on test specimen deviations and their correlation with AE signals captured during the injection moulding cycle. Polym. Test. 2013, 32, 583–593. [Google Scholar] [CrossRef]
  29. Pinpathomrat, B.; Mathurosemontri, S.; Thumsorn, S.; Hamada, H. Interfacial characteristics of insert-injection molding by using acoustic emission. Key Eng. Mater. 2017, 728, 258–263. [Google Scholar] [CrossRef]
  30. Heinisch, J.; Lockner, Y.; Hopmann, C. Comparison of design of experiment methods for modeling injection molding experiments using artificial neural networks. J. Manuf. Process. 2021, 61, 357–368. [Google Scholar] [CrossRef]
  31. Rufo, J.; Cai, F.; Friend, J.; Wiklund, M.; Huang, T.J. Acoustofluidics for biomedical applications. Nat. Rev. Methods Prim. 2022, 2, 30. [Google Scholar] [CrossRef]
  32. Plesek, J.; Kolman, R.; Landa, M. Using finite element method for the determination of elastic moduli by resonant ultrasound spectroscopy. J. Acoust. Soc. Am. 2004, 116, 282–287. [Google Scholar] [CrossRef]
  33. Wang, H.; Jiang, W.; Cao, W. Characterization of lead zirconate titanate piezoceramic using high frequency ultrasonic spectroscopy. J. Appl. Phys. 1999, 85, 8083–8091. [Google Scholar] [CrossRef]
  34. Saeedabadi, K.; Tosello, G.; Calaon, M. Optimization of injection molded polymer lab-on-a-chip for acoustic blood plasma separation using virtual design of experiment. Procedia CIRP 2022, 107, 40–45. [Google Scholar] [CrossRef]
  35. Polak, R.; Zahalka, M. Influence of gate position during the injection moulding process. Ann. Daaam Proc. Int. Daaam Symp. 2018, 29, 0659–0664. [Google Scholar] [CrossRef]
  36. Jin, K.; Jeong, T.; Kim, T.; Kim, N.; Kim, B. Analysis and design for reducing residual stress and distortion after ejection of injection molded part with metal-insert. Int. J. Precis. Eng. Manuf. 2014, 15, 2533–2542. [Google Scholar] [CrossRef]
  37. Kim, B.; Min, J. Residual stress distributions and their influence on post-manufacturing deformation of injection-molded plastic parts. J. Mater. Process. Technol. 2017, 245, 215–226. [Google Scholar] [CrossRef]
  38. Xu, G.; Ni, Z.; Chen, X.; Tu, J.; Guo, X.; Bruus, H.; Zhang, D. Acoustic Characterization of Polydimethylsiloxane for Microscale Acoustofluidics. Phys. Rev. Appl. 2020, 13, 054069. [Google Scholar] [CrossRef]
  39. Ilg, J.; Rupitsch, S.J.; Sutor, A.; Lerch, R. Determination of Dynamic Material Properties of Silicone Rubber Using One-Point Measurements and Finite Element Simulations. IEEE T. Instrum. Meas. 2012, 61, 3031–3038. [Google Scholar] [CrossRef]
  40. Morokov, E.; Yabbarov, N.; Sedush, N.; Bogachenkov, A.; Malykhin, A.; Demina, V.; Azarkevich, P.; Nikolskaya, E.; Chirkina, M.; Sokol, M. Observation of discrepancy between the degradation of polymer scaffolds in vitro and in vivo according to high-resolution ultrasound technique. Eur. Polym. J. 2023, 195, 112248. [Google Scholar] [CrossRef]
  41. Eslami, S.; de Figueiredo, M.; Tavares, P.J.; Moreira, P. Parameter optimisation of friction stir welded dissimilar polymers joints. Int. J. Adv. Manuf. Technol. 2018, 94, 1759–1770. [Google Scholar] [CrossRef]
Figure 1. The flowchart traces the study’s steps from refining the IM process parameters to gathering acoustic data, ultimately aiming to correlate the IM settings with the material’s acoustic data. Additionally, the chart implies potentially aligning the IM simulation results and settings with the acoustic parameter values.
Jmmp 07 00222 g001
Figure 2. A schematic and dimensions of the injection molded part. Every part contains a set of two chips with two different thicknesses but which are identical in other dimensions. The chips are cut to obtain two blank slides from each part. (a) Chips before cutting the runner system; (b) Sketch of the two chips after cutting the runner system.
Jmmp 07 00222 g002
Figure 3. A polarized microscopy image of the chips before and after cutting out the rings. The black lines demonstrate the residual stress caught in the polymer during the injection molding, representing the flow-induced and thermally induced residual stress.
Jmmp 07 00222 g003
Figure 4. The image documents the sample holder used as part of the UEIS setup for the electrical impedance measurements. The setup shows the polymer ring and the piezoelectric transducer disk, made from the material PZT, clamped via two spring-loaded pins by the sample holder.
Jmmp 07 00222 g004
Figure 5. Melt front progress of the IM simulation at t = 3 s. The simulations provided insight into the different characteristics of the parts and facilitated the next stage of the analysis, which was the study of the acoustic parameters of the material.
Jmmp 07 00222 g005
Figure 6. A comparison of shear stress during filling between Run 1 with the highest average value and Run 9 with the lowest.
Jmmp 07 00222 g006
Figure 7. A polarized microscopy image of the chips before and after cutting out the rings. The black lines demonstrate the residual stress caught in the polymer during the injection molding.
Jmmp 07 00222 g007
Figure 8. The polymer samples’ four measured elastic moduli C i k are shown for different packing pressures, ranging from 90 MPa to 120 MPa. The red square indicates the mean, while the blue error bars denote the standard error (N = 3).
Jmmp 07 00222 g008
Figure 9. The polymer samples’ four measured elastic moduli C i k are shown for different injection velocities, ranging from 16 mm/s to 40 mm/s. The red square indicates the mean, while the blue error bars denote the standard error (N = 3).
Jmmp 07 00222 g009
Figure 10. Young’s moduli and Poisson’s ratios are shown for different injection velocities ranging from 16 mm/s to 40 mm/s and packing pressures ranging from 90 MPa to 120 MPa. The red square indicates the mean, while the blue error bars denote the standard error (N = 3).
Jmmp 07 00222 g010
Table 1. Injection molding process parameters of PMMA LG IG 840 as the substrate material. The same set of parameters is used for both production and simulations.
FactorsUnitLevel 1/Level 2/Level 3
Mold temperature ° C65/−/−
Melt temperature ° C220/−/−
Packing pressureMPa90/105/120
Injection velocitymm/s16/20/40
Table 2. Young’s moduli and Poisson’s ratios were calculated for samples with different packing pressures with the corresponding maximum RPD.
PropertyPP-90/PP-105/PP-120Max RPD
Young’s modulus5.69/5.65/5.631%
Poisson’s ratio0.34/0.34/0.332.9%
Table 3. Young’s moduli and Poisson’s ratios were calculated for samples with different injection velocities with the corresponding maximum RPD.
PropertyIV-16/IV-20/IV-40Max RPD
Young’s modulus5.60/5.56/5.600.7%
Poisson’s ratio0.34/0.34/0.332.9%
Disclaimer/Publisher’s Note: The statements, opinions and data contained in all publications are solely those of the individual author(s) and contributor(s) and not of MDPI and/or the editor(s). MDPI and/or the editor(s) disclaim responsibility for any injury to people or property resulting from any ideas, methods, instructions or products referred to in the content.

