Article

Experimental Uncertainty Evaluation in Optical Measurements of Micro-Injection Molded Products

1
STIIMA-CNR, Institute of Intelligent Industrial Systems and Technologies for Advanced Manufacturing, Consiglio Nazionale delle Ricerche, Via Lembo 38/F, I-70124 Bari, Italy
2
STIIMA-CNR, Institute of Intelligent Industrial Systems and Technologies for Advanced Manufacturing, Consiglio Nazionale delle Ricerche, Via Corti 12, I-20133 Milano, Italy
*
Author to whom correspondence should be addressed.
J. Manuf. Mater. Process. 2024, 8(1), 21; https://doi.org/10.3390/jmmp8010021
Submission received: 13 December 2023 / Revised: 18 January 2024 / Accepted: 24 January 2024 / Published: 26 January 2024
(This article belongs to the Special Issue Advances in Injection Molding: Process, Materials and Applications)

Abstract

:
Optical measurements are increasingly widely used as preferential techniques to evaluate dimensional and surface quantities in micro-products. However, uncertainty estimation is more critical on micro-products than macro, and it needs careful attention for evaluating the obtained quality, the requested tolerance, and the correct setting of experimental process settings. In this study, optical measurements characterized micro-injected products by linear and surface acquisition and considered all the sources contributing to uncertainties. The results show that the measure uncertainty could be underestimated if only the standard deviation on simple measurements is considered; this could cause a significant restriction of the estimated range covering the measured values. Furthermore, the findings confirm that the correct evaluation of the potential uncertainties contributes to accurately assessing the process behavior and improving product quality.

1. Introduction

The achievable accuracy and precision are the advantages of the micro-injection molding process. A favorable cost-time ratio makes this process desirable in several applications ranging from the automotive to the biomedical, from the aerospace to optics and communications [1,2]. The high, achievable quality in micro-parts manufacturing requires more extensive attention in evaluating linear dimensions and surface properties, mainly 3D amplitude parameters focused on surface roughness, than a macro product; hence, a suitable evaluation of the measurement procedure’s uncertainties is necessary. Stylus profilers were the elected contact instruments used for measuring dimensions and texture. Coordinated measuring machines (CMMs) are widely used and commonly consist of three fundamental components, the machine, the measuring probe moving across the surface, and the control system with appropriate software. They can measure various geometrical characteristics for size, form, location, orientation, and roughness. In particular, the measurements are suitable when complex measurement tasks of a workpiece must be made [3]. Many researchers have estimated CMM measurement uncertainty in the last decade, as reported in references [4,5,6]. But, although the stylus instrument returned generally accurate and repeated the data, there is potential damage to the surface that could depend on the measurement force, the stylus tip size, and the surface hardness. The accuracy of CMMs has been continuously optimized and improved over the last decades. Still, the positional errors of 3D measurement points are inevitably affected by machine geometric errors, and this could become a significant measurement uncertainty contribution [7]. The atomic force microscope (AFM) [8] is the most accurate contact instrument for surface morphology acquisition. However, it is a costly and time-consuming method to address the area to scan with a z extension lower than 1 µm.
With the emergence of more reliable and efficient optical measurement techniques, optical instruments are increasingly being used, and comparisons between contact and contactless methods were performed to highlight the corresponding advantages and disadvantages. Chin and Bharat [9] compared surface roughness measurements by a stylus profiler, an AFM, and an optical interferometric profiler. They suggested carefully choosing the scan size and sampling interval for the optical method and a tip radius of 0.2 µm for the stylus for measurement on a glass-ceramic substrate. They concluded that the AFM was the most suitable surface measuring instrument; in contrast, the stylus could produce localized damage to the test surface. Vorburger et al. [10] tested periodic grating and random roughness standards and concluded that for surfaces having Ra about 500 nm, both the optical technique and stylus profiler provide the same results. In contrast, for lower values, only the phase shifting interferometry is in moderately good agreement with measurements obtained with the stylus method (AFM). Garcia et al. [11] compared the measurement characteristics of the confocal microscope with a portable stylus profilometer using a Monte Carlo method to calculate the uncertainties with the roughness parameters. The authors found that the stylus profilometer presented the most reliable results with the highest measurement speed and least complex algorithm. At the same time, the confocal method showed higher vertical and horizontal resolution than the adopted stylus profilometer.
The size and properties of micro-injection products are usually in the range of nanometers to micrometers. Consequently, optical instruments are currently the most eligible equipment and have been paid close attention by researchers [12,13]. Generally, optical techniques are faster than stylus measurements, have different operating principles [14], and can reach the same accuracy and precision as long as rigorous use protocols are followed [15]. Recently, a standard measurement procedure has been established [16]. This standard allows to overcome a limit of stylus profilers in determining surface parameters for samples or parts of them that are not reachable by the stylus without the damage of the sample.
As other processes needing accurate analysis, also the measurement process must be characterized and standardized even if the uncertainty evaluation is a lengthy procedure; in particular, Leach et al. [17] highlighted that uncertainty for areal surface topography measurements should not have received appropriate attention from the research community and almost no consideration from industrial users since now. Standard procedures are limited to repeated measurements on a selected produced sample, neglecting important uncertainty sources that could make the quality evaluation of process and product less effective. Recently, several efforts have been made to estimate uncertainties in optical measurements, and some authors have proposed different methods for uncertainty description. Bernstein et al. [18] described a measurement uncertainty analysis for an optical multi-sensor system for the in-line inspection of concave extruding profiles by examining all the possible uncertainty sources of the system like dust, object vibrations, illuminations’ pitch error, and extraneous light. They stated that the analyzed system is suitable for adequately achieving accurate and precise measurements in an industrial environment.
In the uncertainty contributes collection, it is also necessary to consider the sources generated by the optical inspection system integrated into a process line production. Ye et al. [19] report an uncertainty investigation using an on-machine areal measuring instrument based on the chromatic scanning principle by considering noise, flatness deviation, amplification coefficient, and linearity deviation (calibration parameter in step height measurement) [13]. They identified a systematic uncertainty quantification for this online machine measurement. Grochalski et al. [20] presented the uncertainties due to lighting type and direction on measurement surface asperities using focus-variation microscopy and the effect of a light polarizer on the surface topography parameters. They showed that the most favorable conditions for measurement were with lighting coming from the lens or parallel lighting from a ring with a careful positioning of the sample relating to the axis of the profilometer’s table; differences were found in the measurements using the polarizer about the sample, which has a directional surface structure. Among the studied surface parameters, Ra is the least affected using the polarizer. Also, the choice of the optical method to use could introduce uncertainties in measurements, as Walczack et al. [21] determined in comparing a focus variation, coherence scanning interferometry, and confocal microscopy techniques; the authors found results that a hybrid approach, the confocal fusion, was the most reliable and accurate for the surface morphology calibration. Wang et al. [22] present an uncertainty analysis method for a fiducial-aided calibration and positioning system to provide an approach to transform the accuracy of high-precision off-machine measurement equipment to the machine tool during working; the proposed model to “transform” accuracy is adequate and highlights that the lower accuracy of the machine measuring system has a significant influence on the accuracy of the whole system sensible to different uncertainty sources. Genta et al. [23] developed an original framework to evaluate the measurement uncertainty of some currently validated methods available to measure small wear volumes on complex topographies by combining metrological characteristics of measuring instruments and statistical modeling of evaluation procedures. Haitjema [24] gives an overview of the problems that appear when uncertainties have to be associated with the values that are derived from surface topography measurements and suggests a practical solution by considering the main aspects, as given in ISO 25178 standards series [16], and applying these to measured surface topography.
Beyond the applied methods, the optical instrument calibration could introduce a bias in uncertainties, and practical strategies are necessary to overcome the question [25]. Baruffi et al. [26] successfully adopted uncertainty estimation by adapting the ISO 15530-3 [27] method, conceived for CMM measurements, to optical measurements to reduce complications that a total uncertainty estimation would introduce [24]. This approach uses a substitution method to estimate the instrument uncertainty by repeated measures on a calibrated artifact similar to the part to be measured. It allows authors to evaluate indirectly, by the replica molding method, the surface and geometry of micro-milled components. Furthermore, Baruffi et al. [28] also individuated process parameters’ effects on the dimensional variation of micro-injected gear dimensions by adequately evaluating the uncertainty related to the optical measurement instruments used.
In this scenario, the present paper proposes a standardized procedure for uncertainty evaluation of micro-components. The paper experimentally investigates the uncertainty sources involved in a one-dimensional measurement acquired by an optical instrument on polymer micro-molded parts and the corresponding expanded uncertainty; then, expanded uncertainty is assessed for the optical measurement of surface texture parameters. Successively, a comparison between the expanded uncertainty evaluated in one-dimensional measurement and surface texture is performed. The paper is organized as follows: base concepts of uncertainties applied in this work are presented in the next Section 2; then, materials, instruments, and methods are reported in Section 3. Finally, results are shown, discussed, and then briefly resumed in the conclusion.

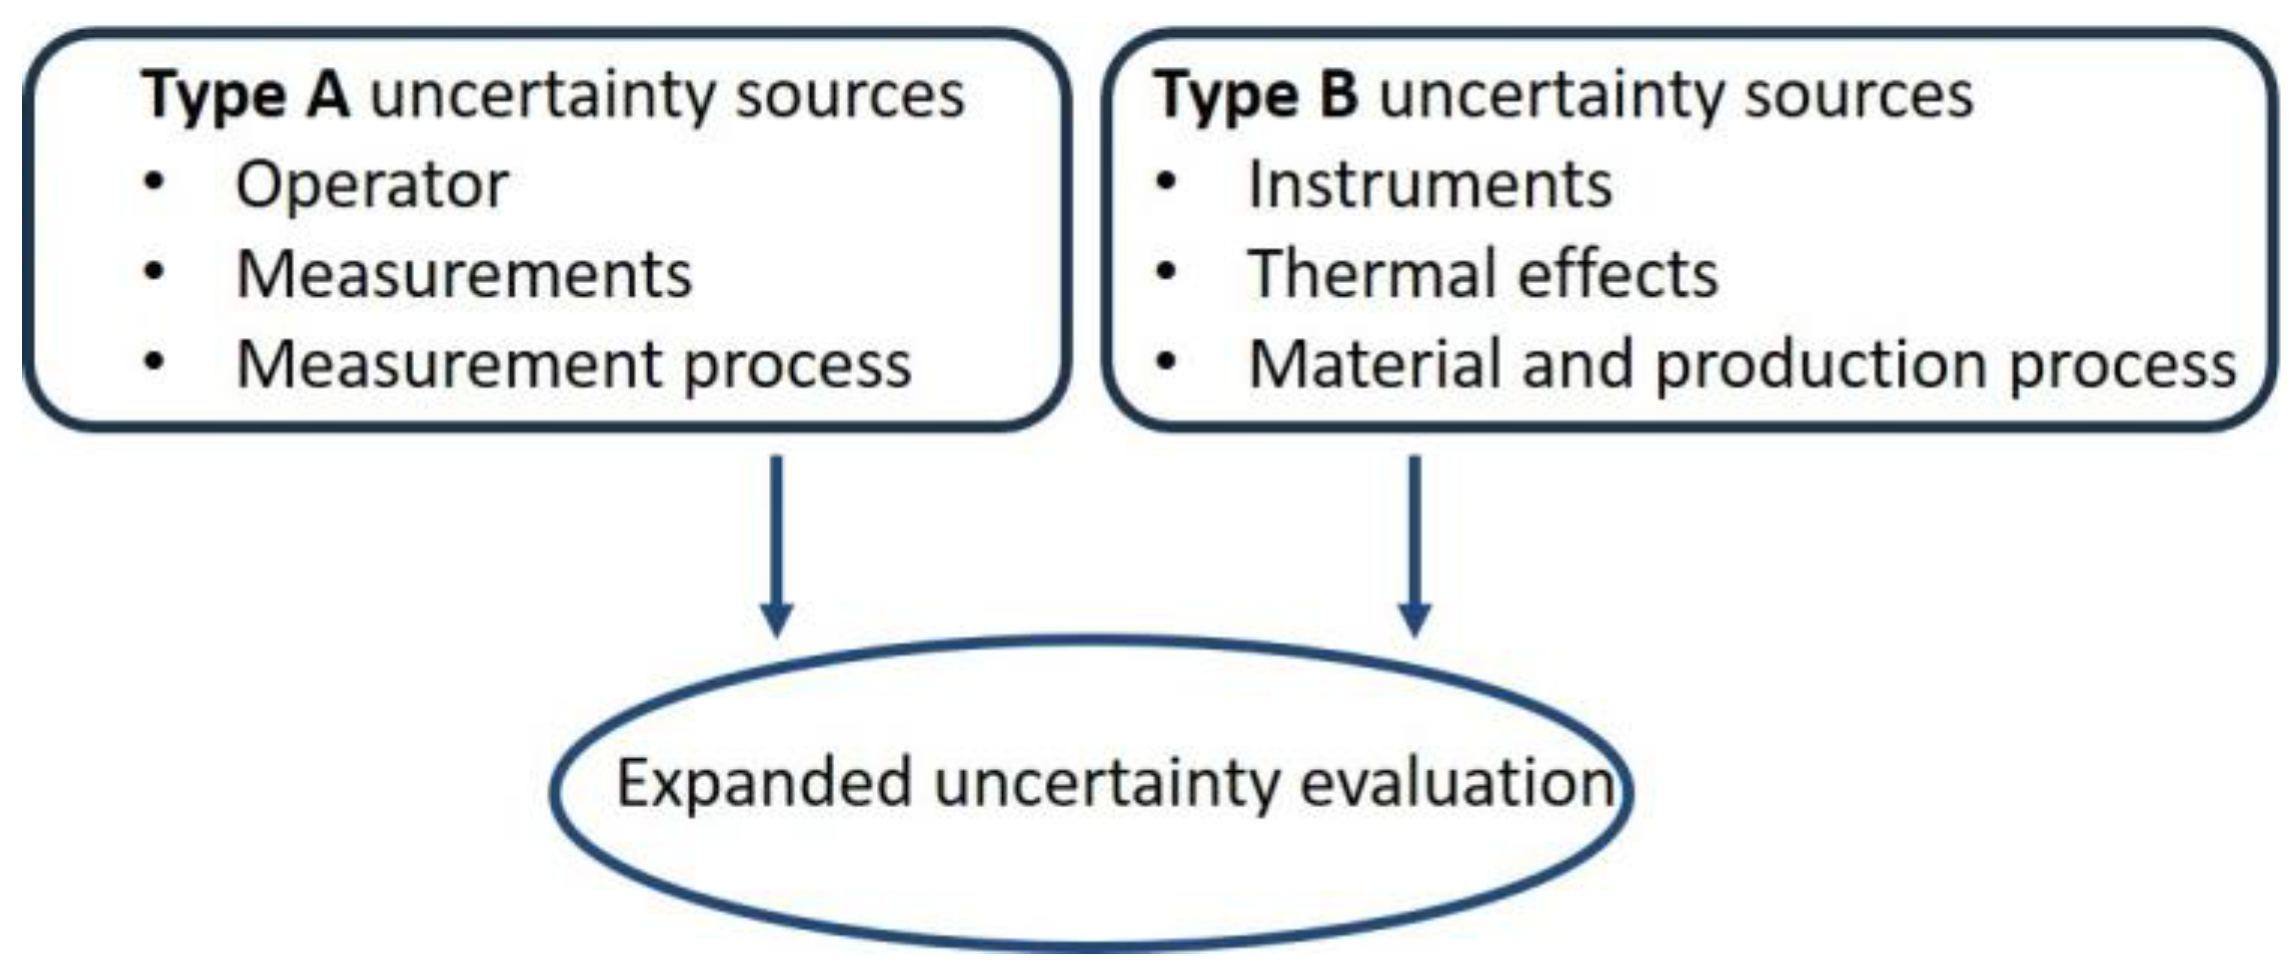
2. Elements of Uncertainty

According to the Guide to the Expression of Uncertainty in Measurement (GUM) [29], uncertainty is the parameter associated with the result of a measurement that characterizes the dispersion of the same values that could reasonably be attributed to the measurand; the knowledge of this parameter affects the evaluation of a manufacturing process and realized products.
The correct assessment of uncertainty is complex due to the multiple sources that could contribute to its definition, and these sources should be identified. Type A evaluation of uncertainty refers to the amount evaluated by statistical analysis of a series of observations, type B collects all uncertainties not assessable via statistical analysis. Both types contribute to the increase of a measure uncertainty and have to be considered to obtain more reliable results; in general, if the estimate of quantity (y) depends on independent different amounts (xi), the corresponding combined standard uncertainty uc(y) is given by:
u c y = i = 1 n u 2 ( x i ) ,
This uncertainty could be used to fix an interval with a defined probability to expect the measurand in comparison to a normal distribution by multiplying it by a coverage factor k, and so the expanded uncertainty is:
U = k u c ( y ) ,
which allows the evaluation of the interval y ± U, covering all the measurements y with a chosen confidence level expressed by the k factor.
Type A uncertainty sources are mainly related to the operator, measurement, and measurement processes.
Type B uncertainties are mainly due to the instruments, thermal effects, the adopted material batch, and the production process.
The flow chart in Figure 1 summarizes mainly uncertainty sources to be considered, and that, in the following section, will be stated for our study.

3. Materials and Methods

3.1. Machine, Material, and Instrument

The uncertainty evaluation of the optical measurements of micro-injected products was performed by considering micro-plates as a reference part. The design and dimensions (in mm) of the micro-plate cavity, the entire mold, and the realized sample are shown in Figure 2. The plate cavity has a rectangular geometry with a thickness of 100 µm (Figure 2a). Its design, showing a high aspect ratio, presents a challenging shape to be filled by the micro-injection molding process. The mold (Figure 2c) was micro-milled by the Evo machine (KERN, Eschenlohe/Murnau, Germany), while the micro-cavity (Figure 2b) was manufactured by the SX200 HP (SARIX, Sant’Antonino, Switzerland) micro-EDM machine; more details can be found in [30]. Due to this previous work, the chosen mold cavity surface roughness was selected to guarantee almost a partial cavity filling that could present a severe condition to evaluate.
Polymer micro-plates were manufactured via a micro injection molding machine, the DesmaTec FormicaPlast 1 K. This machine is characterized by a two-phase piston injection unit that allows precise process control with small shot weights in the 10–200 mg range. Pre-plastification and injection pistons have 6 mm and 3 mm diameters, respectively; the highest injection pressure, volume, and speed values are 3000 Bar, 150 mm3, and 500 mm/s, respectively.
The experiment’s chosen polymer is a semi-crystalline thermoplastic polyoxymethylene POM (BASF Ultraform N2320 003); its main properties are reported in Table 1. POM is particularly recommended in the micro-injection molding of samples with challenging dimensions and sizes for its suitable properties: high hardness, stiffness, toughness, and excellent dimensional stability. Before molding, POM was preconditioned at 110 °C for three hours, as suggested by the manufacturer.
Optical images and measurements were obtained via confocal microscope CSM 700 (ZEISS, Milan, Italy) by using the Z-scan acquisition technique with the following setting: objective lens 10× and z-resolution 1.5 µm for dimensional measurements; objective lens 100× and z-resolution 0.2 µm for surface measurements.
All the tests were carried out in a climatic chamber set at 20 °C and RH 50%. Measurements were performed the day after molding in the same working session to guarantee that samples were exanimated after experiencing the same ambient conditions.

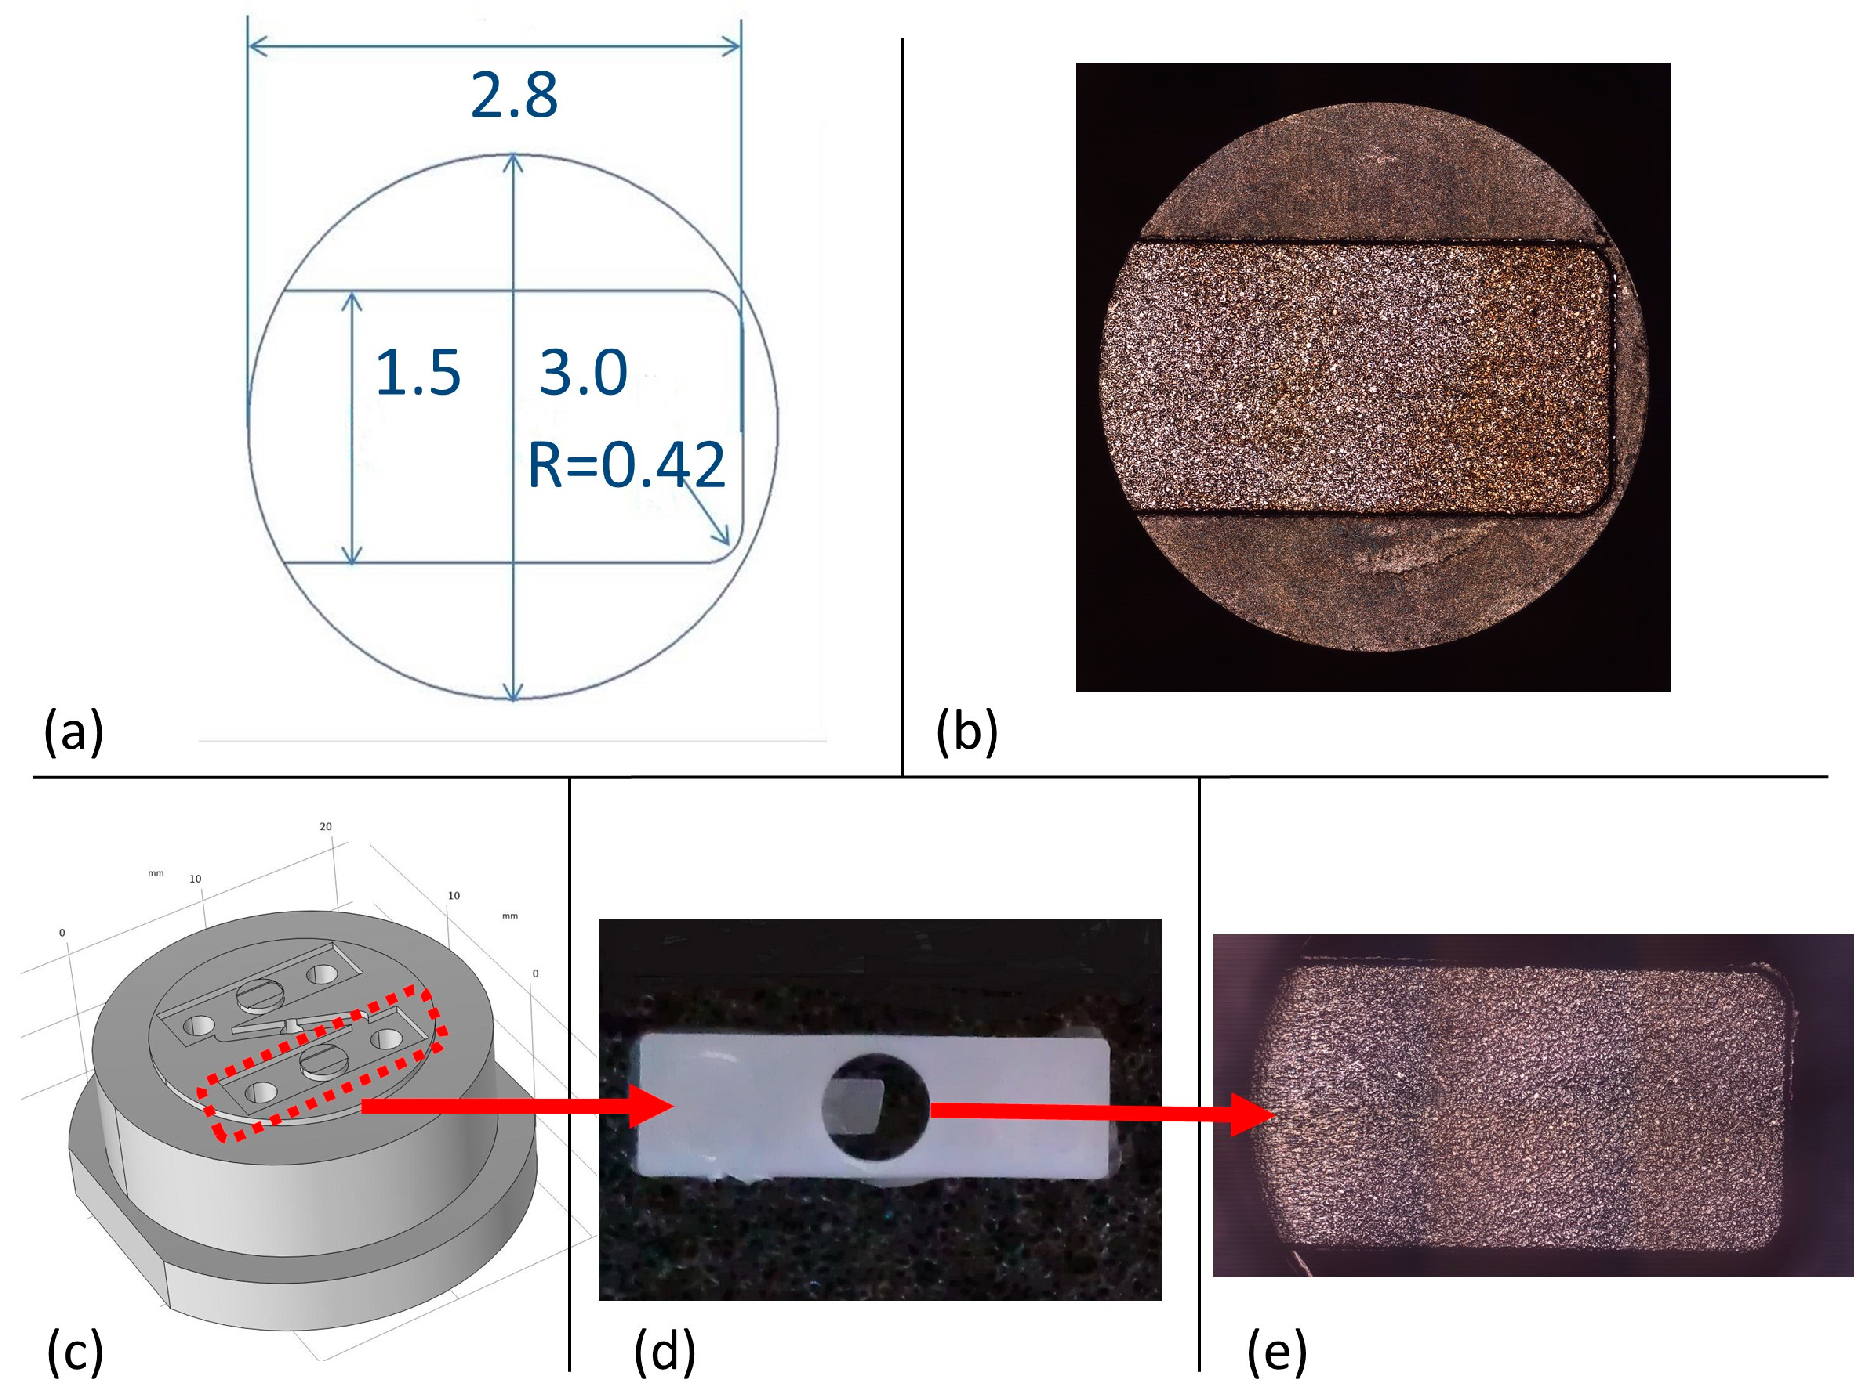
3.2. Methods of Measurements and Uncertainty Evaluation for One-Dimensional Measurement

The uncertainty evaluation has been performed by measuring the length of molded plates corresponding to the micro feature shown in Figure 1 along three axes parallel to the melt flow and expanding from the gate until the end of the filled section, along the upper and the bottom edges and the center of the micro-plate, as shown in Figure 3 and marked by red arrows. Measured values were checked for outliers by implementing Chauvenet’s Criterion. Successively, a Winsorization is applied to replace outliers due to measurement and acquisition errors [31].
The type A uncertainty sources that have been considered are the following:
  • u0, generally associated with the operator;
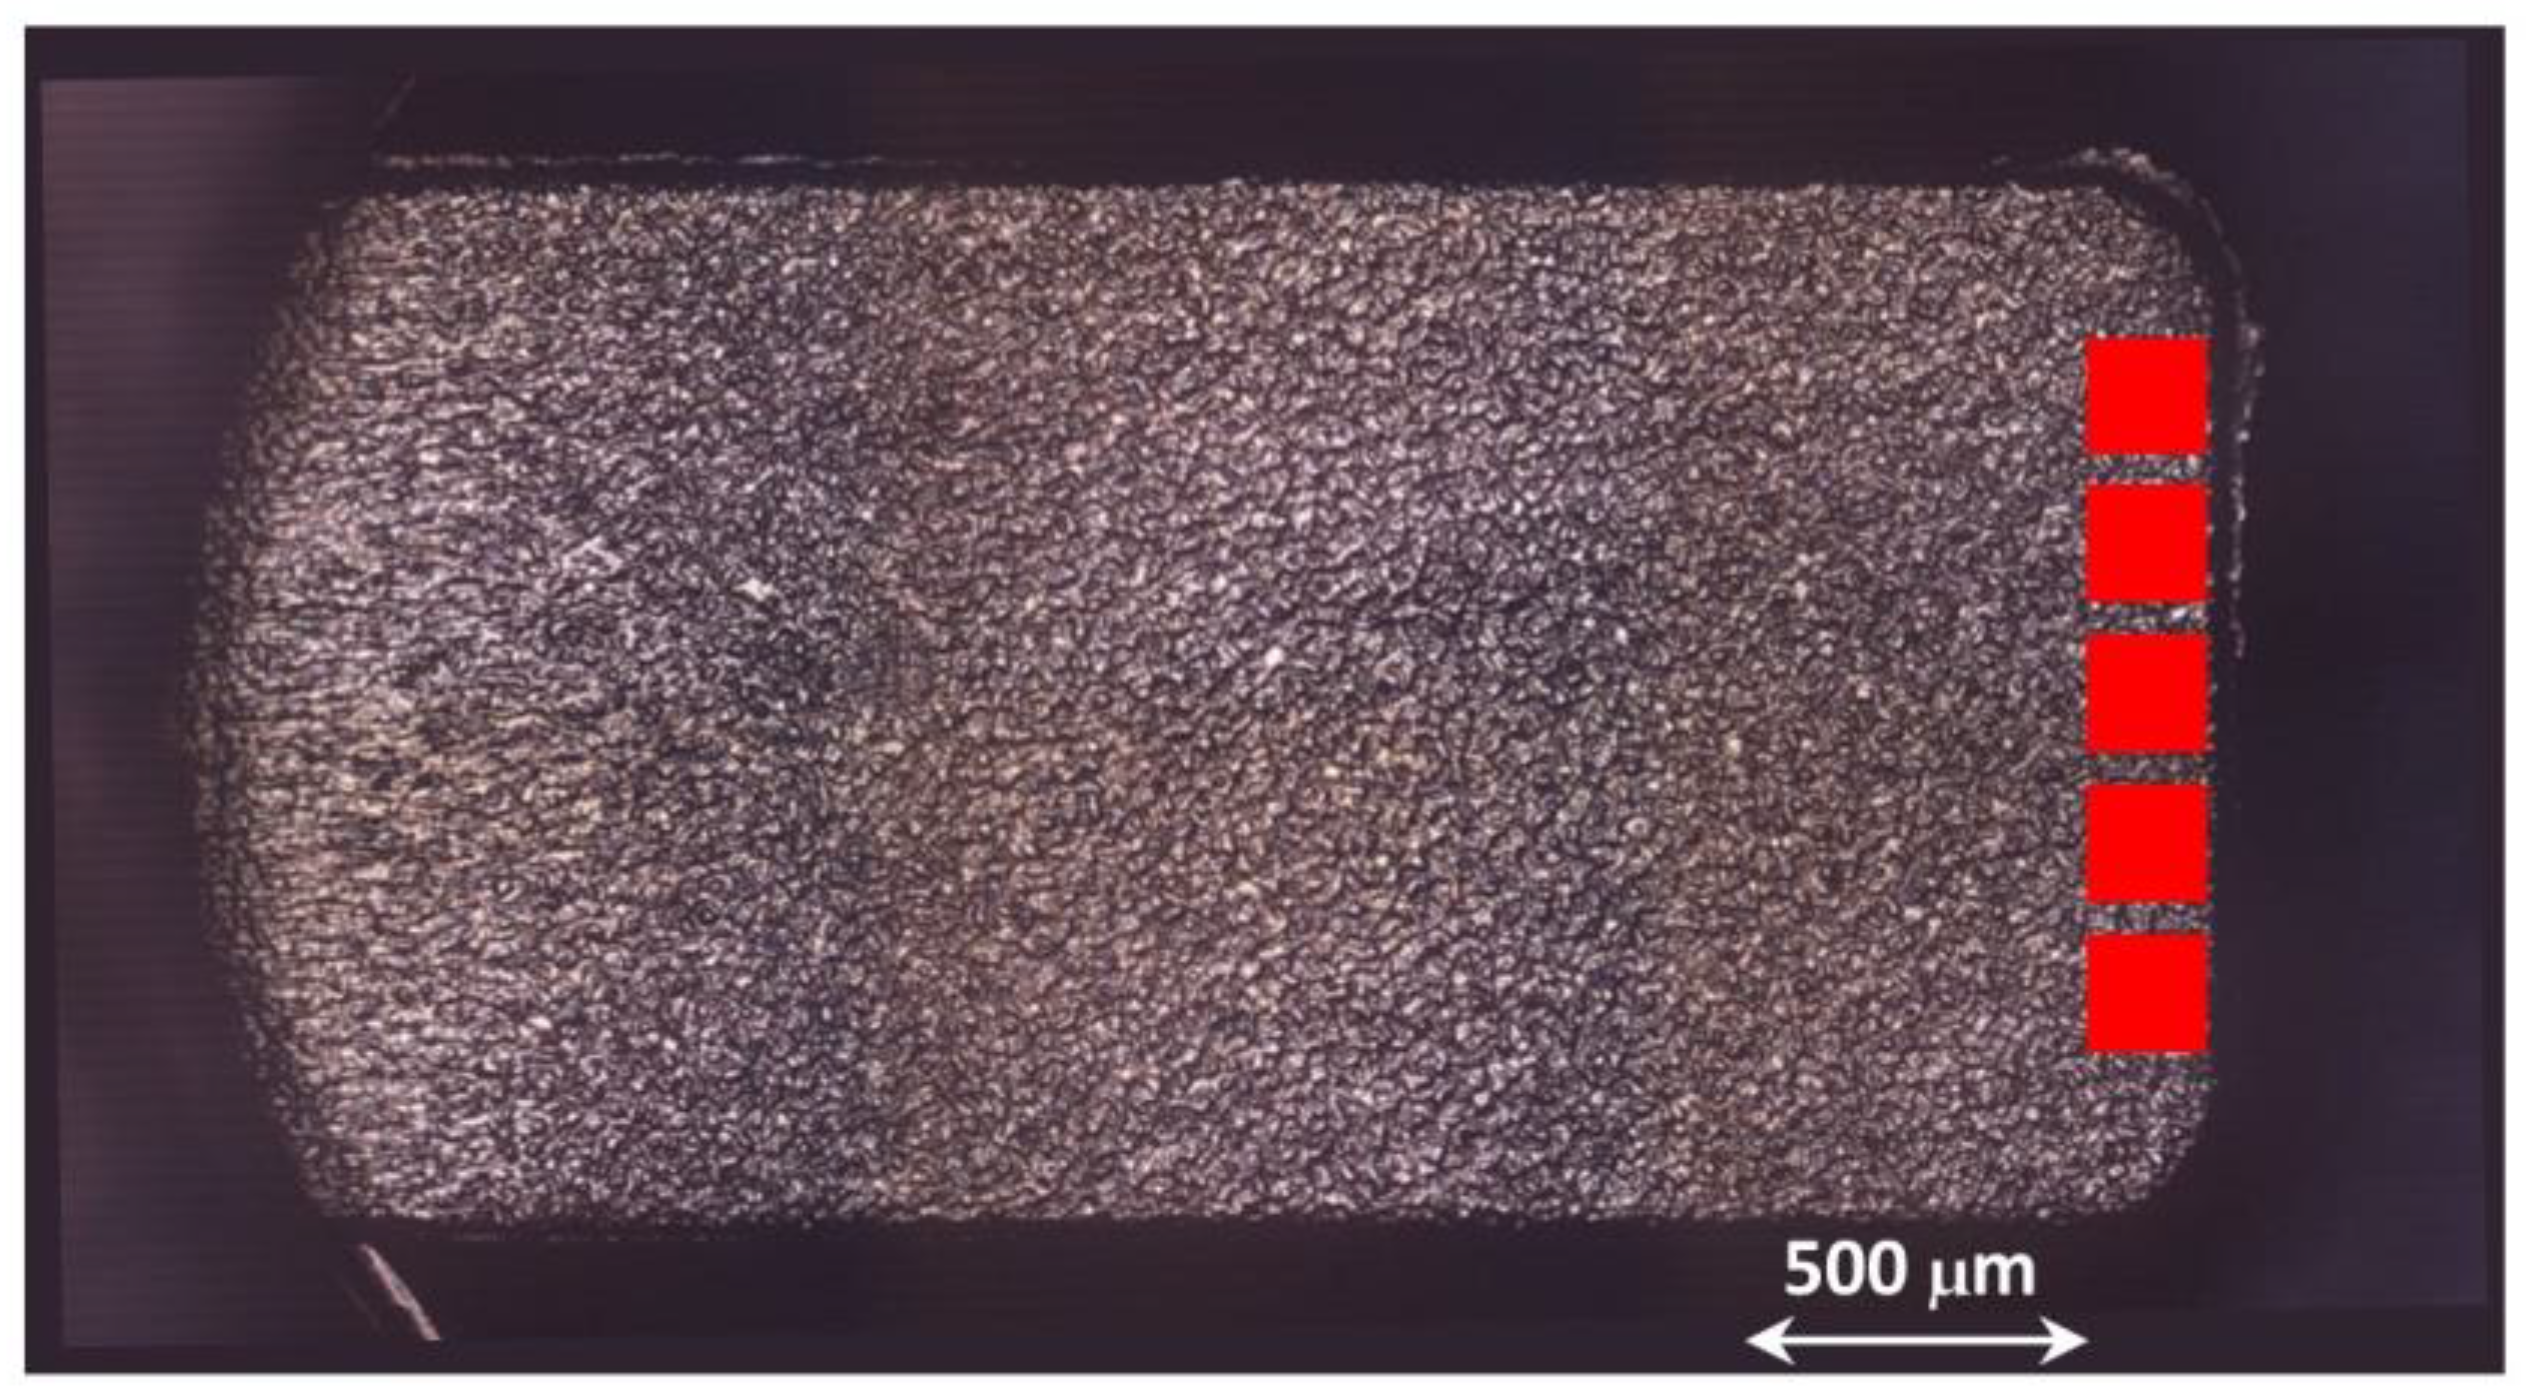
  • ux, due to the operator relative to the specific geometry to measure, and it is associated with the variable positions of the vertical lines (l and r Figure 2) needed for length measurements;
  • um, due to the length values measurement;
while the type B uncertainty sources are:
4.
ures, associated with the instrument resolution;
5.
ucal is the standard calibration uncertainty of the length standard;
6.
up represents the standard uncertainty related to the reference standard measurement;
7.
ut and uT, due to thermal effects;
8.
uL is associated with variation in the used material or production process.
The first source, uo, is associated with each operator’s variability in measuring samples. To take account of that, ten measures were performed on the upper edge of the same part, and the uncertainty was evaluated as the experimental standard deviation of the mean:
u o = s N ,
where s is the standard deviation of the N measures.
The second term of uncertainty collection introduced the variability in measurements due to the position of extreme settings (lines l and r at the start and end of the sample) needed for evaluating the sample length. To consider this contribution, each line was fixed and ten replicated measurements were performed on the same sample by varying one line at a time. The uncertainties due to the positions were evaluated also as u x 1 = s 1 N and u x 2 = s 2 N and could be considered independent of each other’s, then:
u x = u x 1 2 + u x 2 2 ,
The third contribution is the uncertainty due to the measurement (um) evaluated by the standard deviation on ten measurements on ten different samples for the three selected lengths: upper, central, and bottom ones parallel to the melt flow direction, as mentioned.
The fourth source is the instrument resolution (ures) that was evaluated as a rectangular distribution depending on the resolution r of the manufacturer datasheet:
u r e s = r 2 3 ,
The fifth and sixth sources are referred to the calibration uncertainty of the length standard and the standard uncertainty related to the measurement procedure, respectively. The former is a certified data, and the latter is calculated as the standard deviation of ten repeated measurements on the calibrated standard.
The seventh contribution is the thermal effect, which can affect the uncertainties, too. Thermal expansion was considered both occurring during the several days used for performing all the measurements uT and during the acquisition time of a single measurement ut. Thermal expansion ΔL was evaluated as:
L = L α T ,
where α is the material linear thermal expansion coefficient. Successively, ΔL was used to evaluate the uncertainty as half-amplitude of a rectangular distribution:
u T = L T 2 3 ,
u t = L t 2 3 ,
The last uncertainty contribution is due to the production process and to the different material batches used during production; it was evaluated as a rectangular distribution with the difference between the maximum and minimum size measured for the length as:
u L = L m a x L m i n 2 3 ,
Finally, the expanded uncertainty was evaluated with the factor k = 2 for a 95% confidence level as:
U = 2 u 0 2 + u m 2 + u c a l 2 + u p 2 + u r e s 2 + u T 2 + u t 2 + u L 2 ,
Hence, the value of the considered quantity, the sample length, can be regarded as the sum of the mean value ± the expanded uncertainty U:
L = L ¯ ± U ,

3.3. Method of Measurements and Uncertainty Evaluation for Surface Measurement

In addition, to evaluate the uncertainty sources’ contribution in measuring one-dimensional quantity (sample length, as shown), the uncertainties were also assessed by measuring a surface characteristic such as the surface roughness of the sample. Figure 4 shows the five red areas used for measurement; each area is equivalent to the microscope field of view, 117 µm × 94 µm, at the observation setting. These areas are the last filled regions by melt flow. Thus, they present the most variable surface characteristics due to the difficulty of the polymer in flowing and correctly filling the last thin section before solidifying [32].
The uncertainties associated with surface roughness measurement were evaluated following ISO standard (15530-3) and successfully applied to optical measurements in [15]. The combined uncertainty related to the measurements performed with confocal microscope uc can be expressed as:
u c = u c a l 2 + u p 2 + u r e s 2 ,
where:
  • ucal is the standard calibration uncertainty of the roughness standard;
  • up represents the standard uncertainty related to the measurement procedure and is calculated as the standard deviation of ten repeated measurements on the calibrated standard;
  • ures is the resolution uncertainty related to the confocal microscope’s declared 1 nm vertical resolution.
The expanded uncertainty USa can be evaluated as:
U S a = k × u c 2 + u S 2 ,
where k is the coverage factor depending on the chosen confidence level, and uS is the standard deviation of surface roughness (Sa) measured on ten samples.

4. Results and Discussion

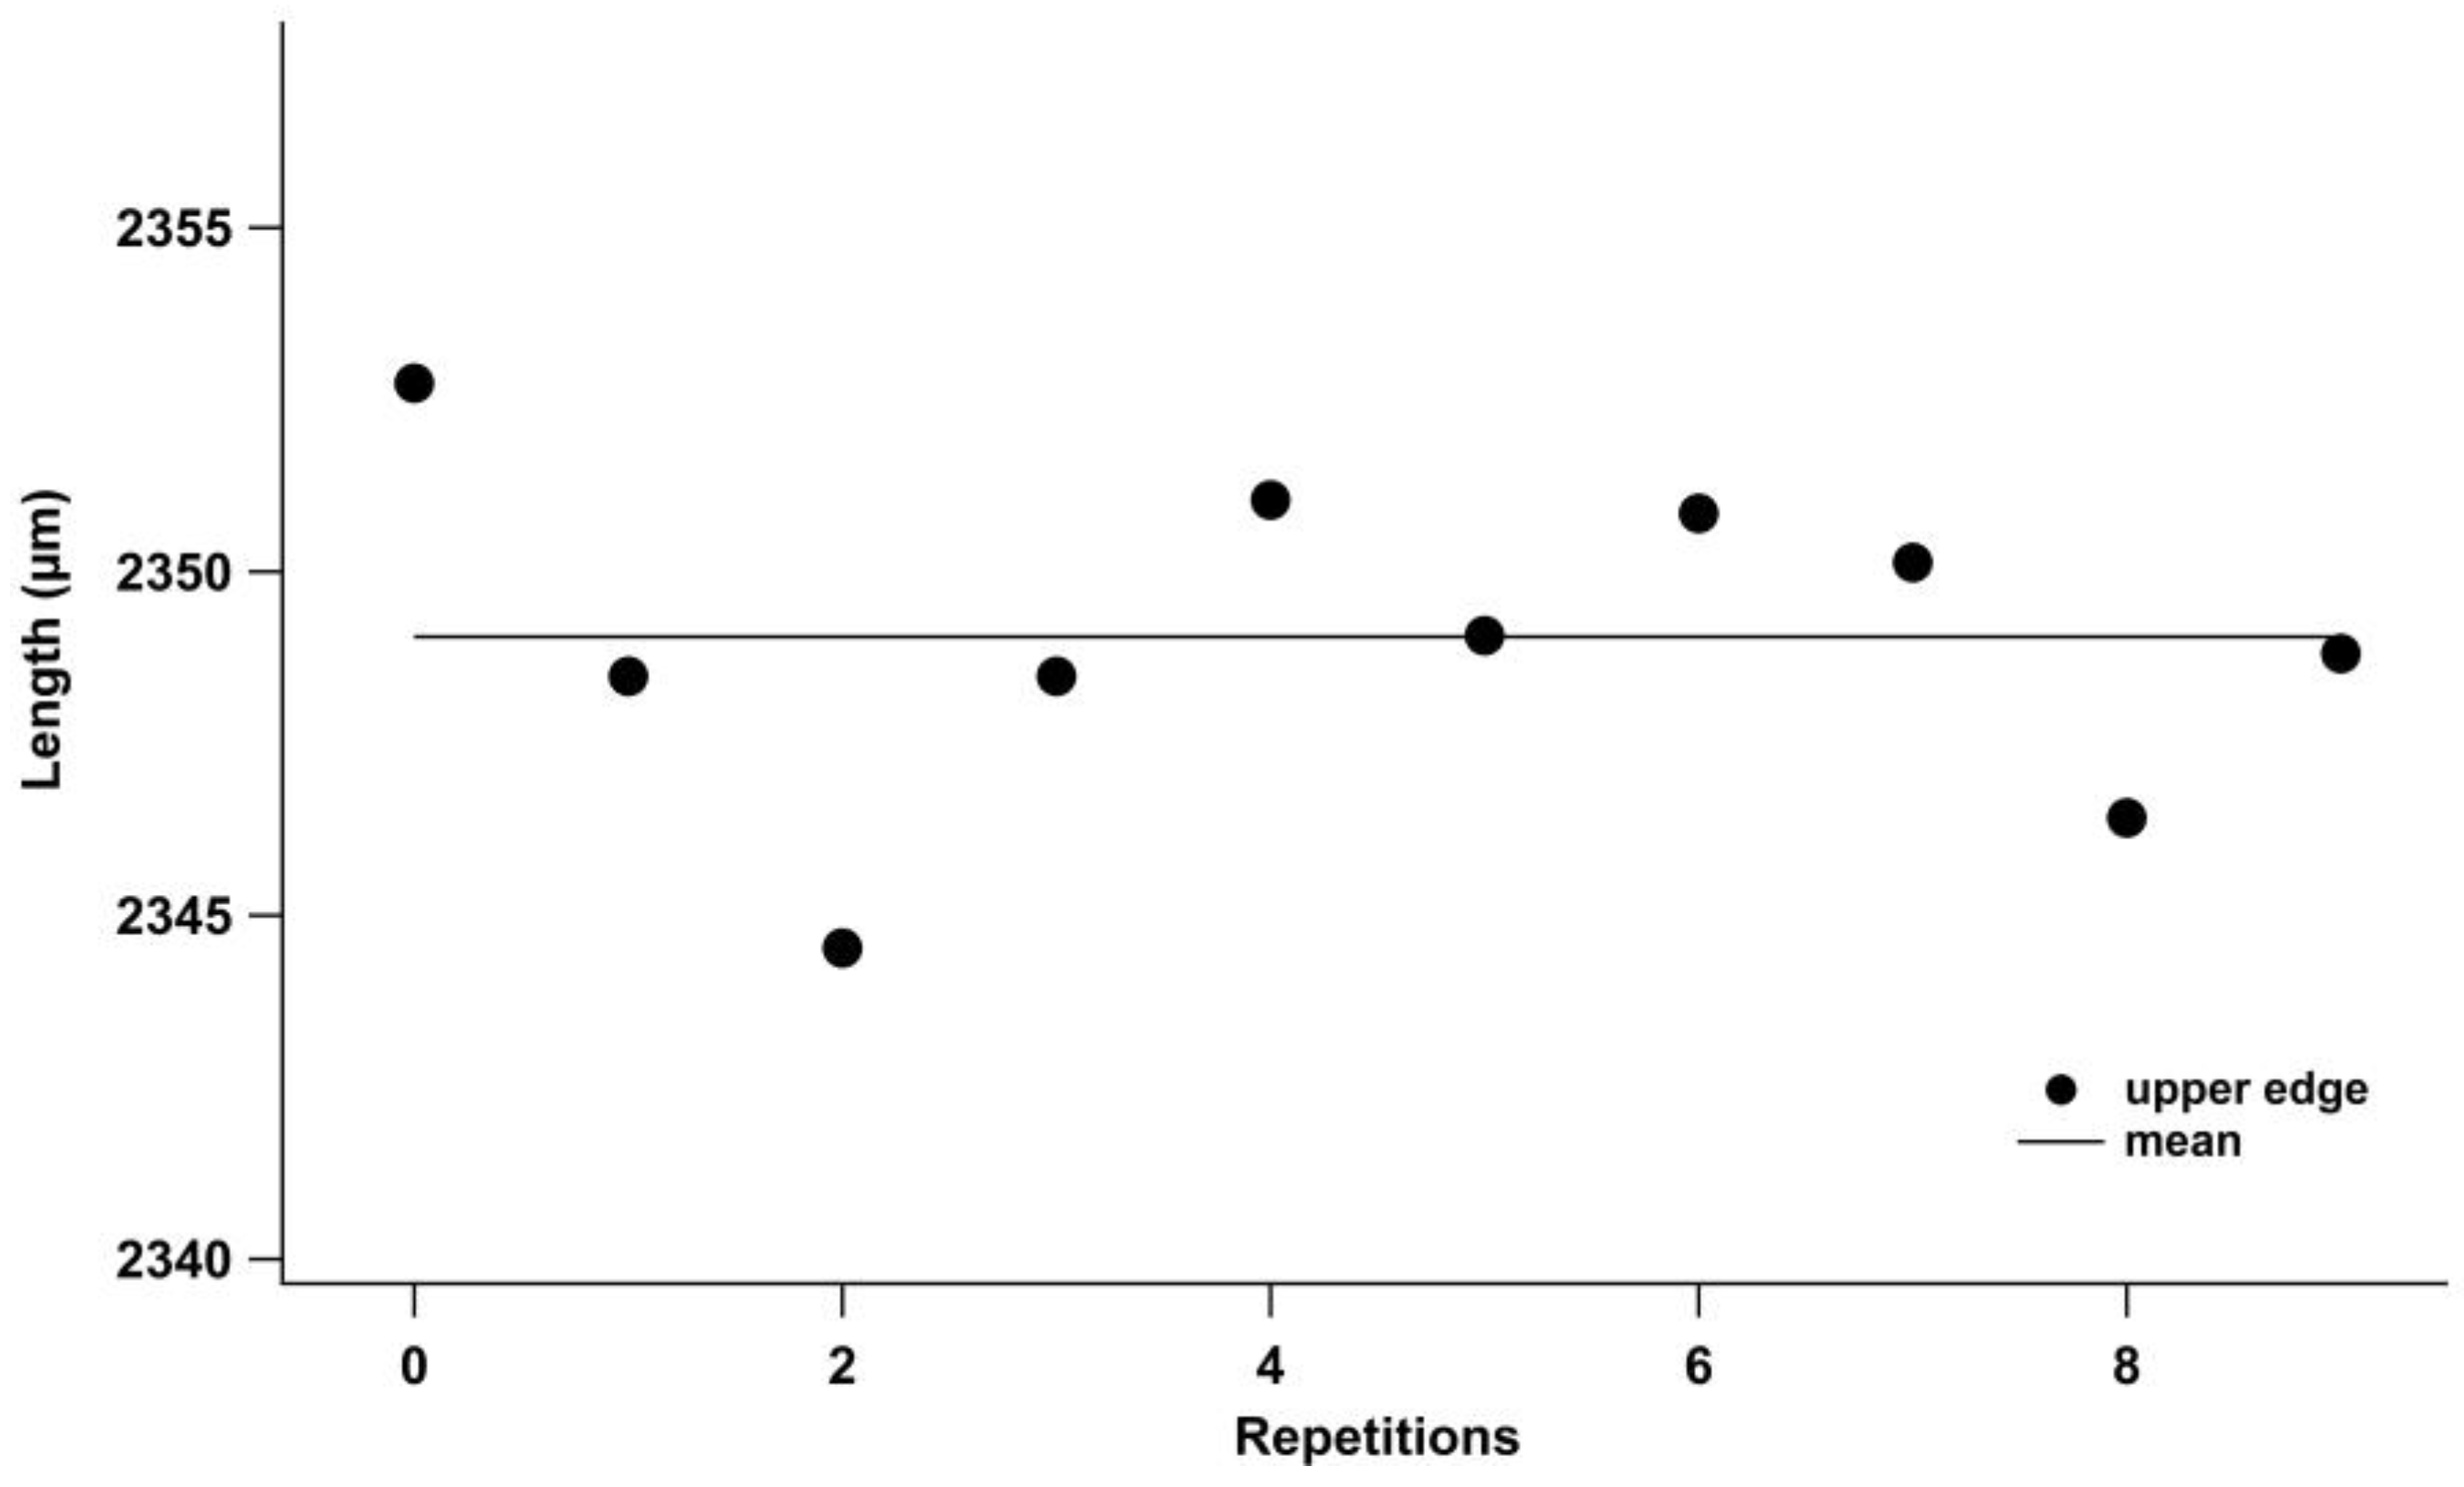
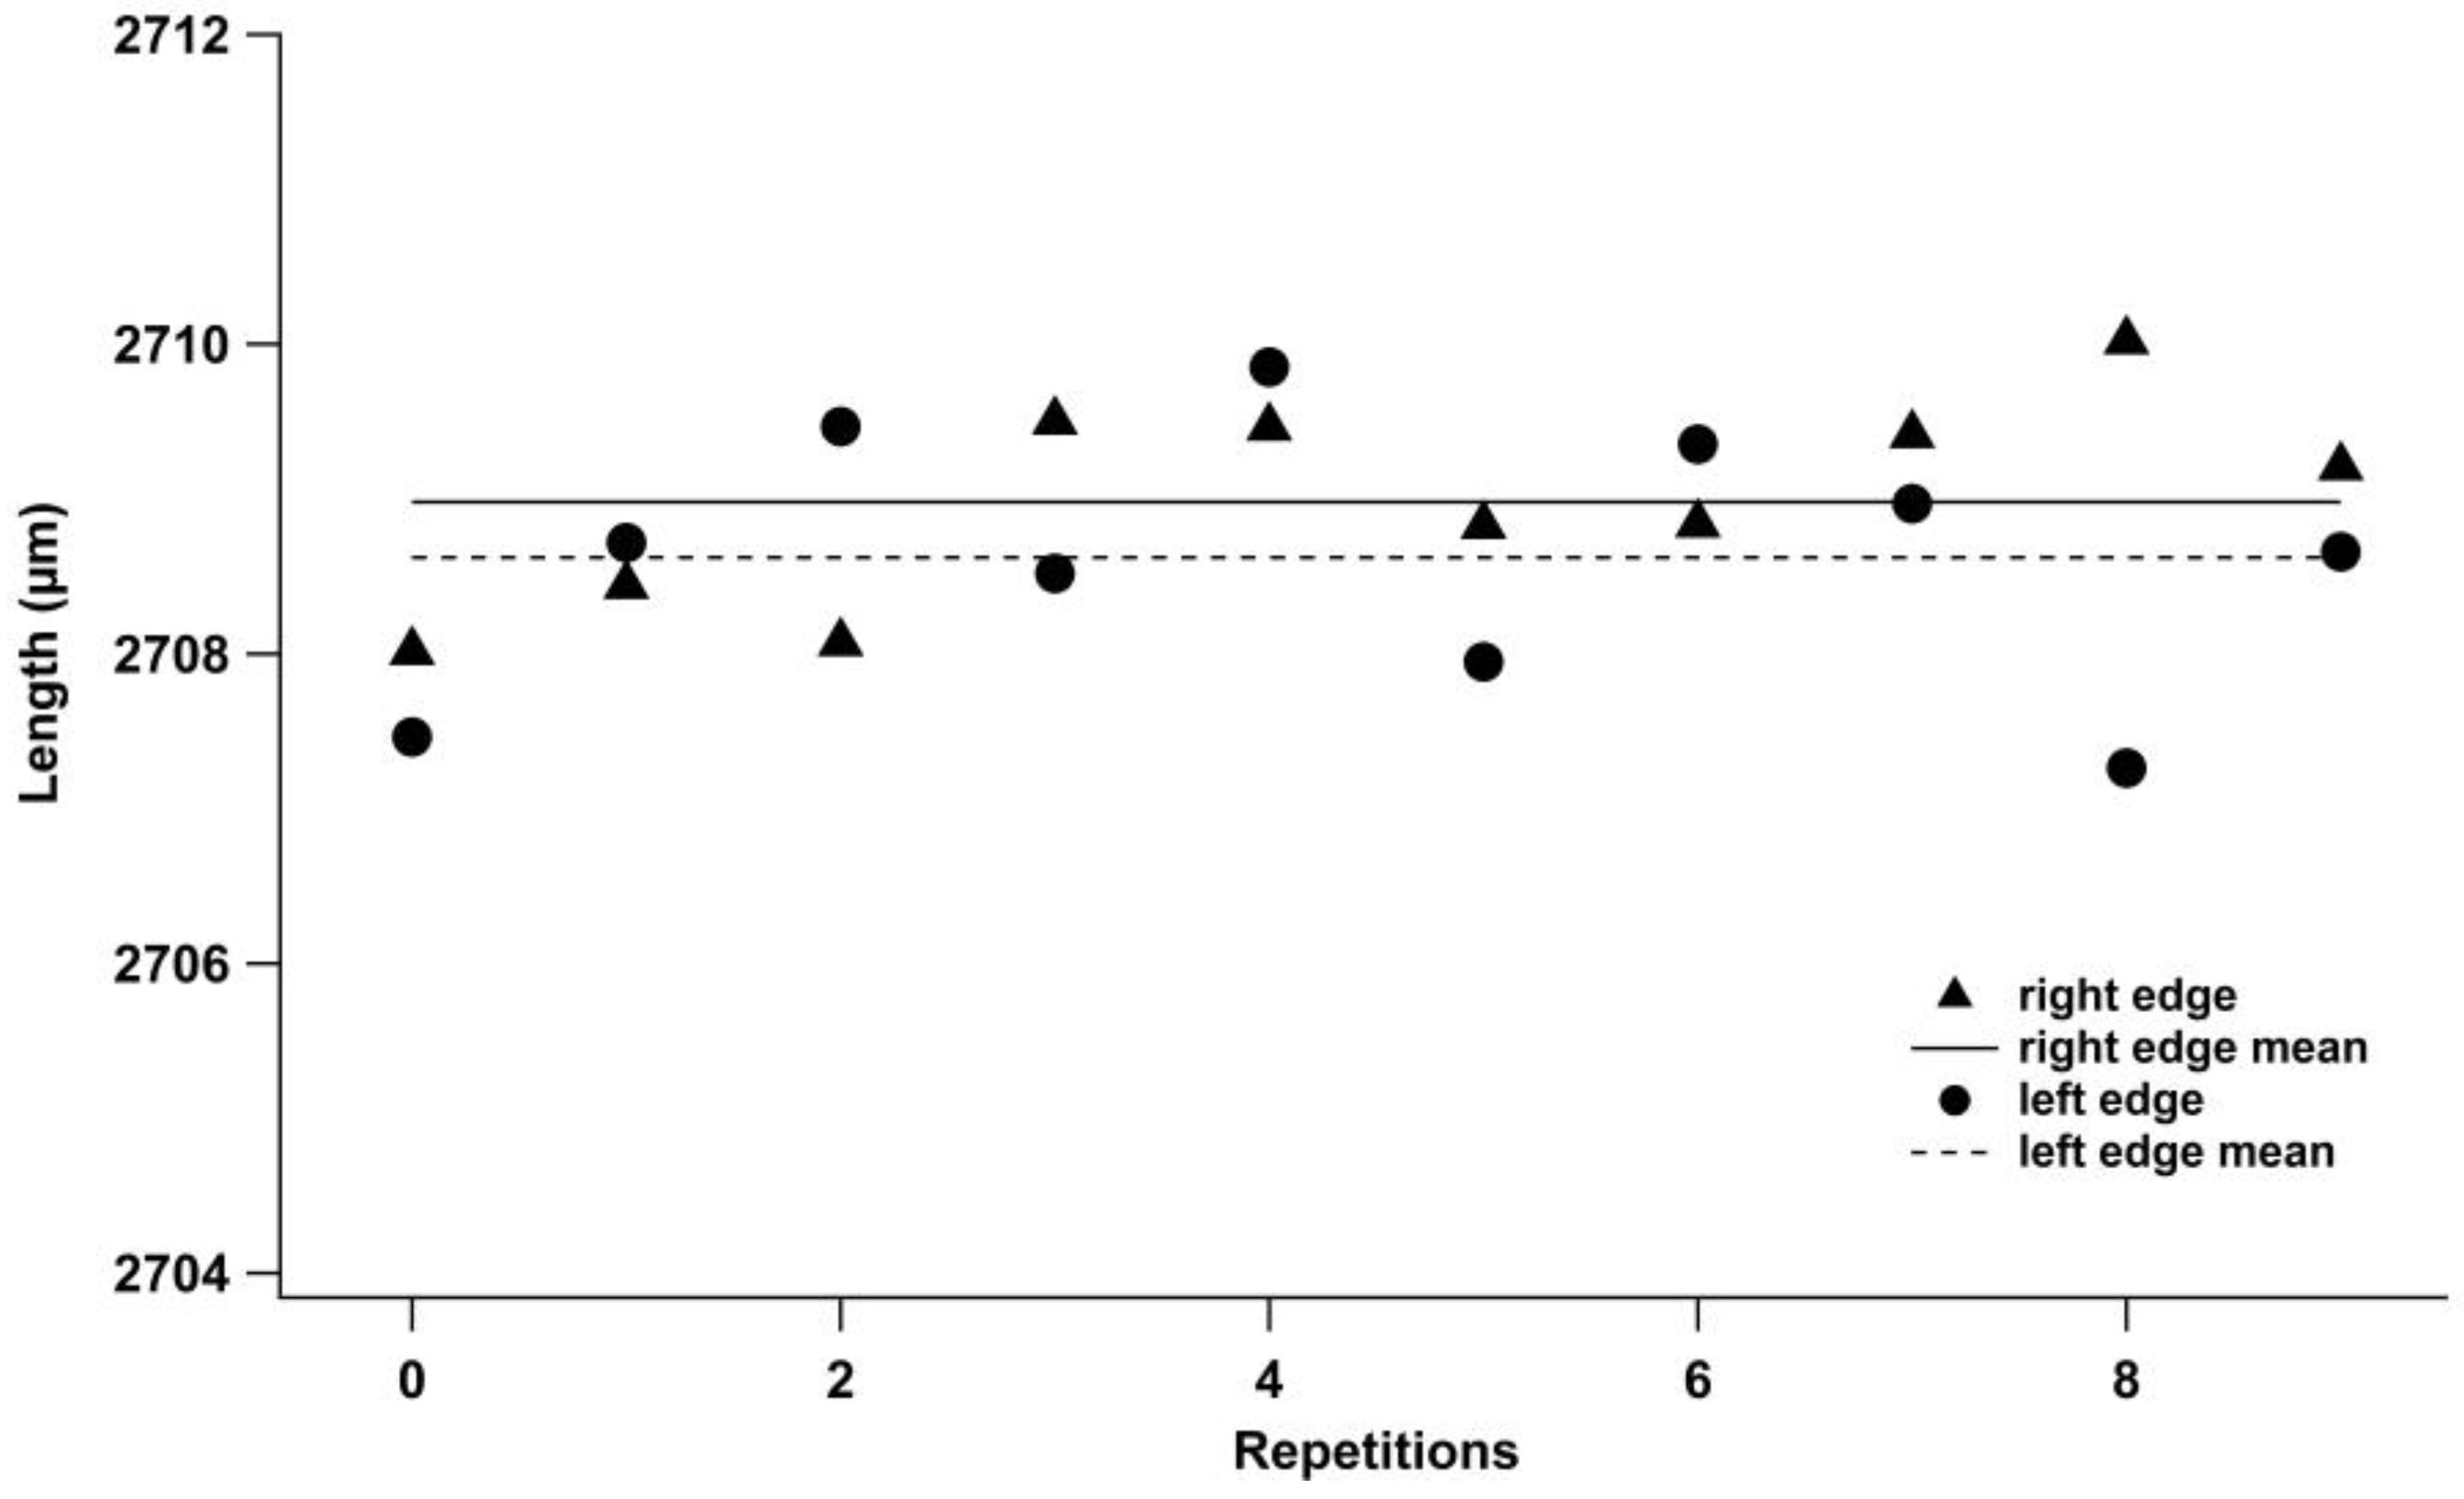
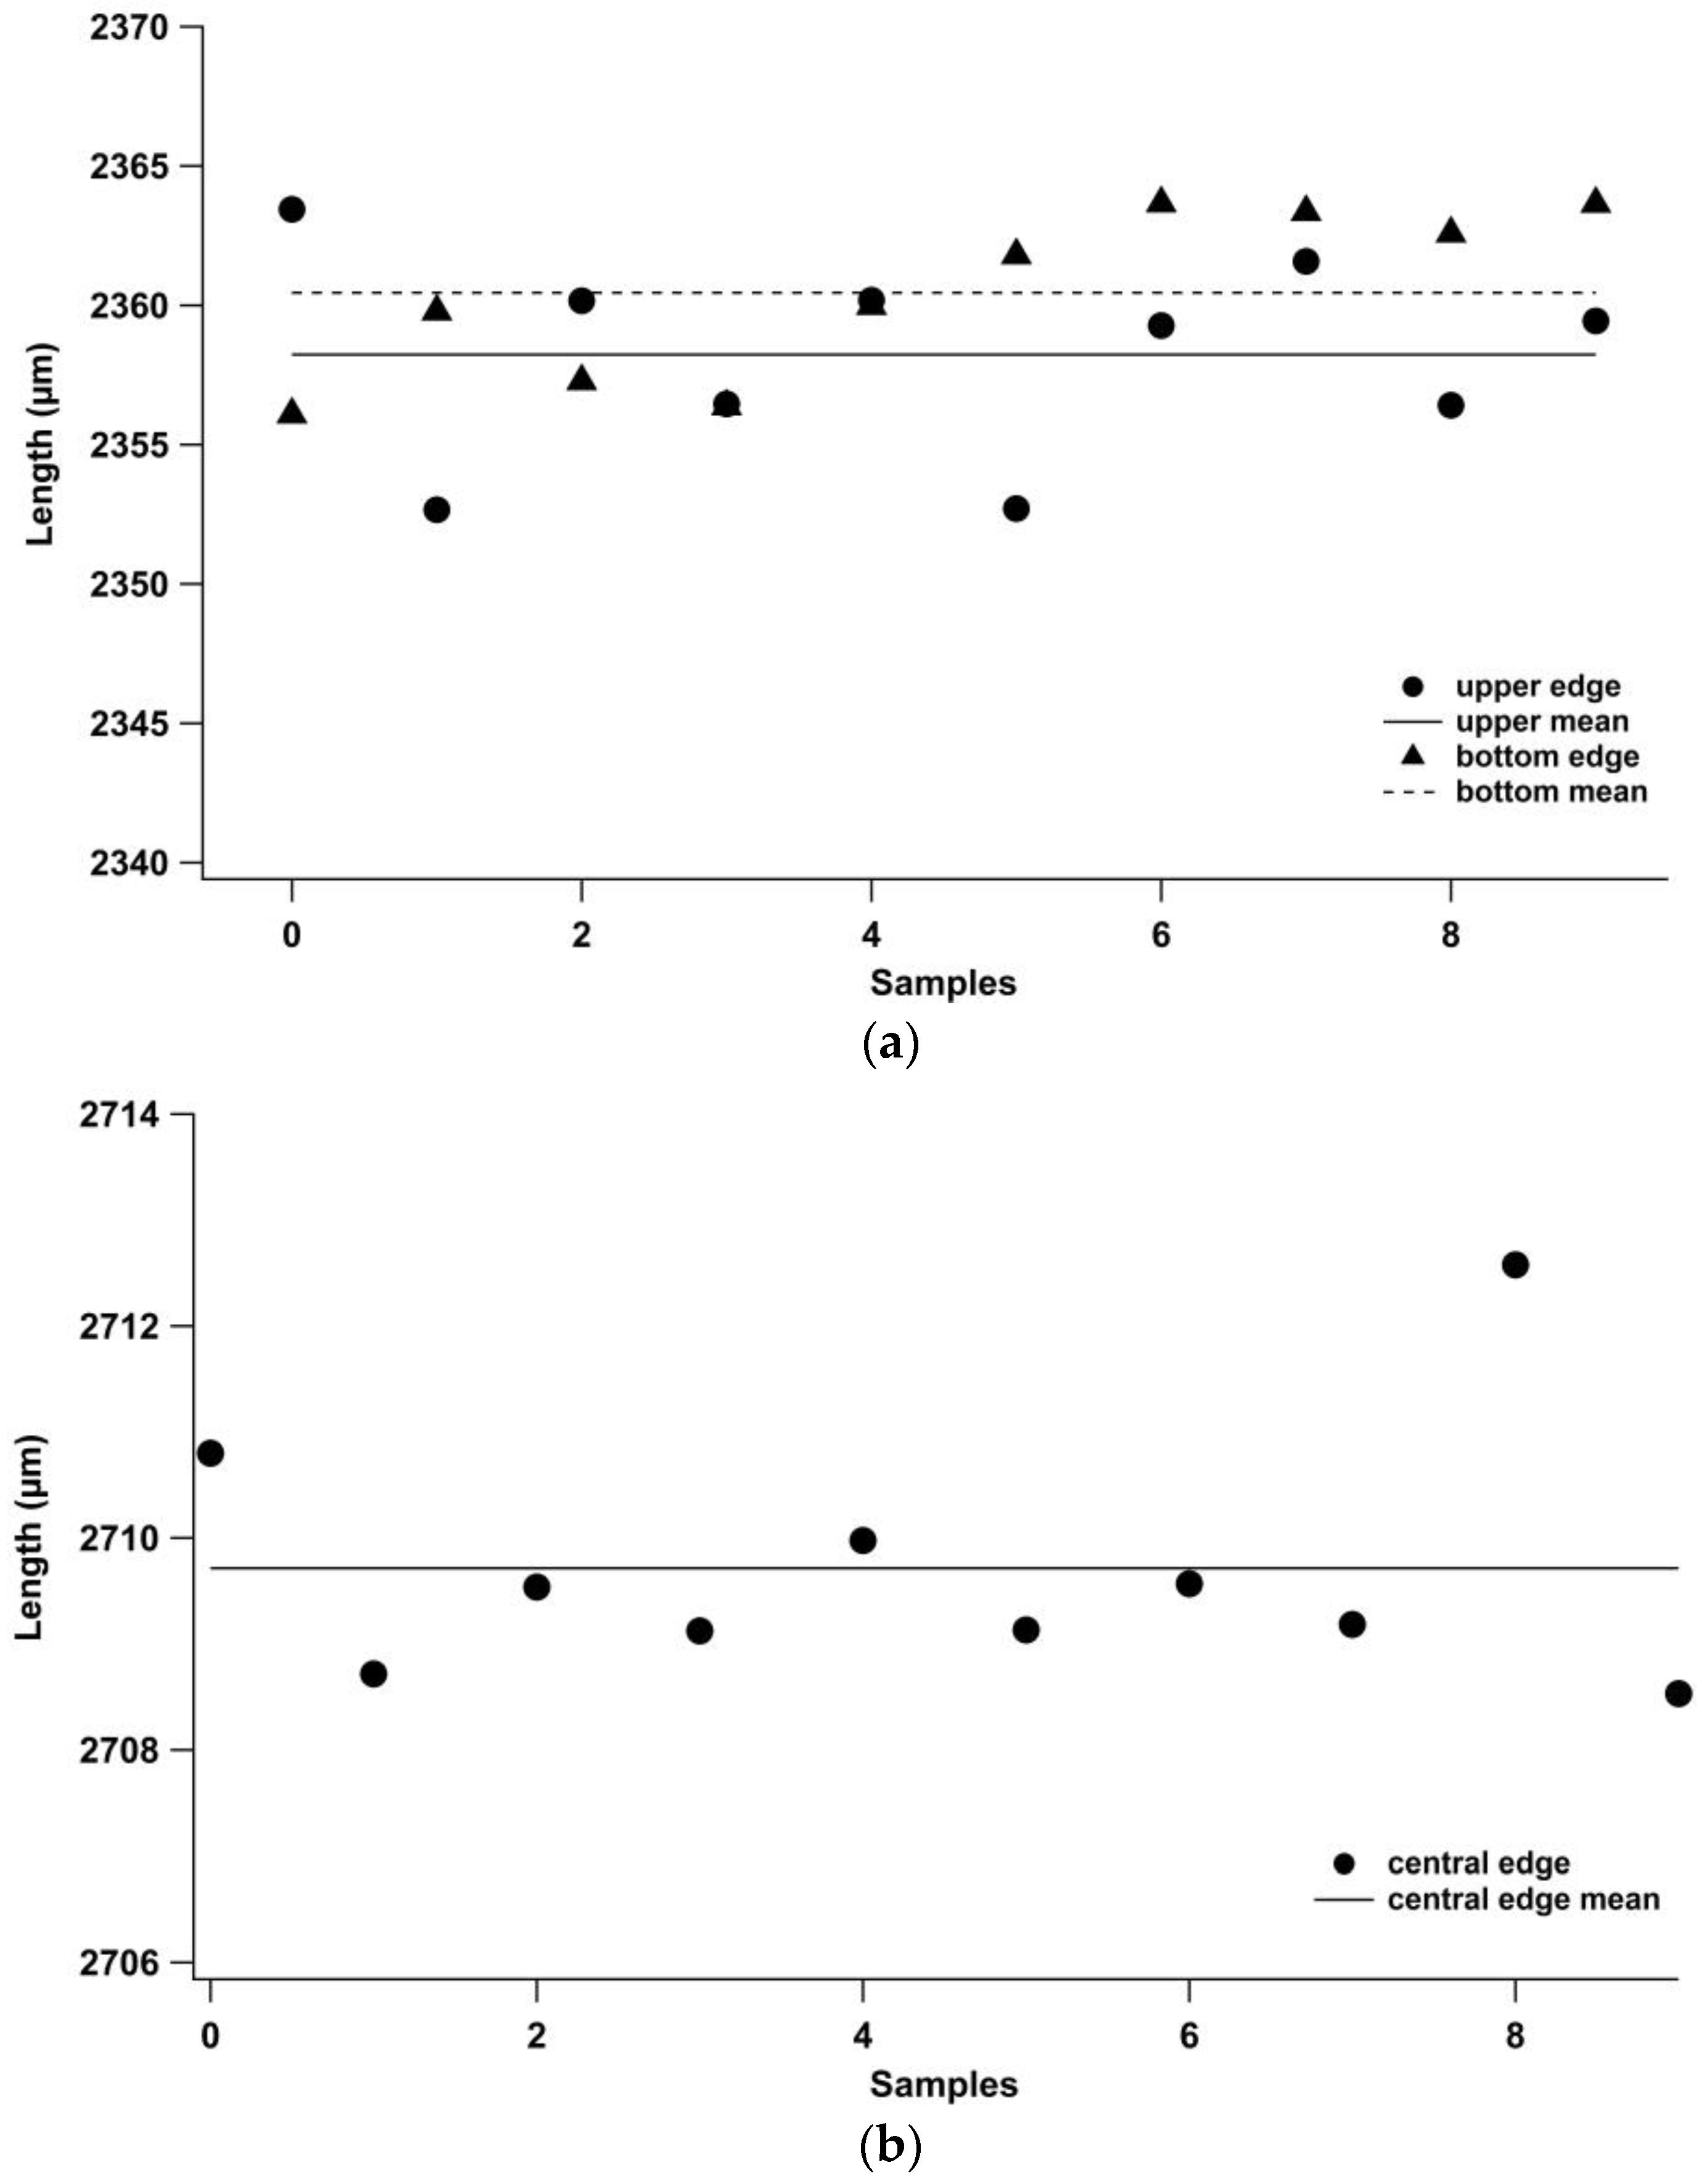
4.1. Uncertainties in Length Measurements, Type A

The first uncertainty is due to the operator and was evaluated by the lengths of 10 repeated measurements on a single sample, randomly chosen, along the upper edge (Figure 5); the mean value and standard deviation are 2349.054 µm and 2.360 µm, respectively, and the evaluated uncertainty is u0 = 0.746 µm. It must be pointed out that also for an expert operator, the absolute measured value ranges from about 10 µm, almost ten times higher than the spatial x–y resolution (0.909 µm) of the microscope in the adopted setting. This gap is mainly due to the difficulty in distinguishing the edges of the sample to measure. The last filled part of the micro-plate has many irregularities due to the polymer flow’s efforts to fill the cavity when it has increased its density due to the forthcoming freezing. These irregularities exhibit different slope surfaces that do not allow a regular light reflection under the microscope and contribute to making undefined part edges. To better consider this difficulty as an uncertainty source, measurements were performed by varying reference lines on the edges.
Figure 6 shows the repeated measurements on a single sample performed by fixing one extreme line and varying the other and vice versa, named left (l) and right (r), respectively. This procedure accounts for the uncertainties that could arise from slight variations in positioning the cursor on the screen to define the limit of the sample. The mean values obtained are 2708.621 µm and 2709.980 µm, respectively, with the corresponding standard deviation of 0.853 µm and 0.660 µm. The related uncertainties are 0.270 and 0.209, giving a combined uncertainty of ux = 0.341 µm. The patterns do not show a trend; hence, the independence of the measurements could be accepted. It is to be noted that this uncertainty is less than the previous one, which is also due to the operator.
Then, the lengths of ten randomly chosen samples were measured and displayed in Figure 7; these samples were measured along the upper, bottom (a), and center (b) lines. Results are summarized in Table 2. It is to be noted that the standard deviations of the length measured along the edge having a filler radius (upper and bottom) are more significant than those evaluated on the central line due to the difficulties of fixing the reference setting during measurements at the rounded edge. However, the corresponding uncertainties are more effective than the just considered ux, accounting for the positioning during the measuring. Hence, it could account for the real variation of the sample size along the edge; the progress of the melt flow on the edges is certainly more hindered in comparison to the center due to the presence of the mold walls (melt flow fountain is the progress model of the flow in the cavity) and hence a more considerable variability in its paths is expected.
The lengths measured along the bottom line seem to show a trend that can invalidate the randomness hypothesis; however, the contribution is of the exact quantities for the lengths of other lines, so it does not interfere with it.
This last evaluated uncertainty is usually the main factor that is considered in assessing the quality of a product; in the case study, the length of the sample, but it is significant to note that the obtained uncertainties (Table 2) are comparable to that due to the operator and evaluated on repeated measurements on the same sample. This occurrence shows how significant several sources’ contributions are in considering a more reliable uncertainty for a quality characterization of a product.
Finally, ten repeated measurements were performed on a certificate length standard, and the corresponding standard deviation was considered source uncertainty due to the instrument used to evaluate a known quantity.

4.2. Uncertainties in Length Measurements, Type B

The CSM Zeiss confocal microscope, with the reported previously adopted setting, has a resolution of 0.909 µm, and the corresponding uncertainty evaluated by a rectangular distribution is ures = 0.2624 µm; this quantity is less than the previously evaluated one. Also, ucal could be classified as type B measurements as it is a certified data of the adopted length reference equal to 1 µm.
Table 3 reports data necessary for evaluating the uncertainties uT due to thermal variation ∆T. During the days when experimental work was performed, ambient temperature values of the laboratory varied by ±1 degree, and the corresponding length variations with the thermal expansion coefficient α of the used polymer were evaluated. The obtained uncertainties are less than the previously evaluated ones but of the same size order, and then they could not be excluded in the expanded uncertainty evaluation. The uncertainty due to thermal variation during the acquisition time of the image of a single sample ut can be neglected by assuming a deviation of 0.25 °C during the acquisition, a minute at most. If the sample size could vary in this interval, ut would be 0.0042 µm and one order lower than uT.
Variations associated with the production process and the used material (different batches) could introduce uncertainties, too. Table 4 shows the evaluated uL by using a rectangular distribution. The extreme values of the range to which all measured length values belong are considered for this evaluation; also, in this case, the central measured value is less affected by uncertainty. The estimated uncertainties are more significant than the previously evaluated ones.

4.3. Expanded Uncertainty

The combined uncertainty was evaluated then as follows:
u c = u o 2 + u m 2 + u x 2 + u c a l 2 + u p 2 + u r e s 2 + u T 2 + u L 2 ,
All the uncertainties contributing to the total sum are reported in Table 5.
The source that significantly influences the uncertainties is associated with the production process and the material uL (Table 4). Thermal variations uT are less influential on the condition that the temperature is controlled. The combined uncertainties uc are listed in Table 5, too, and they are larger than those obtained by evaluating only the standard deviations on measurements.
Finally, the corresponding expanded uncertainties were evaluated by adopting a coverage factor k = 2 that allows to reach a confidence level of 95%:
  • upper line: U = 7.8 µm;
  • bottom line U = 6.3 µm;
  • central line U = 4.8 µm.
With these values, the sample length values are as follows:
  • Lupper = 2358 ± 8 μm;
  • Lbottom = 2360 ± 6 μm;
  • Lcenter = 2708 ± 5 μm.
In the worst case, the evaluated interval corresponds to a measurement range four times larger than the one obtained by considering only the standard deviation as uncertainties on the performed measurements; in this case, it will obtain Lupper = 2358 ± 2 μm. This rough estimate of the uncertainty could adversely influence the results by giving a wrong tolerance range for a functional application or making process optimization more difficult due to the incorrect assessment of the process variance.

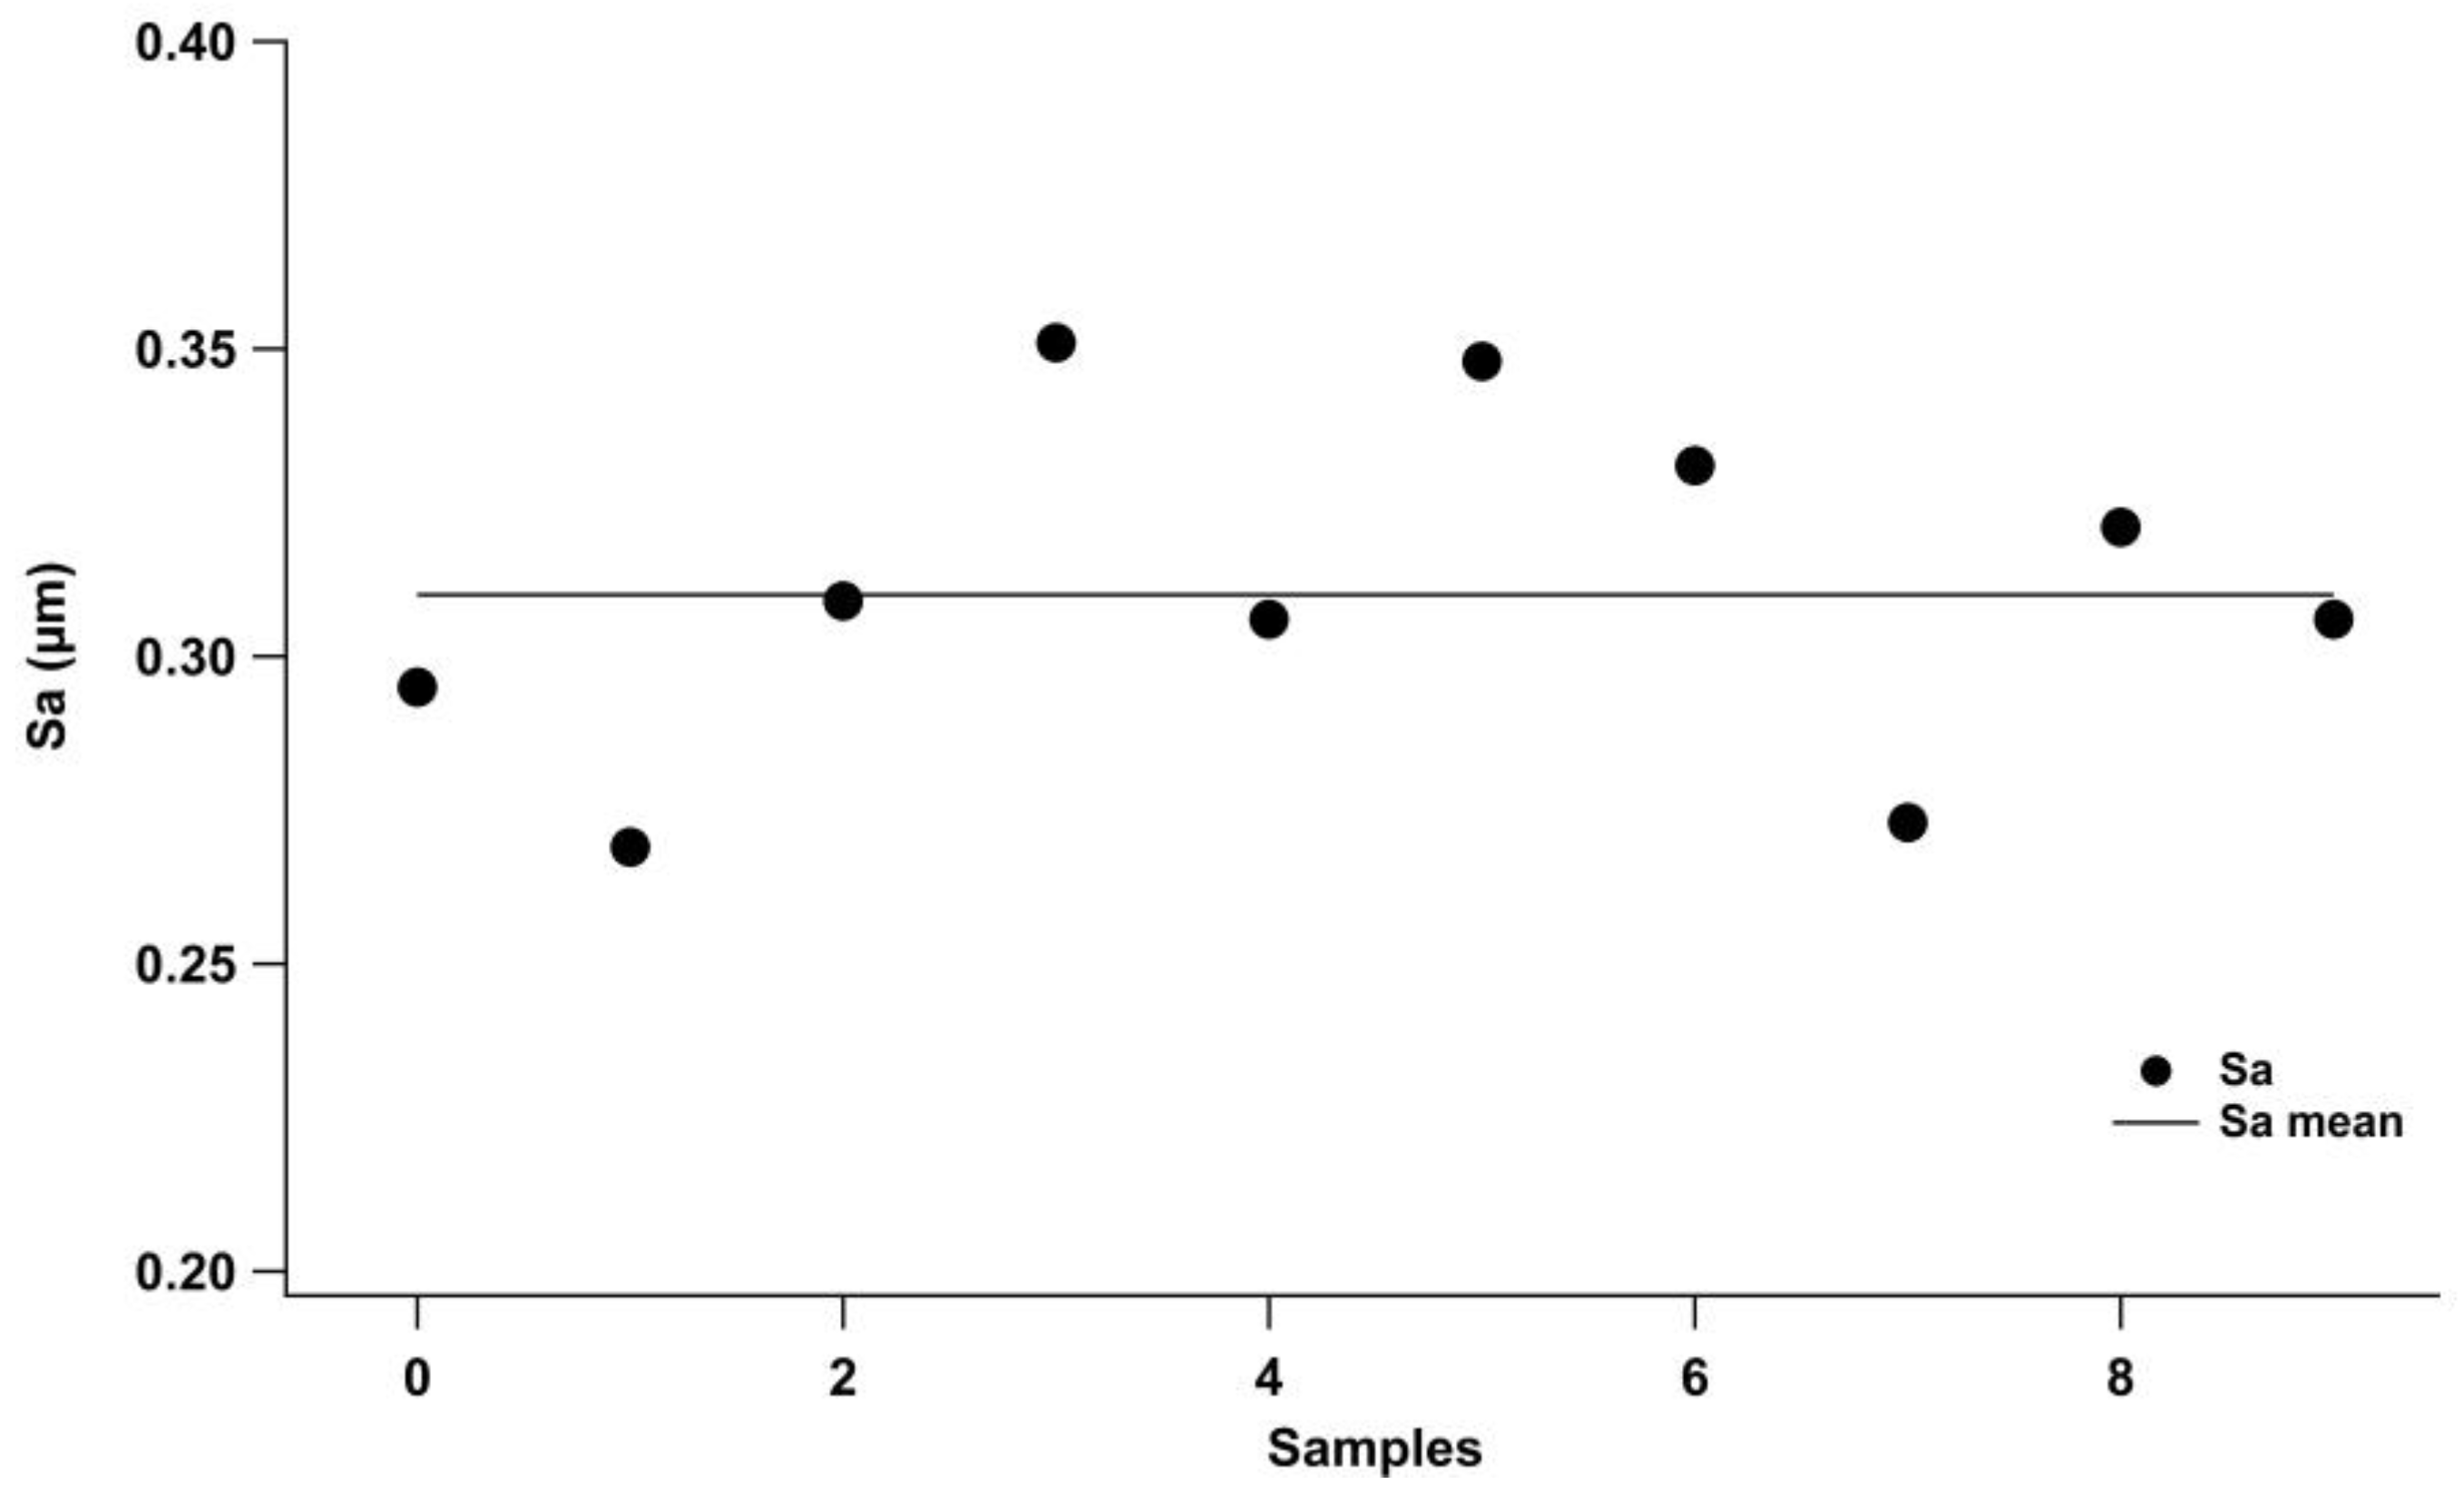
4.4. Uncertainties in Surface Measurements

Uncertainty contributions for evaluating the combined uncertainty for surface measurement obtained by confocal microscope are reported in Table 6 and are very low; they result in a combined uncertainty of 121 nm.
Figure 8 shows measurement dispersion due to the uncertainty (us) associated with the standard deviation of surface roughness (Sa) measurements on ten samples molded in the same condition. The resulting value is 27 nm. Therefore, the expanded uncertainty is equal to 248 nm, and this value allows to evaluate the surface roughness as Sa = 0.31 ± 0.06 µm. An uncertainty evaluation obtained only by the standard deviation of the ten repetition measurements is equal to 0.03 µm, underestimating the total uncertainties of about 50%.
It is worth noting that the added uncertainty is slightly less than the corresponding value obtained in evaluating the expanded combined uncertainty for the sample length as in evaluating one-dimensional measurement. This conclusion is supported by considering that surface properties consider quantities covering a wider area than a single dimension, allowing a more accurate and reliable evaluation of the part quality. This is a further support for using a surface parameter in evaluating a micro molding product/process quality, as suggested in a previous work [32], due to the uncertainty budget being almost the same or slightly inferior compared to the one-dimensional measurement selection.

5. Conclusions

This study systematically analyzed the sources contributing to uncertainty definition by optical measurements to evaluate a one-dimensional quantity (the length) or a texture property (the surface roughness) in measuring micro-injection products. The proposed method can be employed for all the procedures using optical instruments. The main result is that the measuring uncertainty is underestimated if only the standard deviation on a fixed number of test parts is considered: the calculated expanded uncertainty is three times larger. It allows us to determine the value range of the measured quantity accurately. This result ensures the best estimation of the quality of micro-products under evaluation and allows to better adapt the results to the pressing tolerance requested in micro-component production. Furthermore, the optimization of the process and products is more achievable due to the improved ability to set adequate parameters range and design experimental plans; a more reliable evaluation of measurement uncertainties of manufactured samples allows setting the correct power of an experimental design to discriminate better the effect of process parameters on the quality of the product and to choose the adequate parameter value to optimize the production process [33]. The proposed methodology can also be applied in different contexts, manufacturing processes, and materials.

Author Contributions

Conceptualization, V.B. and R.S.; methodology, V.B. and R.S.; formal analysis, V.B.; investigation, V.B. and R.S.; writing—original draft preparation, V.B. and R.S.; writing—review and editing, V.B. and R.S. and I.F.; supervision, I.F. All authors have read and agreed to the published version of the manuscript.

Funding

This research received no external funding.

Data Availability Statement

Data are contained within the article.

Conflicts of Interest

The authors declare no conflicts of interest.

References

  1. Zhang, H.; Liu, H.; Zhang, N. A Review of Microinjection Moulding of Polymeric Micro Devices. Micromachines 2022, 13, 1530. [Google Scholar] [CrossRef]
  2. Alting, L.; Kimura, F.; Hansen, H.N.; Bissacco, G. Micro Engineering. CIRP Ann.-Manuf. Technol. 2003, 52, 635–657. [Google Scholar] [CrossRef]
  3. Mussatayev, M.; Huang, M.; Beshleyev, S. Thermal Influences as an Uncertainty Contributor of the Coordinate Measuring Machine (CMM). Int. J. Adv. Manuf. Technol. 2020, 111, 537–547. [Google Scholar] [CrossRef]
  4. Cheng, Y.; Wang, Z.; Chen, X.; Li, Y.; Li, H.; Li, H.; Wang, H. Evaluation and Optimization of Task-Oriented Measurement Uncertainty for Coordinate Measuring Machines Based on Geometrical Product Specifications. Appl. Sci. 2018, 9, 6. [Google Scholar] [CrossRef]
  5. Gąska, A.; Harmatys, W.; Gąska, P.; Gruza, M.; Gromczak, K.; Ostrowska, K. Virtual CMM-Based Model for Uncertainty Estimation of Coordinate Measurements Performed in Industrial Conditions. Meas. J. Int. Meas. Confed. 2017, 98, 361–371. [Google Scholar] [CrossRef]
  6. Weckenmann, A.; Knauer, M.; Kunzmann, H. The Influence of Measurement Strategy on the Uncertainty of CMM-Measurements. CIRP Ann.-Manuf. Technol. 1998, 47, 451–454. [Google Scholar] [CrossRef]
  7. Lin, H.; Keller, F.; Stein, M. Influence and Compensation of CMM Geometric Errors on 3D Gear Measurements. Meas. J. Int. Meas. Confed. 2020, 151, 107110. [Google Scholar] [CrossRef]
  8. Gonda, S.; Doi, T.; Kurosawa, T.; Tanimura, Y.; Hisata, N.; Yamagishi, T.; Fujimoto, H.; Yukawa, H. Accurate Topographic Images Using a Measuring Atomic Force Microscope. Appl. Surf. Sci. 1999, 144–145, 505–509. [Google Scholar] [CrossRef]
  9. Poon, C.Y.; Bhushan, B. Comparison of Surface Roughness Measurements by Stylus Profiler, AFM and Non-Contact Optical Profiler. Wear 1995, 190, 76–88. [Google Scholar] [CrossRef]
  10. Vorburger, T.V.; Rhee, H.G.; Renegar, T.B.; Song, J.F.; Zheng, A. Comparison of Optical and Stylus Methods for Measurement of Surface Texture. Int. J. Adv. Manuf. Technol. 2007, 33, 110–118. [Google Scholar] [CrossRef]
  11. García, J.C.; Lobera, A.S.; Maresca, P.; Pareja, T.F.; Wang, C. Some Considerations about the Use of Contact and Confocal Microscopy Methods in Surface Texture Measurement. Materials 2018, 11, 1484. [Google Scholar] [CrossRef] [PubMed]
  12. Leach, R. Optical Measurement of Surfacte Topography; Springer: Berlin/Heidelberg, Germany, 2011; ISBN 9783642120114. [Google Scholar]
  13. Leach, R. Characterisation of Areal Surface Texture; Springer: Berlin/Heidelberg, Germany, 2013; Volume 9783642364, ISBN 9783642364587. [Google Scholar]
  14. Schwenke, H.; Neuschaefer-Rube, U.; Pfeifer, T.; Kunzmann, H. Optical Methods for Dimensional Metrology in Production Engineering. CIRP Ann.-Manuf. Technol. 2002, 51, 685–699. [Google Scholar] [CrossRef]
  15. Tosello, G.; Haitjema, H.; Leach, R.K.; Quagliotti, D.; Gasparin, S.; Hansen, H.N. An International Comparison of Surface Texture Parameters Quantification on Polymer Artefacts Using Optical Instruments. CIRP Ann.-Manuf. Technol. 2016, 65, 529–532. [Google Scholar] [CrossRef]
  16. ISO 25178-2:2021; Geometrical Product Specifications (GPS)—Surface Texture: Areal Part 2: Terms, Definitions and Surface. British Standards Institution BSI Standards Publication: London, UK, 2012.
  17. Leach, R.K.; Giusca, C.L.; Haitjema, H.; Evans, C.; Jiang, X. Calibration and Verification of Areal Surface Texture Measuring Instruments. CIRP Ann.-Manuf. Technol. 2015, 64, 797–813. [Google Scholar] [CrossRef]
  18. Bernstein, J.; Weckenmann, A. Measurement Uncertainty Evaluation of Optical Multi-Sensor-Measurements. Meas. J. Int. Meas. Confed. 2012, 45, 2309–2320. [Google Scholar] [CrossRef]
  19. Ye, L.; Qian, J.; Haitjema, H.; Reynaerts, D. Uncertainty Evaluation of an On-Machine Chromatic Confocal Measurement System. Measurement 2023, 216, 112995. [Google Scholar] [CrossRef]
  20. Grochalski, K.; Wieczorowski, M.; H’Roura, J.; Le Goic, G. The Optical Aspect of Errors in Measurements of Surface Asperities Using the Optical Profilometry Method. Front. Mech. Eng. 2020, 6, 12. [Google Scholar] [CrossRef]
  21. Walczak, D.; Krolczyk, J.B.; Chudy, R.; Gupta, M.K.; Pruncu, C.; Krolczyk, G.M. Role of Optical Measurement Systems in Analysing the Surface Topography of an Industry Standard Component. Optik 2023, 283, 170919. [Google Scholar] [CrossRef]
  22. Wang, S.; Cheung, B.; Ren, M. Uncertainty Analysis of a Fiducial-Aided Calibration and Positioning System for Precision Manufacturing of Optical Freeform Optics. Meas. Sci. Technol. 2020, 31, 065012. [Google Scholar] [CrossRef]
  23. Genta, G.; Maculotti, G. Uncertainty Evaluation of Small Wear Measurements on Complex Technological Surfaces by Machine Vision-Aided Topographical Methods. CIRP Ann. 2021, 70, 451–454. [Google Scholar] [CrossRef]
  24. Haitjema, H. Uncertainty in Measurement of Surface Topography. Surf. Topogr. Metrol. Prop. 2015, 3, 035004. [Google Scholar] [CrossRef]
  25. Leach, R.; Haitjema, H.; Su, R.; Thompson, A. Metrological Characteristics for the Calibration of Surface Topography Measuring Instruments: A Review. Meas. Sci. Technol. 2020, 32, 032001. [Google Scholar] [CrossRef]
  26. Baruffi, F.; Parenti, P.; Cacciatore, F.; Annoni, M.; Tosello, G. On the Application of Replica Molding Technology for the Indirect Measurement of Surface and Geometry of Micromilled Components. Micromachines 2017, 8, 195. [Google Scholar] [CrossRef]
  27. ISO 15530-3:2011; Geometrical Product Specifications (GPS)—Coordinate Measuring Machines (CMM): Technique for Determining the Uncertainty of Measurement, Part 3: Use of Calibrated Workpieces or Measurement Standards. BSI Standards Publication: London, UK, 2022.
  28. Baruffi, F.; Calaon, M.; Tosello, G. Effects of Micro-Injection Moulding Process Parameters on Accuracy and Precision of Thermoplastic Elastomer Micro Rings. Precis. Eng. 2018, 51, 353–361. [Google Scholar] [CrossRef]
  29. JCGM100:2008; Evaluation of Measurement Data—Guide to the Expression of Uncertainty in Measurement (GUM). JCGM: Sèvres, France, 2020.
  30. Bellantone, V.; Surace, R.; Modica, F.; Fassi, I. Evaluation of Mold Roughness Influence on Injected Thin Micro-Cavities. Int. J. Adv. Manuf. Technol. 2018, 94, 4565–4575. [Google Scholar] [CrossRef]
  31. Taylor, J.R. An Introduction to Error Analysis: The Study of Uncertainties in Physical Measurements; ASMSU/Spartans.4.Spartans Textbook; University Science Books: Melville, NY, USA, 1997; ISBN 9780935702422. [Google Scholar]
  32. Bellantone, V.; Surace, R.; Fassi, I. Quality Definition in Micro Injection Molding Process by Means of Surface Characterization Parameters. Polymers 2022, 14, 3775. [Google Scholar] [CrossRef] [PubMed]
  33. Montgomery, D.C. Design and Analysis of Experiments, 8th ed.; Wiley: Hoboken, NJ, USA, 2012; ISBN 978-1118-14692-7. [Google Scholar]
Figure 1. The flow chart shows the primary sources for evaluating the expanded uncertainty.
Jmmp 08 00021 g001
Figure 2. Cavity and mold design (a,c), machined cavity (b), molded sample (d), and studied molded micro part (e).
Jmmp 08 00021 g002
Figure 3. Length measurements along three lines parallel to the melt flow (upper, center, and bottom).
Jmmp 08 00021 g003
Figure 4. Selected areas for surface roughness measurements.
Jmmp 08 00021 g004
Figure 5. The length dispersion is due to the uncertainty associated with the operator; the continuous line represents the mean value.
Jmmp 08 00021 g005
Figure 6. Length dispersion due to the uncertainty associated with the variable line positions during measurements, (circle market) using the left position and (triangle market) right position, the continuous and dotted lines represent the corresponding mean values.
Jmmp 08 00021 g006
Figure 7. Measurements on ten samples along the upper, bottom (a), and central (b) lines; the dispersion is due to the uncertainty associated with the measured length. The continuous line represents mean values.
Jmmp 08 00021 g007
Figure 8. Surface roughness dispersion due to the uncertainty associated with the standard deviation of surface roughness (Sa) on ten samples. The continuous line is the mean value.
Jmmp 08 00021 g008
Table 1. Material properties.
NameTrade NameGradeManufacturerMVR
(cm3/10 min)
Density
(kg/m3)
PolyoxymethyleneUltraformN2320 003Basf7.51.4
Table 2. Mean length measured on ten samples along three paths with corresponding standard deviations and uncertainty.
LengthUpper EdgeBottom EdgeCenter
Mean value (µm)2358.22360.42709.7
Standard deviation (µm)3.63.01.195
Uncertainty um1.140.950.38
Table 3. Uncertainties due to the thermal variations.
Mean L (μm)∆T (°C)α (°C−1)∆L (μm)Uncertainty uT (μm)
Upper2358.210.000110.260.150
Bottom2360.410.000110.260.150
Center2709.710.000110.30.042
Table 4. Uncertainties associated with variations in the material used during production.
L Max (μm)L Min(µm)Uncertainty uL (μm)
Upper2363.42352.63.1
Bottom2363.62356.12.2
Center2712.62708.51.2
Table 5. Summary of all evaluated uncertainties along the three paths and the resulting combined uncertainties.
UpperBottomCenter
uo0.70.70.7
um1.11.00.4
ux 0.3
ures0.30.30.3
ucal111
up333
uT0.150.150.2
uL3.12.21.2
uc3.93.22.4
Table 6. Evaluated uncertainty contributions for surface measurements.
Uncertainty ContributionValue (nm)
ucal10
up1.6
ures0.3
Disclaimer/Publisher’s Note: The statements, opinions and data contained in all publications are solely those of the individual author(s) and contributor(s) and not of MDPI and/or the editor(s). MDPI and/or the editor(s) disclaim responsibility for any injury to people or property resulting from any ideas, methods, instructions or products referred to in the content.

