Article

Time and Spatially Resolved Operando Small-Angle X-ray Scattering Measurements during Injection Moulding of Plastics

1
Departament d’Enginyeria Química, Universitat Politècnica de Catalunya, Av. Eduard Maristany 10–14, 08019 Barcelona, Spain
2
Centre for Rapid and Sustainable Product Development, Polytechnic of Leiria, 2430-080 Marinha Grande, Portugal
3
NCD-SWEET Beamline, ALBA Synchrotron Light Source, Cerdanyola del Vallès, 08290 Barcelona, Spain
*
Author to whom correspondence should be addressed.
J. Manuf. Mater. Process. 2023, 7(5), 176; https://doi.org/10.3390/jmmp7050176
Submission received: 14 August 2023 / Revised: 31 August 2023 / Accepted: 20 September 2023 / Published: 29 September 2023
(This article belongs to the Special Issue Advances in Injection Molding: Process, Materials and Applications)

Abstract

:
We recently introduced the possibility of performing operando small-angle X-ray scattering measurements using a novel industrially relevant injection moulding system for plastics. We show that useful time-resolving measurements can be performed with a time-cycle of 1 s and highlight the possible steps to reduce this to 0.5 s. We show how we can use the transmission measurements to provide a time marker when plastic first enters the mould cavity in the region probed by the incident X-ray beam. We show the opportunities provided by this experimental stage mounted on the NCD-SWEET beamline at ALBA to probe the reproducibility of the injection moulding system on different scales. The design of the equipment allowed for the development of the structure and the morphology to be evaluated in different parts of mould cavity, and we evaluated any differences in a rectangular mould cavity. We identified future prospects for this equipment in terms of novel mould heating and cooling systems and the opportunities for quantitatively evaluating radical approaches to injection moulding technology.

1. Introduction

Injection moulding is the most widely used technology for the manufacturing of plastic parts [1]. The process is usually completely automated for the repeatable and reproducible production of parts that, in general, need no finishing. The first injection moulding machine was patented by the Hyatt brothers John and Isaiah in 1872 [2]. These first machines were quite primitive in comparison to contemporary systems. The technology was revitalized in the 1940s by the replacement of the plunger to inject the hot plastic into the mould by an extrusion screw [3]. The rotating screw gave the machine better control over the injection speed and consequently improved the quality of the plastic parts produced. The screw also allowed for the mixing of, for example, recycled materials with virgin materials due to the mixing action of the screw. The interaction of the screw with the solid pellet feed stock greatly contributed to the first stage process of melting or softening the plastic due to friction. The remaining heat came from electrical band heaters. Screw machines now make up the vast majority of all injection moulding machines. Not long after the introduction of the screw extrusion injection moulding system, new high-quality thermoplastics, including polyethylene, polypropylene, polystyrene, and nylons, became available [4] and greatly helped the acceleration in the adoption of injection moulding of plastics as a manufacturing technology.
Injection moulding of plastics is a deceptively simple technology. Plastic-fed stock, usually in the form of mm sized pellets, is heated into a liquid state and then injected at high pressure into a metallic mould to define the shape. The liquid polymer cools and becomes solid after passing through a glass transition in the case of an amorphous polymer or crystallising to form a semi-crystalline solid for a semi-crystalline polymer. The solid part is then ejected from the mould. This work is focused on semi-crystalline polymers such as isotactic polypropylene, polyethylene, nylon, and some bio-based plastics such as polyhydroxybutyrate and polybutylene succinate. In these materials, the flow processes inherent to injection moulding and the rapid changes in temperature involved as the fluid plastic enters the mould have a profound impact on the structure, morphology, which develop as the fluid plastic solidifies, and, therefore, on the properties of the part [5]. Previous reports in the literature have focused on the post-processing characterisation of injection moulded parts and attempts have been made to reconstruct the history of the development of the structure and morphology during the injection moulding cycles [6,7]. There are a few exceptions to this, including experimental stages, which approach industrial processing conditions. One of the earliest in situ scattering studies was focused on reaction injection moulding. This is a low-pressure process, in which a reactive mixture is injected at low pressure into a mould cavity. The low pressure used means that a variety of materials can be used to fabricate the mould. Elwell et al. [8,9] used time-resolved small-angle X-ray scattering to study the microphase separation that took place during the formation of the solid foam. Mateus et al. [10] used time-resolved scattering small-angle X-ray scattering to evaluate the microphase separation and showed that the rates of reaction of the components were less that the time scale to form the morphology. In Hamburg, Zachmanns group [11], working on beamline A1 at HASYLAB, were amongst the first to develop what could be seen as a realistic industrial manufacturing process, exploring fibre spinning. A more recent development involved polymer films that were blown using air pressure on extruded tubular films. This is a widely used process, although it is a complex process with fast changing temperatures and different deformation geometries. Van Drongelen et al. [12] were probably the first to explore the film blowing process using time-resolving wide-angle X-ray scattering techniques. A limitation of this approach is that the preferred orientation of the chain-folded-lamellar crystals is more difficult to evaluate using wide-angle X-ray scattering (WAXS), and later work included small-angle X-ray scattering (SAXS) measurements [13]. Zhang et al. [14] mounted a film-blowing system on a SAXS beamline [15] to evaluate polyethylene films prepared in this manner and used operando scattering to explore by adjusting the height of the extruder die in relationship to the incident beam. It was possible to evaluate different parts of the blown film at defined distances from the extruder die. The authors highlighted how they were able to follow the network formation from the entangled melt through the formation of crystalline network points obtaining quantitative data, which was able to inform on computational models of film blowing and the dependence of the process on the molecular parameters. Most other reported works fell more into the realm of scientific studies, but some recent work from Liao et al. [16] developed an operando X-ray scattering system for injection moulding using a metallic mould and diamonds as X-ray transparent windows. They used this system in conjunction with intense flux at the synchrotron beam-time BL19U2 [15] at the Shanghai synchrotron radiation facility to determine the characteristics of the shish kebab structures that were created during crystallization in the micro-injection moulding. However, in the last year, a new major project at the Centre for Rapid and Sustainable Product Development (CDRSP) developed an industrially relevant injection moulding system that could be mounted on the NCD-SWEET beam at the ALBA Synchrotron Light Source to perform operando small-angle X-ray scattering measurements [17]. X-ray scattering is a powerful tool for operando experiments. The bright sources of X-rays available via an undulator at a synchrotron light source enable effective time-resolving measurements [18]. The analysis of the data is largely unambiguous, as the theory of X-ray diffraction physics is well understood and well developed, and the optimum sample thickness of 1–2 mm is a practical industrial scale [19]. Moreover, the samples need not be optically clear and can contain pigments and other nanofillers. The work of Zhao et al. [20] provides an excellent example of the interplay between molecular parameters and processing parameters that takes place during injection moulding of semi-crystalline polymers. Small-angle scattering covers the important scale of ~10 nm and provides critical information on the formation and the preferred orientation of chain-folded lamellar crystals that are particularly important in determining the properties of the final part [21]. There is much interest in the framework of Industry 4.0 in providing feedback during the injection moulding process. The current work on operando SAXS measurements provides one approach to providing feedback on multiple scales, but the role of more traditional “sensors” should not be overlooked, and reference [22] gives an excellent coverage of such possibilities.
The injection moulding system used in this work was designed and fabricated using industry standard materials and protocols so that information gained in this work could be directly translated to industrial practice. The current work focused on what could be achieved in terms of time and spatially resolved measurements using this new injection moulding system, the NCD-SWEET SAXS/WAXS beamline at the ALBA Synchrotron Light Source, and the prospects for future developments and experimental work.

2. Materials and Methods

This work were only possible due to the developments at third generation synchrotron light sources, such as ALBA, and the provision of bright energy tuneable sources of hard X-rays [23].
Figure 1 shows a schematic representation of the NCD-SWEET beamline at ALBA [18]. 3 GeV electrons moving at speeds close to the speed of light passed through the undulator, where they were further accelerated by arrays of Samarium Cobalt magnets. The static magnetic field alternated along the length of the undulator with a wavelength λu, which, for the NCD-SWEET undulator, was 21.6 mm with 92 periods. Electrons that traversed this periodic magnet structure were driven to undergo oscillations and radiate energy. The radiation produced in an undulator was particularly intense and concentrated in narrow energy bands [24]. It was also highly collimated in the orbit plane of the electrons. The radiation produced in this way entered the beamline. The undulator was a harmonic device, and, on the NCD-SWEET beamline, the first harmonic was the most intense. The energy was rather low at 2 keV, and we instead utilized the 7th harmonic, which had an energy of 12.4 keV, corresponding to a wavelength of 1 Å, which offered a greater transmission through the aluminium windows. This choice of wavelength was a trade-off between the intensity of the harmonic produced in the undulator and its absorption by the aluminium alloy in the mould insert windows.
The injection moulding unit followed a conventional design with the mould cavity prepared using standard mould plates and mould inserts in an aluminium-silicon alloy, AW6082 [25]. An automatic mechanism for opening and closing the mould cavity was provided using a rail structure. For the injection process, an Industrial Autonomous Injection Unit, UAI6/1OP, from the Rambaldi Group was mounted above the mould. This was an autonomous unit, and the injection stage was all hydraulic [26]. The unit was fitted with a Euromap connection, which made the addition of other components, such as an interface to the ALBA Synchrotron controls, very straightforward. Figure 2a shows the system showing the entry points of the incident X-ray beam, Figure 2c shows the exit ports, and Figure 2b shows the assembled system viewed from the side.
The mould inserts were machined with 6 cylindrical holes that stopped ~0.08 mm from the far side, so as to provide a “window” that would enable the X-ray beam to pass through without excessive absorption. The transmission was measured at ~70%, but this thickness was sufficient to withstand the high pressure in the cavity during the injection phase. The window system was described in detail elsewhere [17,27] (Appendix A). The whole system was mounted on a motorized translation stage that enabled the system to be position so that the incident X-ray beam could pass through any of the 6 windows. Figure 3 shows the design of the plastic part obtained from the injection and used in this work.
The beamline was fitted with a 2D detector, a Pilatus3S 1M detector manufactured by the DECTRIS company in the USA, to record the small-angle X-ray scattering patterns, and this was mounted 6.7 m away from the mould cavity. This enabled SAXS patterns to be recorded over a scattering vector |Q| range from 0.002 Å−1 to 0.125 Å−1, where |Q| = 4π Sinθ/λ; 2θ was the scattering angle; and λ was the incident wavelength, which was 1 Å. The beamline in terms of sample to detector distance was calibrated using the well-known calibrant sodium behenate. To minimize the effects of scattering by the air, the space between the mould cavity and the detector was fitted with a vacuum tube. To prevent the intense forward beam reaching and saturating the detector, it was fitted with a small absorbing beam stop. This also contained a photodiode that could be used to make transmission measurements. Just before the sample, an ion chamber was mounted so that the incident intensity of the X-ray beam could be measured. The ALBA Synchrotron Light Source, in common with most other 3rd generation synchrotron rings, had an automatic system to top-up the ring current every twenty minutes, so as to maintain a more or less constant current. In the intervening periods, the ring current and hence the intensity of the X-ray beam from the undulator would decay slowly and then increase at each top up. An example of this is shown in Figure 4. To account for this small variation, the measured small-angle X-ray scattering data could be normalized to the measured incident beam intensity, but otherwise it was a constant output source.
The work described here was performed using some standard industrial grades of isotactic polypropylene. Table 1 shows the acronym for each grade, the reported Melt Flow Index, and any additives incorporated in this grade. We consider the scope of this equipment with respect to other materials in the discussion.
The injection unit allowed the injection process parameters to be set before the start of any series of experiments. Table 2 shows the parameters used in this work. The temperature of the molten polymer to be injected into the mould cavity is given in the description of each experiment along with the temperature of the mould prior to injection.

3. Results

A key feature of the process of injection moulding is the high level of reproducibility that makes the technology particularly suited to mass production. This, in essence, relates to the external shape and the surface finish. These multiscale experiments will enable us to probe to what length scale injection moulding is reproducible. This is not to say that the positions and conformations of the molecules in two successive moulded parts are exactly the same. Rather, we need to check if the characteristics of the structure and the morphology are similar.

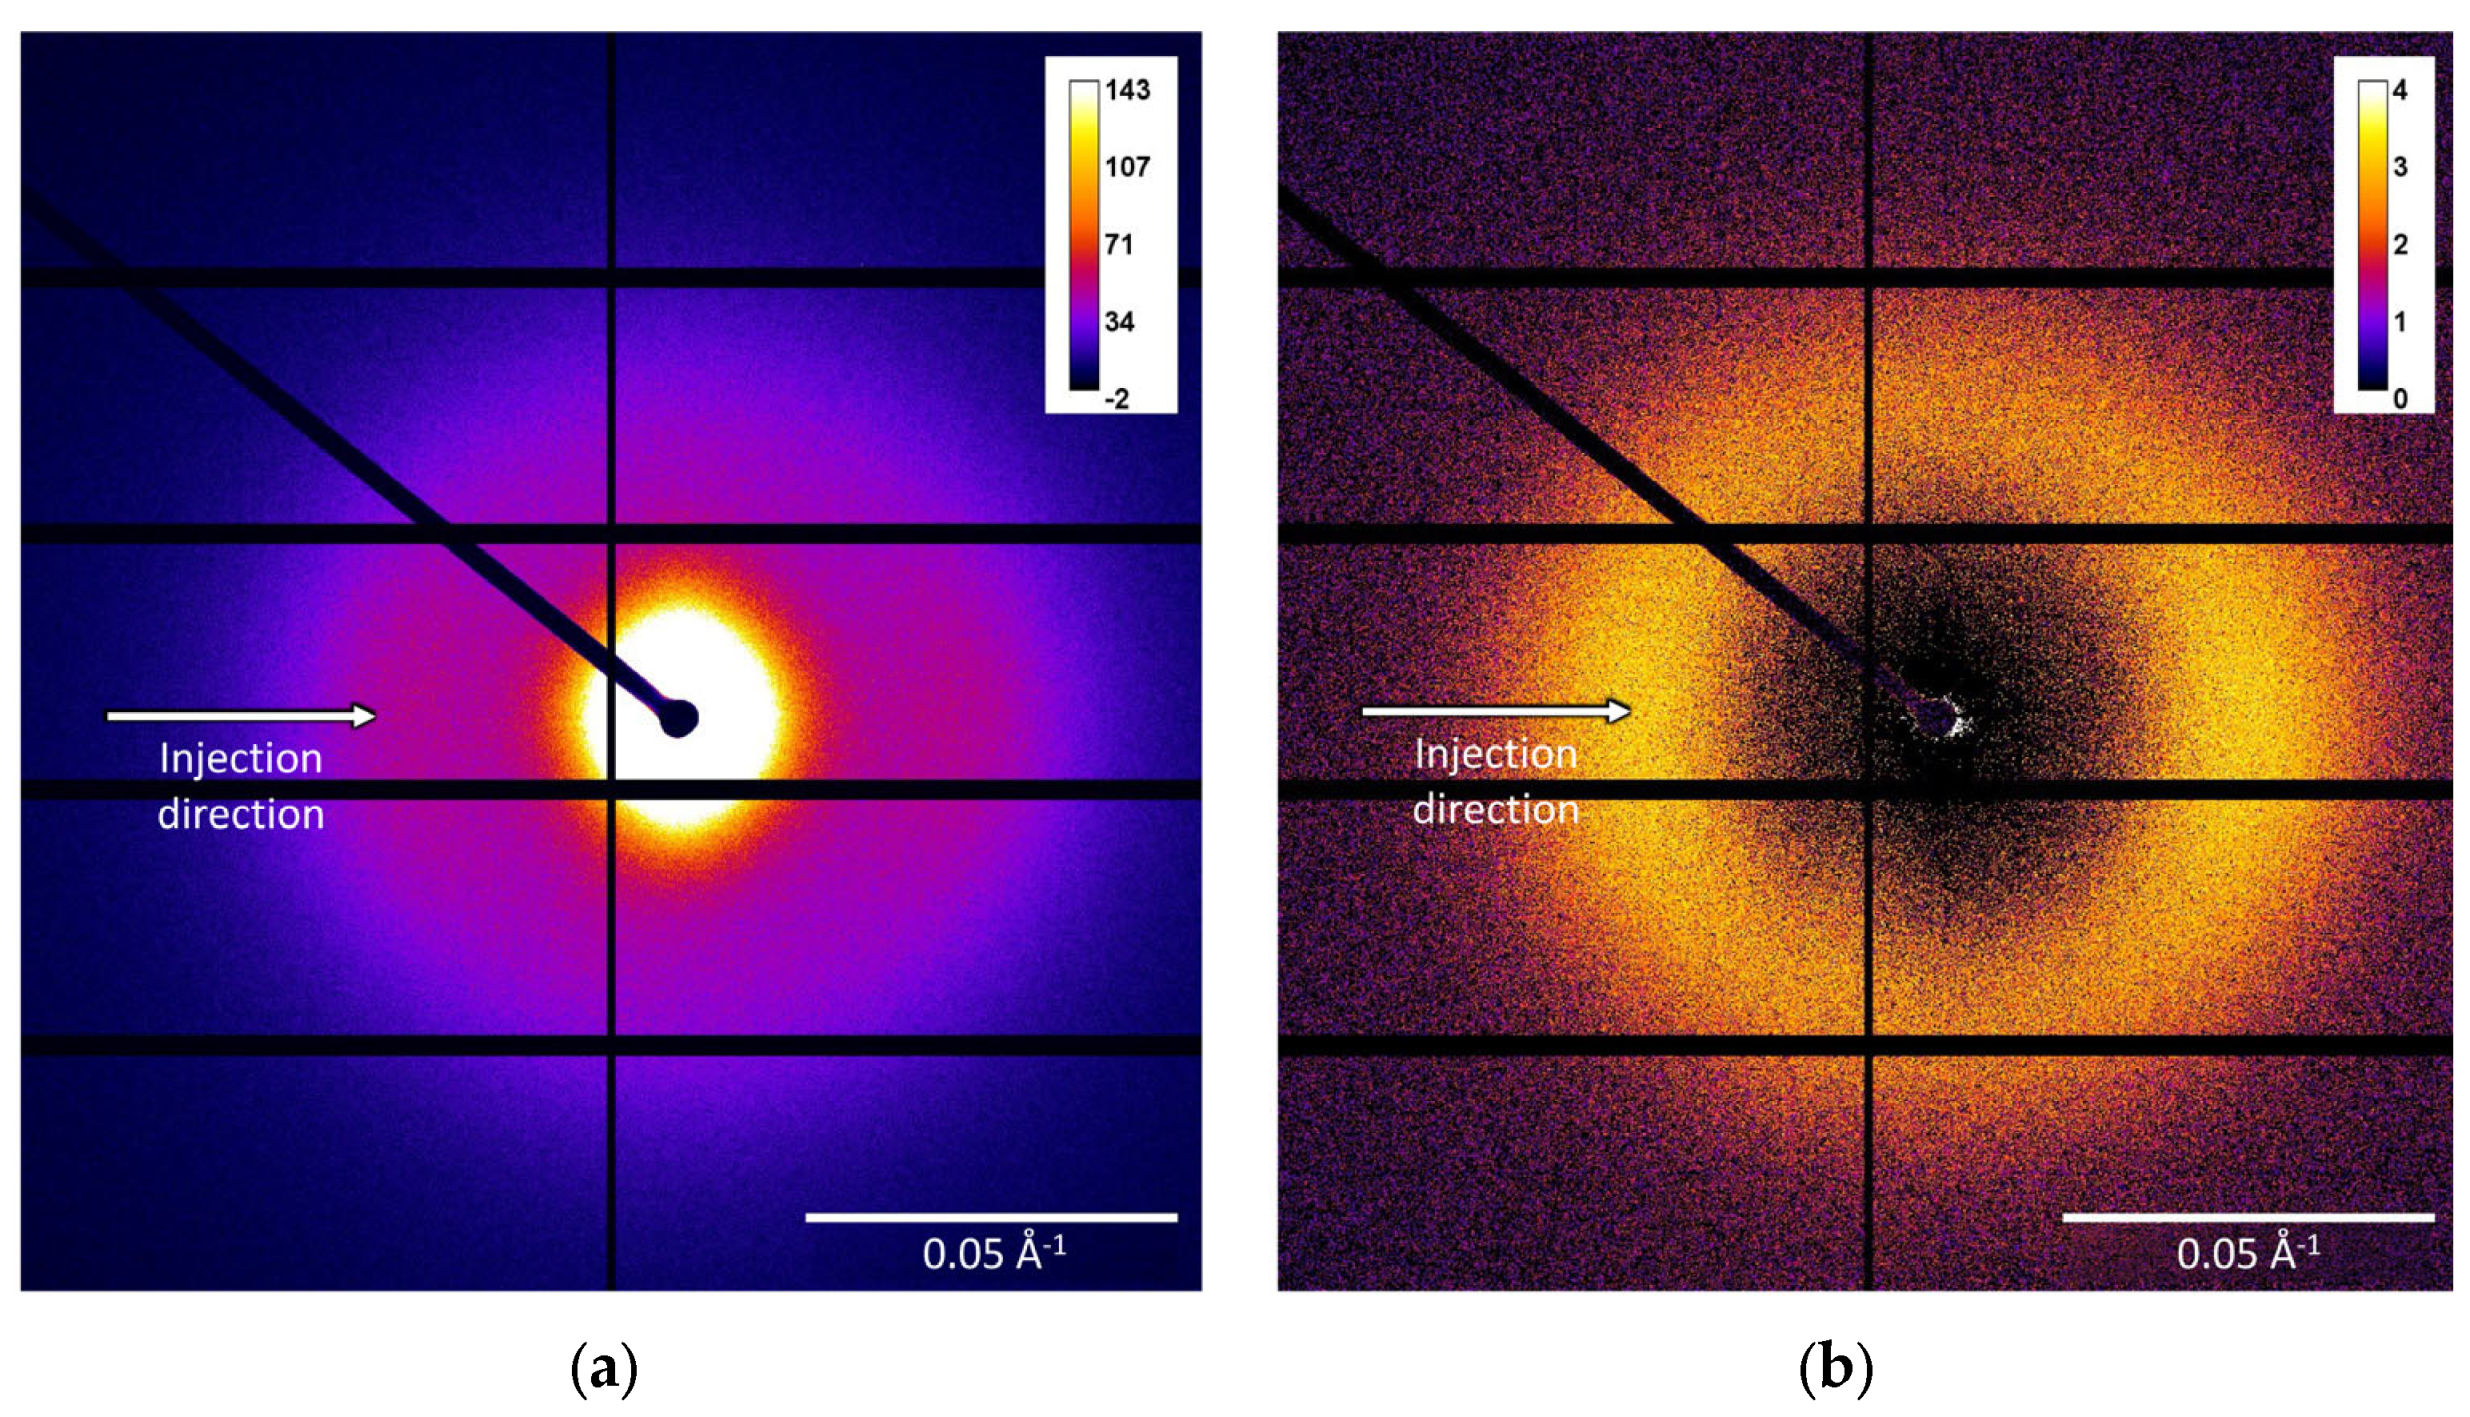
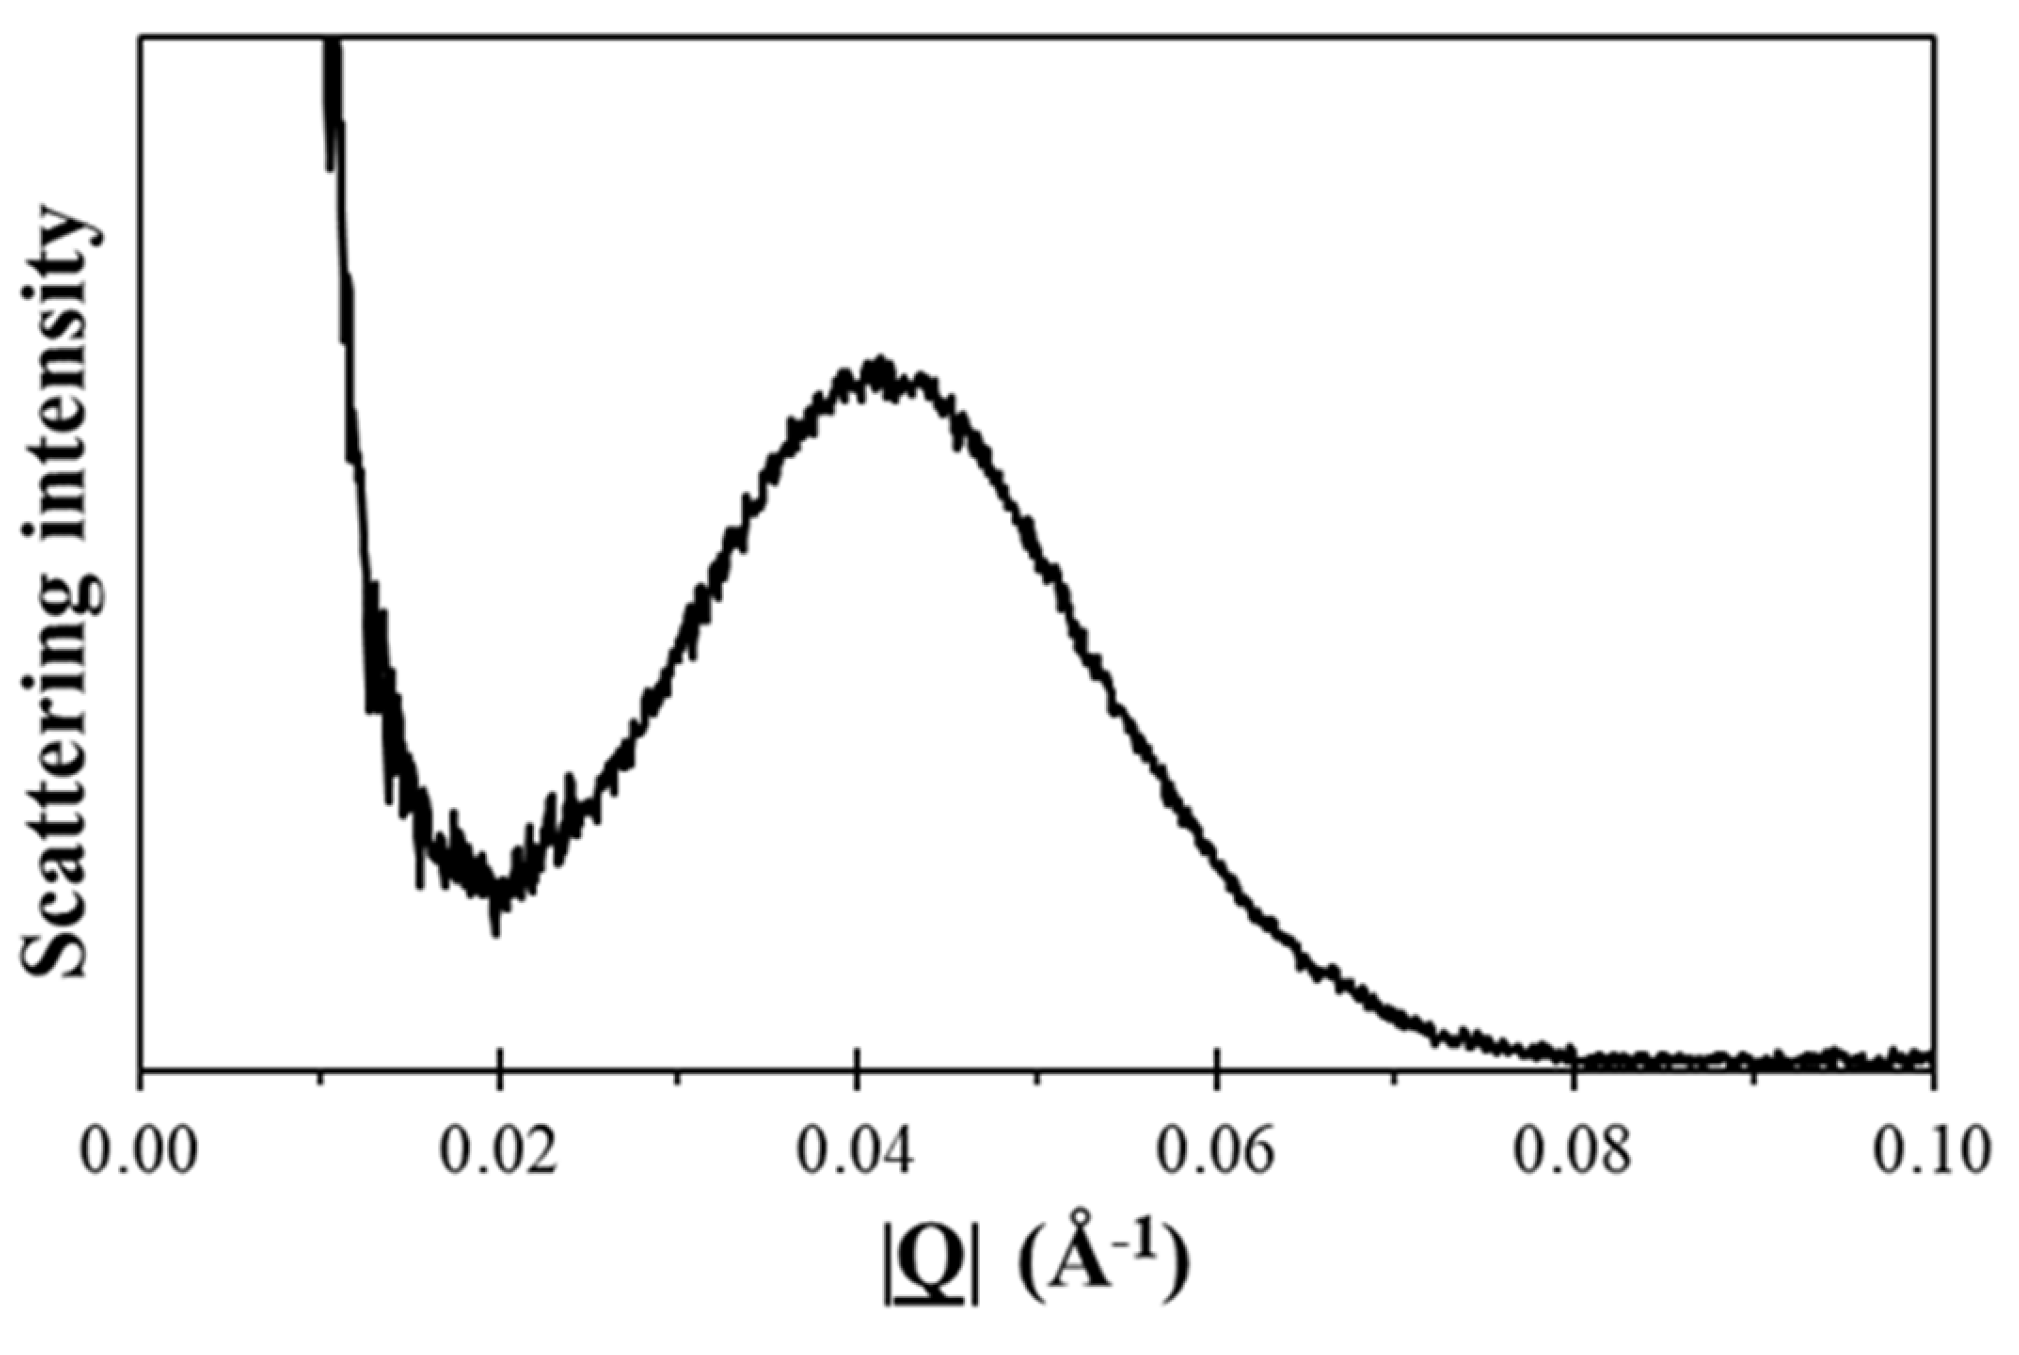
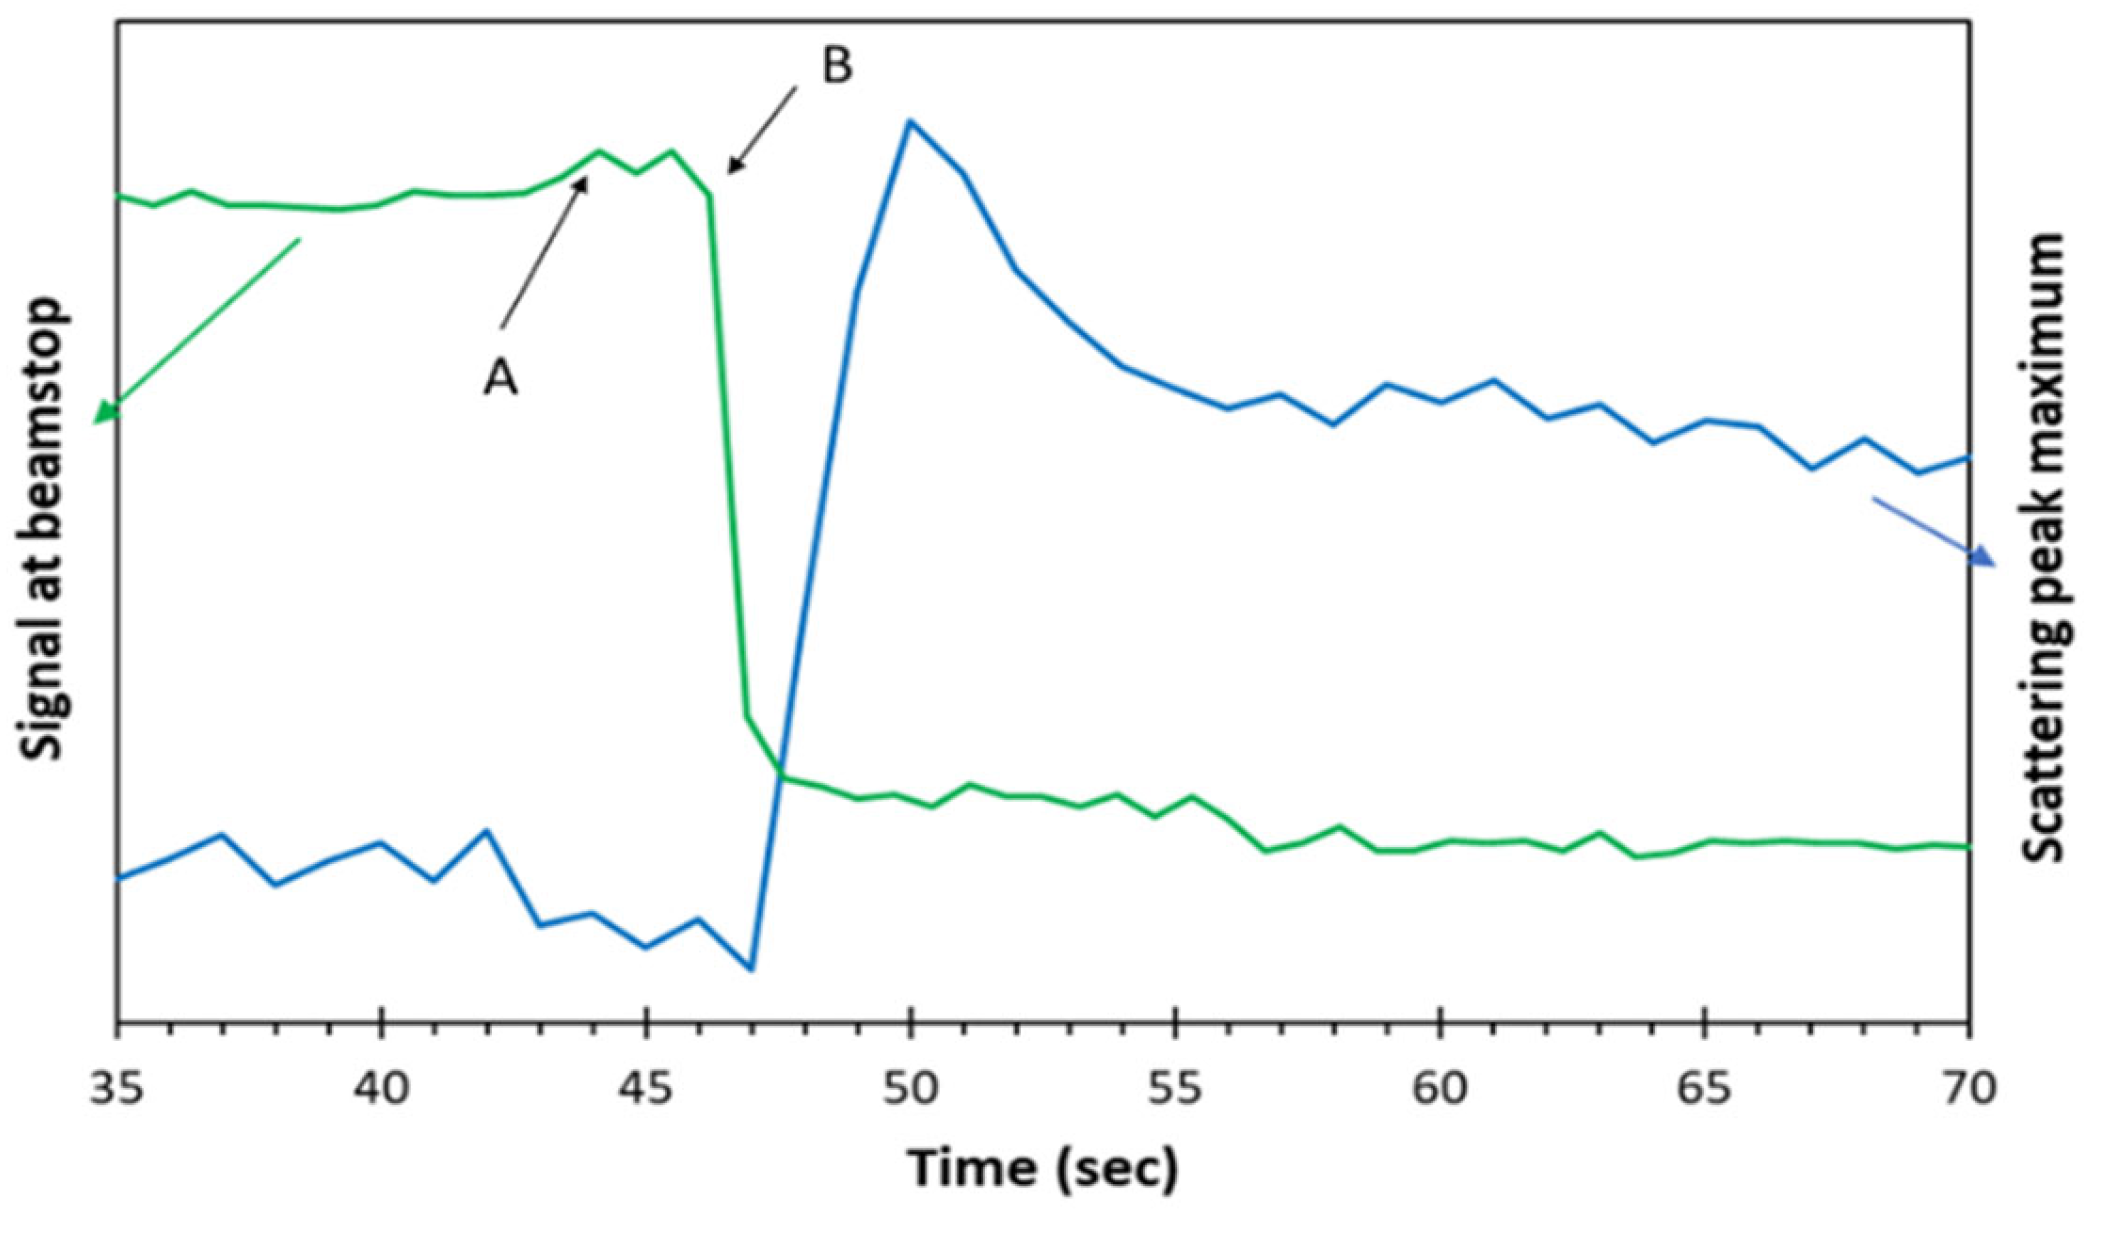
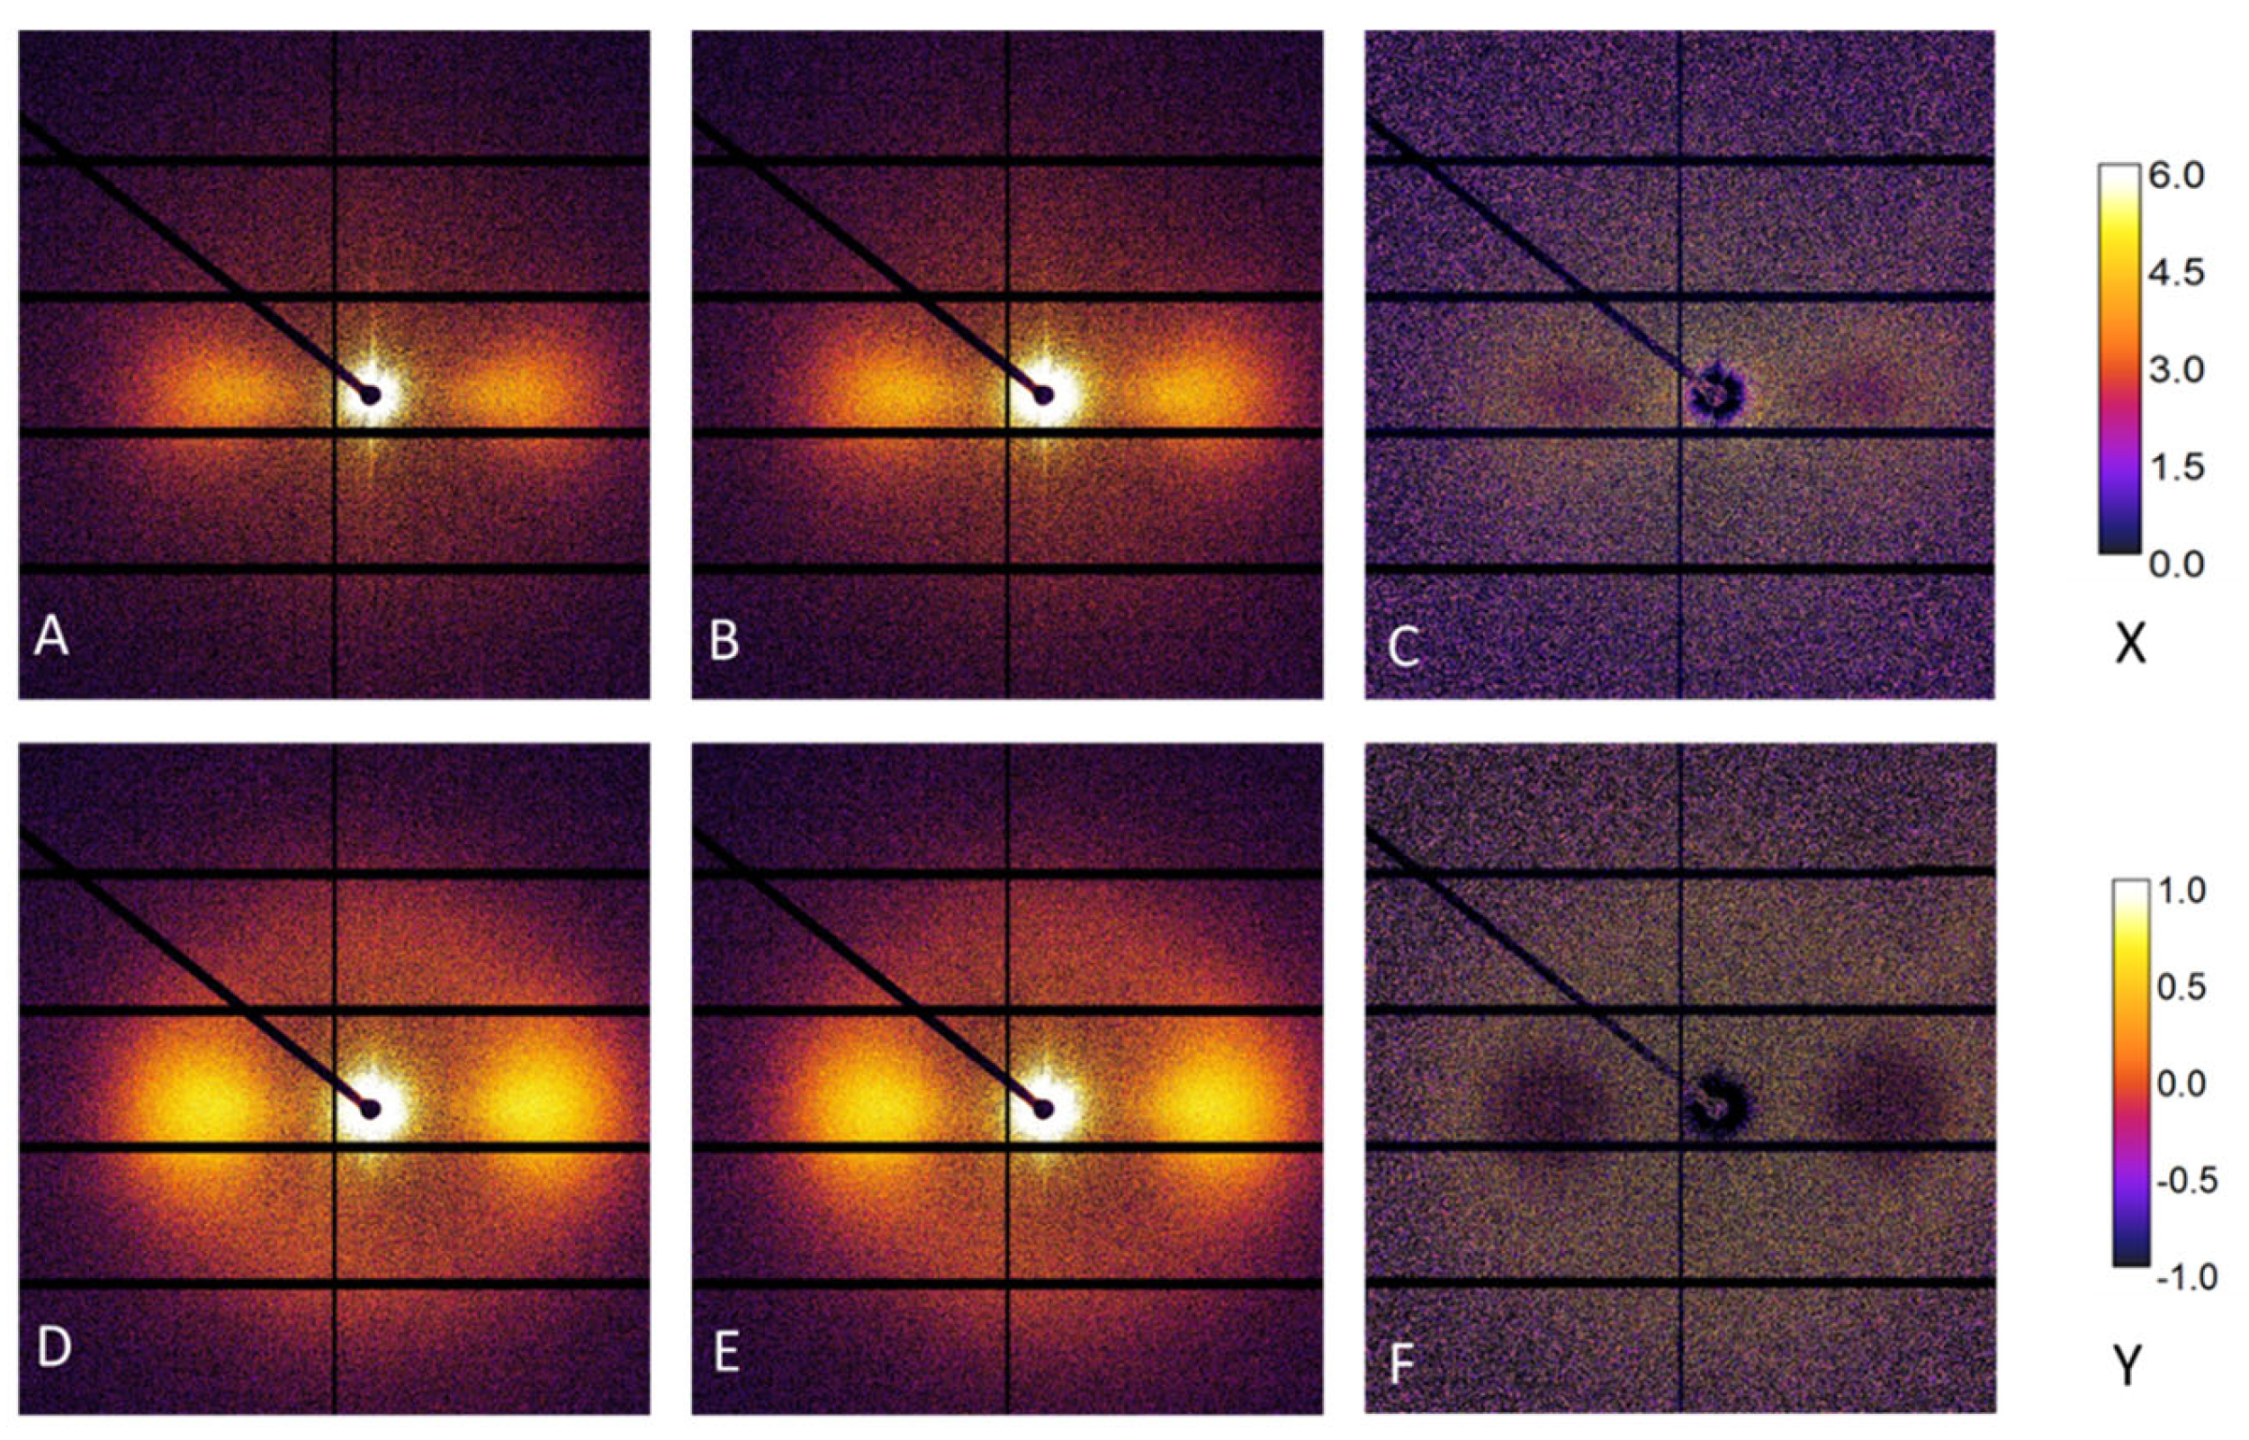
3.1. Basic Observations

Figure 5 shows two small-angle X-ray scattering patterns for PP1 recorded during 1 s following the fluid plastic first entering the mould cavity in the volume adjacent to the selected window. Figure 5a is the as measured pattern, whereas Figure 5b is the same data but with the scattering from the empty cavity subtracted from it. The injection temperature was 230 °C, and the mould temperature was 50 °C. The flow axis of the fluid plastic in the mould cavity was horizontal, and the intense scattering feature in the centre of the pattern largely arose from the scattering from the aluminium alloy, which formed the “window” in the mould. In the very centre of the pattern, there was a black circular object, which was the beam stop, which was placed to intercept the intense forward going beam that had passed through the sample. The volume of the sample in the X-ray beam here was small, and only part of that material was crystalline.
As a consequence, the scattering intensity was weak and difficult to visualise against the strong scattering from the window. Figure 5b shows the same pattern with the background scattering from the empty mould cavity, subtracted from Figure 5a. The remaining scattering was typical for a chain-folded lamellar crystal stack structure. In other words, this scattering was from the first crystals to form in the mould cavity adjacent to the selected window after the fluid plastic had been injected. The slightly higher intensity along the flow axis direction to the left and right of the centre of the zero angle of the pattern was indicative of a certain level of preferred orientation of the crystals.
Figure 6 shows the integrated intensity in the image shown in Figure 5b as a function of the modulus of the scattering vector |Q|. This shows an intensity curve typical of the SAXS data from a semicrystalline polymer. The broad peak, centred around a |Q| of 0.043 Å−1, arose from the contrast between the chain-folded lamellar crystals and the intervening amorphous material, which exhibited a lower density. From the data shown in Figure 6, we could obtain a value for the so-called long period Lp, which was the sum of the lamellar thickness and the thickness of the intervening amorphous material. Here, the peak position indicated a value for the long period of 146 Å. From the azimuthal variation in the intensity at a fixed value of |Q|, we can evaluate a measure of the level of preferred orientation.
Figure 7 shows the value of the photodiode mounted inside the beam stop and its variation with time. When the fluid plastic material enters the mould cavity adjacent to the selected window, the value of this signal is reduced due to absorption of the beam by the fluid plastic material, and it provides a timing marker to unify the timescales. The value of the transmission signal It is related to the incident beam I0 through the following equation:
I t = I 0   e x p ( A t )
where A is the linear absorption coefficient, which depends on the elemental composition of the plastic, and t is the thickness of the plastic in the mould cavity. From this, we can see that ln(It/I0) is linearly related to the thickness. In Figure 7, we also plotted the intensity of equivalent peak height of the “long period” peak shown in Figure 6 for successive time-resolved images. This peak arose from the scattering from alternating lamellar crystals and a region of non-crystalline polymer, and, as a consequence, it will reach a maximum at 50% v/v of lamellar crystals. A further complication is that the difference in density between the lamellar crystals and the amorphous polymer narrowed as the temperature of the plastic cooled, and hence the scattering intensity reduced, as can be observed in Figure 7.

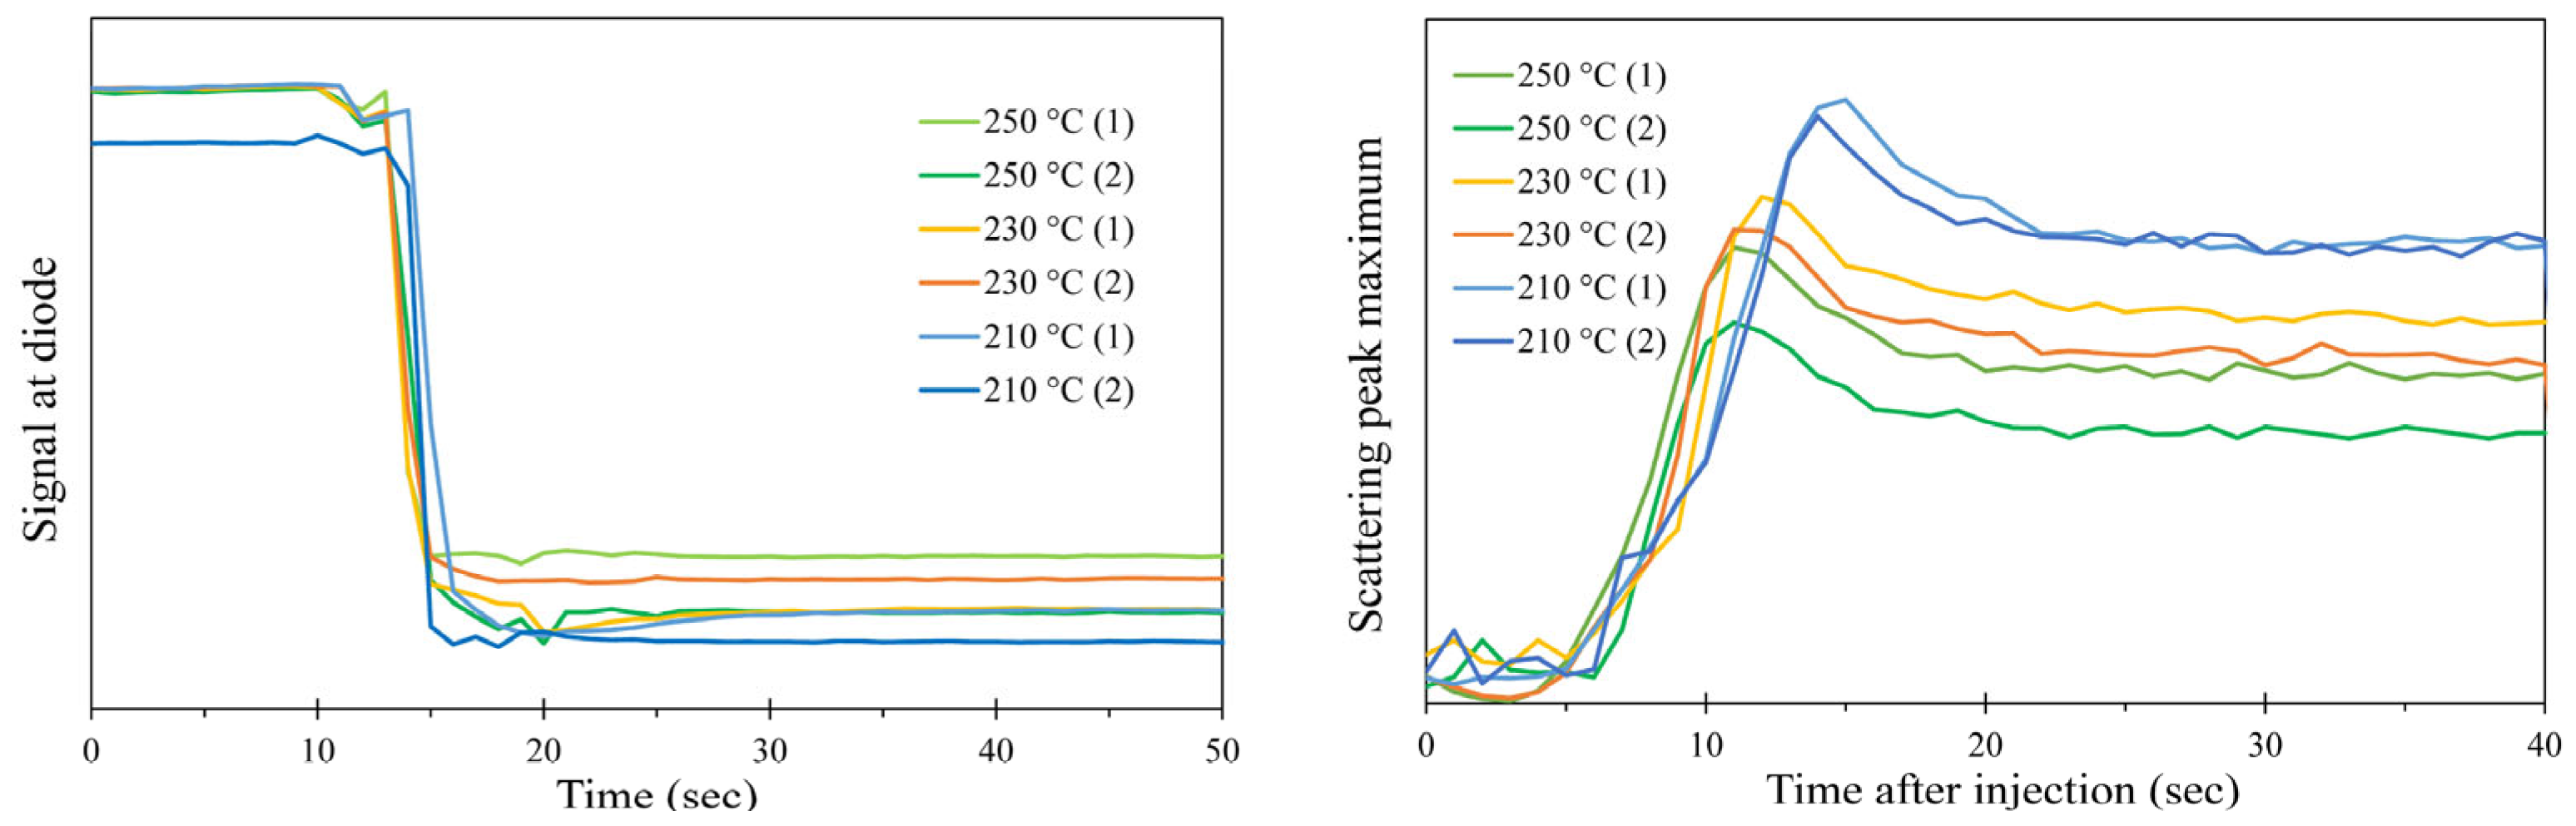
3.2. Reproducibility

The major advantage of injection moulding as a manufacturing technology is its ability to produce large numbers of identical parts with the same surface finishes, without requiring extensive post-processing. In this section, we explore whether this level of reproducibility extended to the structure and morphology of the part. By this, we mean that we will explore whether the characteristics of the time development of the structure and morphology were equivalent in repeated parts, rather than whether the molecular organization was identical at an atomic level. Figure 8 shows time sequences of SAXS patterns recorded during an injection moulding cycle for PP3; the first image is for the empty mould cavity, the time resolution here is more or less a second between successive images, and time runs horizontally.
The time sequences are in pairs, the top two are for an injection temperature of 250 °C, the middle pair is for 230 °C, and the lowest pair is for 210 °C. We can observe two trends looking at these images. The first is that the emergence of the crystalline pattern is slower at 250 °C than at 210 °C, and the second is that there is a distinct level of preferred orientation in the patterns at lower injection temperatures, as there is a great intensity in the horizontal section compared to the vertical section of the rings. This latter trend can be associated with the shorter time between the flow and the subsequent nucleation of crystals. This shorter time will mean that the longest chains extended in the flow will not have relaxed by the time crystal growth of the matrix begins. We also show plots of the transmission versus time and the height of the peak in the integrated plot in Figure 9 (see Section 3.1).
A visual inspection of the pairs of time-equivalent SAXS patterns in Figure 8 for the three different experimental temperatures shows that the time sequence of the development of the SAXS patterns is the same for repeated runs. We calculated the χ2 parameter for each pixel in essentially time-equivalent pairs using Equation (2):
χ 2 = I p x 1 I p x 2 2   σ 2
where Ipx1 and Ipx2 represent the intensity of the same pixel in images 1 or 2, respectively, and σ is the standard deviation of the first point. As the Pilatus detector is a photon counting system, the standard deviation is given by (Ipx1)0.5. These images based on these χ2 values are shown in Figure 10. We have plotted the value of ∑χ2/n, where n is the total number of pixels in the image, for each difference image shown in Figure 10, for each of the three experimental temperatures as a function of time, and the total values of χ2 for each image are shown in Figure 11.
Inspection of the curves in Figure 11 confirms the reproducibility of the successive time-resolving sequences. We can see that when crystallisation is initiated at all temperatures, but particularly at the lower temperatures, the values of χ2 rises slightly. As the images are changing more rapidly with time, the small errors in time equivalence between images are more significant.

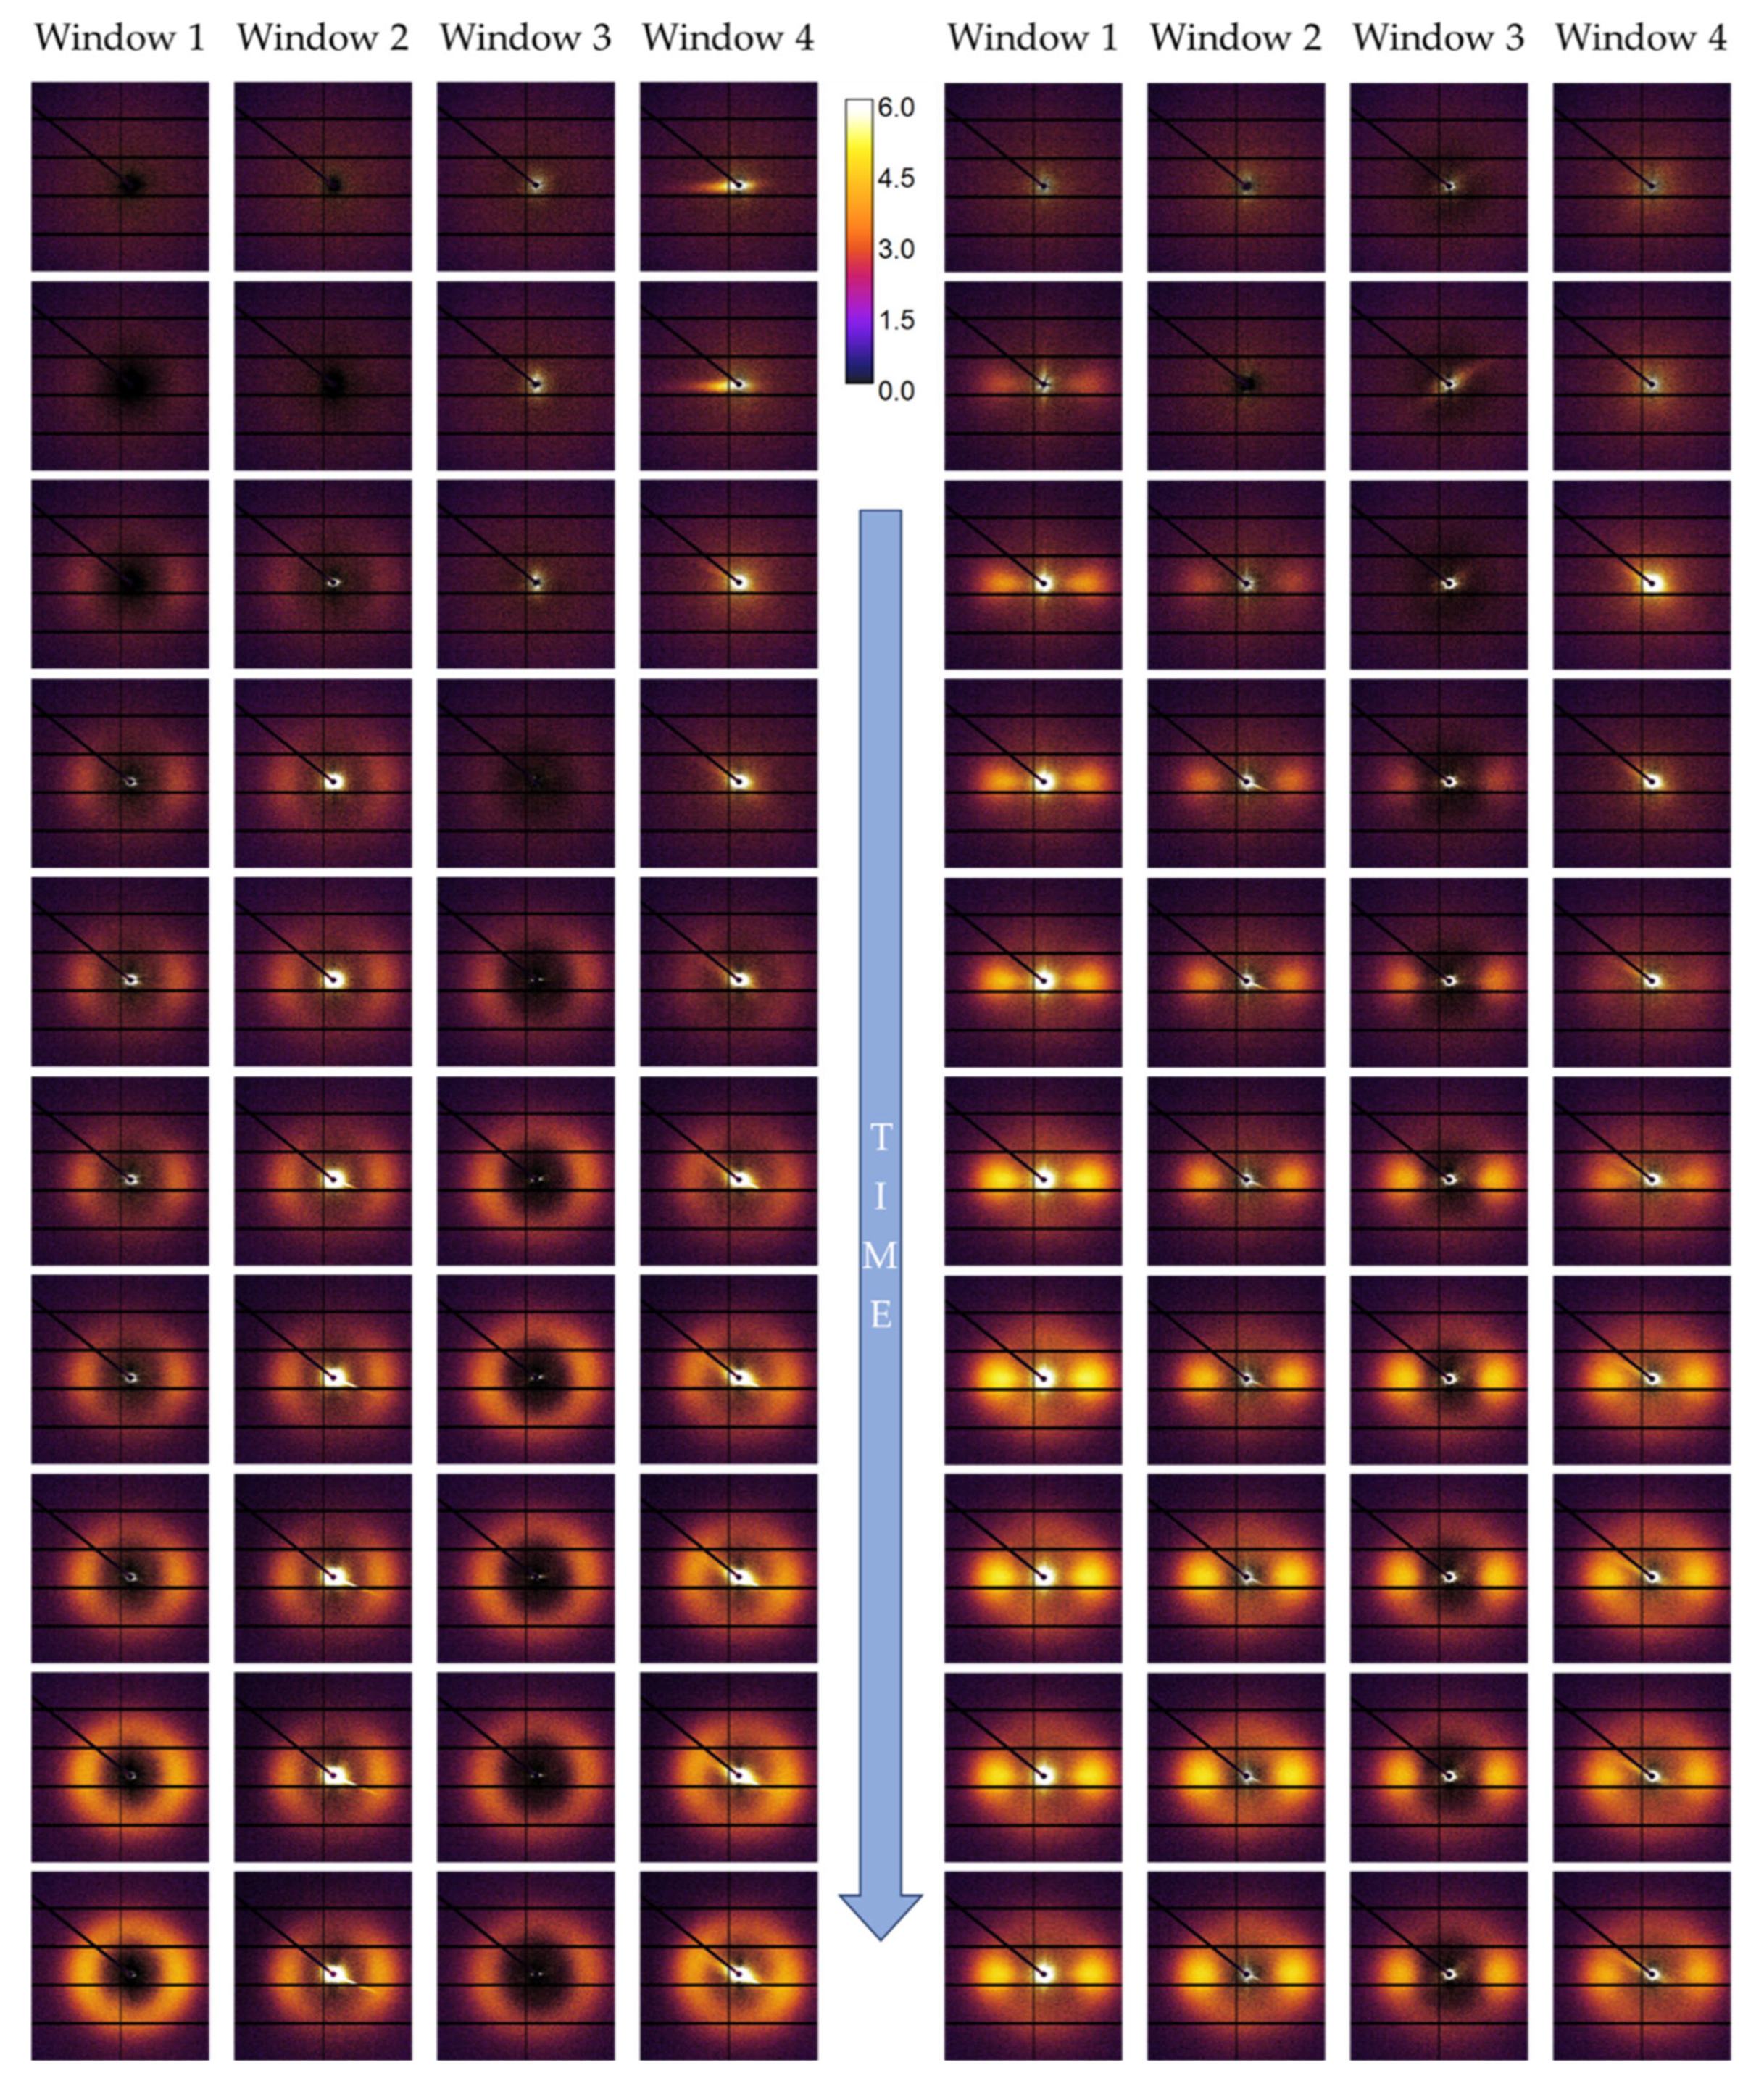
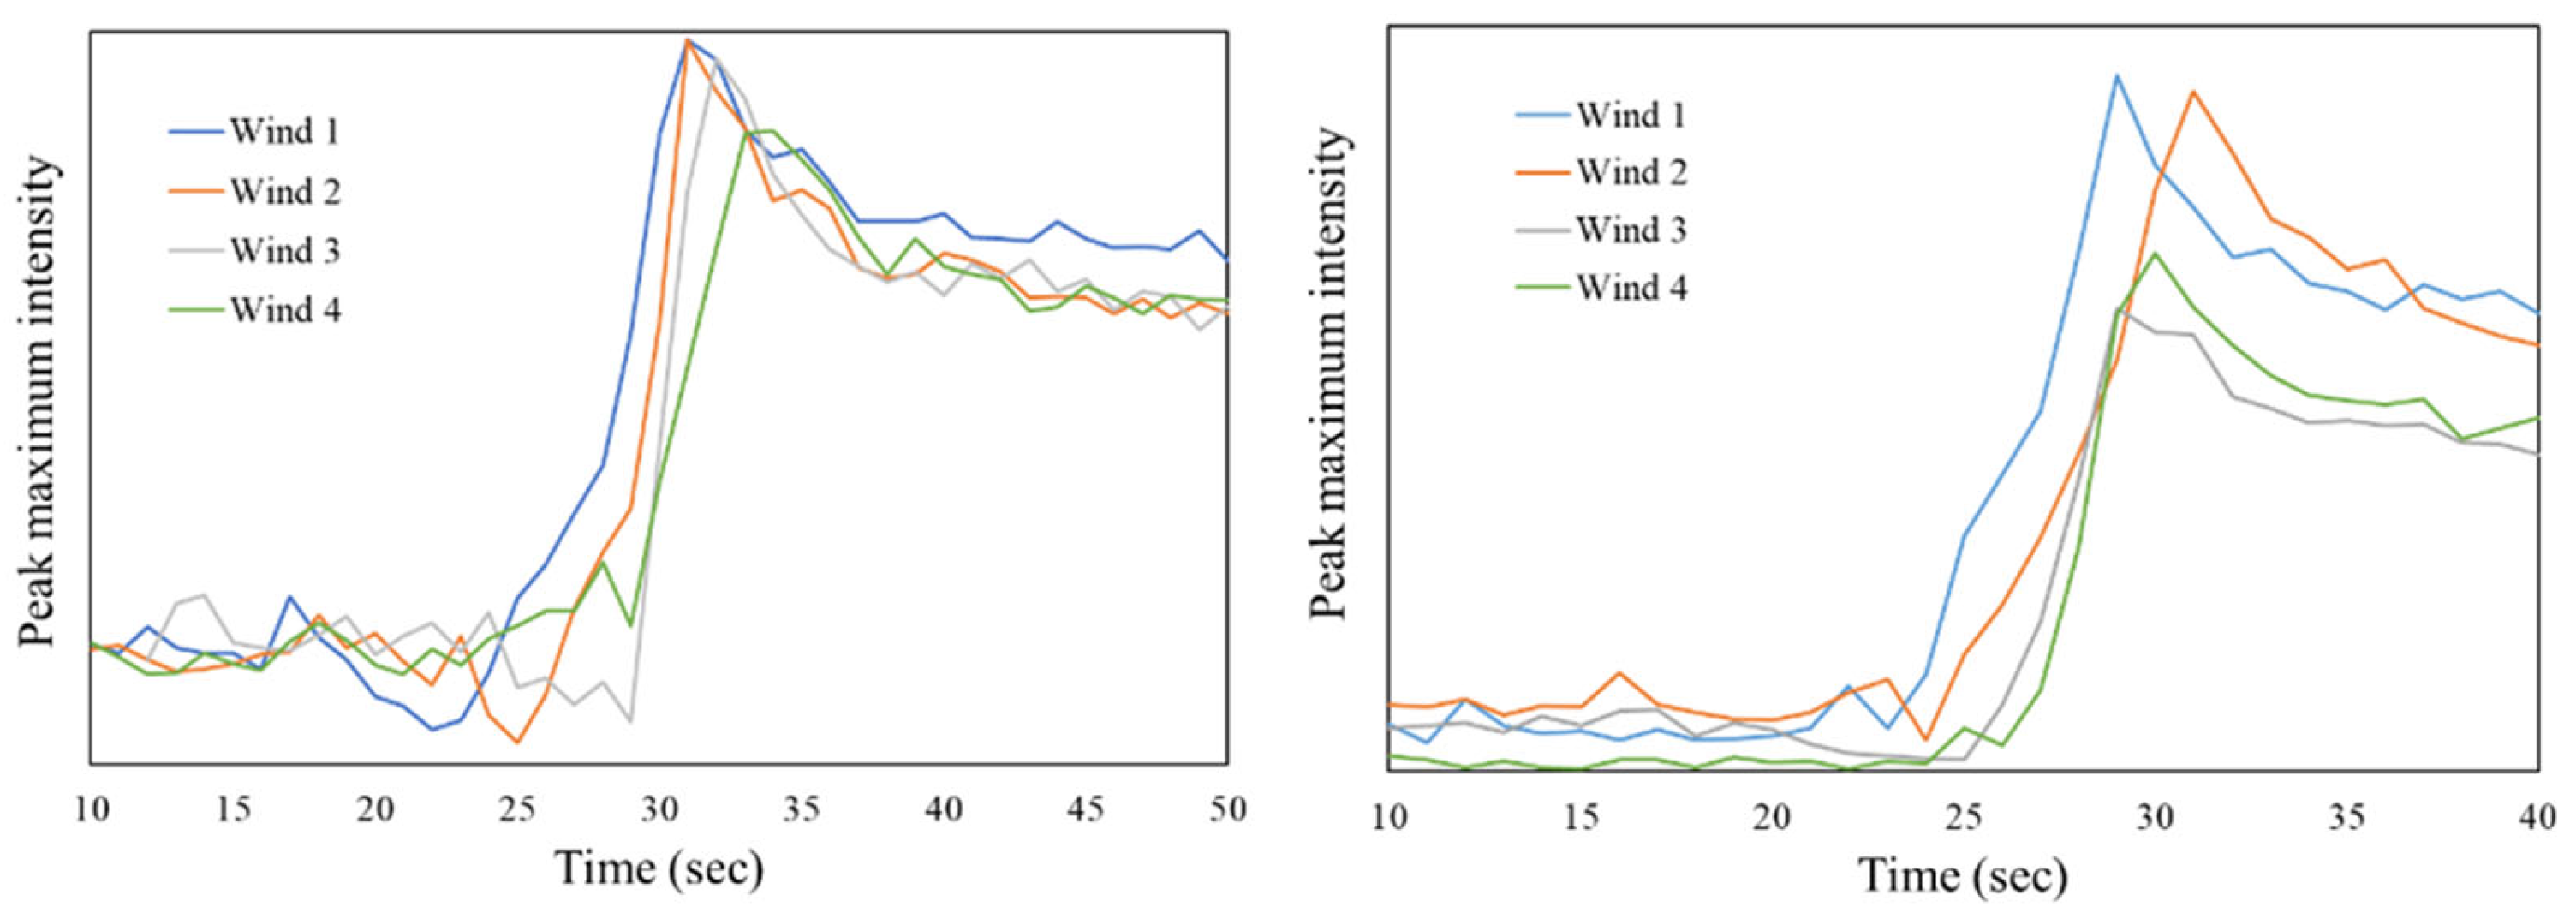
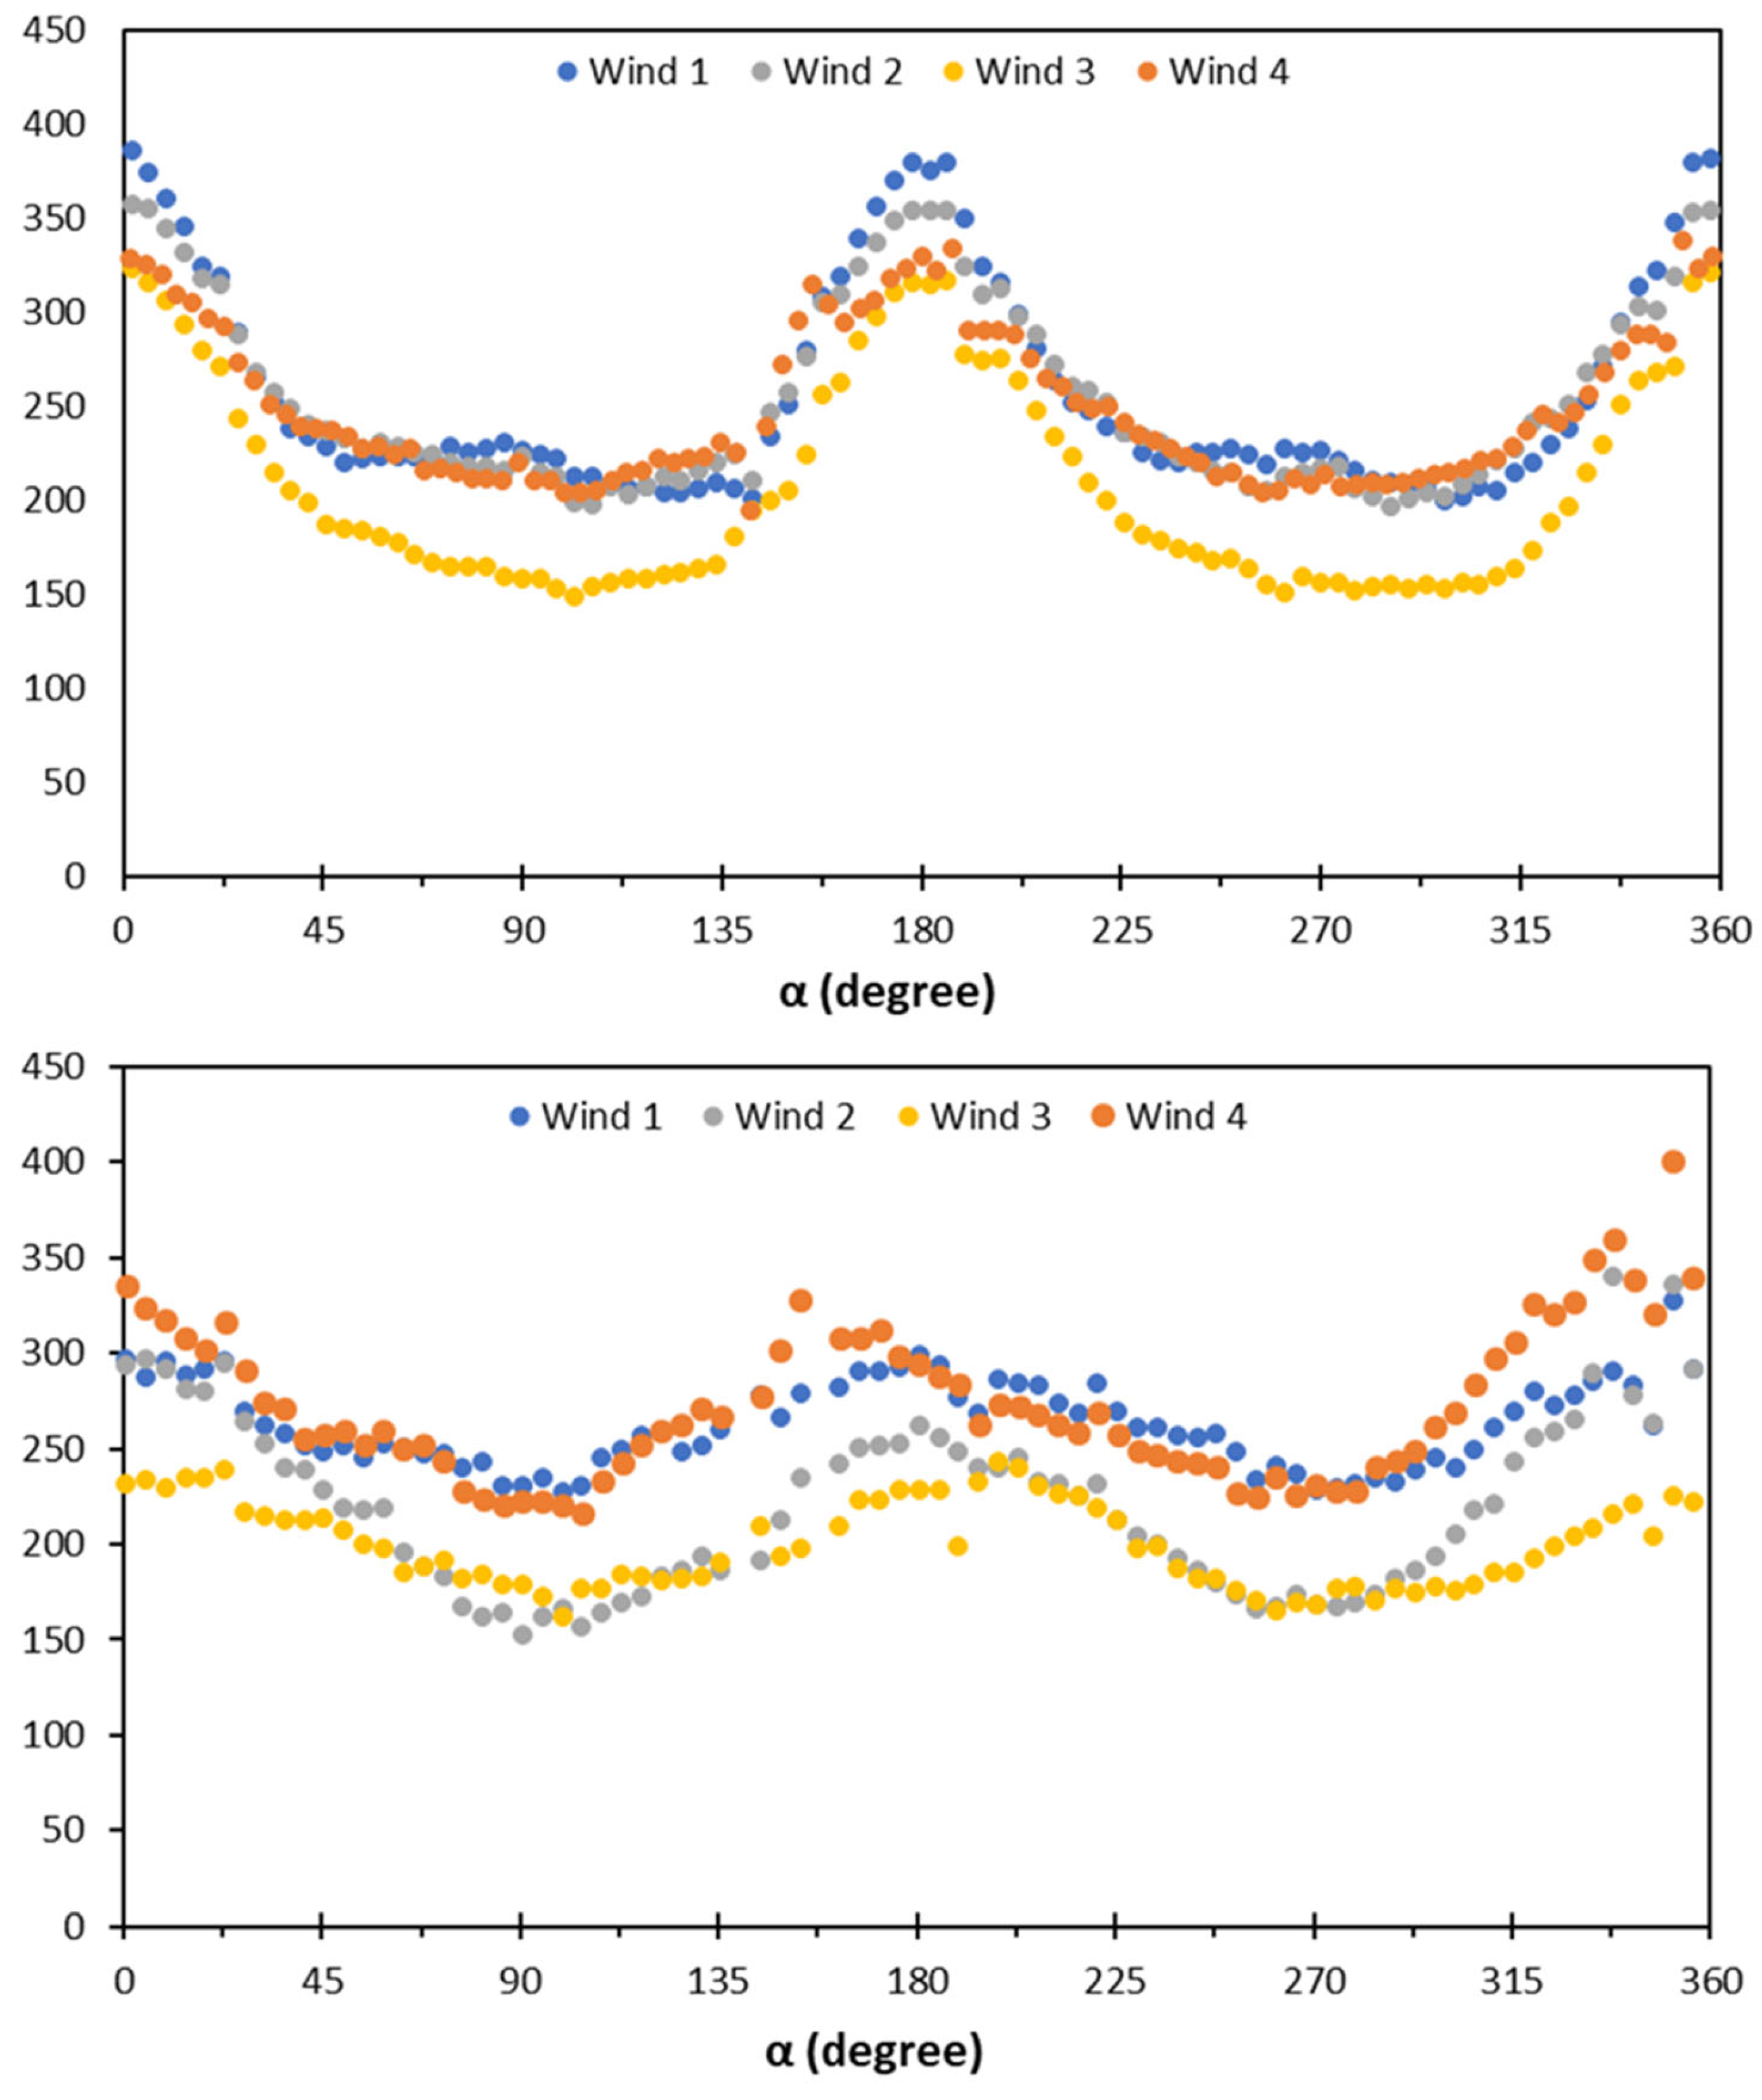
3.3. Spatial Variations
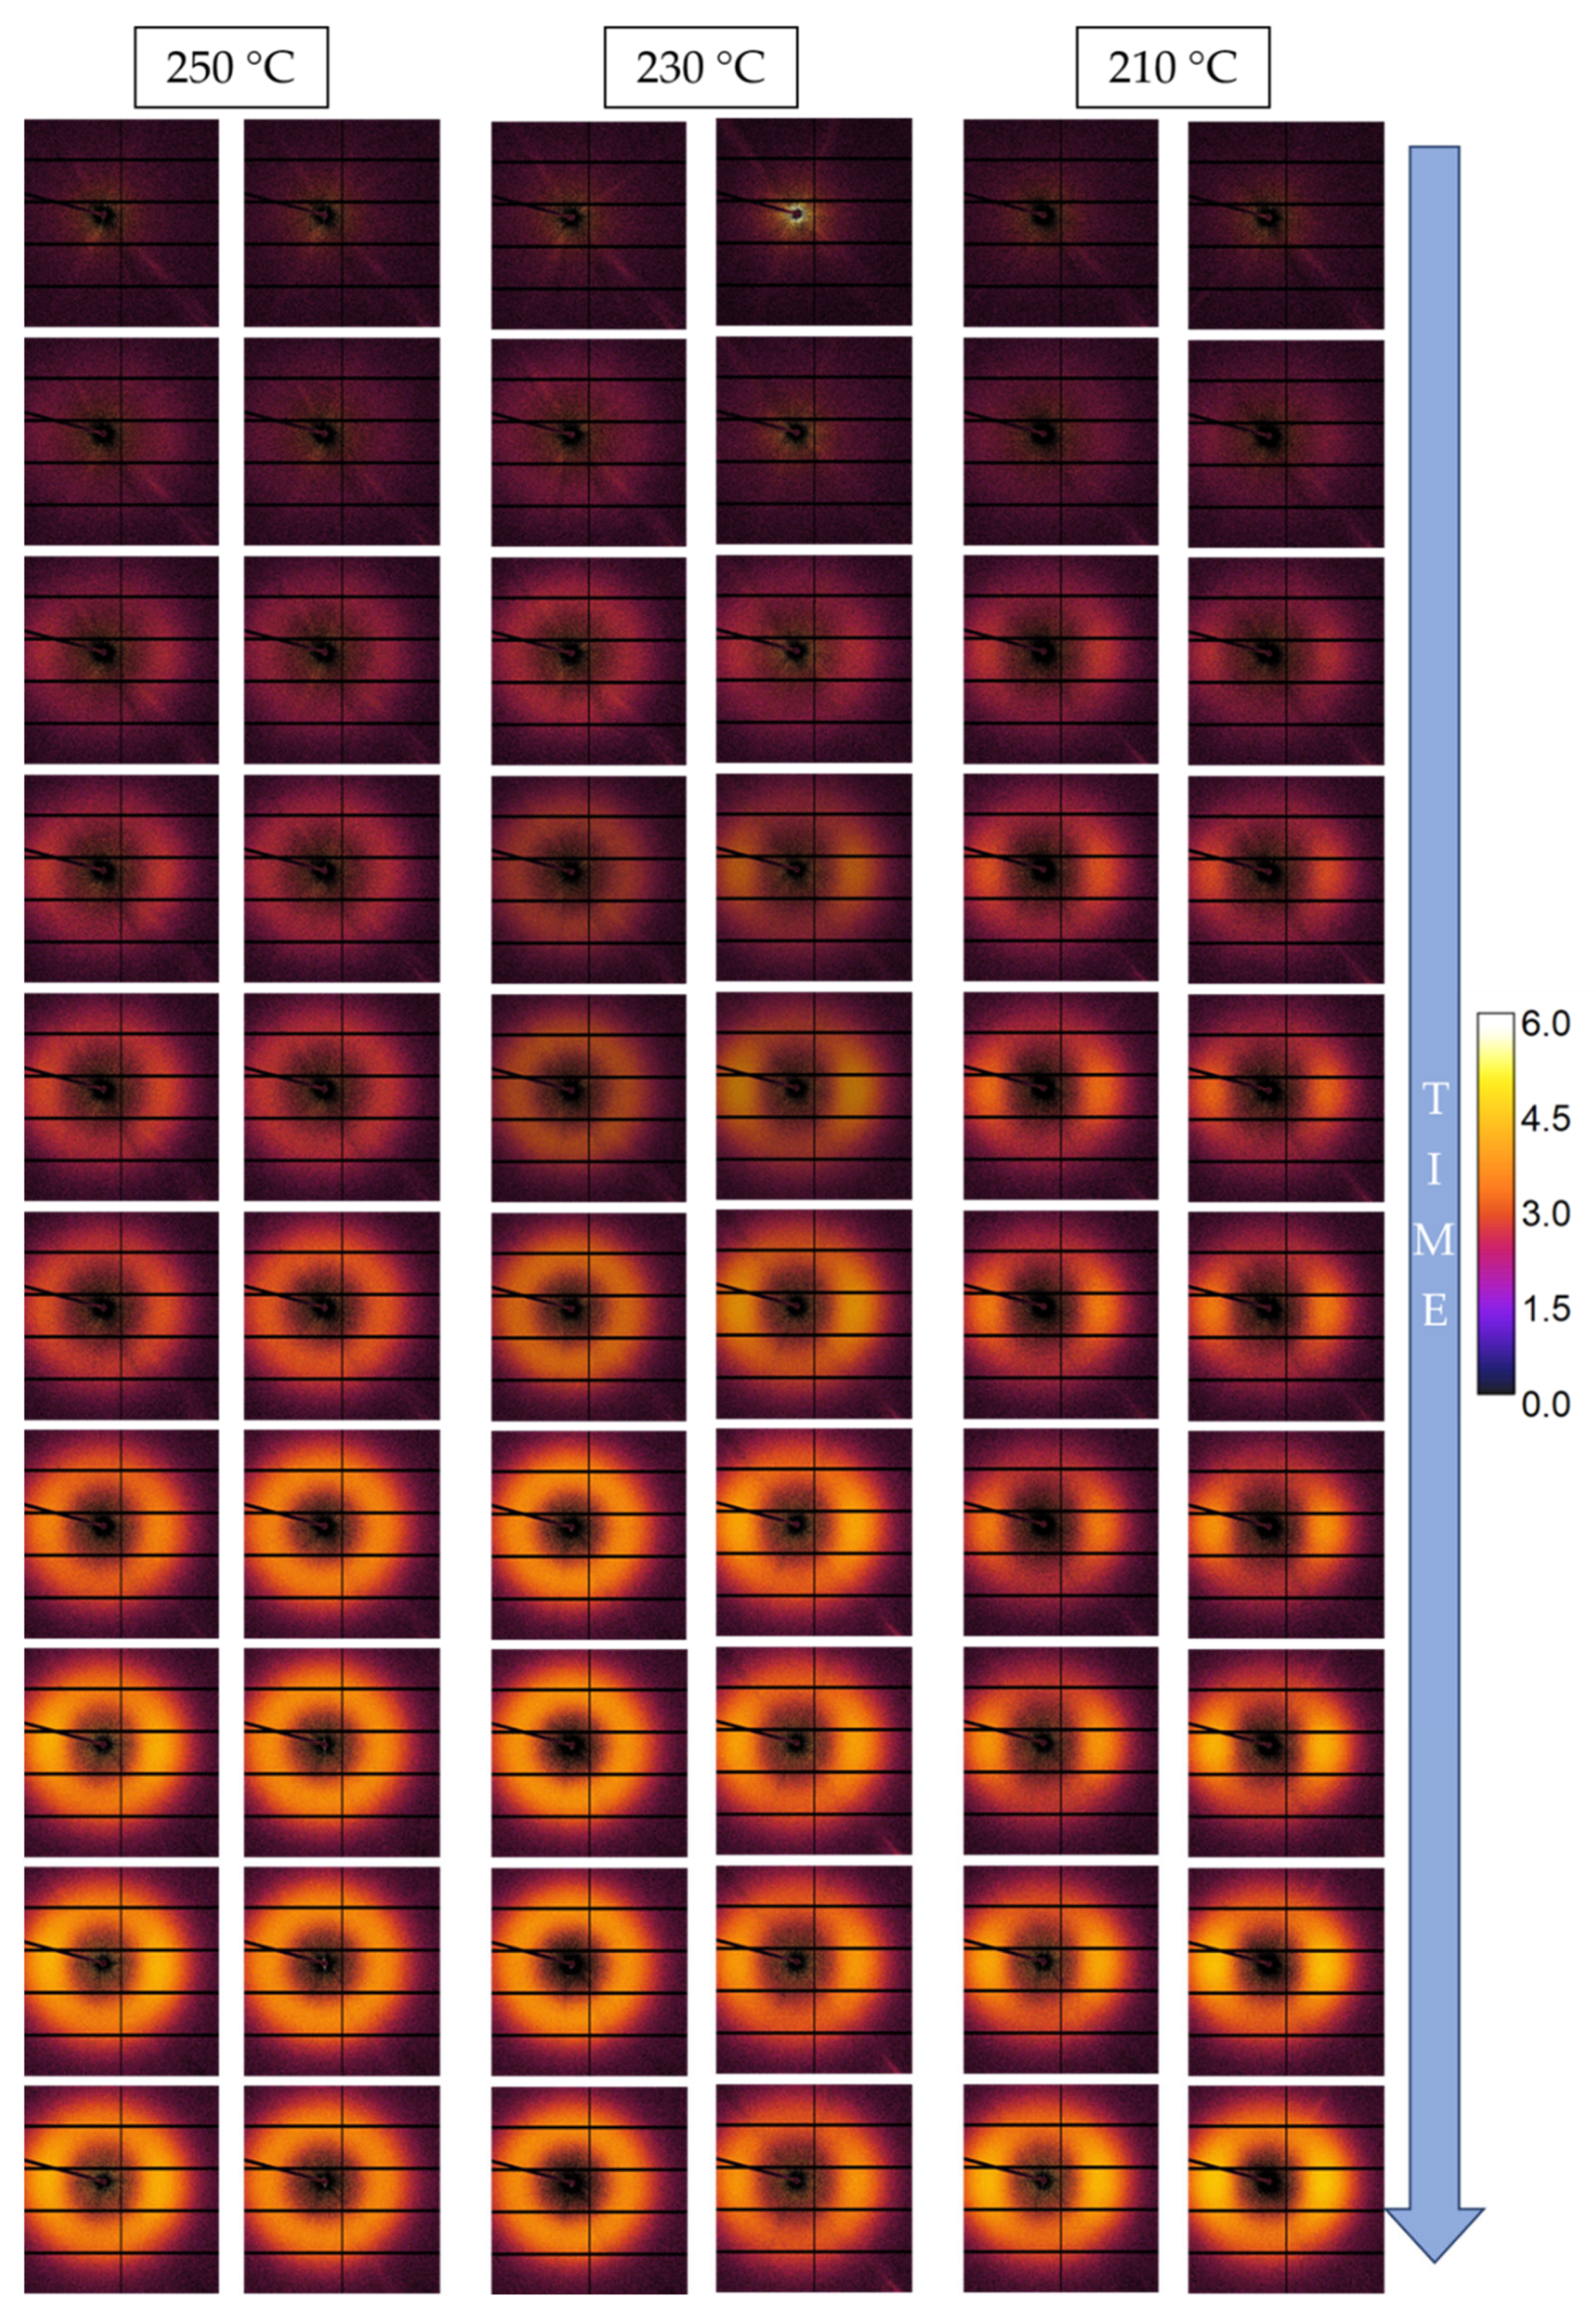
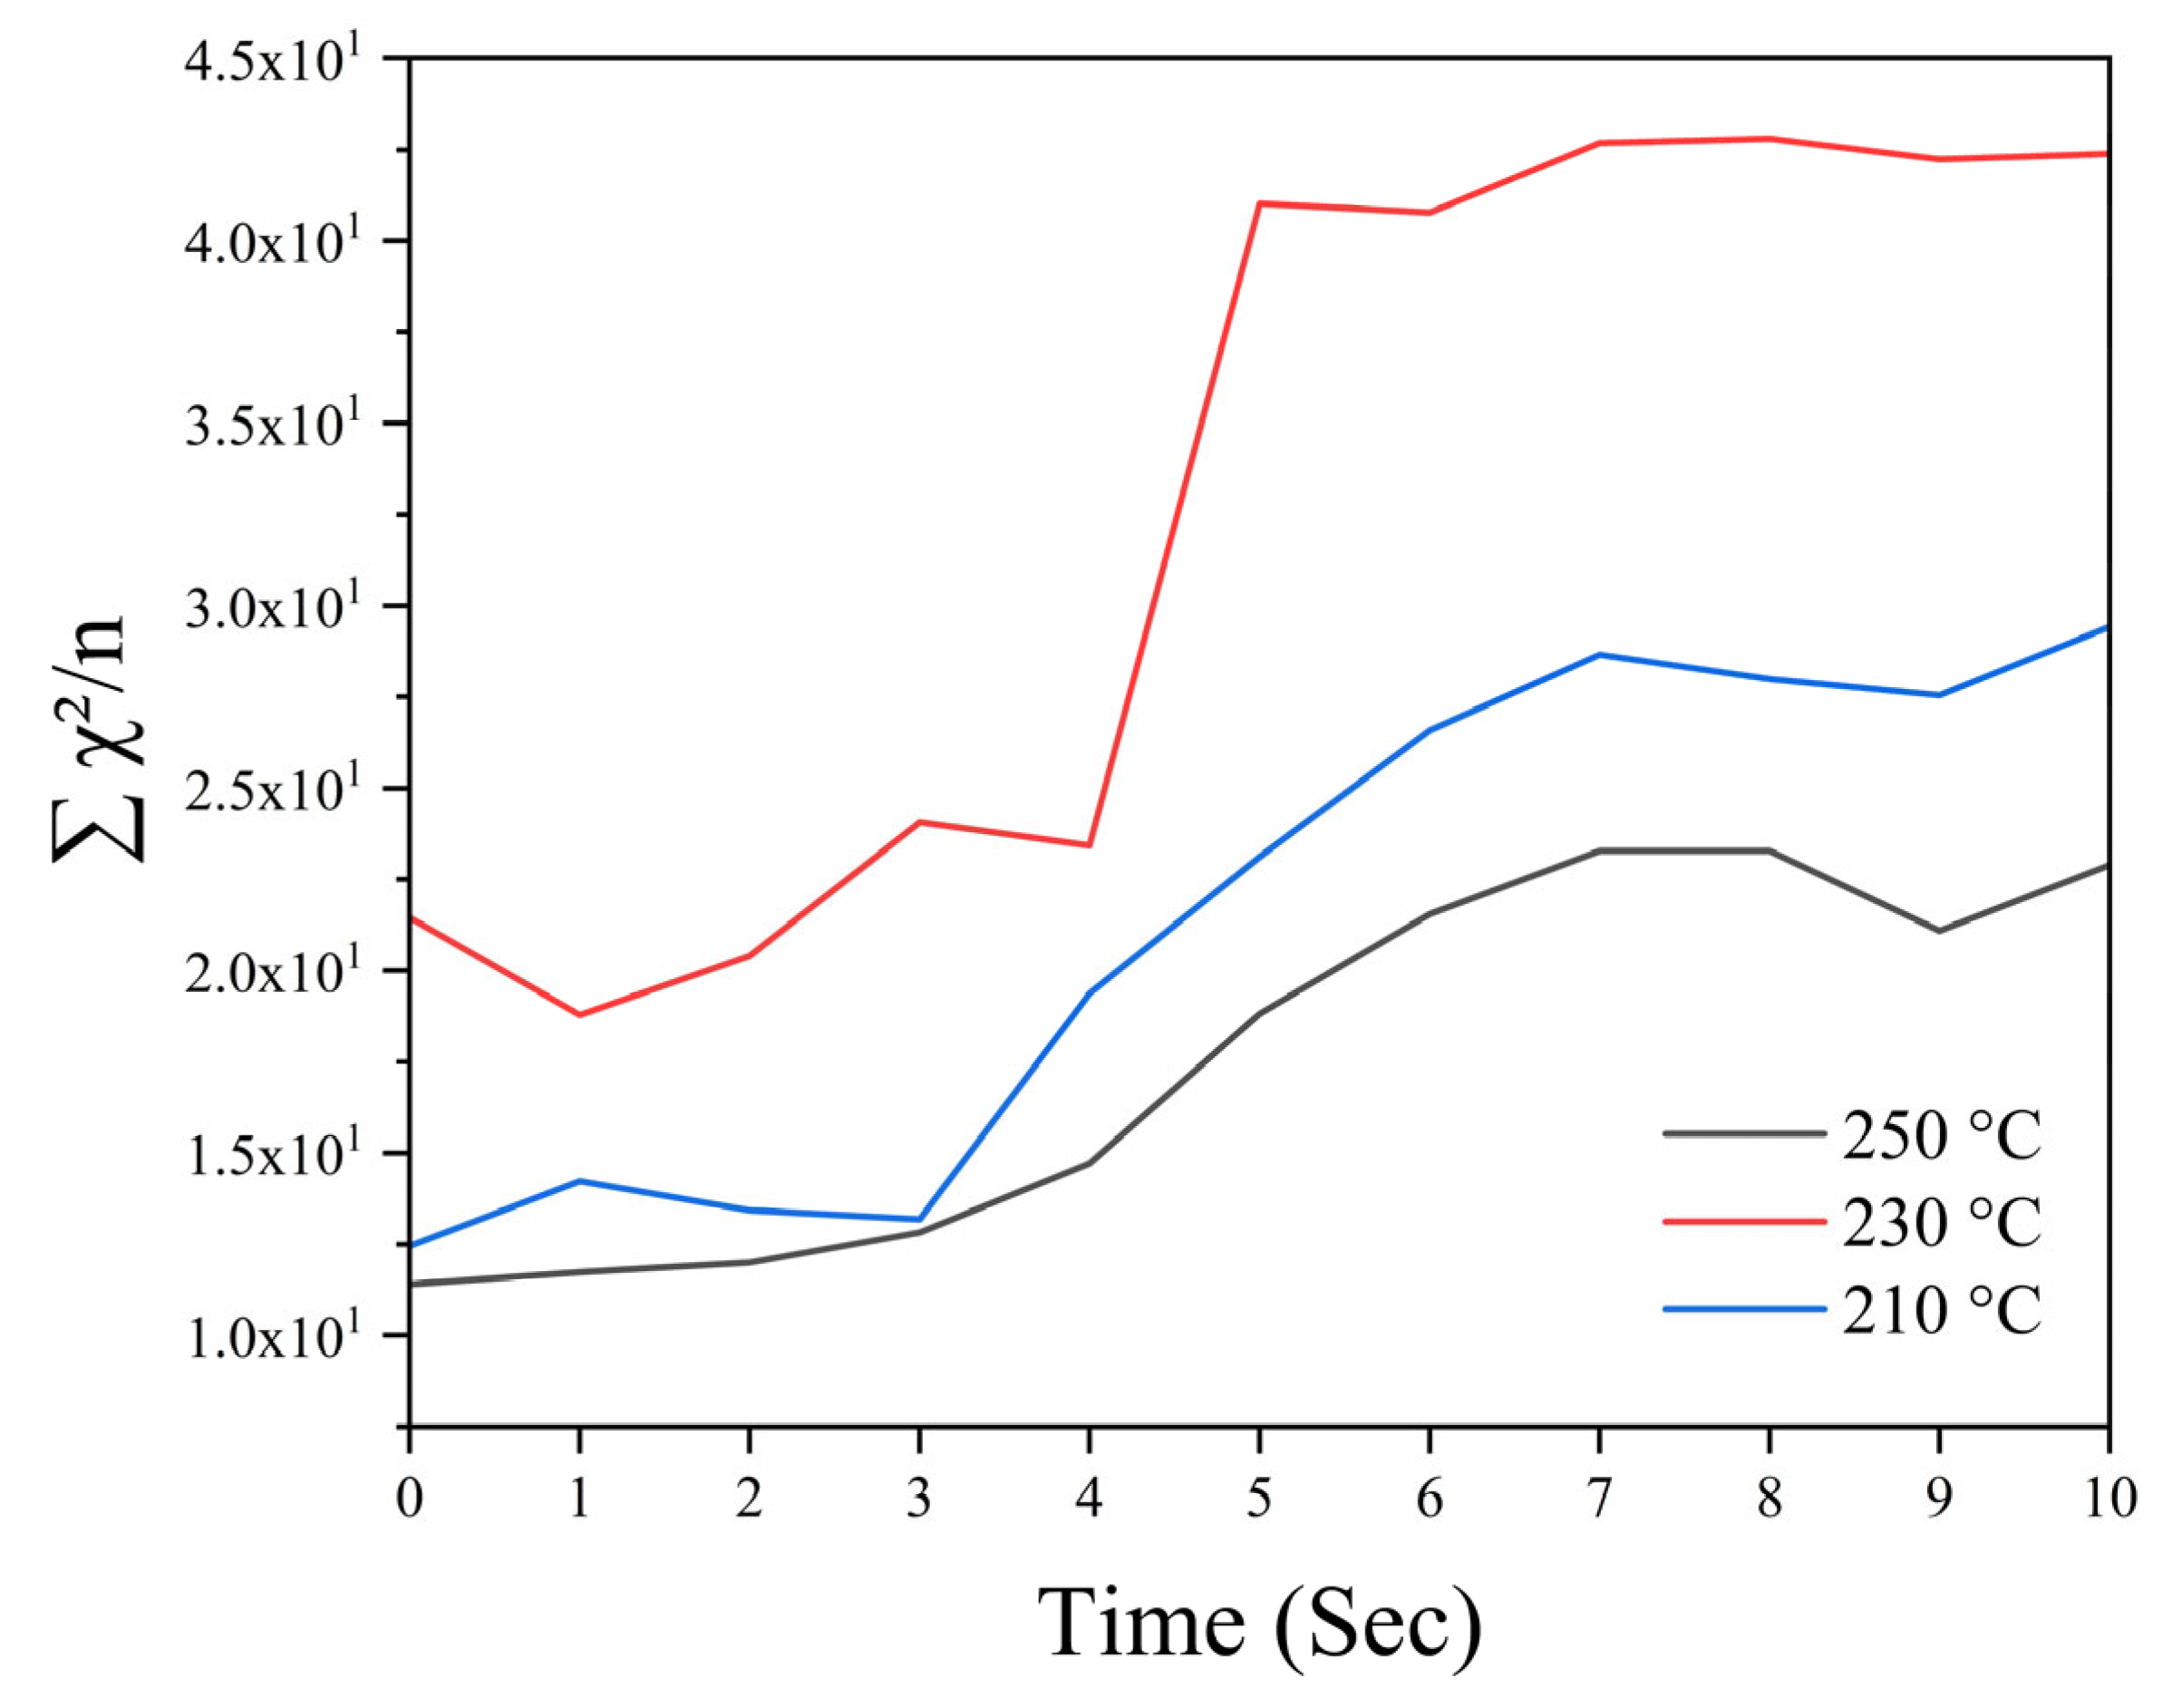
The constraints on the design of the mould cavity limit sampling the SAXS data to one of six predetermined positions, corresponding to the positions in the mould insert where the mould material has been thinned sufficiently to allow adequate transmission of the incident and scattered beams through the mould inserts. Now, of course, the challenge of predetermined positions is that they may not be the ideal position for extracting data or comparing to the predictions of a simulation. We emphasise here that it is straightforward to fabricate an alternative mould insert with optimised positions and install it in an injection moulding system. Here, we report on measurements made using the standard mould insert, in which six windows are distributed evenly along the central line of the mould, with a standard spacing of 11 mm. Figure 12 shows the time-resolved sequences of SAXS data for the first four windows of the mould. Each time sequence starts before the liquid plastic enters the mould cavity. Figure 13 shows the accompanying 1D plots for the time markers and the intensity of the equivalent peak to that shown in Figure 6, but for the images shown in Figure 12 as a function of time. The material is PP1 for the upper block and PP2 for the lower one; the temperature of the molten polymer was 210 °C, and the mould temperature was 50 °C.
It can be seen from Figure 12 that the entry of the liquid plastic into the area of mould cavity in line with the windows is delayed by ~1 s from window 1 to window 2 and so on to window 4. The consequence of this is that the development of crystallinity in that material is also delayed from windows 2, 3, and 4, as can be seen in Figure 13. We can also notice that the time sequences for windows 2, 3, and 4 are similar to those for window 1. Figure 12 shows that the development of crystallinity in the relevant parts of the mould cavity vary from window 1 to window 4. We speculate that it is related to a reduction in the temperature of the liquid plastic as it moves along the length of the mould cavity. In future work, we will consider the value of extending the length of the mould cavity in order to enhance this possible effect.

3.4. Time Variation

The preceding sections have demonstrated the data that are available in these operando X-ray scattering measurements of injection moulding. The availability of digital data means that it is possible to access more information by simple manipulations of the data. For example, Figure 14 shows the first two images in a time resolving time sequence for the injection moulding of PP2 with an extrusion temperature of 210 °C and a mould temperature of 50 °C. As with all of the data shown in this work, each of the images is receiving the cumulative scattered intensity for the structure formed since the start of the moulding processing.
The image shown in Figure 14B is that shown in Figure 14A plus the data recorded for the structure development in the second time interval. Now, it is interesting to ask the question: is the crystallization that takes place in the 2nd second the same as what takes place in the first second? Figure 14C reveals the answer to this question, and, clearly, the answer is yes. The additional level of scattering is low. We can see that the lobes of the lamellar stack scattering are essentially the same as in the first second in terms of azimuthal breadth. However, there is a small shift in the peak position, arising from a change in temperature. Now, we can extend the questions to the 9th and 10th images. Even in this case, the idea that elaborates the characteristics as the same can be supported. It is also possible, in this case, to distinguish between the formation of a second, more isotropic structure, highlighted by the fact that a more visible scattering ring is forming around the lobes. This, again, confirms a change in the temperature in the cooling system, causing a different lamellar reorganization. We emphasise the self-evident value of even brighter sources, which will increase the signal/noise ratio in such difference images.

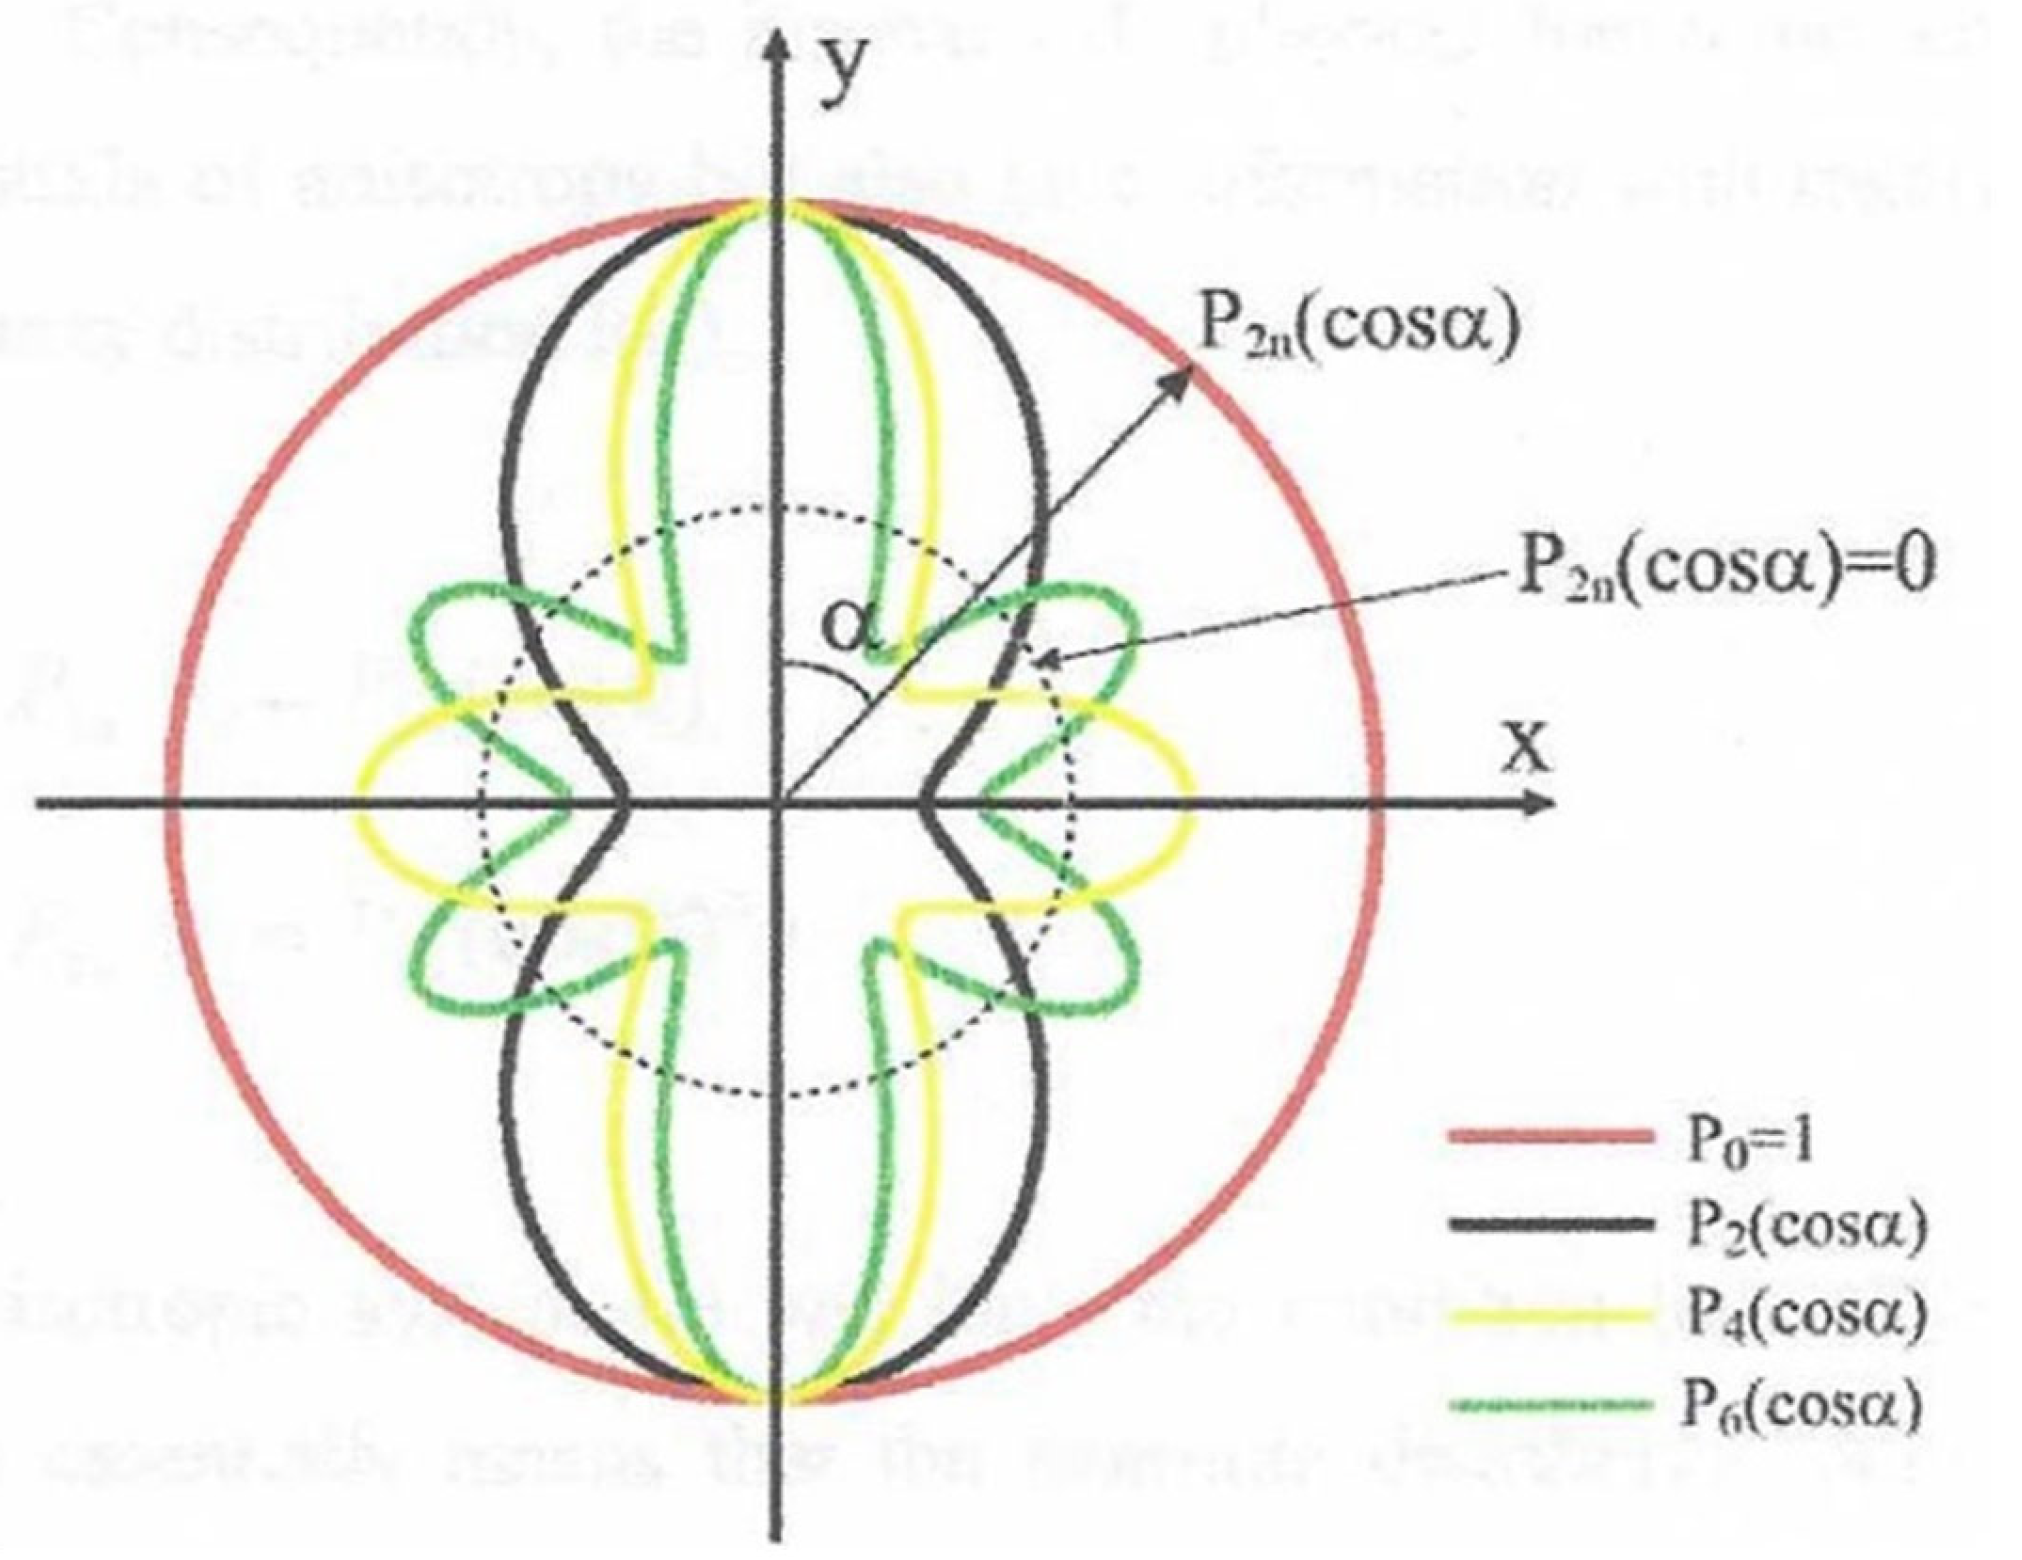
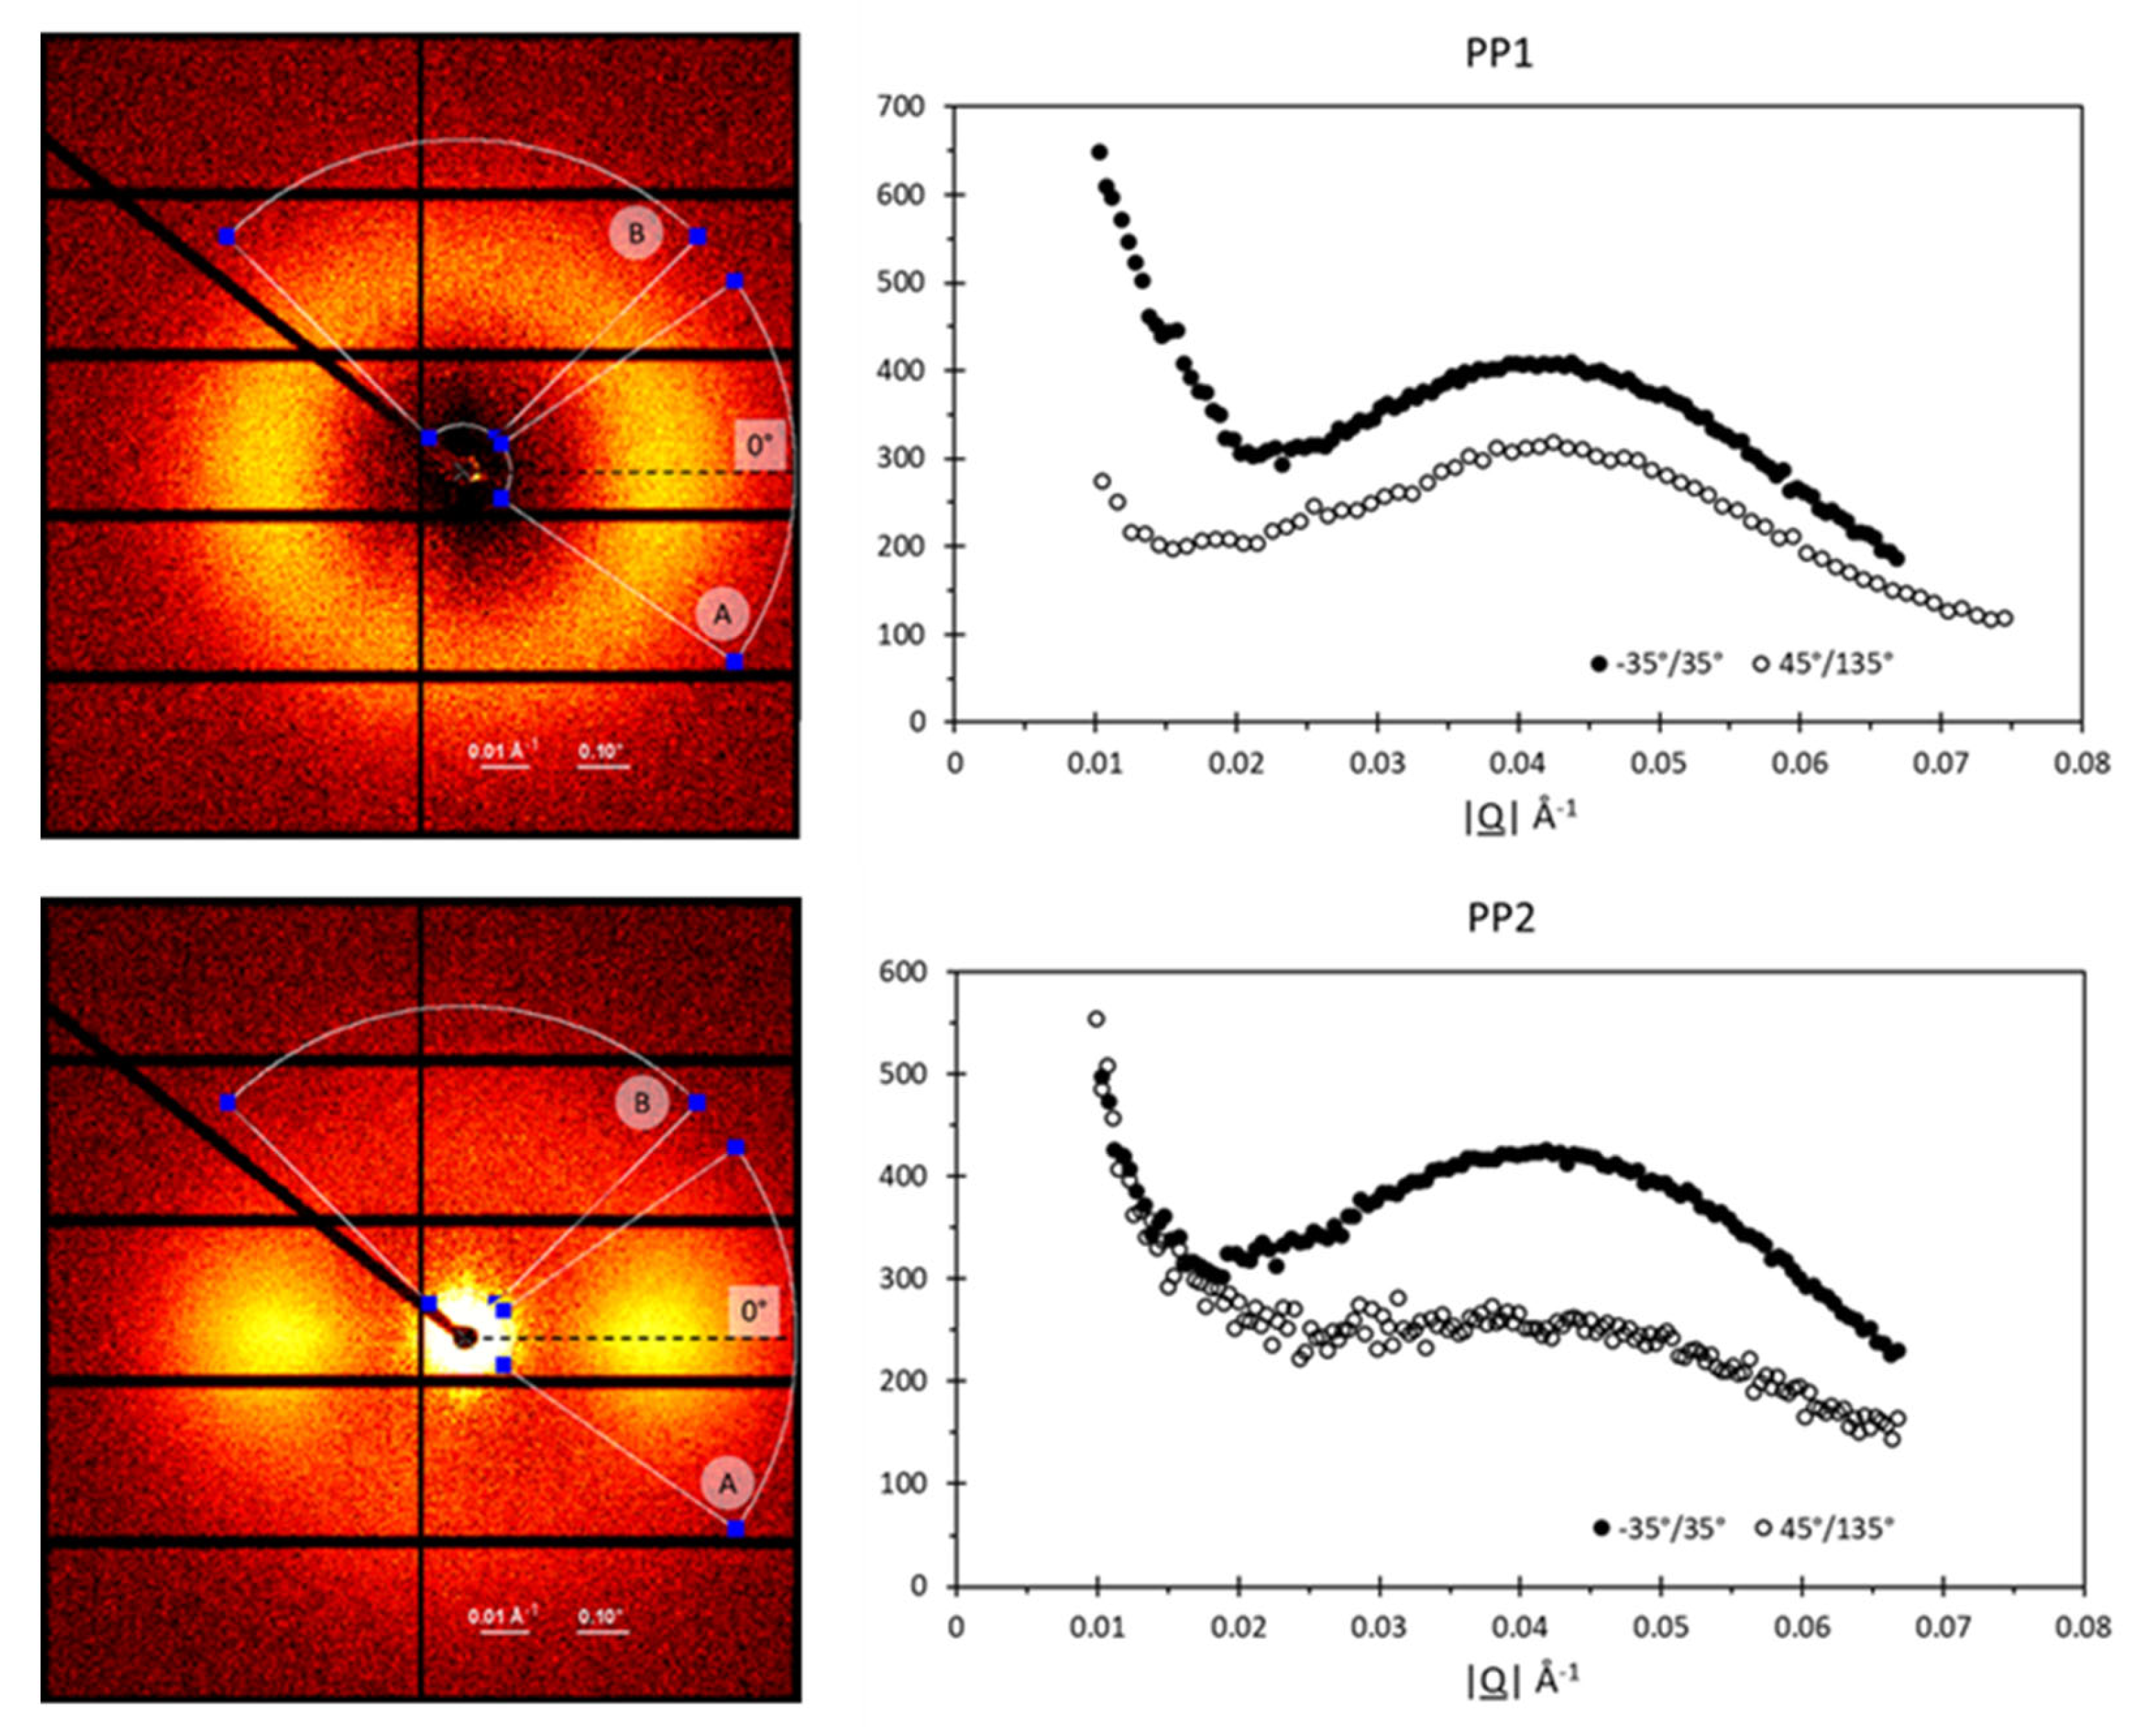
3.5. Preferred Crystal Orientation

The flow fields inherent in the process of injection moulding with plastics may lead to formations of a preferred orientation of the lamellar chain-folded crystals. As the focus is lamellar crystals, the vector to define the preferred orientation needs to be defined. Perhaps the most evident is the vector normal to the fold surface of the chain-folded crystal. This may, in some cases, present problems, as the chain-folded crystals are not always planar, and, as Keller et al. showed for some polyethylene samples, the crystals may be twisted [28]. This is not the case here, but perhaps a more specific vector is the growth direction of the chain-folded crystals. This is well defined by the crystallography of the crystals.
Information of the level of preferred orientation can be obtained from the azimuthal variation in intensity I(α) at a constant value of |Q|. Figure 15 shows the azimuthal variation in the intensity of the lamellar crystal stack scattering (Figure 5b) for SAXS patterns recorded for the injection moulding of PP1, with a polymer melt temperature of 210 °C and a mould temperature of 60 °C for time-equivalent images for the four window positions previously considered. α = 0 is defined as parallel to the flow direction, which is horizontal in the SAXS patterns recorded in this work. Mitchell and co-workers have developed and used a robust mathematical methodology to evaluate the anisotropy from X-ray scattering data [29,30,31]. The basic method is encapsulated in the equations below:
I 2 n ( | Q _ | ) = ( 4 n + 1 ) 0 π / 2 I ( | Q _ | , α ) P 2 n ( cos α ) sin α   d α
where P2n(cosα) are a series of Legendre Polynomials. In this work, only the even orders are required, due to the inversion centre in the scattering pattern for a weakly absorbing sample, such as the hydrocarbon-based polymers used. Equation (3) identifies the fraction of the shape of the intensity (I|Q|,α) in polar coordinates, with each of the harmonic functions shown in Figure 16, and then scaling that with the scattering for a perfectly aligned system.
< P 2 n a cos ( α ) > = I 2 n a ( | Q _ | ) I 0 a ( | Q _ | ) ( 4 n + 1 ) P 2 n m ( cos α )
where Pm2n (cosα) are the normalised amplitudes for the scattering of a perfectly aligned system. The data shown in Figure 15 show a modest level of anisotropy for PP1 compared to the higher level of anisotropy exhibited by the data for PP2. In both cases, the maximum scattering is observed at α = 0° and 180°, indicating that the lamellar stack is arranged parallel to the flow direction, with the lamellar growth direction perpendicular to the flow direction, as is expected for a system nucleated by row nuclei [20,21,32].
We applied the methodology of Mitchell and co-workers to evaluate the orientation parameters for the data in Figure 15, and the results are shown in Table 3. The series of orientation parameters describe the amplitudes of a series of spherical harmonics that describe the orientation distribution function D(α). These values, and higher order values where required, can be used to recreate the orientational distribution function for the normals to the chain-folded lamellar crystals. For highly aligned systems, probably the first 11 or 12 orientation parameters are required, but, for more intermediate levels of orientation, probably 5 parameters will suffice. Figure 16 shows a plot in polar coordinates that shows the amplitudes of the function P2n(cosα).
These are normalised amplitudes that range from 1, for an orientation distribution function with all of the structural units with a common alignment, to 0, for an isotropic distribution where all alignments are equally possible. These parameters can be calculated as a function of time for a fixed sampling position, or as a function of position, as shown in Figure 15. The curves shown in this Figure underline the importance of the alignment of the injection moulding system on the beamline. For these data, window 1 was aligned so as to position the incident beam in the centre of the window, and then we used the information of the positions of the other windows from the matching process. In future work, we will perform the alignment of each window on an individual basis and use the translation stages to move to each defined position based on the alignment.
Figure 17 shows the results of integrating the data over a specific azimuthal range to enhance the signal-to-noise ratio, as the random fluctuations about a mean value inherent in photon counting systems rapidly cancel out. The differences in the resultant curves shown in Figure 17 reflect the different levels of anisotropy present in these two samples.
In Table 4, the calculated long period Lp values (see Section 3.1) for the profiles shown in Figure 16 are reported.

4. Discussion

The data shown in Section 3 underline the variety of data available and their quantitative nature. It is possible to obtain adequate quality SAXS patterns in 1 s, use these to follow the arrival of the liquid plastic in the mould cavity, and subsequently follow its transformation to a semi-crystalline solid. We are able to observe variations in the temperature of the plastic through the change in the long period peak position. We are able to quantitatively evaluate the level of preferred orientation of the lamellar chain-folded crystals that form as a function of time. Through simple and rigorous manipulation of the data, we are able to follow the development of the morphology beyond the first second. The flexibility of the mould design means that it is straightforward to design and implement new mould cavities to evaluate specific aspects of the injection moulding process. In some cases, this will involve replacement of the mould inserts, and, in others, the mould plates will also need changing. As these are all standard components, the resources required to perform these experiments will be minimised. Although the work reported here was focused on standard isotactic polypropylene resins, the injection unit has an upper temperature of 420 °C, so a much wider range of materials can be studied. The mould temperature is maintained using two industrial recirculation units and a switch to enable both heating and cooling modes. The full range of processing parameters can be varied. The injection unit is fitted with an Euromap interface that facilitates the addition of other components into injection moulding systems. In future experiments, we will be implementing the triggering of the injection moulding cycle by the hardware and software of the beamline to start the moulding cycle after collecting 10 SAXS patterns. Other developments planned include the rapid heating of the mould using induction heating [33,34] and other methods. Future experiments will also include a wider range of materials, including bioplastics such as polyhydroxybutyrate and polybutylene succinate.
The data reported in this work were obtained using isotactic polypropylene, a material widely used in industry for injection moulding. There are other semi-crystalline polymers that are based on C, H, O, and N, and whose X-ray absorption coefficients will be similar to polypropylene and present no problems. Chlorinated polymers, such as polyvinylchloride, will be more challenging, as the WAXS is dominated by the higher atomic number Cl atoms [35]. The additional absorption due the high chorine content will reduce the signal-to-noise ratio and may require a thinner part, making it less representative of industrial practice. Amorphous polymers, such as Acrylonitrile butadiene styrene (ABS) and polystyrene (PS), represent another challenge, as they exhibit more or less homogenous structures on the scale probed by SAXS. Some useful information can be extracted from WAXS [36], but this equipment will be difficult to modify to enable WAXS to be recorded, unless high energy photons are used to reduce the scattering angle to the small angle regime. Filled polymers are a common class of industrial materials used in injection moulding. Again, the level of X-ray absorption may be a problem, but we have previously successfully performed SAXS/WAXS experiments on polyamide/glass fibre materials with up to 40% glass fibres [37]. Polyolefins with carbon black, graphene, or carbon nanotubes will present no problems, as the absorption of the filler is similar to the polymer. In summary, the current equipment is particularly suited to semi-crystalline polymers, with the possible exception of halogenated systems due to the increased absorption. This range of polymers includes the polyolefin family, polyoxymethylene, polyethylene terephthalate, polyamides, polyhydroxyalkanoates, polybutylene succinate, and related polymers. Polymers with fillers in small quantities can be easily accommodated, whereas polymers with high loadings of fillers can be easily studied if they do not present an excessive absorption of the X-rays.
In these first validating experiments, we settled on a time step of 1 s. This allowed 300 SAXS patterns to be recorded during the injection moulding cycle. Now, it would clearly be advantageous to decrease this time period, to 0.5 s or even 0.2 s. Of course, the more patterns recorded the more time is lost in resetting the detector and storing the data. The transmission measurement used to provide a timing marker for the arrival of the plastic in the mould cavity is also made in this 1 s data accumulation cycle. There would be an advantage of measuring this at a high frequency, but this would involve modification to the beamline system, and we will raise this if it becomes pressing requirement.
Reducing the time step for the data accumulation stage requires an increase in the brightness of the beamline. The source of the X-rays on the NCD-SWEET beam is a vacuum undulator and is already one of the brightest sources available. ALBA has a development plan, “ALBA-2” [38], which is focused on upgrading the ALBA Synchrotron Light Source from a 3rd generation source to a 4th generation source by greatly reducing the emittance of the storage ring. Undoubtably, the new facility will have a brighter NCD-SWEET beamline, the effectiveness of which will depend on many factors, including the beamline optics and the detectors. In the current configuration, the beamline can work from 6 keV to 20 keV, but it is optimised between 8 keV and 15 keV, where the best compromise between flux (2.0 × 10¹² ph/s at 12.4 keV), beam size (110 × 110 μm2 at 12.4 keV), and absorption is achieved. The undulator can go to 2 keV, but the remainder of the beam-line optics is not setup for this energy, and the channel cut monochromator would need modification. Moreover, the absorption of the sample and any windows for this energy of photons will be huge, and only few photons will be collected on the detectors.
There are a wide range of synchrotron light sources across Europe and around the world. These all have different characteristics and operate with different energies of X-ray photons. In the current configuration, there is a trade-off between the brightness of the source and the signal that will be measured in the detector. On the one hand, increasing the energy of the incident photons will increase the transmission through the aluminium alloy windows. There are many advantages of X-ray scattering with high energy photons [39], but, above an energy of 104 eV, the coherent scattering cross-sections fall more or less linearly with photon energy. As a consequence, although more photons will reach the sample through a higher transmission through the aluminium windows, fewer photons will be scattered to provide a signal at the detector. We are currently assessing the possibilities at alternative synchrotron light sources, and we will make a quantitative evaluation of the advantages of doing so.
A more immediate option is changing the nature of the windows. We have made simulations of the injection moulding process and evaluated the injection pressure required. Using this pressure, we have evaluated the effect on the thinned aluminium alloy windows. The main effect is that the temperature of the window area increases more than the surrounding mould when the plastic is injected, and, as a consequence, there is a small expansion of the height of the window area, and it leaves an almost imperceptible mark on the moulded product [27]. Once the temperature reduces, the window area returns to its original form. We will explore such simulations if thinner windows are possible to provide a greater transmission. Our current ambition is to maintain the industrial relevance of this injection moulding system, and so we have set aside the possibility of preparing windows with less absorbing materials, not least to avoid the problems of sealing the windows and creating gradients of thermal conductivity.

5. Conclusions

  • We have successfully developed and tested operando X-ray scattering measurements during injection moulding. We are able to obtain useful quantitative data on the rate of crystallisation, local temperature variations, and the pattern of preferred orientation of the lamellar crystals.
  • We are able to operate on a 1 s data cycle time, and the possibilities of reducing this to 0.5 s are promising.
  • The design of the injection moulding unit enables modifications to be made easily and controls the processing parameter.
  • On this basis of these validation experiments, we are poised to perform defined injection moulding cycles to test specific aspects of the process of transforming molten plastic into a shaped, moulded solid product.
  • These validation experiments have confirmed that the microscopic characteristics of the process of transforming molten plastic to solid plastic are reproducible with successive moulding cycles, and this opens up the possibility of exploring spatial variations within the mould cavity using the predetermined window locations.
  • We have been able to obtain quantitative time-resolving data that can be compared with the predictions of computer simulations.
  • We now have a quantitative test bed with which to explore new avenues and new procedures in the injection moulding of plastics; the opportunities for multiscale active feedback are exciting and move us closer to the realisation of a multiscale digital twin for injection moulding.

Author Contributions

Conceptualization, G.R.M. and A.M.; methodology, D.P.d.S. and J.M.; software, M.A.; validation, G.R.M., J.M. and A.M.; formal analysis, M.A. and G.R.M.; investigation, M.A., A.P.M. and F.A.G.; resources, A.M. and G.R.M.; data curation, M.A.; writing—original draft preparation, M.A. and G.R.M.; writing—review and editing, M.A., A.P.M., D.P.d.S., F.A.G., P.C., M.M., J.M., P.P.-F., A.M. and G.R.M.; visualization, M.A.; supervision, G.R.M., P.P.-F. and A.M.; project administration, G.R.M. and A.M.; funding acquisition, A.M. All authors have read and agreed to the published version of the manuscript.

Funding

This work was financially supported by the Fundação para a Ciência e a Tecnologia FCT/MCTES (PIDDAC) through the following Projects: MIT-EXPL/TDI/0044/2021, UIDB/04044/2020; UIDP/04044/2020; Associate Laboratory ARISE LA/P/0112/2020; PAMI—ROTEIRO/0328/2013 (No. 022158); plus EcoPlast, Materiais compósitos eco-sustentáveis para substituição dos plásticos convencionais, ref POCI-01-0247-FEDER-069002; and INNOV-AM funded by National Agency of Innovation M.A. is grateful for the support received from the Ministerio de Ciencia, Innovación y Universidades of Spain, with the mobility program of the grant “Ayudas para contratos predoctorales para la formación de doctoresas 2019”.

Data Availability Statement

The data obtained using the facilities of the ALBA Synchrotron Light Source are subject to the generic data management policy at ALBA CELLS, as can be accessed at https://www.cells.es/en/users/call-information-1/bases/2023_03_06_data_policy_cells.pdf (accessed on 19 September 2023). The experimental data identifiers are available from the corresponding author after the end of the embargo period.

Acknowledgments

The X-ray Scattering data presented were obtained at the ALBA Synchrotron Light Source in Barcelona in collaboration with ALBA Staff. We thank Paul Heiney of the University of Pennsylvania for granting a licence to use “Datasqueeze”.

Conflicts of Interest

The authors declare no conflict of interest.

Appendix A

The two mould inserts were mounted in the mould plates and were a key part of the mould cavity. These mould inserts were fabricated from an industry standard aluminium alloy AW 6082 [25]. These were machined with six cylindrical holes that had an initial diameter of 5 mm, which narrowed closer to the mould surface, with a diameter of 1.5 mm to reduce the area of the “window”. These holes stopped ~0.08 mm from the far side, so as to provide a “window” that would enable the X-ray beam to pass through without excessive absorption. The transmission was measured at ~70%, but this thickness was sufficient to withstand the high pressure in the cavity during the injection phase. This has been validated by simulation and by extensive testing. Of course, the precipitates in the aluminium alloy made a contribution, to the scattering but this was isotropic scattering with a smooth exponential decay away from the zero-angle position and was easily subtracted from each measured position. The aluminium alloy exhibited a stable structure over the temperature range to which it would be exposed to during the injection moulding cycle, which resulted in stable background scattering, simplifying its subtraction.
Figure A1. A CT scan of one of the mould inserts used in this work, showing the thinned areas of the insert that serve as windows for the X-ray beams. The inset shows the resultant window. Redrawn from [17].
Jmmp 07 00176 g0a1
Measurements taken from the CT data confirmed the measurements of the thickness of the windows as 0.0832 mm with a standard deviation of 0.0015 mm. This thickness gave an estimated attenuation < 30% for 12.4 keV photons. This design of the “windows” in the mould cavity presented a smooth continuous surface to the fluid plastic as it entered the mould cavity. This approach allowed for the design of a mould cavity based on industry standards.

References

  1. Ebnesajjad, S. Injection Moulding. In Melt Processible Fluoroplastics; Chapter 7; Ebnesajjad, S., Ed.; Andrew Publishing: Norwich, UK, 2003; pp. 151–193. ISBN 13: 9781884207969. [Google Scholar]
  2. Hyatt, S.; Hyatt, J.W. Improvement in Processes and Apparatus for Manufacturing Pyroxyline. U.S. Patent 133,229, 19 November 1872. [Google Scholar]
  3. Mitchell, P. (Ed.) Tool and Manufacturing Engineers Handbook: Plastic Part Manufacturing; Society of Manufacturing Engineers: Southfield, MI, USA, 1996; Available online: https://books.google.pt/books?id=Q4X1ovFVBvoC&printsec=frontcover&hl=pt-PT&source=gbs_ge_summary_r&cad=0#v=onepage&q&f=false (accessed on 30 July 2023).
  4. Sailors, H.R.; Hogan, J.P. History of Polyolefins. J. Macromol. Sci. Part A Chem. 1981, 15, 1377–1402. [Google Scholar] [CrossRef]
  5. Mandelkern, L. The Relation between Structure and Properties of Crystalline Polymers. Polym. J. 1985, 17, 337–350. [Google Scholar] [CrossRef]
  6. Hu, T.; Hua, W.-Q.; Zhong, G.-J.; Wang, Y.-D.; Gao, Y.-T.; Hong, C.-X.; Li, Z.-M.; Bian, F.-G.; Xiao, T.-Q. Nondestructive and Quantitative Characterization of Bulk Injection-Molded Polylactide Using SAXS Microtomography. Macromolecules 2020, 53, 6498–6509. [Google Scholar] [CrossRef]
  7. Björn, L.; Mazza, R.M.; Andreasson, E.; Linell, F.; Lutz-Bueno, V.; Guizar-Sicairos, M.; Jutemar, E.P.; Liebi, M. Scanning Small-Angle X-ray Scattering of Injection-Molded Polymers: Anisotropic Structure and Mechanical Properties of Low-Density Polyethylene. ACS Appl. Polym. Mater. 2023, 5, 6429–6440. [Google Scholar] [CrossRef]
  8. Elwell, M.J.; Mortimer, S.; Ryan, A.J. A Synchrotron SAXS Study of Structure Development Kinetics during the Reactive Processing of Flexible Polyurethane Foam. Macromolecules 1994, 27, 5428–5439. [Google Scholar] [CrossRef]
  9. Stanford, J.L.; Powell, J.R.; Wilkinson, A.N. Structural composites formed by reaction injection moulding. In FRC 2000–Composites for the Millennium; Gibson, A.G., Ed.; Woodhead Publishing: Sawston, UK, 2000; pp. 191–199. ISBN 9781855735507. [Google Scholar] [CrossRef]
  10. Mateus, A.; Bartolo, P.; Mitchell, G.R. In-situ time-resolving small-angle X-ray scattering studies of reaction kinetics and morphology in reaction injection moulding. 2010; Unpublished work. [Google Scholar]
  11. Kolb, R.; Seifert, S.; Stribeck, N.; Zachmann, H. Investigation of the high speed spinning process of poly(ethylene terephthalate) by means of synchrotron X-ray diffraction. Polymer 2000, 41, 2931–2935. [Google Scholar] [CrossRef]
  12. Van Drongelen, M.; Cavallo, D.; Balzano, L.; Portale, G.; Vittorias, I.; Bras, W.; Alfonso, G.C.; Peters, G.W.M. Structure Development of Low-Density Polyethylenes During Film Blowing: A Real-Time Wide-Angle X-ray Diffraction Study. Macromol. Mater. Eng. 2014, 299, 1494–1512. [Google Scholar] [CrossRef]
  13. Troisi, E.; van Drongelen, M.; Caelers, H.; Portale, G.; Peters, G. Structure evolution during film blowing: An experimental study using in-situ small angle X-ray scattering. Eur. Polym. J. 2016, 74, 190–208. [Google Scholar] [CrossRef]
  14. Zhang, Q.; Chen, W.; Zhao, H.; Ji, Y.; Meng, L.; Wang, D.; Li, L. In-situ tracking polymer crystallization during film blowing by synchrotron radiation X-ray scattering: The critical role of network. Polymer 2020, 198, 122492. [Google Scholar] [CrossRef]
  15. Li, Y.-W.; Liu, G.-F.; Wu, H.-J.; Zhou, P.; Hong, C.-X.; Li, N.; Bian, F.-G. BL19U2: Small-angle X-ray scattering beamline for biological macromolecules in solution at SSRF. Nucl. Sci. Tech. 2020, 31, 117. [Google Scholar] [CrossRef]
  16. Liao, T.; Zhao, X.; Yang, X.; Coates, P.; Whiteside, B.; Barker, D.; Thompson, G.; Lai, Y.; Jiang, Z.; Men, Y. In situ synchrotron small angle X-ray scattering investigation of structural formation of polyethylene upon micro-injection molding. Polymer 2021, 215, 123390. [Google Scholar] [CrossRef]
  17. Costa, A.A.; Gameiro, F.; Potêncio, A.; da Silva, D.P.; Carreira, P.; Martinez, J.C.; Pascoal-Faria, P.; Mateus, A.; Mitchell, G.R. Evaluating the Injection Moulding of Plastic Parts Using In Situ Time-Resolved Small-Angle X-ray Scattering Techniques. Polymers 2022, 14, 4745. [Google Scholar] [CrossRef] [PubMed]
  18. González Fernánde, J.B.; Colldelram, C.; Ferrer, S.; Fontserè Recuenco, A.; Gevorgyan, A.A.; Gonzalez, N.; Jover-Mañas, G.; Kamma-Lorger, C.; Llonch, M.L.; Malfois, M.; et al. Mechanical Engineering Design of Synchrotron Radiation Equipment and Instrumentation. In Proceedings of the MEDSI2018, Paris, France, 28 June 2018; JACoW Publishing: Geneva, Switzerland, 2018. ISBN 978-3-95450-207-3. [Google Scholar] [CrossRef]
  19. Ishige, R. Precise structural analysis of polymer materials using synchrotron X-ray scattering and spectroscopic methods. Polym. J. 2020, 52, 1013–1026. [Google Scholar] [CrossRef]
  20. Zhao, X.; Liao, T.; Yang, X.; Coates, P.; Whiteside, B.; Barker, D.; Thompson, G.; Jiang, Z.; Men, Y. Mold temperature- and molar mass-dependent structural formation in micro-injection molding of isotactic polypropylene. Polymer 2022, 248, 124797. [Google Scholar] [CrossRef]
  21. Mohan, S.; Olley, R.H.; Vaughan, A.S.; Mitchell, G.R. Evaluating Scales of Structure in Polymers. In Controlling the Morphology of Polymers: Multiple Scales of Structure and Processing; Mitchell, G.R., Tojeira, A., Eds.; Springer: Berlin/Heidelberg, Germany, 2016; ISBN 978-3-319-39320-9. [Google Scholar]
  22. Párizs, R.D.; Török, D.; Ageyeva, T.; Kovács, J.G. Multiple In-Mold Sensors for Quality and Process Control in Injection Molding. Sensors 2023, 23, 1735. [Google Scholar] [CrossRef]
  23. Shin, S. New era of synchrotron radiation: Fourth-generation storage ring. AAPPS Bull. 2021, 31, 21. [Google Scholar] [CrossRef]
  24. Bilderback, D.H.; Batterman, B.W.; Bedzyk, M.J.; Finkelstein, K.; Henderson, C.; Merlini, A.; Schildkamp, W.; Shen, Q.; White, J.; Blum, E.B.; et al. Performance of a hard X-ray undulator at CHESS. Rev. Sci. Instrum. 1989, 60, 1419–1425. [Google Scholar] [CrossRef]
  25. 6082 Aluminium Alloy 6082-T6 T651 AlMgSi1 (AlSi1MgMn–3.2315) Properties. Available online: https://www.theworldmaterial.com/ (accessed on 30 July 2023).
  26. UAI—Babyplast. Available online: https://www.babyplast.com/en/product-line/uai/ (accessed on 30 July 2023).
  27. Costa, A.A.; Gameiro, F.; Olivereria, L.; da Silva, D.P.; Carreira, P.; Martínez, J.C.; Martinho, P.G.; Mateus, A.; Mitchell, G.R. Industrially relevant Injection Moulding Apparatus for Operando Time-Resolving Small-Angle X-ray Scattering Measurements. J. Manuf. Process. 2023. submitted. [Google Scholar]
  28. Keller, A.; Kolnaar, H. Flow-Induced Orientation and Structure Formation. Mater. Sci. Technol. 1997, 18, 187–268. [Google Scholar]
  29. Pinheiro, J.; Abdulghani, S.; Pascoal-Faria, P.; Sousa, D.; Carreira, P.; Viana, T.; Kamma-Lorger, C.S.; Mitchell, G. Tools to define and evaluate morphology mapping, a route to complex structures using direct digital manufacturing. AIP Conf. Proc. 2019, 2116, 230003. [Google Scholar] [CrossRef]
  30. Lovell, R.; Mitchell, G.R. Molecular orientation distribution derived from an arbitrary reflection. Acta Crystallogr. Sect. A 1981, 37, 135–137. [Google Scholar] [CrossRef]
  31. Mitchell, G.R.; Saengsuwan, S.; Bualek-Limcharoen, S. Evaluation of preferred orientation in multi-component polymer systems using X-ray scattering procedures. In Scattering Methods and the Properties of Polymer Materials; Progress in Colloid and Polymer Science; Stribeck, N., Smarsly, B., Eds.; Springer: Berlin/Heidelberg, Germany, 2005; Volume 130. [Google Scholar]
  32. Da Silva, D.P.; Holt, J.J.; Pratumshat, S.; Pascoal-Faria, P.; Mateus, A.; Mitchell, G.R. Crystallisation from Anisotropic Polymer Melts. In Polymer Crystallization: Methods, Characterization, and Applications; Chapter 10; Parameswaranpillai, J., Jacob, J., Krishnasamy, S., Jayakumar, A., Hameed, N., Eds.; Wiley-VCH: Weinheim, Germany, 2023; pp. 225–284. ISBN 9783527350810. [Google Scholar]
  33. Muszyński, P.; Poszwa, P.; Mrozek, K.; Zielinski, M.; Dalewski, P.; Kowal, M. Design and Simulation Study of the Induction Heated Injection Mold with Sliders. Materials 2021, 14, 7476. [Google Scholar] [CrossRef] [PubMed]
  34. Sánchez, R.; Martinez, A.; Mercado, D.; Carbonel, A.; Aisa, J. Rapid heating injection moulding: An experimental surface temperature study. Polym. Test. 2021, 93, 106928. [Google Scholar] [CrossRef]
  35. Mitchell, G.R. Neutron Diffraction of Polymers and Other Soft Matter. In Essentials of Neutron Techniques for Soft Matter; Imae, T., Kanaya, T., Furusaka, M., Eds.; Wiley: Hoboken, NJ, USA, 2011; ISBN 10: 0-470-40252. [Google Scholar]
  36. Mitchell, G.R. X Ray Scattering from Non Crystalline and Liquid Crystalline Polymers in Comprehensive Polymer Science; Allen, G., Bevington, J., Eds.; Pergamon Press: Oxford, UK, 1989; Volume 1, pp. 687–729, Chapter 31. [Google Scholar]
  37. Mofakhami, E.; Tencé-Girault, S.; Perrin, J.; Scheel, M.; Gervat, L.; Ovalle, C.; Laiarinandrasana, L.; Fayolle, B.; Miquelard-Garnier, G. Microstructure-mechanical properties relationships in vibration welded glass-fiber-reinforced polyamide 66: A high-resolution X-ray microtomography study. Polym. Test. 2020, 85, 106454. [Google Scholar] [CrossRef]
  38. ALBA II—En. Available online: https://www.cells.es/en/science-at-alba/alba-ii-upgrade (accessed on 30 July 2023).
  39. Reichert, H.; Honkimäki, V. High-Energy X-ray Scattering and Imaging. In Synchrotron Light Sources and Free-Electron Lasers; Jaeschke, E., Khan, S., Schneider, J., Hastings, J., Eds.; Springer: Cham, Switzerland, 2015. [Google Scholar] [CrossRef]
Figure 1. A schematic of the NCD-SWEET beamline at the ALBA Synchrotron Light Source [18].
Jmmp 07 00176 g001
Figure 2. Operando Injection System mounted on the NCD-SWEET beamline. Red arrows indicate the directions IN and OUT of the X-ray beam.
Jmmp 07 00176 g002
Figure 3. The part produced using the moulding system developed in this work. The dots along the centre line of the part correspond to the position of the X-ray beam, with respect to the part corresponding to the six windows.
Jmmp 07 00176 g003
Figure 4. Variation in the storage ring current (orange) and the Ionization Chamber signal (blue) during decaying operations (left) and in the topping-up moments (right). The sudden increase in the signals in the first second is associated with the aperture of the fast shutter.
Jmmp 07 00176 g004
Figure 5. (a) Left, original SAXS pattern acquired during 1 s; and (b) right, the same pattern as before, in which the image collected for an empty mould cavity was subtracted as background.
Jmmp 07 00176 g005
Figure 6. Azimuthal integration of the SAXS pattern in Figure 5b.
Jmmp 07 00176 g006
Figure 7. Signals of transmitted radiation intensity collected at the beam stop photodiode are visible at the injection point (A) and the moment in which polymer enters in the mould cavity adjacent to the selected window (B).
Jmmp 07 00176 g007
Figure 8. Sequences of 1 s acquisition scans, corresponding to the monitoring of the first window. 1st and 2nd columns: Temperature of molten polymer = 250 °C; 3rd and 4th columns: Temperature of molten polymer = 230 °C; and 5th and 6th columns: Temperature of molten polymer = 210 °C.
Jmmp 07 00176 g008
Figure 9. In Figure 9 are reported the variation of the signal at the beamstop photodiode (left) and the increase of the scattering peak after injection. From the plot on the left it’s clearly visible how the injection of the material, inside the mould, produces a change in the transmitted light barely dependent on the different injection. On the other hand, the crystallization degree, correlated to the amount of scattered light, is increased for lower injection temperature.
Jmmp 07 00176 g009
Figure 10. Images showing maps of χ2, calculated as described in the text for pairs of time-equivalent images for the three temperatures shown in Figure 8. Time runs vertically, with 1 s between adjacent images. The false colour mapping of the intensity has been adjusted to maximise the visualisation of these small differences.
Jmmp 07 00176 g010
Figure 11. Total χ2/n values for the three experimental runs at the three extrusion temperatures shown in Figure 8.
Jmmp 07 00176 g011
Figure 12. Time-resolved sequences of SAXS patterns obtained by monitoring the first four windows of the mould. On the left, the patterns related to PP1, whereas related to PP2 at the right. Time proceeds from top to bottom. The flow direction of the plastic is horizontal.
Jmmp 07 00176 g012
Figure 13. Scattering peak maximum intensity variation towards time for the PP1 (left) and PP2 (right).
Jmmp 07 00176 g013
Figure 14. (A,B) Images obtained 1 s and 2 s after injection with their differences, depicted in (C): (D,E) Images obtained 9 s and 10 s after injection with their difference, shown in (F). X represents the colour scale for (A,B,D,E), whereas Y for (C,F) images (enlarged to enhance the readability). It is clear that the majority of the crystallization in the 2nd second exhibits the same highly anisotropic as in the first second), whereas, the crystallisation in the 10th second, there is a modification in the structure towards a more isotropic structure (the “lobes” are darker, whereas the “ring” is lighter).
Jmmp 07 00176 g014
Figure 15. Azimuthal profiles for PP1 (top image) and PP2 (bottom image), obtained for each measured window.
Jmmp 07 00176 g015
Figure 16. Plots of the first four Legendre Polynomials used in the work, plotted in polar coordinates and reproduced with permission from [21].
Jmmp 07 00176 g016
Figure 17. Radial integration over a selected range of angles. Left diagrams visualize a schematic representation of the azimuthal integration ranges superimposed on the SAXS pattern, on which the integration was applied, A being the range −30°/30°, and B being 45°/135°. On the right, the resulting profiles of the integration are shown. Top images correspond to PP1, whereas PP2 results are in the bottom line.
Jmmp 07 00176 g017
Table 1. The grades of isotactic polypropylene used in this work.
AcronymManufacturerGradeMFI g/10 min at 230 °CNotes
PP1Lyndon BaselMOPLEN HP 500N12General purpose suitable for food contact applications.
PP2RepsolISPLEN PR595C2M45Phthalate free random copolymer which is clarified and contains antistatic additives.
PP3SABIC595A47Designed for Automotive applications.
Table 2. Injection Moulding Parameters as inputted into the injection moulding control panel.
ParameterValueUnits
Part weight5G
Shot size12.991cm3
1st Injection Pressure40Bar
1st Injection Time2S
2nd Injection Pressure30Bar
2nd Injection Time6S
1st Injection speed55% a
2nd Injection speed45% a
Cooling time2S
Cycle time22.30S
a The injection speed is inputted as a % of the maximum speed possible for the particular injection moulding system. For the system used in this work, the maximum injection speed was 50 mm/s.
Table 3. Orientation parameters describing the level of preferred orientation of the chain-folded lamellar crystals formed during the injection moulding of PP1 and PP2, based on the data shown in Figure 15 for window 1.
D2nPP1PP2
D20.260.50
D40.05−0.28
D60.00−0.26
Table 4. Lp values for PP1 and PP2 for the profiles integrated over specific and reported angles.
Lp (Å)PP1PP2
−35°/35°113106
45°/135°121116
Disclaimer/Publisher’s Note: The statements, opinions and data contained in all publications are solely those of the individual author(s) and contributor(s) and not of MDPI and/or the editor(s). MDPI and/or the editor(s) disclaim responsibility for any injury to people or property resulting from any ideas, methods, instructions or products referred to in the content.

