Article

Impact Strength for 3D-Printed PA6 Polymer Composites under Temperature Changes

by
Jorge Guillermo Díaz-Rodríguez
1,*,
Alberto David Pertuz-Comas
2 and
Oscar Rodolfo Bohórquez-Becerra
1
1
GIEMA, Universidad Industrial de Santander, Escuela de Ingeniería Mecánica, Carrera 27 calle 9, Bucaramanga 680002, Colombia
2
GIC, Universidad Industrial de Santander, Escuela de Ingeniería Mecánica, Carrera 27 calle 9, Bucaramanga 680002, Colombia
*
Author to whom correspondence should be addressed.
J. Manuf. Mater. Process. 2023, 7(5), 178; https://doi.org/10.3390/jmmp7050178
Submission received: 31 July 2023 / Revised: 13 September 2023 / Accepted: 20 September 2023 / Published: 1 October 2023
(This article belongs to the Special Issue Design and Additive Manufacturing of Lightweight Composite Structures)

Abstract

:
This paper shows how temperature influences impact energy for continuous fiber additively manufactured (AM) polymer matrix composites. AM composites were fabricated with a nylon-based matrix and four continuous reinforcements: fiberglass, high-temperature fiberglass (HSHT), Kevlar, and carbon. The tested temperatures ranged from −40 to 90 °C. The chosen printed configuration for the lattice structure and fiber volume was the configuration that was found to perform the best in the literature, with a volumetric fiber content of 24.2%. Impact tests showed that the best response was fiberglass, HSHT, Kevlar, and carbon, in that order. The impact resistance was lowered at temperatures below ambient temperatures and above 50 °C. Additionally, each material’s impact energy was adjusted to third-degree polynomials to model results, with correlation factors above 92%. Finally, the failure analysis showed the damage mechanisms of matrix cracking, delamination in the printing direction, fiber tearing, and fiber pulling as failure mechanisms.

1. Introduction

A recent review [1] identified the missing tests needed to characterize the behavior of the newly produced additively manufactured (AM) composites. Among those tests were impact strength. The importance of impact tests for polymers is that although they show ductile failure when tested in tension at moderate strain rates, they suffer fragile rupture when tested at high strain rates [2]. A relatively low energy absorption rate often accompanies fragile breakage and is a failure mode that structural designers must avoid. Moreover, experiments measure the impact strength of a structure and validate the analytical methods used to calculate the in-service performance of a structure [3]. In the case of parametric models, a post-testing simulation uses coupon sample results to recreate the part’s performance.
Toughness is a mechanical property that describes a material’s resistance to loads at a high strain rate [4]. It can be quantified as the total deformation energy a component can absorb before rupturing by accumulating high-speed dislocations per unit area of the fractured section. In a viscoelastic material, such energy depends on the evolution of deformation velocity, whereas in elastoplastic materials, it is not affected by it. One can use fracture mechanics to predict the behavior of a composite under the inevitable presence of a flaw [5,6]. Toughness is heavily influenced by temperature [4], which makes fracture mechanics methods to measure it impractical. Therefore, indirect measurement of fracture toughness can be performed by impact tests.
Yasa [7] and Sauer [8] performed independent Charpy impact tests for MEX [9] nylon composites and short carbon-reinforced samples, studying layer height and material infill raster angles. They both found high anisotropy and dependence on infill patterns. Sauer [8] went further and tested additional samples in the flat (f) and on-edge (e) directions (see Figure 1 for the description of such orientations). Caminero et al. [2] performed the Charpy impact test for a Nylon matrix with continuous carbon, fiberglass, and Kevlar fiber reinforcement using different printing configurations, including flat (f) and on-edge (e) configurations, and three different fiber contents (Vf). They found that fiberglass delivered the best results compared to Kevlar and carbon, in that order, the opposite of the tensile strength results [10,11] in agreement with Prajapati et al. [12] who also confirmed that continuous fiber orientation heavily influences impact energy. Sauer [8] and Caminero et al. [2] also found that the on-edge (e) configuration delivers higher performance than the flat (f) one, as shown in Figure 1. Kabir et al. [13] performed drop weight and impact tests on several FDM nylon matrix-reinforced composites. Ojha et al. [14] also performed tests on nylon-based matrix composites, and Papa et al. [15] measured thermography fields in AM composites under impact at high speed. Vaško et al. [16] systematically tested 3D-printed composites under different printing conditions. Finally, Scrocco et al. [17] tested onyx composites with different reinforcements to find that Kevlar and hexagonal infill perform best in Charpy and high-speed impact tests. No studies were found that show the influence of temperature on impact energy on AM composites.
Composite materials are intrinsically limited under localized impact loadings [18]. Roberson [19], working with ABS, found that part orientation significantly influenced impact resistance due to the intrinsic anisotropic nature of MEX. Such anisotropy is attributed to pore formation [20], which is implicit in AM [21], and a weak interlayer material bonding delivers an inappropriate matrix-to-fiber load transfer [22]. Reported surface failure modes under impact loading have been attributed to matrix splitting, matrix delamination, intralaminar matrix cracking, and longitudinal matrix piercing. Internal failures are related to the fiber and are associated with fiber/matrix disengagement, fiber withdrawal, and fiber fracture [2,18,23,24]. Moreover, interlayer normal and shear deformations, both due to high-speed bending, are the main energy dissipation mechanisms for impact loading in composite materials [2,18].
Contrary to the rule of mixture prediction and that fibers can act as a deterrent for crack propagation, there is evidence that fiber addition in a polymer matrix begets a brittle and weak material [25,26,27]. This is possible due to a weakening in the matrix continuum by the addition of fiber [28]. However, Caminero et al. [2] showed an increment in impact energy absorption when more fiber was added. Finally, the reported techniques to observe failure modes include microscopy (both optical and electron microscopy), and digital image correlation [10,23,28,29].
Extensive details of Caminero’s work are available in [2]. Heitkamp [30] tested hybrid composites (different ratios of carbon and Kevlar reinforcement), but the values reported here are for only one type of reinforcement (carbon or Kevlar alone). They tested Charpy samples for three different configurations and two different printing directions: flat (f) and on edge (e), as shown in Figure 1, whereas the impact energy and volume fiber content (Vf) for each sample are shown in Table 1. They reported that FG offered better impact resistance than Kv and C for about the same Vf. Furthermore, it is also observed that the on-edge (e) configuration delivers higher performance than the f-configuration and raises the impact resistance more than the f.
Markforged provides mechanical properties for matrix and fibers [31]. However, material performance varies significantly besides intrinsic AM anisotropy [24] [NO_PRINTED_FORM], due to different combinations and configurations [1]. In addition, Dutra et al. [29] showed that the properties of the nylon matrix are different from those of the 100% nylon filament. A summary of relevant properties is presented in Table 2. All tests were performed at ambient temperature.
The article shows how impact strength changes under different temperature exposures for MEX-reinforced polymers with long fibers. Impact energy values are reported, and SEM images revealed fracture surfaces with the respective analysis.

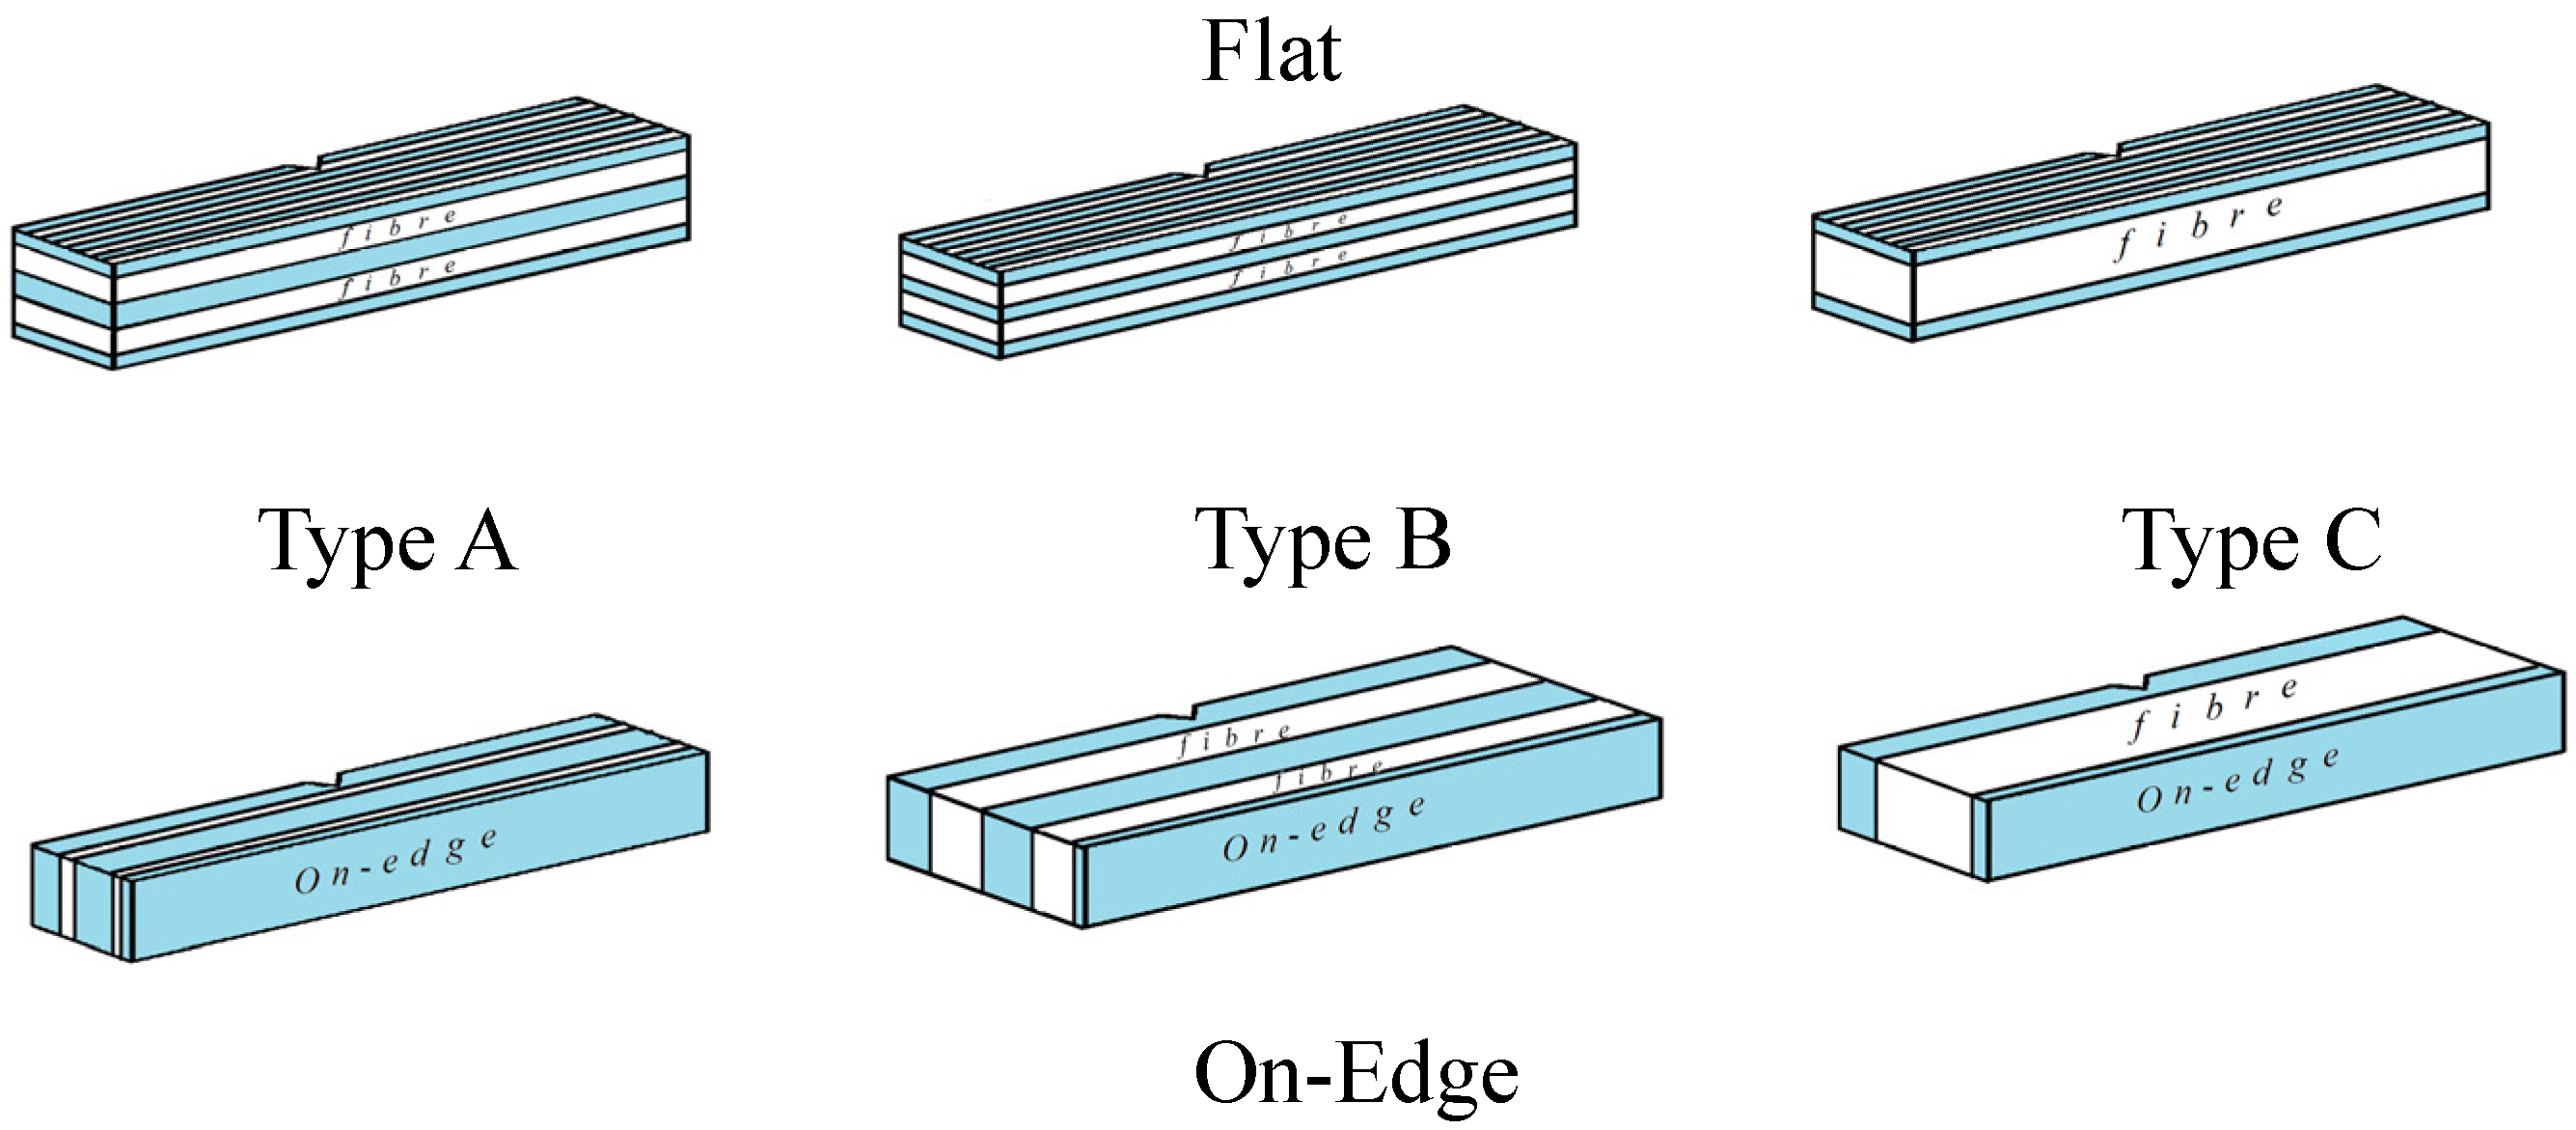
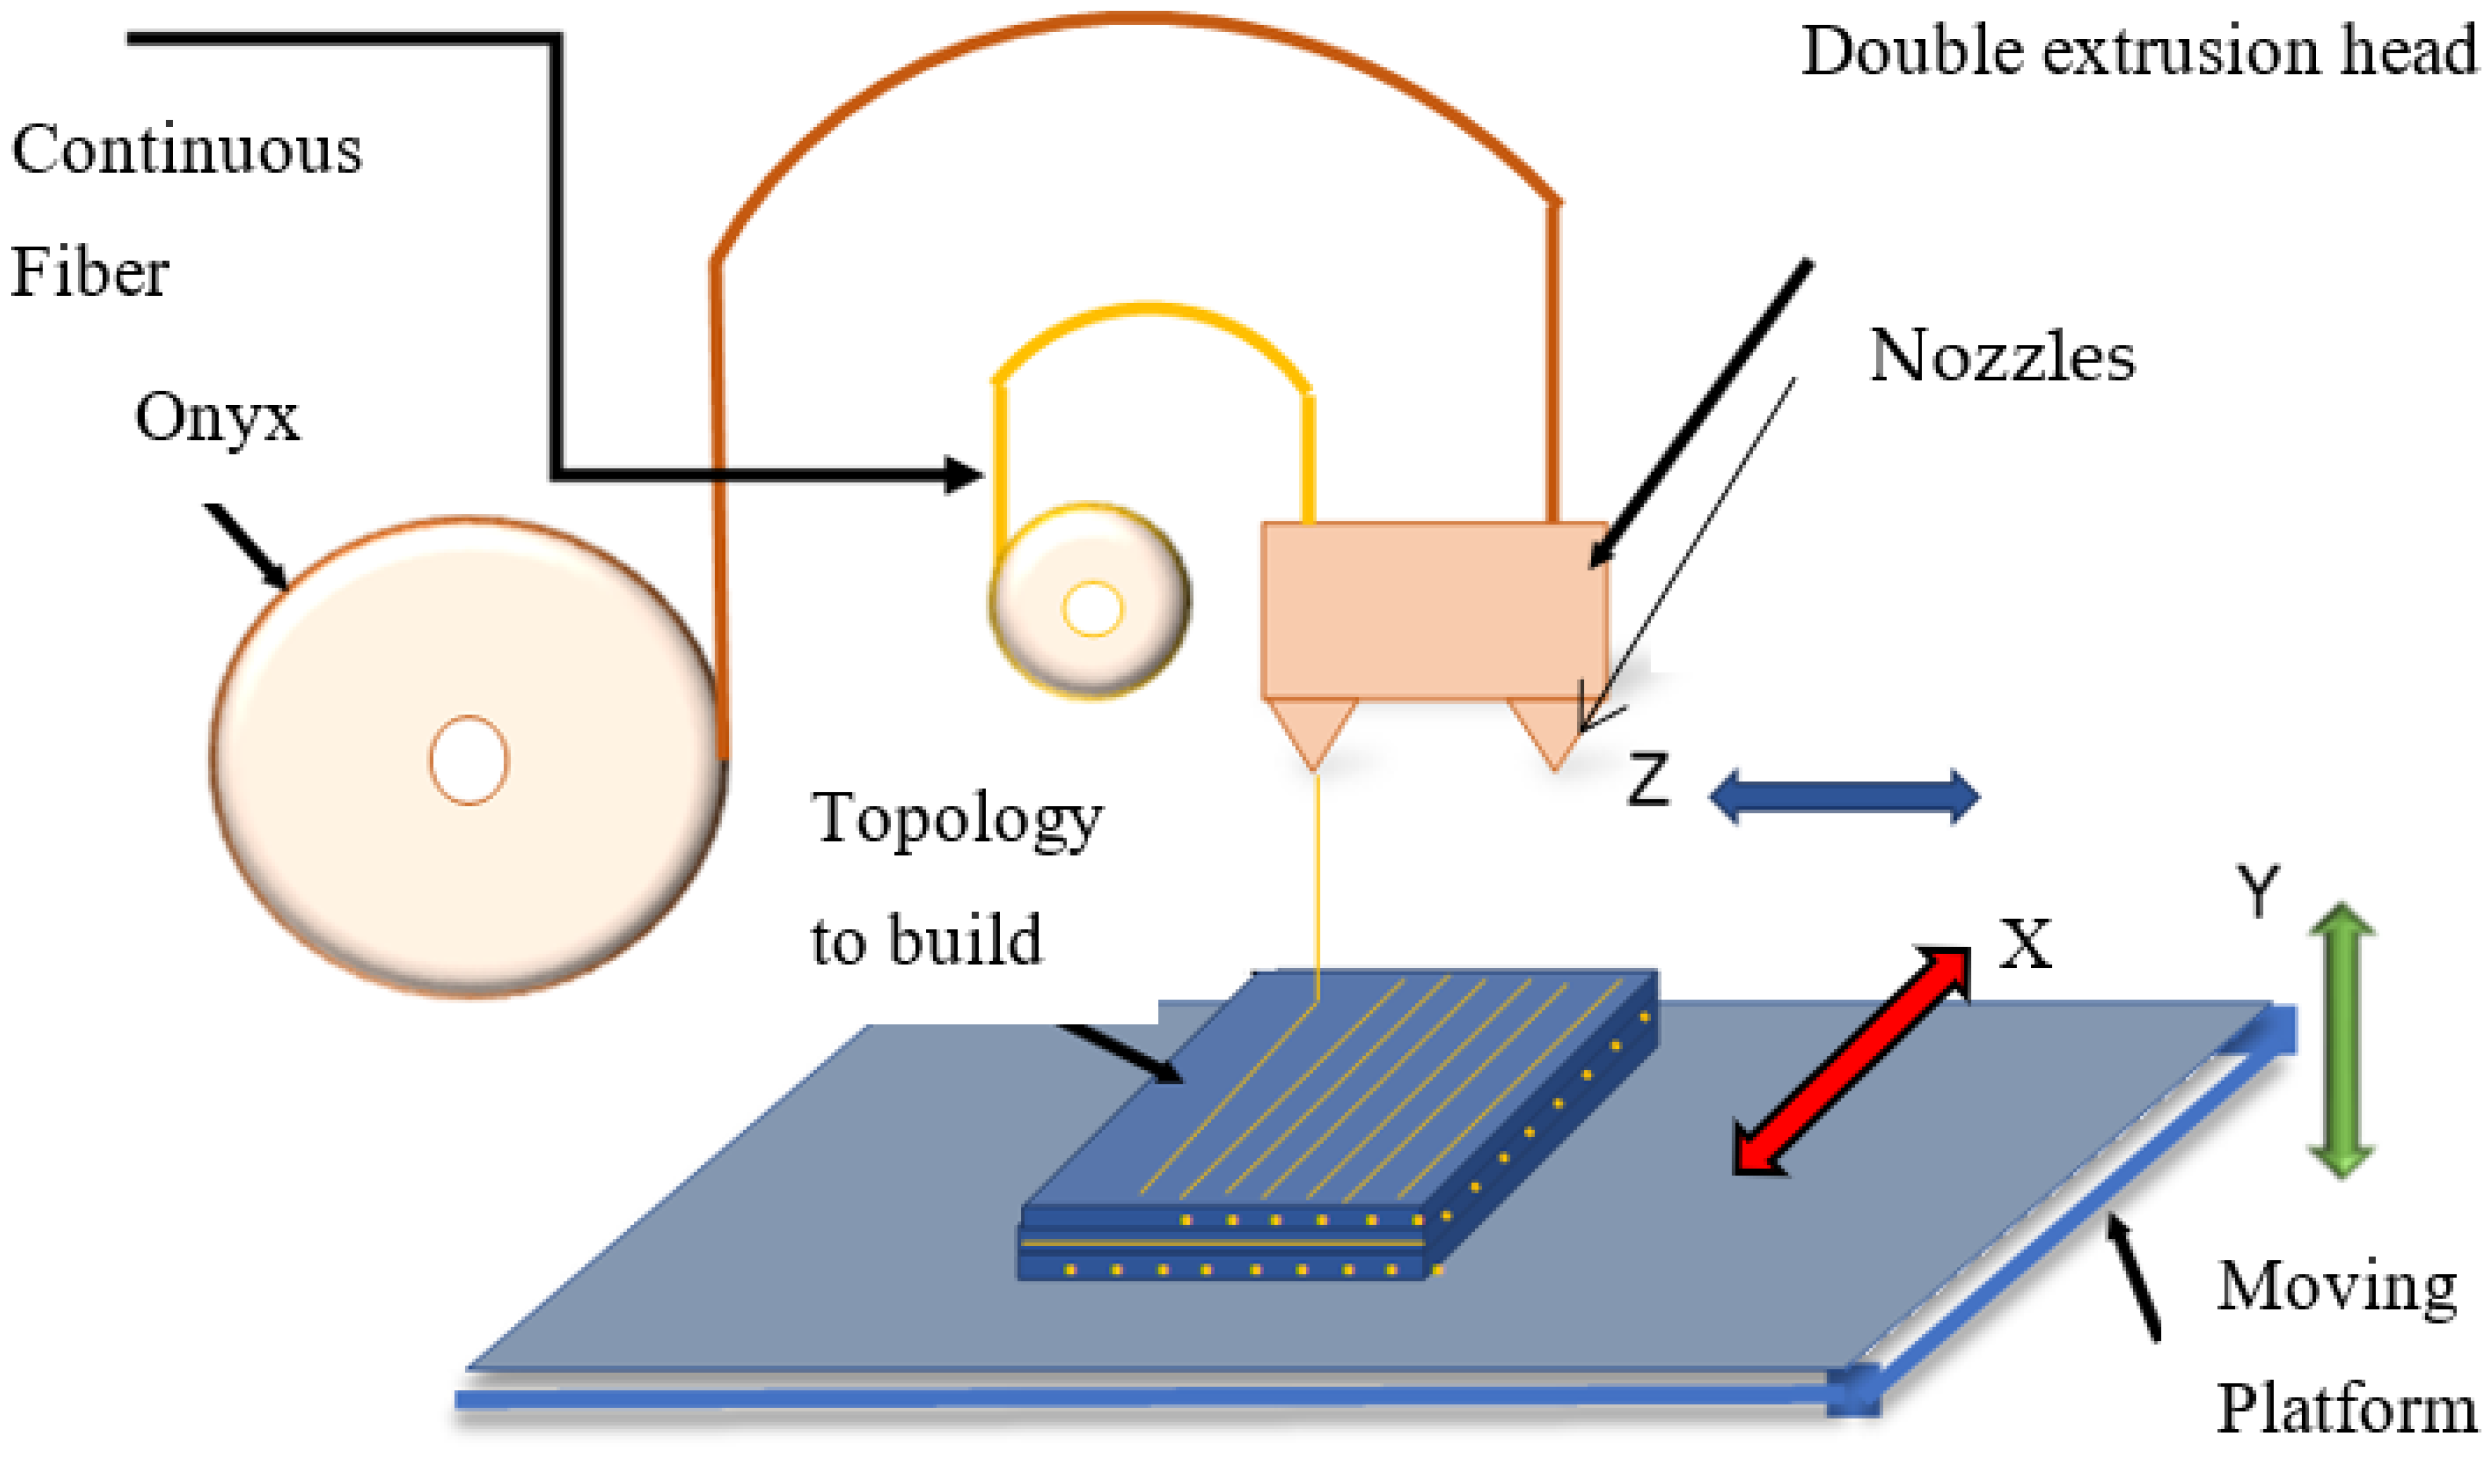
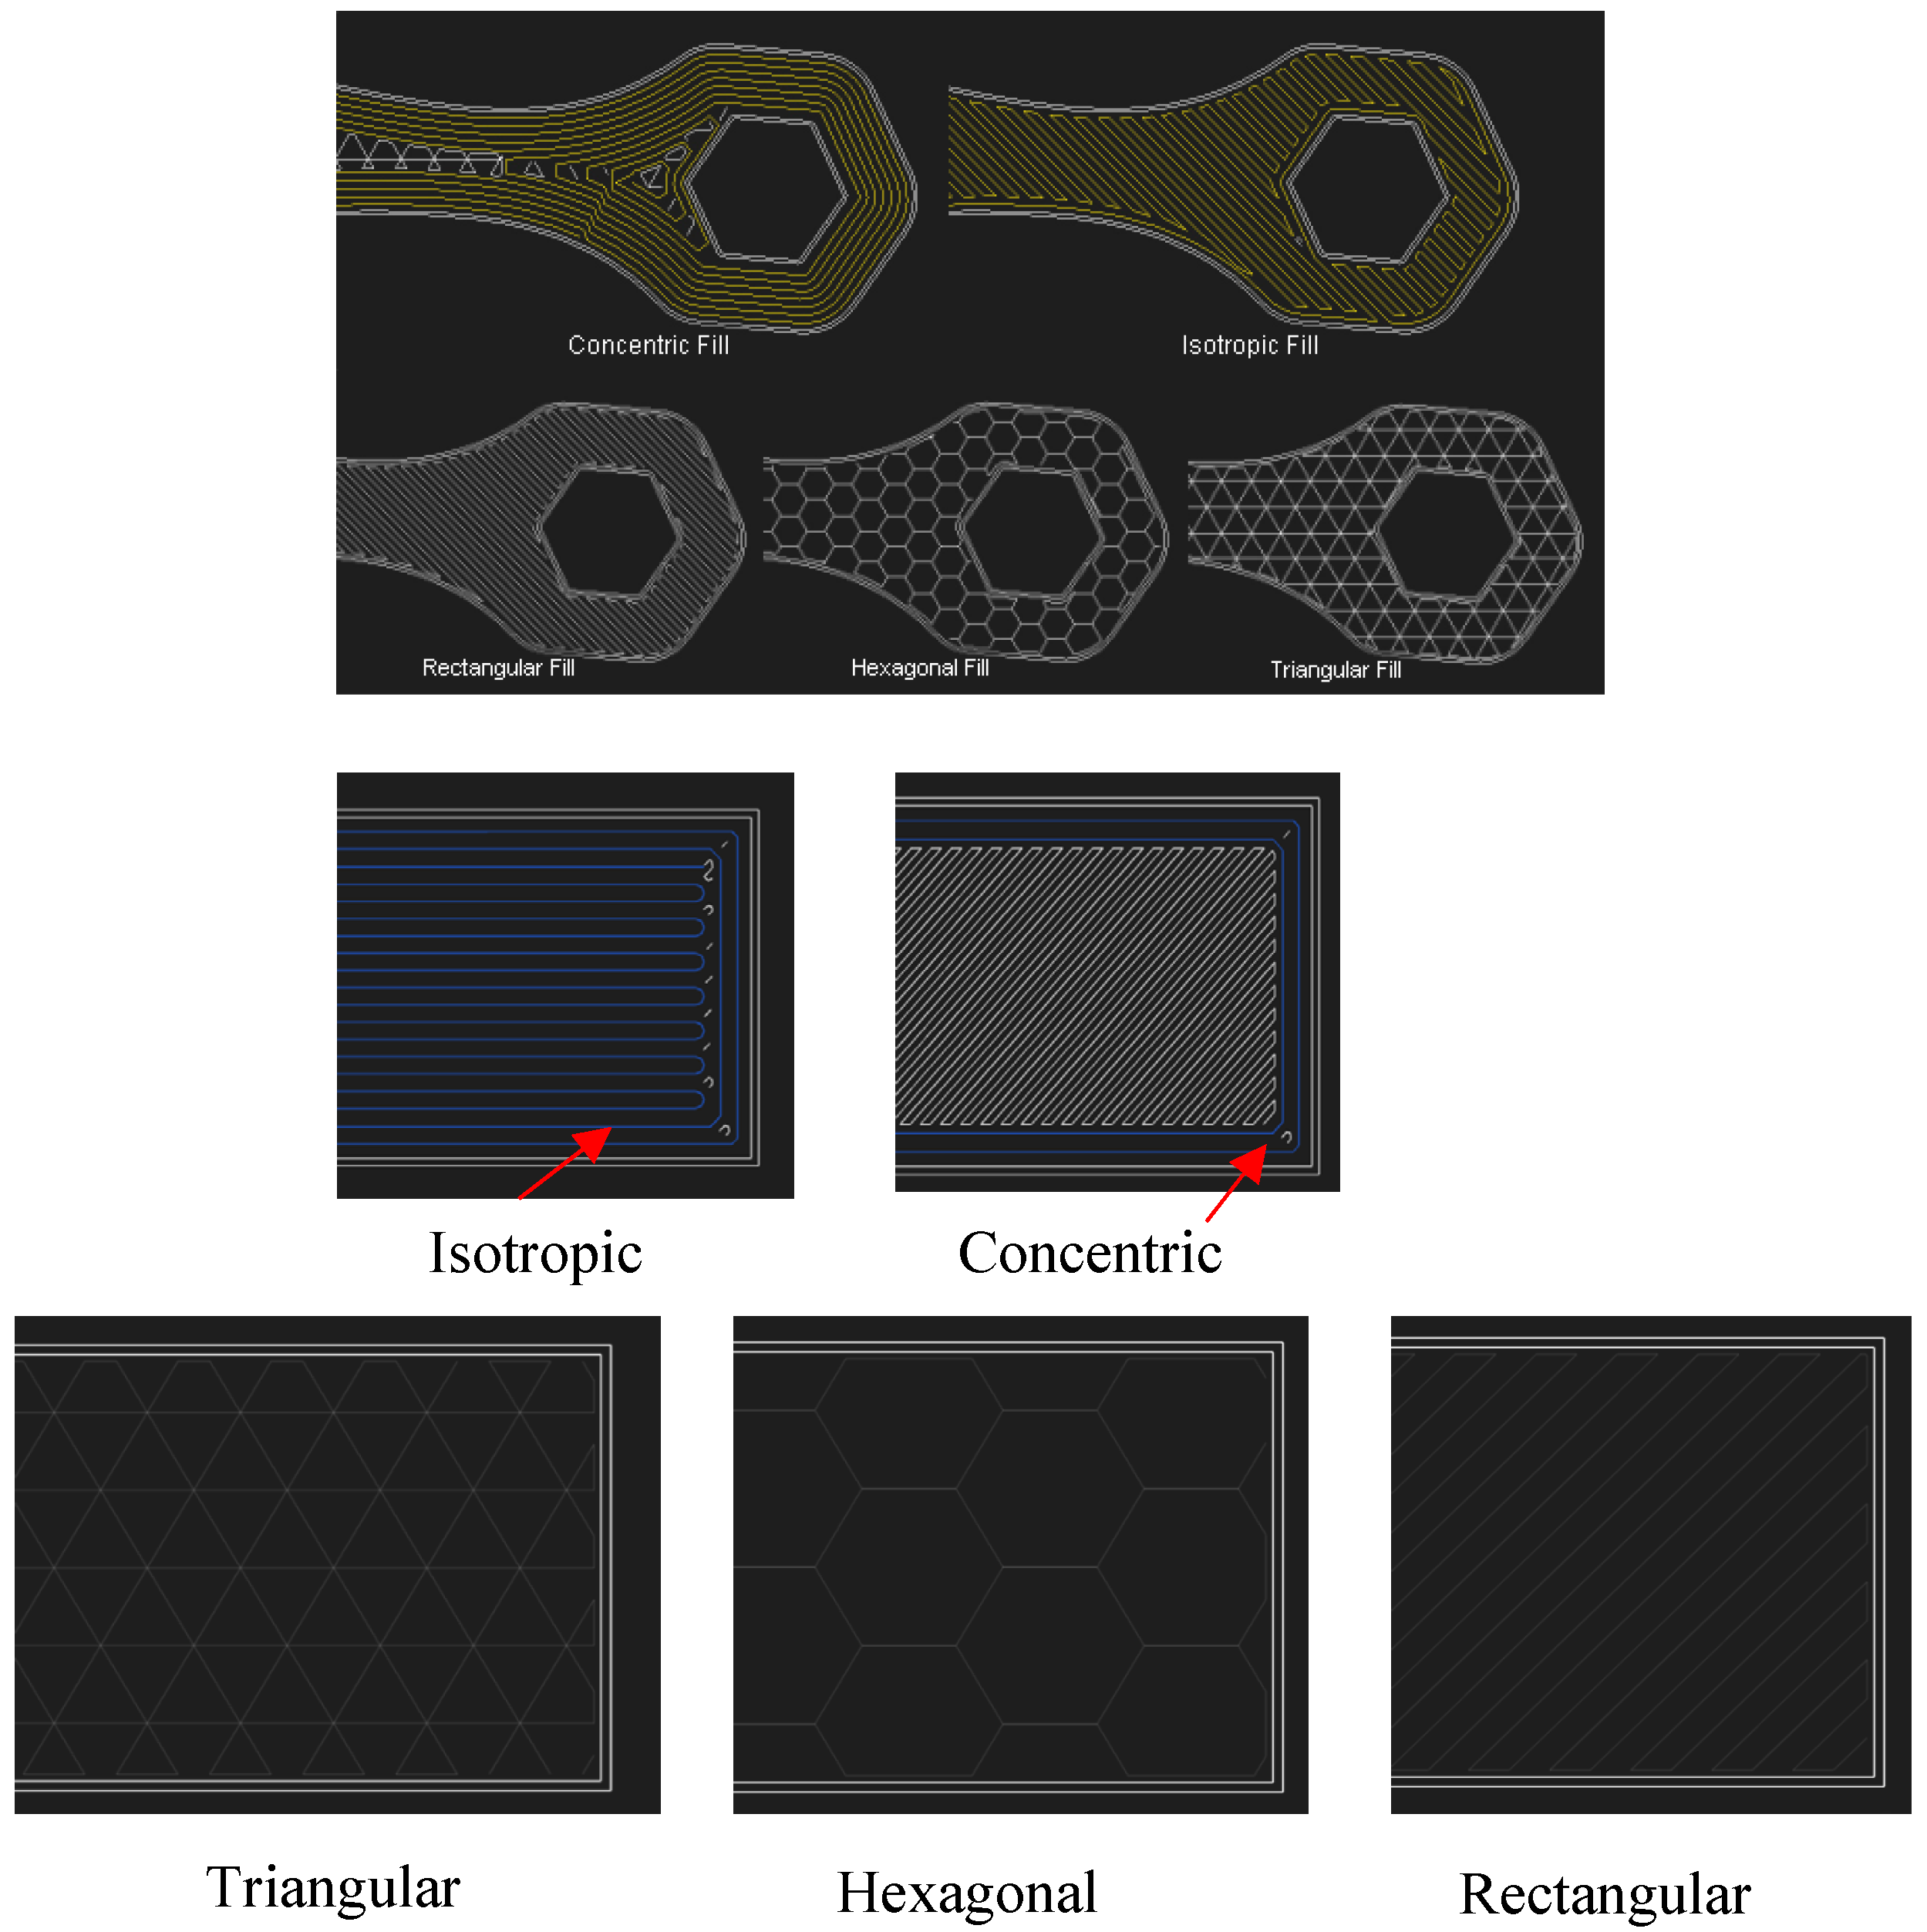
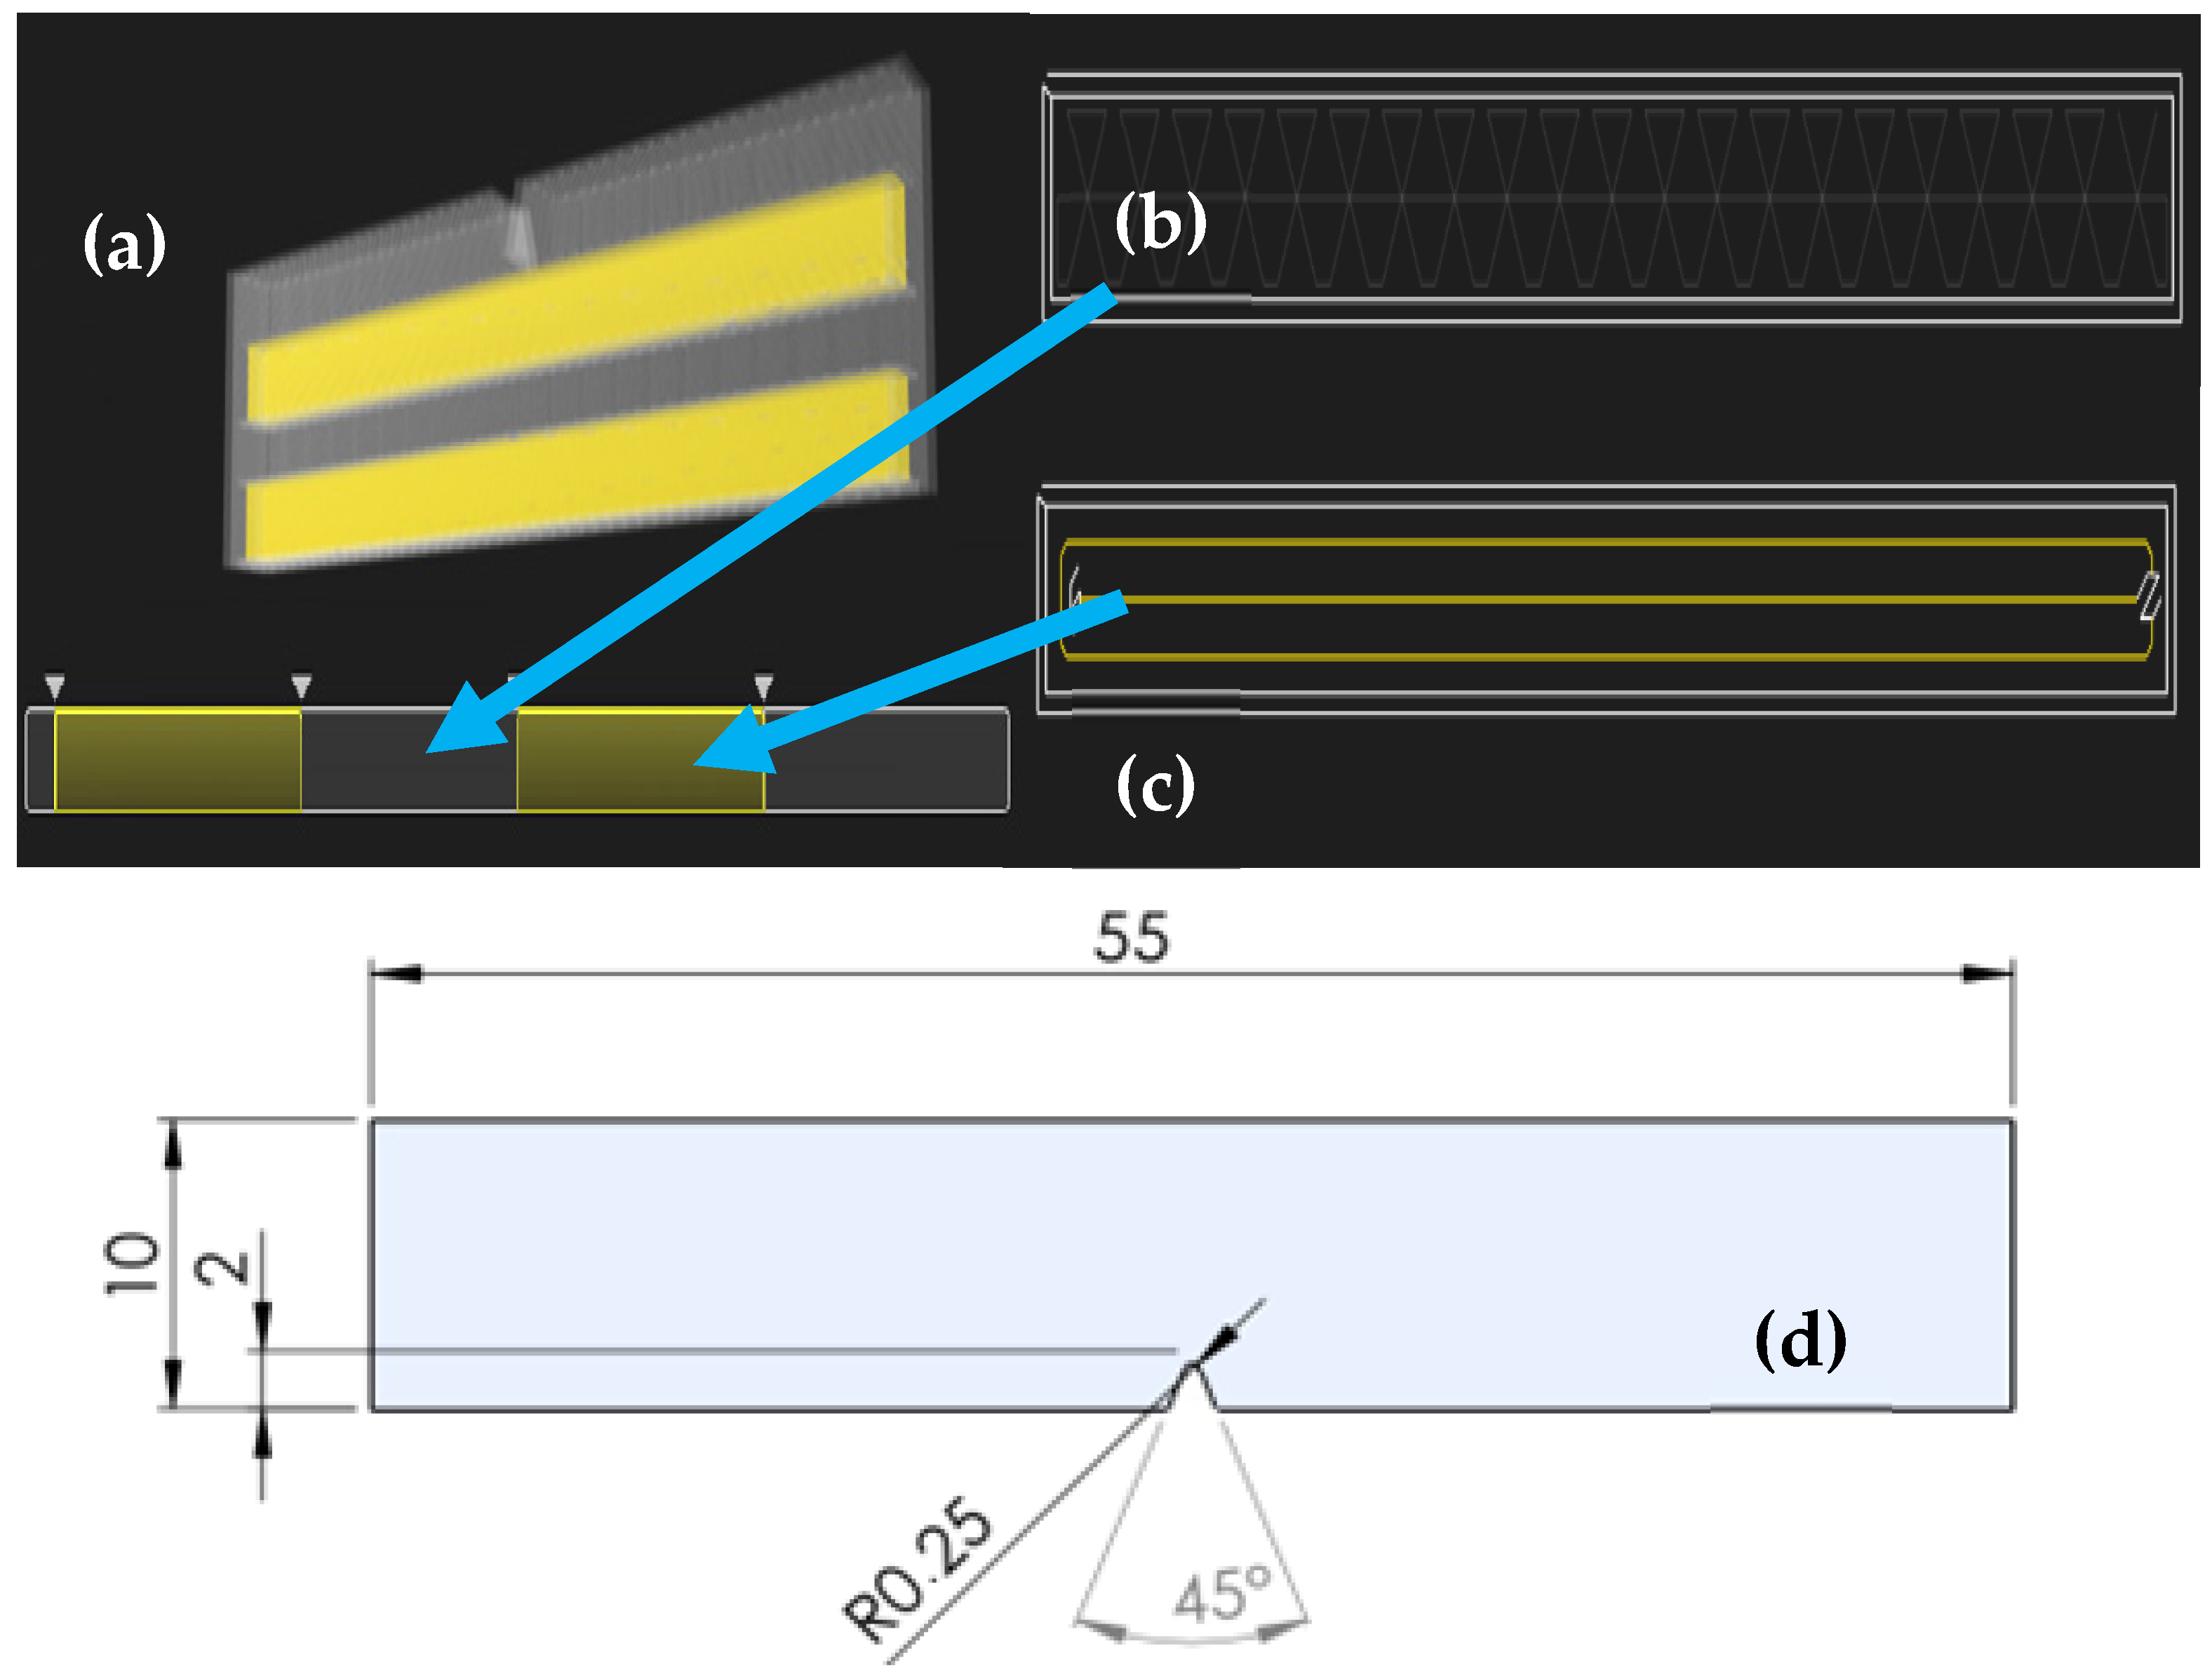
2. Material Extrusion

Additive Manufacturing (AM) is a set of techniques used to join one or more materials to form objects from 3D topologies, generally layer by layer, instead of subtractive technologies such as mechanized cut, foundry, forging, and welding. One tremendous advantage for AM is that printing costs are virtually the same for one as for thousands of pieces [32], and it has excellent compatibility with different materials for constructing highly complex structures. The ISO/ASTM 52900 [9] categorizes the technologies regardless of the materials used. Material extrusion (MEX, also known as fused deposition modeling of fused filament fabrication) is the most widely used AM technology [33].
A topology is created in a CAD software and saved as a Standard Tessellation Language (STL) file. Such a file is discretized in a slicer software, resulting in G-code instructions. Those instructions are then loaded into a 3D printer that moves the printer head accordingly. Eiger® is the Markforged software suite, and it is entirely cloud-based. In MEX, a nozzle deposits molten polymer material onto a platform with relative movement in three orthogonal axes, allowing the creation of layers that will reconstruct the original CAD topology by continuous and appropriate movements. Furthermore, a reinforced polymeric composite can be fabricated if a second nozzle is used, i.e., for continuous fibers such as the technology provided by Markforged [34].
Figure 2 shows the schematics of the 3D printing process used by the Markforged Two® printer. A moving platform is contained within the printing envelope where two nozzles, one containing a matrix polymer (Onyx®) and the other a continuous fiber, alternate to deposit a material layer by layer until the original topology is recreated.
Commonly used materials are acrylonitrile butadiene styrene (ABS), polylactic acid (PLA), polypropylene (PP), polyethylene (PE), polyamide (PA, also known as nylon), polyetheretherketone (PEEK), polyetherimide (PEI), polyethersulfone (PES) or polyphenylene sulfide (PPS) [33]. This paper used nylon reinforced with short carbon fiber (Onyx®) as a matrix. Comprehensive reviews on MEX for continuous fibers are available [1,35].
To create a part, there are several variables available in the Eiger® software for the Markforged Two® printer to choose from, including the type of fiber (carbon, Kevlar, fiberglass, and high-temperature fiberglass), fiber volume fraction (Vf), fiber layout type (concentric and isotropic, as seen at the top of Figure 3), pattern of matrix filling (hexagonal, triangular, square, as seen on the top of Figure 3, and solid fill), matrix fill density, matrix deposition angle, and fiber deposition angle. In addition, mechanical characterization for different matrix fillings from geometry and material properties is thoroughly reviewed in [36].
Based on a literature review [1], a research campaign was launched to characterize the MEX composite’s impact toughness through Charpy impact tests under temperature changes. This paper deals with this characterization.

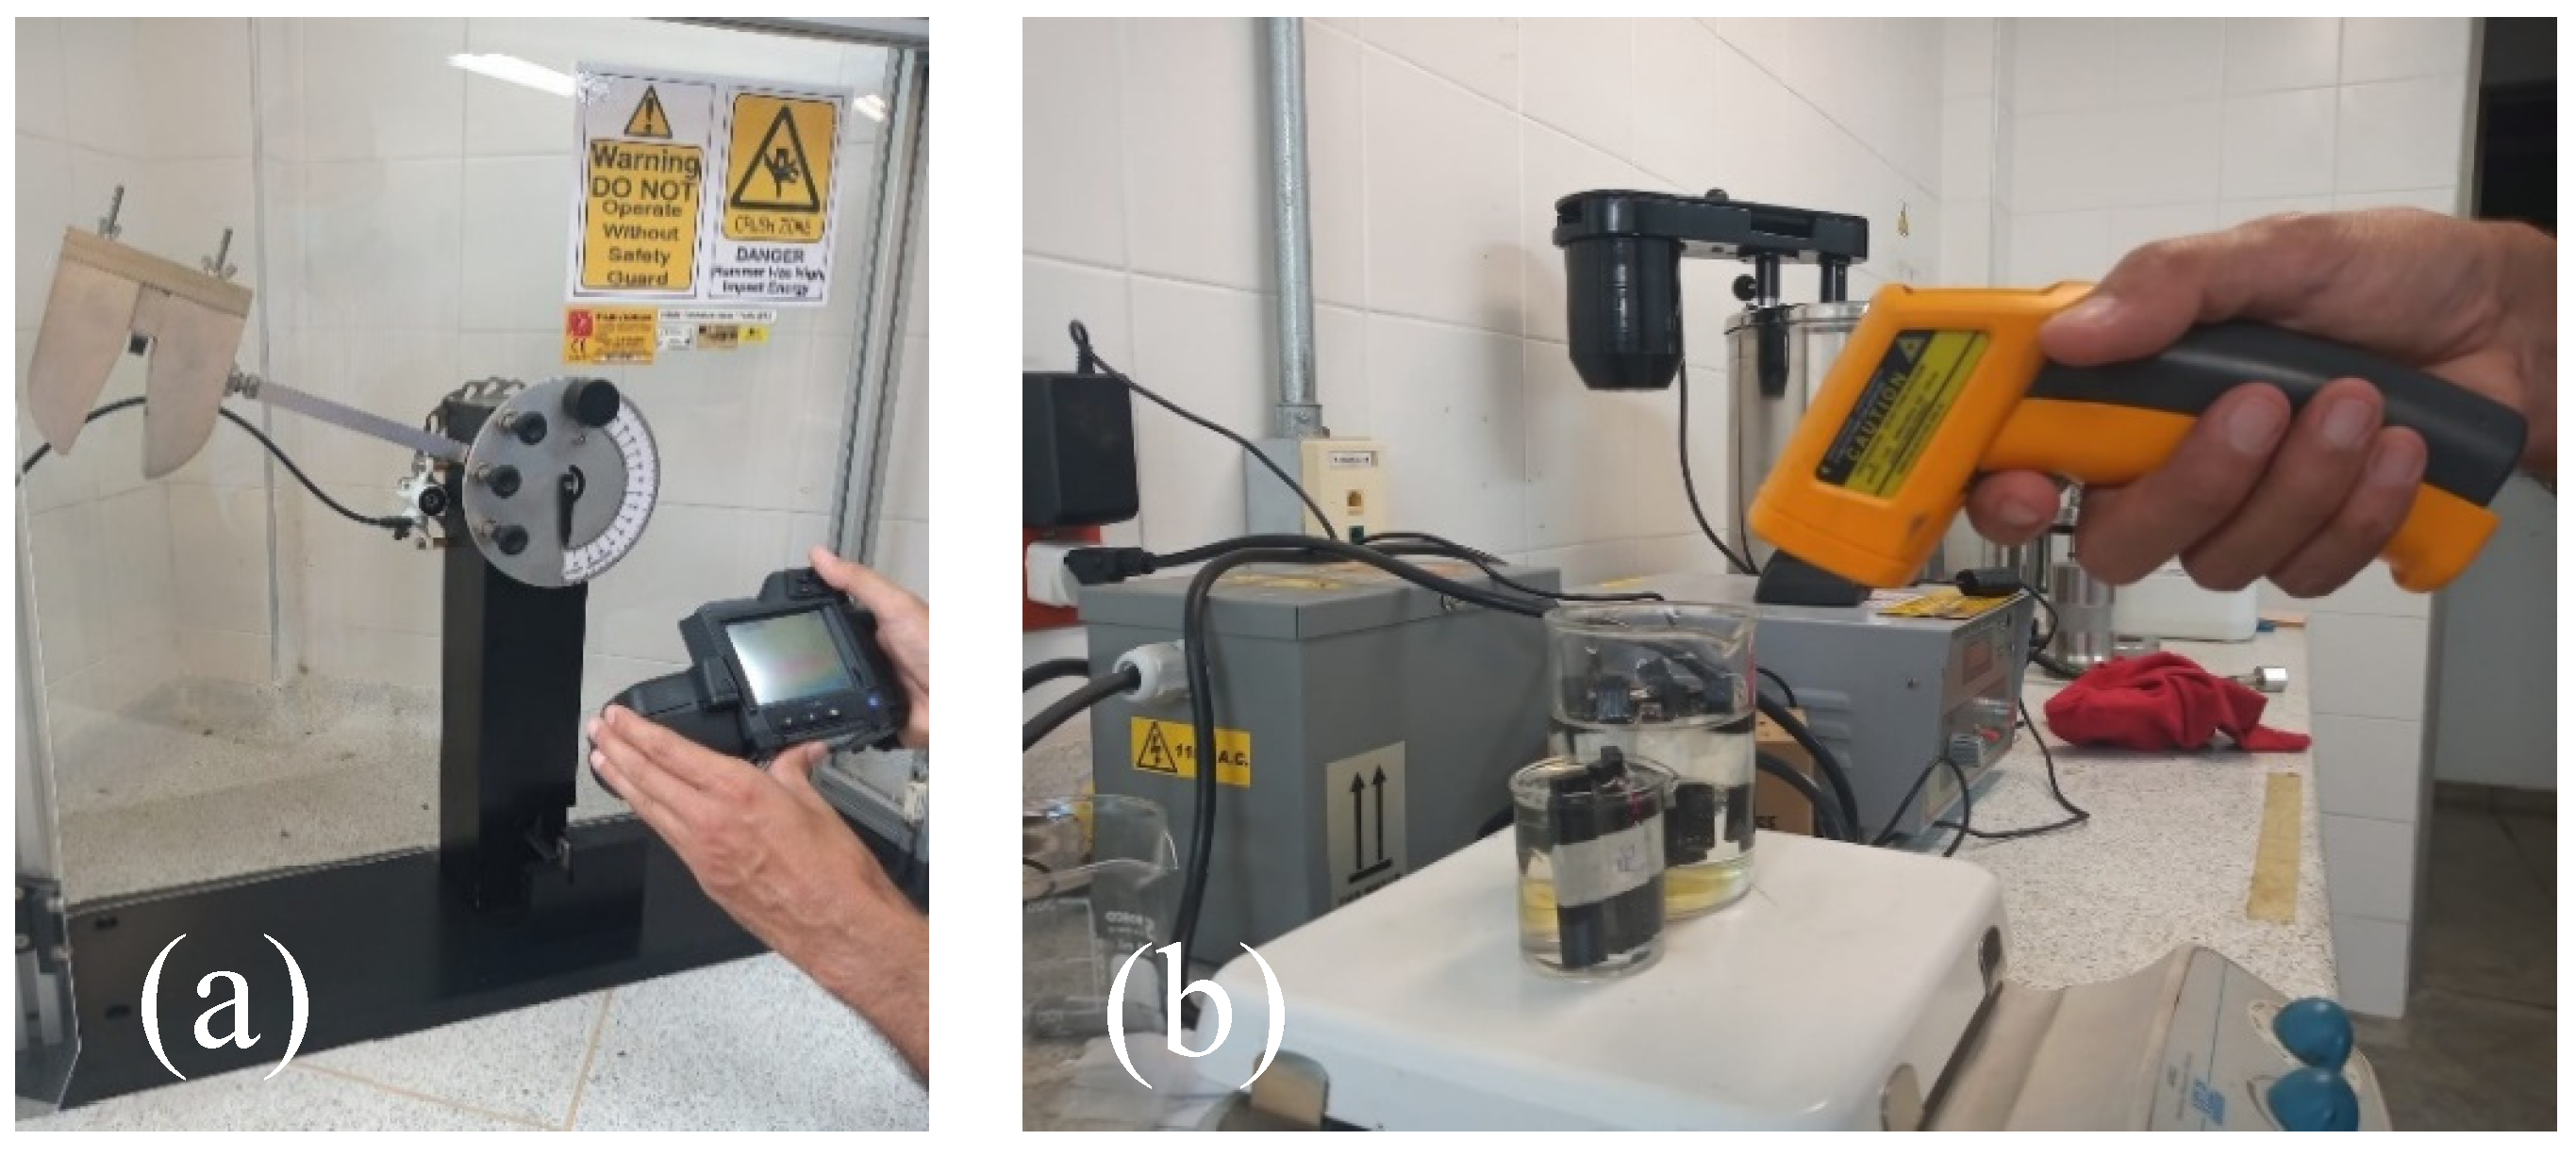
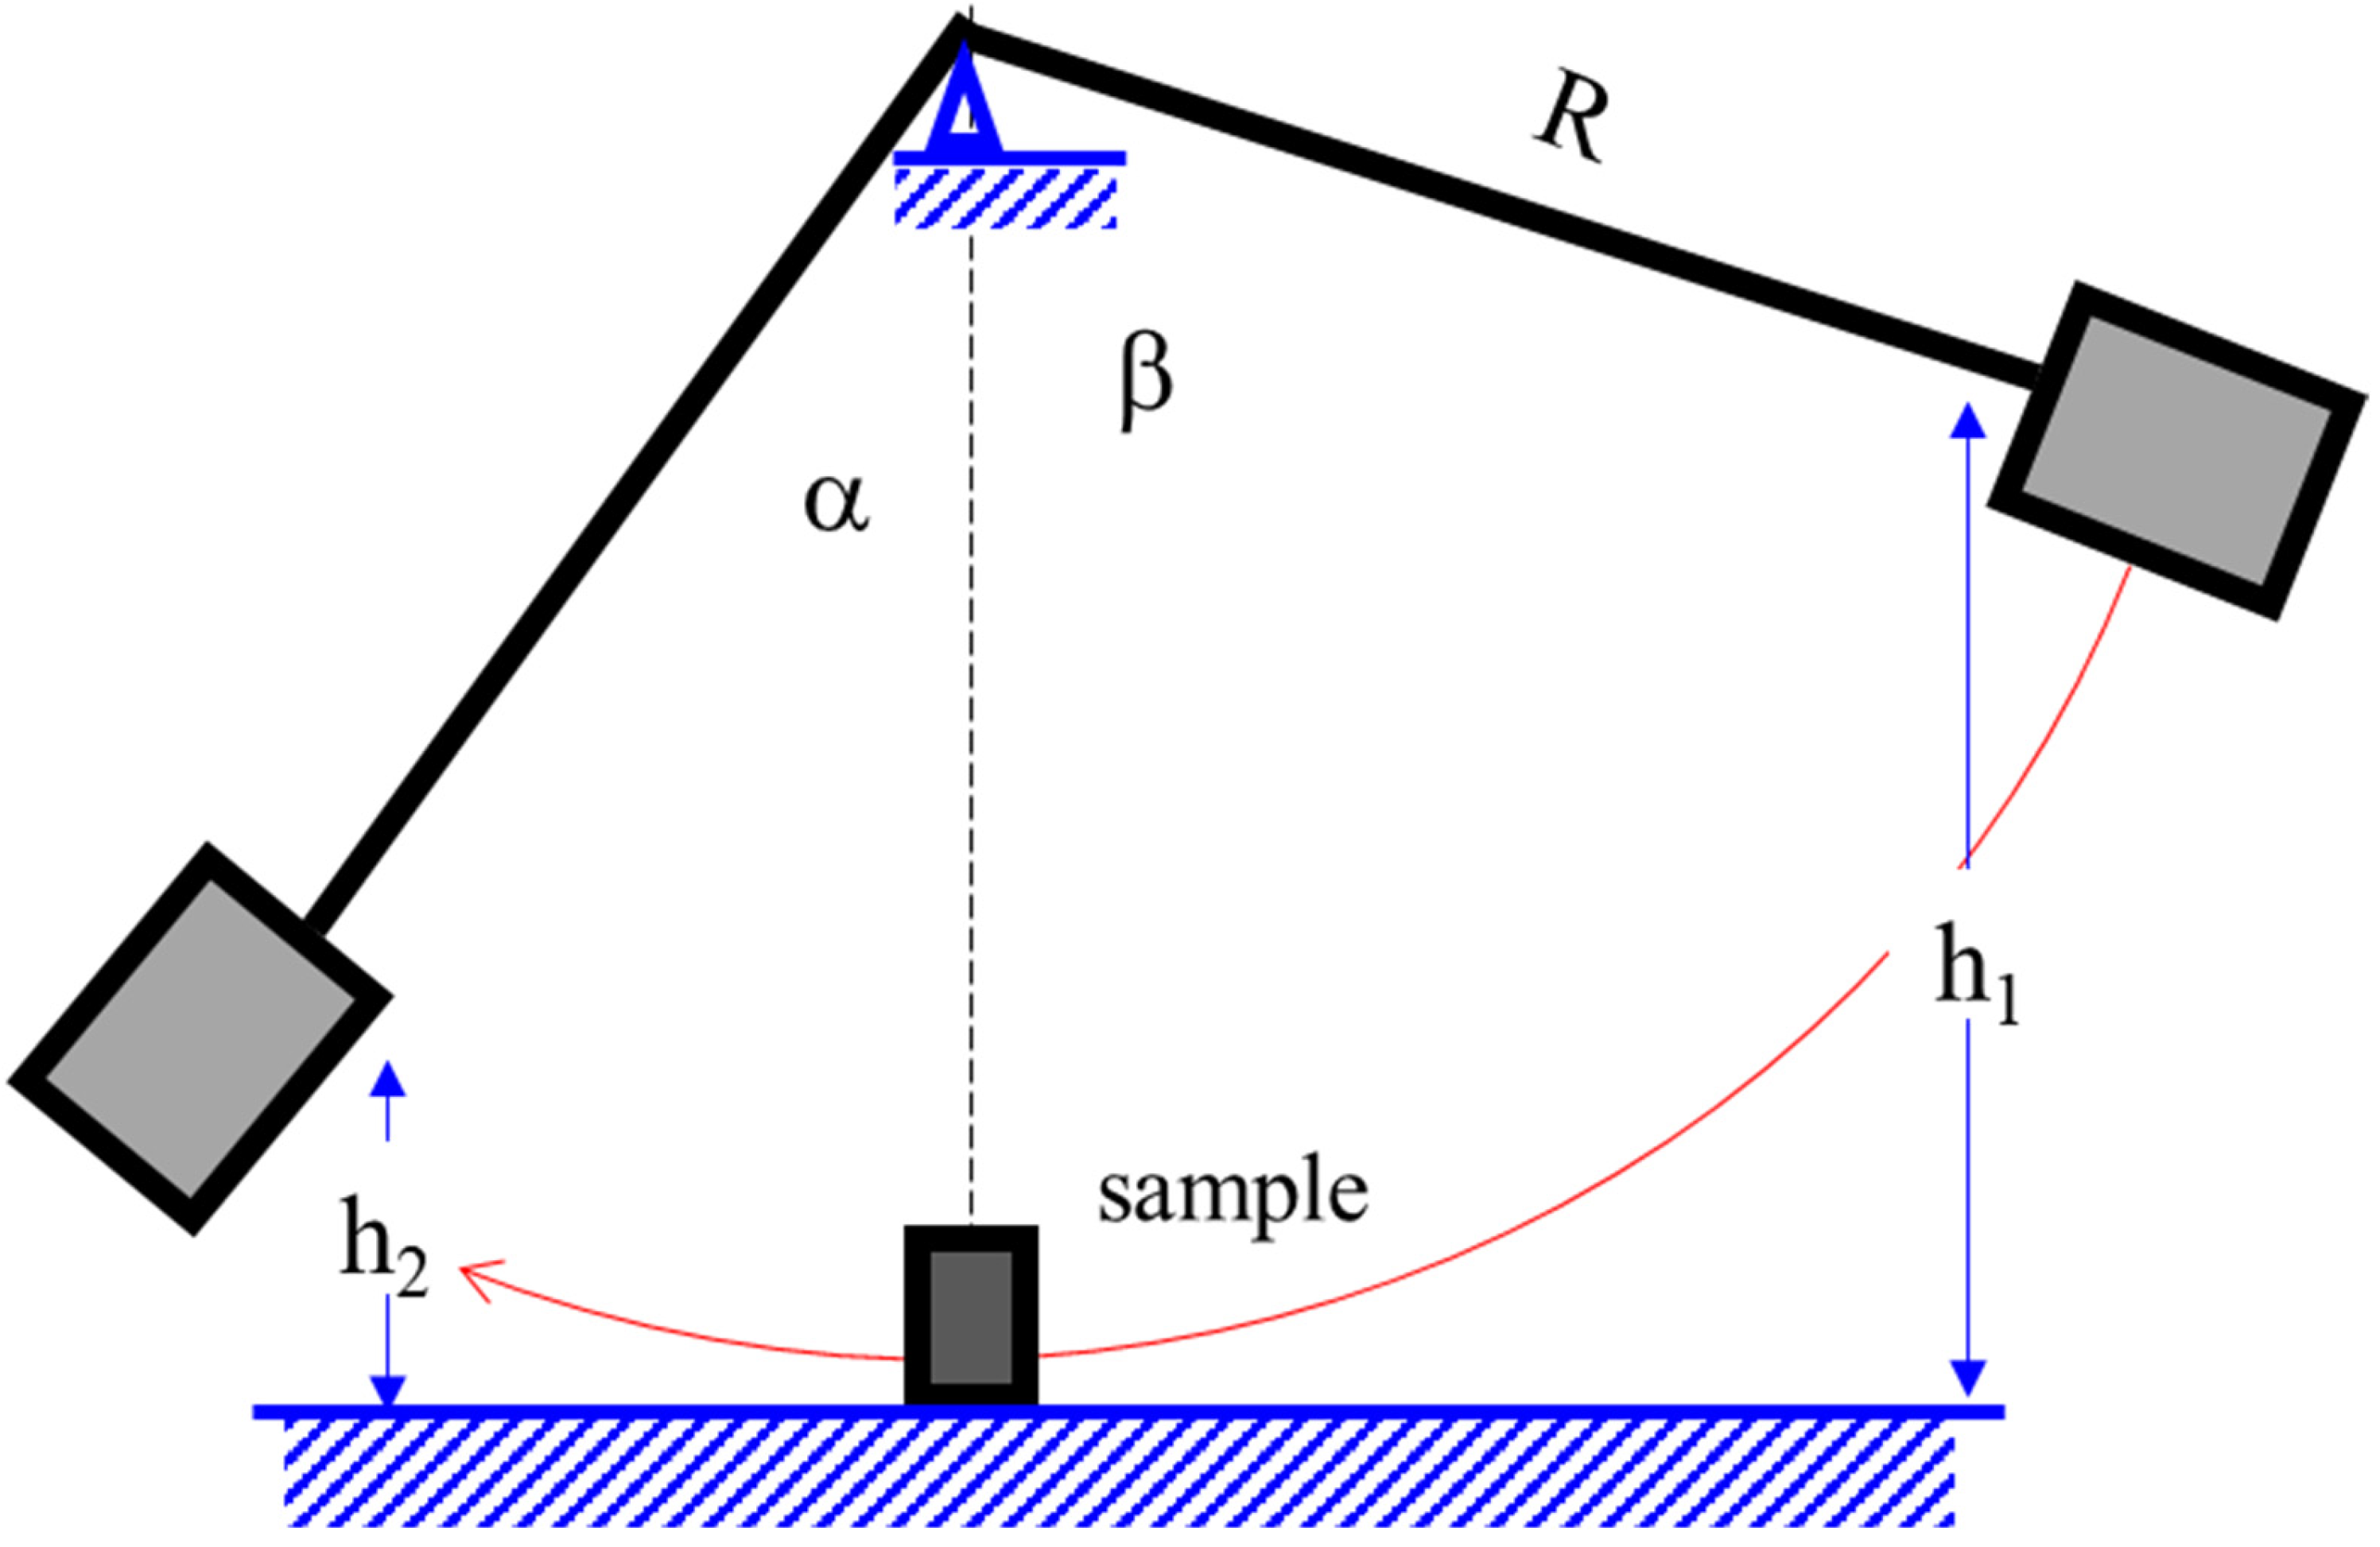
3. Materials and Methods

Short carbon fiber-reinforced nylon (SFRTP) was used for the matrix, as provided by Markforged, and four types of continuous fiber were used as reinforcements: carbon, Kevlar, fiberglass, and high-temperature fiberglass, the four also exclusively provided by Markforged. The Vf was kept the same, about 24.2%, measured by the matrix and fiber volume given by the Eiger® software.
Samples were printed per ASTM A-370 with 55 long, 10 high, and 4 mm wide dimensions The fibers were oriented so that the impact would be edgewise. Figure 4 shows how the sample was configured in Eiger®. It details how the fiber is distributed within the sample, as shown in Figure 4a, and how the matrix filling and reinforcement layers are, as shown in Figure 4b and Figure 4c, respectively and sample dimensions are shown in Figure 4d. The samples were printed with an isotropic fiber layout oriented in the direction of the sample, as shown in Figure 4c, according to results from Caminero et al. [2], but printing parameters were chosen from [10], which included a triangular filling pattern and matrix density of 20%, and two roof, wall, and floor layers. No evidence of warping during printing was found; hence, no brim support was added during configuration.
Samples were tested at different temperatures to assess the variation in impact energy. Samples were labeled describing the type of fiber (C for carbon, FG for fiberglass, Kv for Kevlar, and HSHT for high-strength, high-temperature fiberglass) and the exposed temperature origin (A for liquid nitrogen at about −40 °C, B for solid CO2 at about −20 °C, C for ambient temperature at about 25 °C, D for warm glycerin at about 50 °C, and E for hot glycerin at about 90 °C). The minimum number of samples was three per measured point, following ASTM A370-19 [37]. The performance of individual components and many different combinations was thoroughly reviewed [1] except for HSHT. According to Markforged, HSHT is a fiber that maintains elastic properties until about 150 °C, and its impact resistance is almost 30 and 100 times more than that of ABS and PLA, respectively [31].
Impact tests were carried out in the impact tester HSM41 from P. A. Hilton (Stockbridge, UK) equipped with a 354 mm arm and mass increments of 0.3 kg. The temperature was verified for each sample before testing with a Fischer Scientific infrared temperature gun and a FLIR A655sc Infrared camera. Liquid N2 has a boiling point of about −195 °C; however, the IR camera has a range from −40 to 150 °C. Therefore, to measure the temperature, once samples were out of the N2 bath, they were left to warm up until the camera registered a temperature slightly higher than −40 °C. Data were logged and processed with MS-Excel®. Figure 5a shows a sample mounted on the impact apparatus being tested for temperature with the IR camera right before the hammer was released, and it was double-checked with the IR gun. This was the recorded temperature for each sample. Figure 5b shows the IR gun monitoring temperature while the samples were in glycerin on a hot plate.
Finally, the same type of fiber reinforcement samples was randomly distributed within the different temperature groups to avoid any possible bias from printing differences that may have been raised from the manufacturing technique variation. Table 3 shows the summary of the samples used.
Figure 6 shows the terminology used for the impact apparatus variables. Impact energy, U, was calculated with Equation (1).
U = m g R cos α cos β
where m is the arm mass, R is the arm radius, g is gravity, α and β are the angle between the vertical and maximum height after impact and maximum before release, respectively.
Finally, it has to be added that many attempts have been made to try to correlate Charpy impact energy with fracture toughness [38]. Although they are used for metals, fundamental differences such as a blunt notch, specimen size, and load speed in both samples make such a correlation defective. Care should, therefore, be taken when using these results.

4. Results and Discussion
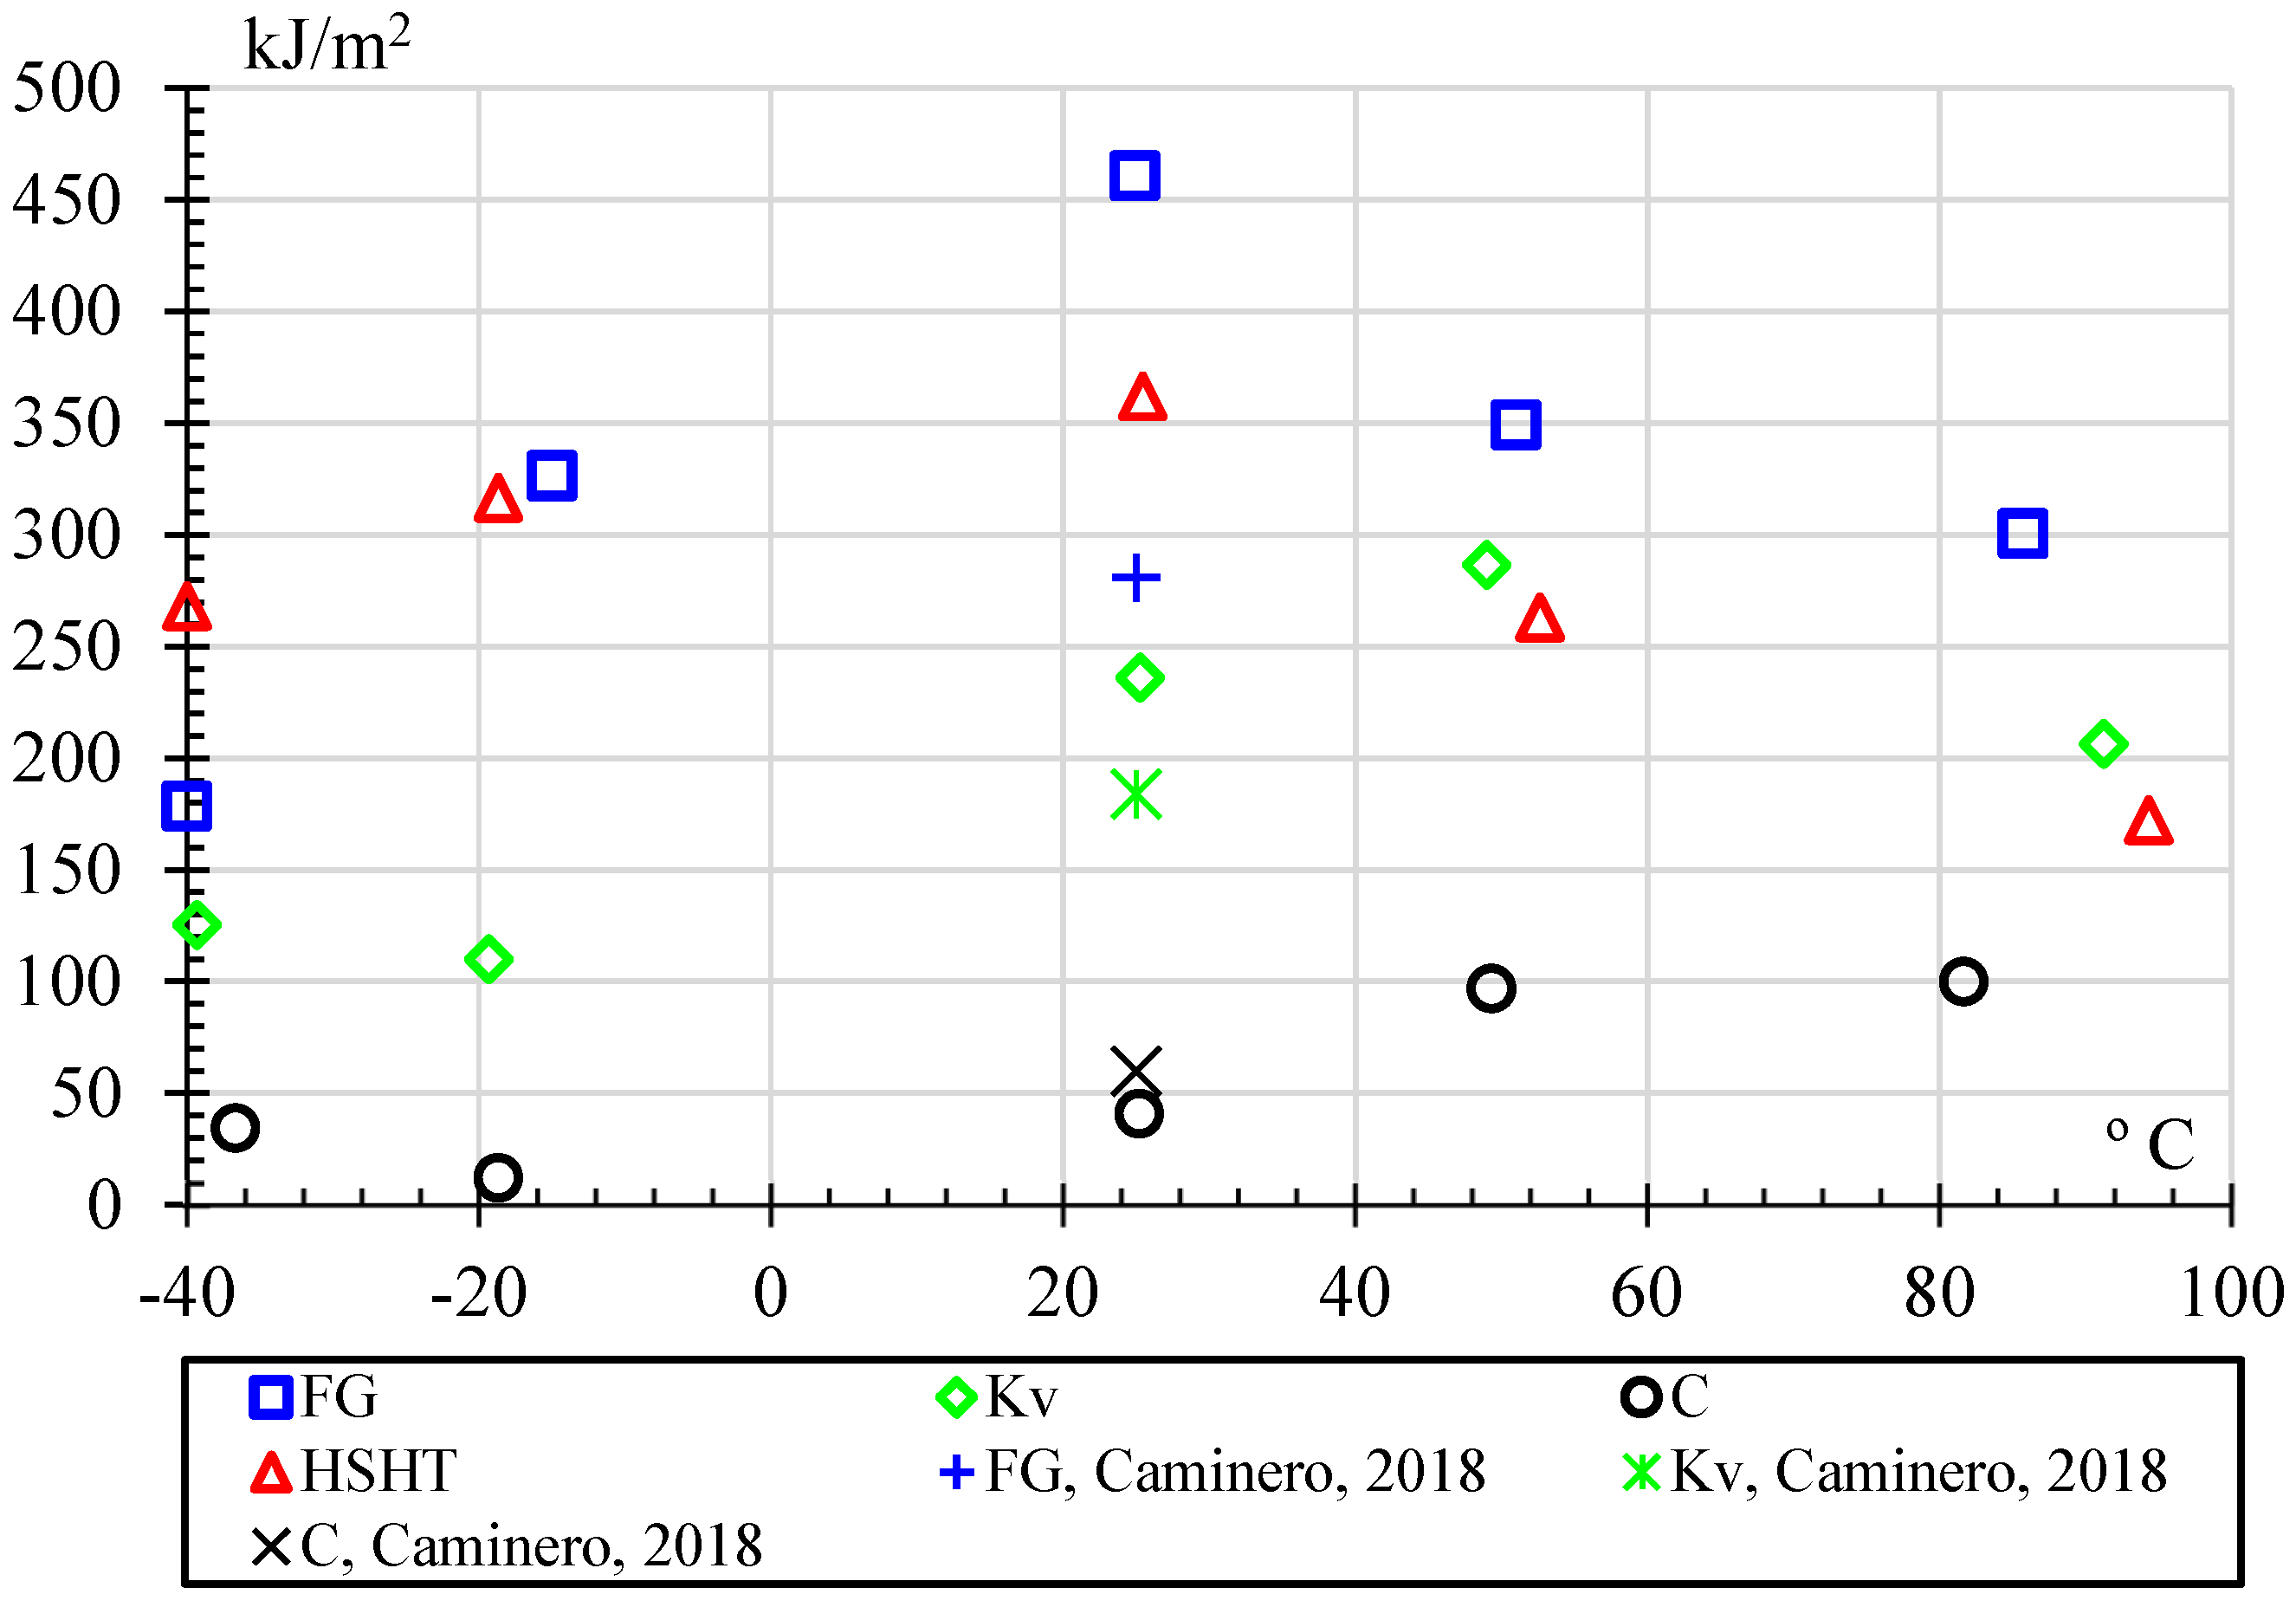
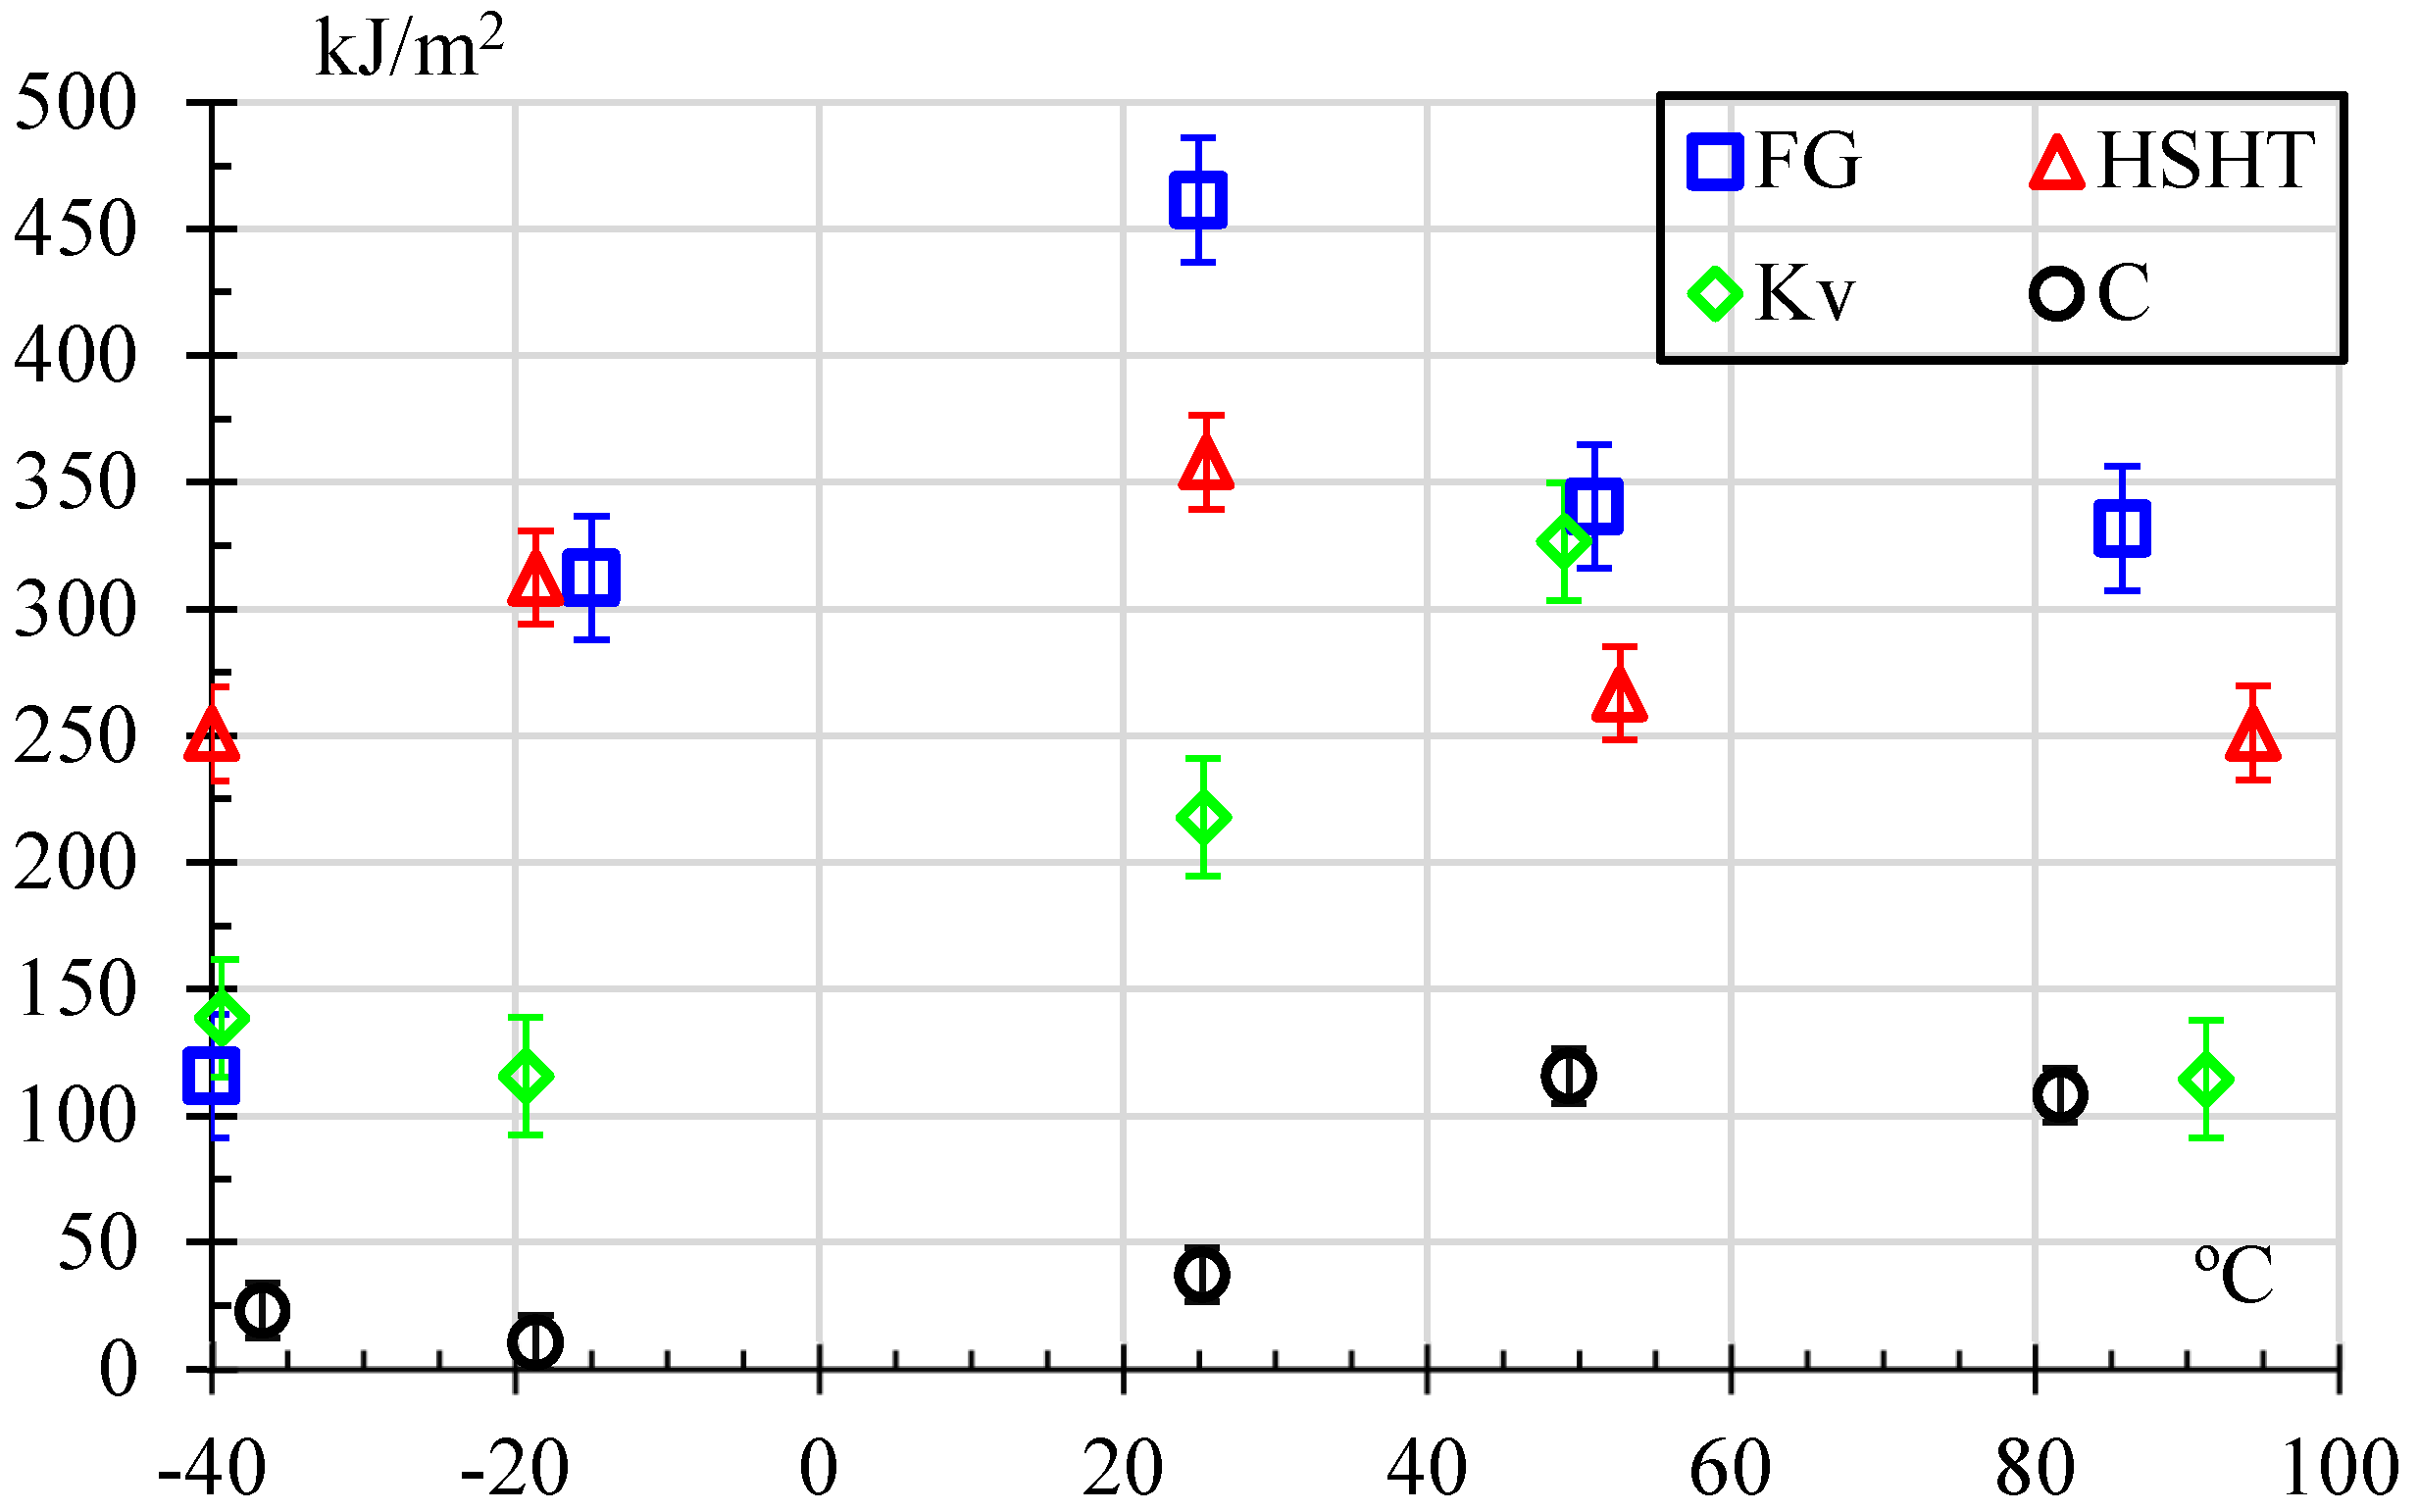
4.1. Impact Results

Figure 7 shows the absorbed impact energy plotted against the average temperature for the four composite materials. Although HSHT offers a 55% higher Izod energy than FG (and is marketed as offering superior performance at temperatures up to 150 °C), FG delivers superior performance at ambient temperature and about the same at −20 °C. However, the highest temperature we tested was about 90 °C, so we cannot verify performance beyond that point. Kevlar outperforms HSHT after ambient temperature. As expected, carbon fiber-reinforced samples offer the poorest performance, being a resistant but less tough material. Finally, the results are proportional to the values for Izod impact strength provided by the manufacturer, as shown in Table 2. In that order, the most resistant fibers are HSHT, FG, Kv, and C. One might be tempted to use the commonly known rule of mixtures to obtain a prediction of impact properties. However, it has been shown that such a rule might make an inaccurate prediction [1] as it only accounts for the individual contribution of impact strength for the matrix and fiber in this case. It cannot include energy dissipation mechanisms such as matrix-fiber bonding and does not account for the internal fiber layout distribution [18]. Therefore, a more suitable method could be numerical modeling, such as asymptotic homogenization as described by Dutra et al. [29].
As a comparison, the results for the same configuration with a similar Vf obtained by Caminero [2] are plotted as well. The difference is about 69, 88, and 25 times higher for FG, Kv, and C, respectively. On the other hand, Vaško et al. [16] obtained the best results for HSHT, FG, Kv, and C, in that order. However, their Vf was very different than the one used in this study.
Figure 8 shows the absorbed impact energy versus average temperature and standard error. The standard error is calculated with Equation (2).
e r r = i = 1 n U i n n
where n is the number of measured points.
Table 4 shows the average temperature in °C for every group, the average impact strength in kJ/m2, and the standard deviation. Because the time taken from the immersion in the heating fluid until the actual test and measurement was not constant, and environmental conditions varied, the temperature slightly changed as recorded by the IR camera at the time of the test. One can see the group that presented the largest standard deviation for the four fibers, except for C and FG, was the group tested after the samples were immersed in hot glycerin at 90 °C. The SD were 47.6, 28.8, 7.6, and 4.8% for KV, HSHT, FG, and C, respectively. Such an effect might be attributed to some of those samples bending rather than breaking. This bending may be why the impact strength decreases instead of absorbing more energy, like in the case of metals.
On the other hand, the C samples presented the most considerable dispersion (38.3%) when they were tested after immersion in liquid nitrogen (about −40 °C) followed by FG (28.4%), Kv (19.2%), and HSHT at 6.8%. The C samples were also the samples with the lowest impact strength. Furthermore, the SD for the temperature was below 10%.
Experimental data were adjusted to a third-order polynomic model, as shown in Equation (3).
U ( T ) = a T 3 + b T 2 + c T + d
Equation (3) uses the constants shown in Table 5, for each type of reinforcement material, and the correlation coefficient R2, representing data inclusion. The impact energy is in kJ/m2, whereas temperature is in °C. The polynomic models are valid from −40 to +90 °C.

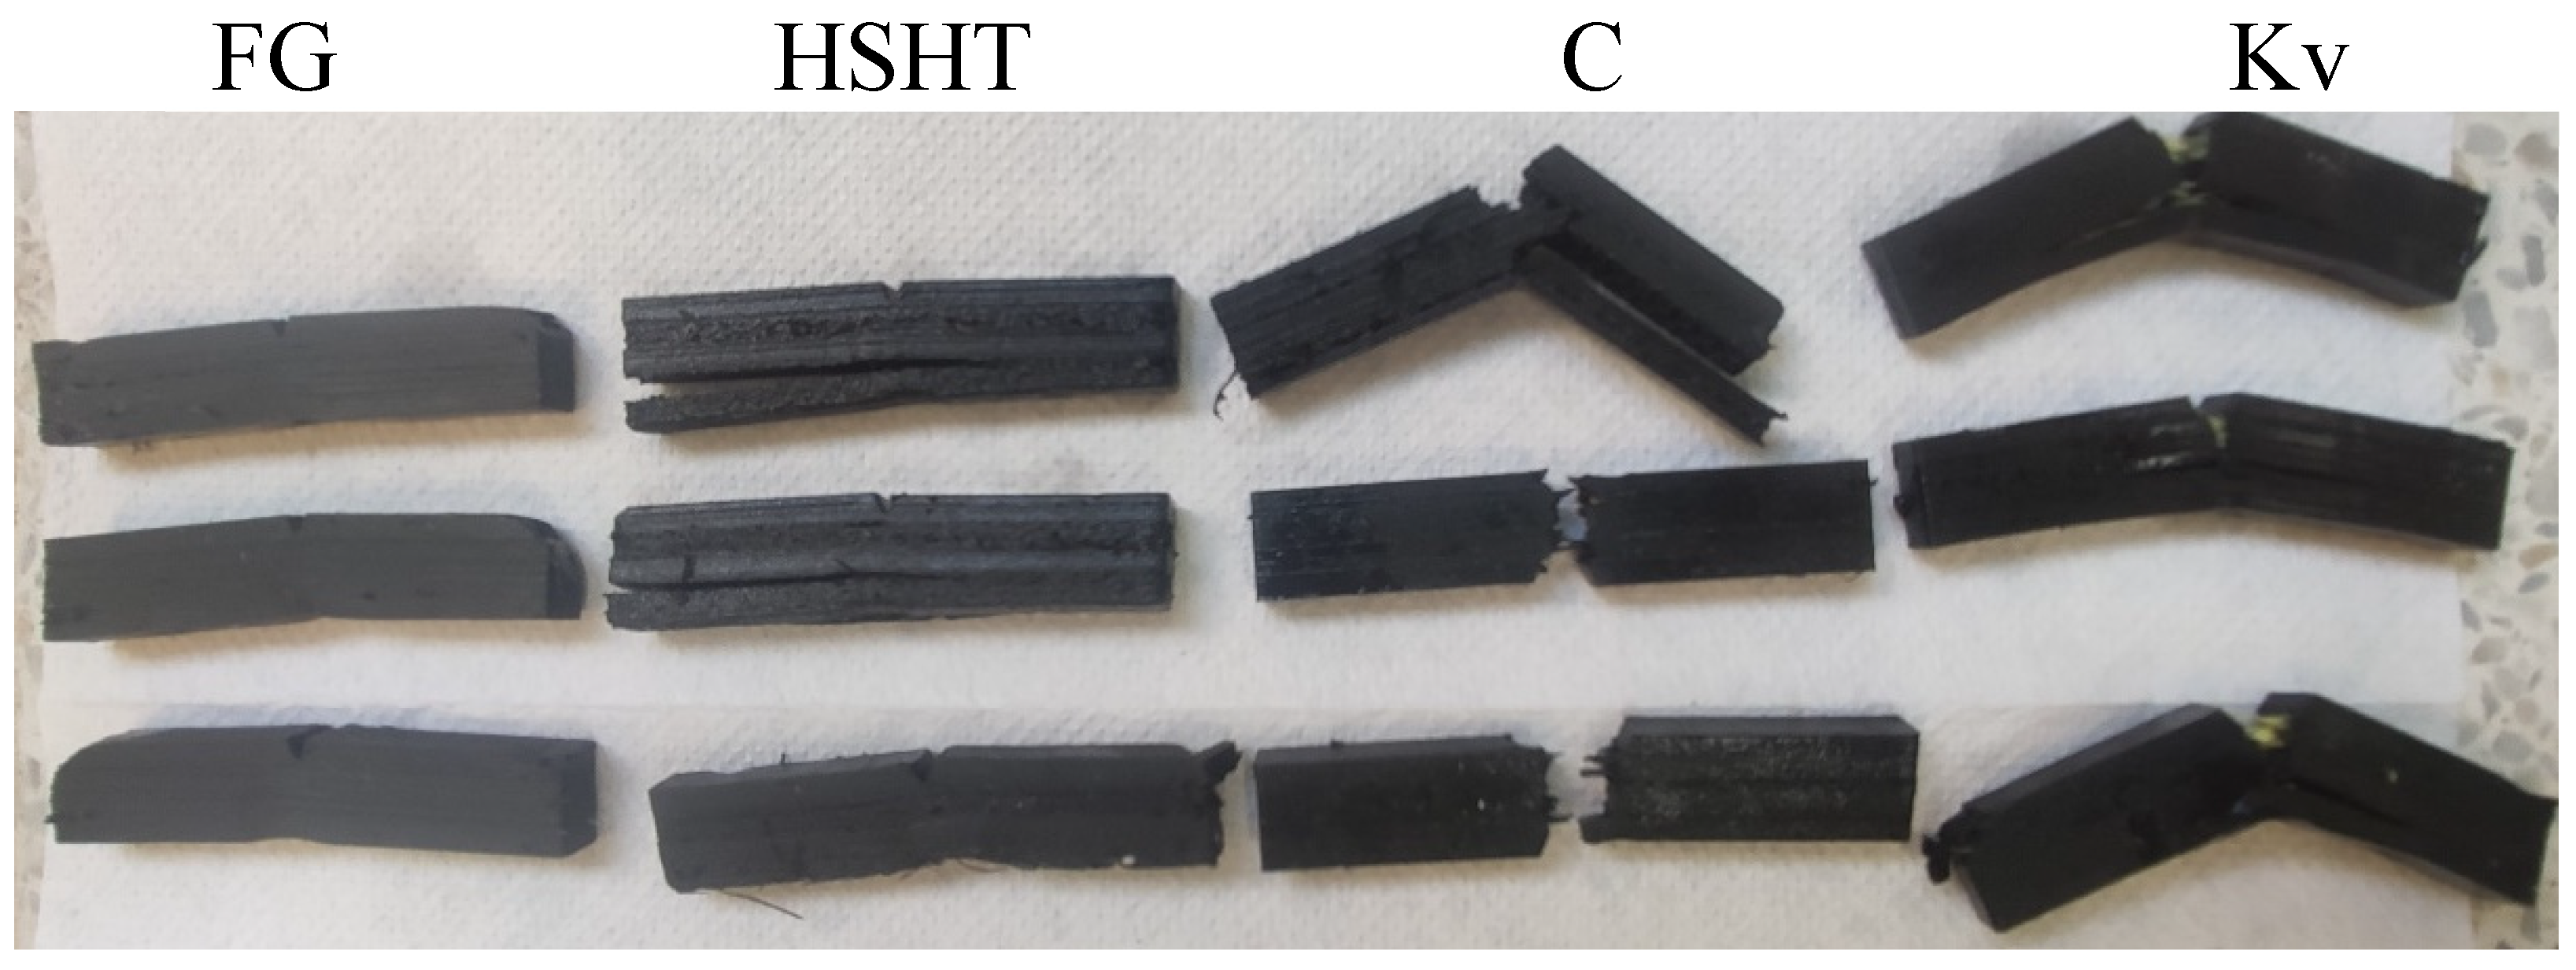
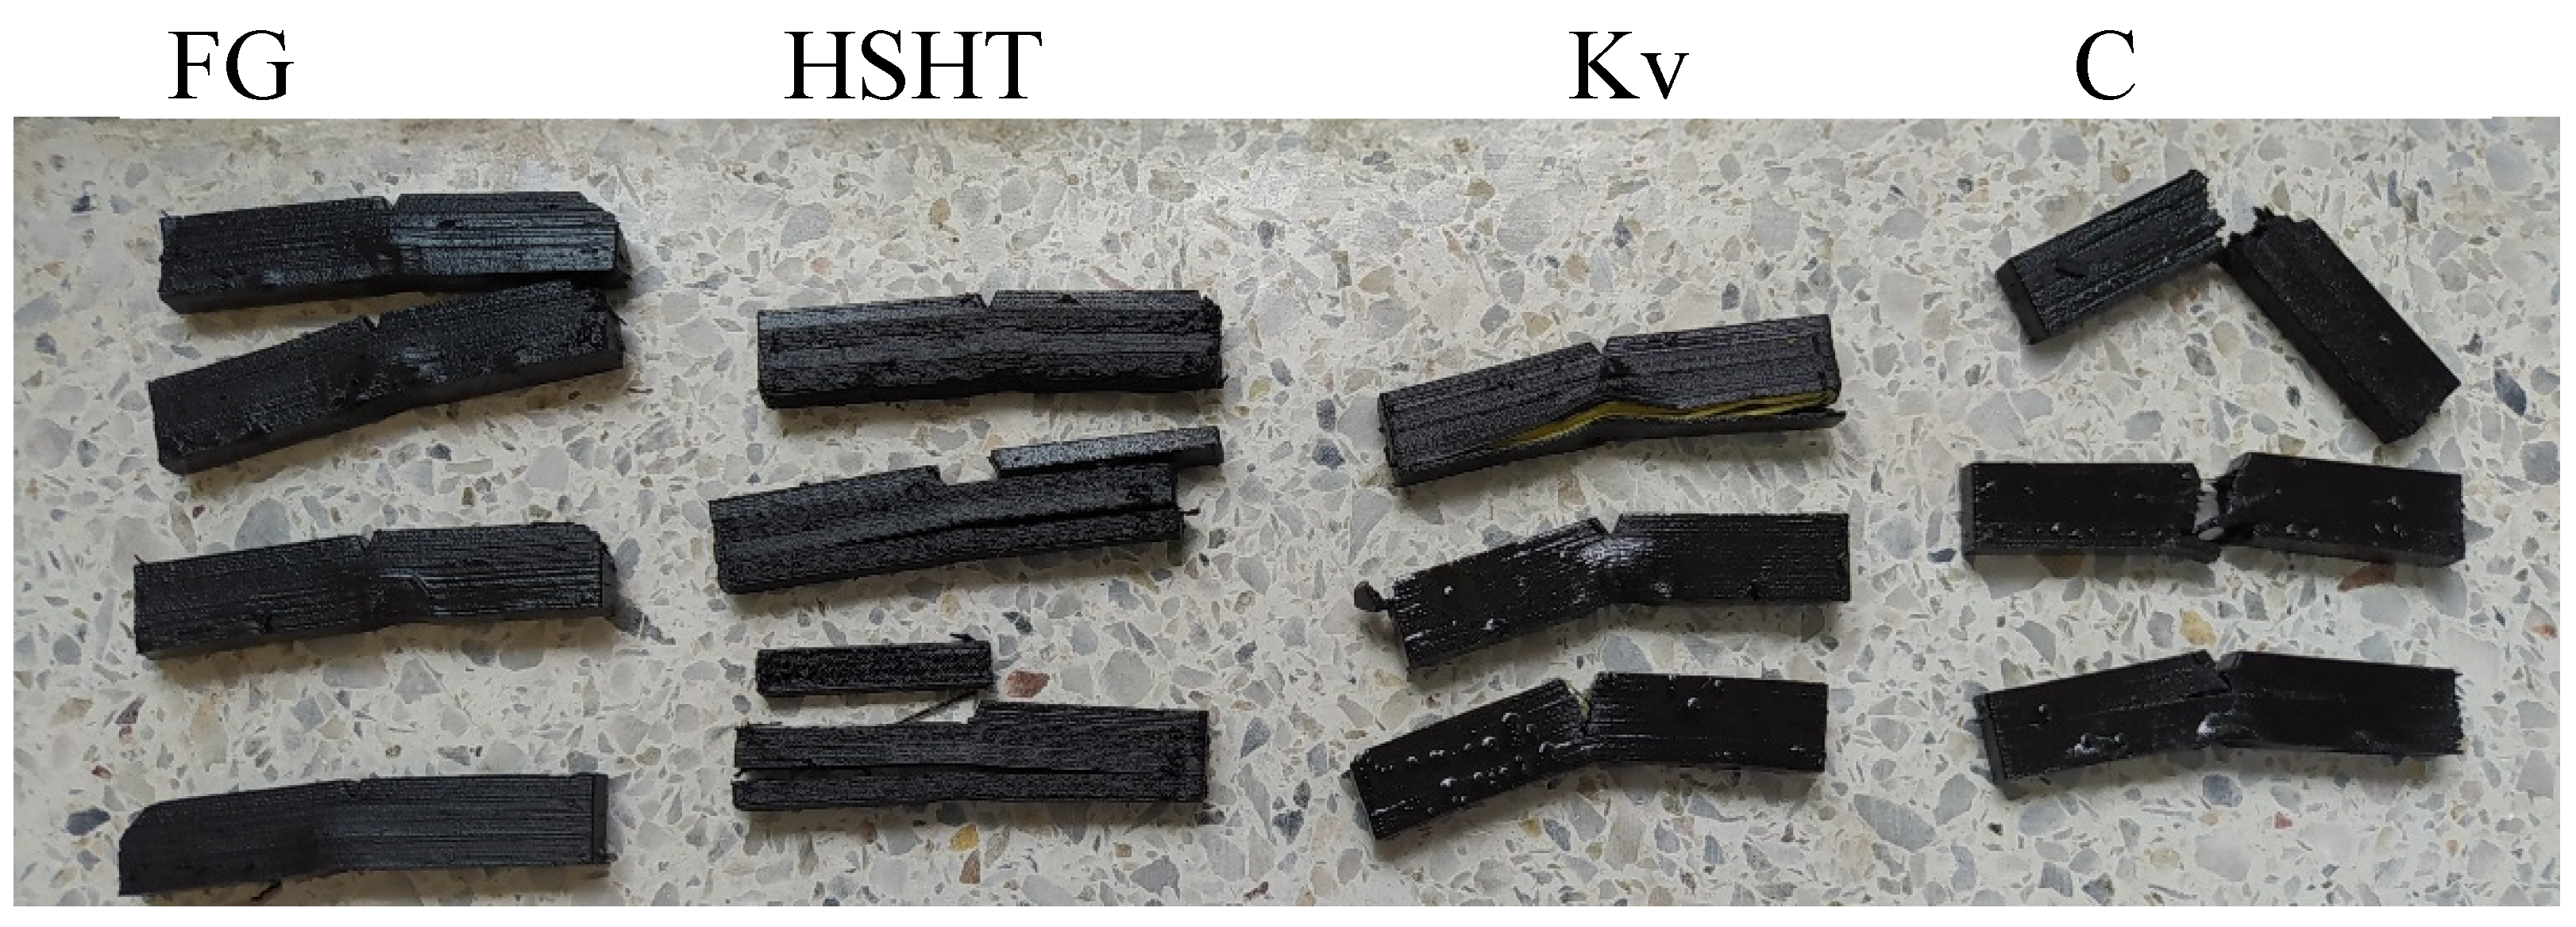
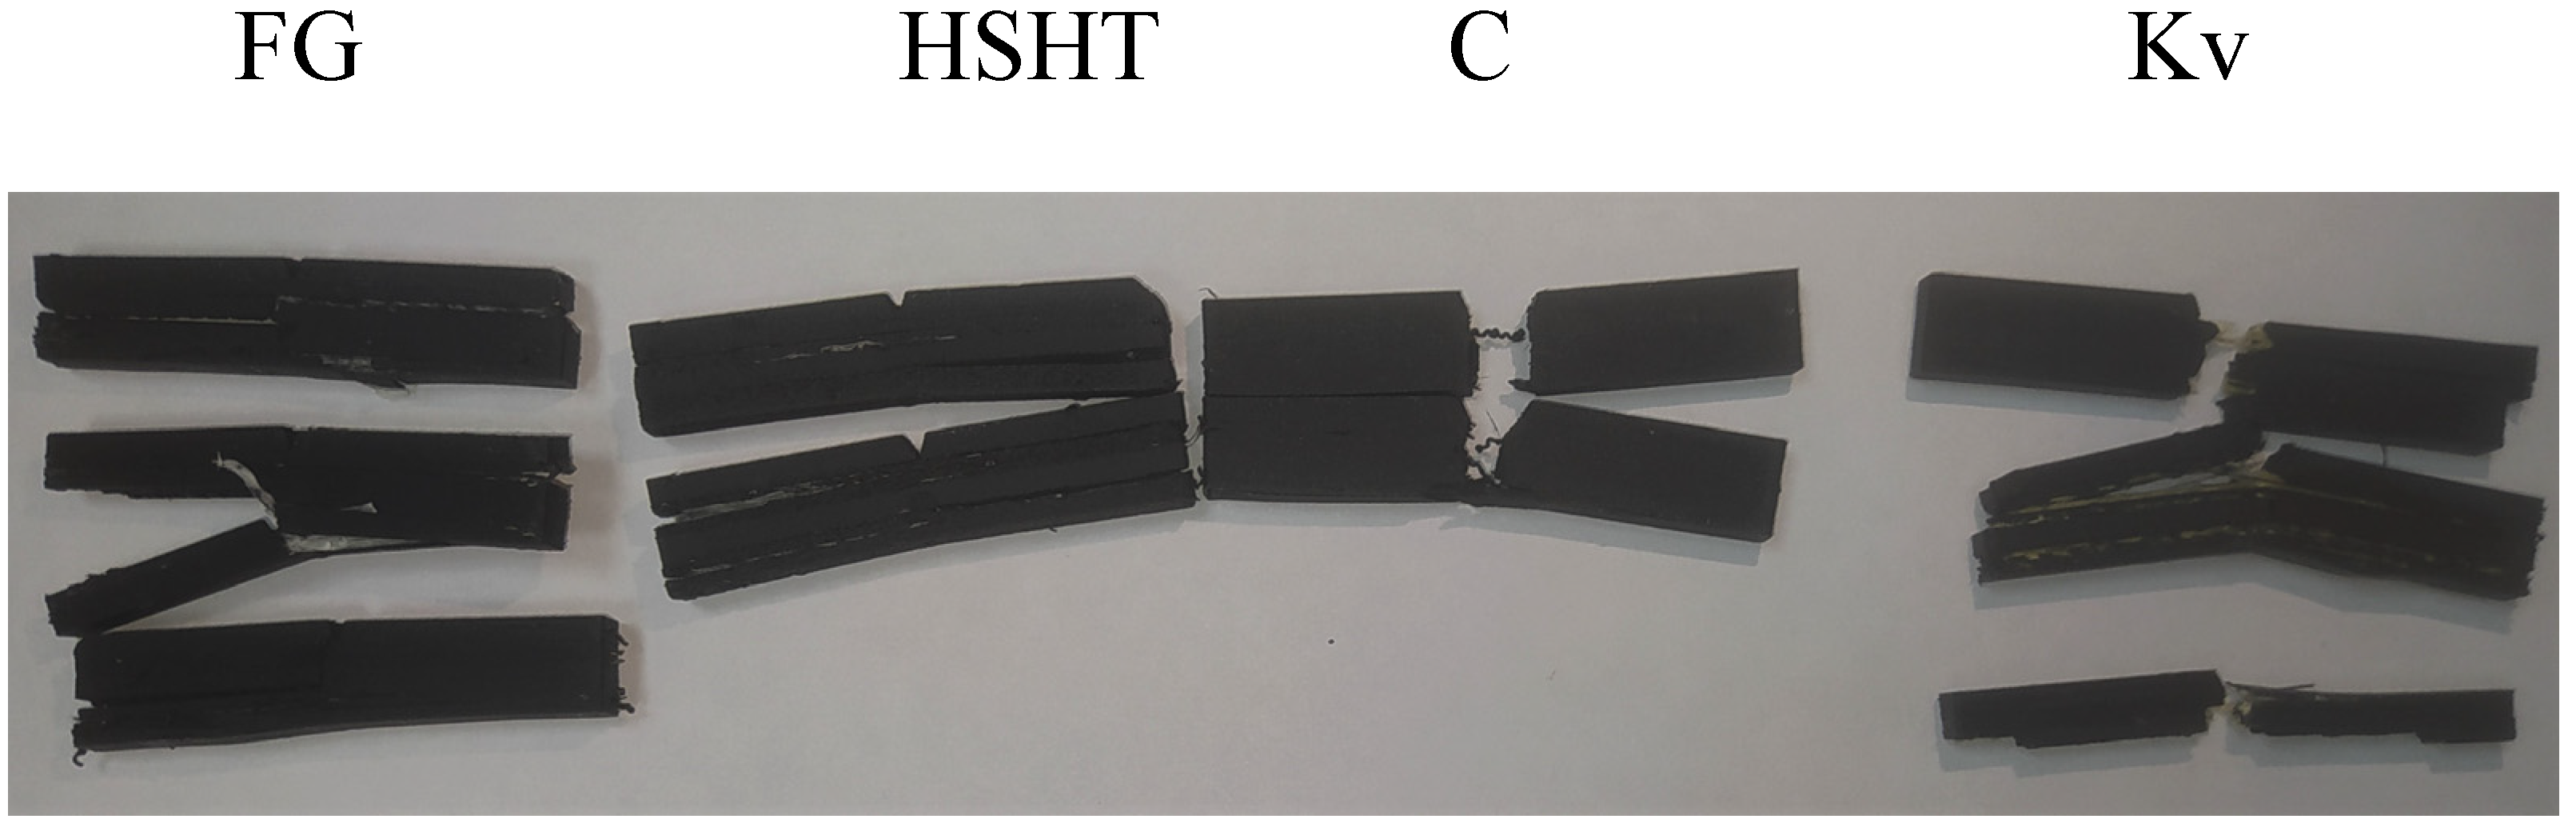
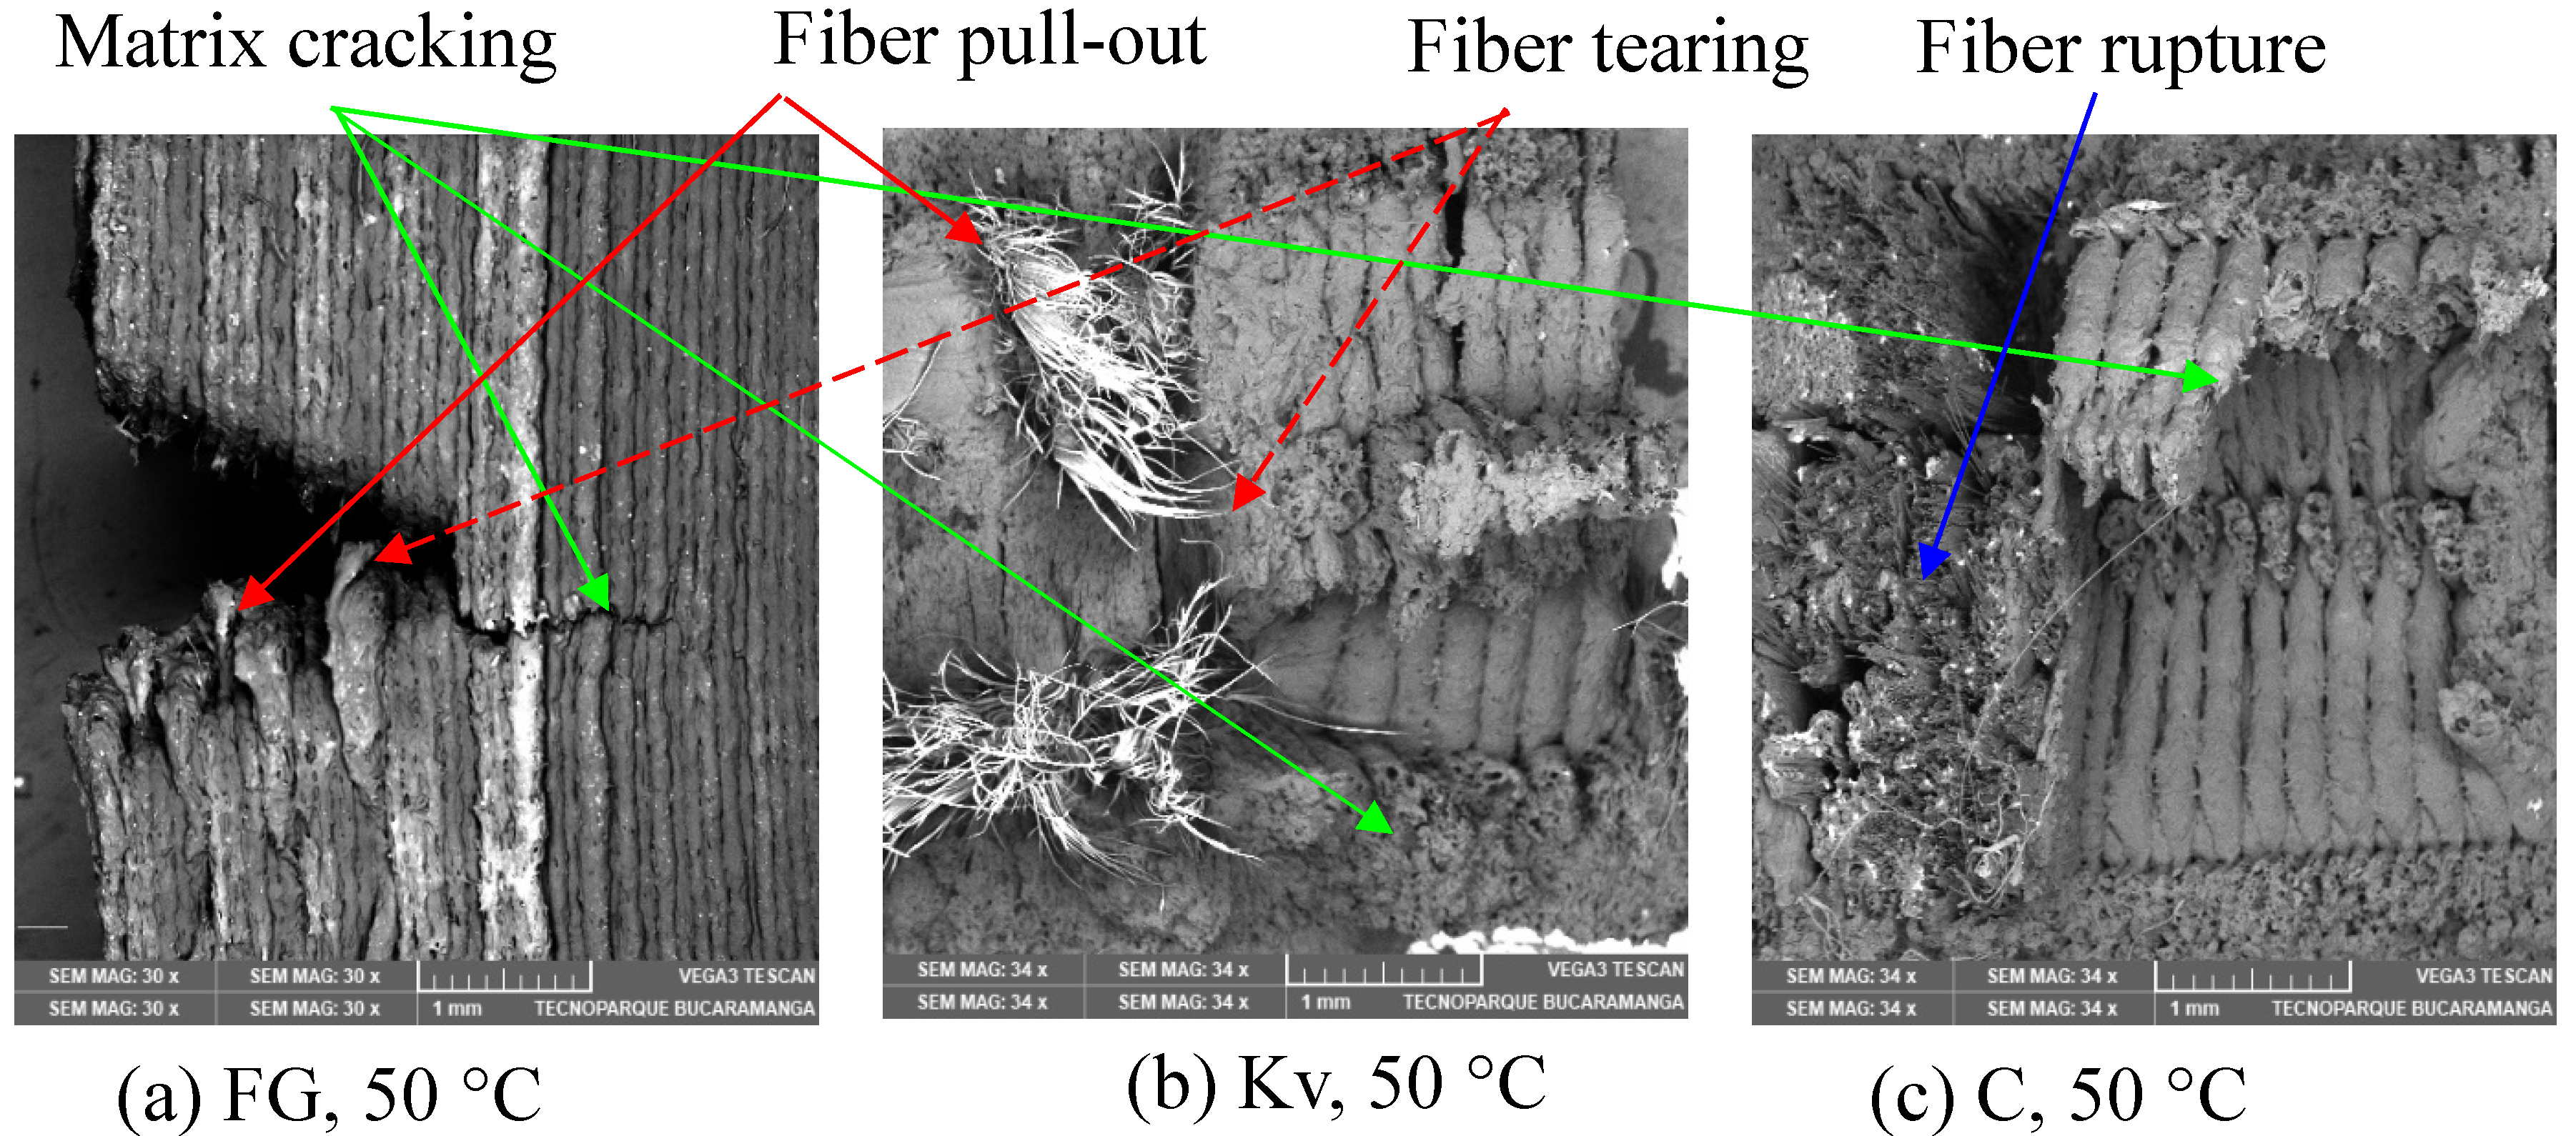
4.2. Failure Analysis

Figure 9 shows the macroscopic appearance of the samples heated with warm glycerin (about 50 °C). FG and HSHT did not break, but HSHT showed some separation between the matrix and fiber along the printing direction. C completely broke, and one sample showed separation between the matrix and fiber along the printing direction, whereas Kv showed fiber tearing and pulling accompanied by matrix bending.
Figure 10 shows the macroscopic appearance of samples cooled under liquid N2 (about −40 °C). FG did not break, while HSHT showed fiber matrix separation along the printing direction. C showed matrix bending and some delamination, whereas Kv completely broke. Overall, one can see how the samples show a more fragile failure compared to the samples at higher temperatures. This morphological behavior agrees with the lower impact energy presented in Figure 7. Furthermore, the failure mechanisms agree with the observations from the literature [12,13,15].
Figure 11 shows the macroscopic appearance of samples cooled in liquid CO2 (about −18 °C). FG and HSHT samples did not break but instead showed delamination. Carbon broke completely in a fragile manner, including both the matrix and fiber, whereas Kevlar showed a mixture of delamination, fiber–matrix separation, and sample rupture.
Figure 12 shows a closer look at the fracture area for samples tested at 50 °C. Figure 12c shows a cleaner rupture in carbon-reinforced specimens, whereas for Kv (Figure 12a) and FG (Figure 12b), pulling and fiber tearing are also observed. The latter two mechanisms partially explain the higher impact energy absorbed by FG and Kv shown in Figure 8. The applied impact energy is absorbed by pulling fiber from the matrix, tearing fiber, cracking, and rupture. Carbon-reinforced samples only show the last two mechanisms.

5. Conclusions

Charpy impact tests were performed for additively manufactured composites under different temperatures. The matrix was onyx, which is nylon based with embedded short carbon, whereas the reinforcements were continuous fiberglass, high-temperature fiberglass, Kevlar, and carbon fibers. The tested temperatures were −40, −20, 25, 50, and 90 °C. A reduction in impact energy absorption was observed in all the samples when the temperature was reduced. In contrast, the impact energy increased when the testing temperature was elevated, reaching a maximum at 50 °C. At that point, the impact energy decreased. In this order, the reinforcement fibers that withstood the higher impact energy were fiberglass, HSHT, Kv, and C. Therefore, if the projected component experiences impact service loads, design verification must be performed using analytical or numerical methods to avoid the damage mechanisms typical of impact loading, even at low-speed strain rates. This study provides impact strength values. The results were adjusted to polynomic models with a linear correlation factor, R2, of 92.19, 93.89, 99.79, and 97.78% for FG, HSHT, Kv, and C, respectively, which are valid between −40 and 90 °C.
The failure mechanism for AM composites does not seem to differ from those of composites fabricated by other methods or from the same type of composites tested at ambient temperature. More specifically, the failure mechanisms for carbon and Kevlar included fiber pull-out, delamination, and matrix cracking for tests performed at −40 and −20. For ambient temperature, failure modes were fiber pull-out and fiber tearing. The failure mechanism for fiberglass was matrix cracking, whereas for HSHT, it was delamination and matrix cracking.

Author Contributions

Conceptualization, J.G.D.-R. and A.D.P.-C., methodology, J.G.D.-R. and A.D.P.-C.; software, O.R.B.-B.; validation, J.G.D.-R.; formal analysis, J.G.D.-R., A.D.P.-C. and O.R.B.-B.; investigation, J.G.D.-R., A.D.P.-C. and O.R.B.-B.; resources, A.D.P.-C. and O.R.B.-B.; data curation, J.G.D.-R.; writing—original draft preparation, J.G.D.-R.; writing—review and editing, J.G.D.-R., A.D.P.-C. and O.R.B.-B.; visualization, O.R.B.-B. supervision, A.D.P.-C.; project administration, J.G.D.-R., A.D.P.-C. and O.R.B.-B.; funding acquisition, A.D.P.-C. All authors have read and agreed to the published version of the manuscript.

Funding

Funding was provided by project VIE UIS 2827.

Data Availability Statement

Data is available upon request.

Acknowledgments

The authors acknowledge the support of the project VIE UIS 2827, SENA Tecnoparque nodo Bucaramanga for printing the samples, and H. J. Orozco and C. Calero for their help in performing the impact tests.

Conflicts of Interest

The authors declare no conflict of interest.

References

  1. Díaz-Rodríguez, J.G.; Pertúz-Comas, A.D.; González-Estrada, O.A. Mechanical Properties for Long Fibre Reinforced Fused Deposition Manufactured Composites. Compos. B Eng. 2021, 211, 108657. [Google Scholar] [CrossRef]
  2. Caminero, M.A.; Chacón, J.M.; García-Moreno, I.; Rodríguez, G.P. Impact Damage Resistance of 3D Printed Continuous Fibre Reinforced Thermoplastic Composites Using Fused Deposition Modelling. Compos. B Eng. 2018, 148, 93–103. [Google Scholar] [CrossRef]
  3. Beaumont, P.W.R. The Structural Integrity of Composite Materials and Long-Life Implementation of Composite Structures. Appl. Compos. Mater. 2020, 27, 449–478. [Google Scholar] [CrossRef]
  4. Castro, J.T.P.; Meggiolaro, M. Fatigue Design Techniques, 3rd ed.; CreateSpace: Scotts Valley, CA, USA, 2016; Volume I, ISBN 1530797365. [Google Scholar]
  5. Diaz, J.G.; Pertúz, A.D.; Ariza, C.J.; García, D.; Pinto, W. Monotonic Crack Propagation in a Notched Polymer Matrix Composite Reinforced with Continuous Fiber and Printed by Material Extrusion. J. Prog. Addit. Manuf. 2023, 8, 733–744. [Google Scholar] [CrossRef]
  6. Stoia, D.I.; Marsavina, L.; Linul, E. Mode I Critical Energy Release Rate of Additively Manufactured Polyamide Samples. Theor. Appl. Fract. Mech. 2021, 114, 102968. [Google Scholar] [CrossRef]
  7. Yasa, E. Anisotropic Impact Toughnness of Chopped Carbon Fiber Reinforced Nylon Fabricated by Material-Extrusion-Based Additive Manufacturing. Anadolu Univ. J. Sci. Technol.—A Appl. Sci. Eng. 2019, 20, 195–203. [Google Scholar] [CrossRef]
  8. Sauer, J.M. Evaluation of the Mechanical Properties of 3D Printed Carbon Fiber Composites; South Dakota State University: Brookings, SD, USA, 2018. [Google Scholar]
  9. ISO ISO/ASTM 52900:2021; Additive Manufacturing—General Principles—Fundamentals and Vocabulary. International Standard Organization: Geneva, Switzerland, 2021.
  10. Pertuz, A.D.; Díaz-Cardona, S.; González-Estrada, O.A. Static and Fatigue Behaviour of Continuous Fibre Reinforced Thermoplastic Composites Manufactured by Fused Deposition Modelling Technique. Int. J. Fatigue 2020, 130, 105275. [Google Scholar] [CrossRef]
  11. González-Estrada, O.A.; Pertuz Comas, A.D.; Díaz Rodríguez, J.G. Monotonic Load Datasets for Additively Manufactured Thermoplastic Reinforced Composites. Data Brief 2020, 29, 105295. [Google Scholar] [CrossRef]
  12. Prajapati, A.R.; Dave, H.K.; Raval, H.K. Impact Energy Absorption and Fracture Mechanism of FFF Made Fiberglass Reinforced Polymer Composites. Rapid Prototyp. J. 2023, 29, 275–287. [Google Scholar] [CrossRef]
  13. Kabir, S.M.F.; Mathur, K.; Seyam, A.-F.M. Impact Resistance and Failure Mechanism of 3D Printed Continuous Fiber-Reinforced Cellular Composites. J. Text. Inst. 2021, 112, 752–766. [Google Scholar] [CrossRef]
  14. Ojha, K.K.; Gugliani, G.; Francis, V. Impact and Tensile Performance of Continuous 3D-Printed Kevlar Fiber-Reinforced Composites Manufactured by Fused Deposition Modelling. Prog. Addit. Manuf. 2022. [Google Scholar] [CrossRef]
  15. Papa, I.; Manco, E.; Epasto, G.; Lopresto, V.; Squillace, A. Impact Behaviour and Non Destructive Evaluation of 3D Printed Reinforced Composites. Compos. Struct. 2022, 281, 115112. [Google Scholar] [CrossRef]
  16. Vaško, M.; Sága, M.; Majko, J.; Vaško, A.; Handrik, M. Impact Toughness of FRTP Composites Produced by 3D Printing. Materials 2020, 13, 5654. [Google Scholar] [CrossRef] [PubMed]
  17. Scrocco, M.; Chamberlain, T.; Chow, C.; Weinreber, L. Impact Testing of 3D Printed Kevlar-Reinforced Onyx Material. In Proceedings of the 29th Annual International Solid Freeform Fabrication Conference, Austin, TX, USA, 13–15 August 2018. [Google Scholar]
  18. Barbero, E.J. Finite Element Analysis of Composite Materials Using ANSYS, 2nd ed.; CRC Press: Boca Raton, Fl, USA, 2013. [Google Scholar]
  19. Roberson, D.A.; Torrado Perez, A.R.; Shemelya, C.M.; Rivera, A.; MacDonald, E.; Wicker, R.B. Comparison of Stress Concentrator Fabrication for 3D Printed Polymeric Izod Impact Test Specimens. Addit. Manuf. 2015, 7, 1–11. [Google Scholar] [CrossRef]
  20. Pyl, L.; Kalteremidou, K.A.; Van Hemelrijck, D. Exploration of Specimen Geometry and Tab Configuration for Tensile Testing Exploiting the Potential of 3D Printing Freeform Shape Continuous Carbon Fibre-Reinforced Nylon Matrix Composites. Polym. Test. 2018, 71, 318–328. [Google Scholar] [CrossRef]
  21. Pertuz-Comas, A.D.; Díaz, J.G.; Meneses-Duran, O.J.; Niño-Álvarez, N.Y.; León-Becerra, J. Flexural Fatigue in a Polymer Matrix Composite Material Reinforced with Continuous Kevlar Fibers Fabricated by Additive Manufacturing. Polymers 2022, 14, 3586. [Google Scholar] [CrossRef]
  22. Dickson, A.N.; Ross, K.-A.; Dowling, D.P. Additive Manufacturing of Woven Carbon Fibre Polymer Composites. Compos. Struct. 2018, 206, 637–643. [Google Scholar] [CrossRef]
  23. Angelidis, N.; Irving, P.E. Detection of Impact Damage in CFRP Laminates by Means of Electrical Potential Techniques. Compos. Sci. Technol. 2007, 67, 594–604. [Google Scholar] [CrossRef]
  24. Cantwell, W.J.; Morton, J. Detection of Impact Damage in CFRP Laminates. Compos. Struct. 1985, 3, 241–257. [Google Scholar] [CrossRef]
  25. Araya-Calvo, M.; López-Gómez, I.; Chamberlain-Simon, N.; León-Salazar, J.L.; Guillén-Girón, T.; Corrales-Cordero, J.S.; Sánchez-Brenes, O. Evaluation of Compressive and Flexural Properties of Continuous Fiber Fabrication Additive Manufacturing Technology. Addit. Manuf. 2018, 22, 157–164. [Google Scholar] [CrossRef]
  26. Van Der Klift, F.; Koga, Y.; Todoroki, A.; Ueda, M.; Hirano, Y.; Matsuzaki, R. 3D Printing of Continuous Carbon Fibre Reinforced Thermo-Plastic (CFRTP) Tensile Test Specimens. Open J. Compos. Mater. 2016, 06, 18–27. [Google Scholar] [CrossRef]
  27. Mohammadizadeh, M.; Imeri, A.; Fidan, I.; Elkelany, M. 3D Printed Fiber Reinforced Polymer Composites—Structural Analysis. Compos. B Eng. 2019, 175, 107112. [Google Scholar] [CrossRef]
  28. Dickson, A.N.; Barry, J.N.; McDonnell, K.A.; Dowling, D.P. Fabrication of Continuous Carbon, Glass and Kevlar Fibre Reinforced Polymer Composites Using Additive Manufacturing. Addit. Manuf. 2017, 16, 146–152. [Google Scholar] [CrossRef]
  29. Dutra, T.A.; Ferreira, R.T.L.; Resende, H.B.; Guimarães, A. Mechanical Characterization and Asymptotic Homogenization of 3D-Printed Continuous Carbon Fiber-Reinforced Thermoplastic. J. Braz. Soc. Mech. Sci. Eng. 2019, 41, 133. [Google Scholar] [CrossRef]
  30. Heitkamp, T.; Girnth, S.; Kuschmitz, S.; Klawitter, G.; Waldt, N.; Vietor, T. Continuous Fiber-Reinforced Material Extrusion with Hybrid Composites of Carbon and Aramid Fibers. Appl. Sci. 2022, 12, 8830. [Google Scholar] [CrossRef]
  31. REV 5.0—08/01/2021 Markforged Composites Mechanical Properties. Available online: http://static.markforged.com/downloads/composites-data-sheet.pdf (accessed on 31 August 2022).
  32. Parrado-Agudelo, J.Z.; Narváez-Tovar, C. Mechanical Characterization of Polylactic Acid, Polycaprolactone and Lay-Fomm 40 Parts Manufactured by Fused Deposition Modeling, as a Function of the Printing Parameters. ITECKNE 2019, 16, 25–31. [Google Scholar] [CrossRef]
  33. León, B.J.; Díaz-Rodríguez, J.G.; González-Estrada, O.A. Daño En Partes de Manufactura Aditiva Reforzadas Por Fibras Continuas. Rev. UIS Ing. 2020, 19, 161–175. [Google Scholar] [CrossRef]
  34. Thomas, G.; Antoni, M.; Gozdz, S. Three Dimensional Printer with Composite Filament Fabrication. US9156205B2, 13 October 2015. [Google Scholar]
  35. Kabir, S.M.F.; Mathur, K.; Seyam, A.M. A Critical Review on 3D Printed Continuous Fiber-Reinforced Composites: History, Mechanism, Materials and Properties. Compos. Struct. 2020, 232, 111476. [Google Scholar] [CrossRef]
  36. Gibson, L.J.; Ashby, M.F. Cellular Solids: Structure and Properties, 2nd ed.; Cambridge University Press: Cambridge, UK, 2014; ISBN 9781139878326. [Google Scholar]
  37. ASMT D-370; Standard Test Methods and Definitions for Mechanical Testing of Steel Products. ASTM: West Conshohocken, PA, USA, 2019.
  38. Wallin, K.; Nevasmaa, P.; Planman, T.; Valo, M. Evolution of the Charpy-V Test from a Quality Control Test to a Materials Evaluation Tool for Structural Integrity Assessment. Eur. Struct. Integr. Soc. 2002, 30, 57–68. [Google Scholar]
Figure 1. Printing configurations for Charpy impact tests. Adapted from [2].
Jmmp 07 00178 g001
Figure 2. Schematics of FDM printing. Adapted from [33].
Jmmp 07 00178 g002
Figure 3. Graphical description of fiber layup and matrix options in the Eiger® software [1].
Jmmp 07 00178 g003
Figure 4. Sample configuration was performed in Eiger®. (a) Location of fiber-reinforcement on the sample, (b) non-reinforced area showing the triangular filling pattern; (c) fiber reinforcement distribution; (d) sample dimensions in mm.
Jmmp 07 00178 g004
Figure 5. General view of testing (a) Temperature measurement with IR camera for samples mounted on the impact apparatus; (b) temperature measurement with IR gun for samples heated in a beaker.
Jmmp 07 00178 g005
Figure 6. Schematics and nomenclature of the impact apparatus.
Jmmp 07 00178 g006
Figure 7. Impact—energy versus average temperature for the four composite materials [2].
Jmmp 07 00178 g007
Figure 8. Impact—energy versus average temperature with standard error.
Jmmp 07 00178 g008
Figure 9. Macroscopic appearance of samples at ~50 °C.
Jmmp 07 00178 g009
Figure 10. Macroscopic appearance of samples at ~−40 °C.
Jmmp 07 00178 g010
Figure 11. Macroscopic appearance of samples at ~−18 °C.
Jmmp 07 00178 g011
Figure 12. Fractured area tested at 50°C: (a) fiberglass, (b) Kevlar, and (c) carbon-reinforced samples.
Jmmp 07 00178 g012
Table 1. Impact results for each configuration.
TypeA, Caminero [2] (kJ/m2)B, Caminero [2] (kJ/m2)C, Caminero [2] (kJ/m2)C, Heitkamp [30] (kJ/m2)
f-CRTP22.2133.2157.512.6
Vf0.03440.24940.53180.258
f-KvRTP30.1183.69125.4730.42
Vf0.0860.2950.56060.258
f-FGRTP74.16206.66271.19N/A
Vf0.0840.29150.556N/A
e-CRTP24.7359.7682.26N/A
Vf0.03380.24820.3316N/A
e-KvRTP36.4295.11184.76N/A
Vf0.07820.25330.3465N/A
e-FGRTP86.3246.19280.95N/A
Vf0.07820.29680.343N/A
Table 2. Individual mechanical properties for FDM composites’ individual components. From [32].
MaterialE1 (GPa)σ1 (MPa)J (Izod) (N/m)Relative Density
Onyx2.4403301.2
StandardASTM D638ASTM D638ASTM D256NA
C608009601.4
FG2159026001.5
Kv2761020001.2
HSHT2160031001.5
StandardASTM D3039ASTM D3039ASTM D256NA
Table 3. Description of labeling used for samples.
GroupABCDE
Temperature MediumLiq N2Solid CO2T ambWarm GlycerineHot Glycerine
Temp, °C−40~−1525~50~90
Sample IDC33333
Fg43333
Kv33333
HSHT33333
Table 4. Average temperature, impact strength, and standard deviation for the tested samples.
T, °CkJ/m2SD
FG24.9460.71.3
−15.0326.416.7
−40.0178.647.3
85.8300.422.8
51.0349.211.5
HSHT25.5362.17.2
−18.7316.626.5
−40.0268.318.4
94.3172.551.3
52.7263.13.1
Kv25.3236.216.7
−19.3110.09.9
−39.3125.324.1
91.3206.698.3
49.0286.636.2
C25.240.93.2
−18.712.21.5
−36.734.613.2
81.7100.04.8
49.396.916.3
Table 5. Constants for modeling impact energy.
Material\ConstantabcdR2
FG0.0004−0.07342.30964034.3692.19
HSHT0.0002−0.04360.2928355.6193.89
Kv−0.00060.02972.2783151.6399.79
C−0.00040.03170.932310.86997.78
Disclaimer/Publisher’s Note: The statements, opinions and data contained in all publications are solely those of the individual author(s) and contributor(s) and not of MDPI and/or the editor(s). MDPI and/or the editor(s) disclaim responsibility for any injury to people or property resulting from any ideas, methods, instructions or products referred to in the content.

