Article

Dissimilar Friction Stir Lap Welding of Aluminium to Steel: Influence of Alloy Type and Sheet Thickness on Strain Distribution and Failure Location

by
Hernán G. Svoboda
1,2,
Leonardo N. Tufaro
1,3,
Carlos Leitão
4 and
Dulce M. Rodrigues
5,*
1
Facultad de Ingeniería, Instituto de Tecnologías y Ciencias de la Ingeniería, Universidad de Buenos Aires (UBA)-CONICET, Paseo Colón 850, Ciudad Autónoma de Buenos Aires C1063ACV, Argentina
2
Consejo Nacional de Investigaciones Científicas y Técnicas, Godoy Cruz 2290 (C1425FQB), Ciudad Autónoma de Buenos Aires C1063ACV, Argentina
3
Centro de Investigación y Desarrollo en Mecánica, Instituto Nacional de Tecnología Industrial, San Martín B1650KNA, Argentina
4
Department of Mechanical Engineering, University of Coimbra, CEMMPRE, ARISE, 3030-788 Coimbra, Portugal
5
Department of Mechanical Engineering, University of Coimbra, ISISE, ARISE, 3030-788 Coimbra, Portugal
*
Author to whom correspondence should be addressed.
J. Manuf. Mater. Process. 2023, 7(6), 221; https://doi.org/10.3390/jmmp7060221
Submission received: 23 October 2023 / Revised: 28 November 2023 / Accepted: 29 November 2023 / Published: 6 December 2023

Abstract

:
Dissimilar joining through solid-state welding is an important engineering tool to address the transportation industry’s sustainable goals. The dissimilar friction stir lap welding (FSLW) of two different aluminium alloys (AA5182 and AA5052 with two different thicknesses) to steels AISI1010 and DP1000 was performed in this work, in order to analyse the effect of the mismatch in base material properties and plate thickness on the joint strength and fracture location. The mechanical behaviour and the strength of the welds were assessed using transverse tensile–shear testing and hardness measurements. Strain data acquisition through Digital Image Correlation (DIC) was used. The differences in fracture location registered for the different joints are explained based on the alloy’s plastic properties and on the mismatch in thickness between the plates. Local stress–strain curves were plotted, using the strain data acquired through DIC, to highlight the mechanisms resulting in the differences in tensile behaviour among the joints. It is concluded that despite the differences in failure location and tensile behaviour, the strength of the joints was very similar, irrespective of the base material combinations.

1. Introduction

Due to the increased requirements associated with carbon dioxide emissions and fuel economy, the use of multi-material structures has significantly increased in recent years, aiming for a light-weight design [1,2]. The construction of multi-material structures often requires the production of dissimilar welds, between materials usually not able to be joined together using conventional welding processes [2]. Friction stir lap welding (FSLW) allows the joining of dissimilar materials, due to its solid-state nature, which helps minimise the extent of intermetallic compound (IMC) formation, with important deleterious effects on the joint’s strength [3,4,5,6,7,8,9]. Regarding dissimilar material combinations, the Aluminium to Steel (Al-Fe) lap joining combination is considered of extreme importance, owing to its potential to be applied in the transportation industry [3,10].
Owing to the action of the tool in contact with the materials to be joined, a thermo-mechanical cycle is established at the Al-Fe interaction zone, producing the microstructural evolution of base materials. Depending on the magnitude of temperature, strain, and strain rate, different zones will result: Stirred Zone or Weld Nugget (WN), Thermo-Mechanical-Affected Zone (TMAZ), and Heat-Affected Zone (HAZ) [4].
To join steels using FSW, the most common tool materials are WC and PCBN [11], although Tool Steel may be also used in the FSLW of Al-Fe, when the steel sheet is placed at the bottom of the lap joint [6,12]. In this dissimilar combination, the level of interaction between the pin and the steel sheet will affect the tool damage, as well as the mixing between both base materials. Chen et al. [12] reported that the optimal welding conditions correspond to a null pin penetration into the steel sheet, but with the pin tip operating close enough to the base material interface, to enable the formation of a continued intermetallic layer. Several authors affirm that the presence of the intermetallic layer is the necessary condition for continued metallurgical bonding [4]. However, the pin plunge into the steel sheet may lead to the formation of a steel hook within the aluminium alloy [13]. Nevertheless, other authors have shown that the optimum mechanical properties are reached when a minimum interaction exists between the tool pin and the steel plate [4,10].
Two geometrical effects can be pointed out related to the hook formation. One is related to the reduction in the effective thickness of the aluminium alloy sheet, which can negatively affect the mechanical properties of the welded joint [8,13]. The other one is related to the mechanical locking produced by the steel flow into the aluminium sheet, which was found by some authors to be beneficial in terms of joint strength [14,15]. In this sense, in order to optimise the Al-Fe lap joint strength, it is necessary to define an optimum tool plunge depth that minimises the pin penetration into the steel plate, to avoid important tool damage and severe hook defects, but that also simultaneously promotes the bonding between the two materials [16]. Naturally, the deleterious effect of the hook on the joint strength depends on the upper sheet thickness. Also, due to the indentation of the tool shoulder into the upper sheet, a thickness reduction takes place, which will affect the fracture load of the joint at the weld nugget (WN) zone [3]. Thus, the resultant upper sheet thickness, together with the Al-Fe interface integrity and the local strength of the different weld zones, defines the fracture load and fracture location of the Al-Fe joints. According to the literature, the lap joints may fail through the Al-Fe interface, in a shear mode [7,12,14,15,17,18,19], or through the thickness of one of the base materials, in a tensile mode [14,15,17,20]. The tensile mode may also occur, through failure of the aluminium sheet, at the WN [3,13,20].
Despite different modes of failure reported in the literature, no information is available on the influence of the joint characteristics on the failure location. The effect of the welding parameters is only reported on the fracture load and mode. For example, it is well known that the traverse speed and the rotational speed of the tool affect the heat input during welding, resulting in the IMC layer thickness and morphology, which controls the interface integrity and its fracture load [14,15,17,19]. Also, the pin plunge into the steel sheet, the pin diameter, and the tool tilt angle were also reported as having important effects on the fracture load, due to its influence on the IMC layer thickness and on defect generation [17,18]. To complement the knowledge developed by other authors on the influence of process parameters and welding procedures on the Al-Fe friction stir lap joint properties (microstructure, strength, and defect formation), the current work addresses the influence of the mismatch in sheet thickness and mechanical properties, between the base materials, on the joint strength and fracture location.

2. Materials and Methods

In this work, dissimilar Al-Fe friction stir lap welds were produced, using different combinations of the base materials. As shown in Table 1, the base materials were two non-heat-treatable aluminium alloys, AA 5052-H32 (1 and 2 mm thick sheet) and AA 5182-H11 (1.2 mm thick sheet) alloys, and two steels, AISI 1010 (0.8 mm thick) and DP1000 (1.2 mm thick) steels. In the table, the average mechanical properties are also shown, which were determined in this work, for all the base materials. Tensile properties were determined from two tensile samples tested according to ASTM-E8 standard. Vickers microhardness was measured using a load of 0.3 kg. The chemical compositions of the base materials are shown in Table 2.
The base materials were lap-welded, in dissimilar combinations, as described in Table 3. The aluminium alloy sheets, of 120 mm × 60 mm, were placed in the upper position of the lap joint at the advancing side (AS) of the tool and the steel sheets, with the same dimensions, were placed in the lower position at the retreating side (RS). The lap length was 30 mm, as shown in Figure 1. The samples were welded in the rolling direction of the sheet. The process parameters used for FSLW are also shown in Table 3, as well as the ID used in the text for the different joints. Two tools made of H13 tool steel, identified as H1 and H2, were used for the welding of the 1 mm and 2 mm aluminium alloy sheet thicknesses, respectively. The tools presented a concave shoulder 10 and 12 mm in diameter, and a tapered pin, with major and minor diameters of 4.1 and 5.0 mm, respectively. The pin length was adjusted to obtain a pin penetration depth into the steel plate of 0.1 mm. The tilt angle was 1.5° for all welds. These set of process parameters and tool dimensions were defined based on previous works, conducted for different combinations of base materials [3,5,10,13].
Cross-sections of the lap welds were prepared for metallographic observation following the conventional procedures. Light microscopy was performed to observe the material interaction at the aluminium/steel interface. The hook height was estimated by measuring the distance from the hook tip to the interface at the AS, on the cross-sectional images, as it is schematised in Figure 1. Vickers microhardness (HV0.3) profiles were carried out along horizontal lines, at the mid-thickness of the upper (aluminium) and lower (steel) sheets of the joints, as shown by the dashed lines in Figure 1, to evaluate the mismatch in mechanical properties across the joints. Three specimens were also extracted, from each joint, to perform lap tensile–shear tests, using a 5 kN universal testing machine (Shimadzu Autograph AG-X) in quasi-static loading conditions (1 mm/min). The samples were 70 mm in length and 10 mm in width. Local strain fields were acquired through Digital Image Correlation (DIC), using the GOM Aramis 5 M system. In order to enable strain data acquisition through DIC, before testing, the specimens were prepared by applying a random black speckle pattern over the previously matte-white-painted surface. All the procedures used in sample preparation and in the post-processing of results are explained in previous works of Leitão et al. [21,22]. The DIC hardware and the parameters used for the analysis are described in Table 4.

3. Results and Discussion

Figure 2 shows the true stress–strain curves, up to the maximum load, for all the base materials used in the investigation. For enhancing the similarities and dissimilarities in strength and plastic behaviour between the base materials, Figure 2a shows the curves relative to the AISI 1010 steel and the aluminium alloys (AA5052-H32-1, AA5052-H32-2, and AA5182-H11-1.2), and Figure 2b shows the curve relative to the DP 1000 base material.
After analysing Figure 2a, it is possible to conclude that the AISI 1010 steel and the AA5052 aluminium alloy have very similar yield strengths (YSs), of around 180 MPa, and similar plastic behaviour for low plastic deformation values. The most important difference between these base materials is that the aluminium alloy attains the ultimate tensile strength (UTS) for much lower plastic deformation and stress values than the steel (UTS5052 = 260 MPa and UTS1010 = 350 MPa). The figure also shows that the AA 5182 alloy has a lower yield stress, of 150 MPa, than the AA 5052 and AISI 1010 base materials, but displays strong work hardening during plastic deformation, attaining a UTS similar to that of the AISI 1010 steel, for very high values of plastic deformation. Finally, Figure 2b shows that the DP 1000 base material has much higher YS and UTS values than any of the other base materials. Actually, the YS of the DP1000 steel is much higher than the UTS of any of the other base materials. This mismatch in mechanical properties between the base materials, as well as the mismatch in thickness, can be used to determine the strength and failure location of the joints, as is discussed.
Figure 3 compares the load per unit of width (P/W) versus displacement curves obtained for the different types of joints when testing them in tensile–shear loading. Table 5 shows the average maximum load per width (Pmax/W) values obtained for the different welded joints, as well as the failure location and the hook height. It can be seen that the maximum difference in Pmax/W between the different joints was 14%, which is found in the same range of the experimental error between the curves in Figure 3c, for example. However, despite the very close values of strength, the different samples experienced different types of failure. The variations in deformation and in failure location between the joints are discussed in this work.
Figure 4a shows a cross-sectional macrography of joint A, which enables the observation of small hooking features, at both the RS and AS of the weld, resulting from the upward flow of the lower plate material (AISI 1010), due to the tool action. The hook height is provided in Table 5. Since the AISI 1010 and the AA 5052 alloys had similar strength and plastic behaviour for small plastic deformation values (Figure 2), the small hooking conducted to a certain stress concentration at its tip. This is due to the fact that the hook introduces a local thickness reduction on the aluminium sheet, which is also enhanced by the indentation of the tool shoulder in the top surface. However, it is also important to note that the stress concentration did not take place since the beginning of the sample loading and that the failure only took place after the AISI 1010 base material, which had the lower thickness of 0.8 mm, was plastically deformed. This is demonstrated by Figure 5, in which the Mises strain distribution maps, for four different loading stages of sample A_T1, are shown, together with an image of the sample after rupture. The strain distribution maps show that the stress concentration at the hook tip only took place after the AISI 1010 steel started deformation. This behaviour demonstrates that the hooking was not very severe. Additionally, the dissimilar joint is prone to be used in structural applications for which the maximum load is set to be lower than the yield strength of the parts to be joined. For these reasons, the failure of all the samples took place at the WN zone of the AA5052 alloy, starting at the hook tip, for relatively small displacement values (Figure 5e).
Figure 4b and Figure 6 show the results obtained for joint B, for which the AA5052 upper sheet had a much higher thickness (2 mm) than the AISI 1010 plate (0.8 mm). Due to the drastic increase in the Al alloy thickness relative to that of the steel, the stress level at the tip of the hook (Figure 4b) was low, leading to the failure of the sample at the steel base metal, for the highest displacement values of all the samples tested in this work (Figure 6e). For these samples, the tensile load was fully absorbed by the AISI 1010 steel, which, in addition of having a similar yield strength to the AA5052 alloy, was much less thick. In this sense, the AISI1010 plate experienced intense plastic deformation since the beginning of the loading, as is shown by the Mises strain distribution maps in Figure 6a–d. The strain distribution maps also show that the sample’s failure occurred before any deformation took place in the lap joint region.
Joint C differed from the previous ones since the AA 5052 alloy was replaced by the AA 5182 alloy, which had the lower YS of all the base materials tested in this work. Despite having a lower YS than the AISI 1010 steel, the AA5182 sheets were 1.2 mm thick, which balanced the strength between the two base materials and resulted in different results in terms of the joint’s behaviour, compared with joints A and B. The macrography of a cross-section of joint C (Figure 4c) shows the small hooking defects at both the AS and RS of the lap weld. For this joint, different load–displacement curves were registered (Figure 3c) and two different failure locations were observed.
Failure in the AISI 1010 base material was produced for sample C_T2 and an interfacial failure (IF), through separation of the sheets across the joint, was obtained for samples C_T1 and C_T3. They are shown in Figure 7 and Figure 8, where the Mises strain maps for samples T1 and T2, respectively, are also displayed. None of the samples were ruptured before important plastic deformation took place in both base materials. However, it can also be seen that the thinner AISI 1010 base material was that which experienced higher plastic deformation before sample failure.
To better illustrate the previous analysis, concerning the deformation of type C joints, local stress–strain curves are compared in Figure 9a, for both base materials, obtained from the tensile–shear testing results following the procedures explained in Leitão et al. [21], with the stress–strain curves of the AISI 1010 and AA5182 alloys, already represented in Figure 2. The local stress–strain curves, for each base material, were plotted by averaging the tensile strain inside the areas indicated in the strain distribution map in Figure 9b by small rectangles. Analysing the figure, it is possible to conclude that the AISI 1010 plate was loaded close to the maximum load (BM 1010 curve), before joint rupture, even when the sample failed through the separation of the sheets. This indicates that the maximum strength of the joint was close to the maximum strength of this alloy. However, even the AA5182 plate experienced severe plastic deformation before the sample rupture (BM 5182 curve). No plastic deformation was registered in the weld region, due to two factors. The extra thickness relative to the base material plates in the lap joint region and the increase in local strength at this zone were promoted by the thermo-mechanical phenomena induced by the tool, mainly at the steel side of the lap joint. This is illustrated in Figure 9c, which shows that there was an increase in hardness in the weld region, relative to the base metal values (represented by the continuous and dashed lines).
For comparative proposes, Figure 10 and Figure 11 show the results of local stress–strain curves and microhardness profiles for joints A and B, respectively. It can be seen that in both cases, the joints failed after severe plastic deformation of the AISI1010 base material, but with a very low one for the thicker AA5052 sheets, which have similar strength to the AISI 1010 steel. As it was observed for joint C, the hardness profiles of joints A and B also show an intense increase in the hardness values of the steel sheet at the weld region, but no significant variations in the aluminium hardness. This observation is associated with the strain hardening and/or grain refinement effect on the steel side, which was welded in the annealed condition. In the case of the aluminium alloy, it was welded in a strain-hardened condition, which usually does not produce significant variations in WN hardness [4]. The absence of any hardness increase on the aluminium side contributed to the stress concentration at the tip of the hook, which resulted in the failure of joint type A, in the aluminium WN. This did not occur for joint B, for which the aluminium plate was much thicker than the steel plate, which prevented stress concentration at the tip of the hook, as already mentioned.
To test the effective strength of the bonding between the steel and the aluminium sheets (interfacial), joint D was produced between a 2 mm thick sheet of AA5052 alloy and a 1.2 mm thick sheet of DP1000 steel. Both plates were thicker than the other base materials and, as already discussed, the DP1000 steel was highly overmatched in terms of strength, relative to all the base materials. All the samples of joint D fractured with very small displacement values (Figure 3), but with load-per-width values close to those reached by the other samples (Table 3). In Figure 12a,b, the Mises strain distribution maps for sample T1 are shown. It can be seen that the sample failed (Figure 12c) before any plastic deformation took place in both base materials. Figure 12d, in which hardness profiles for this joint are provided, shows that the DP steel experienced a local decrease in hardness in the weld, relative to the base material values, mainly associated with the high temperature reached, which produced the tempering of the martensite. However, despite this hardness decrease, the strength of the steel side of the weld remained much higher than those of the aluminium alloy base material and weld, which were not plastically deformed during the tensile–shear test. Consequently, it can be assumed that the maximum load of the joint D samples equals the shear strength of the bond between the base materials. Since the average maximum load per width values was very similar for all joints tested (Table 3), it could be concluded that the joint strength was determined by the interfacial strength, which is defined by the tool dimensions (the size of the bonded length at the interface) and could be mostly independent of the type of base material combinations and the interaction at the interface. This could be supported by Figure 4, where the bond interface is compared for all the joints. The images clearly show that while, in joints A and C, some stirring took place across at the interface, in joint D, the stirring level was low, and the joint resulted from the very intense pressure exerted by the tool over the base materials, heated at very high temperatures. This phenomenon was already analysed by Mira-Aguiar et al. [23] who proposed a joining mechanism named Tool-Assisted Friction Welding. In the present investigation, it is shown that the bond strength may be similar for joints performed with different interaction levels across the bond interface. The main factors governing the failure location, among the different joints, were the mismatch in mechanical properties between the base materials and the mismatch in thickness between the sheets.

4. Conclusions

In this work, the strength and failure location of Al-Fe friction stir lap joints obtained by combining different sheet thicknesses and alloys with different strength levels were determined. All the joints were produced by placing the aluminium alloy as the upper plate of the lap joint, to avoid tool damage. The aluminium alloys had a thicker base material in all Al-Fe lap joint combinations. The welding parameters were the same for all conditions analysed. The following conclusions were reached:
  • Regardless of which combinations of base materials were used, similar values of maximum load per width (Pmax/W) were registered for the different joints analysed.
  • Despite the similarities in strength of the FSLW Al-Fe joints, the differences in base material strength and thickness modified the failure location, producing failures at the weld nugget, steel base metal, or interface.
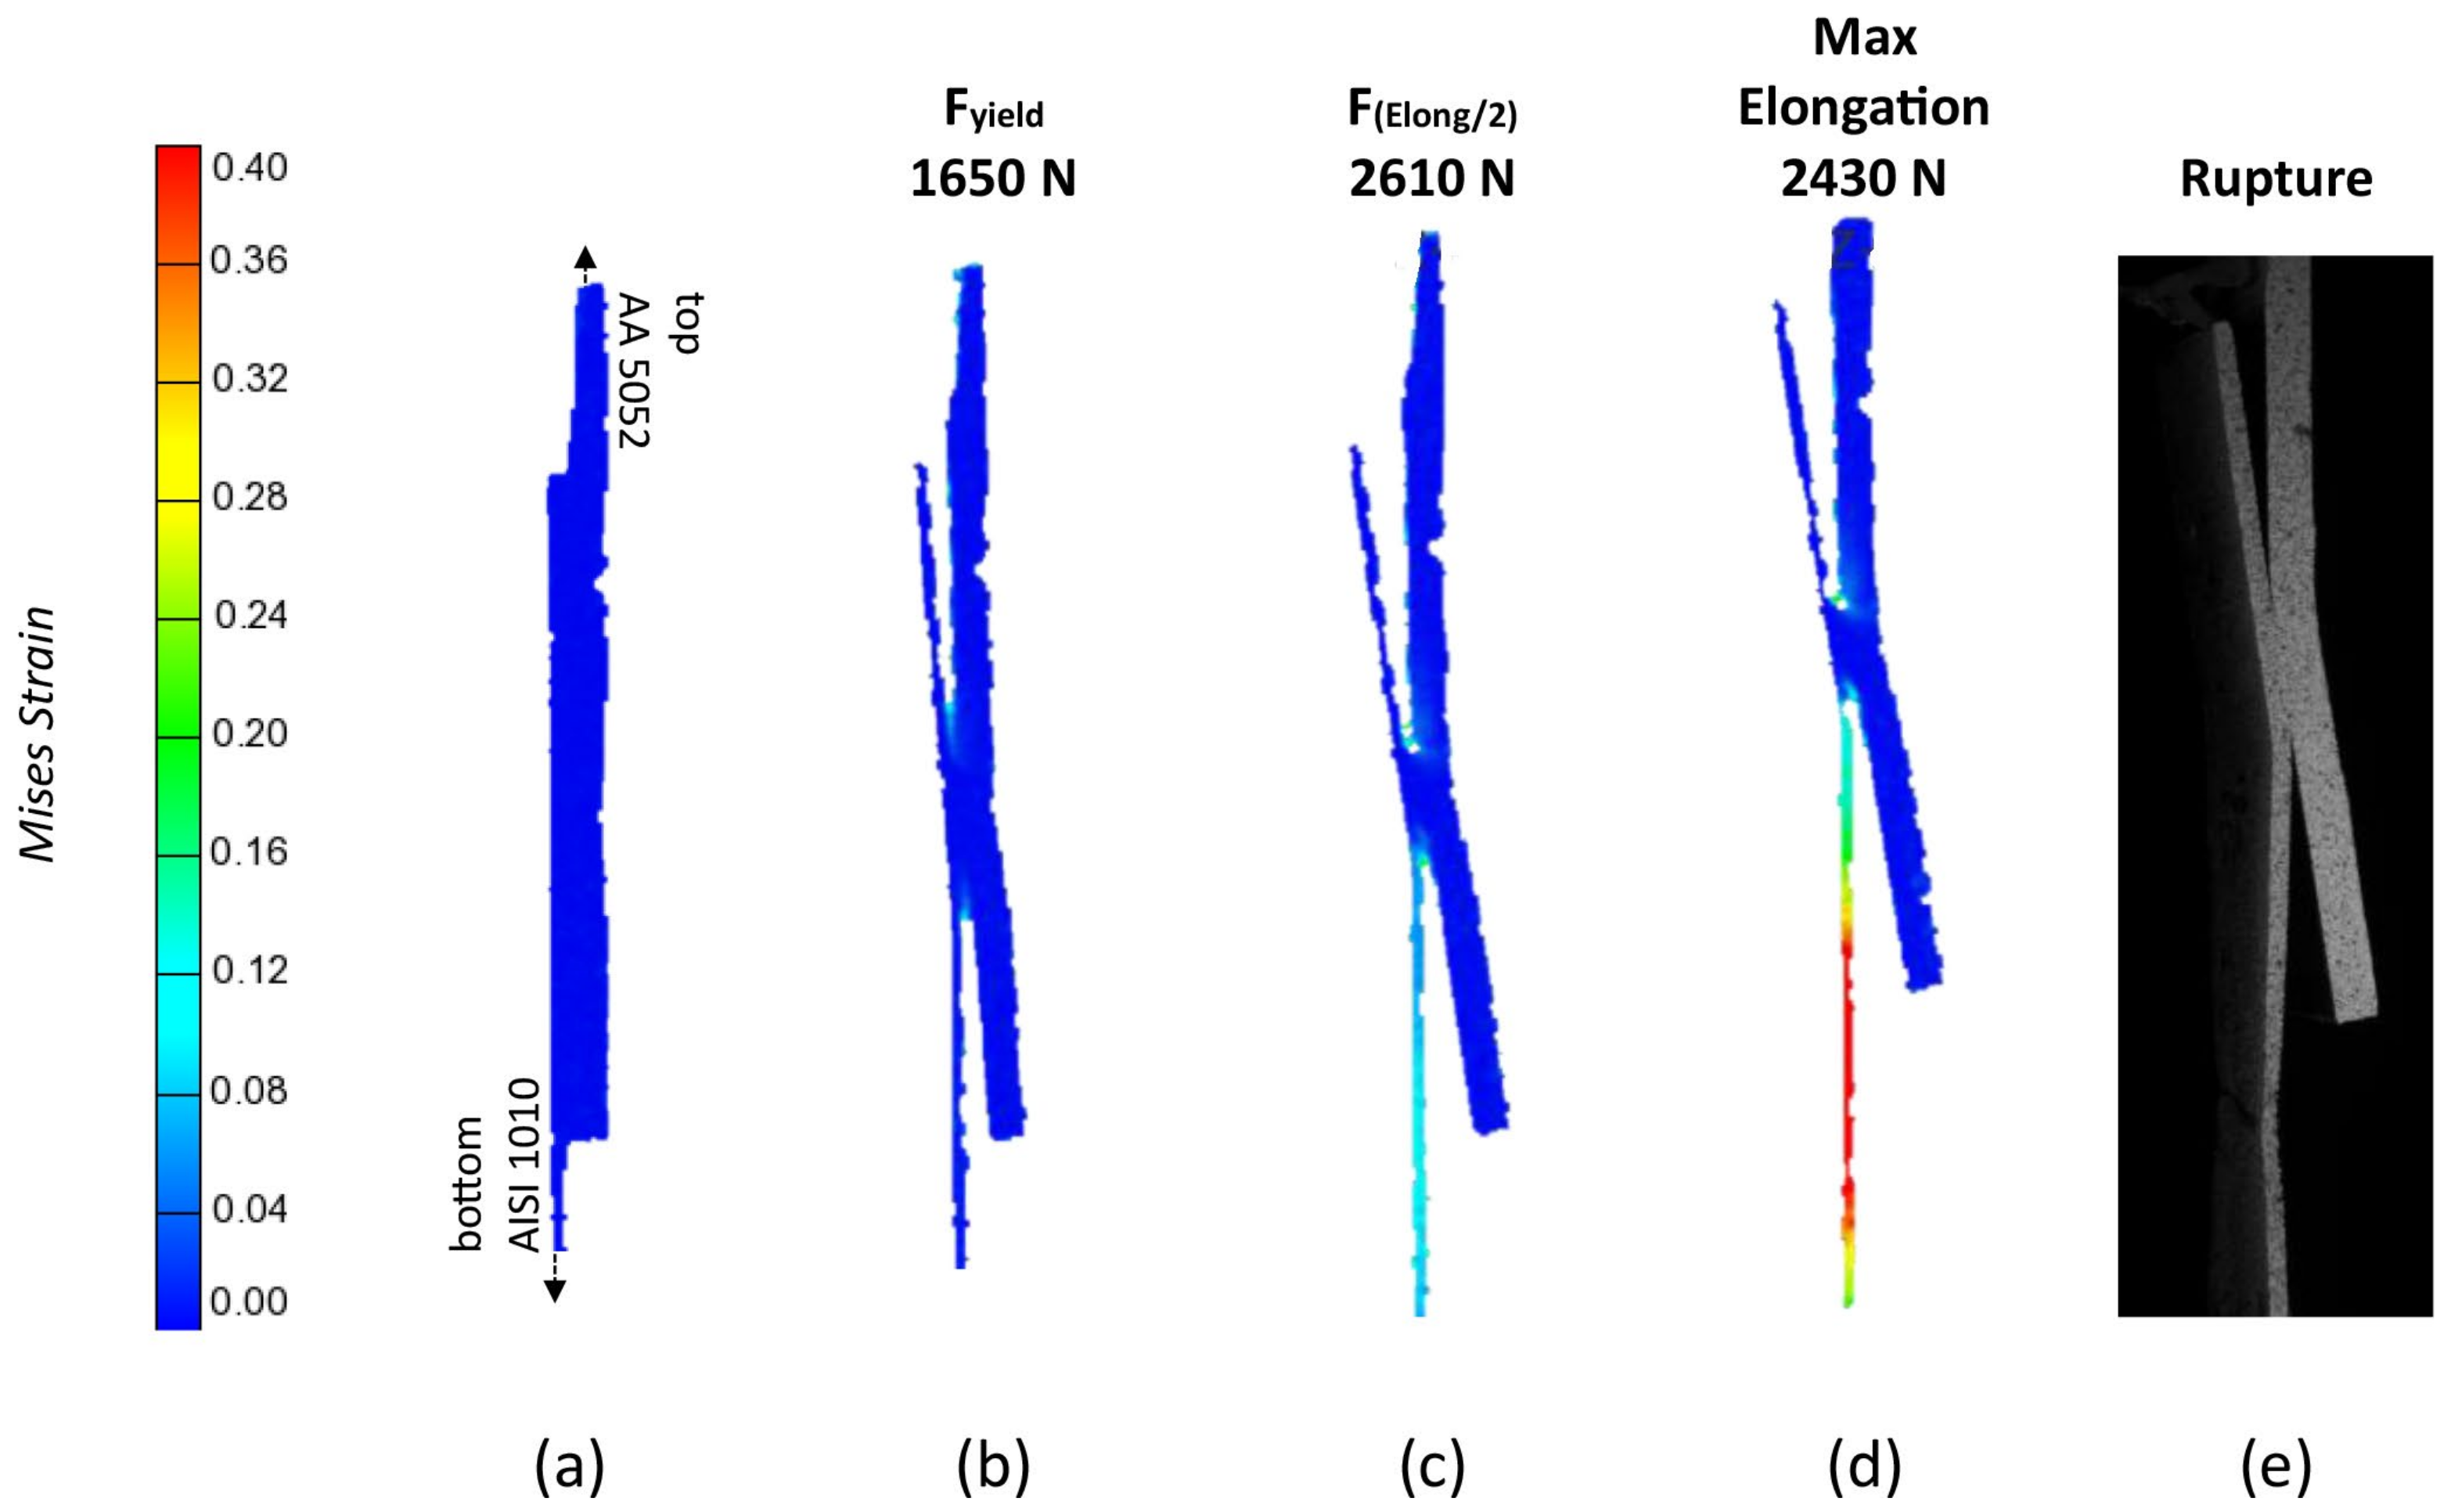
  • For Al-Fe joints made of base materials with a similar yield strength, and the small mismatch in thickness, the failure takes place in the weld nugget, where the stress concentration may take place at the hook tip. Consequently, in this case, the strength of the joint is determined by the hook size, the thickness reduction, and the local microhardness evolution.
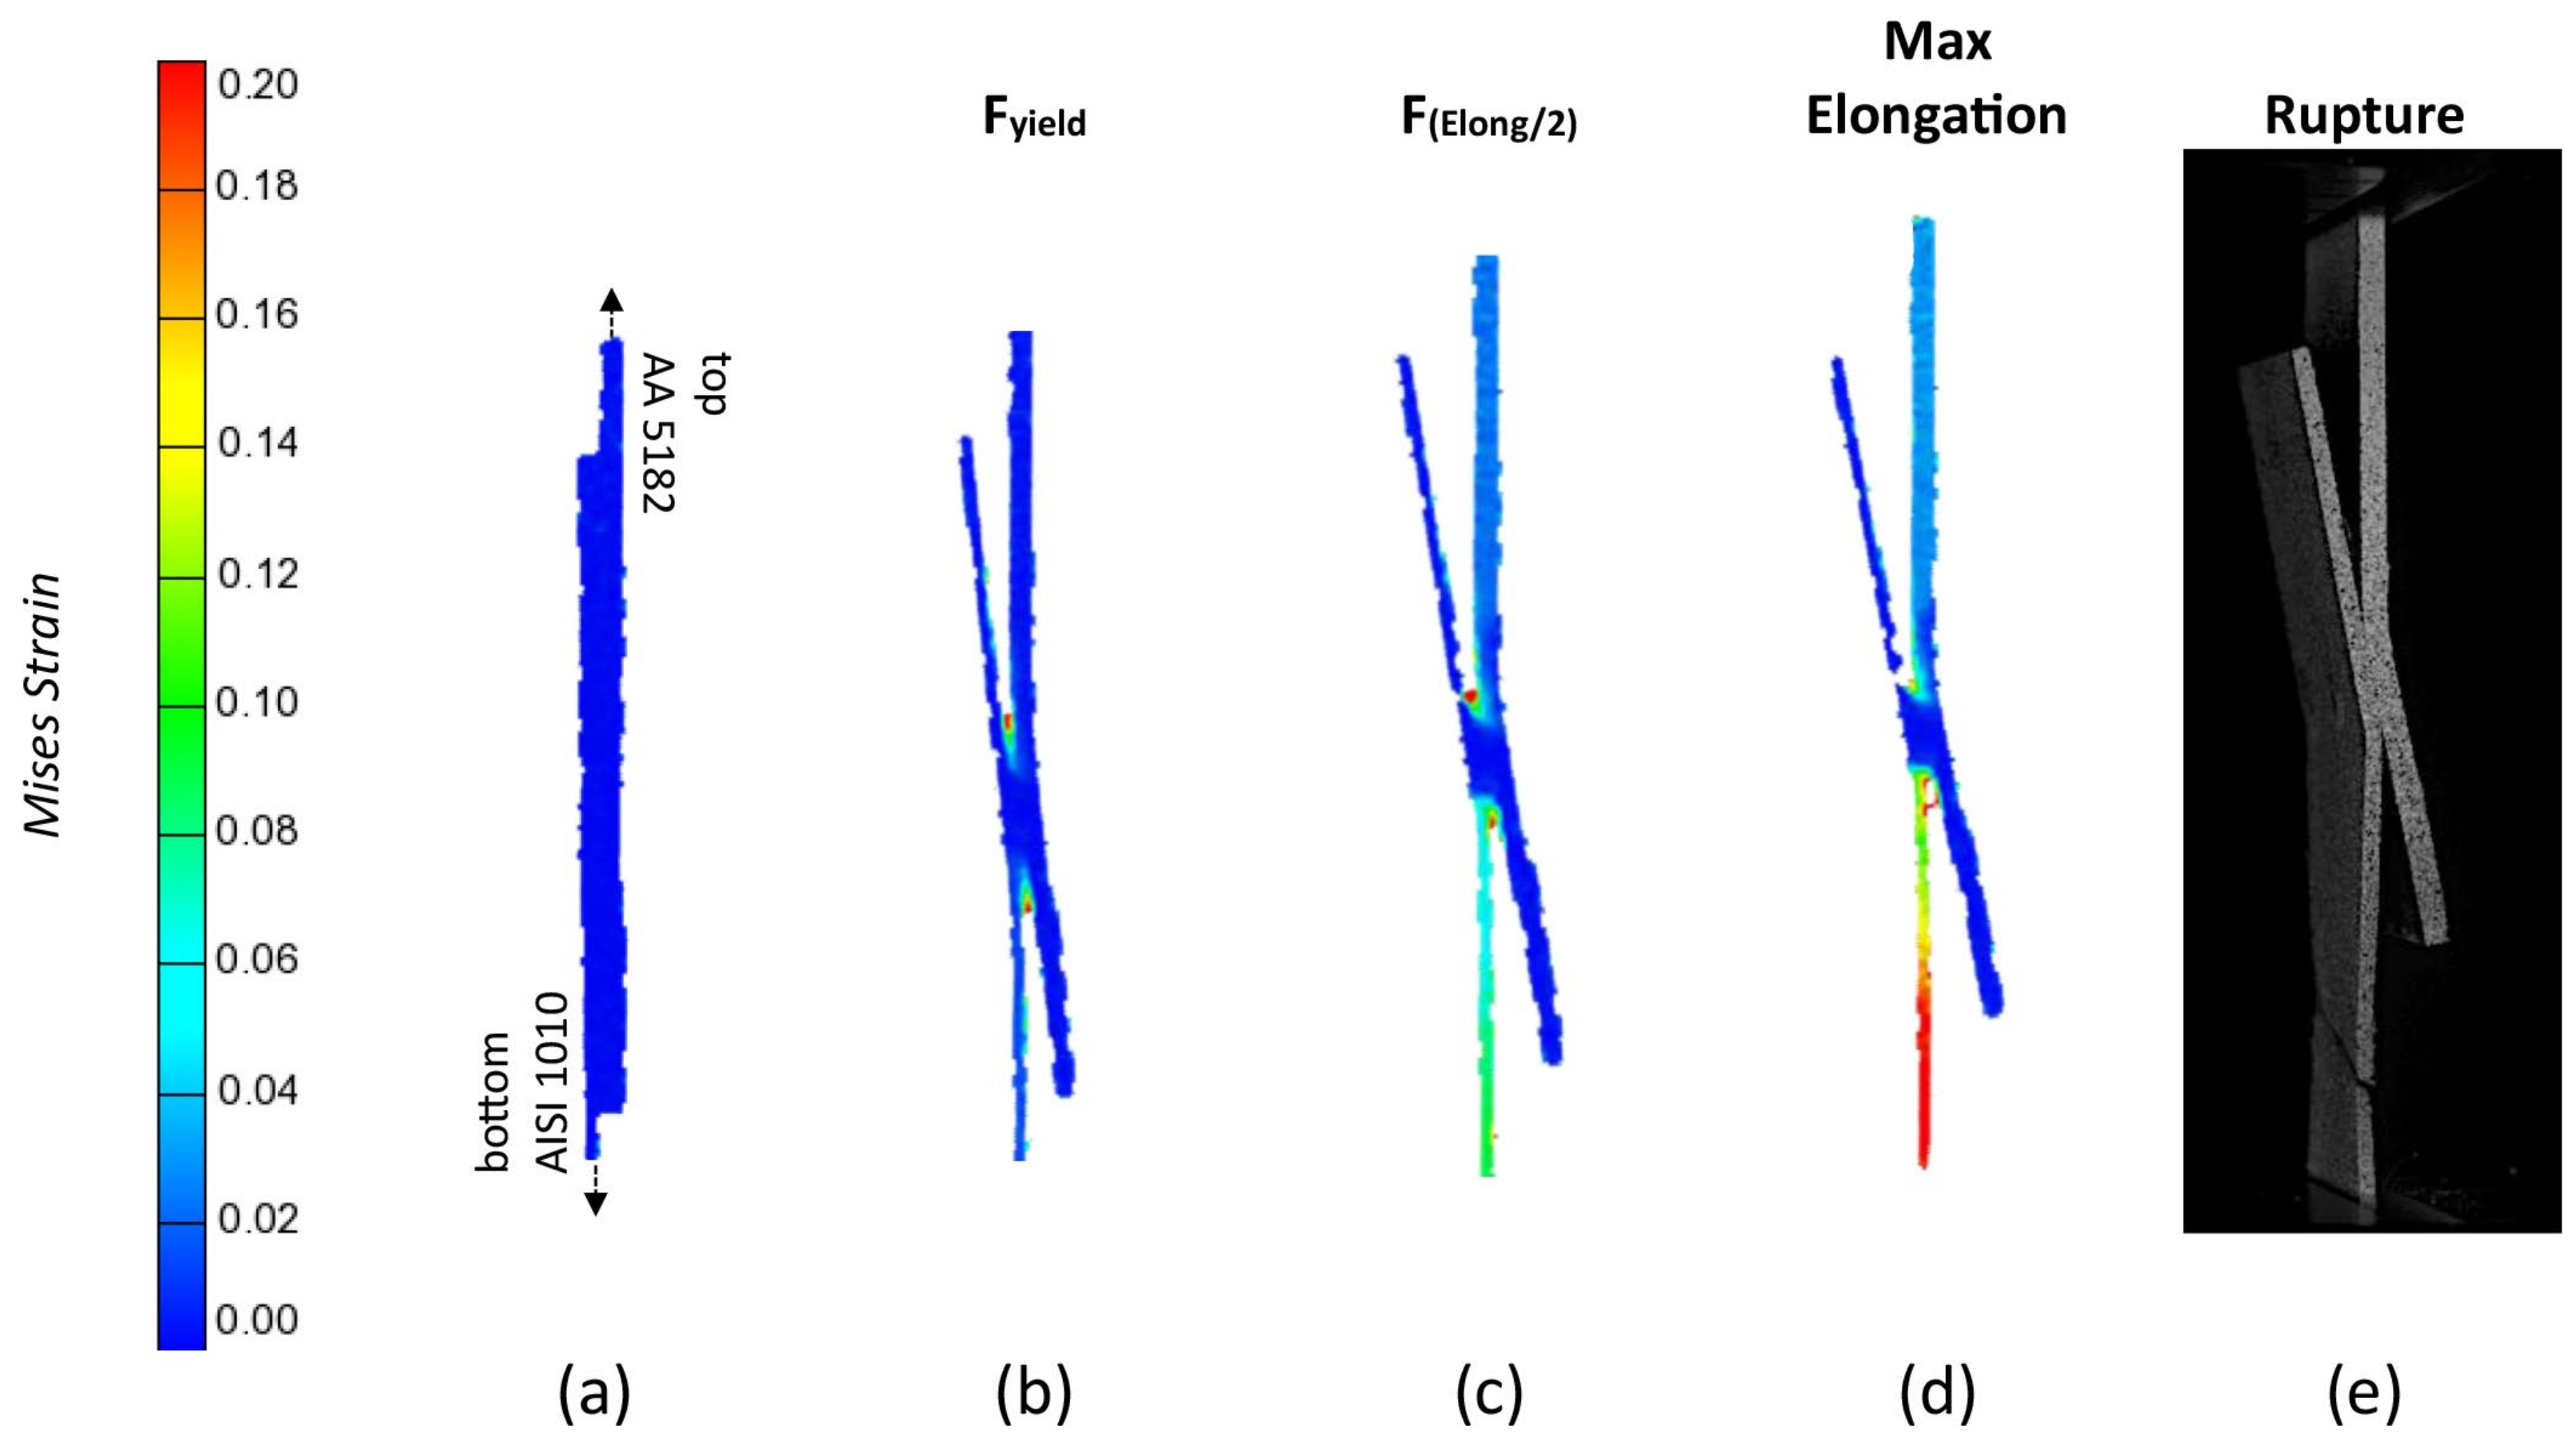
  • For Al-Fe joints made of base materials with similar yield strength, but with a strong mismatch in thickness, failure takes place through necking of the lower-thickness base material, after severe plastic deformation. Increasing the thickness of the upper plate avoids stress concentration at the tip of the hook.
  • For joints with an important mismatch in yield strength and thickness, different failure modes may take place, according to the specific material combination. When the higher thickness of the aluminium alloy results in an even match in strength between the base materials, failure may take place via debonding through the Al-Fe interface or via necking of the thinner plate, after severe plastic deformation of both base materials. When the mismatch in strength and thickness between the base materials is very high, failure takes place via debonding through the Al-Fe interface, for very low displacement values.

Author Contributions

Conceptualization, H.G.S.; Methodology, H.G.S., L.N.T., C.L. and D.M.R.; Formal Analysis, H.G.S., L.N.T., C.L. and D.M.R.; Investigation, H.G.S., L.N.T., C.L. and D.M.R.; Resources, H.G.S., L.N.T. and C.L.; Data Curation, H.G.S.; Writing—Original Draft Preparation, D.M.R.; Writing—Review and Editing, H.G.S., L.N.T., C.L. and D.M.R. All authors have read and agreed to the published version of the manuscript.

Funding

This work was partly financed by FCT/MCTES through national funds (PIDDAC) under the R&D Units ISISE (UIDB/04029/2020) and CEMMPRE (UIDB/00285/2020), and under the Associate Laboratory ARISE under reference LA/P/0112/2020. It was also supported by the University of Buenos Aires (UBAINT 2022 program) and ANPCYT (PICT 2017 N°3782).

Data Availability Statement

Data are contained within the article.

Conflicts of Interest

The authors declare no conflict of interest.

References

  1. Gullino, A.; Matteis, P.; D’Aiuto, F. Review of Aluminum-To-Steel Welding Technologies for Car-Body Applications. Metals 2019, 9, 315. [Google Scholar] [CrossRef]
  2. Borgert, T.; Neuser, M.; Hoyer, K.-P.; Homberg, W.; Schaper, M. Thermomechanical Joining of Hypoeutectic Aluminium Cast Plates. J. Manuf. Mater. Process. 2023, 7, 169. [Google Scholar] [CrossRef]
  3. Meng, X.; Huang, Y.; Cao, J.; Shen, J.; dos Santos, J.F. Recent progress on control strategies for inherent issues in friction stir welding. Prog. Mater. Sci. 2021, 115, 100706. [Google Scholar] [CrossRef]
  4. Simar, A.; Avettand-Fènoël, M.N. State of the art about dissimilar metal friction stir welding. Sci. Technol. Weld. Join. 2017, 22, 389. [Google Scholar] [CrossRef]
  5. Hussein, S.; Tahir, A.; Hadzley, A. Characteristics of aluminum-to-steel joint made by friction stir welding: A review. Mater. Today Commun. 2015, 5, 32–49. [Google Scholar] [CrossRef]
  6. Kumar, N.; Yuan, W.; Mishra, R.S. Friction Stir Welding of Dissimilar Alloys and Materials, 1st ed.; Butterworth-Heinemann: Oxford, UK, 2015. [Google Scholar]
  7. Kar, A.; Vicharapu, B.; Morisada, Y.; Fujii, H. Elucidation of interfacial microstructure and properties in friction stir lap welding of aluminium alloy and mild steel. Mater. Charact. 2020, 168, 110572. [Google Scholar] [CrossRef]
  8. Sorger, G.; Wang, H.; Vilaça, P.; Santos, T.G. FSW of aluminum AA5754 to steel DX54 with innovative overlap joint. Weld World 2017, 61, 257–268. [Google Scholar] [CrossRef]
  9. Beygi, R.; Carbas, R.J.C.; Barbosa, A.Q.; Marques, E.A.S.; da Silva, L.F.M. A comprehensive analysis of a pseudo-brittle fracture at the interface of intermetallic of η and steel in aluminum/steel joints made by FSW: Microstructure and fracture behavior. Mater. Sci. Eng. A 2021, 824, 141812. [Google Scholar] [CrossRef]
  10. Wang, X.; Lados, D. Optimization of aluminum-to-steel friction stir lap welding for the fabrication of high-integrity structural components. J. Adv. Join. Process. 2022, 5, 100114. [Google Scholar] [CrossRef]
  11. Fuller, C.B. Friction Stir Tooling: Tool Materials and Designs. In Friction Stir Welding and Processing, 1st ed.; Mishra, R.S., Mahoney, M.W., Eds.; ASM International: Materials Park, OH, USA, 2007. [Google Scholar]
  12. Chen, Z.W.; Yazdanian, S.; Littlefair, G. Effects of tool positioning on joint interface microstructure and fracture strength of friction stir lap Al-to-steel welds. J. Mater. Sci. 2013, 48, 2624–2634. [Google Scholar] [CrossRef]
  13. Tufaro, L.N.; Svoboda, H.G. Effect of Welding Parameters on Mechanical Properties of Dissimilar Friction Stir Lap Welds of AA5052 and AISI 1010. In Selected Contributions of AJP 2021, Proceedings of the 2nd International Conference on Advanced Joining Processes (AJP 2021), Sintra, Portugal, 21–22 October 2021; da Silva, L.F.M., Martins, P.A.F., Reisgen, U., Eds.; Springer International Publishing: Cham, Switzerland, 2022. [Google Scholar] [CrossRef]
  14. Movahedi, M.; Kokabi, A.H.; Reihani, S.S.; Najafi, H. Mechanical and microstructural characterization of Al-5083/St-12 lap joints made by friction stir welding. J. Proc. Eng. 2011, 10, 3297–3303. [Google Scholar] [CrossRef]
  15. Movahedi, M.; Kokabi, A.H.; Reihani, S.S.; Najafi, H. Effect of tool travel and rotation speeds on weld zone defects and joint strength of aluminium steel lap joints made by friction stir welding. Sci. Technol. Weld. Join. 2012, 17, 162–167. [Google Scholar] [CrossRef]
  16. Leitao, C.; Arruti, E.; Aldanondo, E.; Rodrigues, D.M. Aluminium-steel lap joining by multipass friction stir welding. Mater. Des. 2016, 106, 153–160. [Google Scholar] [CrossRef]
  17. Kimapong, K.; Watanabe, T. Lap joint of A5083 aluminum alloy and SS400 steel by friction stir welding. Mater. Trans. JIM 2005, 46, 835–841. [Google Scholar] [CrossRef]
  18. Kimapong, K.; Watanabe, T. Effect of welding process parameters on mechanical property of FSW lap joint between aluminum alloy and steel. Mater. Trans. JIM 2005, 46, 2211–2217. [Google Scholar] [CrossRef]
  19. Wan, L.; Huang, Y. Microstructure and mechanical properties of Al/Steel friction stir lap weld. Metals 2017, 7, 542. [Google Scholar] [CrossRef]
  20. Coelho, R.S.; Kostka, A.; Sheikhi, S.; Dos Santos, J.; Pyzalla, A.R. Microstructure and mechanical properties of anAA6181-T4 aluminium alloy to HC340LA high strength steel friction stir overlap weld. Adv. Eng. Mater. 2008, 10, 961–972. [Google Scholar] [CrossRef]
  21. Leitao, C.; Galvao, I.; Leal, R.M.; Rodrigues, D.M. Determination of local constitutive properties of aluminium friction stir welds using digital image correlation. Mater. Des. 2012, 33, 69–74. [Google Scholar] [CrossRef]
  22. Leitao, C.; Costa, M.I.; Khanijomdi, K.; Rodrigues, D.M. Assessing strength and local plastic behaviour of welds by shear testing. Mater. Des. 2013, 51, 968–974. [Google Scholar] [CrossRef]
  23. Mira-Aguiar, T.; Verdera, D.; Leitão, C.; Rodrigues, D.M. Tool assisted friction welding: A FSW related technique for the linear lap welding of very thin steel plates. J. Mater. Process. Technol. 2016, 238, 73–80. [Google Scholar] [CrossRef]
Figure 1. Scheme of joint configuration, hook height, and Vickers microhardness profile measurement locations.
Jmmp 07 00221 g001
Figure 2. True stress–strain curves corresponding to the tensile behaviour of the different base materials.
Jmmp 07 00221 g002
Figure 3. Load per unit length (P/W) vs. displacement curves for the different joints: (a) A; (b) B; (c) C; and (d) D. T1, T2, and T3 identify the samples tested for each joint.
Jmmp 07 00221 g003
Figure 4. Cross-sections of the different joints: (a) joint A, (b) joint B, (c) joint C, (d) joint D.
Jmmp 07 00221 g004
Figure 5. Mises strain distribution maps (ad) for four different loading stages of joint A_T1 and image of the sample after failure (e).
Jmmp 07 00221 g005
Figure 6. Mises strain distribution (ad) maps for four different loading stages of joint B_T1 and image of the sample after failure (e).
Jmmp 07 00221 g006
Figure 7. Mises strain distribution maps (ad) for four different loading stages of joint C-sample T1 and image of the sample after failure (e).
Jmmp 07 00221 g007
Figure 8. Mises strain distribution maps (ad) for four different loading stages of joint C-sample T2 and image of the sample after failure (e).
Jmmp 07 00221 g008
Figure 9. (a) Local stress–strain curves (BM 1010 and BM 5182) corresponding to the regions of the joint C_T1 sample identified in the strain map (b). Hardness profiles for the top and bottom sheets of the weld (c).
Jmmp 07 00221 g009
Figure 10. (a) Local stress–strain curves (BM1010 and BM 5052) corresponding to the regions of the joint A_T1 sample identified in the strain map (b). Hardness profiles for the top and bottom sheets of the weld (c).
Jmmp 07 00221 g010
Figure 11. (a) Local stress–strain curves (BM1010 and BM 5052) corresponding to the regions of the joint B_T1 sample identified in the strain map (b). Hardness profiles for the top and bottom sheets of the weld (c).
Jmmp 07 00221 g011
Figure 12. Mises strain distribution maps for two different loading (a,b) stages of joint D_T1 and image of the sample after failure (c). Hardness profiles for the top and bottom sheets of joint D_T1 (d).
Jmmp 07 00221 g012
Table 1. Mechanical properties of the base materials (YS—yield strength, UTS—ultimate tensile strength, ef—deformation at fracture).
Base MaterialsTensile PropertiesPmáx/wHardness
Alloy TypeThickness (mm)YS (MPa)UTS (MPa)ef (%)(N/mm)HV (0.3)
AA 5052-H32119826013.426065
AA 5052-H32218724520.449068
AA 5182-H111.215029330.435072
AISI 10100.817030860.324696
DP 10001.27531032101238309
Table 2. Nominal chemical compositions of the different base materials (wt%).
MaterialCMgSiCuMnCrFeAl
AA 5052-H32-2.6<0.25<0.10<0.100.20<0.40Bal.
AA 5182-H11-4.5<0.20<0.150.35<0.10<0.35Bal.
AISI 10100.10-0.1-0.45-Bal.-
DP 10000.15-0.500.011.500.03Bal.0.04
Table 3. Dissimilar joint characteristics: base materials combinations, welding parameters, and tool characteristics.
Joint IDUpper SheetLower SheetToolRotational Speed
(rpm)
Traverse Speed (mm/min)Pin Length
(mm)
AAA5052-H32-1AISI 1010-0.8H1680980.95
BAA5052-H32-2AISI 1010-0.8H2680982.0
CAA5182-H11-1.2AISI 1010-0.8H1680980.95
DAA5052-H32-2DP1000-1.2H2680982.0
Table 4. Set of parameters used for strain measurement in GOM ARAMIS 5 M Digital Image Correlation system.
DIC Hardware Parameters
Camera ManufacturerNot specified—part of the package
Lens ManufacturerSchneider
Lens Focal Length23 mm
FOV55 × 40 mm
Stereo-Angle27°
SOD250 mm
Image Acquisition Rate1 fps
Patterning TechniqueBlack spackle pattern applied over matte-white-pre-painted surface, using Lack Spray
Approximate Pattern Feature Size<0.2 mm (optical microscopy aided by generic measurement software)
DIC Analysis Parameters
Software PackageGOM Aramis Linux (V6.02)
Subset Size11 pixels
Step Size5 pixels
Subset Shape Function Affine
Strain FormulationLogarithmic
Table 5. Average maximum load per unit length (Pmax/W), failure location, and hook height for the different FSLW joints (WN—weld nugget, BM—base material, IF—interfacial failure).
JointABCD
Pmax/W (N/mm)200 ± 8232 ± 2219 ± 19207 ± 1
Failure locationWN (Hook)BM (Steel)IF/BM (Steel)IF
Hook Height (mm)0.070.070.170.01
Disclaimer/Publisher’s Note: The statements, opinions and data contained in all publications are solely those of the individual author(s) and contributor(s) and not of MDPI and/or the editor(s). MDPI and/or the editor(s) disclaim responsibility for any injury to people or property resulting from any ideas, methods, instructions or products referred to in the content.

