Article

AA5754–Al2O3 Nanocomposite Prepared by Friction Stir Processing: Microstructural Evolution and Mechanical Performance

by
Moustafa M. Mohammed
1,
Mahmoud E. Abdullah
1,*,
M. Nafea M. Rohim
1,
Andrzej Kubit
2 and
Hamed Aghajani Derazkola
3,*
1
Mechanical Department, Faculty of Technology and Education, Beni-Suef University, Beni-Suef 62511, Egypt
2
Department of Manufacturing and Production Engineering, Rzeszow University of Technology, al. Powst. Warszawy 8, 35-959 Rzeszow, Poland
3
Department of Mechanics, Design and Industrial Management, University of Deusto, Avda Universidades 24, 48007 Bilbao, Spain
*
Authors to whom correspondence should be addressed.
J. Manuf. Mater. Process. 2024, 8(2), 58; https://doi.org/10.3390/jmmp8020058
Submission received: 13 February 2024 / Revised: 6 March 2024 / Accepted: 6 March 2024 / Published: 8 March 2024

Abstract

:
The utilization of Al2O3 nanopowder to reinforce AA5754 aluminum alloy through blind holes employing the friction stir processing (FSP) technique to produce an aluminum matrix nanocomposite is explored in this paper. Motivated by the necessity to enhance the strength and ductility of welded joints, the impacts of varying the tool rotational speed (rpm) and blind hole diameter on the microstructure and mechanical properties of the joints are investigated. Experimental characterization techniques including SEM, optical microscopy, microhardness, and tensile tests were employed to analyze the welded joints produced under different processing parameters (tool rotational speeds of 910, 1280, and 1700 rpm, and blind hole diameters of 0, 1, 1.5, and 2 mm). Comparative analyses were conducted against base metal properties and joints without reinforcement powder. It was found that the addition of nanopowder resulted in a decrease in the maximum generated heat during FSP, while also reducing the stir zone size compared to samples without nanopowder. Moreover, enhancements in both the strength and ductility of the joints were observed with the incorporation of Al2O3 nanoparticles. The optimal combination of welding conditions, observed at 1280 rpm rotational speed and 1.5 mm hole diameter, yielded a remarkable ultimate tensile strength of 567 MPa, accompanied by a hardness of 45 HV. These results underscore the potential of nano-Al2O3 reinforcement in significantly improving the mechanical properties of the produced nanocomposite, with implications for advancing the performance of welded structures in various engineering applications.

1. Introduction

Metal matrix composites (MMCs) have gained significant attention in various industrial sectors due to their exceptional combination of strength, lightweight characteristics, and corrosion resistance [1]. The incorporation of reinforcement particles in aluminum alloys enhances their surface properties, such as increased hardness, corrosion resistance, and, sometimes, the ability to dissipate heat [2,3,4]. Automotive, aerospace, and marine industries require materials with high corrosion resistance and good mechanical properties [5]. Friction stir processing (FSP) is a novel solid-state technique that enables the production of MMCs with a refined microstructure and uniform reinforcement distribution [6,7]. The role of refinement depends on additional powder (metal or ceramic) in the total metal matrix or modification of only the metal surface that is exposed to loads [8,9,10,11]. The distribution of additional powder in FSP depends on the specific parameters and techniques employed during the processing operation and the material’s characteristics. The specific parameters related to FSP are classified into three categories: variables of the processing machine, parameters of tool processing, and reinforcement materials [12]. Considering these factors to optimize the powder distribution for the desired application is essential. Usually, powder is added to the material to be treated, either by creating a longitudinal groove parallel to the processing direction or by drilling blind holes in the surface as a ratio of the base metal thickness.
Several studies have been considered to enhance the microstructure, surface modification, and mechanical performance via extending the duration of the tool pass, adjusting the tool rotation direction between passes, or employing multi-pass FSP; for instance, Ata et al. [13] employed five distinct values of nanocomposites involving Ni-Cu-Fe to enhance the mechanical characteristics of commercial aluminum 1050-O. During the (FSP) process, an optimal welding condition was established, utilizing 800 rpm and a feed rate of 25 mm/min. The technique for incorporating the additive powder relied on creating a horizontal groove in the workpiece before FSP. The researchers observed that dynamic recrystallization within the stir zone facilitated a strong bond between the additive powder and the base metal. Parumandla and Adepu [14] reinforced commercial AA 6061-T6 using two types of nanopowders: Al2O3 and SiC. The main welding parameter they focused on was the volume percentage of additive reinforcement. They observed that increasing the volume percentage of nanopowder resulted in a significant increase in hardness at the stir zone. However, ultimate tensile strength (UTS) and elongation percentage (E%) were reduced.
Mehdi and Mishra [15] reinforced AA6082-T6 with SiC at a tool rotational speed of 1350 rpm, traveling speed of 65 mm/min, and tool tilt angle (TTA) of 2°. The mechanical and microstructure properties were evaluated from pass 1 to pass 5. The microhardness increased significantly, and the agglomeration of powders reduced as the number of passes increased. Bevilacqua et al. [16] studied the process parameters for welding a 2 mm thick sheet of AA5754. They suggested the optimum welding conditions producing the highest UTS were 1500 rpm, 30 mm/min, TTA of 2°, and a tool plunge depth of 0.2 mm. Liu et al. [17] used zirconium dioxide and cerium oxide to improve a 5 mm AZ31B magnesium alloy. A longitudinal groove with a depth of 3 mm was made in the base metal to add micropowder particles. Defect-free specimens were obtained during processing under 1200 rpm, 100 mm/min, and a TTA of 3°. It was observed that the microhardness increases significantly with an increase in the tool rotational speed from 800 to 1200 rpm. Li et al. [18] produced composite surfaces using surface reservoir powder. This technique involves an array of blind drilling holes to reduce the powder accumulation. Using the blind drilling method has several advantages compared to longitudinal grooves, such as better control over the powder distribution and, therefore, the ability to control the surface properties based on the specific application. Kumar et al. [19] also utilized blind holes to modify the surface of AZ31 by incorporating Al2O3. Three specimens were employed to examine the impact of tool rotational speed on welding properties in addition to non-reinforced processed specimens. The findings demonstrated that the tool rotational speed is a primary influencing factor affecting corrosion resistance and surface hardness enhancement.
Previous studies indicate that using additive ceramic nanopowder generally enhances surface properties. However, these studies have a research gap in modifying the surface of aluminum AA5754 specifically through the utilization of blind holes. To address this research gap, blind holes were created with varying diameters of 1, 1.5, and 2 mm while maintaining a consistent depth of 1.5 mm. These blind holes were employed to modify the surface of aluminum AA5754, which possessed a thickness of 3 mm. Subsequently, mechanical and metallurgical tests were conducted to assess the quality of the modified specimens.

2. Materials and Methods

In the experimental study, AA5754 aluminum alloy, obtained from the local market, was utilized as the primary matrix material, with a thickness of 3 mm. The chemical composition of the AA5754 alloy was determined based on the provided data sheets, detailed in Table 1. To facilitate experimentation, the aluminum matrix was meticulously cut into rectangular pieces, measuring 160 × 200 mm, employing a hydraulic shearing machine. The mechanical property data collected in the laboratory setting are presented in Table 2 for comprehensive analysis. To enhance the properties of the alloy, Al2O3 nanoparticles were meticulously selected as additives to fabricate a nanocomposite material. The average particle size of the Al2O3 was determined to be 1000 nm, accounting for any potential agglomeration effects. The morphology of the utilized particles is depicted in Figure 1a via scanning electron microscope (SEM) imaging, while the X-ray diffraction analysis (XRD) results are elucidated in Figure 1b for further characterization.
In the experimental procedure conducted on the fabrication of aluminum matrix composites via FSP, the initial preparations involved the drilling of the aluminum matrix surface. This step facilitated the subsequent production of the composites. The drilled holes were strategically positioned in a linear arrangement at the center of the matrix, ensuring uniformity and consistency in the fabrication process. Each hole was standardized to a depth of 1.5 mm, with a linear separation distance of 10 mm between them. This meticulous arrangement enabled precise control over the composite formation process, ensuring accurate analysis of the ensuing effects (Figure 2a). The diameter of the blind hole should be less than the FSP tool pin diameter to ensure that the reinforced particles are well distributed in the forming area. On the other hand, the distance between the blind holes should be less than the diameter of the tool shoulder to ensure the distribution of the supported material along the welding line. For this reason, in the current study, the mentioned hole diameter and distance were selected.
To investigate the influence of Al2O3 weight percentages on composite properties, four distinct hole diameters were selected: 0 mm, 1 mm, 1.5 mm, and 2 mm. The 0 mm diameter hole represented the baseline condition, constituting the FSP of the aluminum matrix without the incorporation of any powder additives (Figure 2b). Subsequently, the effects of the FSP process parameters were evaluated by varying the tool rotational speed. Three rotational speeds, namely 910, 1280, and 1700 rpm, were systematically employed to scrutinize their impact on the composite’s characteristics. Throughout the FSP process, parameters such as tool traveling speed, plunge depth, and tilt angle remained constant at 29 mm/min, 0.15 mm, and 2 degrees, respectively. Employing a specialized tool featuring a 12 mm shoulder diameter with a square pin measuring 4 mm in area and 2.5 mm in length ensured precise and controlled processing, facilitating comprehensive analysis of the experimental outcomes (Figure 2c). The thermal history of surface temperature during the FSP was measured using an IR Camera (Bosch GIS 1000C Pro), as it has the capability to measure surface temperature exclusively.
For better analysis of the samples, all the cases were numbered based on the FSP tool rotational velocity and hole diameter. Table 3 presents the sample conditions and names. After the production of FSP samples, a laser cutting machine was used to prepare the samples based on three samples for the tensile test, samples for the macrograph, and samples for microhardness. The tensile tests were conducted on a universal testing machine, Shimadzu “UH-500 KN”, according to the guidelines for an ASTM-E8M subsize specimen at a cross-head speed of 2 mm/min. The microhardness samples were tested using the Vickers micro-hardness tester “Model No. 1600-4981”. According to the ASTM E384-99 guidelines, the Vickers microhardness test was performed on different welding zones using a 300 g testing load for a duration of 15 s. The samples for microhardness were polished and etched on a cross-sectional area. Each specimen was measured on the thickness “perpendicular to welding line” to evaluate the change in hardness, which included the base metal, heat-affected zone (HAZ), thermo-mechanical affected zone (TMAZ), and stir zone (SZ). Scanning electron microscopy was used to evaluate the surface fracture of optimum and minimum samples after the tensile test procedure as well as the surface of samples after the wear test. An optical microscope was used in the comprehensive assessment of welding defects within the welding zone, as well as to evaluate the areas of SZ and HAZ. Two types of optical microscopes were used, the first one was a stereo optical microscope connected with a Leica DMC 2900 to evaluate the areas of SZ and HAZ.

3. Results and Discussions

3.1. Thermal Analysis

The thermal history analysis revealed significant insights into the relationship between the FSP parameters and the heat generation in the aluminum alloy matrix infused with Al2O3 nanoparticles [
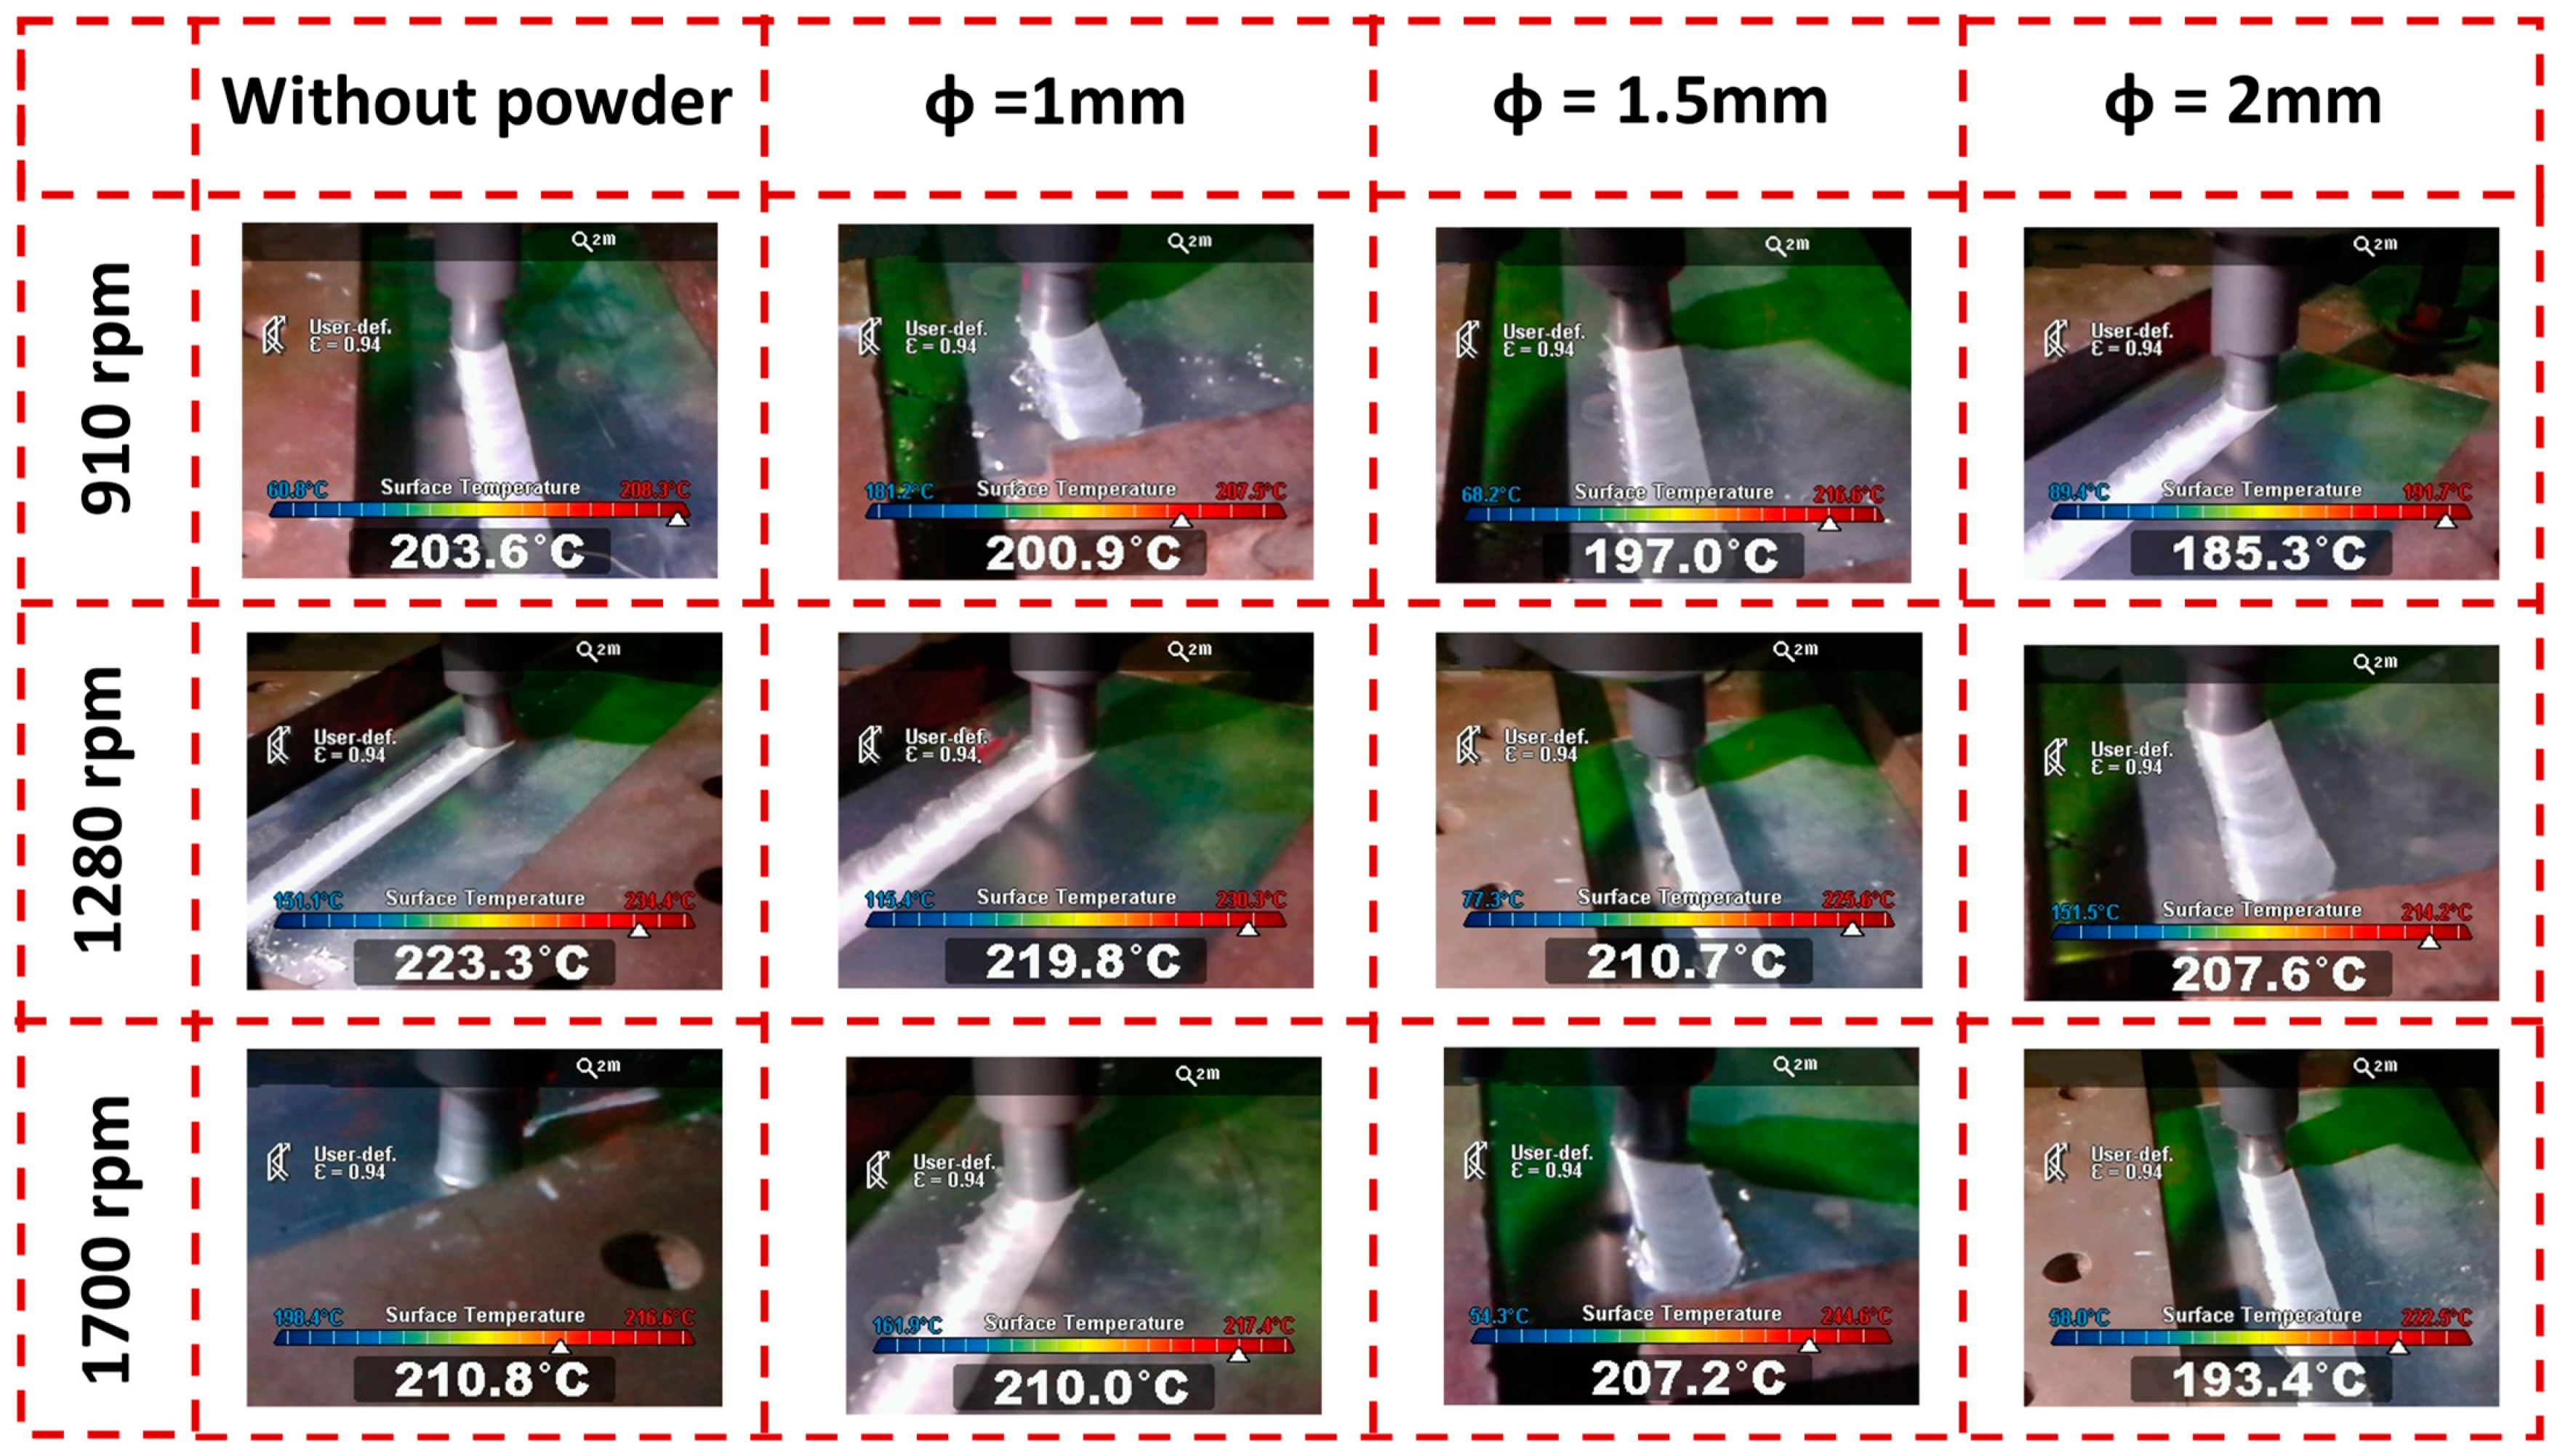
20]. Through thermo-visual camera observations, as shown in Figure 3, alterations in surface heat flux during the process were monitored along the welding line.
The study approached the analysis from two angles: the influence of FSP tool rotational velocity and the impact of the weight of Al2O3 nanoparticles on the aluminum alloy matrix. Both factors were found to exert notable effects on heat generation during the FSP process. An expected trend emerged with increasing tool rotational velocity, wherein the maximum surface temperature on the aluminum matrix escalated. Specifically, without the presence of Al2O3 powder, the recorded minimum surface temperature was 203.6 °C at a tool speed of 910 rpm. Conversely, the maximum temperature registered at 210.8 °C occurred at 1700 rpm, indicating a 4% increase compared to the 910 rpm scenario. Incorporating Al2O3 nanopowder into the aluminum matrix led to a reduction in the maximum temperature across all the samples. A noteworthy observation was made regarding the impact of hole diameter on heat generation. As the surface hole diameter increased, a decrease in generated heat was observed. This phenomenon can be attributed to the increased insertion of Al2O3 nanopowder into the aluminum matrix with larger hole diameters, resulting in a greater reduction in heat generation and surface heat flux.
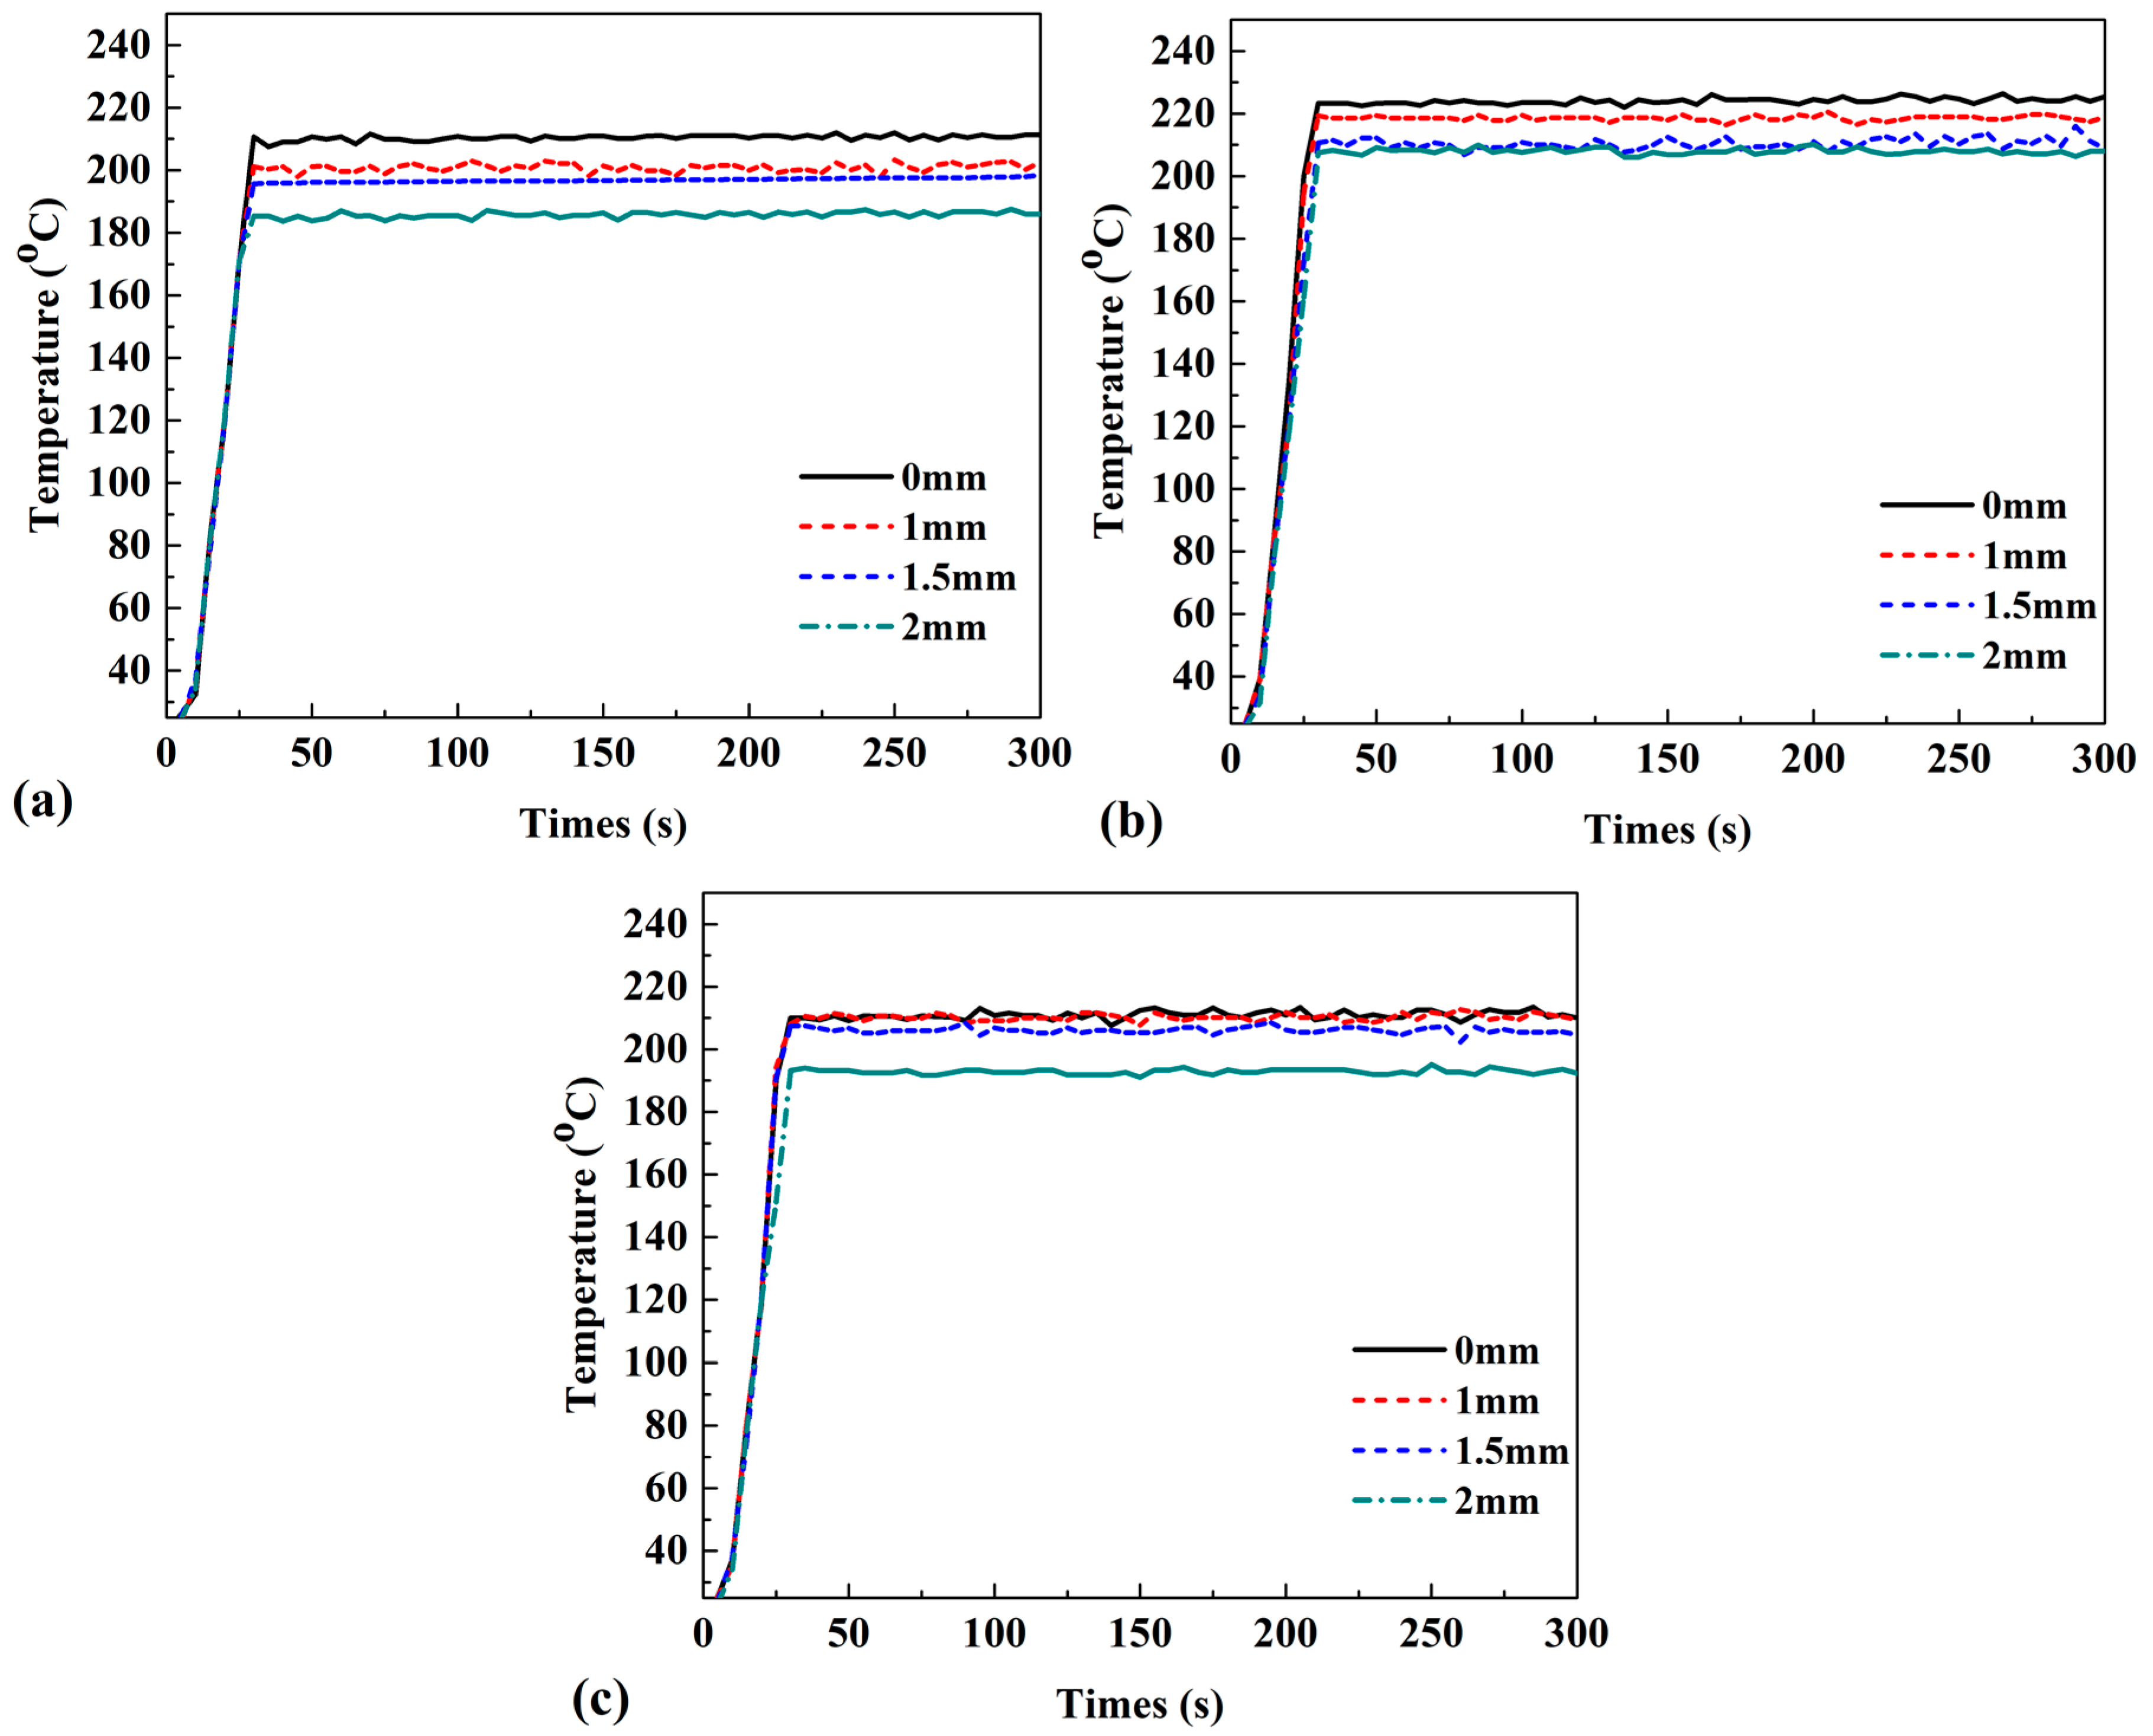
The thermal history tracking based on the A, B, and C case numbers are presented in Figure 4a, Figure 4b, and Figure 4c, respectively. Further analysis, illustrated through thermal history tracking represented by the A, B, and C case numbers, delineated the nuanced variations in heat generation under different experimental conditions. The investigation pinpointed that the maximum heat production occurred with a 1 mm hole diameter at a rotational speed of 1280 rpm (223.3 °C), while the minimum heat generation was recorded with a 2 mm hole diameter at a tool rotational speed of 910 rpm (185.3 °C). These findings underscore the intricate interplay between FSP parameters, Al2O3 nanoparticle incorporation, and hole diameter on heat generation in aluminum alloy composites [21].

3.2. Surface Flow Analysis

The evaluation of sample surfaces constituted a pivotal aspect of this study, providing crucial insights into the effects of FSP conditions and the incorporation of nanopowder on surface characteristics [
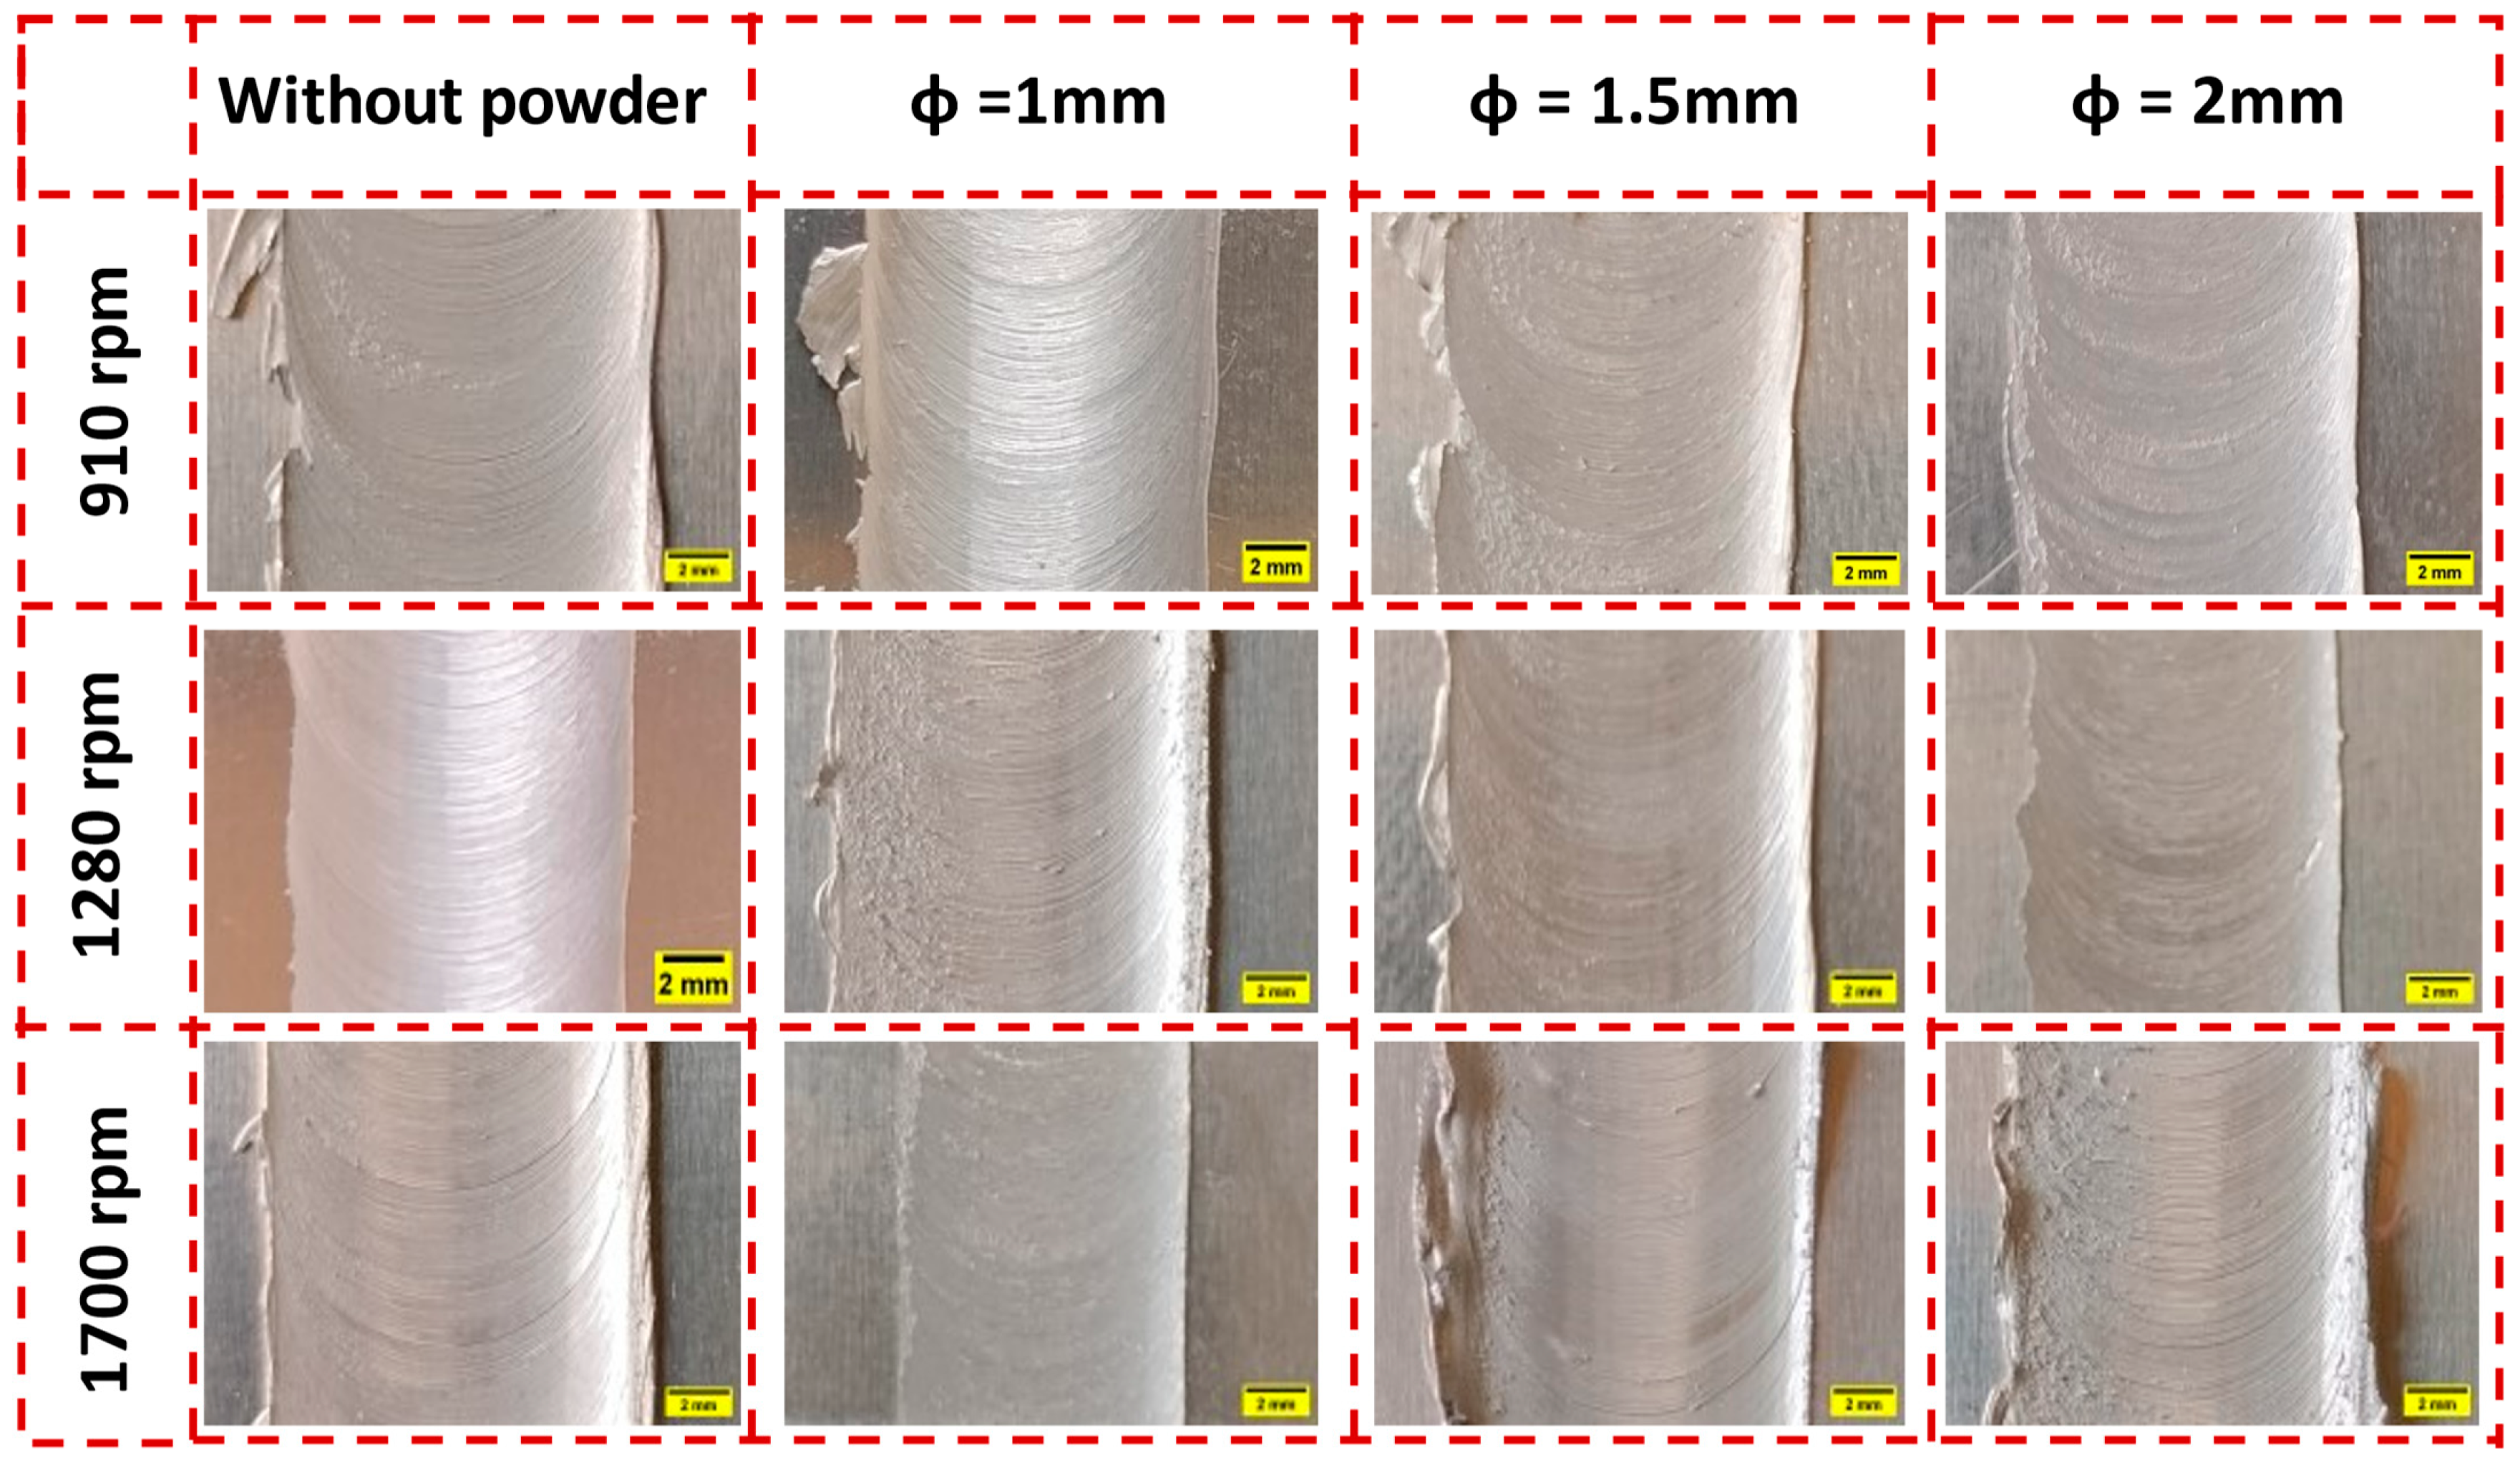
22]. Optical images of all the samples were meticulously examined, offering visual representations of surface features as depicted in Figure 5. Analysis of surface characteristics was conducted across two distinct groups. First, the FSP conditions without nanopowder, and second, those with nanopowder. The results revealed a general absence of macroscopic defects or significant imperfections on the surfaces of the FSP samples. However, a prevalent surface anomaly identified as surface flash was observed in the proximity of the samples, particularly evident on the retreating side. The absence of substantial defects underscores the effectiveness of the FSP process in producing high-quality surfaces in both nanopowder-infused and non-infused scenarios. While surface flash emerged as the primary surface irregularity, its presence was localized and did not compromise the overall integrity of the samples. This analysis underscores the importance of surface examination in assessing the quality and reliability of FSP-produced components.
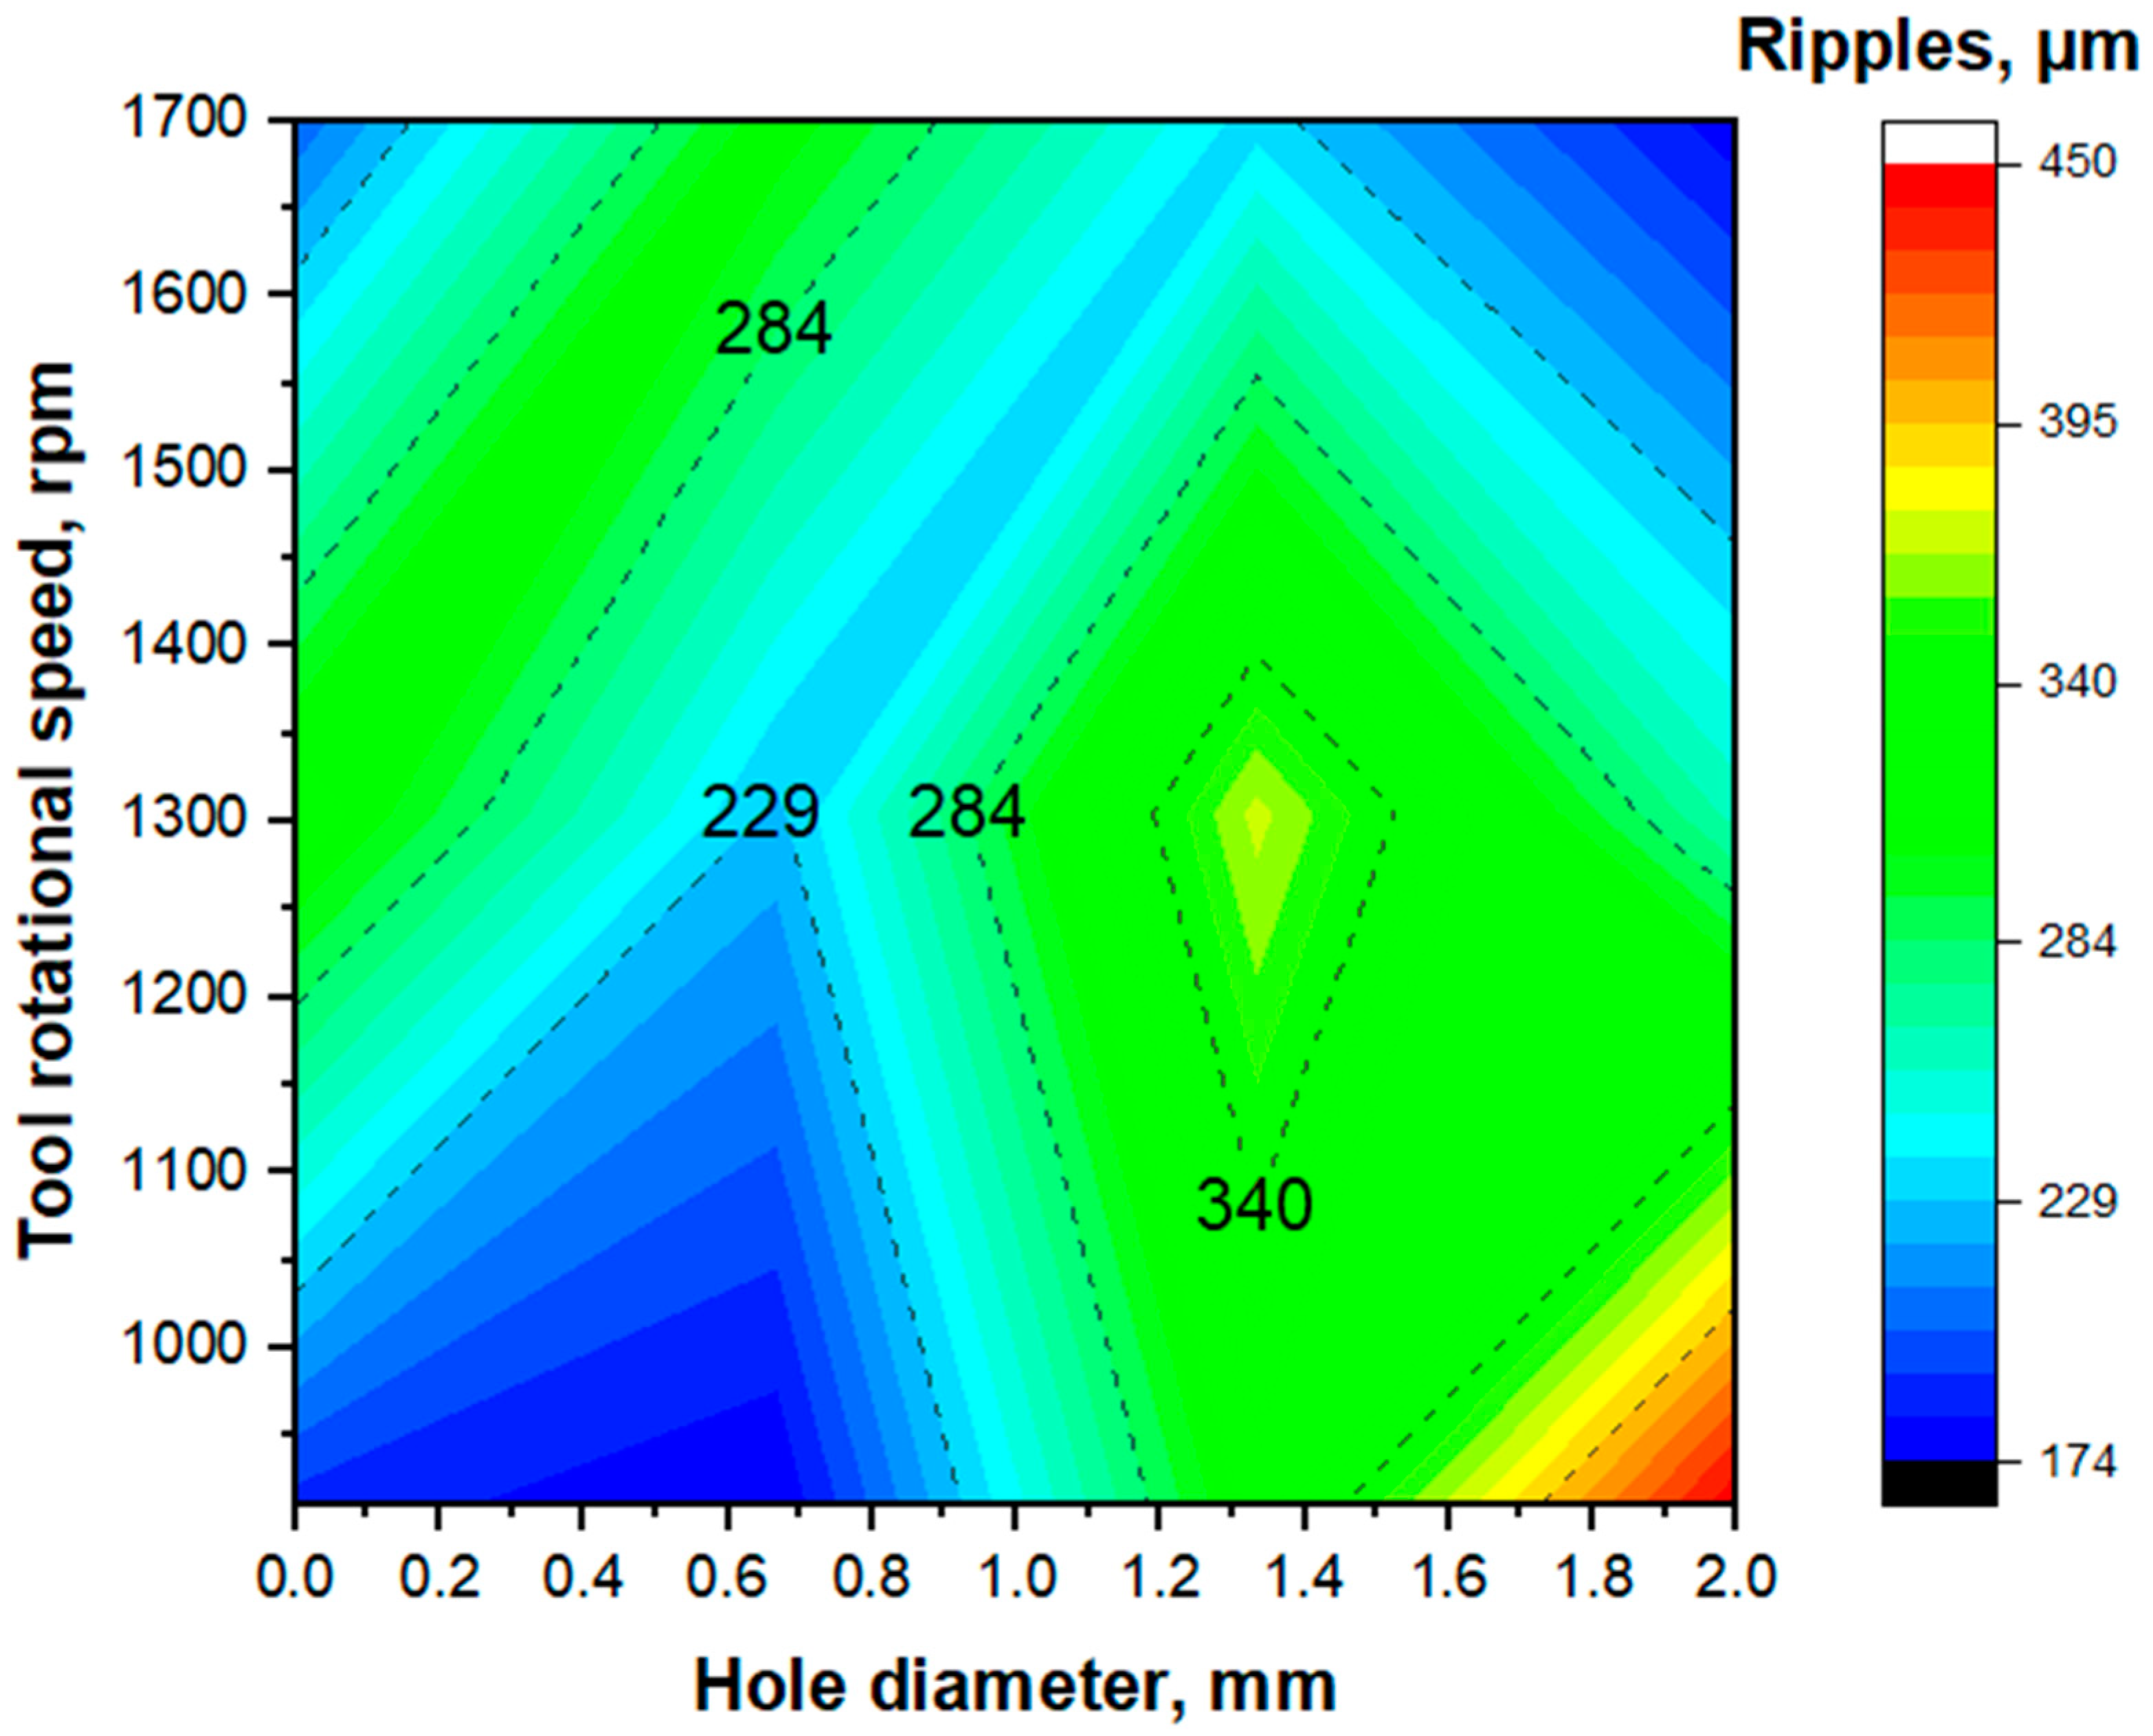
The surface analysis yielded critical insights into the characteristics of the sample surface flow, particularly focusing on the observation of surface flow rings, commonly referred to as ripples. The relationship between the distance between these ripples and both tool rotational velocity and hole diameter was systematically investigated and is graphically depicted in Figure 6. It is conceivable to establish a correlation between the ripple distance, measured in micrometers, and the diameter of the holes, which serves as an indicator of the quantity of Al2O3 nanopowder dispersed within the aluminum matrix, as well as the rotational velocity of the FSP tool, expressed in revolutions per minute (rpm).
The research findings shed light on a compelling correlation existing among ripple distance, tool rotational velocity, and hole diameter. Specifically, the investigation revealed that higher ripple distances were invariably linked to more turbulent surface flows, whereas lower ripple distances consistently indicated smoother surface flows. This notable observation underscores the pivotal role played by FSP parameters in dictating surface morphology, with the formation of ripples serving as a tangible marker for evaluating surface texture and overall quality.
Table 4 displays the average ripple distances observed on the FSP samples. It is noted that the average ripple distances for samples A0, A1, A2, and A3 were measured at 188.181 μm, 147.949 μm, 316.046 μm, and 449.546 μm, respectively. Similarly, for samples B0, B1, B2, and B3, the average ripple distances were found to be 321.266 μm, 226.45 μm, 370.792 μm, and 261.99 μm, respectively. Furthermore, samples C0, C1, C2, and C3 exhibited average ripple distances of 201.697 μm, 309.761 μm, 233.859 μm, and 177.243 μm, respectively. The analysis of these results indicates distinct trends based on the combination of tool rotational velocity and hole diameter. For instance, at a tool speed of 910 rpm, utilizing a 1 mm hole diameter resulted in smoother surface profiles for samples A0, A1, A2, and A3. Similarly, at 1280 rpm, the combination of a 1 mm hole diameter yielded smoother surface profiles for samples B0, B1, B2, and B3. Conversely, at 1700 rpm, the use of a 2 mm hole diameter led to smoother surface profiles for samples C0, C1, C2, and C3.
The observations suggest a correlation between tool rotational velocity, hole diameter, and surface flow characteristics. Notably, lower tool rotational velocities coupled with smaller hole diameters tend to produce smoother surfaces, albeit potentially sacrificing mechanical properties. Conversely, to achieve optimal mechanical properties along with smooth surface quality, a balance between hole diameter (which determines nanoparticle content) and tool rotational velocity is deemed essential. Furthermore, it is observed that the recorded ripple distances span a wide range, from a minimum of 174.649 μm for sample A1 to a maximum of 4449.546 μm for sample A3. This emphasizes the variability in surface characteristics achievable through the manipulation of FSP parameters, underscoring the importance of precise parameter control in achieving desired surface properties. The results elucidate the intricate interplay between tool velocity, hole diameter, nanoparticle reinforcement, and resultant surface characteristics in FSP-treated AA5754 aluminum alloy specimens. These findings provide valuable insights for optimizing FSP parameters to tailor surface properties according to specific application requirements.
Further analysis unveiled that lower tool rotational velocities, particularly in the absence of Al2O3 nanopowder, resulted in the attainment of the smoothest surface finishes. Conversely, instances characterized by low rotational velocities in conjunction with a 2 mm hole diameter exhibited the formation of the most pronounced ripple structures, indicative of the roughest surface flows observed within the study. These discerning findings underscore the intricate interplay among various process parameters, notably the tool rotational velocity and hole diameter, in molding surface morphology during the FSP procedure.

3.3. Internal Flow Analysis

The internal flow analysis of the FSP samples provided valuable insights into the microstructural changes and distribution of materials within the cross-section view [
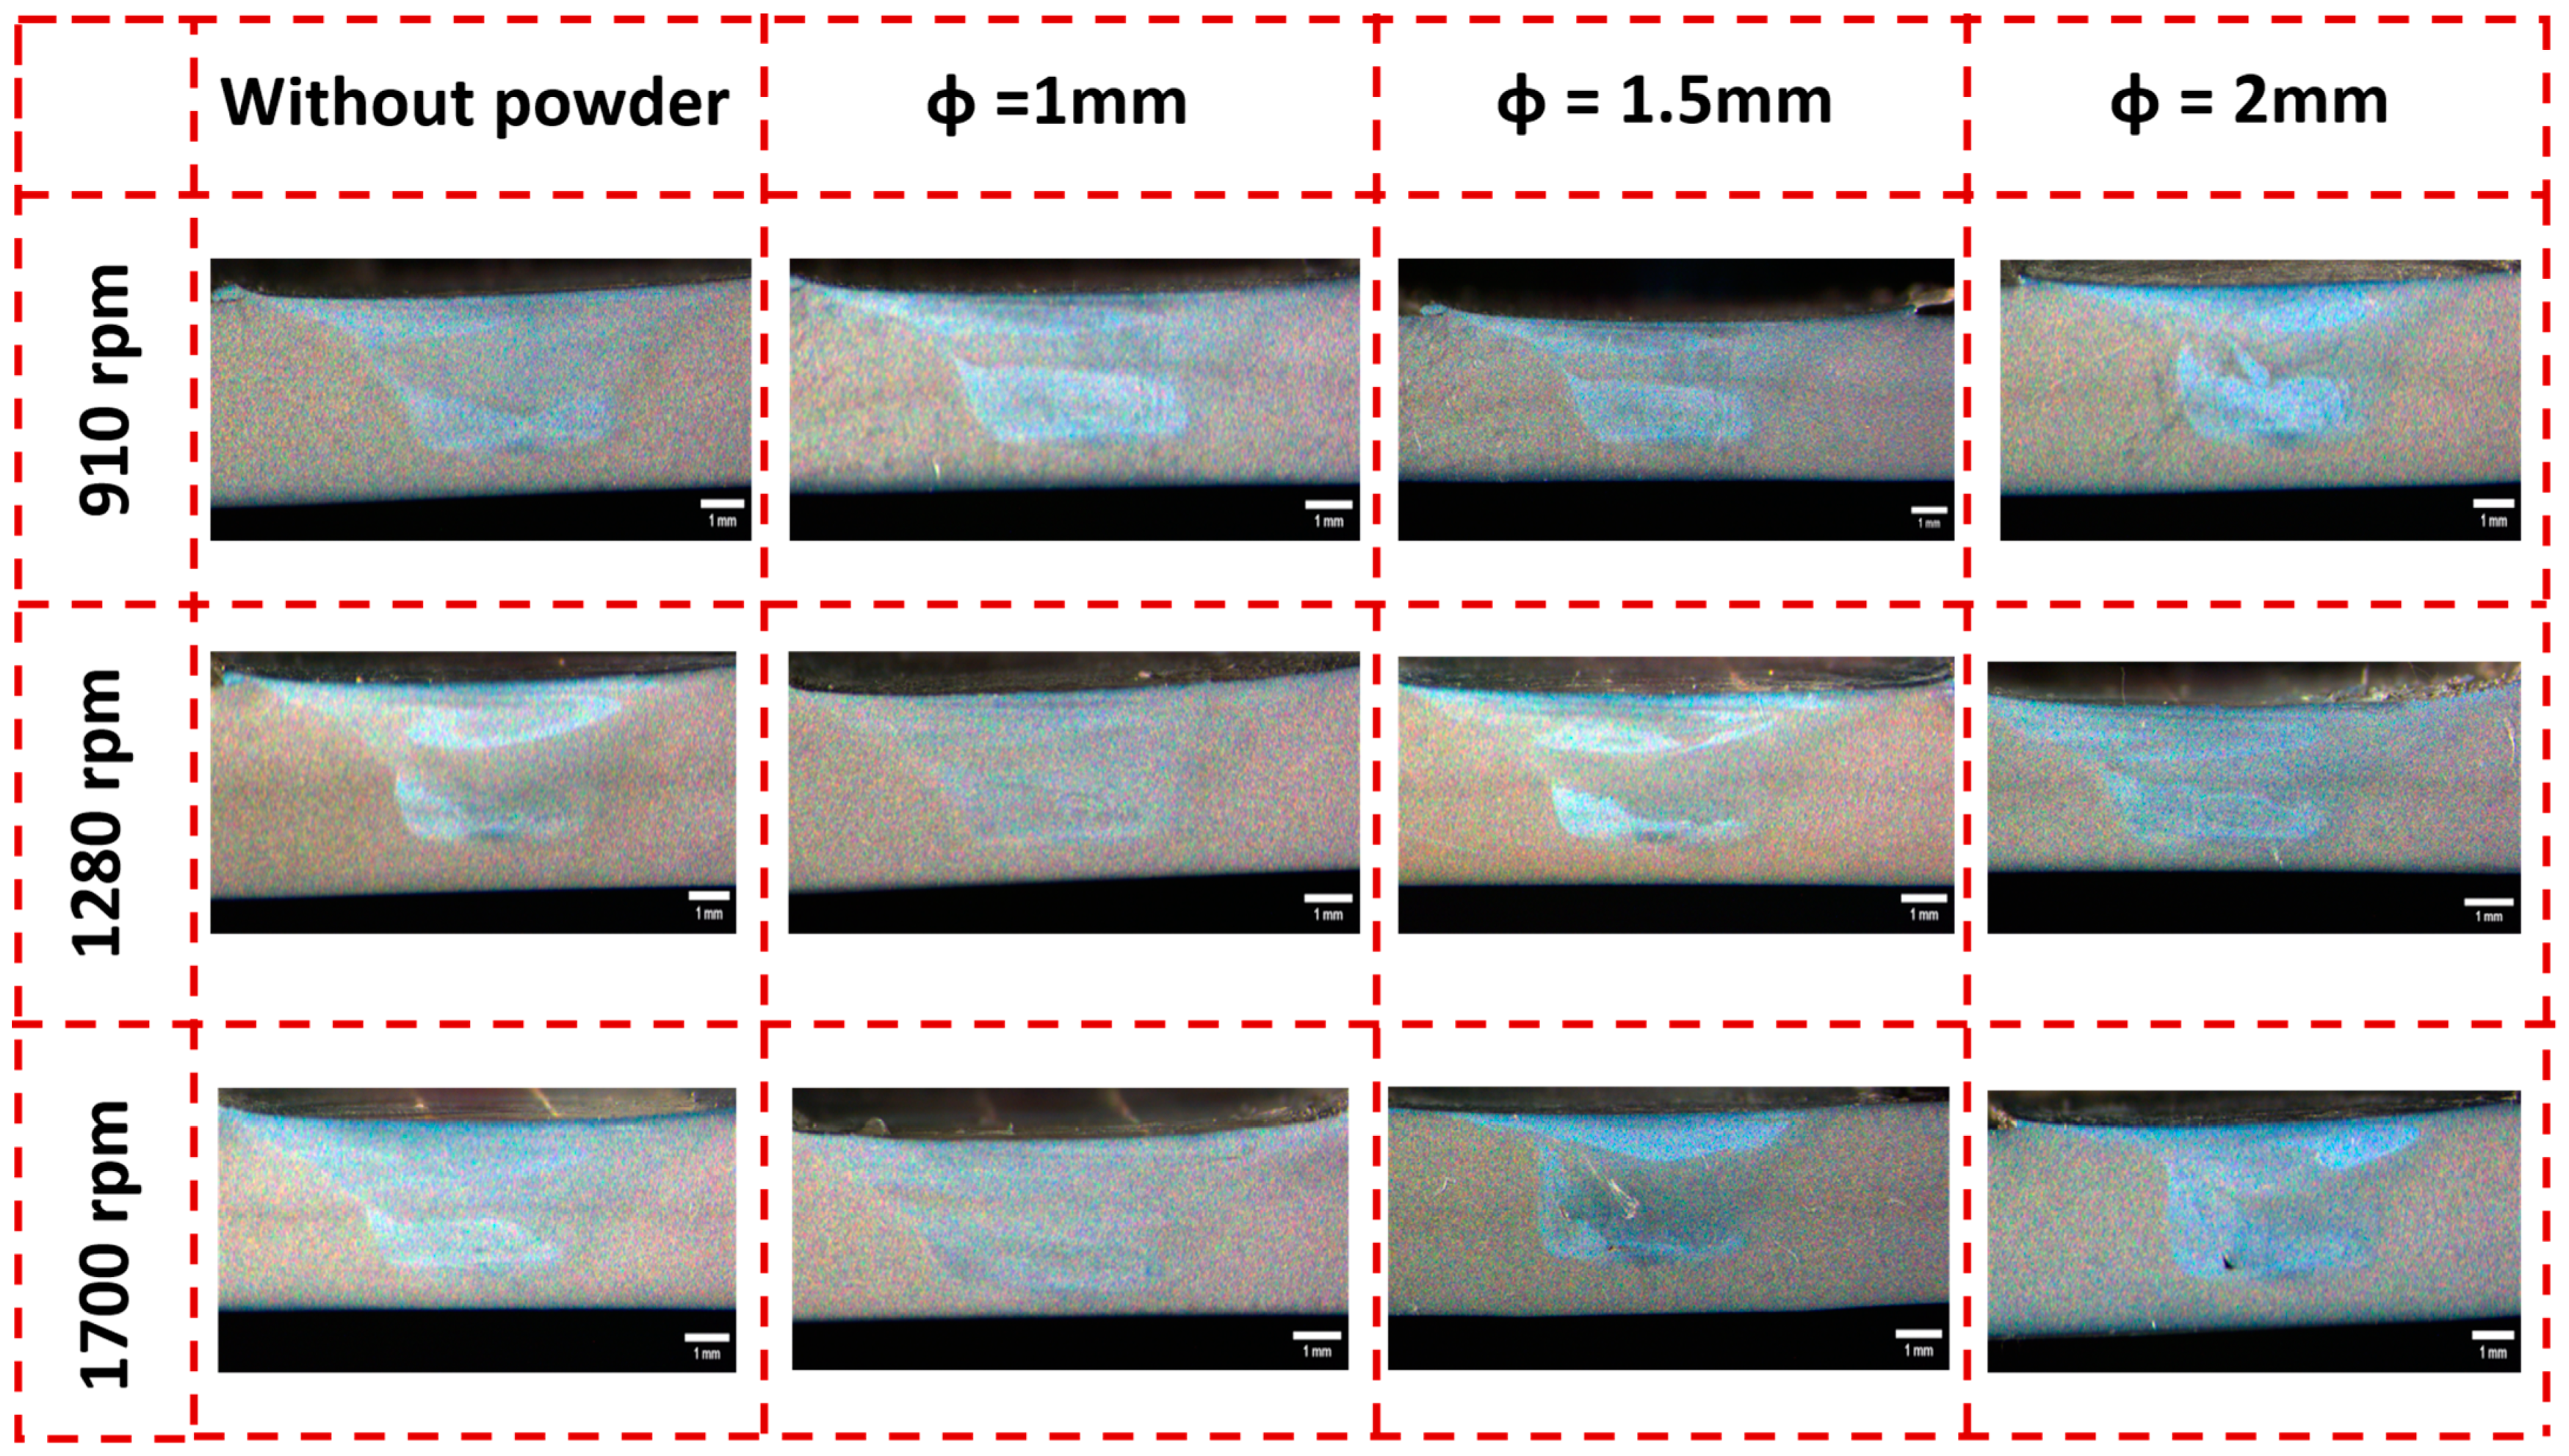
23]. This investigation, facilitated by cross-sectional examinations, as depicted in Figure 7, shed light on various characteristics of the joint zone and the impact of process parameters on internal flow. Upon initial observation, the joint zone exhibited a distinct division into two areas. First, a central white region and second, a surrounding light brown region. This division indicates the presence of different microstructural compositions within the joint zone, likely influenced by the FSP process. The analysis revealed that the stirring zone induced notable changes in microstructure and coloration, indicative of alterations in material properties resulting from the FSP process. Specifically, the incorporation of Al2O3 nanoparticles into the aluminum matrix led to the formation of a shiny area, discernible under optical microscopy, highlighting the interaction between the nanoparticles and the matrix. Interestingly, variations in the stir zone shape were observed among the samples, with the shiny area in Al2O3 nanopowder-added samples concentrated at the upper and lower regions of the stir zone. This consistent behavior across all the samples underscores the influence of Al2O3 nanopowder addition on the distribution of material within the stir zone. The presence of microvoids was detected at the bottom area of specific samples, particularly in cases characterized by high Al2O3 nanopowder content and tool rotational velocity. This observation suggests that excessive Al2O3 nanopowder content coupled with high processing parameters may contribute to the formation of defects within the stir zone.
A comparative analysis between samples with and without nanopowder revealed differences in uniformity, with the stir zones in samples without powder exhibiting greater uniformity compared to those with powder. This finding suggests that the presence of nanoparticles may introduce variability in material distribution within the stir zone. The analysis highlighted the impact of Al2O3 nanopowder viscosity on the spread of particles within the samples, with agglomeration observed primarily at the upper and lower regions of the stir zone. This behavior indicates a change in viscosity induced by nanopowder presence during the FSP process. Specifically, in samples B1, B2, and B3, a greater spread of nanopowders was observed compared to other cases, indicating variations in nanopowder distribution influenced by processing parameters.
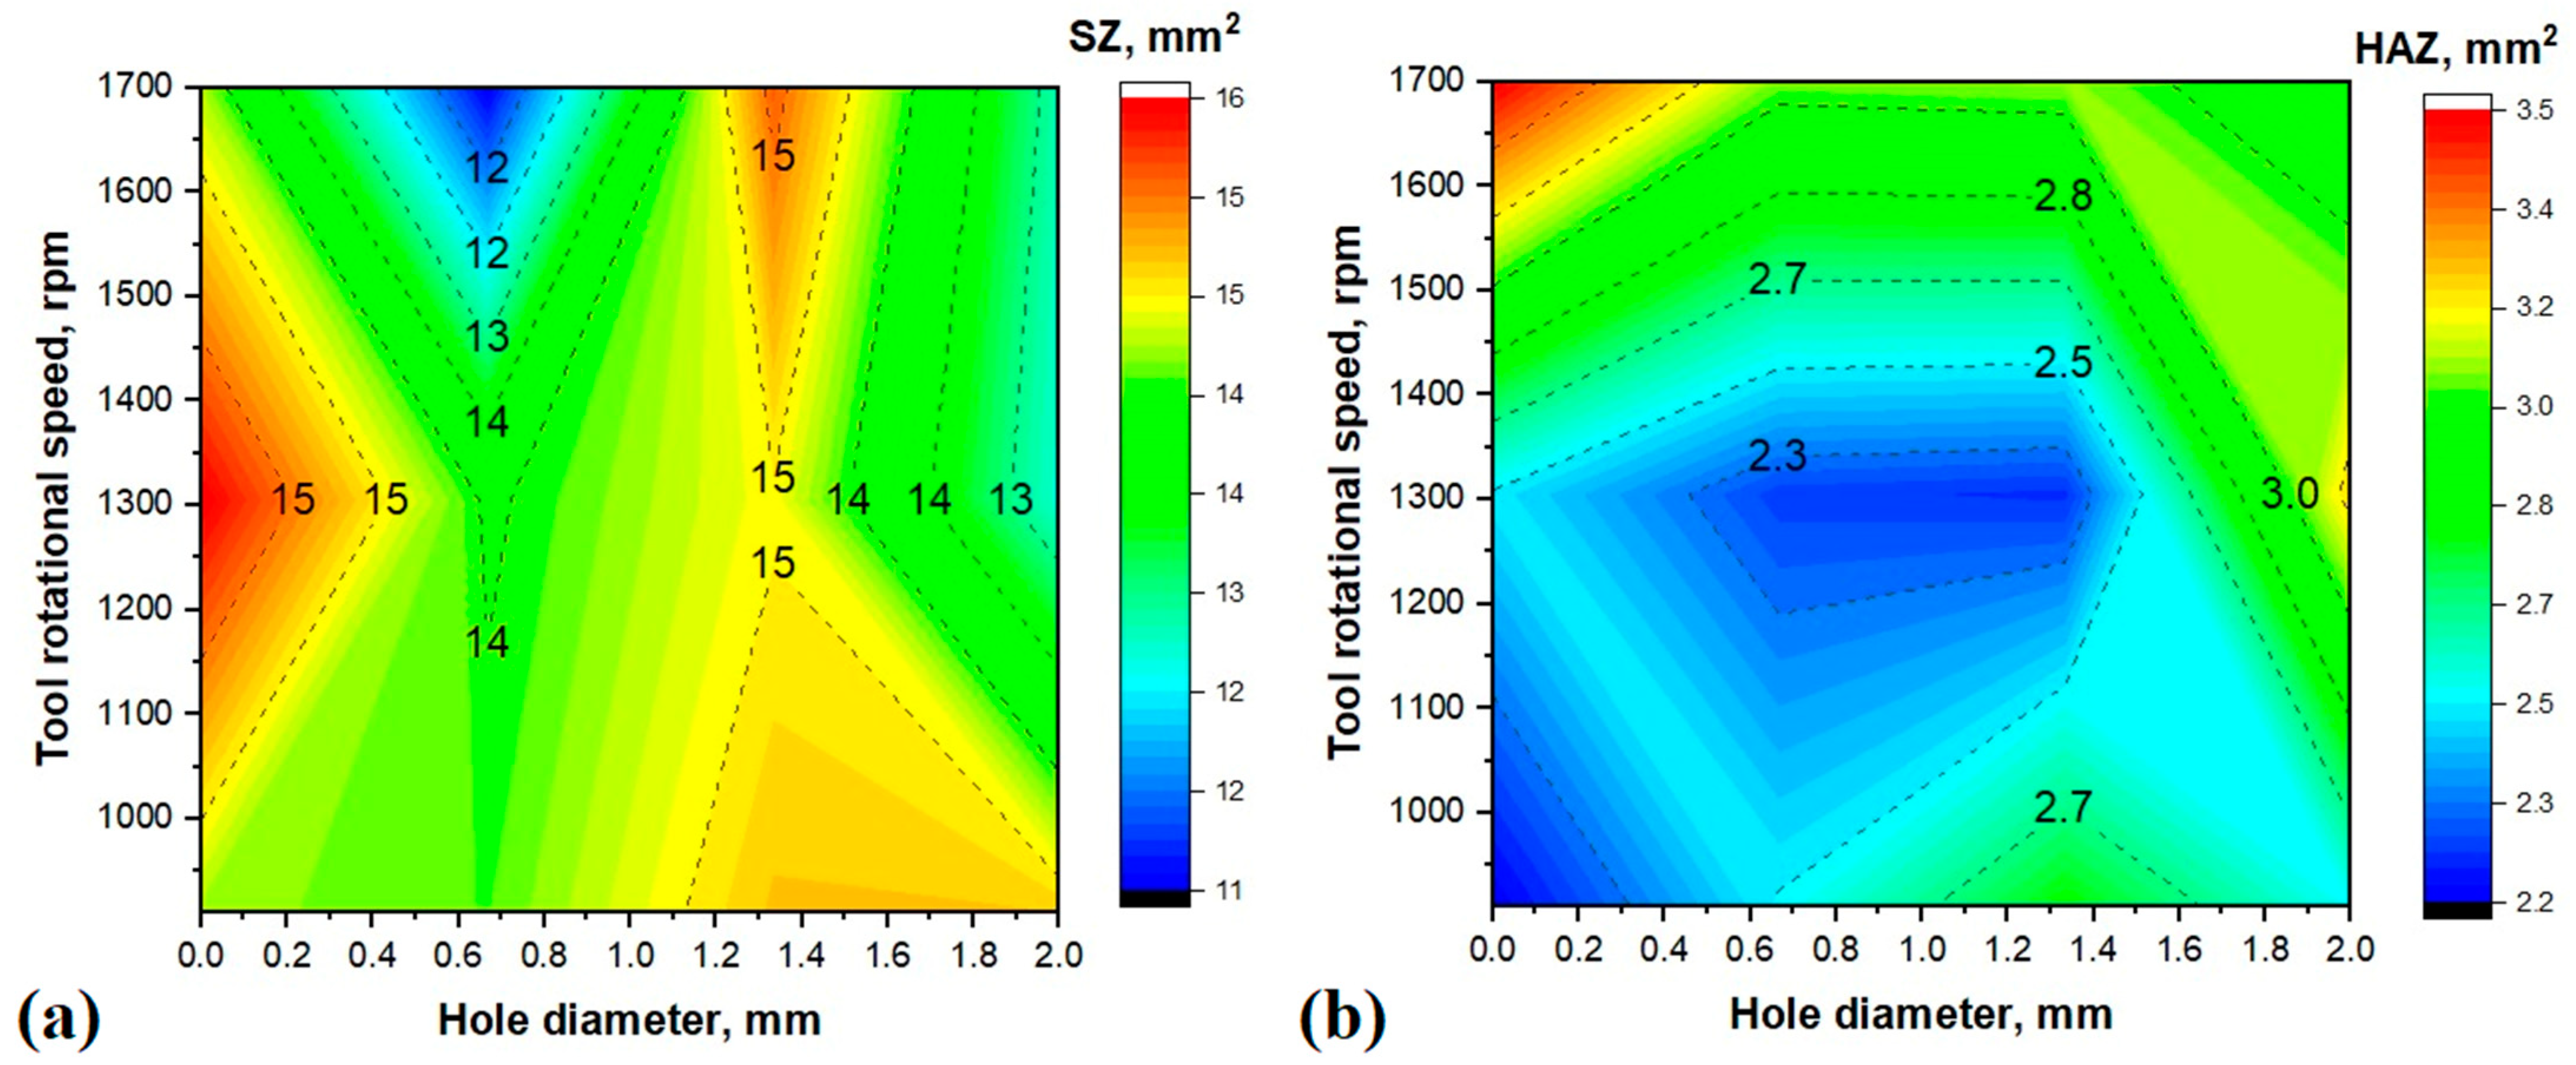
The analysis of the internal flow yielded vital insights into how the process parameters, such as tool rotation and hole diameter, relate to the properties of the SZ and HAZ, which are pivotal in heat generation during FSP. This study sought to clarify how these variables interact and affect material properties in processed samples. The results highlighted a direct link between tool rotation, hole diameter, and the dimensions of the SZ and HAZ regions. Figure 8a,b visually depict these relationships, showing distinct trends in size changes based on process parameters. Across the samples analyzed, it was observed that both tool rotation and hole diameter exerted direct effects on the size of the SZ and HAZ areas. The range of the SZ areas spanned from 11 mm2 (sample B0) to 16 mm2 (sample C1), with the maximum SZ area recorded in sample B0, processed at 1280 rpm with a 0 mm hole diameter. Conversely, the smallest SZ area was attained at 1700 rpm with a 1 mm hole diameter. The hole diameter, indicative of the amount of Al2O3 in the aluminum matrix, played a significant role in influencing the SZ and HAZ dimensions. As discussed previously, an increase in hole diameter led to greater Al2O3 incorporation, consequently decreasing maximum heat generation during FSP. Interestingly, a distinct trend emerged in the dimension of the HAZ area, contrasting with the SZ area. It was observed that lower heat generation, attributed to increased Al2O3 incorporation, resulted in smaller HAZ areas in the FSP samples. The range of HAZ areas varied from 2.3 mm2 to 3.5 mm2 across the samples analyzed, with the minimum HAZ formed in sample A0 and the maximum in sample C0.

3.4. Tensile Strength of Joint

The ultimate tensile strength (UTS) analysis provided significant insights into the mechanical properties of the FSP samples, with the results summarized in Table 5.
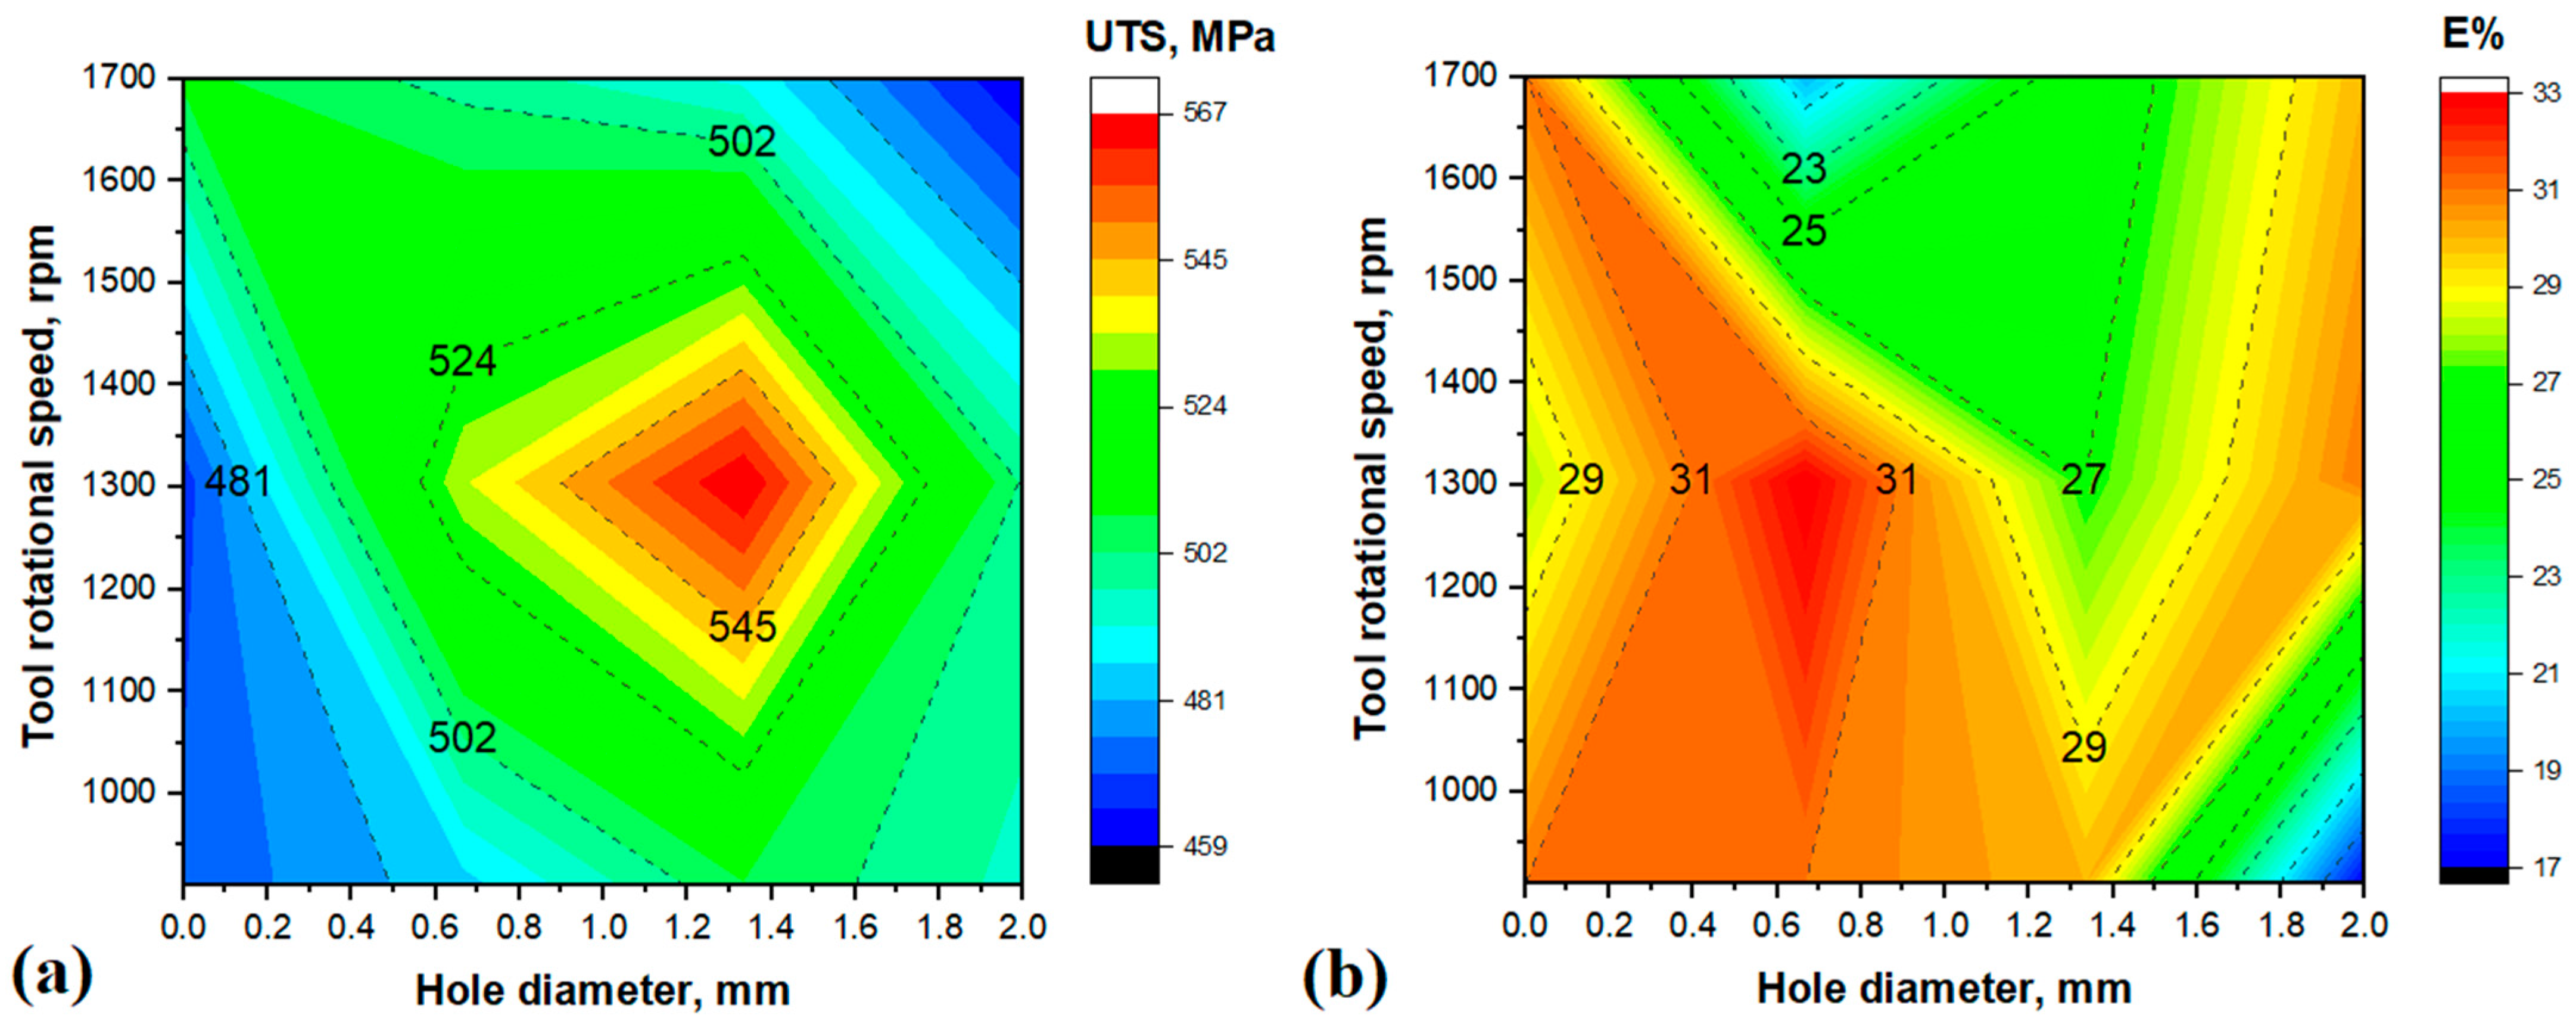
These findings highlighted the influence of process parameters, such as tool rotation and nanopowder incorporation, on the UTS of the fabricated samples. Across the A-series samples, UTS values ranged from 471 MPa for sample A0 to 507 MPa for sample A2, indicating variations in mechanical strength attributed to differing processing conditions. The maximum UTS in sample A2 surpassed the minimum UTS in sample A0 by 7.6%, underscoring the impact of process parameters on mechanical properties. Similarly, the B-series samples exhibited a wide range of UTS values, with strengths ranging from 476 MPa for sample B0 to 567 MPa for sample B2. The maximum UTS in sample B2 represented a significant increase of 21.4% compared to the minimum UTS in sample B0, emphasizing the substantial influence of processing parameters, particularly tool rotation and nanopowder addition. In the C-series samples, the UTS values ranged from 459 MPa for sample C3 to 509 MPa for sample C0. The maximum UTS in sample C0 exceeded the minimum UTS in sample C3 by 9.9%, further highlighting the variability in mechanical properties across different processing conditions.
Comparative analysis revealed that UTS and elongation were closely related to both tool rotation and the amount of added nanopowder. In samples without nanopowder, UTS increased with higher tool rotational velocities. However, with nanopowder addition, the UTS exhibited an optimal increase up to a 1.55 mm hole diameter, beyond which further nanopowder incorporation, particularly in 2 mm hole diameter samples, negatively impacted the UTS. Tool rotation velocity emerged as a critical factor influencing UTS, with an observed direct effect on mechanical strength when mixing Al2O3 with the aluminum matrix. The optimum processing parameters were identified as 1280 rpm tool velocity and a 1.5 mm hole diameter, yielding the highest UTS values in the study. Furthermore, nanopowder incorporation, as indicated by hole diameter, played a crucial role in UTS variation, with specific amounts of Al2O3 added to the aluminum alloy matrix corresponding to different hole diameters. Overall, the maximum UTS recorded in the study was 567 MPa in sample B2, while the minimum UTS was 471 MPa in sample A0, highlighting the significant influence of processing parameters on the mechanical strength of the FSP samples (Figure 9a).
The analysis of elongation provided insights into the ductility of the FSP samples, elucidating the influence of process parameters, such as tool rotation and nanopowder addition, on material deformation properties [24]. Across the A-series samples, elongation values ranged from 17% for sample A3 to 31% for samples A0, A1, and A2. This variation in elongation indicated differences in ductility attributed to distinct processing conditions. Notably, samples A0, A1, B3, and C0 exhibited identical elongation values of 31%, underscoring the consistency in ductility across these samples (Figure 9b). Similarly, the B-series samples exhibited a range of elongation values, with strengths ranging from 27% for sample B2 to 33% for sample B1. The maximum elongation in sample B1 represented the highest ductility observed in the study, while the minimum elongation was found in sample B2. In the C-series samples, elongation values ranged from 20% for sample C1 to 31% for sample C0. The maximum elongation in sample C0 reflected a high level of ductility, whereas the minimum elongation in sample C1 indicated reduced deformation capacity under the tested conditions. Comparative analysis revealed a correlation between elongation and both tool rotation and nanopowder addition. In samples without nanopowder, elongation increased with higher tool rotational velocities, indicating enhanced ductility. However, with nanopowder addition, the relationship between elongation and processing parameters exhibited greater variability, suggesting additional factors influencing material deformation properties. Overall, the maximum elongation recorded in the study was 33% in sample B1, while the minimum elongation was 17% in sample A3. These findings highlight the significant influence of processing parameters on material ductility and deformation behavior in FSP-treated samples.
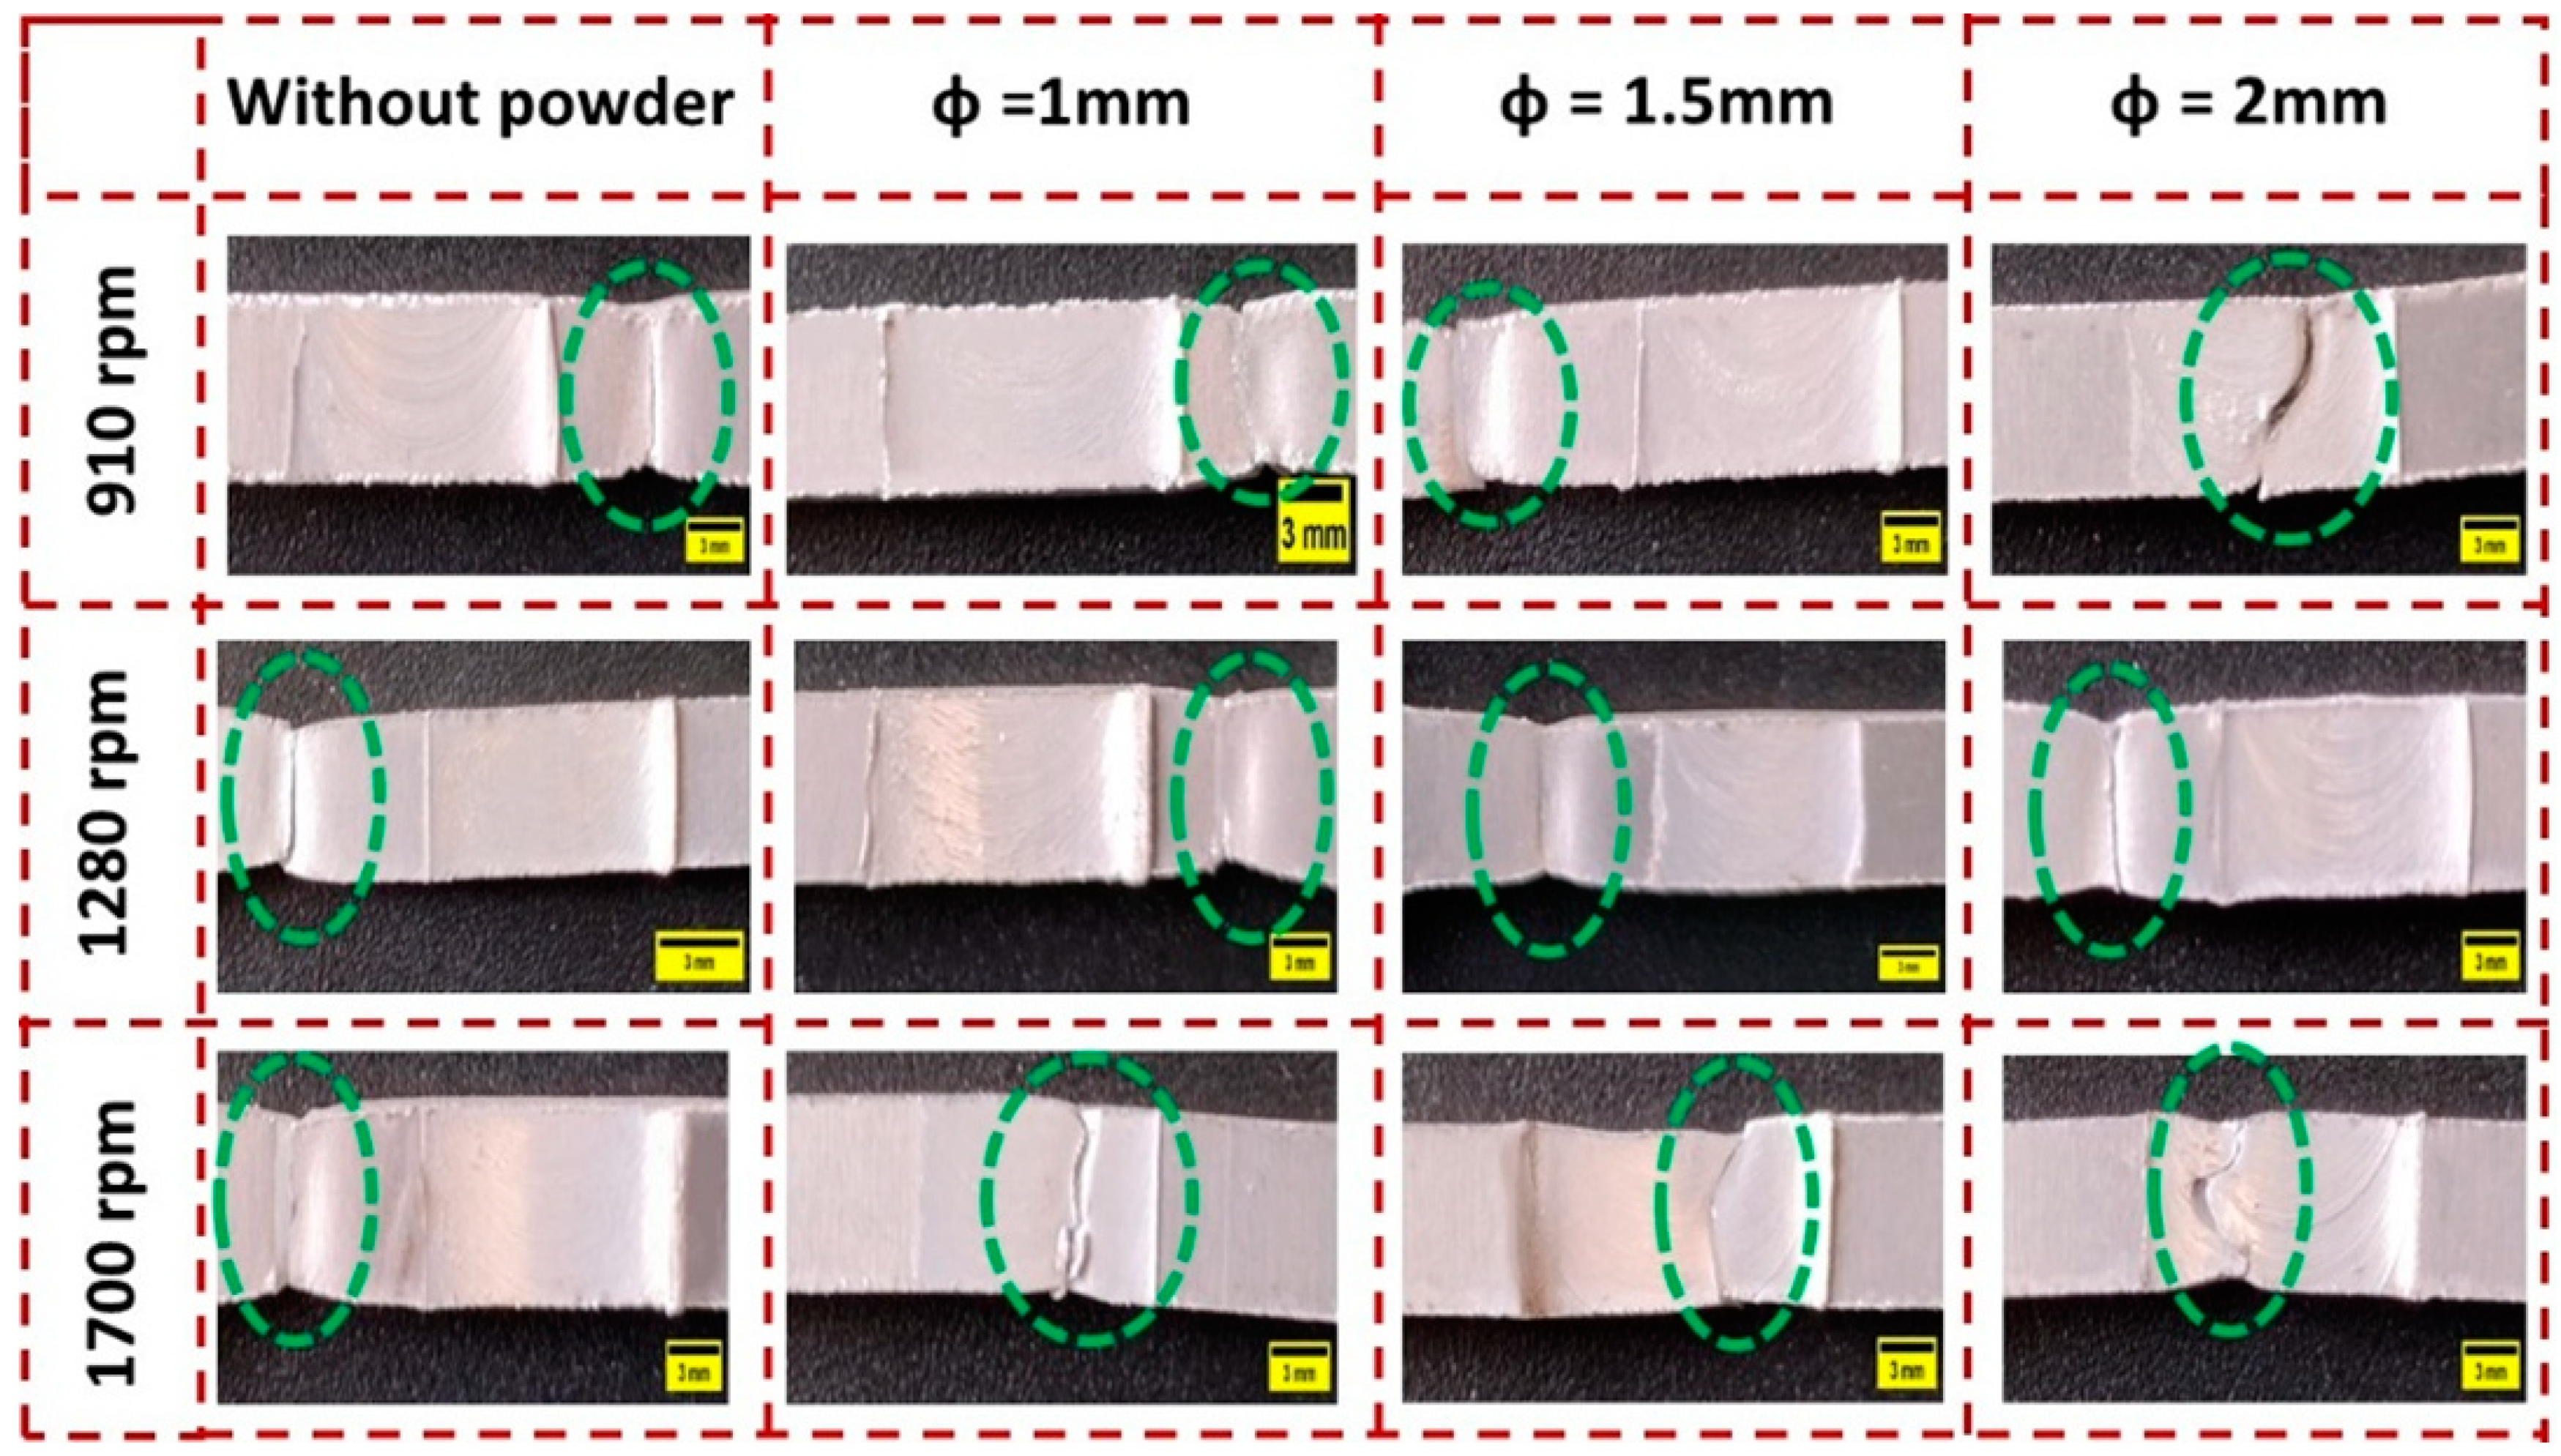
The examination of fracture locations during the tensile test provided valuable insights into the mechanical behavior and structural integrity of nanocomposite samples produced by FSP, offering indications of fracture initiation and propagation patterns. The fracture locations, as depicted in Figure 10, revealed distinct fracture patterns across the different sample series. Specifically, the C-series samples exhibited fracture initiation and propagation from the side and middle of the stir zone. This fracture pattern suggests that the structural integrity of these samples was primarily maintained within the stir zone, indicating robust bonding and material consolidation in this region. Conversely, sample A3 displayed fracture characteristics similar to the C-series samples, with fracture occurring from the middle of the stir zone. However, in contrast to the C-series samples, the remaining A-series samples exhibited fracture initiation and propagation from the heat-affected zone area. This fracture pattern suggests that the structural integrity of these samples was predominantly influenced by the characteristics of the heat-affected zone, highlighting variations in material properties and bonding mechanisms across different processing conditions.
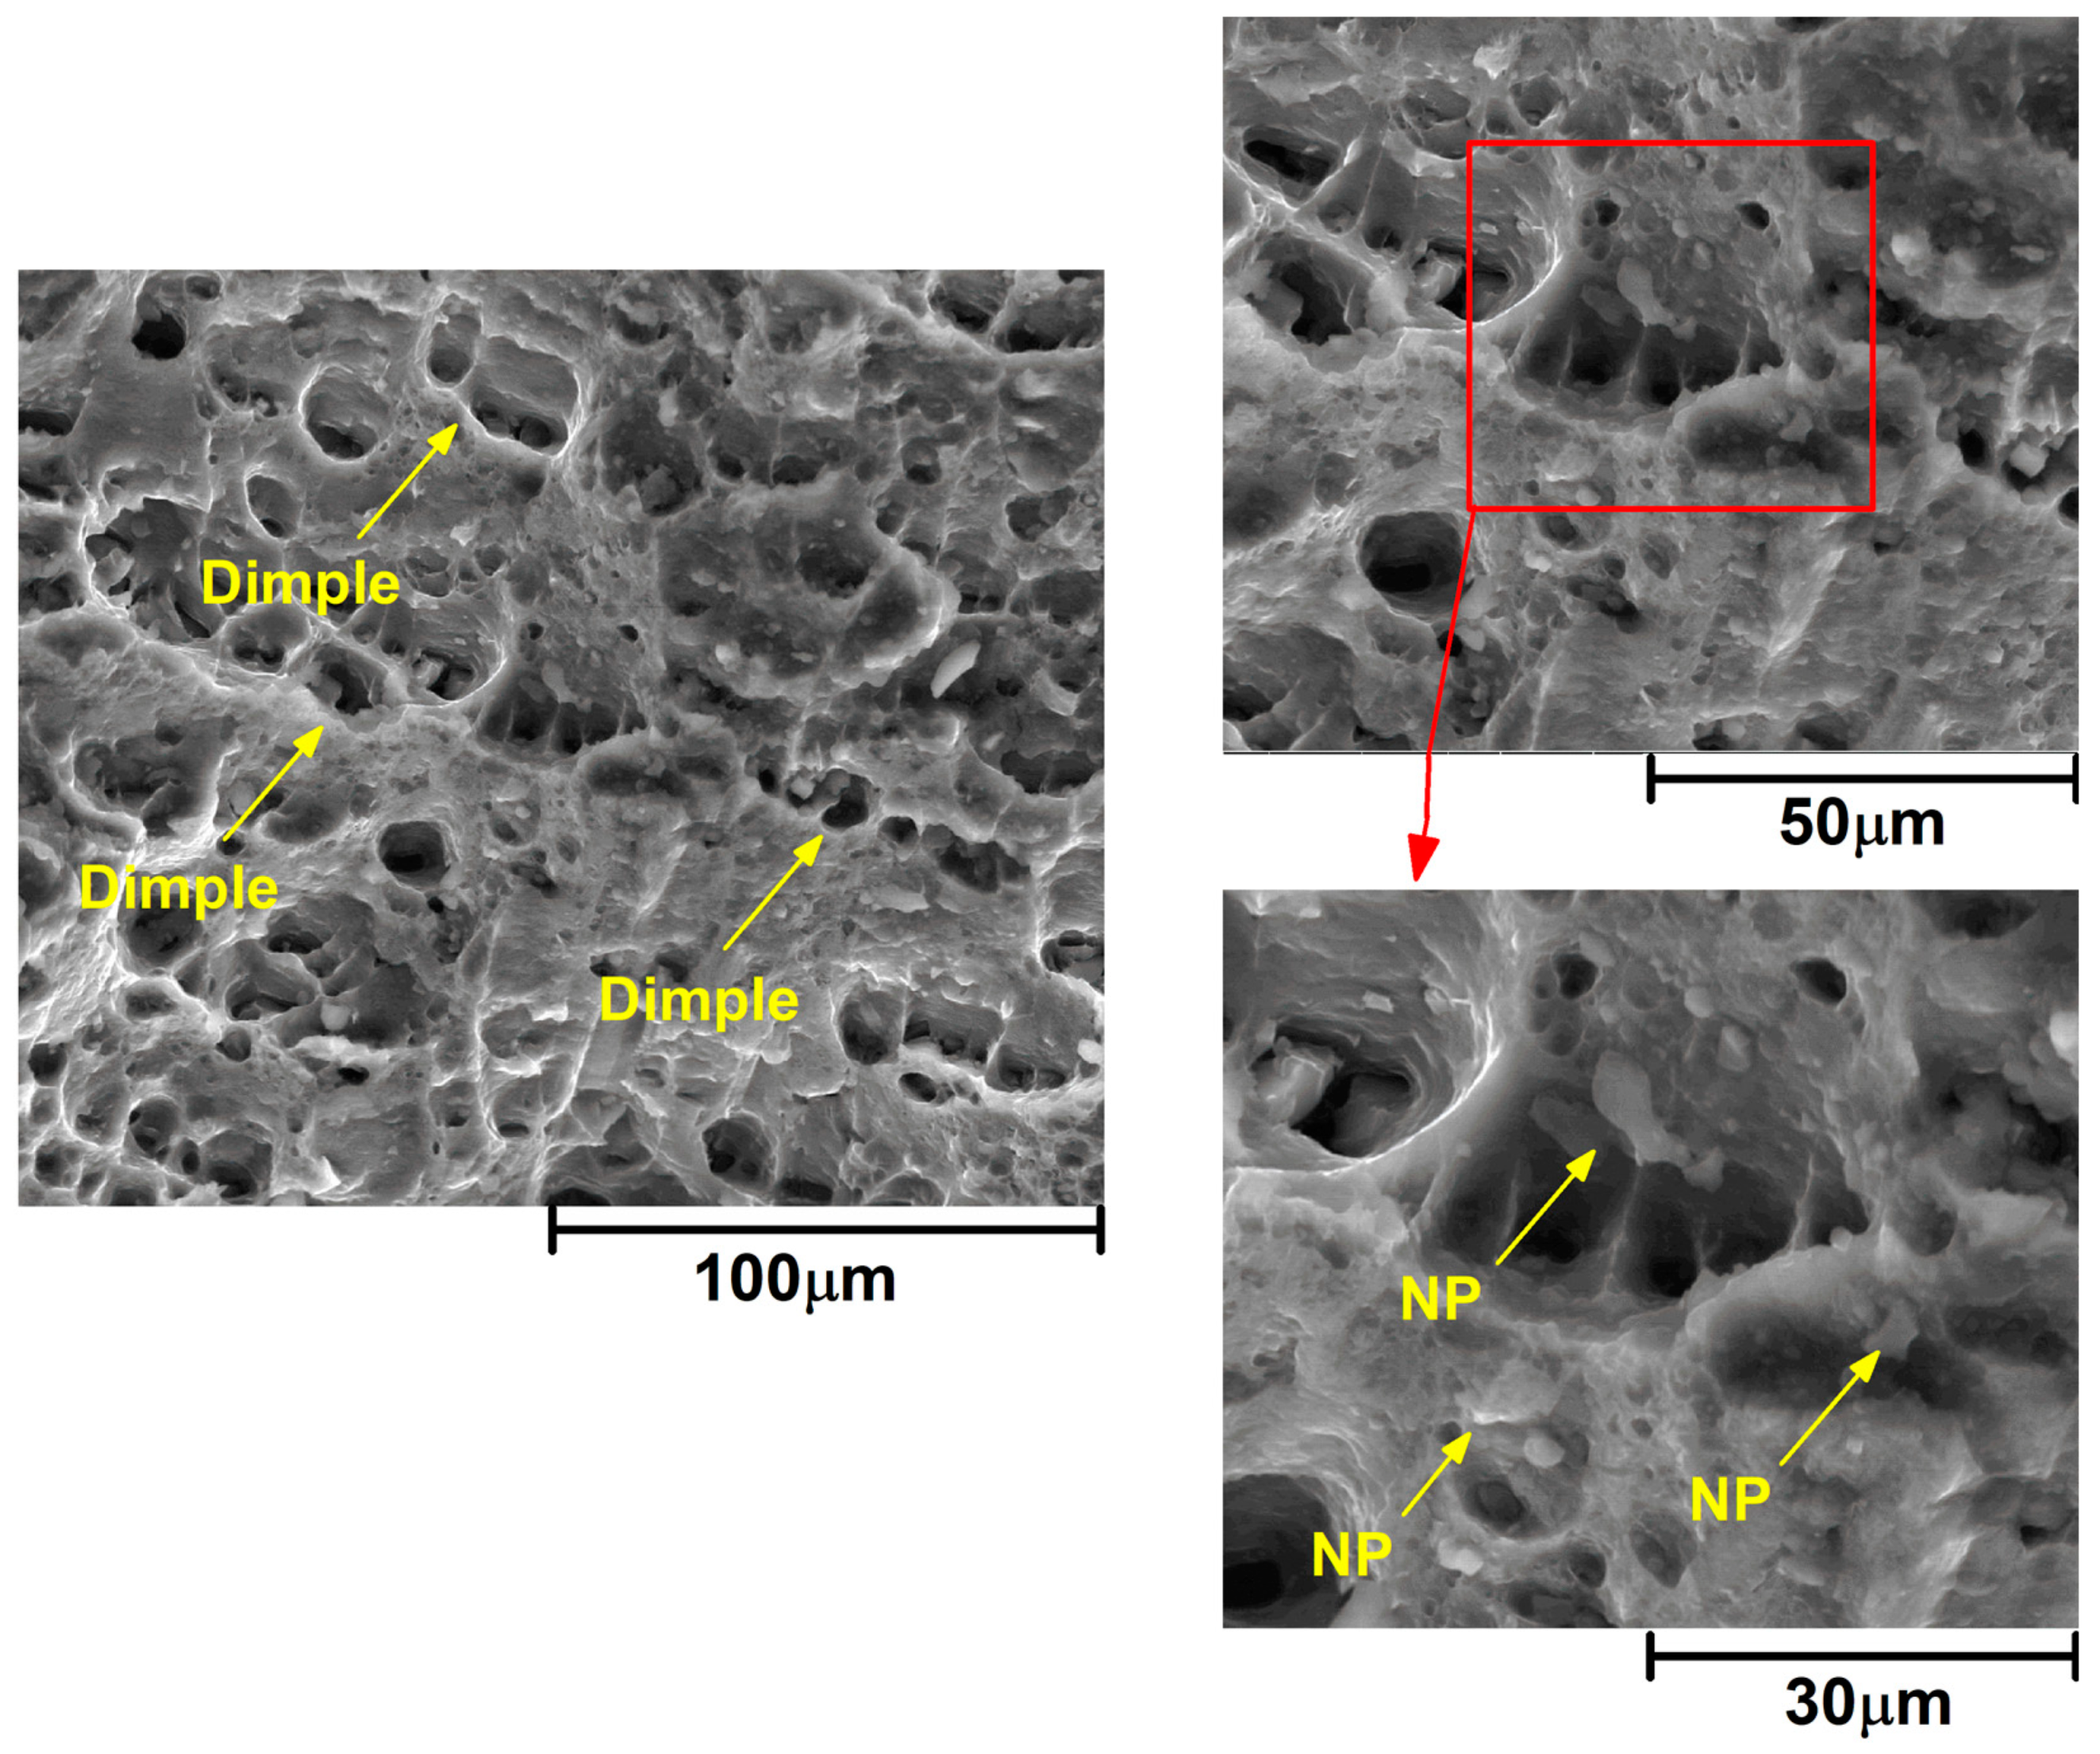
The examination of the fracture surfaces using SEM provided valuable insights into the failure mechanisms and microstructural features of the produced nanocomposite samples, particularly sample C3, which exhibited the lowest UTS, and sample B2, which demonstrated the highest UTS. The SEM images from the fracture surface of sample C3 after the tensile test, as presented in Figure 11, revealed both low-magnification and high-magnification views. The low-magnification images provided an overview of the fracture surface, while the high-magnification images offered detailed insights into the microstructural features. Very small dimples with an irregular pattern observed on the fracture surface indicated a ductile fracture type, suggesting plastic deformation and energy absorption during the failure process. Moreover, high-magnification SEM images revealed the presence of agglomerated Al2O3 nanoparticles inside the dimples, indicating strong bonding between the nanoparticles and the aluminum alloy matrix. The presence of these agglomerated nanoparticles suggests that they may have served as crack initiation sites during the tensile test, influencing the fracture behavior and mechanical properties of the nanocomposite. Specifically, the agglomeration of nanoparticles may have compromised the uniform distribution of reinforcement within the matrix, leading to localized stress concentrations and reduced tensile strength. The observed agglomeration of Al2O3 nanoparticles at the interface of dimples may be attributed to the high rotational velocity during the friction stir processing, which promotes intense stirring action of the aluminum matrix and nanoparticles. Instead of uniformly dispersing throughout the stir zone, the nanoparticles agglomerated, potentially diminishing the effectiveness of reinforcement and adversely affecting the mechanical properties of the produced nanocomposite.
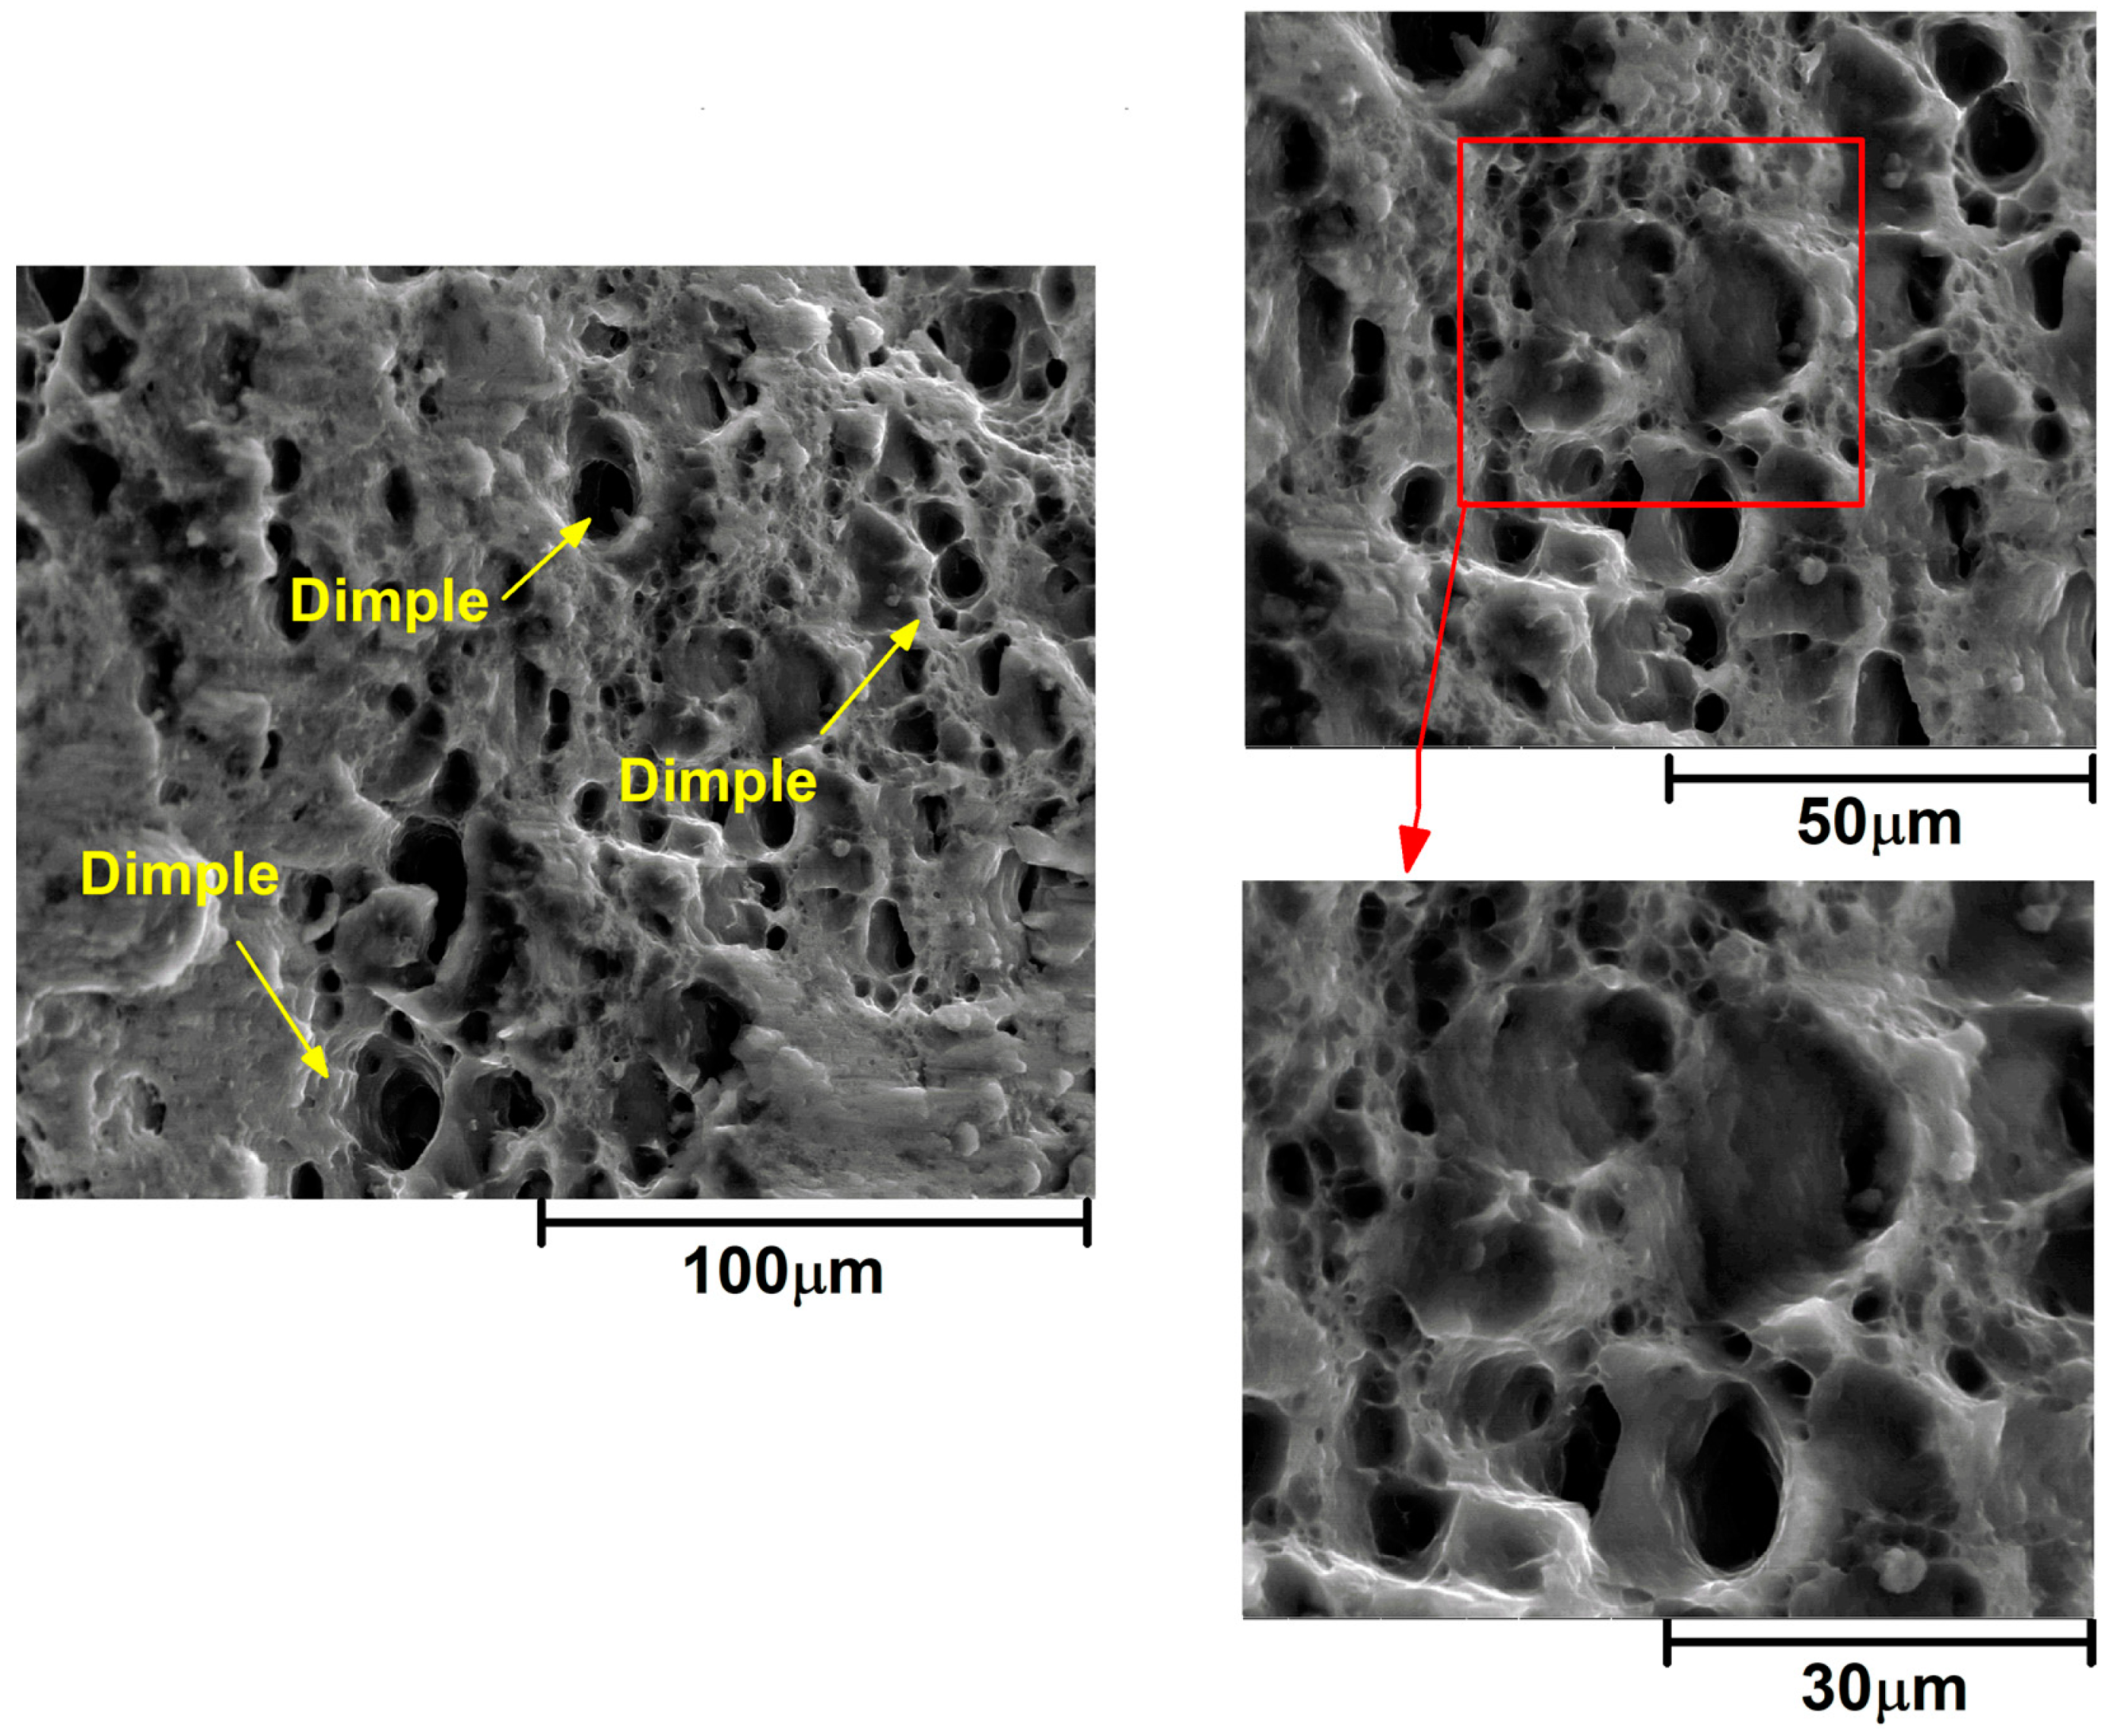
Interestingly, the presence of nanoparticles within the dimples suggests that they did not adversely affect crack initiation and growth during the tensile test. Instead, the aluminum matrix ruptured during the test, leaving the nanoparticles embedded within the fracture surface. This observation indicates that the nanoparticles may have reinforced the aluminum matrix, contributing to improved mechanical properties. The effectiveness of nanoparticle reinforcement may be attributed to the appropriate stirring action achieved at the 1280 rpm tool rotational velocity, which facilitated uniform dispersion of nanoparticles within the stir zone. This uniform distribution likely contributed to enhanced mechanical properties and minimized stress concentrations within the material (in Figure 12).

3.5. Hardness Analysis

The hardness analysis provided valuable insights into the material properties of the produced nanocomposite samples, with the results presented in 
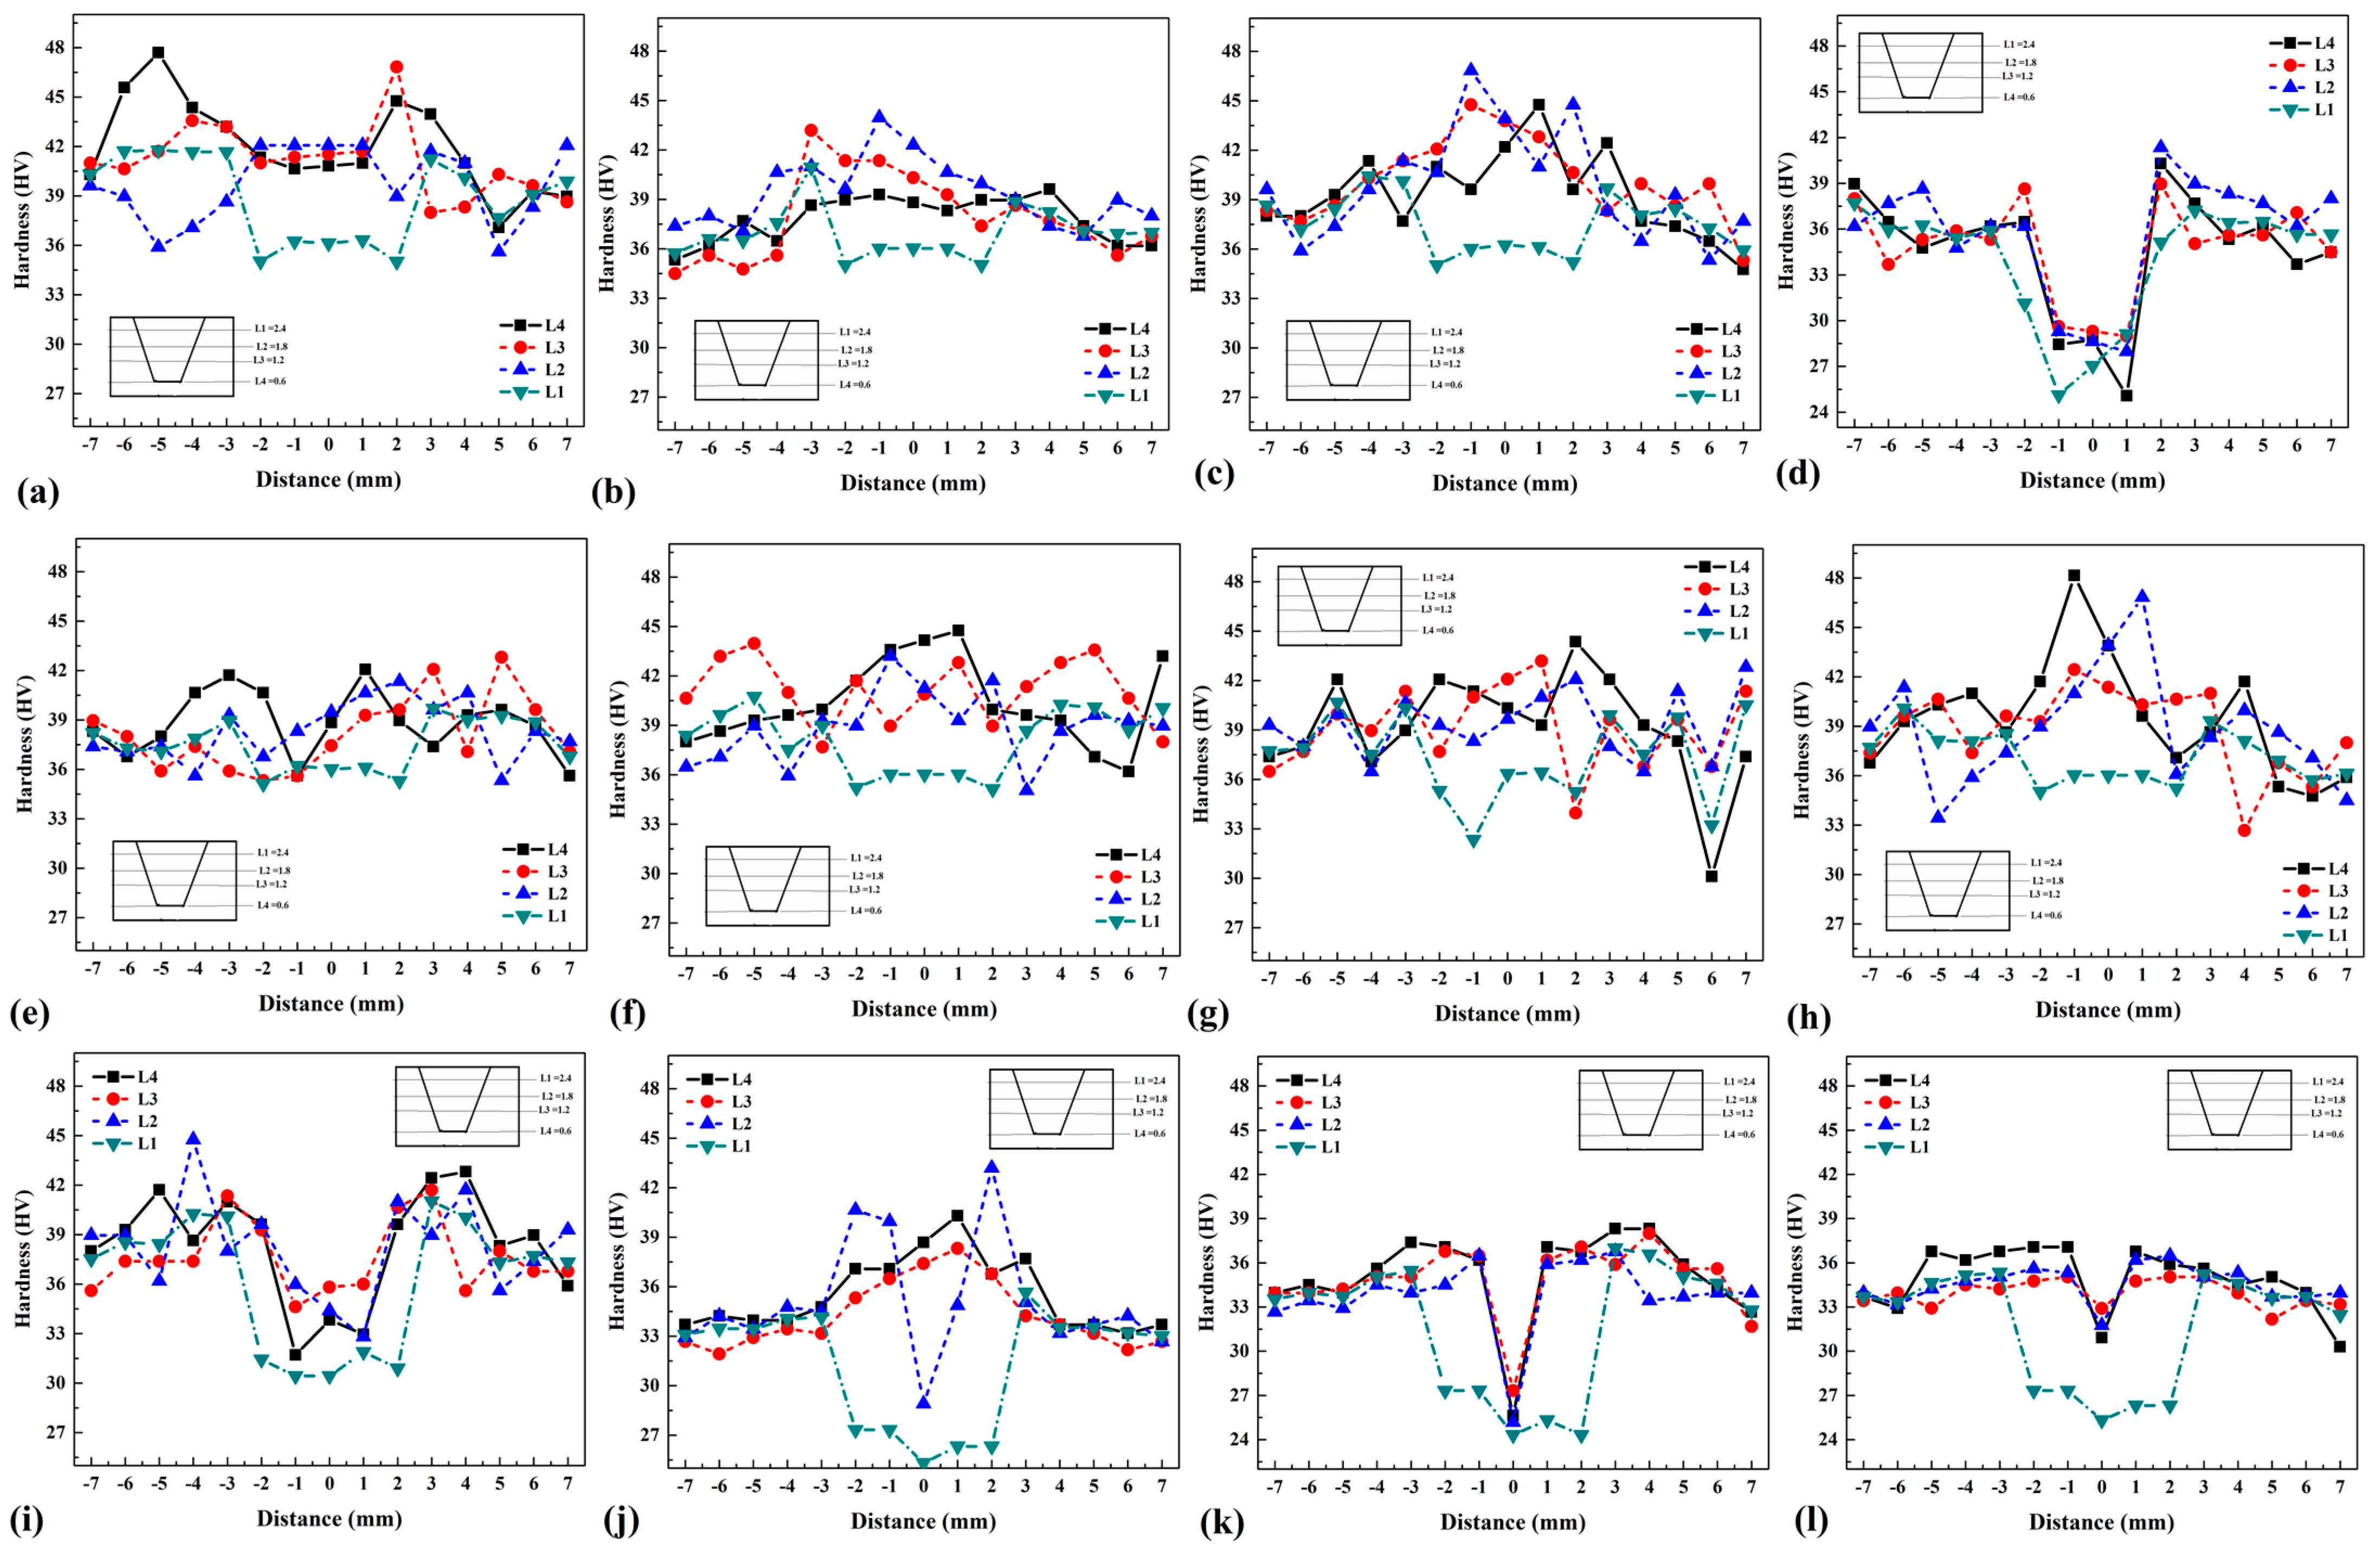
Figure 13. Each sample was divided into four sections, with hardness measurements taken at incremental depths from the bottom of the aluminum matrix. The hardness values of different sections were denoted as L4, L3, L2, and L1, corresponding to depths of 0.6 mm, 1.2 mm, 1.8 mm, and 2.4 mm, respectively, from the bottom of the processed surface. This approach enabled the evaluation of hardness variation across different depths within the nanocomposite structure. Hardness measurements were conducted using the Vickers hardness method, facilitating a precise characterization of material hardness. Figure 13a–d present the hardness profiles of samples A0, A1, A2, and A3, respectively, across the joint line from the retreating side (−7 mm) to the advancing side (+7 mm). The results indicate that the average hardness at the center of the stir zone varied among the samples, with values of 40 HV, 41 HV, 43 HV, and 29 HV for samples A0, A1, A2, and A3, respectively. An inverse relationship was observed between FSP tool rotational velocity and SZ hardness, with increasing velocity correlating with decreased hardness. Similarly, for B-series samples (Figure 13e–h), average hardness values at the center of the SZ were 39 HV, 42 HV, 43 HV, and 42 HV for samples B0, B1, B2, and B3, respectively. The results highlighted the highest hardness in sample B2, corresponding to the highest UTS observed in this series. In contrast, C-series samples (Figure 13i–l) exhibited lower hardness values, with average readings of 29 HV, 33 HV, 24 HV, and 28 HV for samples C0, C1, C2, and C3, respectively. These findings indicate a detrimental effect of nanopowder addition on hardness, resulting in softening of the nanocomposite material. The hardness analysis revealed variations in material hardness across different processing conditions, with higher rotational velocities leading to decreased hardness in the SZ. The highest hardness was observed in B-series samples, correlating with the highest UTS values in this series, underscoring the importance of hardness in determining the mechanical properties of the nanocomposite.

4. Conclusions

This study investigates the influence of friction stir processing (FSP) parameters and the addition of Al2O3 nanopowder in the fabrication of aluminum alloy nanocomposites utilizing blind holes. The key findings are summarized as follows:
  • The temperature depended on the amount of nanopowder (hole size) and the FSP tool speed. Heat generation was maximized with a 1 mm hole diameter at a rotational speed of 1280 rpm (223.3 °C), while minimum heat production occurred with a 2 mm hole diameter at a rotational speed of 910 rpm (185.3 °C).
  • Lower tool rotational velocities, especially without the inclusion of Al2O3 nanopowder, led to smoother surface finishes. Conversely, combinations of low rotational velocities and a 2 mm hole diameter resulted in the formation of pronounced ripple structures, indicative of rougher surface textures.
  • Analysis revealed that both tool rotation and hole diameter directly impacted the size of the SZ and HAZ. The SZ area ranged from 11 mm2 (sample B0) to 16 mm2 (sample C1), with the largest SZ area observed in sample B0. The presence of nanopowder increased the viscosity of the SZ and decreased the width of the HAZ area.
  • The contour plot of the ultimate tensile strength (UTS) exhibited peak values between 1200 to 1400 rpm and hole diameters ranging from 1.2 to 1.6, indicating optimal welding conditions for achieving high UTS values. The results show that the maximum UTS was obtained in the B2 sample (567 MPa), and the minimum UTS was obtained in the C3 sample (459 MPa).
  • The nanopowder alters the hardness of the SZ. Based on the results, the high concentration of Al2O3 at the top area of the SZ results in the formation of a region with higher hardness. The highest and lowest hardness values observed in the SZ area were 42 HV and 28 HV, respectively.

Author Contributions

Conceptualization, M.M.M., M.E.A., M.N.M.R., A.K. and H.A.D.; methodology, M.M.M., M.E.A. and M.N.M.R.; software, M.M.M., M.E.A. and M.N.M.R.; validation, M.M.M., M.E.A., M.N.M.R., A.K. and H.A.D.; formal analysis, M.M.M., M.E.A. and M.N.M.R.; investigation, M.M.M., M.E.A. and M.N.M.R.; resources, M.M.M., M.E.A., M.N.M.R., A.K. and H.A.D.; writing—original draft preparation, M.M.M., M.E.A., M.N.M.R., A.K. and H.A.D.; writing—review and editing, M.M.M., M.E.A., M.N.M.R., A.K. and H.A.D.; supervision, M.E.A. and H.A.D. Please turn to the CRediT taxonomy for term explanations. All authors have read and agreed to the published version of the manuscript.

Funding

This research received no external funding.

Data Availability Statement

No new data were created or analyzed in this study. Data sharing is not applicable to this article.

Acknowledgments

The researchers would like to thank and show their appreciation to the technical staff, Faculty of Technology and Education, Beni-Suef University, Egypt.

Conflicts of Interest

The authors declare no conflicts of interest.

References

  1. ShivaKumar, G.N.; Rajamurugan, G. Understanding the effect of particle reinforcement on friction stir weldment: A review. Proc. Inst. Mech. Eng. Part L J. Mater. Des. Appl. 2023, 237, 1231–1250. [Google Scholar] [CrossRef]
  2. Ghiasvand, A.; Ranjbarnodeh, E.; Mirsalehi, S.E. The microstructure and mechanical properties of single-pass and double-pass lap joint of Al 5754H-11 and Mg AZ31-O alloys by friction stir welding. J. Mater. Res. Technol. 2023, 23, 6023–6038. [Google Scholar] [CrossRef]
  3. Khalili, M.; Eivani, A.R.; Seyedein, S.H.; Jafarian, H.R. The effect of multi-pass friction stir processing on microstructure and mechanical properties of dual-phase brass alloy. J. Mater. Res. Technol. 2022, 21, 1177–1195. [Google Scholar] [CrossRef]
  4. ShivaKumar, G.N.; Rajamurugan, G. Significance of FSW process parameters and tialite particle reinforcement at the weld zone of AA6082 alloy. Mater. Lett. 2023, 353, 135289. [Google Scholar] [CrossRef]
  5. Raja, S.; Muhamad, M.R.; Jamaludin, M.F.; Yusof, F. A review on nanomaterials reinforcement in friction stir welding. J. Mater. Res. Technol. 2020, 9, 16459–16487. [Google Scholar] [CrossRef]
  6. Arokiasamy, S.; Anand Ronald, B. Enhanced properties of Magnesium based metal matrix composites via Friction Stir Processing. Mater. Today Proc. 2018, 5, 6934–6939. [Google Scholar] [CrossRef]
  7. Wu, B.; Ibrahim, M.Z.; Raja, S.; Yusof, F.; Razak, B.B.A.; Bin Muhamad, M.R.; Huang, R.; Zhang, Y.; Badruddin, I.A.; Hussien, M.; et al. The influence of reinforcement particles friction stir processing on microstructure, mechanical properties, tribological and corrosion behaviors: A review. J. Mater. Res. Technol. 2022, 20, 1940–1975. [Google Scholar] [CrossRef]
  8. Mehdi, H.; Mishra, R.S. Modification of Microstructure and Mechanical Properties of AA6082/ZrB2 Processed by Multipass Friction Stir Processing. J. Mater. Eng. Perform. 2023, 32, 285–295. [Google Scholar] [CrossRef]
  9. Hashmi, A.W.; Mehdi, H.; Mishra, R.S.; Mohapatra, P.; Kant, N.; Kumar, R. Mechanical Properties and Microstructure Evolution Of AA6082/Sic Nanocomposite Processed by Multi-Pass FSP. Trans. Indian Inst. Met. 2022, 75, 2077–2090. [Google Scholar] [CrossRef]
  10. Thakur, A.; Sharma, V.; Bhadauria, S.S. Investigation of metallurgical characterization and mechanical properties of double-sided friction stir welding of aluminum 6061 T6 alloy. Proc. Inst. Mech. Eng. Part B J. Eng. Manuf. 2022, 237, 16–30. [Google Scholar] [CrossRef]
  11. Thankachan, T.; Prakash, K.S.; Kavimani, V. Investigating the effects of hybrid reinforcement particles on the microstructural, mechanical and tribological properties of friction stir processed copper surface composites. Compos. Part B Eng. 2019, 174, 107057. [Google Scholar] [CrossRef]
  12. Sharma, V.; Prakash, U.; Kumar, B.V.M. Surface composites by friction stir processing: A review. J. Mater. Process. Technol. 2015, 224, 117–134. [Google Scholar] [CrossRef]
  13. Ata, M.H.; Abdel-Gaber, G.T.; Elkady, O.; Fathy, M.; Abu–Okail, M. An Investigation on microstructural and mechanical properties of an innovative hybrid AA1050/Ni-Cu-Fe via mechanical alloying and friction stir processing. CIRP J. Manuf. Sci. Technol. 2022, 39, 372–386. [Google Scholar] [CrossRef]
  14. Parumandla, N.; Adepu, K. Effect of Al2O3 and SiC nano reinforcements on microstructure, mechanical and wear properties of surface nanocomposites fabricated by friction stir processing. Mater. Sci. 2018, 24, 338–344. [Google Scholar] [CrossRef]
  15. Mehdi, H.; Mishra, R.S. Effect of multi-pass friction stir processing and SiC nanoparticles on microstructure and mechanical properties of AA6082-T6. Adv. Ind. Manuf. Eng. 2021, 3, 100062. [Google Scholar] [CrossRef]
  16. Bevilacqua, M.; Ciarapica, F.E.; D’Orazio, A.; Forcellese, A.; Simoncini, M. Sustainability Analysis of Friction Stir Welding of AA5754 Sheets. Procedia CIRP 2017, 62, 529–534. [Google Scholar] [CrossRef]
  17. Liu, S.; Paidar, M.; Oladimeji Ojo, O.; Poková, M.Š.; Mehrez, S.; Zain, A.M.; Zhao, Q.; Wang, J. Friction stir processing of hybridized AZ31B magnesium alloy-based composites by adding CeO2 and ZrO2powders: Mechanical, wear, and corrosion behaviors. J. Mater. Res. Technol. 2023, 24, 1949–1972. [Google Scholar] [CrossRef]
  18. Li, B.; Shen, Y.; Luo, L.; Hu, W. Fabrication of TiCp/Ti–6Al–4V surface composite via friction stir processing (FSP): Process optimization, particle dispersion-refinement behavior and hardening mechanism. Mater. Sci. Eng. A 2013, 574, 75–85. [Google Scholar] [CrossRef]
  19. Kumar, A.; Singh, V.P.; Nirala, A.; Singh, R.C.; Chaudhary, R.; Mourad, A.-H.I.; Sahoo, B.K.; Kumar, D. Influence of tool rotational speed on mechanical and corrosion behaviour of friction stir processed AZ31/Al2O3 nanocomposite. J. Magnes. Alloy. 2023, 11, 2585–2599. [Google Scholar] [CrossRef]
  20. Myśliwiec, P.; Kubit, A.; Derazkola, H.A.; Szawara, P.; Slota, J. Feasibility study on dissimilar joint between Alclad AA2024–T3 and DC04 steel by friction stir welding. Mater. Today Commun. 2024, 38, 108167. [Google Scholar] [CrossRef]
  21. Derazkola, H.A.; Kubit, A. Thermal analysis of revolution pitch effects on friction stir welding of polypropylene. Int. J. Adv. Manuf. Technol. 2024, 130, 1421–1437. [Google Scholar] [CrossRef]
  22. Derazkola, H.A.; Elyasi, M. Cooling-assist friction stir welding: A case study on AA6068 aluminum alloy and copper joint. Proc. Inst. Mech. Eng. Part B J. Eng. Manuf. 2023, 09544054231209779. [Google Scholar] [CrossRef]
  23. Elyasi, M.; Khoram, D.; Aghajani Derazkola, H.; Mirnia, M.J. Effects of process parameters on properties of friction stir additive manufactured copper. Int. J. Adv. Manuf. Technol. 2023, 127, 5651–5664. [Google Scholar] [CrossRef]
  24. Khalaf, H.I.; Al-Sabur, R.; Derazkola, H.A. Effect of number of tool shoulders on the quality of steel to magnesium alloy dissimilar friction stir welds. Arch. Civ. Mech. Eng. 2023, 23, 125. [Google Scholar] [CrossRef]
Figure 1. (a) SEM image and (b) XRD results of Al2O3 particles.
Jmmp 08 00058 g001
Figure 2. (a) Drilling holes on aluminum matrix, (b) Al2O3 powder placements in aluminum matrix, and (c) used FSP tool.
Jmmp 08 00058 g002
Figure 3. Thermo-visual camera results of various samples’ thermal history.
Jmmp 08 00058 g003
Figure 4. Thermal history results of (a) A samples, (b) B samples, and (c) C samples.
Jmmp 08 00058 g004
Figure 5. Surface flow of FSP samples.
Jmmp 08 00058 g005
Figure 6. Relation between tool rotational speed, hole diameter, and ripples.
Jmmp 08 00058 g006
Figure 7. Internal flow of FSP-treated sample.
Jmmp 08 00058 g007
Figure 8. Relation between tool rotational speed and hole diameter with (a) SZ and (b) HAZ of samples.
Jmmp 08 00058 g008
Figure 9. Relation between tool rotational speed and hole diameter with (a) UTS and (b) elongation of samples.
Jmmp 08 00058 g009
Figure 10. Fracture location of FSP samples after the tensile test.
Jmmp 08 00058 g010
Figure 11. SEM image from fracture surface of C3 sample after tensile test.
Jmmp 08 00058 g011
Figure 12. SEM image from fracture surface of B2 sample after tensile test.
Jmmp 08 00058 g012
Figure 13. Hardness profile of samples (a) A0, (b) A1, (c) A2, (d) A3, (e) B0, (f) B1, (g) B2, (h) B3, (i) C0, (j) C1, (k) C2, and (l) C3.
Jmmp 08 00058 g013
Table 1. Chemical composition of aluminum alloy matrix.
ElementCuFeMnMgSiZnCrTiAl
Wt.%0.10.40.52.6 to 3.60.40.20.30.15Remainder
Table 2. Mechanical properties of aluminum alloy matrix.
Property Value
Proof stress (0.2%)267 MPa
UTS463 MPa
E%35
Strength coefficient (K)1096 MPa
Strain hardening exponent (n)0.39
Hardness (Vickers) (HV)37 ± 2
Table 3. Sample names and test conditions.
Tool Speed Sample NameConditionTotal Nanopowder Amount (g)
910 rpmA0Processing without powder0
910 rpmA1Hole diameter 1 mm0.06983
910 rpmA2Hole diameter 1.5 mm0.157118
910 rpmA3Hole diameter 2 mm0.279321
1280 rpmB0Processing without powder0
1280 rpmB1Hole diameter 1 mm0.06983
1280 rpmB2Hole diameter 1.5 mm0.157118
1280 rpmB3Hole diameter 2 mm0.279321
1700 rpmC0Processing without powder0
1700 rpmC1Hole diameter 1 mm0.06983
1700 rpmC2Hole diameter 1.5 mm0.157118
1700 rpmC3Hole diameter 2 mm0.279321
Table 4. Average ripple distances.
SampleAverage Ripples (µm)
A0188.181
A1174.649
A2316.046
A3449.546
B0321.266
B1226.45
B2370.792
B3261.99
C0203.697
C1309.761
C2233.859
C3177.243
Table 5. UTS and elongation of FSP samples.
SampleRotational Speed (rpm)UTS (MPa)E%
A091047131
A191048431
A291050730
A391049517
B0128046728
B1128053433
B2128056727
B3128050131
C0170050931
C1170050020
C2170049026
C3170045930
Disclaimer/Publisher’s Note: The statements, opinions and data contained in all publications are solely those of the individual author(s) and contributor(s) and not of MDPI and/or the editor(s). MDPI and/or the editor(s) disclaim responsibility for any injury to people or property resulting from any ideas, methods, instructions or products referred to in the content.

