Article

Simulation and Analysis of Thermal Insulators Applied to Post-Disaster Temporary Shelters in Tropical Countries

by
Bruno B. F. da Costa
1,*,
Caio F. P. Silva
2,
Ana Carolina F. Maciel
2,
Herson D. P. Cusi
3,
Gladys Maquera
3 and
Assed N. Haddad
1,*
1
Universidade Federal do Rio de Janeiro, Rio de Janeiro 21941-901, Brazil
2
Universidade Federal de Uberlândia, Uberlândia 38400-902, Brazil
3
Universidad Peruana Unión, Juliaca 21100, Peru
*
Authors to whom correspondence should be addressed.
Designs 2023, 7(3), 64; https://doi.org/10.3390/designs7030064
Submission received: 28 March 2023 / Revised: 17 April 2023 / Accepted: 24 April 2023 / Published: 9 May 2023
(This article belongs to the Special Issue Sustainable Design in Building and Urban Environment)

Abstract

:
Containers are fundamental elements for the development of international trade; however, it is estimated that there are more than 17 million retired containers stacked in ports around the world. Considering the high costs involved in the process of storing, transporting, or destroying these materials, in addition to their non-degradable nature, it is urgent to develop strategies for the sustainable use of these decommissioned containers. In this context, repurposing these containers into permanent structures is becoming a predominant trend. One solution is converting steel shipping structures into habitable spaces. However, due to the urgency with which Container Houses (CHs) are demanded in case of disasters, they are usually planned to be built as quickly as possible, serving as many people as possible, and do not consider the basic principles of energy efficiency. The performance of the CHs is, then, impaired, including risks of overheating, corrosion, and rust, among others, during service, making them an even more stressful experience for their users who are already in a vulnerable situation. Therefore, the objective of this study is to compare the performance of two thermal insulators applied to a temporary shelter container designed to promptly serve vulnerable populations. The model was developed in Building Information Modeling (BIM) software and simulated in Building Energy Simulation (BES) software, aiming to obtain subsidies for its technical and economic viability analysis. The results indicated that thermal insulators are able to generate significant savings in energy consumption, with mineral wool presenting better long-term performance.

1. Introduction

Every year, a surprising amount of people are forced to leave their homes in search of shelter and protection due to natural disasters. According to the Norwegian Refugee Council [1], in the year 2021 alone, 23.7 million people were affected by all kinds of geophysical and climatic catastrophes, such as earthquakes, volcanic eruptions, landslides, storms, floods, wildfires, droughts, and extreme temperature events. However, contrary to the unpredictable nature of climatic events, there is a constant increase in the occurrence of armed conflicts, political persecution, and other types of violence around the world, causing a significant rise in the number of people who move to preserve their lives [2]. Last year alone, 14.4 million people were displaced due to violence, the highest number over the past ten years. Thus, in 2021, adding natural and anthropogenic causes, 38 million refugees were accounted for, in 141 countries, with an estimated financial cost of around 21 billion dollars [1].
Indeed, the economic impact of this exodus is relevant, but the social and humanitarian damage is inestimable. Refugees are often forced to move with minimal resources, depending on all sorts of emergency aid, especially food, medicine, and shelter [2]. They are entire families who have no choice but to leave their cities, their jobs, and their lives. In this context, considering that the majority of those affected reside in underdeveloped countries where resources are already scarce, the situation becomes even more critical. According to [1], 74.7% of all displacements throughout 2021 were concentrated in Sub-Saharan Africa and the East Asia and Pacific regions, followed by South Asia. In these areas alone, there are over 34 million homeless people. Therefore, providing temporary shelter is a priority [3,4].
However, due to the urgency with which they are demanded, these shelters are usually provided in a rudimentary way with people being allocated to any available covered area, such as sports facilities, churches, or hangars. These places, in addition to not offering adequate basic infrastructure, steal the privacy of families who are compelled to sleep, store their belongings, clean themselves, and live with unknown people. In turn, in cases where international humanitarian aid is provided and where victims are taken to relief camps, the most used shelter structures are tents. This is an interesting and worthy option since families often own a private space. On the other hand, this type of structure, despite offering the minimum necessary protection, lacks comfort, and appears to be a campsite not a building. As a result, the feeling of protection against adverse thermal effects, strong winds, and suffocating dust, among others, is impaired. In this context, the use of shipping containers as temporary post-disaster shelters has drawn the attention of specialists in recent years [2,4,5,6].
Shipping containers compose the core of the world’s cargo transportation system [7]. However, the rapid dissemination of this type of structure has always presented challenges regarding the sustainability of the logistic model used [8]. This is mainly because the lifecycle of containers is generally not constrained by their effective lifespan but rather by logistical constraints.
The beginning of the export process occurs when the container is put into operation when it is sent empty to the exporter (Figure 1). The cargo is then accommodated and the container is transported to the port of origin. After the maritime transit stage, the container is unloaded at the port of destination and forwarded to the importer’s warehouse. After the completion of unloading, the empty container is transported back to the port terminal. At this point, the operator faces a dilemma. Upon arriving empty at the port, the container is stored awaiting return freight or round trip. The purpose of the last one is to use the containers disembarking at the port of destination for the export of other cargo after delivery to the final customer so that the containers do not return empty to the port of origin. Nevertheless, in recent years, there has been a significant slowdown in the flow of maritime transport [9] so making round trips is no longer so trivial. In this case, if it is impossible to reuse the container in a round trip, it must be returned empty to the port of origin. Yet, since the cost of retrieving empty containers back to their origin is almost as costly as moving a fully loaded container [7], it is too expensive and manufacturing new containers is considered more economical [10].
This strategic decision has contributed to the increase in the number of unused containers stored in seaports [11], causing problems associated with the allocation of space and requiring a great effort for their reallocation [9]. Currently, it is estimated that there are tens of millions of retired containers in ports around the world [8,12]. On the other hand, manufacturing new units does not eliminate the need to end the life cycle of out-of-service containers and, in this context, there are basically two options available. The first and most obvious is recycling, given the non-degradable nature of steel [11,12]. However, melting and remanufacturing the standard 3.63 ton container requires 8000 kWh of electrical energy [13,14,15], so this is not the most sustainable option. Thus, the second and most recent option has been the attempt to find new market niches in which these elements can be reused. Container housing is one of the most promising [9].
Shipping container buildings benefit from the intrinsic characteristics of modular construction [12] being economical and fast to build [16]. Furthermore, as they are made of corten steel alloy or weathered steel, the containers are highly resistant and durable, once they are designed to withstand many years in the salt air and spray on the ocean [17]. Nevertheless, regarding Container Houses (CH) for temporary shelters, portability is the most important feature of this system. In other words, the ease and speed with which they can be transported to the places where they are needed [6], providing immediate assistance to the victims. However, although the use of containers as buildings is not a recent concept, there is a gap in the technical literature available on the subject, especially concerning to their use as temporary shelters [14,16].
In fact, the technique has already been used successfully in countries, such as Korea, Japan, China, and Turkey to build relief camps for refugees and displaced populations [13]. Nonetheless, due to the urgency with which CHs are demanded in case of disasters, they are usually planned to be built as quickly as possible, serving as many people as possible, and not considering basic principles of comfort and sustainability [2]. The performance of the CHs is then impaired, including risks of overheating, corrosion, and rust, among others, during service, making them an even more stressful experience for their users who are already in a vulnerable situation.
Therefore, the objective of this study is the development of a novel standard Sustainable Container Housing (SCH) project, designed to promptly serve vulnerable populations with a focus on the analysis through computer simulation of the technical and economic viability of using two thermal insulators. The model will be developed in BIM software (Building Information Modeling) in order to allow the realization of thermo energetic simulation of the same, and the efficient survey of its cost, aiming to obtain subsidies for its technical and financial viability. It is proposed to obtain a versatile, cheap, and durable model, so that vulnerable populations can be promptly assisted in housing that, although temporary, allows them to live with dignity and comfort.

2. Theoretical Background

2.1. Modular Construction

Modular construction has become a trend in the last two decades [5,11], and the technologies associated with its application have evolved significantly in the construction industry [13]. Also known as volumetric construction, modular building system, or modular architecture [3,18], there is still no formal definition for the terminology. However, the analysis of recent studies indicates the evolution and convergence of meanings for the term. Chatzimichailidou and Ma [19] define modular construction as a process where the units are built off site and, then, transported and assembled on-site. This concept is congruent with Lacey et al. [20] and Musa et al. [18] which complement it, indicating that this is a technique applicable to volumetric units which generally constitute the building’s structural element. Ye et al. [21], Rakotonjanahary et al. [22], and Hong [3] go forward describing the components that compose the modular unit and that must be integrated in order to allow the transport of a complete module to the building installation site, that is, wall solutions, ceiling, frames, electrical and hydraulic installations, HVAC, and fixed furniture. Finally, Musa et al. [18] highlight the need to consider the logistical aspects as part of the modular construction process, as the use of the method only brings the expected results if executed in accordance with rigorous planning.
In this context, the increasing interest in the subject has generated an intense registration of the advantages of modular construction in the literature. Koke et al. [12] indicate that, when compared to the traditional construction method, modularization has a smaller environmental footprint. The information is confirmed by Cao et al. [23] who conclude that a traditional residential building consumes approximately 20% more energy and 36% more natural resources during construction. Bertolini and Guardigli [7] present positive environmental results regarding the use of modular elements in the construction industry through Life Cycle Analysis (LCA).
However, currently, the main benefits related to the use of modularization concern the greater productivity made possible by the system [11,24]. According to Jeong et al. [25], about 70% of the construction work for a modular unit is conducted off site, so little work is conducted during on-site assembly. As a result, most of the construction process can be carried out using the production line model, similar to that of the automobile industry, with well-defined workstations and less need for workers to move around the factory floor. This peculiarity, in addition to significantly reducing occupational risks [26], allows for optimizing internal finishing work and even facades, decreasing the construction schedule [20,21] as they are carried out in an industrial environment and not on the construction site which is subject to various adversities [22]. In addition, the use of specialized labor in a controlled environment favors a higher quality product delivery [18,21] and less waste generation [13,20].
Despite arousing great interest and the advantages of its use, the diffusion of modular construction has faced barriers [18]. Perhaps the most relevant is the difficulty in meeting the necessary technical criteria to guarantee user comfort and energy efficiency throughout its lifespan [12]. This is because the scope of modular construction is very broad, allowing the application of a wide variety of materials and construction techniques and making it difficult to develop comprehensive technical guides [20]. Among the various existing possibilities, the container house has stood out [11].

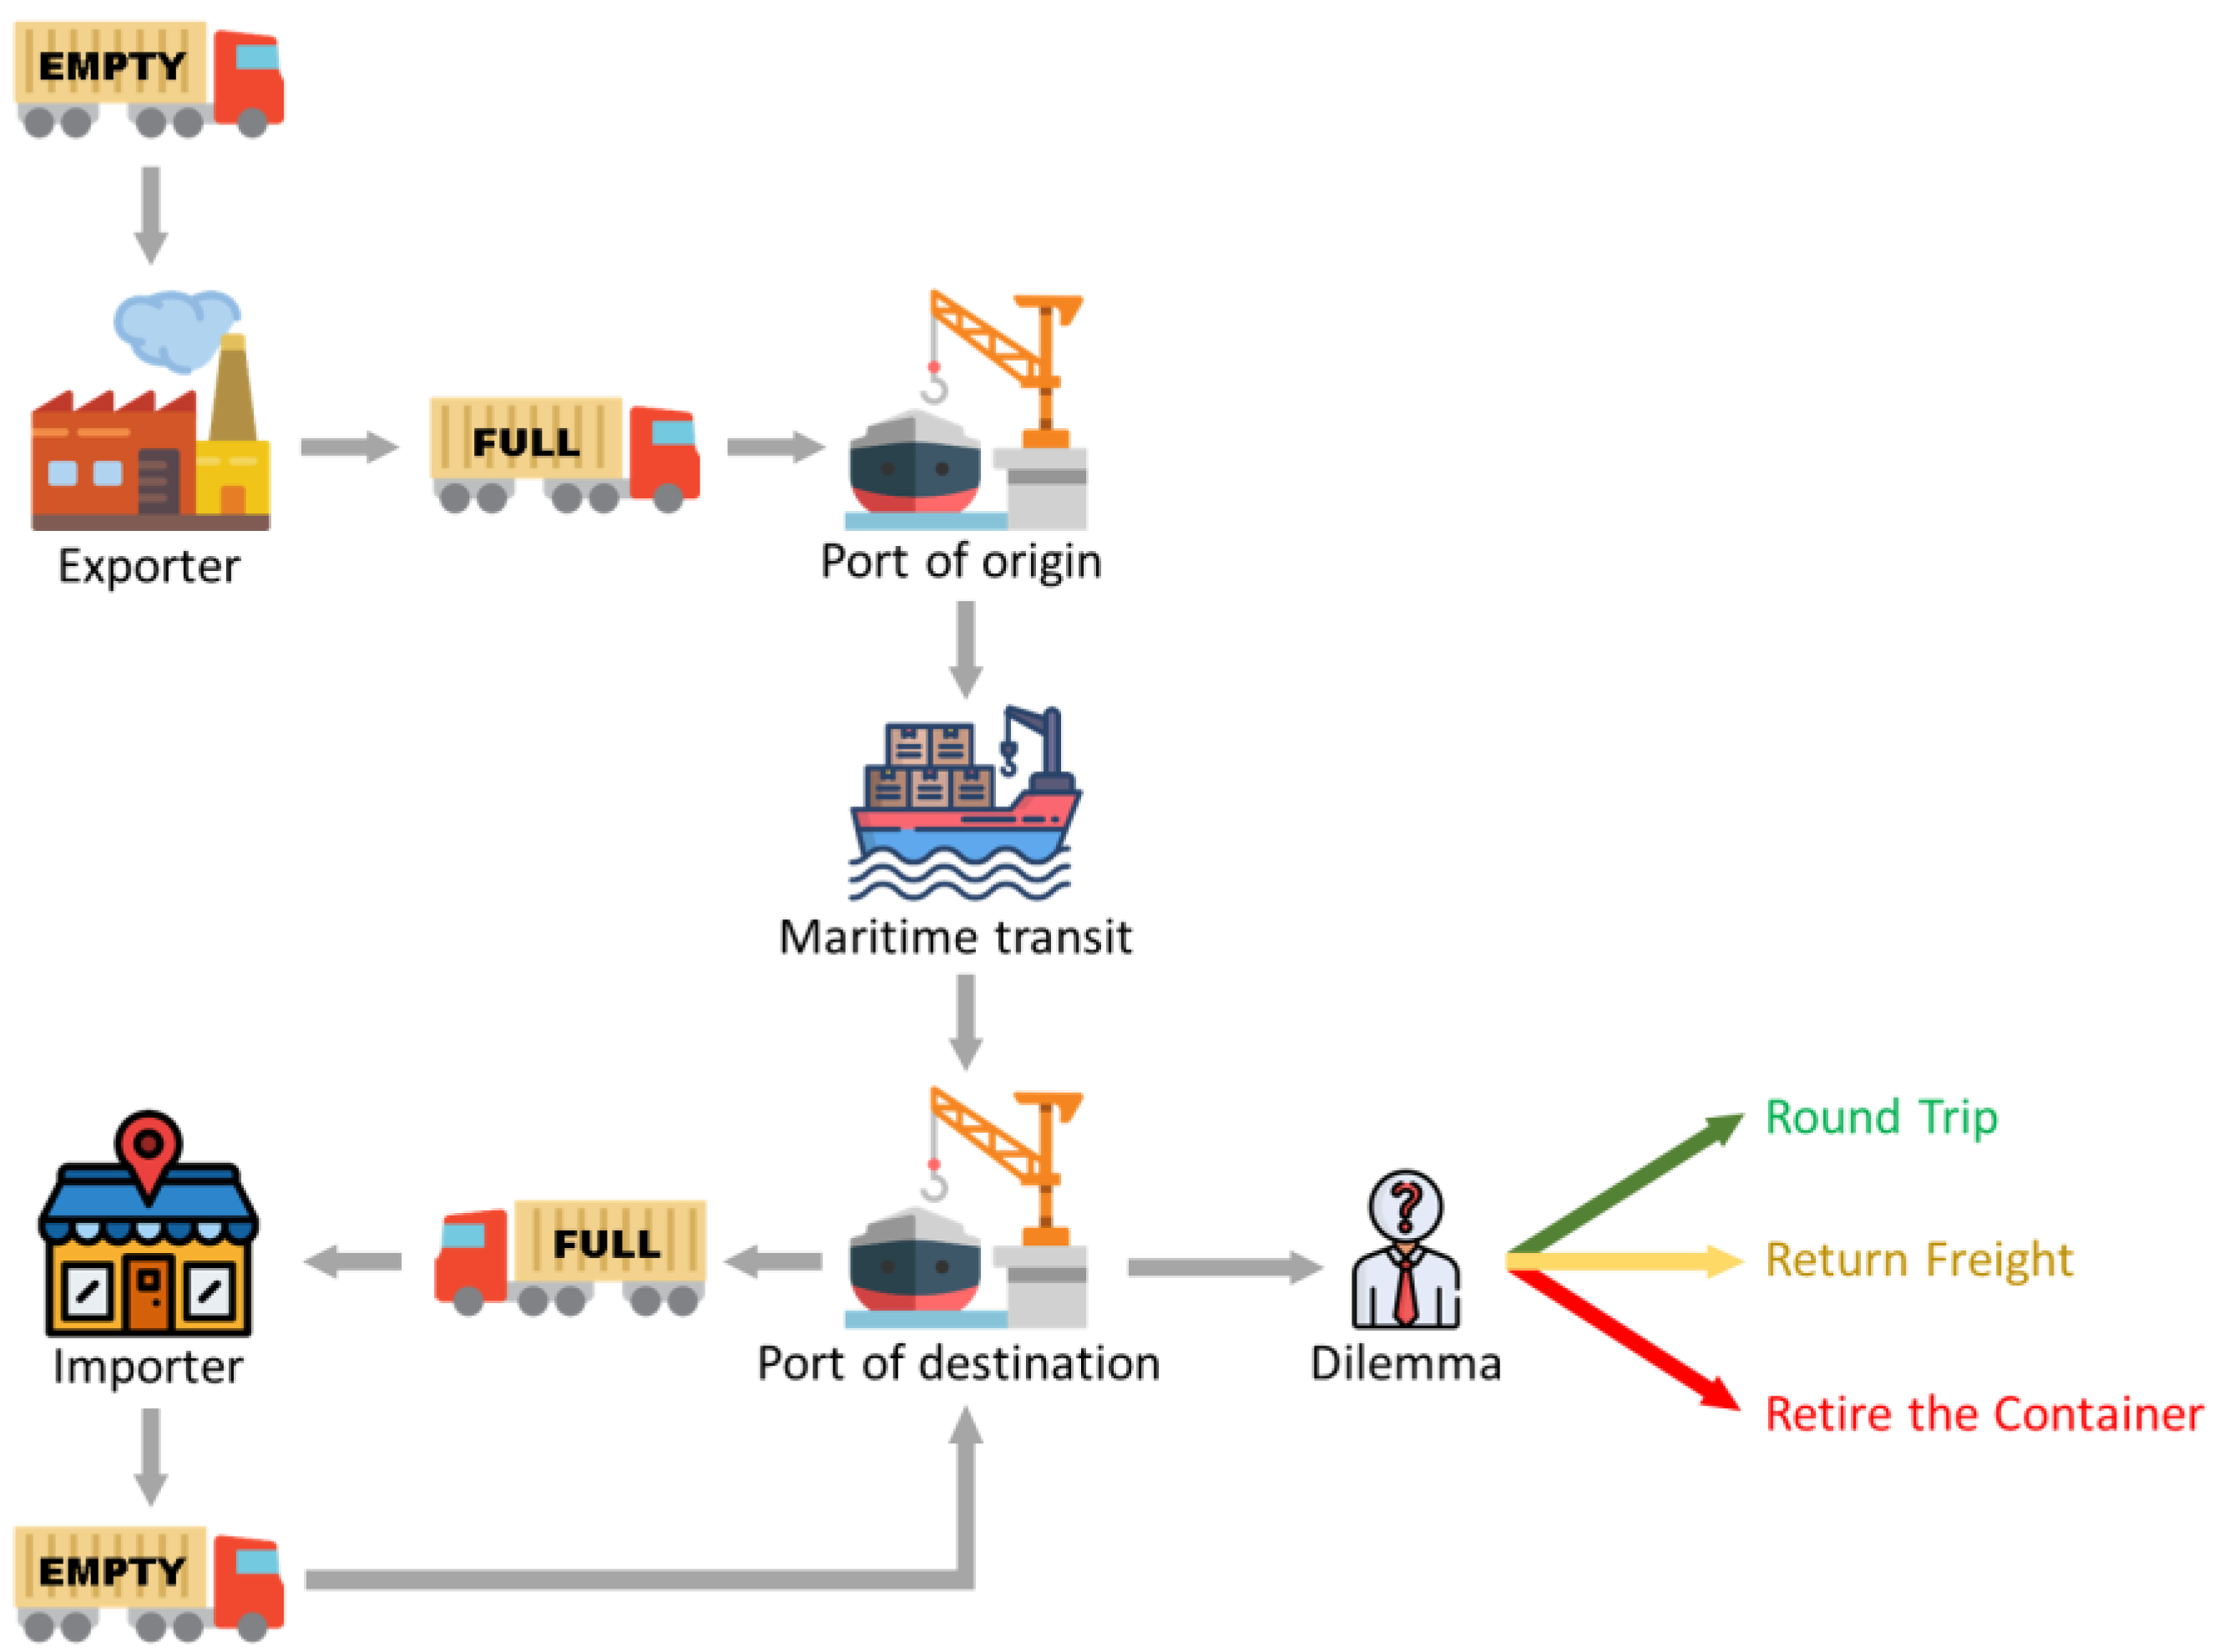
2.2. Shipping Containers

Shipping containers are essentially large steel boxes that are used to transport cargo [27]. This element was idealized by Malcom McLean in the 1930s with the aim of rationalizing the transport of goods when he was still working as a driver of small trucks at the Port of Hoboken, in New Jersey, USA [6]. In 1958, Malcom patented containers as an “Apparatus for shipping freight” [28]. However, the product was intended to be a universal cargo transport solution [2]. After the patent registration, the possibility of transporting goods through standardized structures without the need for constant loading and unloading [6] caught the attention of the U.S. Military. The widespread use of this solution by the military influenced its acceptance by most shipping companies [28]. In this context, following the evolution of international trade, container production has expanded rapidly in recent decades [27], reaching unsustainable standards as shown in the Introduction section of this paper.
Containers use as buildings emerged as a way to reuse these structures and it is not being a new concept because only in the last twenty years has this constructive method achieved greater development [15,29]. This delay is due, at least in part, to the constant erroneous association of this kind of building with trailer houses, normally considered by the general population as unattractive and uncomfortable [18]. Currently, this solution is becoming a trend for several applications, such as hotels, healthcare facilities, low-income housing, and post-disaster settlements [11,12,13].
The shipping containers currently used in building construction can be divided into two main groups, the 20-ft container, with a length of 6.096 m, and the 40-ft container, with a length of 12.192 m [2,14], and both with a width of 2.438 m [28]. For architectural purposes, these containers offer a limited height, that is, 2.591 m of external height [11] which results in an internal ceiling height of just 2.385 m [28]. Although the International Residential Code (IRC) allows a ceiling height of 2.134 m [30], most national building codes require a minimum ceiling height of 2.40 m [10,11,15]. Therefore, a special subcategory of containers is more favorable, despite not being available on the market in the same quantity as the previous ones. High Cube (HC) containers have the same width and length as 20-ft and 40-ft containers but have an external height of 2.896 m, resulting in a minimum internal height of 2.655 m, attending to the national regulations requirements [9]. Table 1 presents the dimensions of the above described containers.
The shipping container standardization is a great advantage in terms of modularity, as it offers versatility in assembly options [10,11], besides facilitating the lifting, transport, and connection operations [14]. Considering a building as an articulation of properly combined spaces to meet the user needs [9], containers make it possible to arrange two or more elements in countless ways. Or even, the application of a single container holding all the infrastructure necessary for the user, which is the adopted approach in this study.
Although there are several container typologies, they must all be manufactured in accordance with the standards set by the International Organization for Standardization (ISO) and the International Convention for Safe Containers (CSC) [11,14]. Among the standards of greatest interest are ISO 668 [31], ISO 830 [32], ISO 6346 [33], ISO 1496-1 [34], ISO 1161 [35], ISO 2308 [36], and ISO 3874 [37] and also the guide provided by CSC [38]. These guidelines present the necessary specifications to ensure the uniformity of the geometric and mechanical properties of the containers for transportation purposes [9], but currently, there are no standards, guidelines, or codes for the use of containers as building materials [11]. Therefore, it is essential to know the main characteristics of these elements, so that the design and construction of the container house reach the required quality standard for use as a building.
The manufacturing process of shipping containers, following the modularization trend, is simple. This element consists of intrinsically structural components, such as corner posts, floor, and closure elements, such as walls, doors, and roofs. Once completed, they all become an integral part of the container’s structural system. Initially, the walls are cut, corrugated, and welded together and then welded to the container floor. This is made up of a mesh of metal beams that will later be covered with a wooden floor [27]. The next step is to install the doors and corner posts which are welded to the walls and floor. Finally, the roof is welded, completing the container’s shell [27] and giving the element a high load capacity [2,9].
In addition to the great structural support, another characteristic that differentiates shipping containers as building materials is their durability [13]. This kind of container is designed to withstand extreme weather conditions during service, that is, they are elements that spend most of their life exposed to rain, wind, and sea air [2,9,28]. For this reason, they are built in Corten steel or weathering steel, a steel resistant to atmospheric corrosion which includes alloying elements that affect the corrosion process of materials and protect the steel integrity [27,28]. Corten steel has a weather resistance of four to eight times greater than ordinary steel, in addition to good weldability and workability [27]. In this context, this material promotes a great reduction in maintenance costs when applied in buildings, since these are generally located in less aggressive environments.

2.3. Shipping Containers for Post-Disaster Reconstruction

The flexibility of modular construction and the benefits of using shipping containers as buildings, the so-called container architecture, have contributed to the development of the technique for various applications [11], including coffee shops, fast food kiosks, sales stands, public restrooms, hotels, residential buildings, field hospitals, information centers, leisure spaces, military barracks, scientific research laboratories, and educational buildings, among others. However, one of the most relevant applications of this technology is its use as post-disaster housing, due to its quick and easy installation [5]. More specifically, as a temporary shelter where victims are allocated before being moved to new homes [2]. In this sense, some studies have recently addressed the topic, especially in countries with a high occurrence of climate catastrophes and armed conflicts. Nevertheless, the literature is still limited.
Zafra et al. [39] applied Building Energy Modeling (BEM) to conduct a thermal performance assessment of container shelters in the Philippines. Two design models were created and simulated by changing the insulation material using the EnergyPlus engine. The authors concluded that, regardless of the design, the use of insulating materials is essential to obtain thermal comfort in containers in tropical climates. Obia [40] conducted several architectural and structural changes in temporary container shelters and concluded that all modifications were well accepted by respondents, confirming the technology’s flexibility. Shen et al. [11] analyzed the effectiveness of climate-adaptive design for container buildings in three different climate zones, Stockholm, Berlin, and Rome. The results indicated that the integration of passive strategies and renewable technologies was the method that obtained the best results. Ling et al. [2] carried out a review of the feasibility of using containers as transitional shelters. The literature analysis indicated that the use of containers for this purpose has great potential, mainly due to its economic and operational advantages. However, the authors highlighted some system weaknesses that must be quickly mitigated, such as the lack of design guidelines and community acceptance. In fact, the analysis of this last topic was precisely the objective of the Wong et al.’s [41] research which sought to assess the level of acceptance of Malaysian citizens in relation to containerized houses. The used methodology was a questionnaire applied to 454 respondents. The results indicated that only 45% of the participants would consider living in a container house but that its use as a commercial establishment already has great approval.
The research of Tan and Ling [14] aimed to understand the current status of the technical aspect of the container for shelter provision. The authors found that this kind of building meets several technical criteria necessary for its use as a building, such as minimum internal area, ventilation, and fire safety. However, they concluded that further research is essential for this constructive technique to reach its full potential. Sun et al. [42] analyzed the advantages of using container construction in regions with very cold weather. The authors concluded that the system’s versatility, combined with the ease of installation and customization possibilities make it adaptable to different locations. In cold weather regions where work schedules must be thought through to avoid periods when workers are exposed to extreme temperatures, being able to do most of the work inside the factory can save time and money.
Elrayies [10] analyzed the thermal comfort of a container house in a hot and humid climate region. The study was performed through computer simulation, varying the external thermal insulation materials. Materials used were mineral wool, closed-cell spray polyurethane foam (ccSPF), and straw. The author concluded that the use of insulation is essential for habitable containers and that the type of material depends on the local climate. In this case, the most effective insulator was ccSPF. Bowley and Mukhopadhyaya [17] were dedicated to the development of an off-grid passive container house. Although the study is not directly related to temporary shelters, the sustainable design ideas presented are useful for this application, such as the photovoltaic power system, rainwater harvesting, and onsite wastewater treatment. A similar study was conducted by Dumas et al. [43] who developed a model of container housing heated by circulating geothermal water inside the building’s outer walls called ZETHa (zero energy temporary habitation). The main objective of the system is to minimize thermal bridges in order to improve the building’s internal comfort with less energy consumption. Zhang et al. [44] took a qualitative approach to analyze the societal factors that affect the suitability of containers as temporary post-disaster shelters with a focus on case studies following Hurricane Katrina in the US, the Christchurch Earthquake in New Zealand, and the 2009 Black Saturday bushfire-affected communities in Australia.
Finally, it is important to emphasize that there are other available technologies to be used as temporary post-disaster shelters. Caia et al. [45], for example, investigated the psychological effects suffered by victims of the earthquake in Italy in 1997. The study investigated people’s satisfaction with temporary shelters, comparing a control group with people housed in shipping containers and dachas. The results indicated that the victims occupying the containers were very dissatisfied, while those allocated to the dachas felt only a little uncomfortable with the shelter. The authors attributed this feeling to the constructive typology of dachas, more similar to a “real home”, that is, built-in wood, with large windows, and traditional sloped roofs. Unlike containers, which are made up of metal boxes with small windows and flat roofs. However, it must be considered that almost two decades have passed and container-building technology has evolved a lot. Currently, containers, despite still being made of metal, can receive thermoacoustic insulation, ensuring the comfort of their occupants. In addition, shipping containers can be customized to resemble traditional construction with large openings, different types of roofing, and even special elements, such as balconies and terraces. However, other technologies must be continuously explored, allowing the constant development of comfortable, cheap, and quick-to-execute solutions.
The analysis of the literature presented in this section shows that there are few studies dedicated to developing sustainability and energy efficiency concepts for temporary container shelters. Therefore, this study constitutes a starting point for a series of research focused on obtaining a standard design for a sustainable, energy-efficient, and autonomous container house to be used as a temporary shelter in tropical countries. In this context, it was decided to first analyze the two most used insulation materials in the cities of Macaé and Uberlândia where the Brazilian authors of the text reside since the next steps of the research will involve field measurements to assess the actual performance conditions of the containers. In future research, other types of containers, changes in architectural design, use of rainwater, photovoltaic and wind energy microgeneration, and the perception of users concerning this type of structure will also be considered. Indeed, when compared with the need to allocate people as quickly as possible, given their emergency use, these issues are usually considered of low importance [2,5]. However, they are fundamental aspects when related to user comfort and the life cycle of this type of building [5].

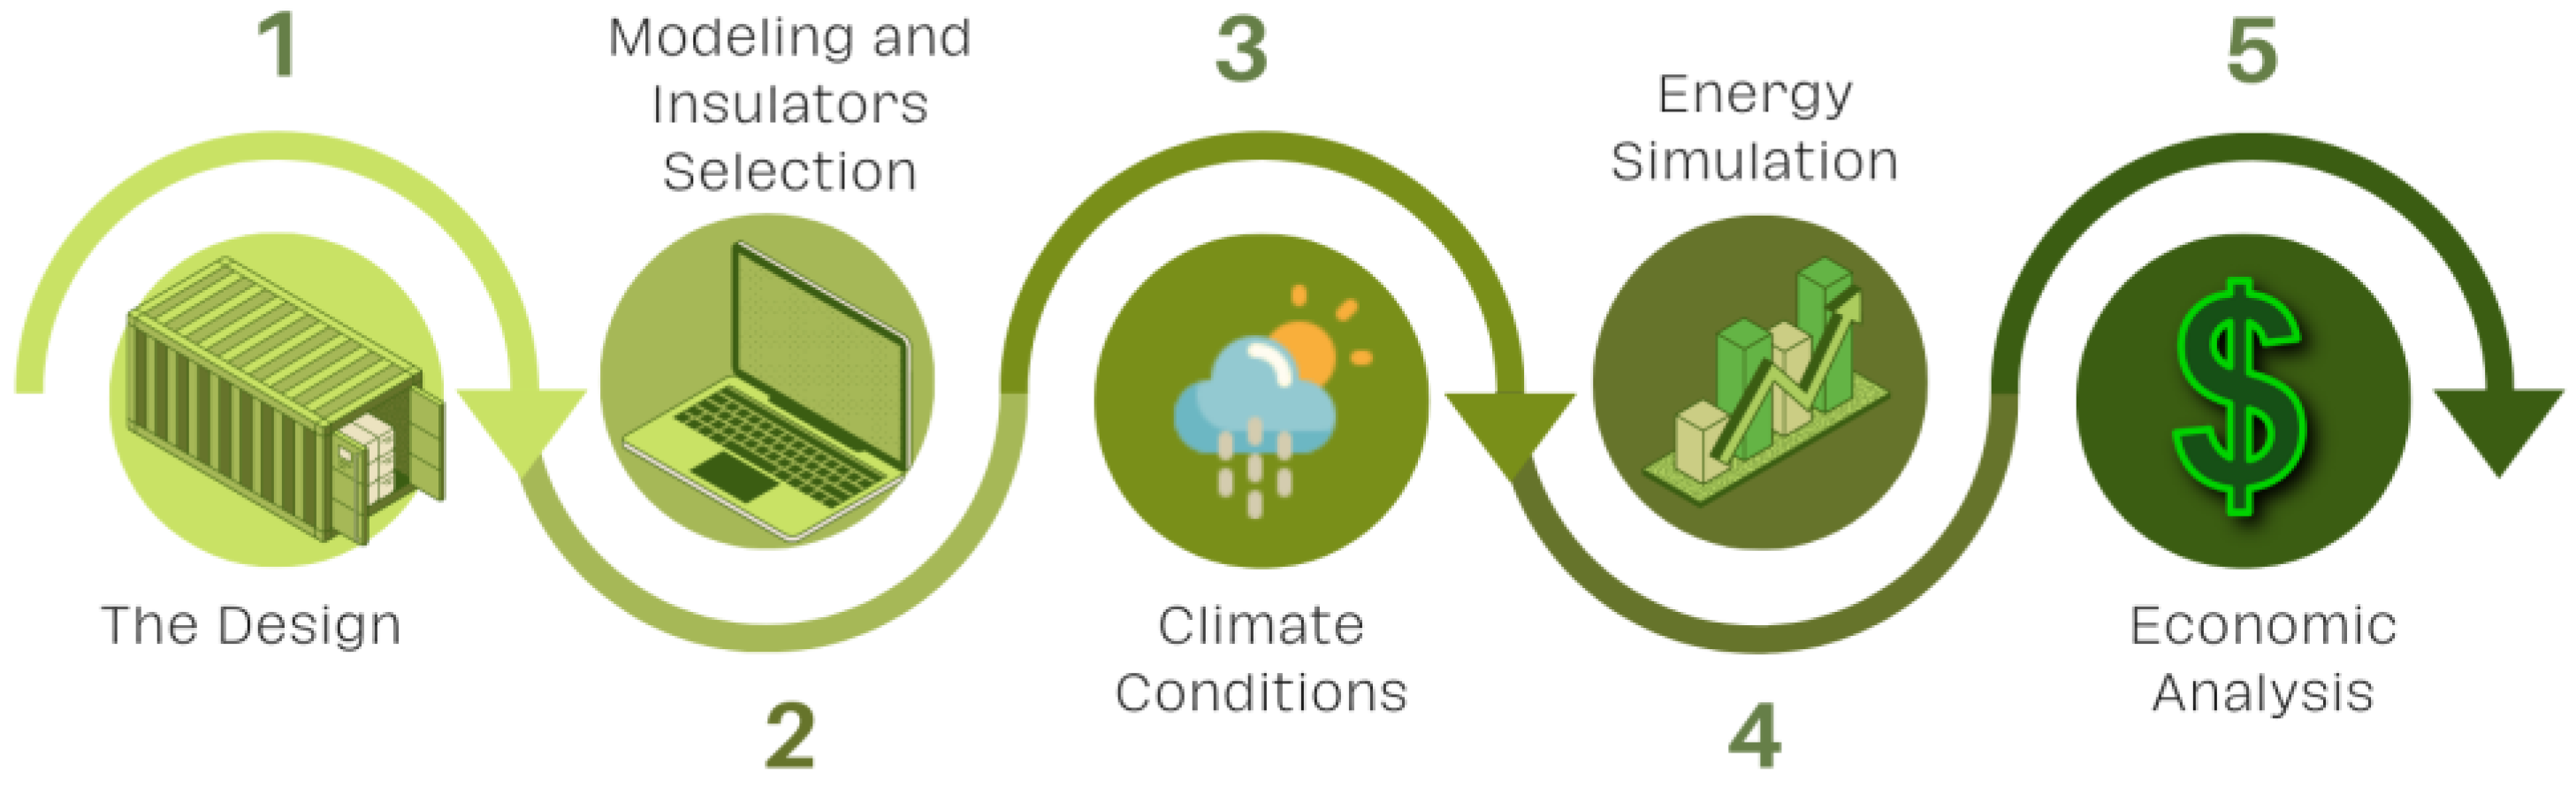
3. Materials and Methods
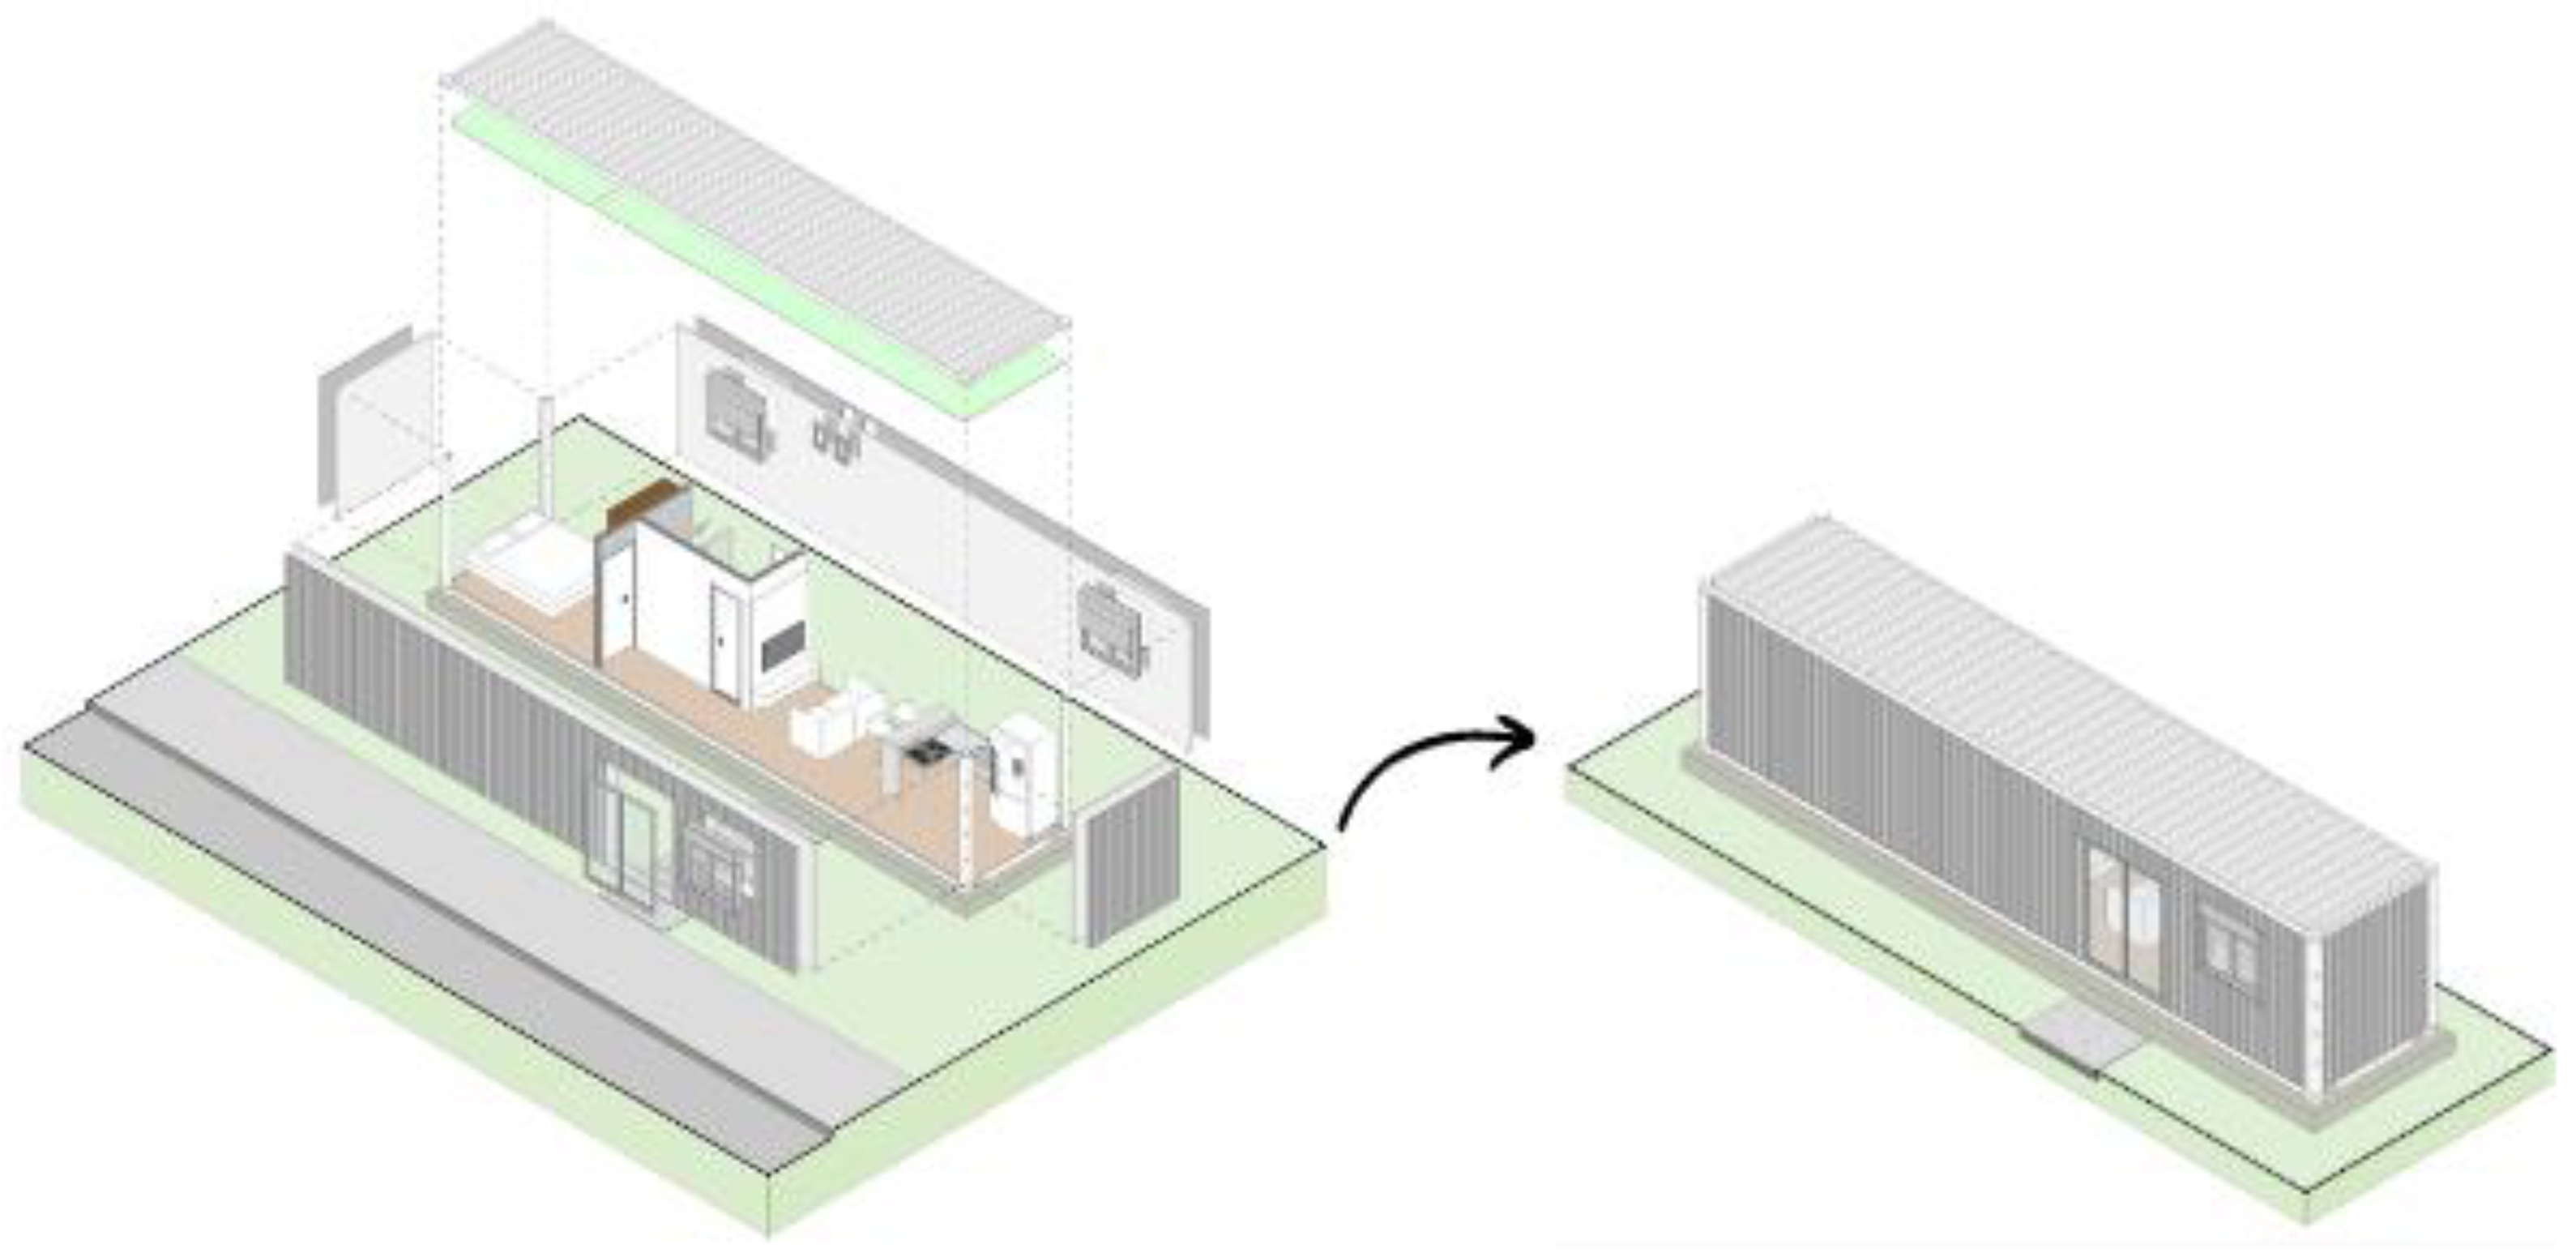
This research aims to evaluate the energy efficiency of a temporary shelter project built in a container through computer simulation. Therefore, a standard design was developed in a 40-ft HC container where two types of thermal insulating materials were simulated for two different climatic conditions. Figure 2 illustrates the research methodological framework.

3.1. The Design

The proposed temporary shelter consists of a retrofitted 40-foot dry high cube (HC) shipping container module with external dimensions of 12.192 m in length, 2.438 m wide, and 2.590 m in height with an approximate area of 28.28 m2 and an approximate volume of 76.99 m3. The container is made of corten steel, has hinged doors at one end, and its walls are corrugated. This model was chosen because its area allows for greater layout flexibility and better spatial room arrangement in accordance with the recommended minimum dimensions for housing. Furthermore, this is the model that the researchers have at their disposal for carrying out future studies which will involve field measurements. Considering the container’s dimensions, the sectorization of the layout began. A 6.98 m2 kitchen integrated into the 7.36 m2 living room, a 3.01 m2 bathroom, and a 7.74 m2 bedroom were defined. Figure 3 shows the final layout configuration.

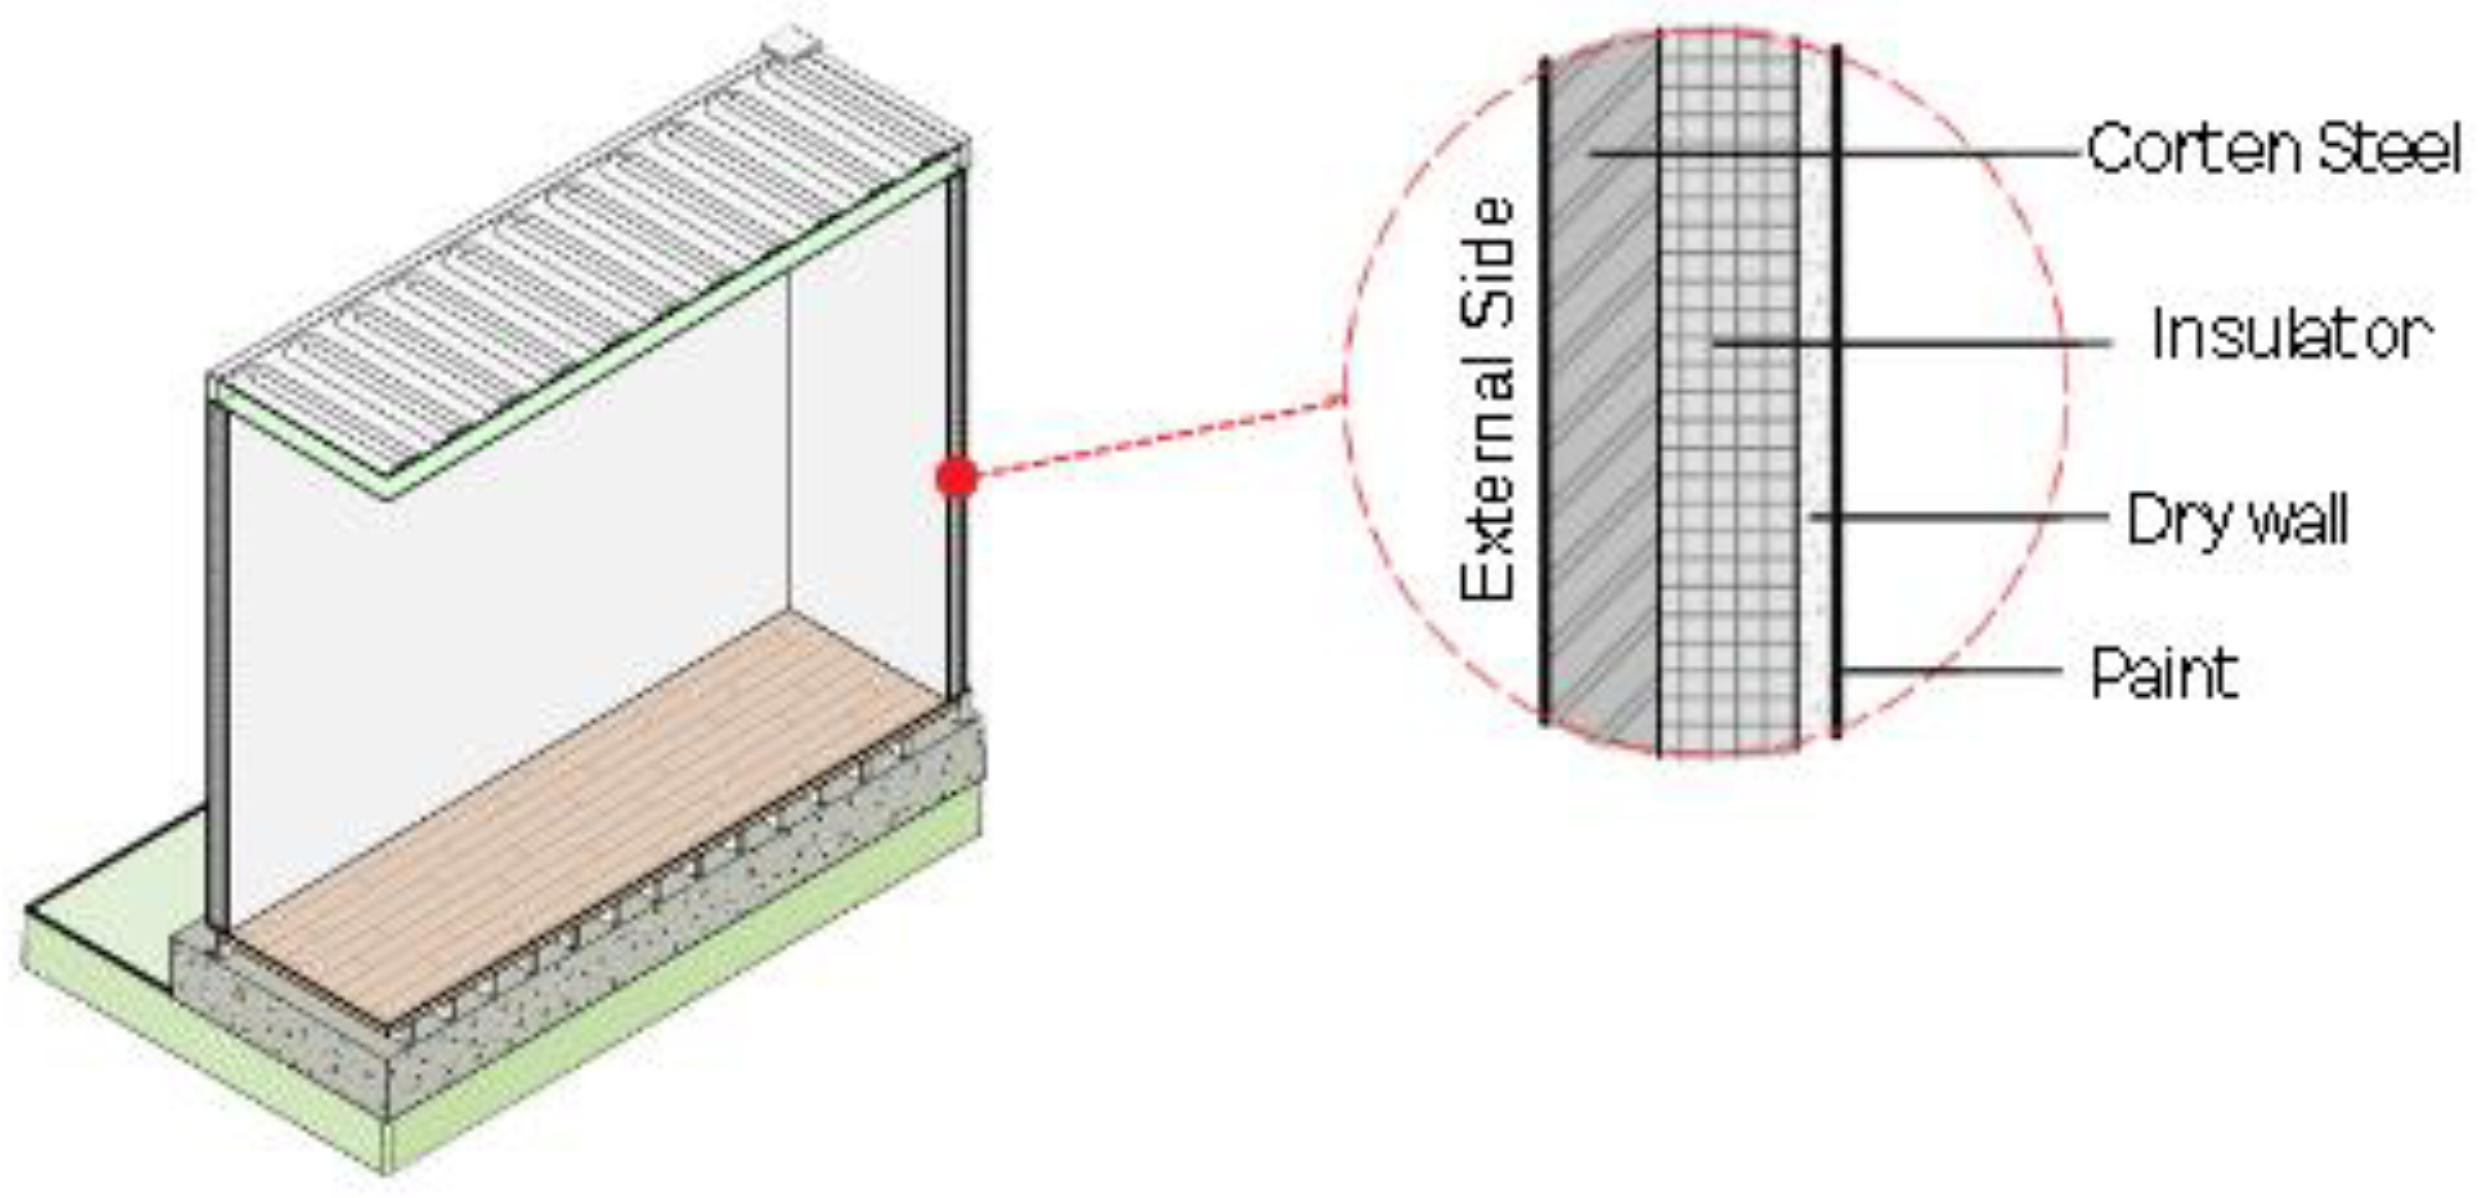
3.2. Modeling and Insulation Material Selection

Once the layout was defined, the project was modeled in Autodesk’s Revit® 2023 software [46]. Building Information Modeling (BIM) is an information modeling technology that is integrated into a single file, and with that, it is possible to create associations between design, analysis, and documentation as well as communication between the systems that constitute the building. According to Eastman et al. [47], it is a digital model that contains the exact geometry and information needed to support the design, construction, manufacture, and supply of resources necessary to produce a building. Parametric modeling allows the simulation and evaluation of different design solutions even during the design phase [48]. In addition, professionals from different areas can effectively participate in the design process, generating solutions that contribute to the definition of assertive and efficient choices, a situation that can also benefit the building’s energy efficiency. Thus, the model has developed in such a way that each type of wall had its thermal characteristic configured, encompassing the properties of thermal conductivity, specific heat, and density.
Three scenarios for simulating thermal insulation were defined (Table 2). The first was considered a reference model in which thermal insulation was not used. In the other two scenarios, PET wool (polyethylene terephthalate) and mineral wool were used. All other project characteristics were maintained, including the type of connection between the container and the floor. Considering that this is the only uninsulated part of the structure, the option of positioning it on a large concrete base guarantees the reduction of thermal exchanges.
PET wool is manufactured from plastic bottles and its development is specifically aimed at thermal and acoustic insulation in dry construction. It is a substance that does not absorb water or humidity, therefore, it does not mold and maintains its original characteristics for a long time with a lifespan of up to 100 years. Hence, PET wool is an excellent option for thermal insulation and can be used in several civil construction environments. Mineral wool is made from a volcanic rock called diabase. The manufacturing process starts with the production of fibers that are superheated to transform them into filaments that are agglomerated with resin solutions and result in products that can be light and flexible or very rigid, depending on the degree of compaction. The material is versatile and can be produced in different densities. In the three scenarios, the other materials were considered equal with the external coating painted directly on the container and the internal one in drywall (Figure 4). These two types of insulators are the most used in the regions where the model was simulated. Thus, considering that the future of this research will involve the purchase of this material and the construction of a prototype to perform field measurements, we chose to simulate only products that are easily found for sale in the local market.
The used PET wool was Wall 50 mm polyester blanket, from Ecofiber. This insulator is fully recyclable and being self-extinguishing, that is, it does not propagate flames and it is a lightweight material compared to other insulators. For mineral wool, the material from ISAR was selected. The product is THERMAX® PSL—32 of 50 mm with good thermal resistance, good acoustic insulation, chemical inertia, water resistance, incombustibility, and resilience. A thickness of 50 mm was chosen because it is the standard dimension for different suppliers of these two materials in our region.
Table 3 summarizes the properties of the materials proposed as thermal insulators.
Density, thermal conductivity, thermal resistance, and thermal transmittance are fundamental parameters in determining the efficiency of a thermal insulator, a low transmittance on the external walls of a residence is desirable, thus preventing the large amplitudes of the external environment from reaching the internal environment. In this context, the table above indicates that, despite the two materials having similar densities, the thermal characteristics of mineral wool are slightly superior to those presented by PET wool.

3.3. Climate Conditions

Climate files from two Brazilian cities were selected to be loaded into the eQuest software (version 3.65) [49]. The equipment used to run the simulation was a notebook with 8 GB of memory, 1 TB HDD, Intel Core i7 processor, and 2 GB NVIDIA GEFORCE graphic card. The objective of this engine is to present results in a fast and objective way. Therefore, simulation results were obtained in a few minutes. Both are located in the southeast of Brazil, 1126 km apart. Uberlândia, which belongs to the State of Minas Gerais, is located at an altitude of 863 m and has a tropical high-altitude climate, with heavy rains in summer and droughts in winter. Macaé, belonging to the State of Rio de Janeiro, is located just 2 m above sea level and has a predominantly tropical climate, whose main characteristics are the large volumes of rainfall throughout the year, with summers and winters with high temperatures. These cities were selected because they had similar climatic characteristics in spring and autumn but with greater variations in the summer and winter months (Table 4). Therefore, considering that this paper aims to evaluate the energy efficiency of a container building project, based only on the insulation materials used, that is, disregarding the effects of other architectural decisions, it was considered pertinent to choose cities that present greater variations only in the most extreme temperature months.

3.4. Energy Simulation

The process of computational energy simulation in a building is known as Building Energy Simulation (BES). BES allows designers to conduct the necessary analyses in the various stages of building modeling in order to predict the real behavior of the building. This makes it possible to select the best design solution.
The BES software chosen for the analysis was the eQuest (Quick Energy Simulation Tool) developed by DOE.com. The software is free and allows calculating the energy consumption of a building throughout the year based on data from climate files in the region where the building is located. Interoperability between modeling (BIM) and energy simulation (BES) tools is usually achieved through data exchange protocols, such as Industry Foundation Classes (IFC) and Green Building Studio XML (gbXML). Existing BIM tools, such as Revit and ArchiCAD, as well as BES softwares, such as Green Building Studio, eQUEST, and IES-VE, support the IFC and gbXML format. As a BIM–BES exchange mechanism, Green Building Studio was applied which is used by Autodesk Revit.
After completing the project modeling in Revit, occupancy data, location, and all the parameters of the materials used were adjusted. The areas were defined as conceptual masses in a total of five (bedroom, bathroom, hallway, living room, and kitchen), and the reference floor was considered on the ground floor. Then, the necessary settings and adjustments were made, and the energy model was generated and exported in gbXML format which was created as an open-source project to facilitate data transfer between BIM files and building energy analysis (BES) software. To produce a Revit gbXML file, the Energy Analysis tool is used which builds an energy simulation model that can be loaded into Autodesk Green Building Studio (GBS), where it will be analyzed for errors, inconsistencies, or flaws in the export. After that, it is possible to export the gbXML file from the GBS cloud service and import it into a BES software that supports gbXML. The benefits of this energy analysis method are the accurate extraction of non-geometric data, such as occupancy, equipment, lighting, thermostat, daily weather data, and outside air information. After checks in Green Building Studio, the files were converted to DOE2 format and analyzed in eQuest software.
The occupancy of two people was considered for simulation, following the minimum pattern recommended by national standards. The use of one air conditioner per room was also considered except for the bathroom. The temperature of 23 °C was considered as the thermal comfort standard to be achieved by the model in the two analyzed cities. That is, the energy consumption for cooling simulated by the model was necessary to maintain the building’s internal temperature at 23 °C. This value is within the operating temperature range considered by Brazilian regulations for both summer and winter [50]. To activate the HVAC system (Heating, Ventilation, and Air Conditioning), the recommendation of the ISO 17772-1:2017 [51] was adopted which provides suggestions for the occupancy schedule of single-family residences. Table 5 presents data from the occupancy schedule.
Table 6 shows the technical parameters adopted in the eQuest software to perform the simulations:

3.5. Economic Analysis

The economic analysis aimed to identify the cost of each of the insulators used, and the energy savings resulting from its implementation. Initially, in the modeling software itself, the wall, and ceiling areas where the insulators will be applied were determined, totaling 114.60 m2.
Then, the energy consumption (EC) of each simulated model (reference, mineral wool, and PET wool) was verified and multiplied by the cost of kWh in each analyzed city. In Uberlândia, R$0.65313/kWh and in Macaé, R$0.75411/kWh. Based on these data, the lag between the reference model and the models with insulators was calculated and multiplied by the tariff of the energy operators in each city. Monthly values were obtained and then summed to obtain annual consumption. Finally, the initial investment of each system was divided by the proportional annual savings of each one to discover the payback of each system. After determining the payback time, it was verified from which year the investment system would become profitable which would have the best cost–benefit in the long term. For this, the annual savings (AE) was subtracted from the initial investment (II) for a period of 20 years according to Table 7.

4. Results and Discussion

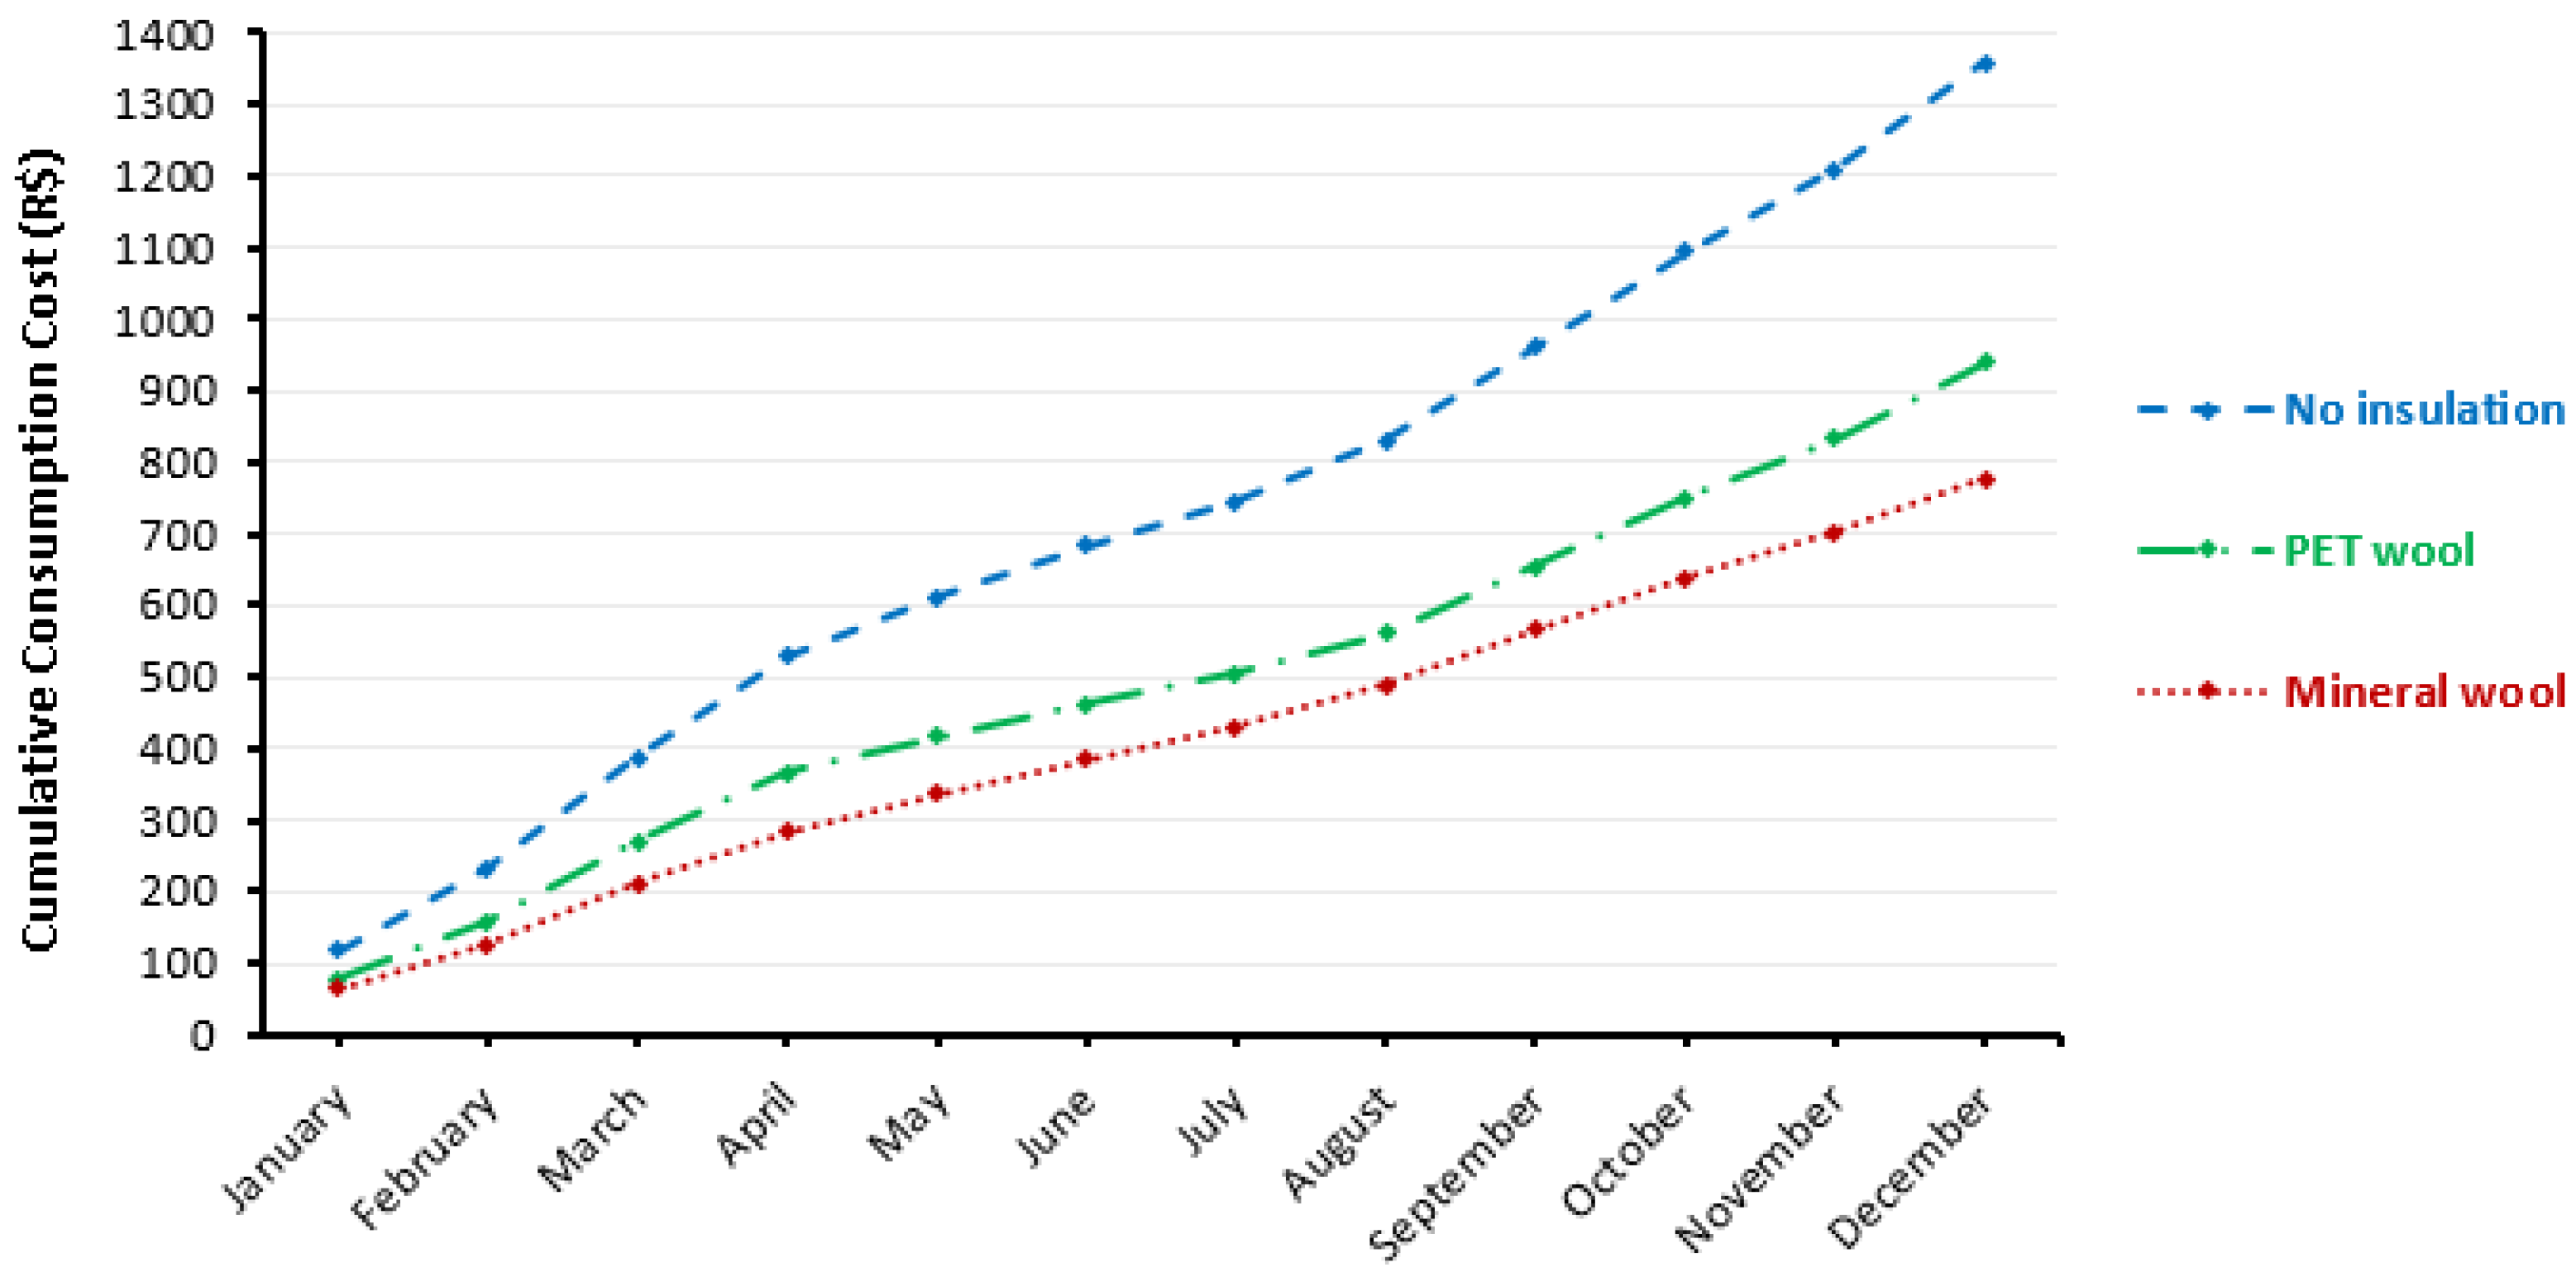
4.1. Results for Uberlândia

The simulation was performed over a period of one year, a parameter that was defined in the e-Quest. The results of monthly and annual energy consumption in kWh of electrical energy for cooling were analyzed in the reference model and in the models with thermal insulation. Table 8 indicates that during the months of May, June, July, and August, the energy consumption of the systems using PET wool and mineral wool are virtually the same. This is because in these months the average temperatures are lower, therefore, the demand for cooling decreases and, consequently, the energy consumption. However, it is possible to state that both insulators produced much better results than the reference model (no insulation). In this context, mineral wool had the lowest consumption with savings of 17.13% compared to PET wool and 42.80% compared to the reference model.
The next step is to calculate the percentage reduction in primary energy consumption (RedCEP) of the housing unit in the real condition compared to the same housing unit in its reference condition. Applying Equation (1) in the scenarios with PET wool and mineral wool, the following results are obtained:
R e d C E P = C E P , r e f × F c e - ( C E P , r e a l × F c e ) ( C E P , r e f × F c e ) × 100
  • RedCEP is the percentage reduction in primary energy consumption of the housing unit in the real model compared to the housing unit in the reference model;
  • CEP, ref is the annual primary energy consumption of the housing unit in the reference model (kWh/year);
  • CEP, real is the annual consumption of primary energy of the housing unit in the real model (kWh/year).
  • Fce is the energy conversion factor.
After applying the conversion factor, there was a 30.98% reduction in energy consumption with PET wool and a 42.80% reduction with mineral wool (Table 9) when compared to the reference model without insulators. For the economic viability analysis, first, the annual expenditure on electricity was calculated, and, then, the cost of implementing each system. From these data, the payback time of each system was obtained. The cost per kWh used for the city of Uberlândia was R$0.65313. Thus, it was found that the annual cost of the system without insulation was R$1359.56; the PET wool system was R$938.35, and the mineral wool system was R$777.62. The average monthly cost of the system without isolation was R$113.30; in the system with PET wool, it was R$78.20, and in the system with mineral wool, it was R$64.80. Figure 5 shows the cumulative cost of consumption of each system over a year.
For the analyzed period of one year, the system with PET wool generated savings of R$421.20 compared to the system without insulation, and the mineral wool system generated savings of R$581.94, resulting in a difference between the two insulators of R$160.74. Table 10 shows the percentage of savings that each scenario achieved in relation to the scenario without insulation through the monthly comparison between the scenarios that used PET wool and mineral wool. PET wool achieved better results in June, July, and August which are the months with the lowest average temperatures. This is because the thermal resistance of PET wool is lower, so it “retains” less external heat.
In order to calculate the payback time, a market survey was carried out to obtain the m2 value of each thermal insulator. The unitary value of each insulator was then multiplied by the areas of the walls and ceilings where the insulators were applied, obtaining the total value of the investment for each material (Table 11).
It is, then, concluded that for a PET wool system, an investment of R$1671.98 in materials will be necessary, and for a mineral wool system, an investment of R$2960.12 will be required. Subsequently, these values were divided by the annual savings generated by each system, according to Equation (2).
P a y b a c k   t i m e = I n i t i a l   I n v e s t m e n t A n n u a l   S a v i n g s
The payback time calculated for the scenario that used PET wool will be approximately four years (3.97 years), while in the mineral wool scenario, it will be about one year longer (5.09 years). Thus, Table 12 indicates that up to the eighth year of installation, PET wool is more economical, but from the eighth year onwards the situation is reversed. That is, mineral wool provides greater long-term savings for the city of Uberlândia.

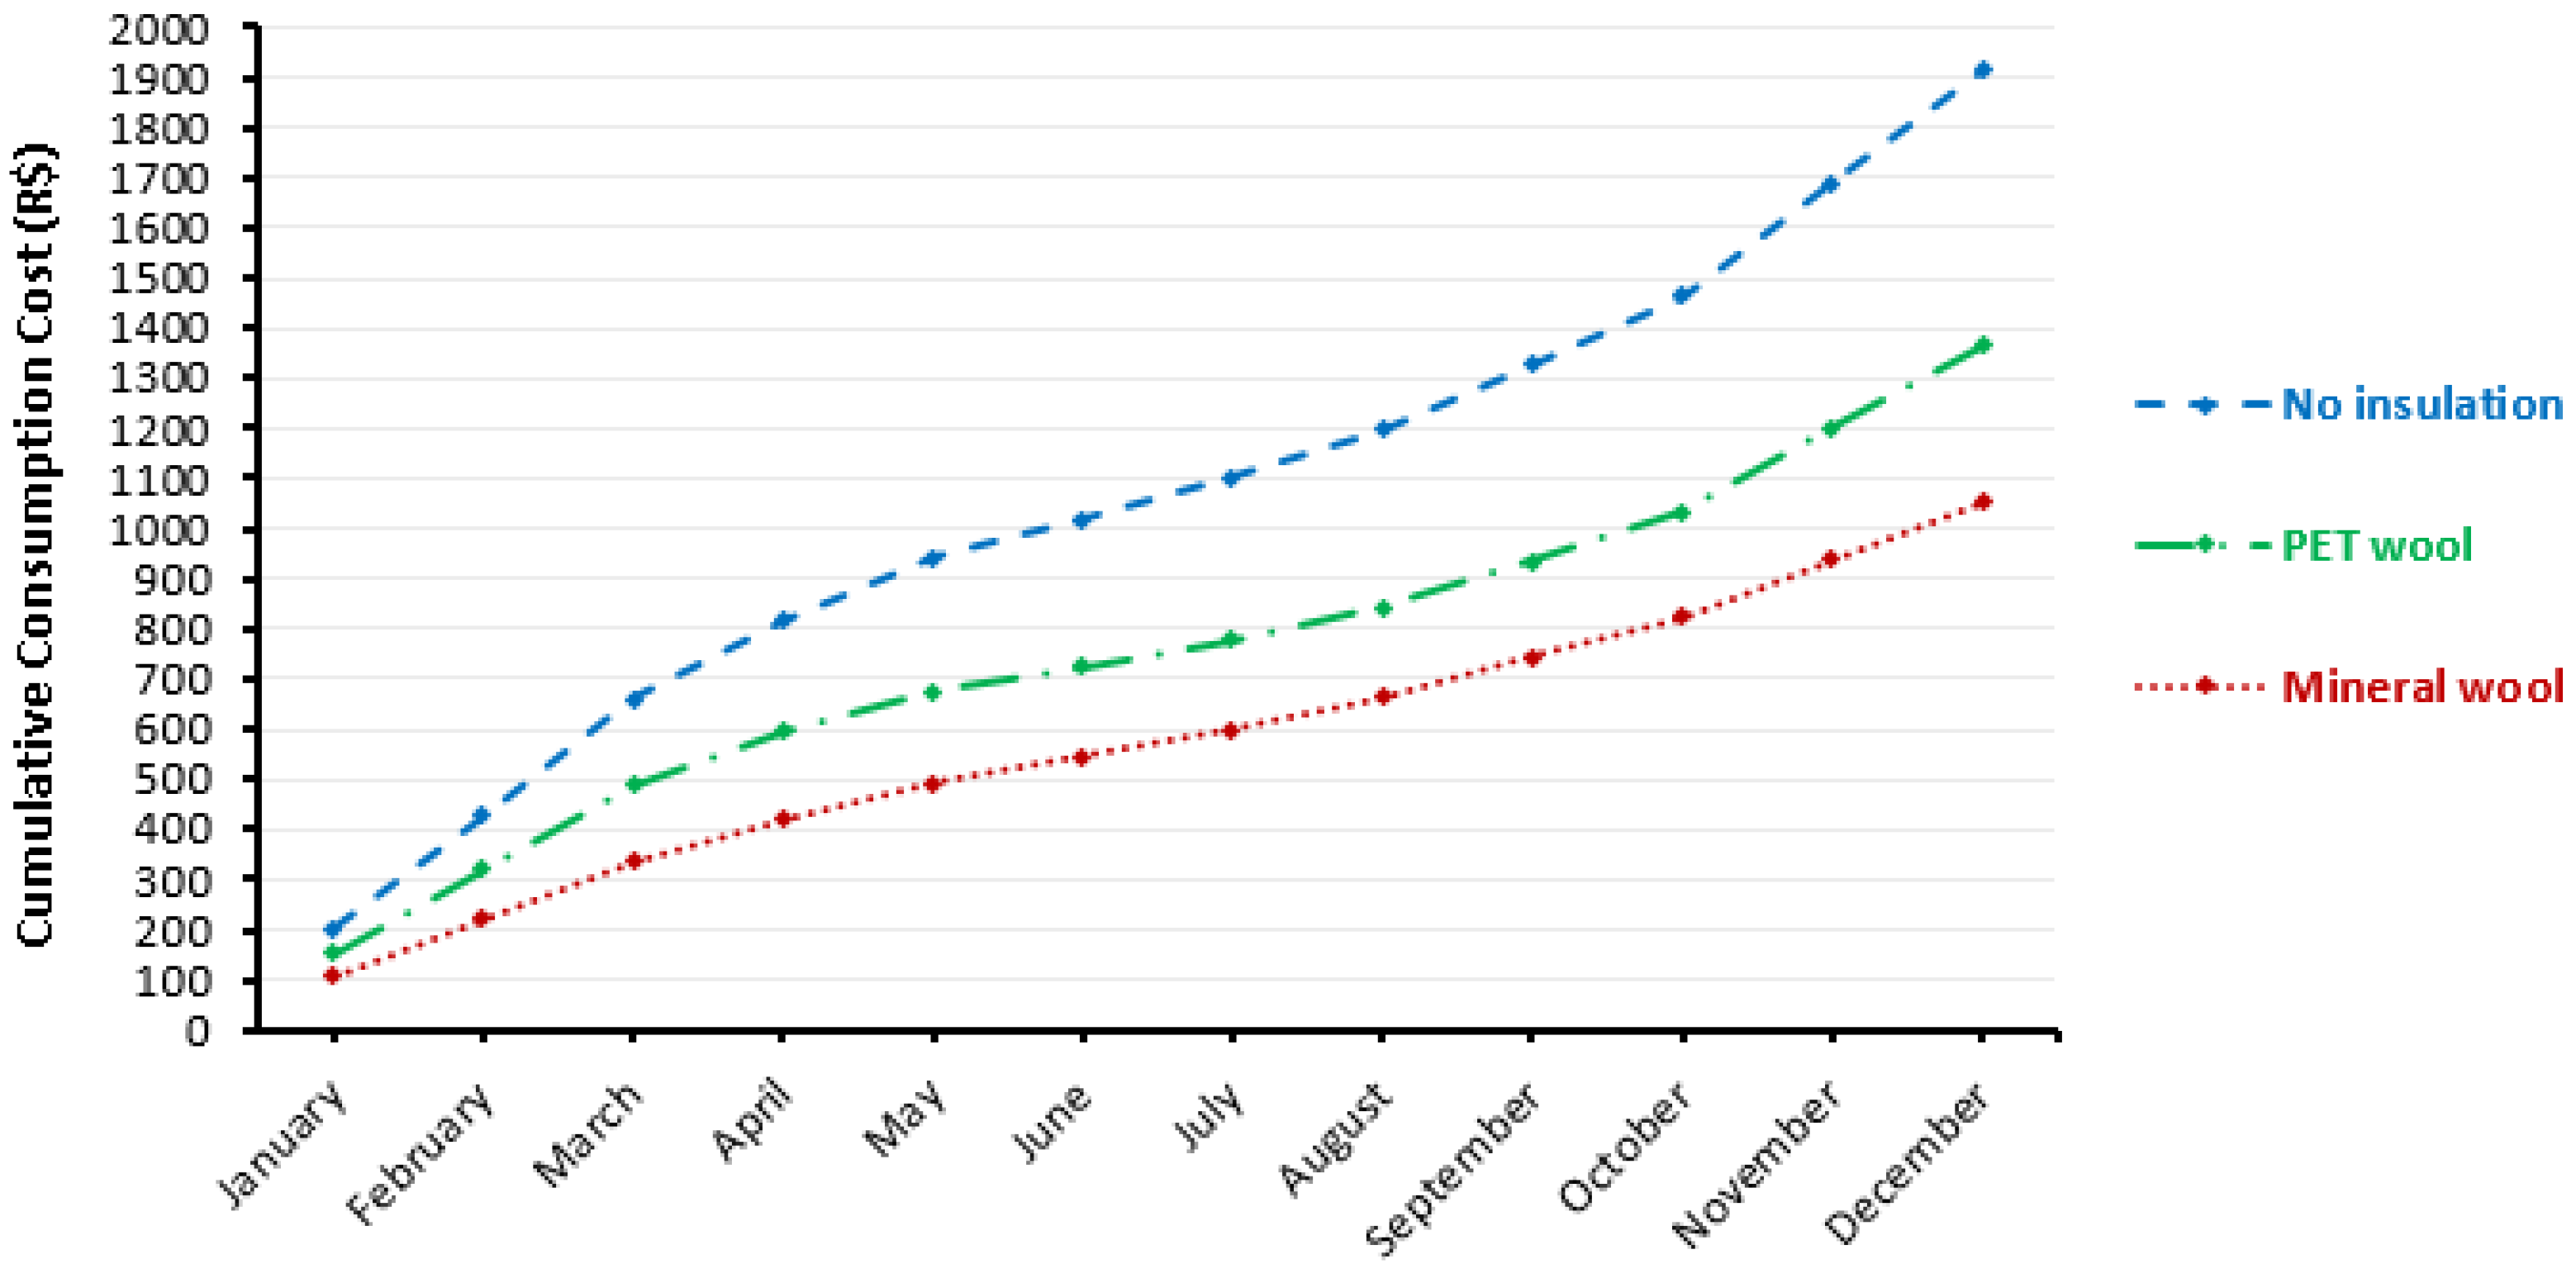
4.2. Results for Macaé

For the city of Macaé, the format in which the analysis was carried out in the city of Uberlândia was repeated. Table 13 indicates that during the months of June, July, and August, the energy consumption of the systems using PET wool and mineral wool are virtually the same. This is because in these months the average temperatures are lower, therefore, the demand for cooling decreases and, consequently, the energy consumption. As in the analysis performed for the city of Uberlândia, it is possible to state that the two insulators produced better results than the reference scenario. Considering that the generated consumption was 2539.3 kWh for the reference model, 1810.7 kWh for the PET wool model, and 1396.8 kWh for the mineral wool model, the mineral wool had the lowest consumption among those analyzed with savings of 22.86% compared to PET wool.
The parameters for the calculation of primary energy consumption (RedCEP) for the city of Macaé according to Equation (1) are described in Table 14:
After applying the conversion factor, there was a 28.69% reduction in energy consumption with PET wool and a 44.99% reduction with mineral wool when compared to the reference model without insulators. For economic viability analysis, the same process applied to the city of Uberlândia was used. The cost per kWh used for the city of Macaé was R$0.75411. Thus, it was found that the annual cost of the system without insulation was R$1941.91, the PET wool system R$1365.47, and the mineral wool system R$1053.34. The average monthly cost of the system without isolation was R$159.58, in the system with PET wool, it was R$113.79, and in the system with mineral wool, it was R$87.78. Figure 6 shows the cumulative cost of consumption of each system over a year.
For the analyzed period of one year, the system with PET wool generated savings of R$549.44 compared to the system without insulation, and the mineral wool system generated savings of R$861.57, resulting in a difference between the two insulators of R$312.13. Table 15 shows the percentage of savings that each scenario achieved in relation to the scenario without insulation through the monthly comparison between the scenarios that used PET wool and mineral wool. PET wool achieved better results in June and July which are the months with the lowest average temperatures. This is because the thermal resistance of PET wool is lower, so it “retains” less external heat.
The payback time calculation was performed based on Equation (2) and on the insulator installation values indicated in Table 11. The payback time calculated for the scenario that used PET wool will be approximately three years (3.04 years) while in the mineral wool scenario, it will be about five months longer (3.44 years). Thus, Table 16 indicates that up to the fourth year of installation, PET wool is more economical but from the fourth year onwards the situation is reversed. That is, mineral wool provides greater long-term savings for the city of Macaé.

4.3. Comparison between Scenarios

The comparison of energy consumption results between the analyzed scenarios for the two cities indicates that in Macaé where average monthly temperatures are higher, the use of thermal insulation becomes more advantageous, providing greater savings, especially in the medium and long term. Table 17 compiles the obtained results and highlights the difference between the analyzed scenarios.
Table 18 shows the comparison of the payback time. It is noticed that in Macaé, the payback time is shorter than in the city of Uberlândia, since the annual savings in electricity is greater and, consequently, the financial savings. In other words, in the city of Uberlândia, the investment with the installation is paid in four years for PET wool and five years and one month for mineral wool. In Macaé, both insulators pay for themselves in about three years. From the payback onwards, the application of the two insulators starts to generate passive savings for the system.
Regarding the cost-effectiveness of each system, it is noticed that in Uberlândia the PET wool system has a greater advantage over the mineral wool system up to the eighth year. After the eighth year, the relationship is inverted. In Macaé, very similar results were obtained, but this inversion occurs in the fifth year of installation. It is important to point out that the greater savings generated in Macaé are also due to the fact that the cost of kWh is higher in this city than in Uberlândia, that is, a difference of approximately 13.40%.

5. Conclusions

The main objective of this paper was to analyze alternatives for thermal insulation applied to the inner part of the envelope of a shipping container with the purpose of using it for construction of emergency housing construction. It is noticeable that in recent years the frequency and intensity of natural disasters have been increasing, influenced by the lack of urban planning, disorderly growth of cities, and climate change. Therefore, it is important that more studies are conducted both to mitigate the damage caused by disasters and to prevent them from recurring frequently over the years.
The results indicated that mineral wool had an advantage in reducing electricity consumption for cooling the housing unit. For the city of Uberlândia, the system with PET wool reduced the consumption of electricity by 30.98%, while the system with mineral wool achieved an annual reduction in consumption of 42.80%. In the city of Macaé, the reduction in electricity consumption with PET wool was 28.69%, and the system with mineral wool saved 44.99% within a year. Furthermore, the analysis of the scenarios when the average monthly temperatures are lower indicates that PET wool obtains better results when compared to mineral wool.
Regarding the life cycle of the materials, both PET wool and mineral wool do not suffer deformations and deterioration over the years, therefore, the insulators do not have an estimated lifespan. Therefore, this criterion does not exempt the use of any material following the building life cycle. Concerning the installation cost, it was evident that mineral wool is the most expensive insulation option, being 45.52% more expensive than PET wool. However, in the long term, the mineral wool system is more cost-effective in both cities compared to PET wool.
The results indicate that in the city of Uberlândia, PET wool has a payback time of approximately four years while for mineral wool it is five years and one month. In turn, in the city of Macaé, the PET wool system had a payback time of three years while for mineral wool it is three years and five months. In this context, in Uberlândia, the mineral wool system obtained a better cost–benefit ratio from the eighth year onwards while in Macaé, from the 5th year onwards. Thus, in terms of energy efficiency, mineral wool stands out in relation to PET wool in both cities, however, in financial terms, the system with PET wool proved to be more efficient during the first eight years of installation in the city in Uberlândia and the first five years in the city of Macaé.
Although computer simulation is being increasingly used to analyze different alternative techniques and construction materials, thus guiding design decisions, this research is subjected to some limitations that should be considered, and some may serve as a stimulus for future work. First, this paper considers only two types of insulating material, PET wool and mineral wool which are the most common in the studied cities. Future research should consider a wider variety of insulators, thus expanding the validity of the results. Second, computer simulation has evolved a lot in recent years, but the reliability of the results directly depends on the parameters adopted during the modeling and simulation steps. In this context, the results of similar studies may vary according to the adopted material parameters, climatic data, and software used. It is suggested that future research analyze the effect of each of these characteristics on this model. Third, this research only considered the energy consumption related to the cooling of the housing unit due to the tropical climate of the analyzed cities which rarely requires heating of buildings aiming at thermal comfort. Future research should analyze the insulator’s behavior in regions with different climatic conditions.
Finally, this research focused on analyzing the effect of insulating the inner surfaces of the container. Possible treatments related to the structure’s external surface were not considered. Corten steel, the material that makes up the container’s sides, has high thermal conductivity and reflectance. However, these two properties can be improved using special paints or coatings. Since the thermal conductivity of this material has a direct impact on the building’s internal environment, its high reflectance can impact the entire surroundings. The re-emission of long-wave radiation from the sun reflected in containers can result in an unwanted increase in the temperature of the local microclimate, mainly in regions with a high concentration of buildings in containers. Future research should analyze the impact of changes in the outer covering of container houses and their influence on the surroundings. Therefore, current research can be extended in several directions, and one of them is the comparison of simulation results with field data. Research on the subject will follow this direction for this group.

Author Contributions

Conceptualization, C.F.P.S. and A.C.F.M.; methodology, C.F.P.S., A.C.F.M. and B.B.F.d.C.; software, C.F.P.S.; validation, H.D.P.C., G.M. and A.N.H.; formal analysis, H.D.P.C., G.M. and A.N.H.; investigation, B.B.F.d.C., C.F.P.S. and A.C.F.M.; resources, C.F.P.S., A.C.F.M. and B.B.F.d.C.; data curation, C.F.P.S.; writing—original draft preparation, B.B.F.d.C. and C.F.P.S.; writing—review and editing, B.B.F.d.C., A.C.F.M., H.D.P.C., G.M. and A.N.H.; visualization, B.B.F.d.C. and C.F.P.S.; supervision, B.B.F.d.C. and A.C.F.M.; project administration, B.B.F.d.C. and A.C.F.M. All authors have read and agreed to the published version of the manuscript.

Funding

This research received no external funding.

Institutional Review Board Statement

Not applicable.

Informed Consent Statement

Not applicable.

Data Availability Statement

Not applicable.

Acknowledgments

Assed Haddad would like to acknowledge Conselho Nacional de Desenvolvimento Científico e Tecnológico (CNPq), and Fundação Carlos Chagas Filho de Amparo à Pesquisa do Estado do Rio de Janeiro (FAPERJ), which helped in the development of this work. Bruno B. F. da Costa would like to acknowledge Prefeitura Municipal de Macaé which helped in the development of this work.

Conflicts of Interest

The authors declare no conflict of interest.

References

  1. Norwegian Refugee Council. Children and Youth in Internal Displacement, 1st ed.; The Internal Displacement Monitoring Centre: Geneva, Switzerland, 2022; p. 12. [Google Scholar]
  2. Ling, P.C.H.; Tan, C.S.; Saggaff, A. Feasibility of ISO shipping container as transitional shelter—A review. IOP Conf. Ser. Mater. Sci. Eng. 2019, 620, 012056. [Google Scholar] [CrossRef]
  3. Hong, Y. A study on the condition of temporary housing following disasters: Focus on container housing. Front. Archit. Res. 2017, 6, 374–383. [Google Scholar] [CrossRef]
  4. Lin, H.; Cheng, J. A study of the simulation and analysis of the flow field of natural convection for a container house. Sustainability 2020, 12, 9845. [Google Scholar] [CrossRef]
  5. Tanyer, A.M.; Tavukcuoglu, A.; Bekboliev, M. Assessing the airtightness performance of container houses in relation to its effect on energy efficiency. Build. Environ. 2018, 134, 59–73. [Google Scholar] [CrossRef]
  6. Dumas, A.; Trancossi, M.; Madonia, M.; Bonnici, M. A novel concept of container house with zero energetic consumption. SAE Int. 2012, 1, 1507. [Google Scholar] [CrossRef]
  7. Bertolini, M.; Guardigli, L. Upcycling shipping containers as building components: An environmental impact assessment. Int. J. Life Cycle Assess. 2020, 25, 947–963. [Google Scholar] [CrossRef]
  8. Shi, M. Assessment of the impact of windows and building orientation on the energy intensity of container houses using BIM. IOP Conf. Ser. Earth Environ. Sci. 2021, 769, 022023. [Google Scholar] [CrossRef]
  9. Pereira-de-Oliveira, L.A.; Bernardo, L.F.A.; Marques, A.R.A. Architectural building design with refurbished shipping containers: A typological and modular approach. J. Eng. Res. 2022, 10, 1–20. [Google Scholar] [CrossRef]
  10. Elrayies, G.M. Thermal performance assessment of shipping container architecture in hot and humid climates. Int. J. Adv. Sci. Eng. Inf. Technol. 2017, 7, 1114–1126. [Google Scholar] [CrossRef]
  11. Shen, J.; Copertaro, B.; Zhang, X.; Koke, J.; Kaufmann, P.; Krause, S. Exploring the potential of climate-adaptative container building design under future climates scenarios in three different climate zones. Sustainability 2020, 12, 108. [Google Scholar] [CrossRef]
  12. Koke, J.; Schippmann, A.; Shen, J.; Zhang, X.; Kaufmann, P.; Krause, S. Strategies of design concepts and energy systems for nearly zero-energy container buildings (NZECBs) in different climates. Buildings 2021, 11, 364. [Google Scholar] [CrossRef]
  13. Dara, C.; Hachem-Vermette, C.; Assefa, G. Life cycle assessment and life cycle costing of container-based single-family housing in Canada: A case study. Build. Environ. 2019, 163, 106332. [Google Scholar] [CrossRef]
  14. Tan, C.S.; Ling, P.C.H. Shipping container as shelter provision solution for post-disaster reconstruction. E3S Web Conf. 2018, 65, 08007. [Google Scholar] [CrossRef]
  15. Islam, H.; Zhang, G.; Setunge, S.; Bhuiyan, M.A. Life cycle assessment of shipping container home: A sustainable construction. Energy Build. 2016, 128, 673–685. [Google Scholar] [CrossRef]
  16. Giiriunas, K.; Sezen, H.; Dupaix, R.B. Evaluation, modeling, and analysis of shipping container building structures. Eng. Struct. 2012, 43, 48–57. [Google Scholar] [CrossRef]
  17. Bowley, W.; Mukhopadhyaya, P. A sustainable design for an off-grid passive container house. Int. Rev. Appl. Sci. Eng. 2017, 8, 145–152. [Google Scholar] [CrossRef]
  18. Musa, M.F.; Yusof, M.R.; Mohammad, M.F.; Samsudin, N.S. Towards the adoption of modular construction and prefabrication in the construction environment: A case study in Malaysia. ARPN J. Eng. Appl. Sci. 2016, 11, 8122–8131. [Google Scholar]
  19. Chatzimichailidou, M.; Ma, Y. Using BIM in the safety risk management of modular construction. Saf. Sci. 2022, 154, 105852. [Google Scholar] [CrossRef]
  20. Lacey, A.W.; Chen, W.; Hao, H.; Bi, K. Structural response of modular buildings—An overview. J. Build. Eng. 2018, 16, 45–56. [Google Scholar] [CrossRef]
  21. Ye, Z.; Giriunas, K.; Sezen, H.; Wu, G.; Feng, D. State-of-the-art review and investigation of structural stability in multi-story modular buildings. J. Build. Eng. 2021, 33, 101844. [Google Scholar] [CrossRef]
  22. Rakotonjanahary, M.; Scholzen, F.; Waldmann, D. Summertime overheating risk assessment of a flexible plug-in modular unit in Luxemburgo. Sustainability 2020, 12, 8474. [Google Scholar] [CrossRef]
  23. Cao, X.; Li, X.; Zhu, Y.; Zhang, Z. A comparative study of environmental performance between prefabricated and traditional residential buildings in China. J. Clean. Prod. 2015, 109, 131–143. [Google Scholar] [CrossRef]
  24. Kristiansen, A.B.; Zhao, B.Y.; Ma, T.; Wang, R.Z. The viability of solar photovoltaic powered off-grid zero energy buildings based on a container home. J. Clean. Prod. 2021, 286, 125312. [Google Scholar] [CrossRef]
  25. Jeong, G.; Kim, H.; Lee, H.; Park, M.; Hyun, H. Analysis of safety risk factors of modular construction to identify accident trends. J. Asian Archit. Build. Eng. 2022, 21, 1040–1052. [Google Scholar] [CrossRef]
  26. Ahn, S.; Crouch, L.; Kim, T.W.; Rameezdeen, R. Comparison of worker safety risks between onsite and offsite construction methods: A site management perspective. J. Constr. Eng. Manag. 2020, 146, 05020010. [Google Scholar] [CrossRef]
  27. Manuel, B.; Arif, B.T.K.T.; Thibaut, G.; Paul-George, I.; Joseph, R.; Kein, V.B. Sea Container Building. Bachelor’s Thesis, Universitat Politècnica de Catalunya, Barcelona, Spain, 14 June 2017. [Google Scholar]
  28. Moore, C.M.; Yildirim, S.G.; Baur, S.W. Educational adaption of cargo container design features. In Proceedings of the ASEE Zone III Conference, Springfield, IL, USA, 23–25 September 2015. [Google Scholar]
  29. Su, M.; Yang, B.; Wang, X. Research on integrated design of modular steel structure container buildings based on BIM. Adv. Civ. Eng. 2022, 2022, 4574676. [Google Scholar] [CrossRef]
  30. International Residential Code. Available online: https://archive.org/download/gov.law.icc.irc.2009/icc.irc.2009.pdf (accessed on 28 January 2023).
  31. ISO 668:1995; Series 1 Freight Containers-Classification, Dimensions and Ratings. International Organization for Standardization: Geneva, Switzerland, 1995.
  32. ISO 830:1999; Freight Containers-Vocabulary. International Organization for Standardization: Geneva, Switzerland, 1999.
  33. ISO 6346:1995; Freight Containers Coding, Identification and Marking. International Organization for Standardization: Geneva, Switzerland, 1995.
  34. ISO 1496-1:1990; Series 1 Freight Containers-Specification and Testing—Part 1: General Cargo Containers for General Purposes. International Organization for Standardization: Geneva, Switzerland, 1990.
  35. ISO 1161:1984/Cor 1:1990; Technical Corrigendum 1:1990 to ISO 1161:1984. International Organization for Standardization: Geneva, Switzerland, 1990.
  36. ISO 2308:1972; Hooks for Lifting Freight Containers of up to 30 Tonnes Capacity-Basic Requirements. International Organization for Standardization: Geneva, Switzerland, 1972.
  37. ISO 3874:1997; Series 1 Freight Containers Handling and Securing. International Organization for Standardization: Geneva, Switzerland, 1997.
  38. International Maritime Organization. International Convention for Safe Containers; International Maritime Organization: London, UK, 1996. [Google Scholar]
  39. Zafra, R.G.; Mayo, J.R.M.; Villareal, P.J.M.; De Padua, V.M.N.; Castillo, M.a.H.T.; Sundo, M.B.; Madlangbayan, M.S. Structural and thermal performance assessment of shipping container as post-disaster housing in tropical climates. Civ. Eng. J. 2021, 7, 1437–1458. [Google Scholar] [CrossRef]
  40. Obia, A.E. Architectural adaptation of the shipping container for housing the internally displaced persons in South-South Nigeria. Int. J. Archit. Eng. Constr. 2020, 9, 1–9. [Google Scholar] [CrossRef]
  41. Wong, E.K.H.; Tan, C.S.; Ling, P.C.H. Feasibility of using ISO shipping container to build low cost house in Malaysia. Int. J. Eng. Technol. 2018, 7, 933–939. [Google Scholar] [CrossRef]
  42. Sun, Z.; Mei, H.; Ni, R. Overview of modular design strategy of the shipping container architecture in cold regions. IOP Conf. Ser. Earth Environ. Sci. 2017, 63, 012035. [Google Scholar] [CrossRef]
  43. Dumas, A.; Trancossi, M.; Madonia, M.; Coppola, M. Zero emission temporary habitation: A passive container house acclimatized by geothermal water. J. Sol. Energy Eng. 2014, 136, 044505. [Google Scholar] [CrossRef]
  44. Zhang, G.; Setunge, S.; Elmpt, S. Using shipping containers to provide temporary housing in post-disaster recovery: Social case studies. Procedia Econ. Financ. 2014, 18, 618–625. [Google Scholar] [CrossRef]
  45. Caia, G.; Ventimiglia, F.; Maass, A. Container vs. dacha: The psychological effects of temporary housing characteristics on earthquake survivors. J. Environ. Psychol. 2010, 30, 60–66. [Google Scholar] [CrossRef]
  46. Revit: BIM Software for Designers, Builders, and Doers. Available online: www.autodesk.com (accessed on 15 January 2023).
  47. Eastman, C.; Teicholz, P.; Sacks, R.; Liston, K. BIM Handbook: A Guide to Building Information Modeling for Owners, Managers, Designers, Engineers and Contractors, 1st ed.; Bookman: Porto Alegre, Brazil, 2014. [Google Scholar]
  48. Filho, M.V.A.P.M.; da Costa, B.B.F.; Najjar, M.; Figueiredo, K.V.; Mendonça, M.B.; Haddad, A.N. Sustainability assessment of a low-income building: A BIM-LCSA-FAHP-based analysis. Buildings 2022, 12, 181. [Google Scholar] [CrossRef]
  49. eQUEST: The Quick Energy Simulation Tool. Available online: www.doe2.com/equest (accessed on 15 January 2023).
  50. ABNT 16401-2:2008; Central and Unitary Air Conditioning Systems. Part 2: Thermal comfort. Brazilian Association of Technical Standards: São Paulo, Brazil, 2008.
  51. ISO 17772-1:2017; Energy Performance of Buildings—Indoor Environmental Quality—Part 1: Indoor Environmental Input Parameters for the Design and Assessment of Energy Performance of Buildings. International Organization for Standardization: Geneva, Switzerland, 2017.
Figure 1. Export and import flow of goods using containers.
Designs 07 00064 g001
Figure 2. Research methodological framework.
Designs 07 00064 g002
Figure 3. Final layout configuration.
Designs 07 00064 g003
Figure 4. Assembly of the analyzed container walls.
Designs 07 00064 g004
Figure 5. Cumulative consumption cost of each scenario for Uberlândia.
Designs 07 00064 g005
Figure 6. Cumulative consumption cost of each scenario for Macaé.
Designs 07 00064 g006
Table 1. Geometric characteristics of the most popular containers.
ModelExternal DimensionsMinimal Internal Dimensions
LengthWidthHighLengthWidthHighFloor Area
(m)(m)(m)(m)(m)(m)(m2)
20-ft container6.0962.4382.5915.7102.3522.38513.430
40-ft container12.1922.4382.59111.9982.3522.38528.219
20-ft HC container6.0962.4382.8965.7102.3522.65513.430
40-ft HC container12.1922.4382.89611.9982.3522.65528.219
Table 2. Summary of the analyzed scenarios.
Analyzed ScenarioInsulator Thickness (mm)Insulator Type
10No insulator
250PET wool
350Mineral wool
Table 3. Insulating materials properties.
MaterialInsulator Thickness (mm)Thermal Conductivity (W/m.K)Thermal Resistance (m2.K/W)Density (Kg/m3)Thermal Transmittance (W/m2.°C)
Mineral wool500.0311.61320.62
PET wool500.0411.20300.83
Wood floor300.120.254504.00
Drywall180.350.0572019.44
Corten Steel2.6554.72 × 10−5780021,153.85
Table 4. Average, maximum, and minimum temperatures of the analyzed cities.
CityMedium TemperatureJan.Feb.Mar.Apr.MayJun.Jul.Aug.Sep.Oct.Nov.Dec.
UberlândiaHigh28 °C28 °C28 °C28 °C26 °C25 °C26 °C27 °C29 °C29 °C29 °C28 °C
Average23 °C24 °C23 °C23 °C21 °C19 °C20 °C21 °C23 °C24 °C23 °C23 °C
Low20 °C20 °C20 °C18 °C16 °C15 °C15 °C16 °C18 °C19 °C20 °C20 °C
MacaéHigh31 °C32 °C31 °C30 °C28 °C27 °C27 °C27 °C28 °C28 °C29 °C31 °C
Average27 °C27 °C26 °C25 °C23 °C22 °C22 °C22 °C23 °C24 °C25 °C26 °C
Low23 °C23 °C23 °C21 °C19 °C18 °C18 °C18 °C19 °C20 °C22 °C23 °C
Table 5. Occupancy schedule.
HourDevices UseLightingHourDevices UseLightingHourDevices UseLighting
01:0050009:00701517:005020
02:0050010:00501518:007020
03:0050011:0050519:007020
04:0050012:0060520:008020
05:0050013:0060521:008020
06:0050014:0060522:008020
07:00501515:0060523:006015
08:00701516:0050524:006015
Source: ISO 17772-1:2017—Energy performance of buildings [51].
Table 6. Other parameters adopted in the eQuest.
ParameterAdopted Option
Heat transmission through opaque exterior surfacesDelayed method via conduction transform functions.
Heat transmission through transparent surfaces84% glass solar factor
Weather dataBased on the Revit database for stations located in the analyzed cities.
Occupancy schedulesBased on ISO 17772-1:2017 [51]
HVAC SystemResidential split/compact system gas residencial 14 SEER/0.9 AFUE < 5.5 ton.
Table 7. Payback calculation.
YearPET WoolMineral Wool
1II—AE1II—AE1
2II—(AE1 + AE2)II—(AE1 + AE2)
(…)(…)(…)
20II—(AE1 + (…) + AE20)II—(AE1 + (…) + AE20)
Table 8. Annual electricity consumption results in each simulated model for Uberlândia.
MonthConsumption (kWh)
No InsulationPET WoolMineral Wool
January178.20119.6098.50
February175.50119.9095.30
March239.60172.90127.20
April216.40145.80113.40
May126.6079.6079.60
June107.9070.1075.60
July94.3062.5068.50
August133.6088.2090.30
September200.00142.20117.10
October201.40146.70110.10
November178.40127.3098.60
December229.70161.90116.40
Annual consumption2081.601436.701190.60
Table 9. Reduction in primary energy consumption (RedCEP).
MaterialCEP, RefCEP, RealFceRedCEP
Mineral wool2081.601190.601.642.80%
PET wool2081.601436.701.630.98%
Table 10. Percentage reduction in electricity costs between the simulated systems for Uberlândia.
MonthPET Wool
X
No Insulator
Mineral Wool
X
No Insulator
Mineral Wool
X
PET Wool
January32.88%44.73%11.84% 1
February31.68%45.70%14.02% 1
March27.84%46.91%19.07% 1
April32.62%47.60%14.97% 1
May37.12%37.12%0.00% 2
June35.03%29.94%5.10% 3
July33.72%27.36%6.36% 3
August33.98%32.41%1.57% 3
September28.90%41.45%12.55% 1
October27.16%45.33%18.17% 1
November28.64%44.73%16.09% 1
December29.52%49.33%19.81% 1
1 Percentage of reduction that mineral wool achieved in energy costs compared to PET wool. 2 No difference between scenarios. 3 Percentage of reduction that PET wool achieved in energy costs compared to mineral wool.
Table 11. Insulators cost.
MaterialUnit Cost (R$/m2)Area (m2)Total Cost (R$)
Mineral wool25.83114.602960.12
PET wool14.59114.601672.01
Table 12. Annual savings and payback time for the city of Uberlândia over the next 20 years after installation.
YearPET Wool (R$)Mineral Wool (R$)
1−1250.78−2378.12
2−829.57−1796.18
3−408.37−1214.24
412.84−632.30
5434.04−50.36
6855.24531.58
71276.451113.52
81697.651695.45
92118.852277.39
102540.062859.33
112961.263441.27
123382.464023.21
133803.674605.15
144224.875187.09
154646.075769.03
165067.286350.97
175488.486932.90
185909.687514.84
196330.898096.78
206752.098678.72
Table 13. Annual electricity consumption results in each simulated model for Macaé.
MonthConsumption (kWh)
No InsulationPET WoolMineral Wool
January269.60202.50142.00
February298.00221.10149.60
March307.20223.90153.30
April209.10141.30112.00
May163.80107.7096.50
June103.9063.3068.40
July110.7071.8074.10
August125.3085.4085.70
September170.60120.60103.60
October183.60131.30106.00
November300.20222.50154.30
December297.30219.30151.30
Annual consumption2539.301810.701396.80
Table 14. Reduction in primary energy consumption (RedCEP).
MaterialCEP, RefCEP, RealFceRedCEP
Mineral wool2539.301396.801.644.99%
PET wool2539.301810.701.628.69%
Table 15. Percentage reduction in electricity costs between the simulated systems for Macaé.
MonthPET Wool
X
No Insulator
Mineral Wool
X
No Insulator
Mineral Wool
X
PET Wool
January24.89%47.33%22.44% 1
February25.81%49.80%23.99% 1
March27.12%50.10%22.98% 1
April32.42%46.44%14.01% 1
May34.25%41.09%6.84% 1
June39.08%34.17%4.91% 3
July35.14%33.06%2.08% 3
August31.84%31.60%0,24% 2
September29.31%39.27%9.96% 1
October28.49%42.27%13.78% 1
November25.88%48.60%22.72% 1
December26.24%49.11%22.87% 1
1 Percentage of reduction that mineral wool achieved in energy costs compared to PET wool. 2 No difference between scenarios. 3 Percentage of reduction that PET wool achieved in energy costs compared to mineral wool.
Table 16. Annual savings and payback time for the city of Macaé over the next 20 years after installation.
YearPET Wool (R$)Mineral Wool (R$)
1−1122.54−2098.49
2−573.10−1236.92
3−23.66−375.35
4525.78486.22
51075.221347.79
61624.662209.36
72174.103070.93
82723.543932.50
93272.984794.07
103822.425655.64
114371.866517.21
124921.307378.78
135470.748240.35
146020.189101.92
156569.629963.49
167119.0610,825.06
177668.5011,686.63
188217.9412,548.20
198767.3813,409.77
209316.8214,271.34
Table 17. Difference in electricity consumption in kWh between the cities of Uberlândia and Macaé for the three analyzed scenarios.
Uberlândia
(kWh)
Macaé
(kWh)
Consumption
Difference (kWh)
Consumption
Difference (%)
No insulator2081.602539.30457.7018.02
PET wool1436.701810.70374.0020.65
Mineral wool1190.601396.80206.2014.76
Table 18. Payback time for each system in the two cities.
UberlândiaMacaé
PET wool4 years3 years
Mineral wool5 years and 1 month3 years and 5 months
Disclaimer/Publisher’s Note: The statements, opinions and data contained in all publications are solely those of the individual author(s) and contributor(s) and not of MDPI and/or the editor(s). MDPI and/or the editor(s) disclaim responsibility for any injury to people or property resulting from any ideas, methods, instructions or products referred to in the content.

