
Sensing Methodologies in Agriculture for Monitoring Biotic Stress in Plants Due to Pathogens and Pests


Abstract
:1. Introduction
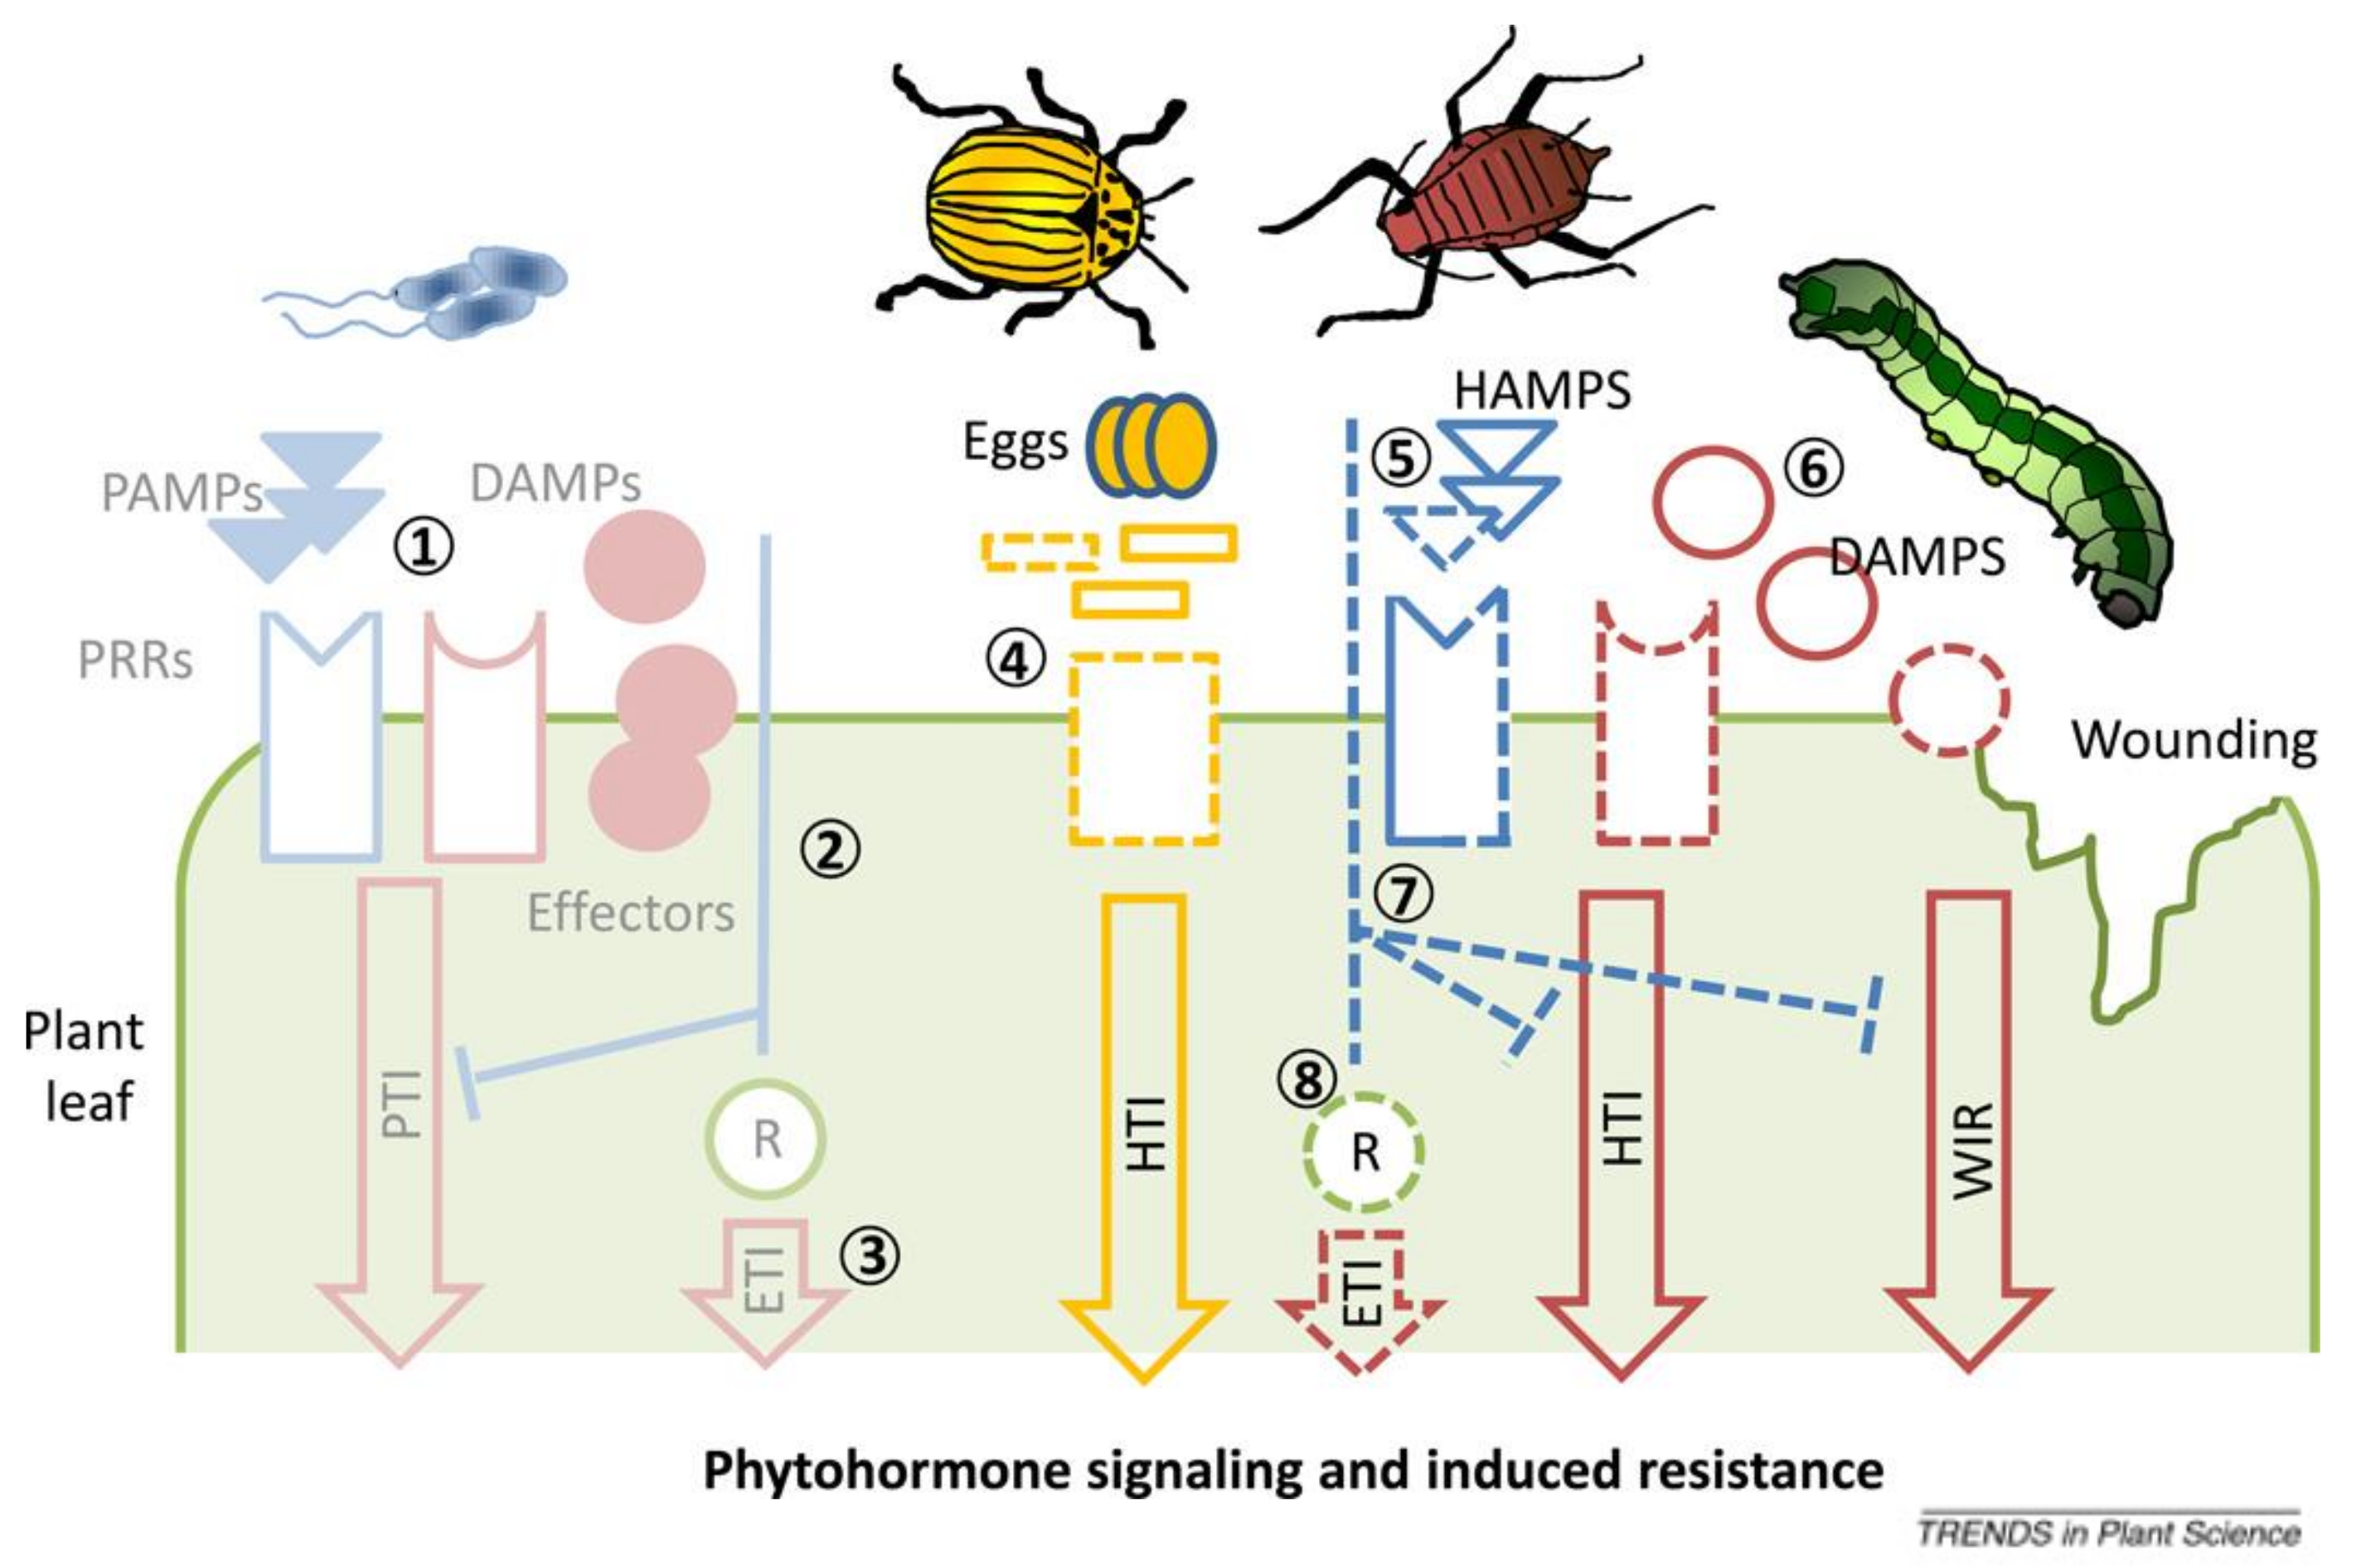
2. How Do Plants Respond to Stress?
2.1. Responses against Phytopathogens
2.2. Responses against Herbivorous Pests/Insects
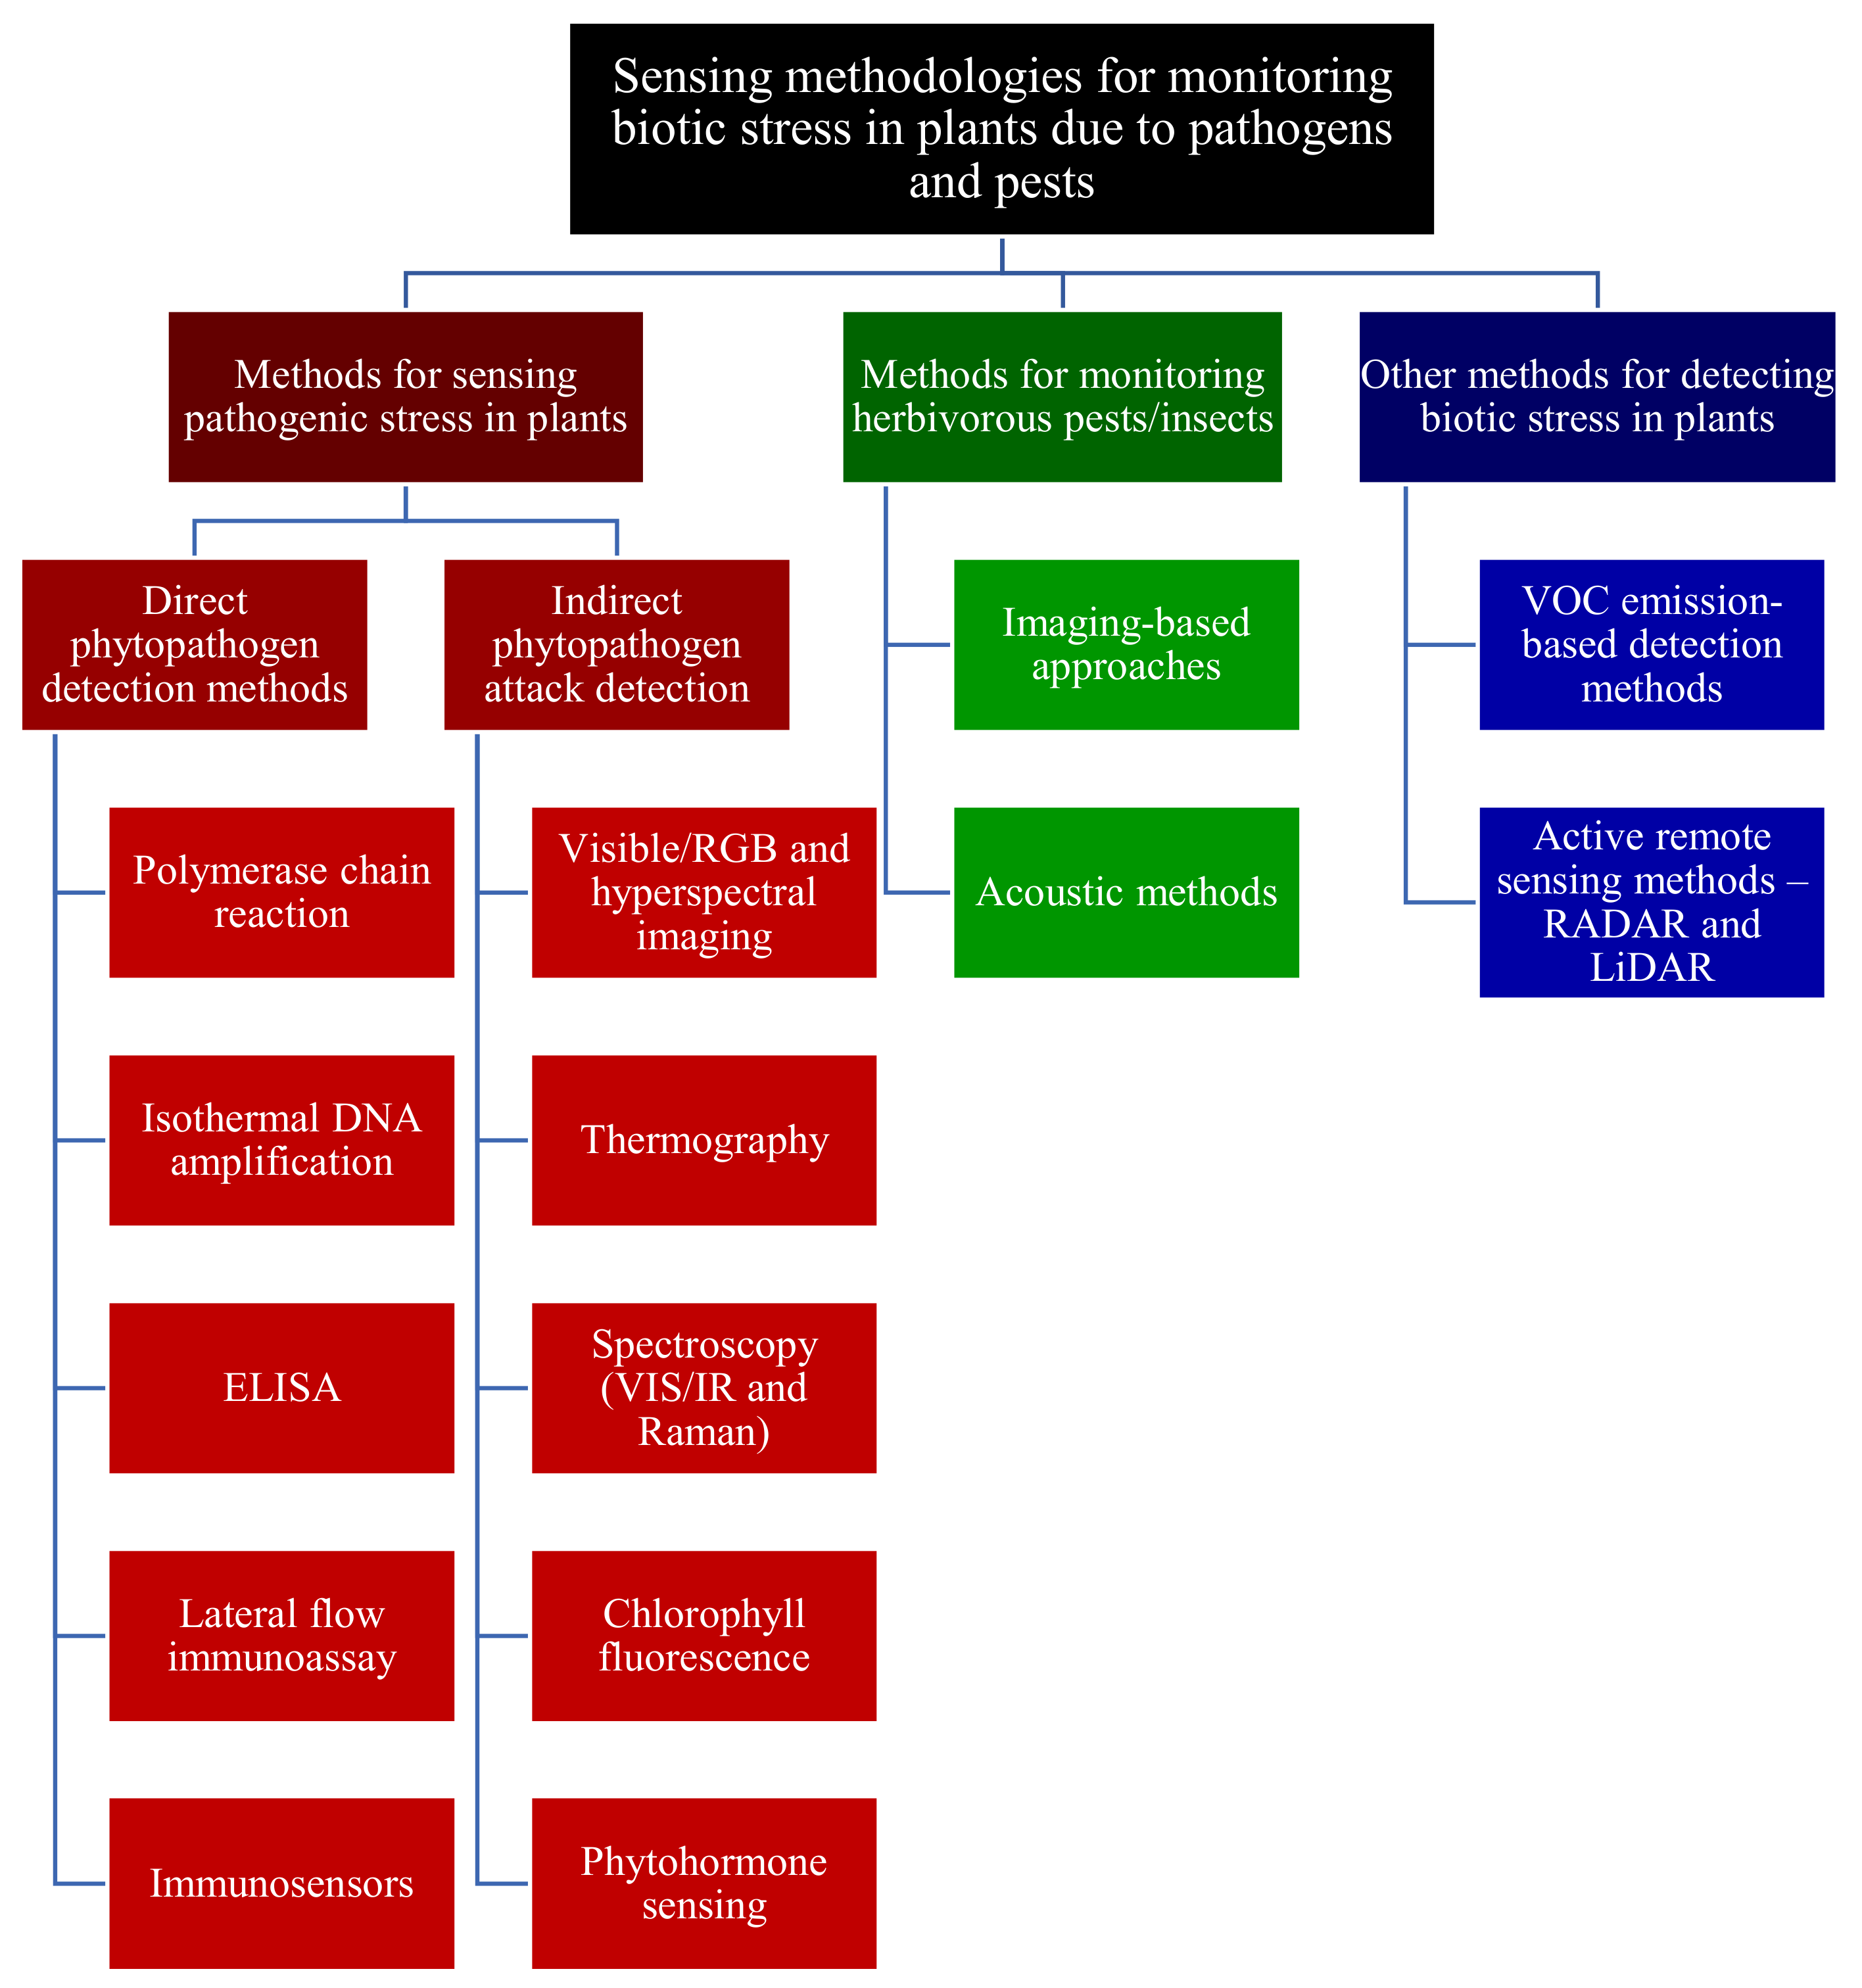
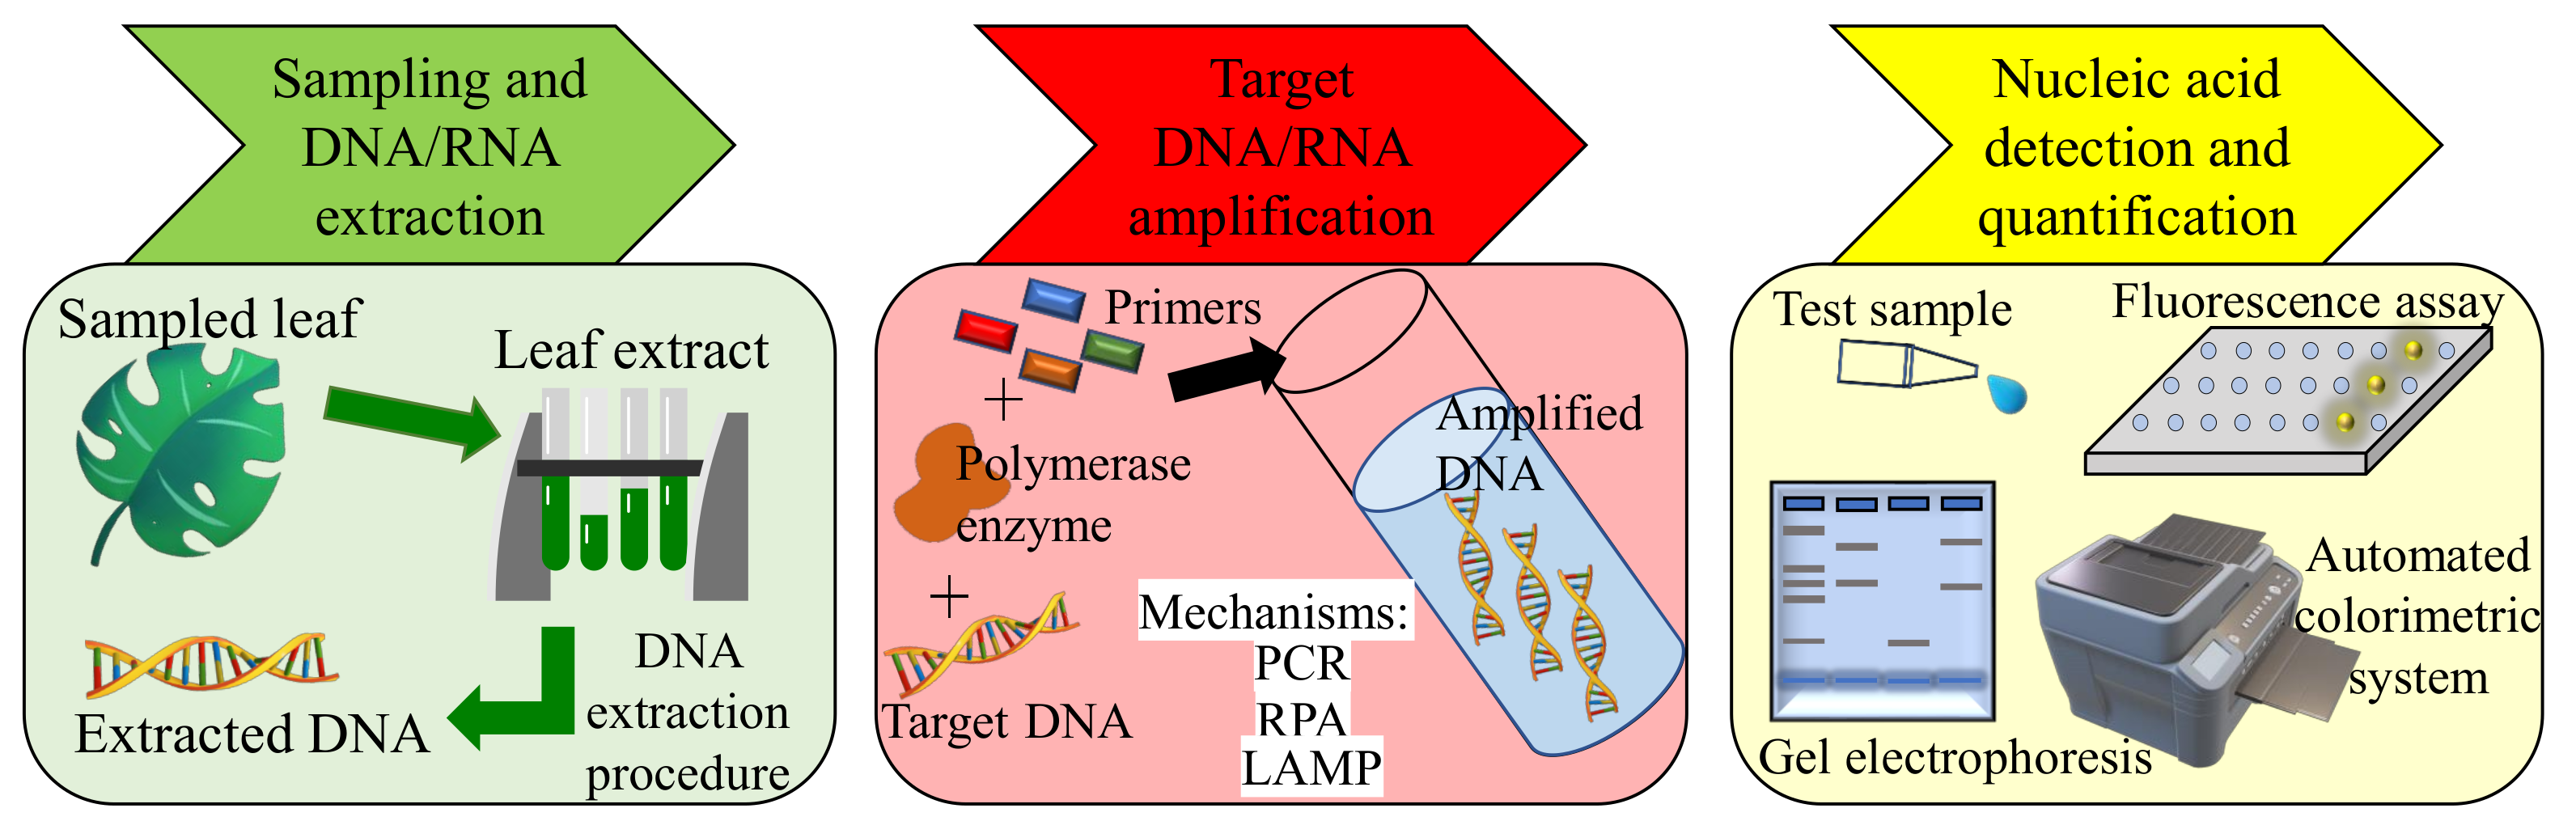
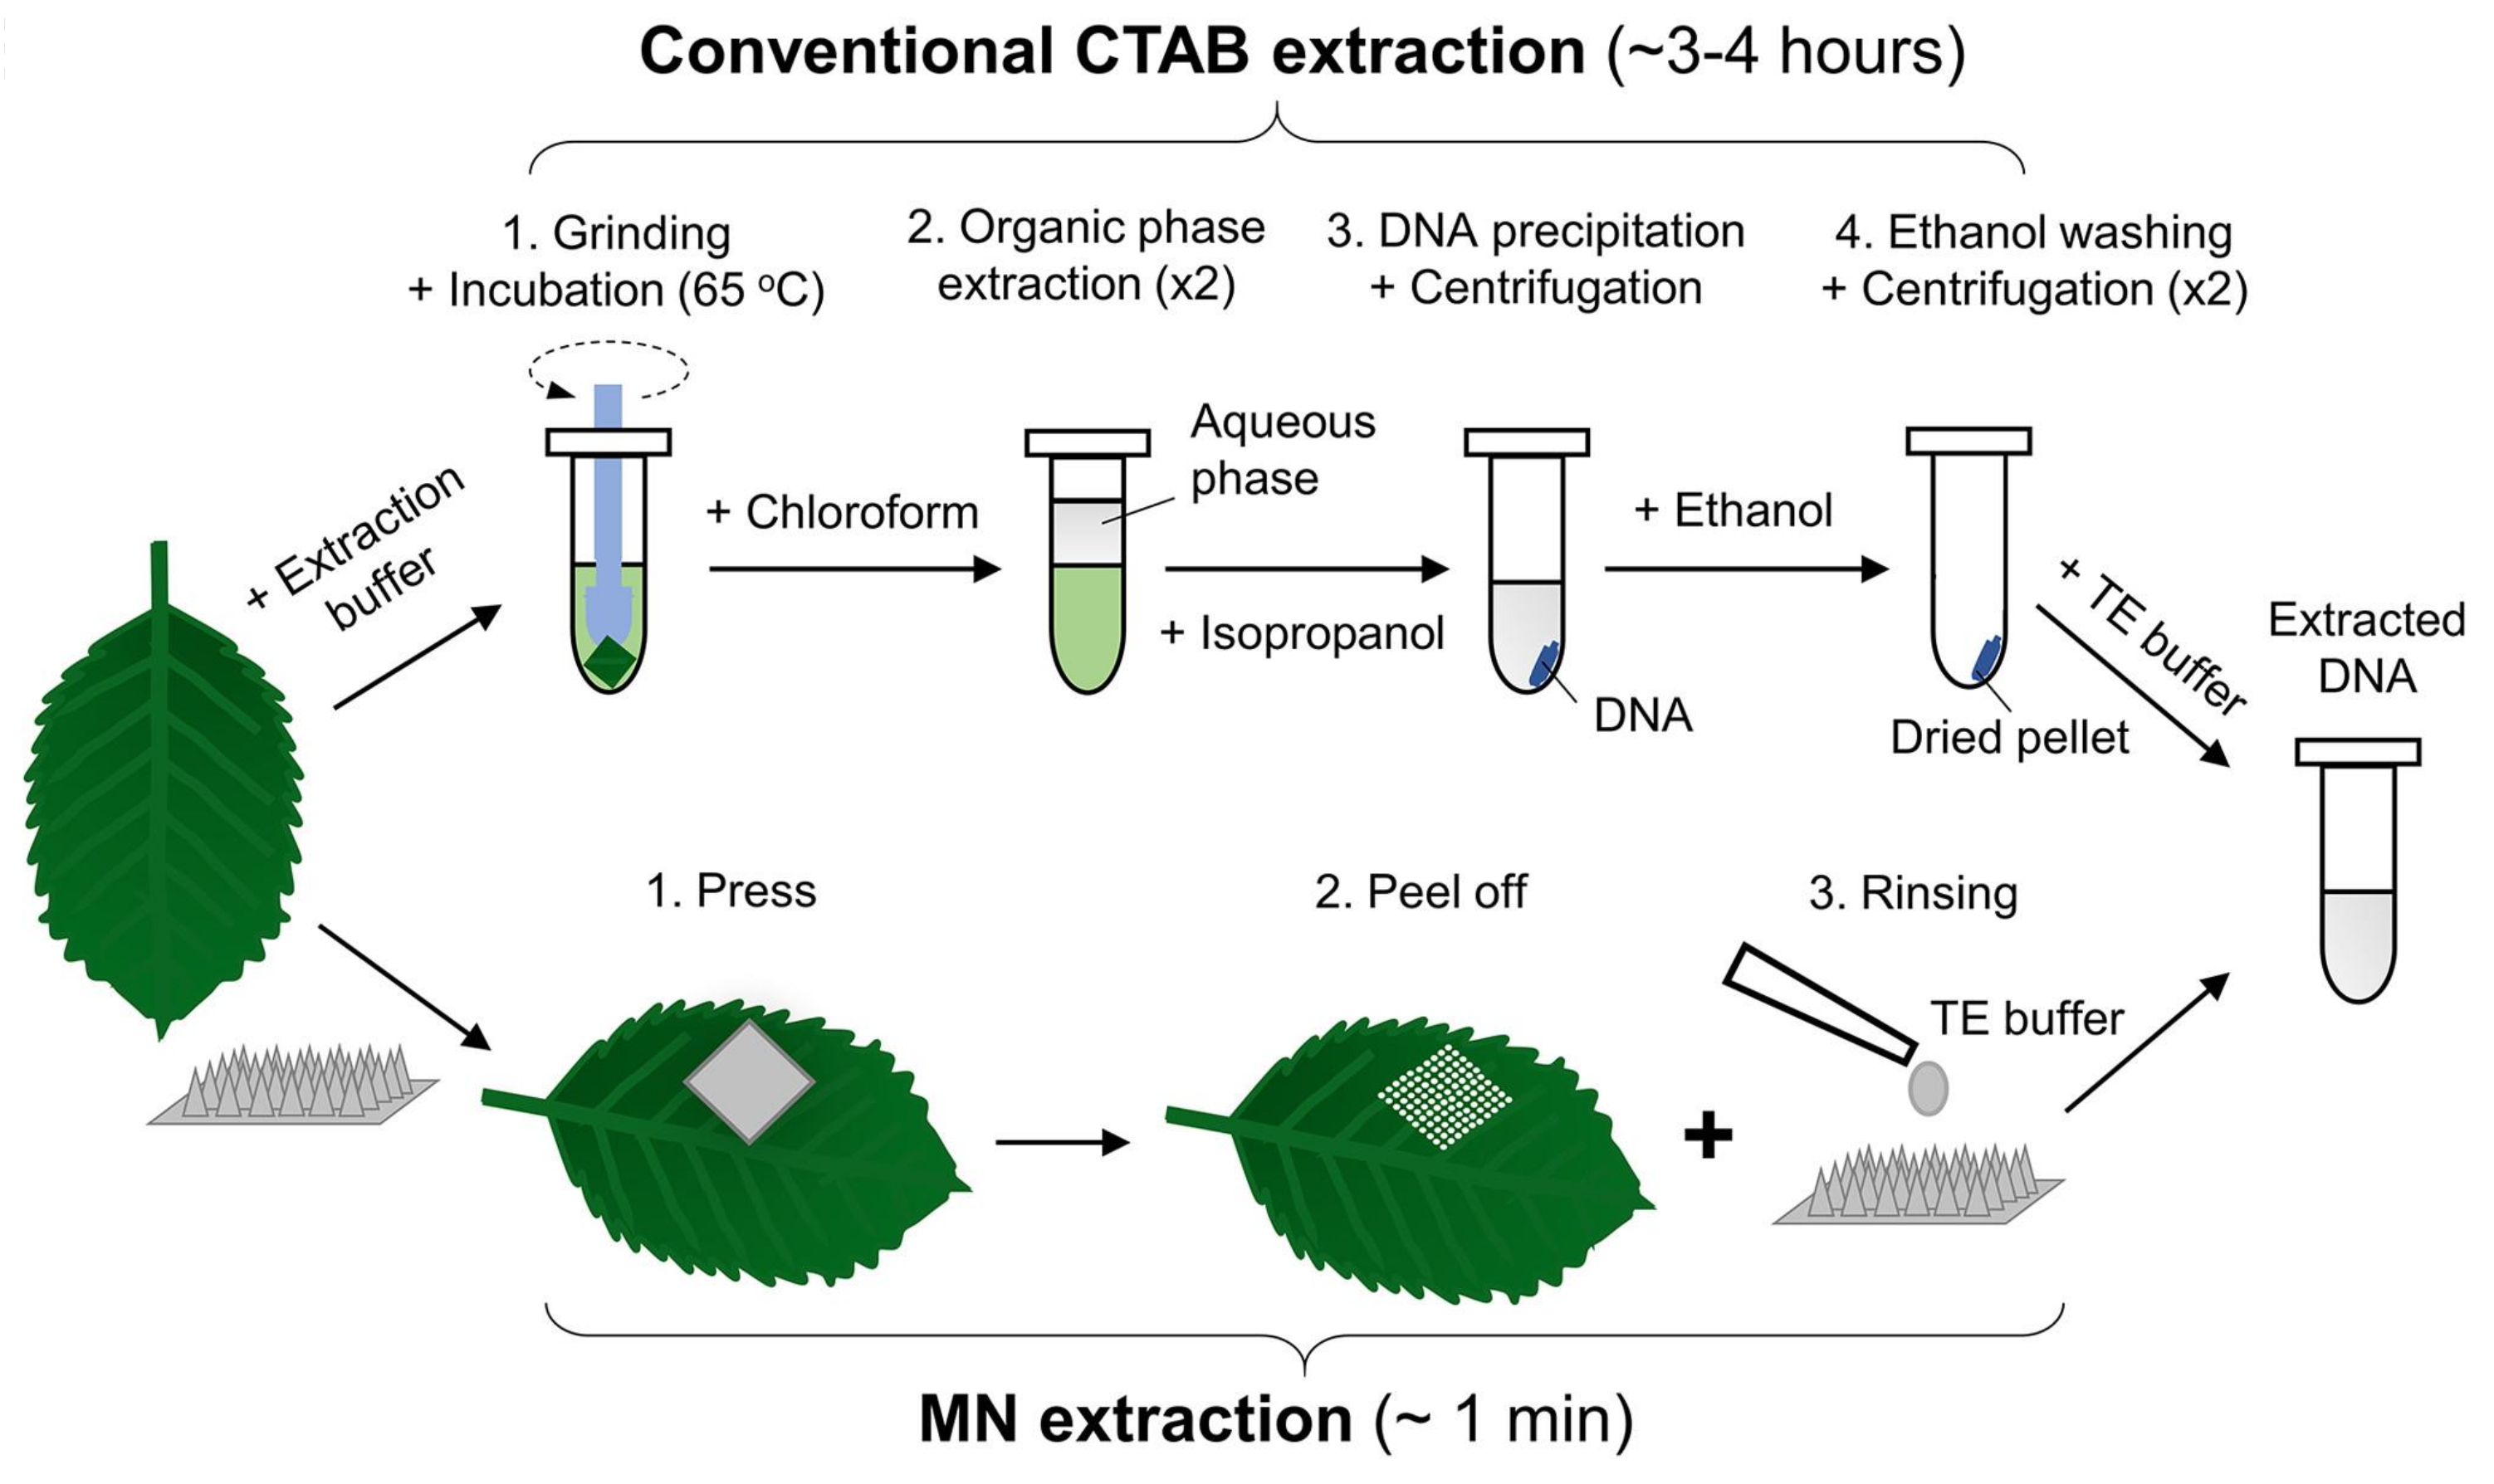
3. Methodologies for Sensing Pathogenic Fragment/Stress in Plants
3.1. Direct Pathogen Detection Methods
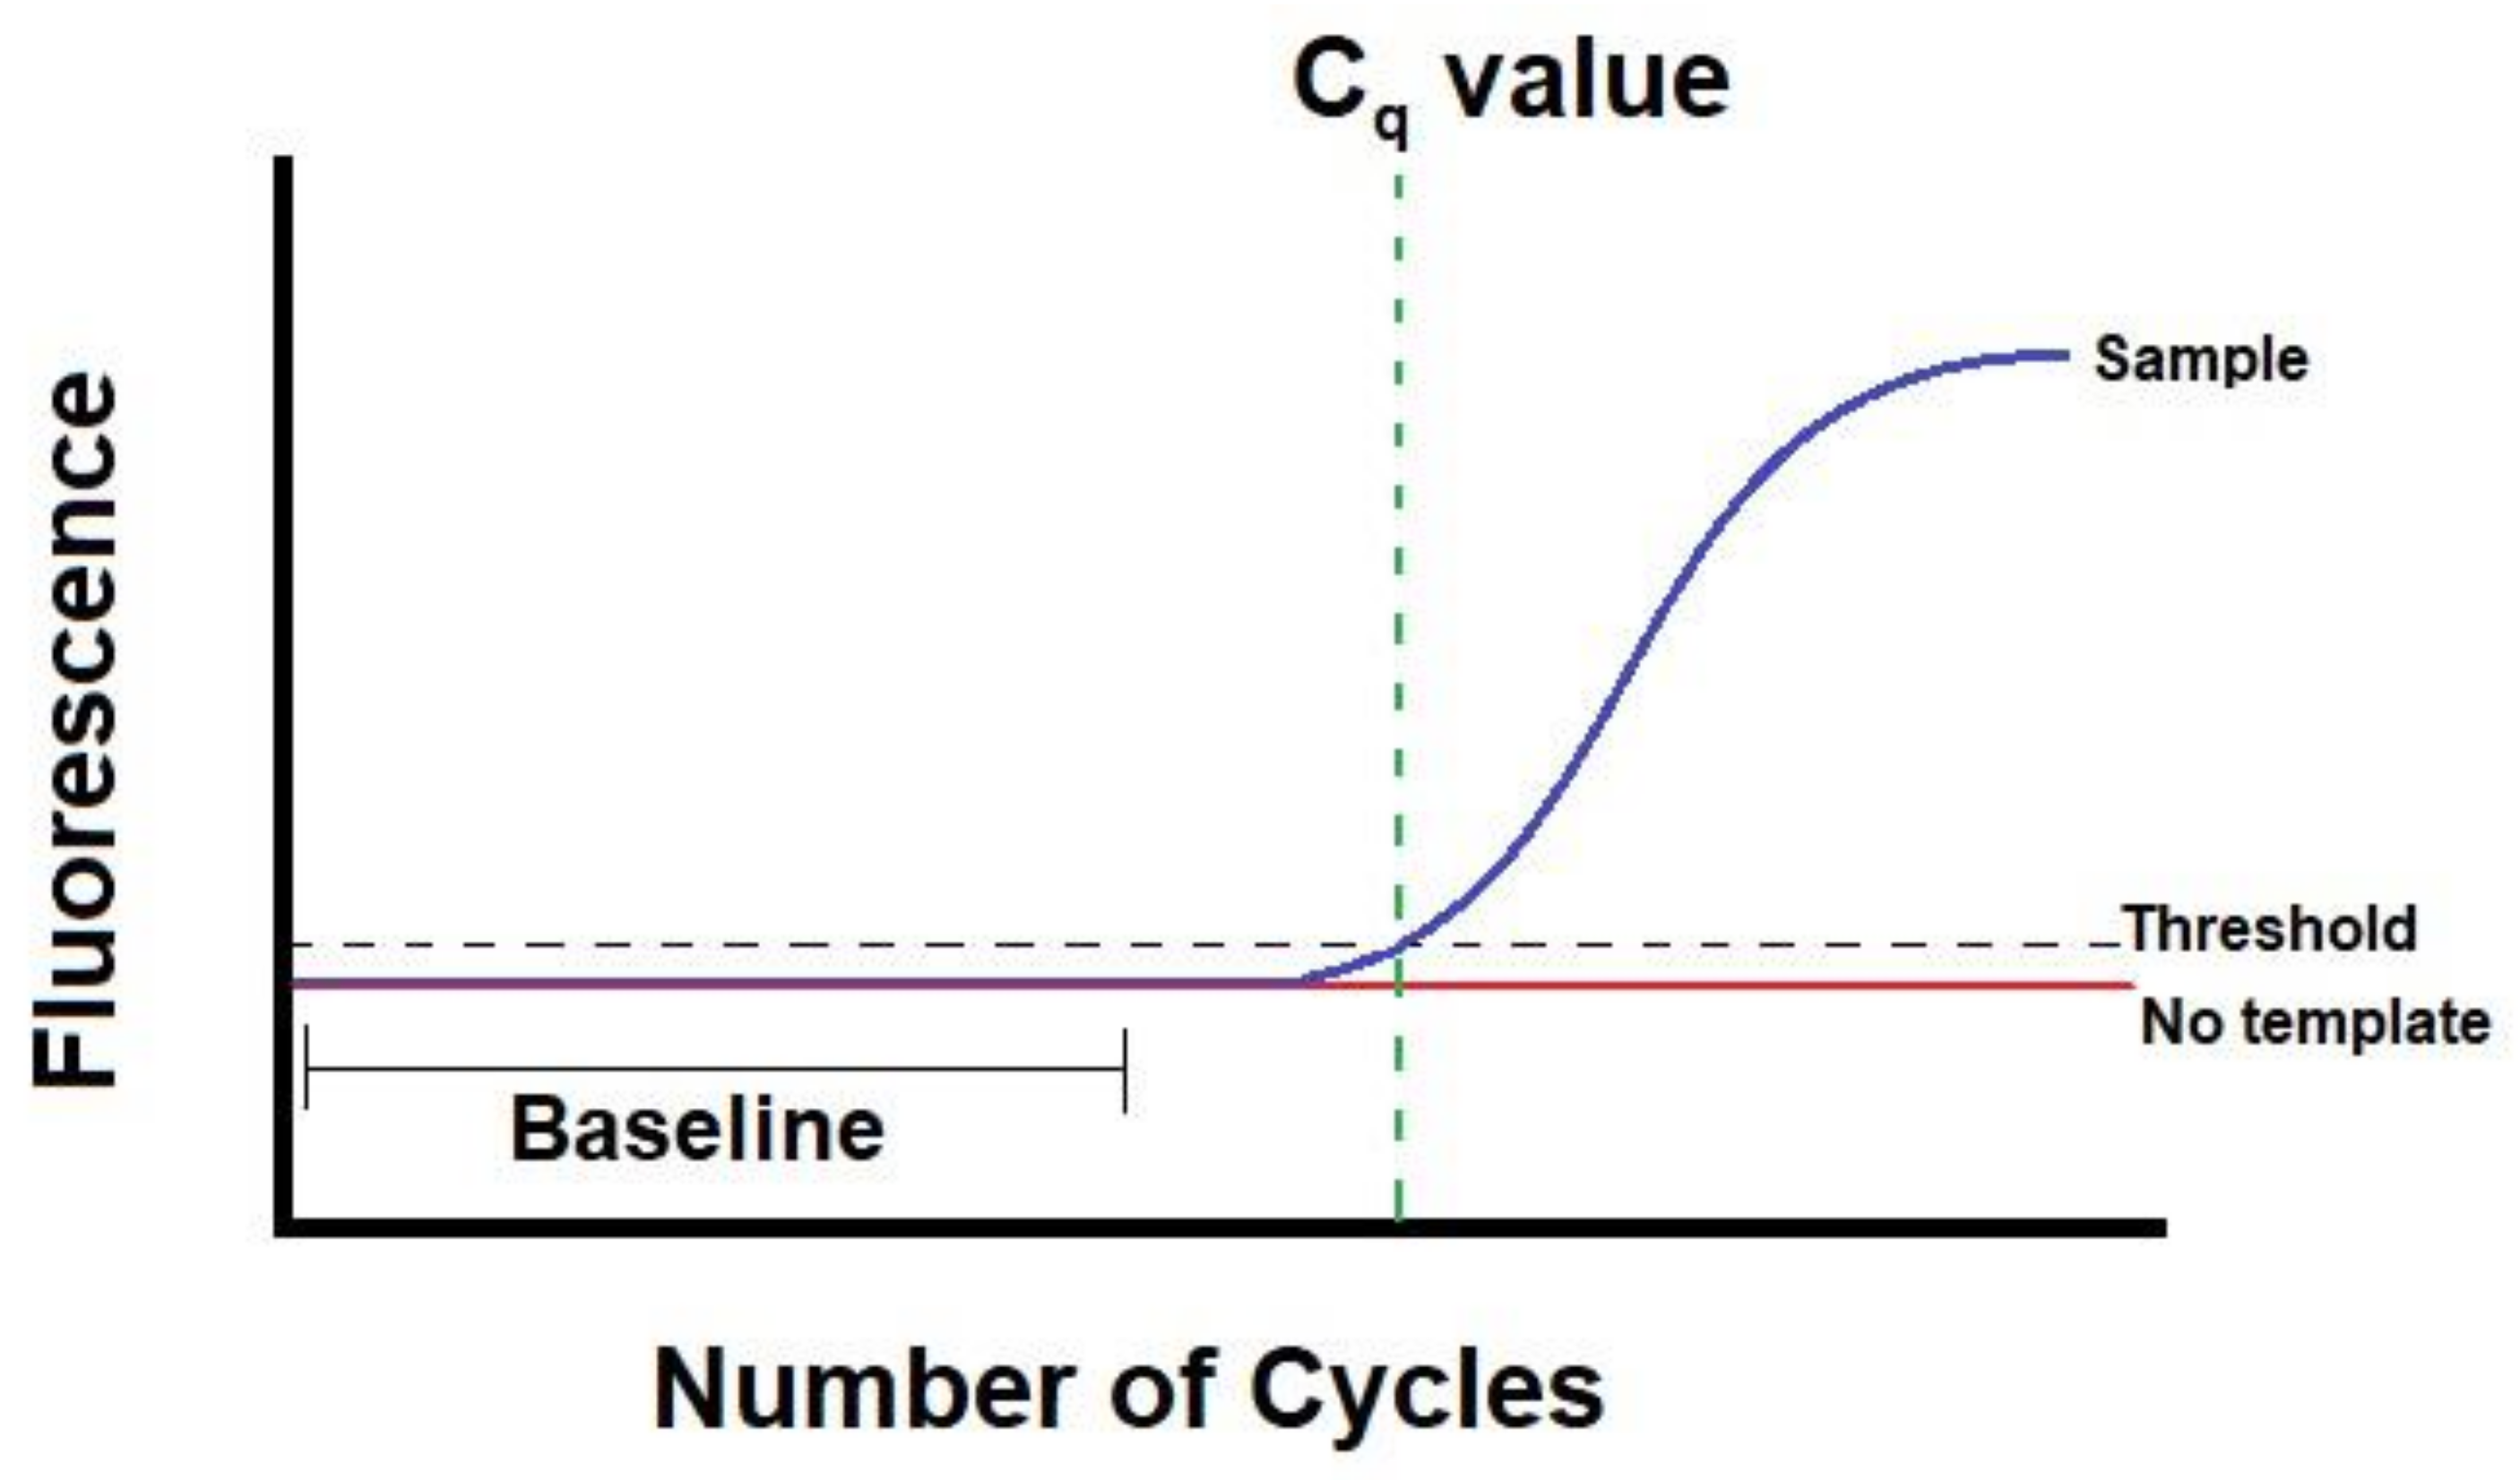
3.1.1. PCR-Based Methods
3.1.2. Isothermal Nucleic Acid Amplification-Based Methods
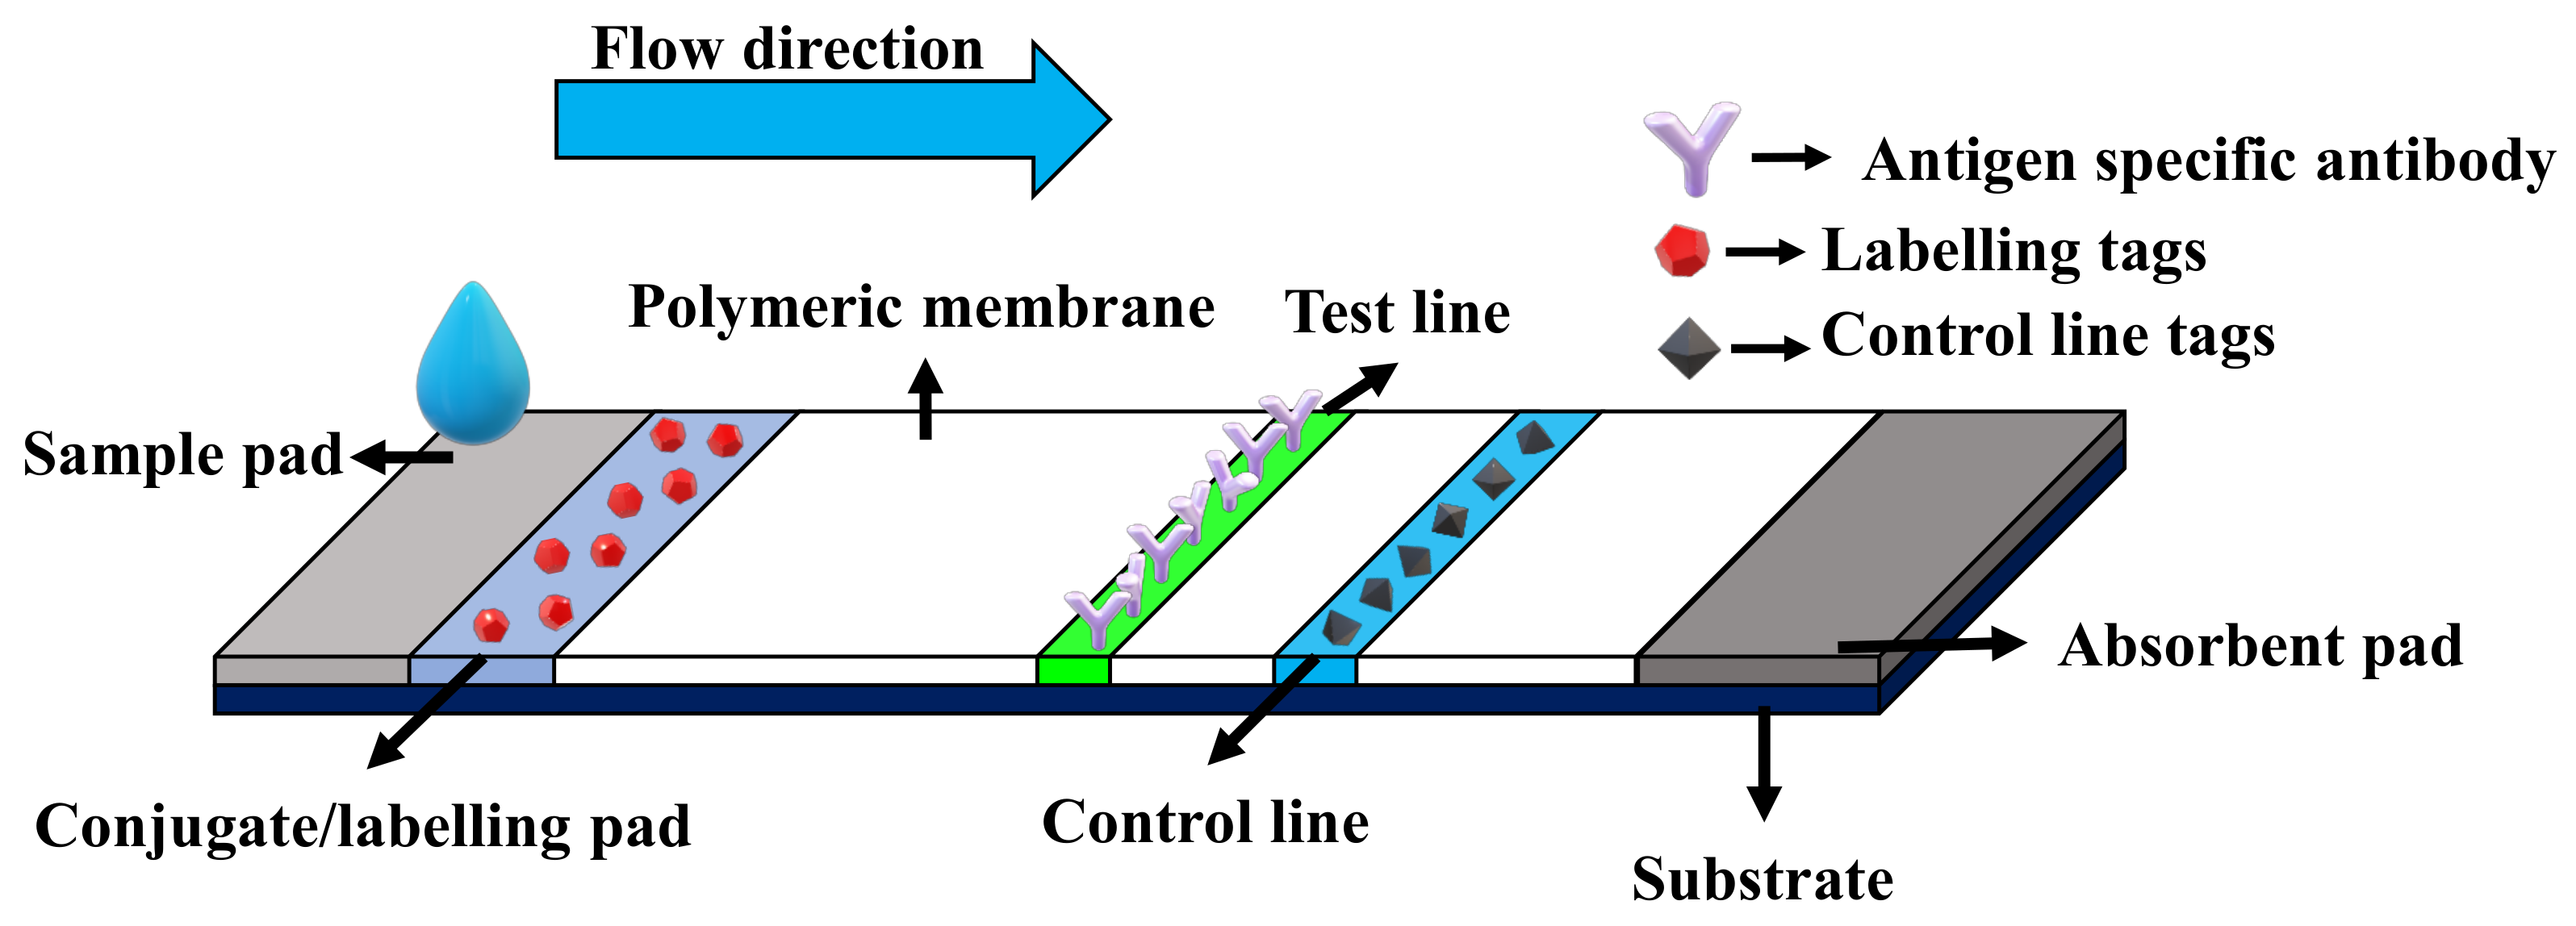
3.1.3. Serological/Immunological Methods
3.2. Indirect Phytopathogen Detection Methods
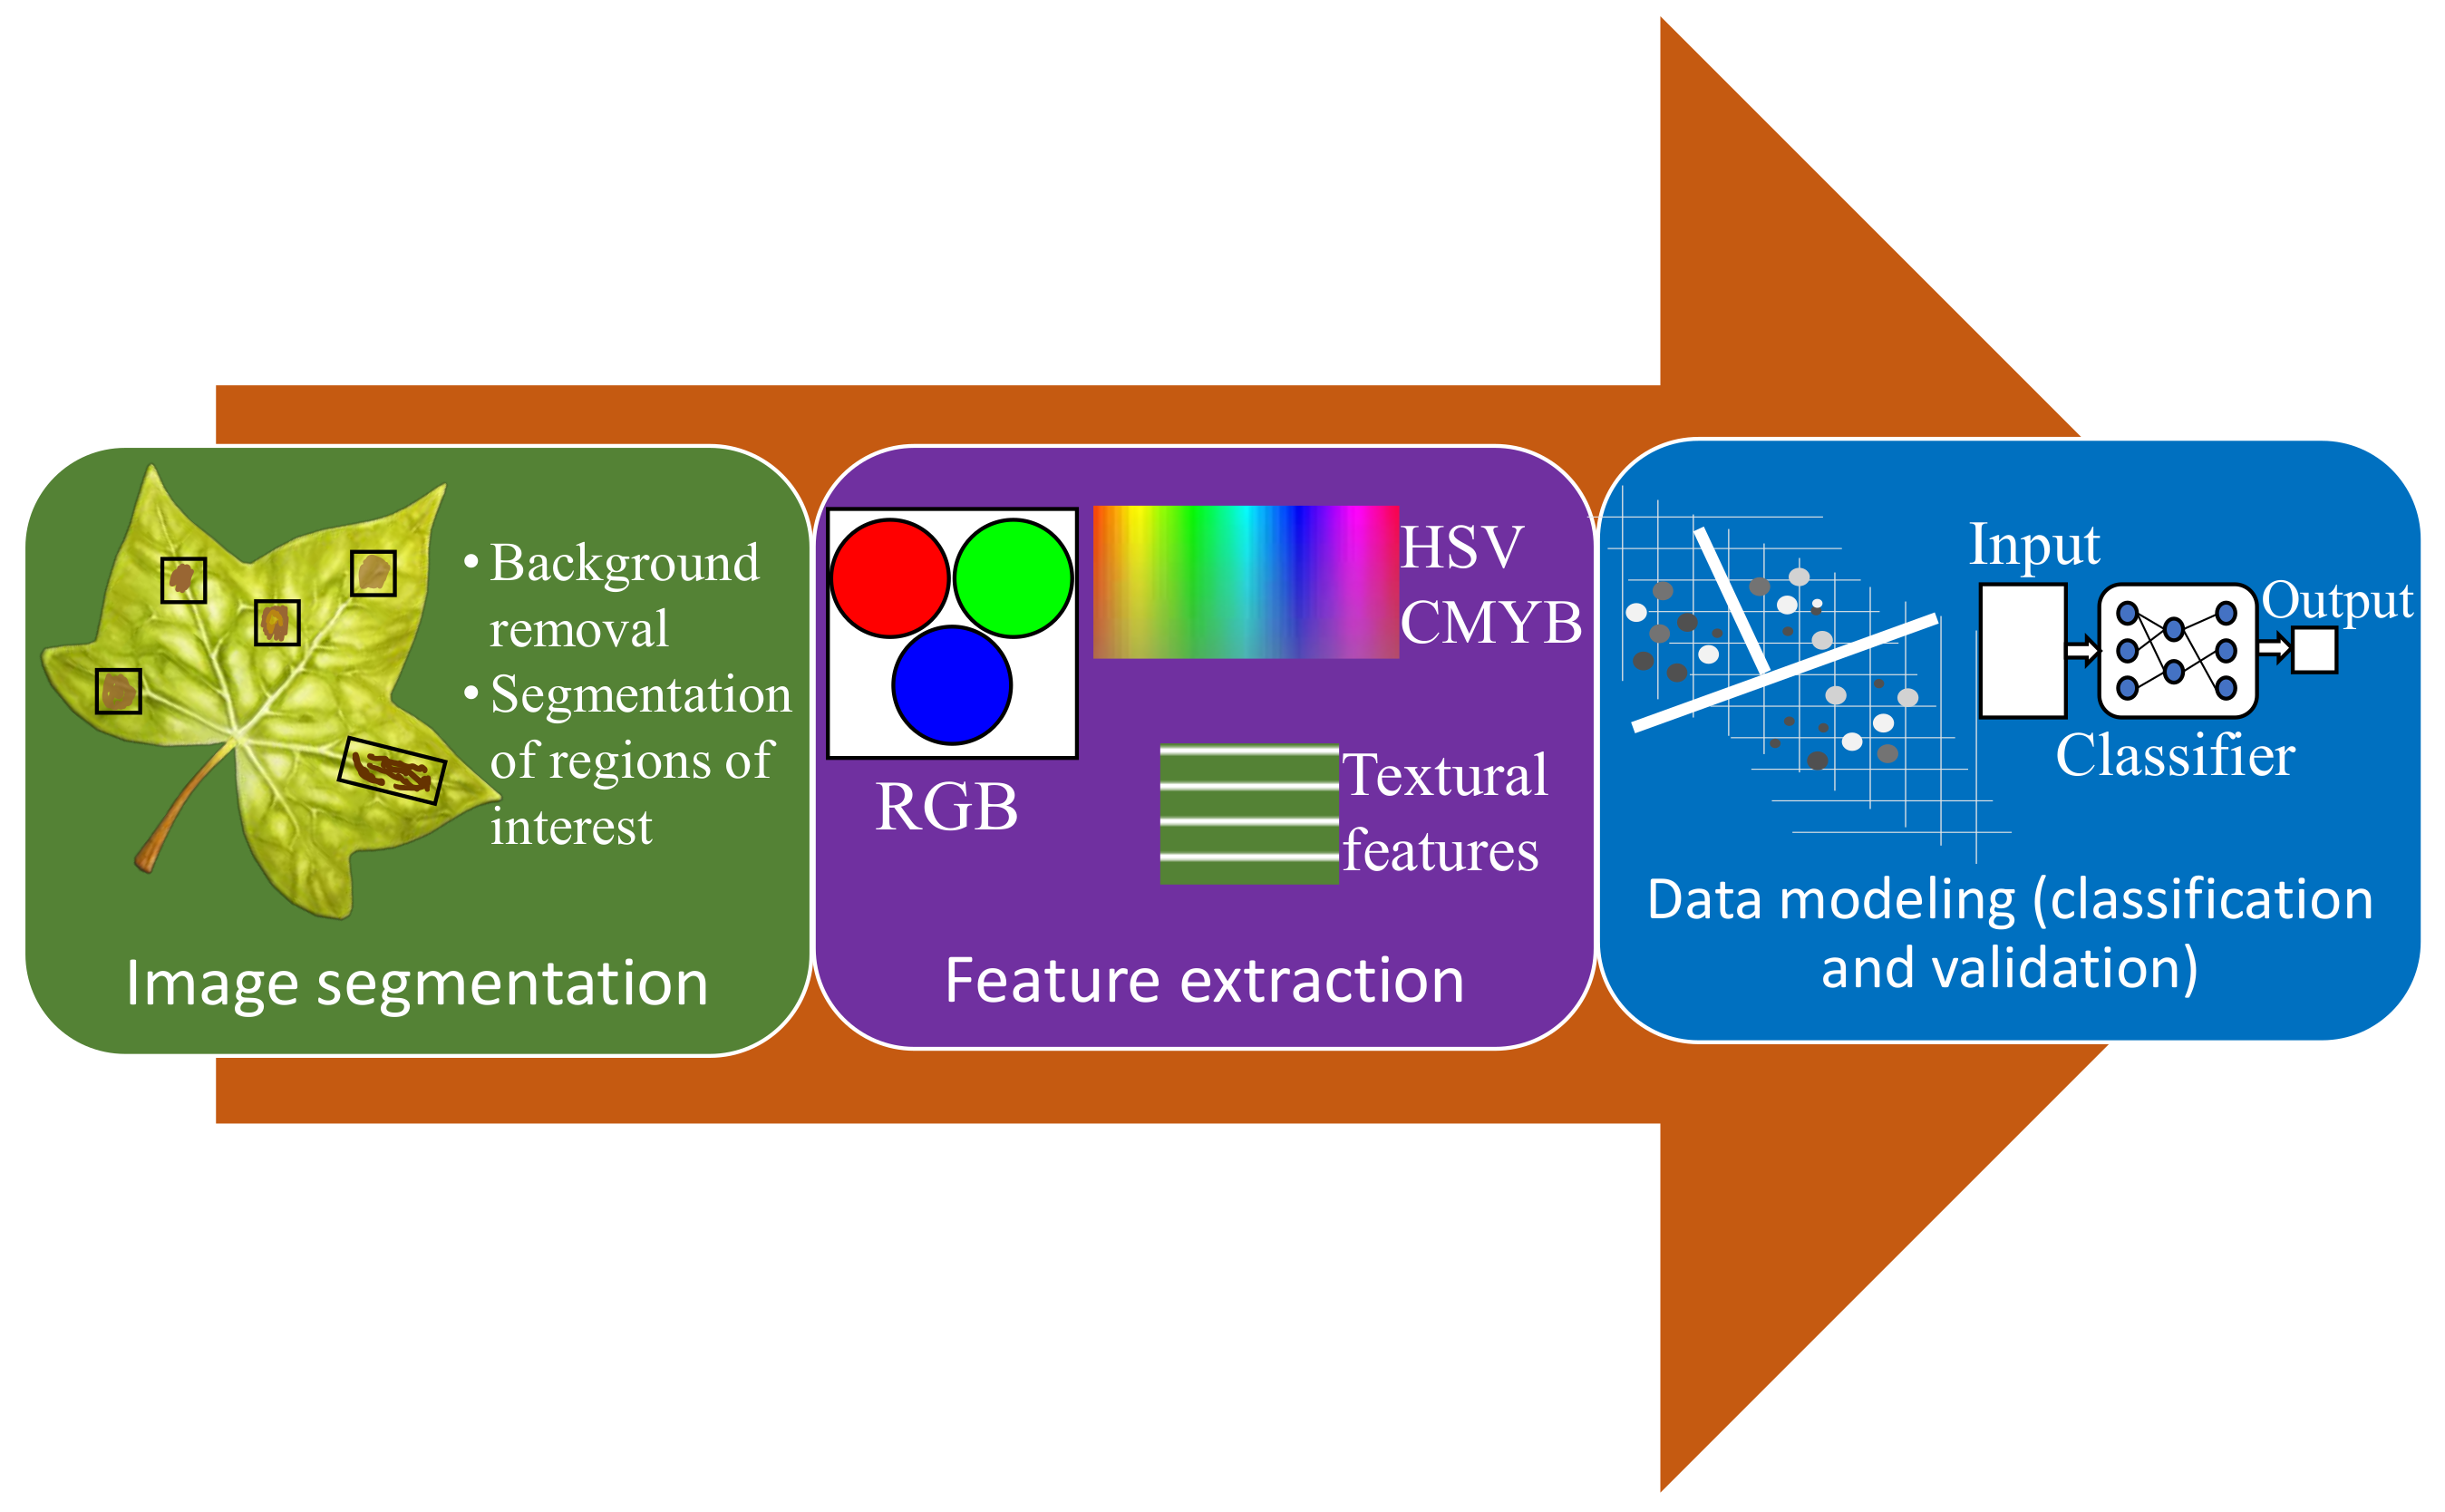
3.2.1. Visible/RGB Imaging-Based Methods
- Segmentation of the region of interest.
- Feature extraction.
- Detection and classification.

| Sensing Application | Brief Description | Accuracy | Strengths | Limitations | Ref., Year |
|---|---|---|---|---|---|
| Cercospora leaf spot and four other diseases in sugar beet | Images taken using a smartphone and processed on servers, a support vector machine (SVM) based classifier with radial basis function (kernel) was employed | 68% to 90% | Smartphone-based imaging, multi-disease detection | Poor accuracy for some diseases | [86], 2018 |
| Three wheat diseases: septoria, rust, and tan spot | Hot-spots were first extracted followed by classification using Random-Forest-based statistical inference methods | 80% | Images were captured using mobile devices, and a mobile application was developed for fast processing | Moderate specificity, not suitable for early disease detection | [87], 2017 |
| Vineyard disease based on grape leaf images | Color as well as texture based features were extracted, and a histogram comparison based approach was followed for classification | 90% | A phone application was developed for generalized plant health monitoring | Lacks specificity in disease detection | [88], 2017 |
| Detecting 26 diseases across 14 crop species | Images taken from PlantVillage dataset and classified using deep learning architectures named: AlexNet and GoogLeNet | over 99% (under specific conditions) | Multi-disease multi-crop system, large diverse dataset, good classification accuracy | Computation-ally intensive, accuracy reduces to 31% for uncontrolled imaging conditions | [89], 2016 |
| Multi-plant multi-disease detection | Color-channel-based pairwise classification approach was applied using a histogram-based structure | 58% (average) | Diverse plant and disease database, images largely captured under real field conditions | Poor accuracy, limited dataset | [90], 2016 |
| Powdery mildew and TSWV in bell peppers | A mobile imaging set-up coupled to principle component analysis- or coefficient of variation-based classification system was developed | 64.3% (average) | Mobile system suitable for greenhouse operation | Moderate accuracy, in-field testing needed | [91], 2016 |
| Cercospora leaf spot in sugar beet | Robust template matching (to detect and extract features) coupled with pattern recognition using SVM for classification | 33% to 83% depending on leaf age | Leaf tracking capability against changes on open field | Poor accuracy in younger leaves, moderate accuracy in older leaves | [92], 2015 |
| Huanglongbing (HLB) disease in citrus plants | Based on the observation that starch in HLB infected leaf rotates the polarization plane of light | 97% (average) | Good classification accuracy, simple imaging setup | Cross-validation training method may have caused information loss and/or over-fitting | [93], 2015 |

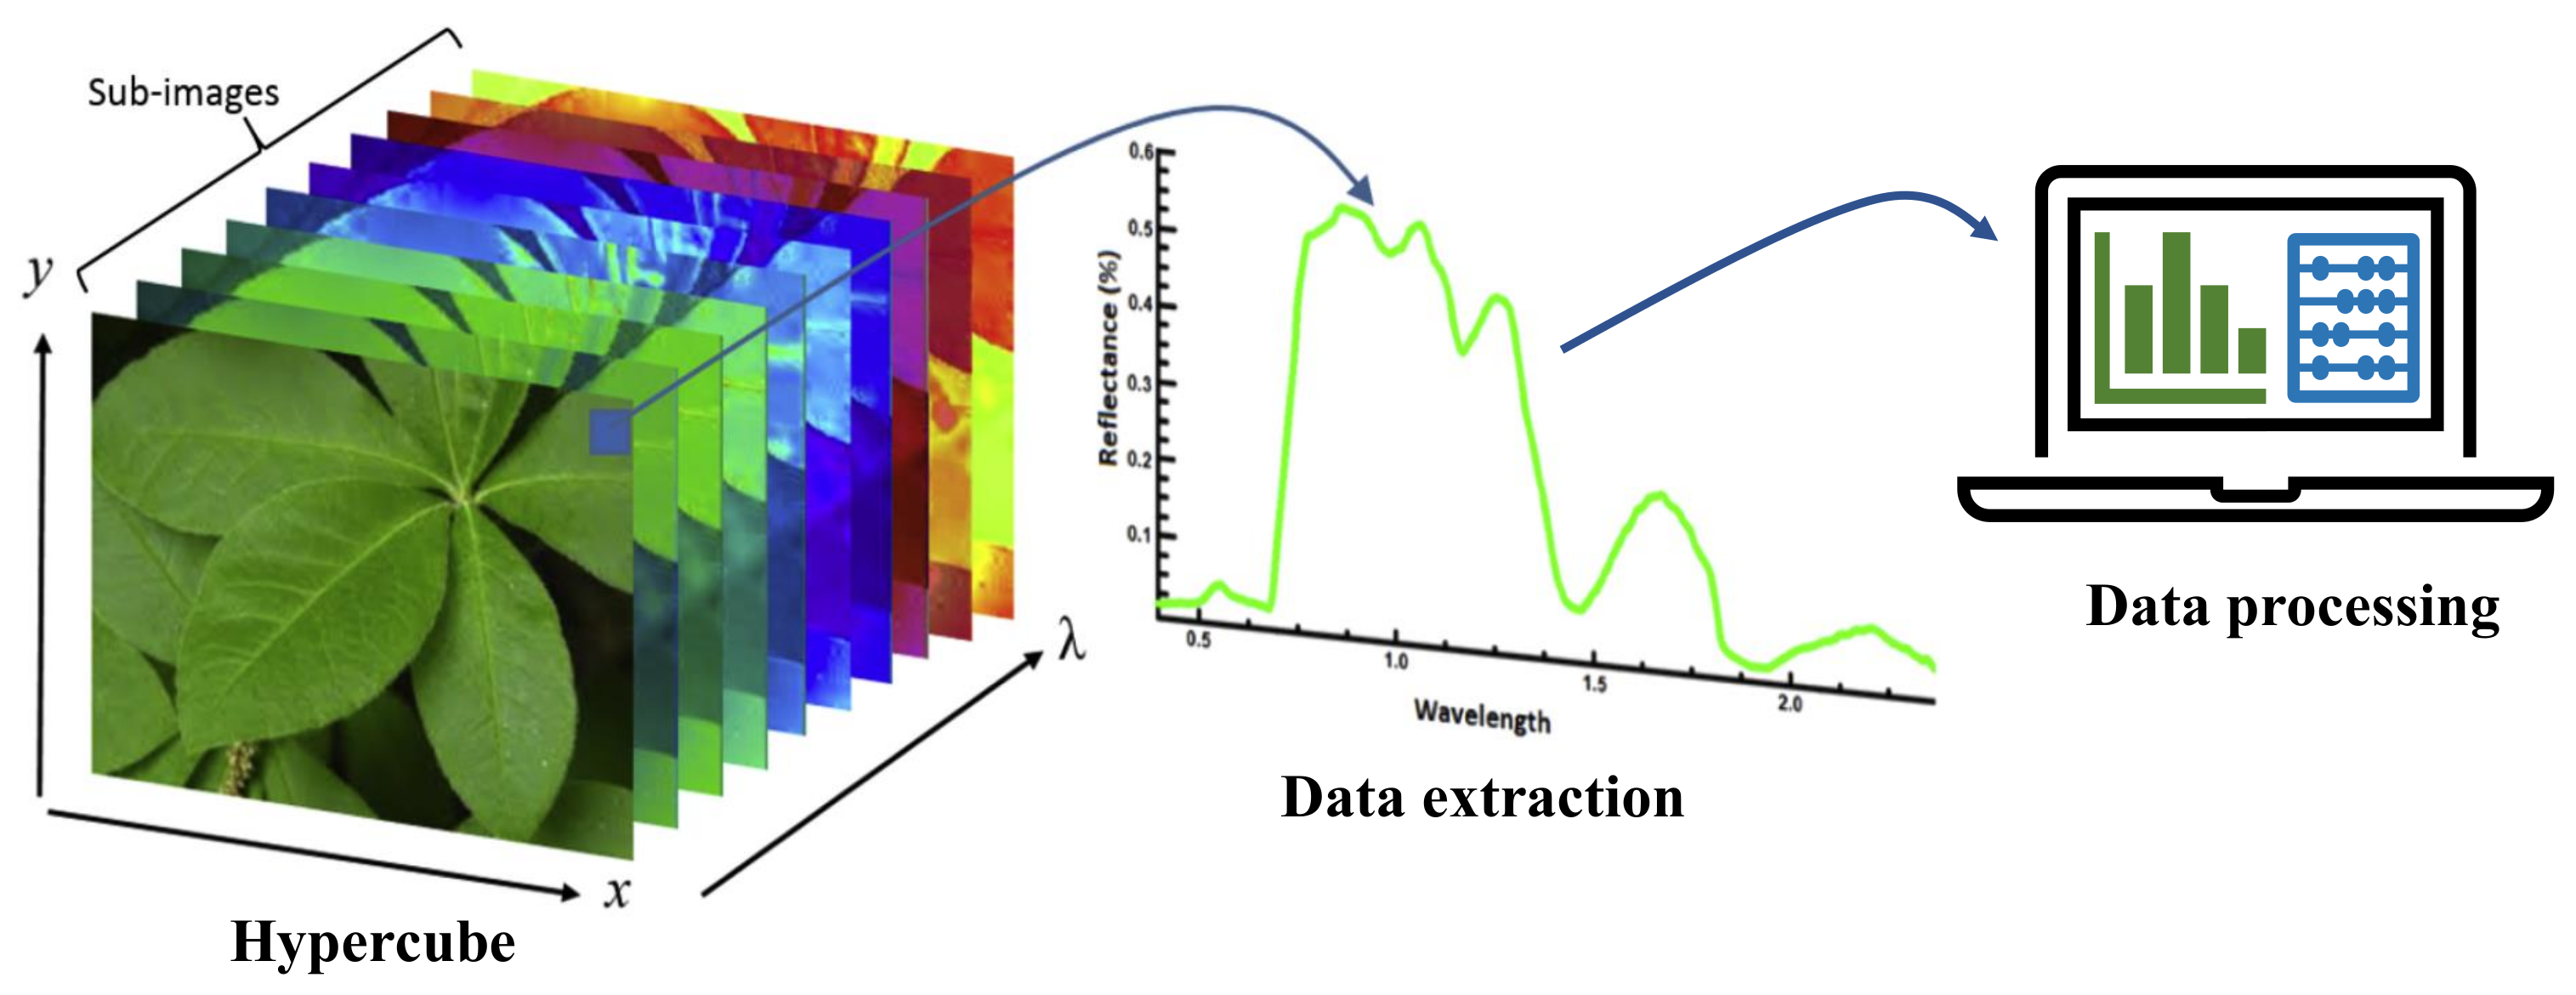
3.2.2. Hyperspectral Imaging
3.2.3. Thermography
3.2.4. Non-Imaging Spectroscopic Methods
3.2.5. Chlorophyll Fluorescence Imaging
3.2.6. Biosensing Methods for Phytohormones Detection
SA Detection
JA Detection
4. Methodologies for Monitoring Herbivorous Pests/Insects
4.1. Imaging-Based Methods for Pest Detection
4.2. Acoustic Methods for Detecting Pests
5. ET/VOCs Detection Methods for Monitoring Biotic Stress in Plants
6. Application of Remote Sensing Technologies for Monitoring Biotic Stress in Plants
7. Discussion and Conclusions
8. Future Prospects and Research Directions for Monitoring Biotic Stress in Plants
Author Contributions
Funding
Institutional Review Board Statement
Informed Consent Statement
Conflicts of Interest
References
- World Population Projected to Reach 9.8 billion in 2050, and 11.2 billion in 2100. Available online: https://www.un.org/development/desa/en/news/population/world-population-prospects-2017.html (accessed on 25 July 2020).
- Elferink, M.; Schierhorn, F. Global Demand for Food Is Rising. Can We Meet It? Available online: https://hbr.org/2016/04/global-demand-for-food-is-rising-can-we-meet-it (accessed on 2 December 2020).
- Savary, S.; Willocquet, L.; Pethybridge, S.J.; Esker, P.; McRoberts, N.; Nelson, A. The global burden of pathogens and pests on major food crops. Nat. Ecol. Evol. 2019, 3, 430–439. [Google Scholar] [CrossRef] [PubMed]
- Global Burden of Crop Loss. Available online: https://www.cabi.org/projects/global-burden-of-crop-loss/ (accessed on 2 December 2020).
- Xu, Z.; Dong, L.; Kumar, R. Electrophoretic Soil Nutrient Sensor for Agriculture. U.S. Patent 10,564,122, 18 February 2020. [Google Scholar]
- Kumar, R.; Weber, R.J.; Pandey, G. Low RF-Band Impedance Spectroscopy Based Sensor for In-Situ, Wireless Soil Sensing. U.S. Patent 10,073,074, 18 September 2018. [Google Scholar]
- Pandey, G.; Weber, R.J.; Kumar, R. Agricultural cyber-physical system: In-situ soil moisture and salinity estimation by dielectric mixing. IEEE Access 2018, 6, 43179–43191. [Google Scholar] [CrossRef]
- Xu, Z.; Wang, X.; Weber, R.J.; Kumar, R.; Dong, L. Nutrient sensing using chip scale electrophoresis and in situ soil solution extraction. IEEE Sens. J. 2017, 17, 4330–4339. [Google Scholar] [CrossRef]
- Ali, M.A.; Jiang, H.; Mahal, N.K.; Weber, R.J.; Kumar, R.; Castellano, M.J.; Dong, L. Microfluidic impedimetric sensor for soil nitrate detection using graphene oxide and conductive nanofibers enabled sensing interface. Sens. Actuators B Chem. 2017, 239, 1289–1299. [Google Scholar] [CrossRef] [Green Version]
- Xu, Z.; Wang, X.; Weber, R.J.; Kumar, R.; Dong, L. Microfluidic eletrophoretic ion nutrient sensor. In Proceedings of the 2016 IEEE SENSORS, Orlando, FL, USA, 30 October–3 November 2016; pp. 1–3. [Google Scholar]
- Pandey, G.; Wang, K.N.; Kumar, R.; Weber, R.J. Employing a metamaterial inspired small antenna for sensing and transceiving data in an underground soil sensor equipped with a GUI for end-user. In Proceedings of the 2014 IEEE International Conference on Systems, Man, and Cybernetics (SMC), San Diego, CA, USA, 5–8 October 2014; pp. 3423–3428. [Google Scholar]
- Britz, B.; Ng, E.; Jiang, H.; Xu, Z.; Kumar, R.; Dong, L. Smart nitrate-selective electrochemical sensors with electrospun nanofibers modified microelectrode. In Proceedings of the 2014 IEEE International Conference on Systems, Man, and Cybernetics (SMC), San Diego, CA, USA, 5–8 October 2014; pp. 3419–3422. [Google Scholar]
- Pandey, G.; Kumar, R.; Weber, R.J. A low profile, low-RF band, small antenna for underground, in-situ sensing and wireless energy-efficient transmission. In Proceedings of the 11th IEEE International Conference on Networking, Sensing and Control, Miami, FL, USA, 7–9 April 2014; pp. 179–184. [Google Scholar]
- Pandey, G.; Kumar, R.; Weber, R.J. Design and implementation of a self-calibrating, compact micro strip sensor for in-situ dielectric spectroscopy and data transmission. In Proceedings of the SENSORS, Baltimore, MD, USA, 3–6 November 2013; pp. 1–4. [Google Scholar]
- Pandey, G.; Kumar, R.; Weber, R.J. Real time detection of soil moisture and nitrates using on-board in-situ impedance spectroscopy. In Proceedings of the 2013 IEEE International Conference on Systems, Man, and Cybernetics, Manchester, UK, 13–16 October 2013; pp. 1081–1086. [Google Scholar]
- Pandey, G.; Kumar, R.; Weber, R.J. Determination of soil ionic concentration using impedance spectroscopy. In Sensing Technologies for Global Health, Military Medicine, and Environmental Monitoring III; International Society for Optics and Photonics: Bellingham, WA, USA, 2013; Volume 8723, p. 872317. [Google Scholar]
- Pandey, G.; Kumar, R.; Weber, R.J. A multi-frequency, self-calibrating, in-situ soil sensor with energy efficient wireless interface. In Sensing for Agriculture and Food Quality and Safety V; International Society for Optics and Photonics: Bellingham, WA, USA, 2013; Volume 8721, p. 87210V. [Google Scholar]
- Kumar, R.; Tabassum, S.; Dong, L. Nano-Patterning Methods Including:(1) Patterning of Nanophotonic Structures at Optical Fiber Tip for Refractive Index Sensing and (2) Plasmonic Crystal Incorporating Graphene Oxide Gas Sensor for Detection of Volatile Organic Compounds. U.S. Patent 10,725,373, 28 July 2020. [Google Scholar]
- Kashyap, B.; Kumar, R. Sensing Methodologies in Agriculture for Soil Moisture and Nutrient Monitoring. IEEE Access 2021, 9, 14095–14121. [Google Scholar] [CrossRef]
- Tabassum, S.; Dong, L.; Kumar, R. Determination of dynamic variations in the optical properties of graphene oxide in response to gas exposure based on thin-film interference. Opt. Express 2018, 26, 6331–6344. [Google Scholar] [CrossRef]
- Tabassum, S.; Kumar, R.; Dong, L. Nanopatterned optical fiber tip for guided mode resonance and application to gas sensing. IEEE Sens. J. 2017, 17, 7262–7272. [Google Scholar] [CrossRef]
- Tabassum, S.; Kumar, R.; Dong, L. Plasmonic Crystal-Based Gas Sensor Toward an Optical Nose Design. IEEE Sens. J. 2017, 17, 6210–6223. [Google Scholar] [CrossRef]
- Tabassum, S.; Kumar, R. Selective Detection of Ethylene Using a Fiber-Optic Guided Mode Resonance Device: In-Field Crop/Fruit Diagnostics. In CLEO: Applications and Technology; Optical Society of America: Washington, DC, USA, 2020; p. ATu4I-6. [Google Scholar]
- Kashyap, B.; Kumar, R. Salicylic acid (SA) detection using bi-enzyme microfluidic electrochemical sensor. In Smart Biomedical and Physiological Sensor Technology XV; Cullum, B.M., Kiehl, D., McLamore, E.S., Eds.; International Society for Optics and Photonics, SPIE: Bellingham, WA, USA, 2018; Volume 10662, pp. 97–103. [Google Scholar]
- Kashyap, B.; Kumar, R. Bio-agent free electrochemical detection of Salicylic acid. In Proceedings of the 2019 IEEE SENSORS, Montreal, QC, Canada, 27–30 October 2019; pp. 1–4. [Google Scholar]
- Tabassum, S.; Wang, Q.; Wang, W.; Oren, S.; Ali, M.A.; Kumar, R.; Dong, L. Plasmonic crystal gas sensor incorporating graphene oxide for detection of volatile organic compounds. In Proceedings of the 2016 IEEE 29th International Conference on Micro Electro Mechanical Systems (MEMS), Shanghai, China, 24–28 January 2016; pp. 913–916. [Google Scholar]
- Bhar, A.; Kumar, R.; Qi, Z.; Malone, R. Coordinate descent based agricultural model calibration and optimized input management. Comput. Electron. Agric. 2020, 172, 105353. [Google Scholar] [CrossRef]
- Bhar, A.; Kumar, R.; Malone, R.W. Comparing a Simple Carbon Nitrogen Model with Complex RZWQM Model. In Proceedings of the 2019 ASABE Annual International Meeting, American Society of Agricultural and Biological Engineers, Boston, MA, USA, 7–10 July 2019; p. 1. [Google Scholar]
- Bhar, A.; Kumar, R. Model-Predictive Real-Time Fertilization and Irrigation Decision-Making Using RZWQM. In Proceedings of the 2019 ASABE Annual International Meeting, American Society of Agricultural and Biological Engineers, Boston, MA, USA, 7–10 July 2019; p. 1. [Google Scholar]
- Erb, M.; Meldau, S.; Howe, G.A. Role of phytohormones in insect-specific plant reactions. Trends Plant Sci. 2012, 17, 250–259. [Google Scholar] [CrossRef] [Green Version]
- Freeman, B.C.; Beattie, G. An Overview of Plant Defenses against Pathogens and Herbivores. Plant Health Instr. 2008. [Google Scholar] [CrossRef] [Green Version]
- Spoel, S.H.; Dong, X. How do plants achieve immunity?: Defence without specialized immune cells. Nat. Rev. Immunol. 2012, 12, 89–100. [Google Scholar] [CrossRef]
- Pel, M.J.C.; Pieterse, C.M.J. Microbial recognition and evasion of host immunity. J. Exp. Bot. 2012, 64, 1237–1248. [Google Scholar] [CrossRef] [Green Version]
- Miller, R.N.G.; Costa Alves, G.S.; Van Sluys, M.A. Plant immunity: Unravelling the complexity of plant responses to biotic stresses. Ann. Bot. 2017, 119, 681–687. [Google Scholar] [CrossRef] [Green Version]
- Wu, S.; Shan, L.; He, P. Microbial signature-triggered plant defense responses and early signaling mechanisms. Plant Sci. 2014, 228, 118–126. [Google Scholar] [CrossRef] [Green Version]
- War, A.R.; Paulraj, M.G.; Ahmad, T.; Buhroo, A.A.; Hussain, B.; Ignacimuthu, S.; Sharma, H.C. Mechanisms of plant defense against insect herbivores. Plant Signal. Behav. 2012, 7, 1306–1320. [Google Scholar] [CrossRef] [Green Version]
- Ross, A. Systemic acquired resistance induced by localized virus infections in plants. Virology 1961, 14, 340–358. [Google Scholar] [CrossRef]
- Vos, I.A.; Pieterse, C.M.J.; van Wees, S.C.M. Costs and benefits of hormone-regulated plant defences. Plant Pathol. 2013, 62, 43–55. [Google Scholar] [CrossRef]
- Berens, M.L.; Wolinska, K.W.; Spaepen, S.; Ziegler, J.; Nobori, T.; Nair, A.; Krüler, V.; Winkelmüller, T.M.; Wang, Y.; Mine, A.; et al. Balancing trade-offs between biotic and abiotic stress responses through leaf age-dependent variation in stress hormone cross-talk. Proc. Natl. Acad. Sci. USA 2019, 116, 2364–2373. [Google Scholar] [CrossRef] [Green Version]
- Mao, Y.B.; Liu, Y.Q.; Chen, D.Y.; Chen, F.Y.; Fang, X.; Hong, G.J.; Wang, L.J.; Wang, J.W.; Chen, X.Y. Jasmonate response decay and defense metabolite accumulation contributes to age-regulated dynamics of plant insect resistanceNature Communications. Nat. Commun. 2017, 8, 13925. [Google Scholar] [CrossRef] [Green Version]
- Li, N.; Han, X.; Feng, D.; Yuan, D.; Huang, L.J. Signaling Crosstalk between Salicylic Acid and Ethylene/Jasmonate in Plant Defense: Do We Understand What They Are Whispering? Int. J. Mol. Sci. 2019, 20, 671. [Google Scholar] [CrossRef] [Green Version]
- Xu, T.; Yao, Z.; Liu, J.; Zhang, H.; Din, G.M.U.; Zhao, S.; Chen, W.; Liu, T.; Gao, L. Development of droplet digital PCR for the detection of Tilletia laevis, which causes common bunt of wheat, based on the SCAR marker derived from ISSR and real-time PCR. Sci. Rep. 2020, 10, 16106. [Google Scholar] [CrossRef]
- Aglietti, C.; Luchi, N.; Pepori, A.L.; Bartolini, P.; Pecori, F.; Raio, A.; Capretti, P.; Santini, A. Real-time loop-mediated isothermal amplification: An early-warning tool for quarantine plant pathogen detection. AMB Express 2019, 9, 50. [Google Scholar] [CrossRef]
- Ristaino, J.B.; Saville, A.C.; Paul, R.; Cooper, D.C.; Wei, Q. Detection of Phytophthora infestans by Loop-Mediated Isothermal Amplification, Real-Time LAMP, and Droplet Digital PCR. Plant Dis. 2020, 104, 708–716. [Google Scholar] [CrossRef]
- Charlermroj, R.; Himananto, O.; Seepiban, C.; Kumpoosiri, M.; Warin, N.; Oplatowska, M.; Gajanandana, O.; Grant, I.R.; Karoonuthaisiri, N.; Elliott, C.T. Multiplex Detection of Plant Pathogens Using a Microsphere Immunoassay Technology. PLoS ONE 2013, 8, e62344. [Google Scholar] [CrossRef] [Green Version]
- Panferov, V.G.; Safenkova, I.V.; Byzova, N.A.; Varitsev, Y.A.; Zherdev, A.V.; Dzantiev, B.B. Silver-enhanced lateral flow immunoassay for highly-sensitive detection of potato leafroll virus. Food Agric. Immunol. 2018, 29, 445–457. [Google Scholar] [CrossRef] [Green Version]
- Song, S.; Liu, N.; Zhao, Z.; Njumbe Ediage, E.; Wu, S.; Sun, C.; De Saeger, S.; Wu, A. Multiplex Lateral Flow Immunoassay for Mycotoxin Determination. Anal. Chem. 2014, 86, 4995–5001. [Google Scholar] [CrossRef]
- Anfossi, L.; Di Nardo, F.; Giovannoli, C.; Passini, C.; Baggiani, C. Increased sensitivity of lateral flow immunoassay for ochratoxin A through silver enhancement. Anal. Bioanal. Chem. 2013, 405, 9859–9867. [Google Scholar] [CrossRef] [Green Version]
- Lin, H.Y.; Huang, C.H.; Lu, S.H.; Kuo, I.T.; Chau, L.K. Direct detection of orchid viruses using nanorod-based fiber optic particle plasmon resonance immunosensor. Biosens. Bioelectron. 2014, 51, 371–378. [Google Scholar] [CrossRef] [PubMed]
- Berto, M.; Vecchi, E.; Baiamonte, L.; Condò, C.; Sensi, M.; Di Lauro, M.; Sola, M.; De Stradis, A.; Biscarini, F.; Minafra, A.; et al. Label free detection of plant viruses with organic transistor biosensors. Sens. Actuators B Chem. 2019, 281, 150–156. [Google Scholar] [CrossRef]
- Mullis, K.B. The Unusual Origin of the Polymerase Chain Reaction. Sci. Am. 1990, 262, 56–65. [Google Scholar] [CrossRef] [PubMed]
- Ward, E.; Fosteer, S.J.; Fraaije, B.A.; Mccartney, H.A. Plant pathogen diagnostics: Immunological and nucleic acid-based approaches. Ann. Appl. Biol. 2004, 145, 1–16. [Google Scholar] [CrossRef]
- Athman, A.; Tanz, S.K.; Conn, V.M.; Jordans, C.; Mayo, G.M.; Ng, W.W.; Burton, R.A.; Conn, S.J.; Gilliham, M. Protocol: A fast and simple in situ PCR method for localising gene expression in plant tissue. Plant Methods 2014, 10, 29. [Google Scholar] [CrossRef] [PubMed] [Green Version]
- Lee, M.H.; Song, K.Y.; Hwang, H.J.; Kim, J.H.; Hwang, I. Development of fast and sensitive protocols for the detection of viral pathogens using a small portable convection PCR platform. Mol. Biol. Rep. 2019, 46, 5073–5077. [Google Scholar] [CrossRef]
- Martinelli, F.; Scalenghe, R.; Davino, S.; Panno, S.; Scuderi, G.; Ruisi, P.; Villa, P.; Stroppiana, D.; Boschetti, M.; Goulart, L.R.; et al. Advanced methods of plant disease detection. A review. Agron. Sustain. Dev. 2015, 35, 1–25. [Google Scholar] [CrossRef] [Green Version]
- Paul, R.; Saville, A.C.; Hansel, J.C.; Ye, Y.; Ball, C.; Williams, A.; Chang, X.; Chen, G.; Gu, Z.; Ristaino, J.B.; et al. Extraction of Plant DNA by Microneedle Patch for Rapid Detection of Plant Diseases. ACS Nano 2019, 13, 6540–6549. [Google Scholar] [CrossRef]
- Koo, C.; Malapi-Wight, M.; Kim, H.S.; Cifci, O.S.; Vaughn-Diaz, V.L.; Ma, B.; Kim, S.; Abdel-Raziq, H.; Ong, K.; Jo, Y.K.; et al. Development of a Real-Time Microchip PCR System for Portable Plant Disease Diagnosis. PLoS ONE 2013, 8, e82704. [Google Scholar] [CrossRef]
- What Is a Cq (Ct) Value? Available online: https://bitesizebio.com/24581/what-is-a-ct-value/ (accessed on 15 December 2020).
- Hajizadeh, M.; Navarro, B.; Bashir, N.S.; Torchetti, E.M.; Di Serio, F. Development and validation of a multiplex RT-PCR method for the simultaneous detection of five grapevine viroids. J. Virol. Methods 2012, 179, 62–69. [Google Scholar] [CrossRef]
- Sanzani, S.M.; Li Destri Nicosia, M.G.; Faedda, R.; Cacciola, S.O.; Schena, L. Use of Quantitative PCR Detection Methods to Study Biocontrol Agents and Phytopathogenic Fungi and Oomycetes in Environmental Samples. J. Phytopathol. 2014, 162, 1–13. [Google Scholar] [CrossRef]
- Duressa, D.; Rauscher, G.; Koike, S.T.; Mou, B.; Hayes, R.J.; Maruthachalam, K.; Subbarao, P.V.; Klosterman, S.J. A Real-Time PCR Assay for Detection and Quantification of Verticillium dahliae in Spinach Seed. Phytopathology 2012, 102, 443–451. [Google Scholar] [CrossRef] [Green Version]
- DeShields, J.B.; Bomberger, R.A.; Woodhall, J.W.; Wheeler, D.L.; Moroz, N.; Johnson, D.A.; Tanaka, K. On-Site Molecular Detection of Soil-Borne Phytopathogens Using a Portable Real-Time PCR System. J. Vis. Exp. 2018, 132, e56891. [Google Scholar] [CrossRef] [Green Version]
- Londoño, M.A.; Harmon, C.L.; Polston, J.E. Evaluation of recombinase polymerase amplification for detection of begomoviruses by plant diagnostic clinics. Virol. J. 2016, 13, 48. [Google Scholar] [CrossRef] [Green Version]
- Lobato, I.M.; O’Sullivan, C.K. Recombinase polymerase amplification: Basics, applications and recent advances. TrAC Trends Anal. Chem. 2018, 98, 19–35. [Google Scholar] [CrossRef]
- Lau, H.Y.; Wu, H.; Wee, E.J.H.; Trau, M.; Wang, Y.; Botella, J.R. Specific and Sensitive Isothermal Electrochemical Biosensor for Plant Pathogen DNA Detection with Colloidal Gold Nanoparticles as Probes. Sci. Rep. 2017, 7, 38896. [Google Scholar] [CrossRef]
- Yu, J.; Shen, D.; Dai, T.; Lu, X.; Xu, H.; Dou, D. Rapid and equipment-free detection of Phytophthora capsici using lateral flow strip-based recombinase polymerase amplification assay. Lett. Appl. Microbiol. 2019, 69, 64–70. [Google Scholar] [CrossRef]
- Zou, Y.; Mason, M.G.; Wang, Y.; Wee, E.; Turni, C.; Blackall, P.J.; Trau, M.; Botella, J.R. Nucleic acid purification from plants, animals and microbes in under 30 seconds. PLoS Biol. 2017, 15, e2003916. [Google Scholar] [CrossRef]
- Strayer-Scherer, A.; Jones, J.B.; Paret, M.L. Recombinase Polymerase Amplification Assay for Field Detection of Tomato Bacterial Spot Pathogens. Phytopathology® 2019, 109, 690–700. [Google Scholar] [CrossRef] [Green Version]
- Zhang, S.; Ravelonandro, M.; Russell, P.; McOwen, N.; Briard, P.; Bohannon, S.; Vrient, A. Rapid diagnostic detection of plum pox virus in Prunus plants by isothermal AmplifyRP® using reverse transcription-recombinase polymerase amplification. J. Virol. Methods 2014, 207, 114–120. [Google Scholar] [CrossRef]
- Zeng, R.; Luo, J.; Gao, S.; Xu, L.; Song, Z.; Dai, F. Rapid detection of Cucumber green mottle mosaic virus by reverse transcription recombinase polymerase amplification. Mol. Cell. Probes 2019, 43, 84–85. [Google Scholar] [CrossRef]
- Mekuria, T.A.; Zhang, S.; Eastwell, K.C. Rapid and sensitive detection of Little cherry virus 2 using isothermal reverse transcription-recombinase polymerase amplification. J. Virol. Methods 2014, 205, 24–30. [Google Scholar] [CrossRef] [Green Version]
- Tomita, N.; Mori, Y.; Kanda, H.; Notomi, T. Loop-mediated isothermal amplification (LAMP) of gene sequences and simple visual detection of products. Nat. Protoc. 2008, 3, 877–882. [Google Scholar] [CrossRef] [PubMed]
- Wong, Y.P.; Othman, S.; Lau, Y.L.; Radu, S.; Chee, H.Y. Loop-mediated isothermal amplification (LAMP): A versatile technique for detection of micro-organisms. J. Appl. Microbiol. 2018, 124, 626–643. [Google Scholar] [CrossRef] [PubMed] [Green Version]
- Karakkat, B.B.; Hockemeyer, K.; Franchett, M.; Olson, M.; Mullenberg, C.; Koch, P.L. Detection of root-infecting fungi on cool-season turfgrasses using loop-mediated isothermal amplification and recombinase polymerase amplification. J. Microbiol. Methods 2018, 151, 90–98. [Google Scholar] [CrossRef] [PubMed]
- Plant Pathogen Tests—Creative Diagnostics. Available online: https://www.creative-diagnostics.com/plant-pathogen-elisa-kits.htm (accessed on 16 December 2020).
- Agdia. ELISA. Available online: https://orders.agdia.com/pathogen-tests/elisa (accessed on 16 December 2020).
- Bio-Rad. What is ELISA?—An Introduction to ELISA. Available online: https://www.bio-rad-antibodies.com/an-introduction-to-elisa.html (accessed on 16 December 2020).
- Estrela, P.; Koczula, K.; Gallotta, A. Lateral flow assays. Essays Biochem. 2016, 60, 111–120. [Google Scholar] [CrossRef]
- Razo, S.C.; Panferov, V.G.; Safenkova, I.V.; Varitsev, Y.A.; Zherdev, A.V.; Dzantiev, B.B. Double-enhanced lateral flow immunoassay for potato virus X based on a combination of magnetic and gold nanoparticles. Anal. Chim. Acta 2018, 1007, 50–60. [Google Scholar] [CrossRef]
- Chen, Y.; Chen, Q.; Han, M.; Zhou, J.; Gong, L.; Niu, Y.; Zhang, Y.; He, L.; Zhang, L. Development and optimization of a multiplex lateral flow immunoassay for the simultaneous determination of three mycotoxins in corn, rice and peanut. Food Chem. 2016, 213, 478–484. [Google Scholar] [CrossRef]
- Haji-Hashemi, H.; Habibi, M.M.; Safarnejad, M.R.; Norouzi, P.; Ganjali, M.R. Label-free electrochemical immunosensor based on electrodeposited Prussian blue and gold nanoparticles for sensitive detection of citrus bacterial canker disease. Sens. Actuators B Chem. 2018, 275, 61–68. [Google Scholar] [CrossRef]
- Riberi, W.I.; Tarditto, L.V.; Zon, M.A.; Arévalo, F.J.; Fernández, H. Development of an electrochemical immunosensor to determine zearalenone in maize using carbon screen printed electrodes modified with multi-walled carbon nanotubes/polyethyleneimine dispersions. Sens. Actuators B Chem. 2018, 254, 1271–1277. [Google Scholar] [CrossRef]
- Zhao, Y.; Liu, L.; Kong, D.; Kuang, H.; Wang, L.; Xu, C. Dual Amplified Electrochemical Immunosensor for Highly Sensitive Detection of Pantoea stewartii sbusp. stewartii. ACS Appl. Mater. Interfaces 2014, 6, 21178–21183. [Google Scholar] [CrossRef]
- Hashemi Tameh, M.; Primiceri, E.; Chiriacò, M.S.; Poltronieri, P.; Bahar, M.; Maruccio, G. Pectobacterium atrosepticum Biosensor for Monitoring Blackleg and Soft Rot Disease of Potato. Biosensors 2020, 10, 64. [Google Scholar] [CrossRef]
- Zeng, C.; Huang, X.; Xu, J.; Li, G.; Ma, J.; Ji, H.F.; Zhu, S.; Chen, H. Rapid and sensitive detection of maize chlorotic mottle virus using surface plasmon resonance-based biosensor. Anal. Biochem. 2013, 440, 18–22. [Google Scholar] [CrossRef]
- Hallau, L.; Neumann, M.; Klatt, B.; Kleinhenz, B.; Klein, T.; Kuhn, C.; Röhrig, M.; Bauckhage, C.; Kersting, K.; Mahlein, A.K.; et al. Automated identification of sugar beet diseases using smartphones. Plant Pathol. 2018, 67, 399–410. [Google Scholar] [CrossRef]
- Johannes, A.; Picon, A.; Alvarez-Gila, A.; Echazarra, J.; Rodriguez-Vaamonde, S.; Navajas, A.D.; Ortiz-Barredo, A. Automatic plant disease diagnosis using mobile capture devices, applied on a wheat use case. Comput. Electron. Agric. 2017, 138, 200–209. [Google Scholar] [CrossRef]
- Petrellis, N. A smart phone image processing application for plant disease diagnosis. In Proceedings of the 2017 6th International Conference on Modern Circuits and Systems Technologies (MOCAST), Thessaloniki, Greece, 4–6 May 2017; pp. 1–4. [Google Scholar]
- Mohanty, S.P.; Hughes, D.P.; Salathé, M. Using Deep Learning for Image-Based Plant Disease Detection. Front. Plant Sci. 2016, 7, 1419. [Google Scholar] [CrossRef] [Green Version]
- Barbedo, J.G.A.; Koenigkan, L.V.; Santos, T.T. Identifying multiple plant diseases using digital image processing. Biosyst. Eng. 2016, 147, 104–116. [Google Scholar] [CrossRef]
- Schor, N.; Bechar, A.; Ignat, T.; Dombrovsky, A.; Elad, Y.; Berman, S. Robotic Disease Detection in Greenhouses: Combined Detection of Powdery Mildew and Tomato Spotted Wilt Virus. IEEE Robot. Autom. Lett. 2016, 1, 354–360. [Google Scholar] [CrossRef]
- Zhou, R.; Kaneko, S.; Tanaka, F.; Kayamori, M.; Shimizu, M. Image-based field monitoring of Cercospora leaf spot in sugar beet by robust template matching and pattern recognition. Comput. Electron. Agric. 2015, 116, 65–79. [Google Scholar] [CrossRef]
- Pourreza, A.; Lee, W.S.; Ehsani, R.; Schueller, J.K.; Raveh, E. An optimum method for real-time in-field detection of Huanglongbing disease using a vision sensor. Comput. Electron. Agric. 2015, 110, 221–232. [Google Scholar] [CrossRef]
- Lloret, J.; Bosch, I.; Sendra, S.; Serrano, A. A Wireless Sensor Network for Vineyard Monitoring That Uses Image Processing. Sensors 2011, 11, 6165–6196. [Google Scholar] [CrossRef] [Green Version]
- Moghadam, P.; Ward, D.; Goan, E.; Jayawardena, S.; Sikka, P.; Hernandez, E. Plant Disease Detection Using Hyperspectral Imaging. In Proceedings of the 2017 International Conference on Digital Image Computing: Techniques and Applications (DICTA), Sydney, NSW, Australia, 29 November–1 December 2017; pp. 1–8. [Google Scholar]
- Mishra, P.; Asaari, M.S.M.; Herrero-Langreo, A.; Lohumi, S.; Diezma, B.; Scheunders, P. Close range hyperspectral imaging of plants: A reviewf. Biosyst. Eng. 2017, 164, 49–67. [Google Scholar] [CrossRef]
- Abdulridha, J.; Ampatzidis, Y.; Kakarla, S.C.; Roberts, P. Detection of target spot and bacterial spot diseases in tomato using UAV-based and benchtop-based hyperspectral imaging techniques. Precis. Agric. 2020, 21, 955–978. [Google Scholar] [CrossRef]
- Wang, D.; Vinson, R.; Holmes, M.; Seibel, G.; Bechar, A..; Nof, S.; Tao, Y. Early Detection of Tomato Spotted Wilt Virus by Hyperspectral Imaging and Outlier Removal Auxiliary Classifier Generative Adversarial Nets (OR-AC-GAN). Sci. Rep. 2019, 9, 4377. [Google Scholar] [CrossRef]
- Nagasubramanian, K.; Jones, S.; Singh, A.K.; Sarkar, S.; Singh, A.; Ganapathysubramanian, B. Plant disease identification using explainable 3D deep learning on hyperspectral images. Plant Methods 2019, 15, 98. [Google Scholar] [CrossRef]
- Zhang, X.; Han, L.; Dong, Y.; Shi, Y.; Huang, W.; Han, L.; González-Moreno, P.; Ma, H.; Ye, H.; Sobeih, T. A Deep Learning-Based Approach for Automated Yellow Rust Disease Detection from High-Resolution Hyperspectral UAV Images. Remote Sens. 2019, 11, 1554. [Google Scholar] [CrossRef] [Green Version]
- Zhu, H.; Chu, B.; Zhang, C.; Liu, F.; Jiang, L.; He, Y. Hyperspectral Imaging for Presymptomatic Detection of Tobacco Disease with Successive Projections Algorithm and Machine-learning Classifiers. Sci. Rep. 2017, 7, 4125. [Google Scholar] [CrossRef] [Green Version]
- Islam, M.; Dinh, A.; Wahid, K.; Bhowmik, P. Detection of potato diseases using image segmentation and multiclass support vector machine. In Proceedings of the 2017 IEEE 30th Canadian Conference on Electrical and Computer Engineering (CCECE), Windsor, ON, Canada, 30 April–3 May 2017; pp. 1–4. [Google Scholar]
- Goodfellow, I.; Pouget-Abadie, J.; Mirza, M.; Xu, B.; Warde-Farley, D.; Ozair, S.; Courville, A.; Bengio, Y. Generative Adversarial Nets. In Advances in Neural Information Processing Systems; Ghahramani, Z., Welling, M., Cortes, C., Lawrence, N., Weinberger, K.Q., Eds.; Curran Associates, Inc.: Red Hook, NY, USA, 2014; Volume 27, pp. 2672–2680. [Google Scholar]
- Lu, J.; Ehsani, R.; Shi, Y.; de Castro, A.I.; Wang, S. Detection of multi-tomato leaf diseases (late blight, target and bacterial spots) in different stages by using a spectral-based sensor. Sci. Rep. 2018, 8, 2793. [Google Scholar] [CrossRef] [Green Version]
- Del Fiore, A.; Reverberi, M.; Ricelli, A.; Pinzari, F.; Serranti, S.; Fabbri, A.; Bonifazi, G.; Fanelli, C. Early detection of toxigenic fungi on maize by hyperspectral imaging analysis. Int. J. Food Microbiol. 2010, 144, 64–71. [Google Scholar] [CrossRef] [PubMed]
- Costa, J.M.; Grant, O.M.; Chaves, M.M. Thermography to explore plant–environment interactions. J. Exp. Bot. 2013, 64, 3937–3949. [Google Scholar] [CrossRef] [PubMed]
- Zhu, W.; Chen, H.; Ciechanowska, I.; Spaner, D. Application of infrared thermal imaging for the rapid diagnosis of crop disease. IFAC-PapersOnLine 2018, 51, 424–430. [Google Scholar] [CrossRef]
- Oerke, E.; Fröhling, P.; Steiner, U. Thermographic assessment of scab disease on apple leaves. Precis. Agric. 2011, 12, 699–715. [Google Scholar] [CrossRef]
- Smigaj, M.; Gaulton, R.; Suárez, J.C.; Barr, S.L. Canopy temperature from an Unmanned Aerial Vehicle as an indicator of tree stress associated with red band needle blight severity. For. Ecol. Manag. 2019, 433, 699–708. [Google Scholar] [CrossRef]
- Wen, D.M.; Chen, M.X.; Zhao, L.; Ji, T.; Li, M.; Yang, X.T. Use of thermal imaging and Fourier transform infrared spectroscopy for the pre-symptomatic detection of cucumber downy mildew. Eur. J. Plant Pathol. 2019, 155, 405–416. [Google Scholar] [CrossRef]
- Jafari, M.; Minaei, S.; Safaie, N. Detection of pre-symptomatic rose powdery-mildew and gray-mold diseases based on thermal vision. Infrared Phys. Technol. 2017, 85, 170–183. [Google Scholar] [CrossRef]
- Wang, M.; Ling, N.; Dong, X.; Zhu, Y.; Shen, Q.; Guo, S. Thermographic visualization of leaf response in cucumber plants infected with the soil-borne pathogen Fusarium oxysporum f. sp. cucumerinum. Plant Physiol. Biochem. 2012, 61, 153–161. [Google Scholar] [CrossRef] [PubMed]
- Sankaran, S.; Mishra, A.; Maja, J.M.; Ehsani, R. Visible-near infrared spectroscopy for detection of Huanglongbing in citrus orchards. Comput. Electron. Agric. 2011, 77, 127–134. [Google Scholar] [CrossRef]
- Liang, P.S.; Haff, R.P.; Hua, S.S.T.; Munyaneza, J.E.; Mustafa, T.; Sarreal, S.B.L. Nondestructive detection of zebra chip disease in potatoes using near-infrared spectroscopy. Biosyst. Eng. 2018, 166, 161–169. [Google Scholar] [CrossRef]
- Gold, K.M.; Townsend, P.A.; Herrmann, I.; Gevens, A.J. Investigating potato late blight physiological differences across potato cultivars with spectroscopy and machine learning. Plant Sci. 2020, 295, 110316. [Google Scholar] [CrossRef]
- Karadağ, K.; Tenekeci, M.E.; Taşaltın, R.; Bilgili, A. Detection of pepper fusarium disease using machine learning algorithms based on spectral reflectance. Sustain. Comput. Inform. Syst. 2020, 28, 100299. [Google Scholar] [CrossRef]
- Kafle, G.K.; Khot, L.R.; Jarolmasjed, S.; Yongsheng, S.; Lewis, K. Robustness of near infrared spectroscopy based spectral features for non-destructive bitter pit detection in honeycrisp apples. Postharvest Biol. Technol. 2016, 120, 188–192. [Google Scholar] [CrossRef] [Green Version]
- Farber, C.; Kurouski, D. Detection and Identification of Plant Pathogens on Maize Kernels with a Hand-Held Raman Spectrometer. Anal. Chem. 2018, 90, 3009–3012. [Google Scholar] [CrossRef] [Green Version]
- Yeturu, S.; Vargas Jentzsch, P.; Ciobotă, V.; Guerrero, R.; Garrido, P.; Ramos, L.A. Handheld Raman spectroscopy for the early detection of plant diseases: Abutilon mosaic virus infecting Abutilon sp. Anal. Methods 2016, 8, 3450–3457. [Google Scholar] [CrossRef]
- Liu, Y.; Xiao, H.; Hao, Y.; Ye, L.; Jiang, X.; Wang, H.; Sun, X. Diagnosis of Citrus Greening using Raman Spectroscopy-Based Pattern Recognition. J. Appl. Spectrosc. 2020, 87, 150–158. [Google Scholar] [CrossRef]
- Mandrile, L.; Rotunno, S.; Miozzi, L.; Vaira, A.M.; Giovannozzi, A.M.; Rossi, A.M.; Noris, E. Nondestructive Raman Spectroscopy as a Tool for Early Detection and Discrimination of the Infection of Tomato Plants by Two Economically Important Viruses. Anal. Chem. 2019, 91, 9025–9031. [Google Scholar] [CrossRef] [PubMed]
- Murchie, E.; Lawson, T. Chlorophyll fluorescence analysis: A guide to good practice and understanding some new applications. J. Exp. Bot. 2013, 64, 3983–3998. [Google Scholar] [CrossRef] [Green Version]
- Belin, É.; Rousseau, D.; Boureau, T.; Caffier, V. Thermography versus chlorophyll fluorescence imaging for detection and quantification of apple scab. Comput. Electron. Agric. 2013, 90, 159–163. [Google Scholar] [CrossRef]
- Wang, L.; Poque, S.; Valkonen, J.P.T. Phenotyping viral infection in sweetpotato using a high-throughput chlorophyll fluorescence and thermal imaging platform. Plant Methods 2019, 15, 116. [Google Scholar] [CrossRef] [Green Version]
- Bauriegel, E.; Herppich, W.B. Hyperspectral and Chlorophyll Fluorescence Imaging for Early Detection of Plant Diseases, with Special Reference to Fusarium spec. Infections on Wheat. Agriculture 2014, 4, 32–57. [Google Scholar] [CrossRef] [Green Version]
- Pineda, M.; Pérez-Bueno, M.L.; Barón, M. Detection of Bacterial Infection in Melon Plants by Classification Methods Based on Imaging Data. Front. Plant Sci. 2018, 9, 164. [Google Scholar] [CrossRef] [Green Version]
- Pan, X.; Welti, R.; Wang, X. Quantitative analysis of major plant hormones in crude plant extracts by high-performance liquid chromatography–mass spectrometry. Nat. Protoc. 2010, 5, 986–992. [Google Scholar] [CrossRef]
- Müller, M.; Munné-Bosch, S. Rapid and sensitive hormonal profiling of complex plant samples by liquid chromatography coupled to electrospray ionization tandem mass spectrometry. Plant Methods 2011, 7, 37. [Google Scholar] [CrossRef] [Green Version]
- Kojima, M.; Kamada-Nobusada, T.; Komatsu, H.; Takei, K.; Kuroha, T.; Mizutani, M.; Ashikari, M.; Ueguchi-Tanaka, M.; Matsuoka, M.; Suzuki, K.; et al. Highly Sensitive and High-Throughput Analysis of Plant Hormones Using MS-Probe Modification and Liquid Chromatography–Tandem Mass Spectrometry: An Application for Hormone Profiling in Oryza sativa. Plant Cell Physiol. 2009, 50, 1201–1214. [Google Scholar] [CrossRef]
- Fang, Y.; Bullock, H.; Lee, S.A.; Sekar, N.; Eiteman, M.A.; Whitman, W.B.; Ramasamy, R.P. Detection of methyl salicylate using bi-enzyme electrochemical sensor consisting salicylate hydroxylase and tyrosinase. Biosens. Bioelectron. 2016, 85, 603–610. [Google Scholar] [CrossRef] [Green Version]
- Martín, C.; Domínguez, E. A new enzyme electrode for quantification of salicylic acid in a FIA system. J. Pharm. Biomed. Anal. 1999, 19, 107–113. [Google Scholar] [CrossRef]
- Chen, C.; Feng, S.; Zhou, M.; Ji, C.; Que, L.; Wang, W. Development of a structure-switching aptamer-based nanosensor for salicylic acid detection. Biosens. Bioelectron. 2019, 140, 111342. [Google Scholar] [CrossRef]
- Yang, X.; Gao, Y.; Ji, Z.; Zhu, L.B.; Yang, C.; Zhao, Y.; Shu, Y.; Jin, D.; Xu, Q.; Zhao, W.W. Dual Functional Molecular Imprinted Polymer-Modified Organometal Lead Halide Perovskite: Synthesis and Application for Photoelectrochemical Sensing of Salicylic Acid. Anal. Chem. 2019, 91, 9356–9360. [Google Scholar] [CrossRef] [Green Version]
- Rawlinson, S.; McLister, A.; Kanyong, P.; Davis, J. Rapid determination of salicylic acid at screen printed electrodes. Microchem. J. 2018, 137, 71–77. [Google Scholar] [CrossRef]
- Park, J.; Eun, C. Electrochemical Behavior and Determination of Salicylic Acid at Carbon-fiber Electrodes. Electrochim. Acta 2016, 194, 346–356. [Google Scholar] [CrossRef]
- Wang, H.R.; Bi, X.M.; Fang, Z.J.; Yang, H.; Gu, H.Y.; Sun, L.J.; Bao, N. Real time sensing of salicylic acid in infected tomato leaves using carbon tape electrodes modified with handed pencil trace. Sens. Actuators B Chem. 2019, 286, 104–110. [Google Scholar] [CrossRef]
- Sun, L.J.; Feng, Q.M.; Yan, Y.F.; Pan, Z.Q.; Li, X.H.; Song, F.M.; Yang, H.; Xu, J.J.; Bao, N.; Gu, H.Y. Paper-based electroanalytical devices for in situ determination of salicylic acid in living tomato leaves. Biosens. Bioelectron. 2014, 60, 154–160. [Google Scholar] [CrossRef]
- Xiong, X.J.; Rao, W.B.; Guo, X.F.; Wang, H.; Zhang, H.S. Ultrasensitive Determination of Jasmonic Acid in Plant Tissues Using High-Performance Liquid Chromatography with Fluorescence Detection. J. Agric. Food Chem. 2012, 60, 5107–5111. [Google Scholar] [CrossRef]
- Gan, T.; Hu, C.; Chen, Z.; Hu, S. Fabrication and application of a novel plant hormone sensor for the determination of methyl jasmonate based on self-assembling of phosphotungstic acid–graphene oxide nanohybrid on graphite electrode. Sens. Actuators B Chem. 2010, 151, 8–14. [Google Scholar] [CrossRef]
- Rustia, D.J.A.; Lin, C.E.; Chung, J.Y.; Zhuang, Y.J.; Hsu, J.C.; Lin, T.T. Application of an image and environmental sensor network for automated greenhouse insect pest monitoring. J. Asia-Pac. Entomol. 2020, 23, 17–28. [Google Scholar] [CrossRef]
- Partel, V.; Nunes, L.; Stansly, P.; Ampatzidis, Y. Automated vision-based system for monitoring Asian citrus psyllid in orchards utilizing artificial intelligence. Comput. Electron. Agric. 2019, 162, 328–336. [Google Scholar] [CrossRef]
- Selvaraj, M.G.; Vergara, A.; Ruiz, H.; Safari, N.; Elayabalan, S.; Ocimati, W.; Blomme, G. AI-powered banana diseases and pest detection. Plant Methods 2019, 15, 92. [Google Scholar] [CrossRef]
- Liu, L.; Wang, R.; Xie, C.; Yang, P.; Wang, F.; Sudirman, S.; Liu, W. PestNet: An End-to-End Deep Learning Approach for Large-Scale Multi-Class Pest Detection and Classification. IEEE Access 2019, 7, 45301–45312. [Google Scholar] [CrossRef]
- Deng, L.; Wang, Y.; Han, Z.; Yu, R. Research on insect pest image detection and recognition based on bio-inspired methods. Biosyst. Eng. 2018, 169, 139–148. [Google Scholar] [CrossRef]
- Ebrahimi, M.; Khoshtaghaza, M.; Minaei, S.; Jamshidi, B. Vision-based pest detection based on SVM classification method. Comput. Electron. Agric. 2017, 137, 52–58. [Google Scholar] [CrossRef]
- Ding, W.; Taylor, G. Automatic moth detection from trap images for pest management. Comput. Electron. Agric. 2016, 123, 17–28. [Google Scholar] [CrossRef] [Green Version]
- Espinoza, K.; Valera, D.L.; Torres, J.A.; López, A.; Molina-Aiz, F.D. Combination of image processing and artificial neural networks as a novel approach for the identification of Bemisia tabaci and Frankliniella occidentalis on sticky traps in greenhouse agriculture. Comput. Electron. Agric. 2016, 127, 495–505. [Google Scholar] [CrossRef]
- Liu, T.; Chen, W.; Wu, W.; Sun, C.; Guo, W.; Zhu, X. Detection of aphids in wheat fields using a computer vision technique. Biosyst. Eng. 2016, 141, 82–93. [Google Scholar] [CrossRef]
- Redmon, J.; Farhadi, A. YOLOv3: An Incremental Improvement. arXiv 2018, arXiv:1804.02767. [Google Scholar]
- Yahia, E.M.; Neven, L.G.; Jones, R.W. Chapter 16—Postharvest Insects and Their Control. In Postharvest Technology of Perishable Horticultural Commodities; Yahia, E.M., 1st, Ed.; Woodhead Publishing Ltd.: Cambridge, UK, 2019; pp. 529–562. [Google Scholar]
- Serre, T.; Wolf, L.; Bileschi, S.; Riesenhuber, M.; Poggio, T. Robust Object Recognition with Cortex-Like Mechanisms. IEEE Trans. Pattern Anal. Mach. Intell. 2007, 29, 411–426. [Google Scholar] [CrossRef] [PubMed]
- Mankin, R.W.; Hagstrum, D.W.; Smith, M.T.; Roda, A.L.; Kairo, M.T.K. Perspective and Promise: A Century of Insect Acoustic Detection and Monitoring. Am. Entomol. 2011, 57, 30–44. [Google Scholar] [CrossRef]
- Rach, M.M.; Gomis, H.M.; Granado, O.L.; Malumbres, M.P.; Campoy, A.M.; Martín, J.J.S. On the Design of a Bioacoustic Sensor for the Early Detection of the Red Palm Weevil. Sensors 2013, 13, 1706–1729. [Google Scholar] [CrossRef]
- Escola, J.P.L.; Guido, R.C.; da Silva, I.N.; Cardoso, A.M.; Maccagnan, D.H.B.; Dezotti, A.K. Automated acoustic detection of a cicadid pest in coffee plantations. Comput. Electron. Agric. 2020, 169, 105215. [Google Scholar] [CrossRef]
- Hetzroni, A.; Soroker, V.; Cohen, Y. Toward practical acoustic red palm weevil detection. Comput. Electron. Agric. 2016, 124, 100–106. [Google Scholar] [CrossRef]
- Görres, C.M.; Chesmore, D. Active sound production of scarab beetle larvae opens up new possibilities for species-specific pest monitoring in soils. Sci. Rep. 2019, 9, 10115. [Google Scholar] [CrossRef] [Green Version]
- Delory, B.M.; Delaplace, P.; Fauconnier, M.L.; du Jardin, P. Root-emitted volatile organic compounds: Can they mediate belowground plant-plant interactions? Plant Soil 2016, 402, 1–26. [Google Scholar] [CrossRef] [Green Version]
- Bitas, V.; Kim, H.S.; Bennett, J.W.; Kang, S. Sniffing on Microbes: Diverse Roles of Microbial Volatile Organic Compounds in Plant Health. Mol. Plant-Microbe Interact. 2013, 26, 835–843. [Google Scholar] [CrossRef] [Green Version]
- Brilli, F.; Loreto, F.; Baccelli, I. Exploiting Plant Volatile Organic Compounds (VOCs) in Agriculture to Improve Sustainable Defense Strategies and Productivity of Crops. Front. Plant Sci. 2019, 10, 264. [Google Scholar] [CrossRef]
- Cui, S.; Inocente, E.A.A.; Acosta, N.; Keener, H.M.; Zhu, H.; Ling, P.P. Development of Fast E-nose System for Early-Stage Diagnosis of Aphid-Stressed Tomato Plants. Sensors 2019, 19, 3480. [Google Scholar] [CrossRef] [Green Version]
- Farag, M.A.; Ryu, C.M.; Sumner, L.W.; Paré, P.W. GC–MS SPME profiling of rhizobacterial volatiles reveals prospective inducers of growth promotion and induced systemic resistance in plants. Phytochemistry 2006, 67, 2262–2268. [Google Scholar] [CrossRef]
- Stoppacher, N.; Kluger, B.; Zeilinger, S.; Krska, R.; Schuhmacher, R. Identification and profiling of volatile metabolites of the biocontrol fungus Trichoderma atroviride by HS-SPME-GC-MS. J. Microbiol. Methods 2010, 81, 187–193. [Google Scholar] [CrossRef]
- Brilli, F.; Ruuskanen, T.M.; Schnitzhofer, R.; Müller, M.; Breitenlechner, M.; Bittner, V.; Wohlfahrt, G.; Loreto, F.; Hansel, A. Detection of Plant Volatiles after Leaf Wounding and Darkening by Proton Transfer Reaction “Time-of-Flight” Mass Spectrometry (PTR-TOF). PLoS ONE 2011, 6, e20419. [Google Scholar] [CrossRef] [Green Version]
- Blake, R.S.; Monks, P.S.; Ellis, A.M. Proton-Transfer Reaction Mass Spectrometry. Chem. Rev. 2009, 109, 861–896. [Google Scholar] [CrossRef]
- Portable Electronic Nose | AIRSENSE Analytics. Available online: https://airsense.com/en/products/portable-electronic-nose (accessed on 2 January 2021).
- Neo Electronic Nose | Norlab. Available online: https://www.norlab.com/library/brochure/11575 (accessed on 2 January 2021).
- Sensigent. Available online: http://www.sensigent.com/products/cyranose.html (accessed on 2 January 2021).
- Park, S.Y.; Kim, Y.; Kim, T.; Eom, T.H.; Kim, S.Y.; Jang, H.W. Chemoresistive materials for electronic nose: Progress, perspectives, and challenges. InfoMat 2019, 1, 289–316. [Google Scholar] [CrossRef] [Green Version]
- Blasioli, S.; Biondi, E.; Braschi, I.; Mazzucchi, U.; Bazzi, C.; Gessa, C. Electronic nose as an innovative tool for the diagnosis of grapevine crown gall. Anal. Chim. Acta 2010, 672, 20–24. [Google Scholar] [CrossRef]
- Cellini, A.; Biondi, E.; Blasioli, S.; Rocchi, L.; Farneti, B.; Braschi, I.; Savioli, S.; Rodriguez-Estrada, M.; Biasioli, F.; Spinelli, F. Early detection of bacterial diseases in apple plants by analysis of volatile organic compounds profiles and use of electronic nose. Ann. Appl. Biol. 2016, 168, 409–420. [Google Scholar] [CrossRef]
- Li, Z.; Paul, R.; Ba Tis, T.; Saville, A.C.; Hansel, J.C.; Yu, T.; Ristaino, J.B.; Wei, Q. Non-invasive plant disease diagnostics enabled by smartphone-based fingerprinting of leaf volatiles. Nat. Plants 2019, 5, 856–866. [Google Scholar] [CrossRef]
- Shang, L.; Liu, C.; Chen, B.; Hayashi, K. Development of molecular imprinted sol-gel based LSPR sensor for detection of volatile cis-jasmone in plant. Sens. Actuators B Chem. 2018, 260, 617–626. [Google Scholar] [CrossRef]
- Wang, Z.; Chen, W.; Gu, S.; Wang, J.; Wang, Y. Discrimination of wood borers infested Platycladus orientalis trunks using quartz crystal microbalance gas sensor array. Sens. Actuators B Chem. 2020, 309, 127767. [Google Scholar] [CrossRef]
- Husin, N.A.; Khairunniza-Bejo, S.; Abdullah, A.F.; Kassim, M.S.M.; Ahmad, D.; Azmi, A.N.N. Application of Ground-Based LiDAR for Analysing Oil Palm Canopy Properties on the Occurrence of Basal Stem Rot (BSR) Disease. Sci. Rep. 2020, 10, 6464. [Google Scholar] [CrossRef] [PubMed] [Green Version]
- Giannakis, I.; Tosti, F.; Lantini, L.; Alani, A.M. Diagnosing Emerging Infectious Diseases of Trees Using Ground Penetrating Radar. IEEE Trans. Geosci. Remote Sens. 2020, 58, 1146–1155. [Google Scholar] [CrossRef]
- Junttila, S.; Holopainen, M.; Vastaranta, M.; Lyytikäinen-Saarenmaa, P.; Kaartinen, H.; Hyyppä, J.; Hyyppä, H. The potential of dual-wavelength terrestrial lidar in early detection of Ips typographus (L.) infestation—Leaf water content as a proxy. Remote Sens. Environ. 2019, 231, 111264. [Google Scholar] [CrossRef]
- Zhang, X.; Derival, M.; Albrecht, U.; Ampatzidis, Y. Evaluation of a Ground Penetrating Radar to Map the Root Architecture of HLB-Infected Citrus Trees. Agronomy 2019, 9, 354. [Google Scholar] [CrossRef] [Green Version]
- Pham, H.; Lim, Y.; Gardi, A.; Sabatini, R. A Novel Bistatic LIDAR System for Early-Detection of Plant Diseases from Unmanned Aircraft. In Proceedings of the 31th Congress of the International Council of the Aeronautical Sciences (ICAS 2018), Belo Horizonte, Brazil, 9–14 September 2018. [Google Scholar]
- Lin, Y. LiDAR: An important tool for next-generation phenotyping technology of high potential for plant phenomics? Comput. Electron. Agric. 2015, 119, 61–73. [Google Scholar] [CrossRef]
- Omasa, K.; Hosoi, F.; Konishi, A. 3D lidar imaging for detecting and understanding plant responses and canopy structure. J. Exp. Bot. 2006, 58, 881–898. [Google Scholar] [CrossRef] [Green Version]
- Delgado, A.; Hays, D.B.; Bruton, R.K.; Ceballos, H.; Novo, A.; Boi, E.; Selvaraj, M.G. Ground penetrating radar: A case study for estimating root bulking rate in cassava (Manihot esculenta Crantz). Plant Methods 2017, 13, 65. [Google Scholar] [CrossRef]
- Malmqvist, E.; Jansson, S.; Zhu, S.; Li, W.; Svanberg, K.; Svanberg, S.; Rydell, J.; Song, Z.; Bood, J.; Brydegaard, M.; et al. The bat–bird–bug battle: Daily flight activity of insects and their predators over a rice field revealed by high-resolution Scheimpflug Lidar. R. Soc. Open Sci. 2018, 5, 172303. [Google Scholar]
- Agriculture IoT Market—Global Opportunity Analysis and Industry Forecast (2019-2027). Available online: https://www.meticulousresearch.com/product/agriculture-iot-market-5080/ (accessed on 13 January 2021).


| Direct Phytopathogen Detection Methods | ||||
|---|---|---|---|---|
| Sensing Method | Brief Description | Performance (Sensitivity) | Strengths | Limitations |
| Polymerase chain reaction (PCR) | Pathogens are identified by selective DNA amplification using specific primers and thermal cycling. | 1–100 fg/L [42] | Highly selective, reliable and sensitive, cost effective, well established. | Extensive sample preparation and precise thermal cycling required, non-portable. |
| Isothermal DNA amplification | Utilizes special primers only without thermal cycling for DNA amplification. | 0.01–1 pg/L [43,44] | Selective, reliable, thermal cycling not required making operation simpler. | Complex primer needs for successful testing, elaborate sampling and testing procedure. |
| ELISA | Detection mechanism consists of affinity-based interaction between antigen (pathogen-specific protein) and antibody. | 1–100 fg/L [45] | Easy to use, suitable for high throughput testing, and particularly useful for detecting viral antigens | Time consuming, elaborate sample preparation and labeling (antigen extraction) maybe required. |
| Lateral flow immunoassay | Based on colorimetric detection of the formation of antigen–antibody complex. | 0.1–1 pg/L [46,47,48] | Portable, inexpensive and easy to use. | Qualitative-only, sample preparation is often required to extract antigen proteins. |
| Immunosensors | Identification of the antigen–antibody complexes using various transduction mechanisms. | 0.1–10 pg/L [49,50] | Highly portable, quantitative, easy to use | Variability in operation. |
| Indirect Phytopathogen Detection Methods | |||
|---|---|---|---|
| Sensing Method | Brief Description | Strengths | Limitations |
| Visible/RGB imaging | Color-based features are identified and extracted followed by classification using computational algorithms. | Relatively inexpensive hardware (often smartphone-based), non-invasive. | Low scope for pre-symptomatic detection, complex data processing. |
| Hyperspectral imaging | Spatio-spectral features are extracted in 100s of wavelength bands forming a hypercube followed by data processing to detect symptoms. | Good scope for pre-symptomatic testing, and potential for in-situ automated operation. | Requires sophisticated hardware and complex software. |
| Thermography | Passive thermal radiation is recorded where local temperature anomalies are used to detect diseases. | Relatively inexpensive, fast response, computationally simple. | Poor specificity, and suitable only for generalized plant health monitoring. |
| VIS/IR spectroscopy | Spectral information from ambient light recording and analyzed using a spectroradiometer. | Low-cost, simple set-up, and good general sensitivity. | Poor specificity, no spatial information is recorded making it unsuitable for in-situ operation. |
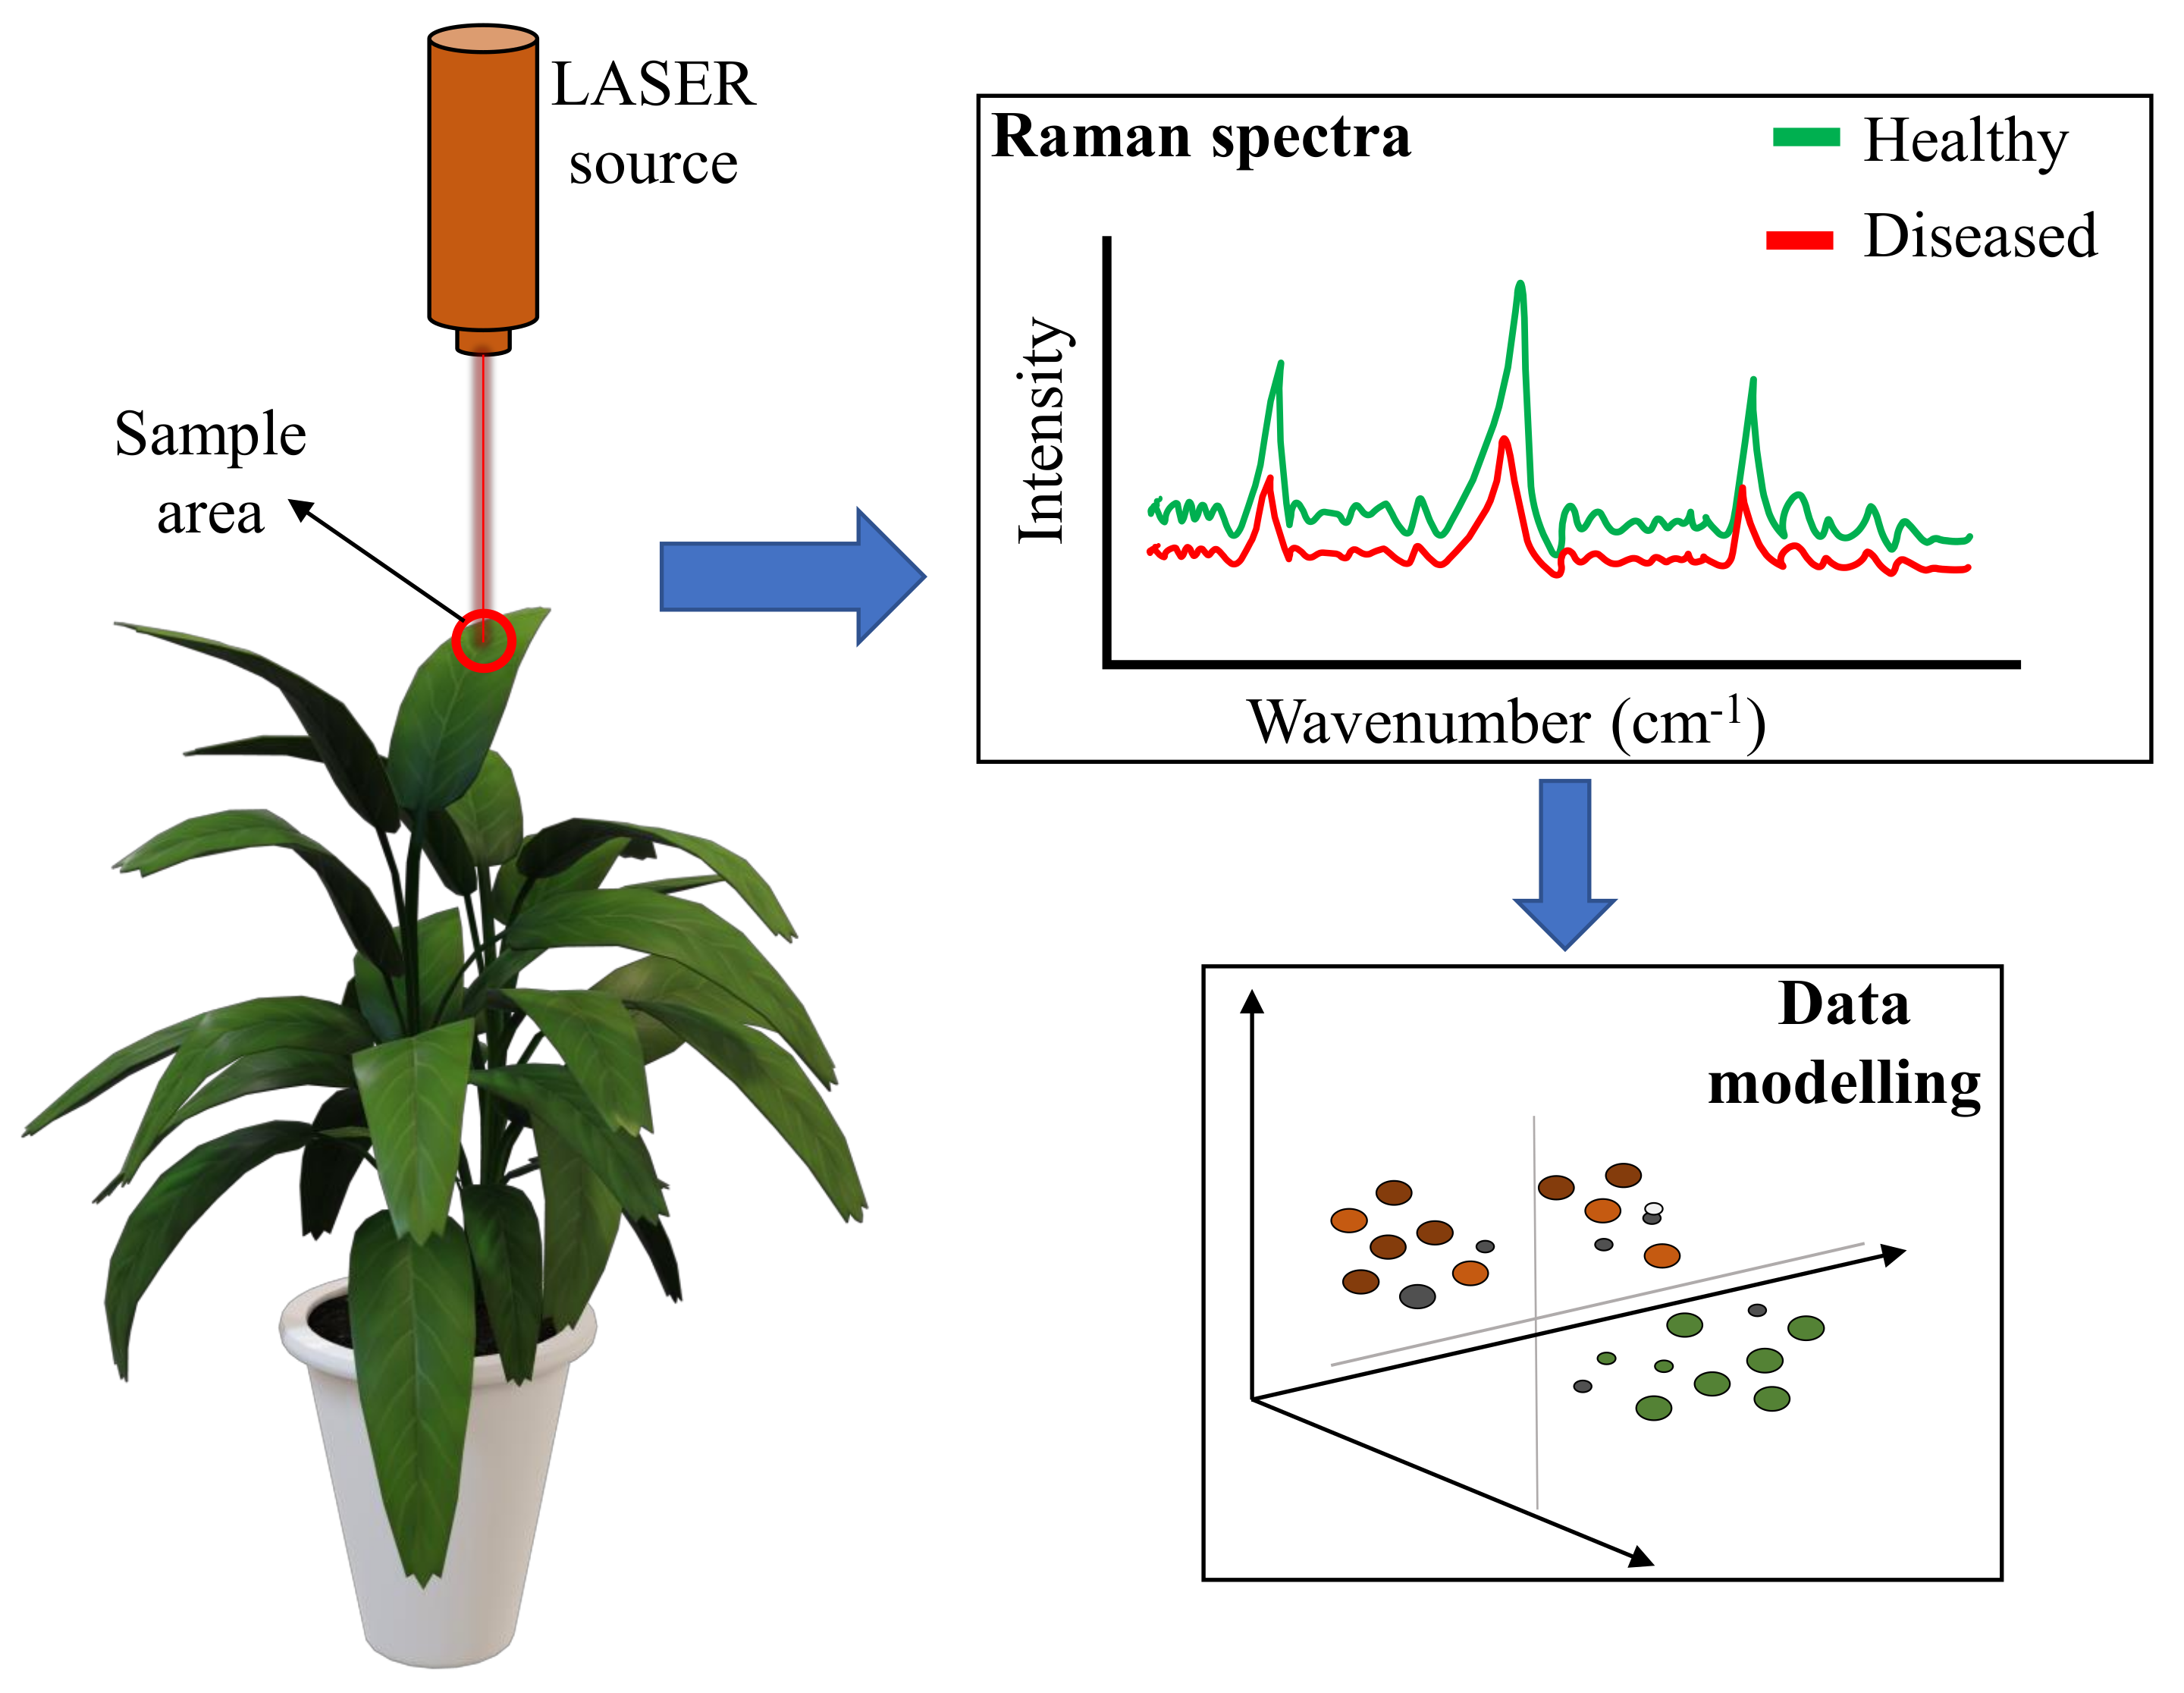
| Raman spectroscopy | Detection of disease is based on chemical changes in the plant tissue identified using molecular signature initiated by a laser source. | Easy to use, fast response, and scope for specific disease detection. | Prone to interference from background fluorescence, special hardware is required, difficult application for in-field operation. |
| Chlorophyll fluorescence | Based on variations (due to stress) in fluorescence that occurs during photosynthesis in the plants. | Provides information about the photosynthetic efficiency that may improve the accuracy when used in conjunction with imaging-based methods. | Time consuming experimental apparatus is required (dark adapting the sample plants). |
| Phytohormone biosensing | Defense related hormonal signatures are monitored as a indicator of biotic stress in plants | Scope for high specificity, low-cost, fast response, and in-situ application. | Invasive sampling. |
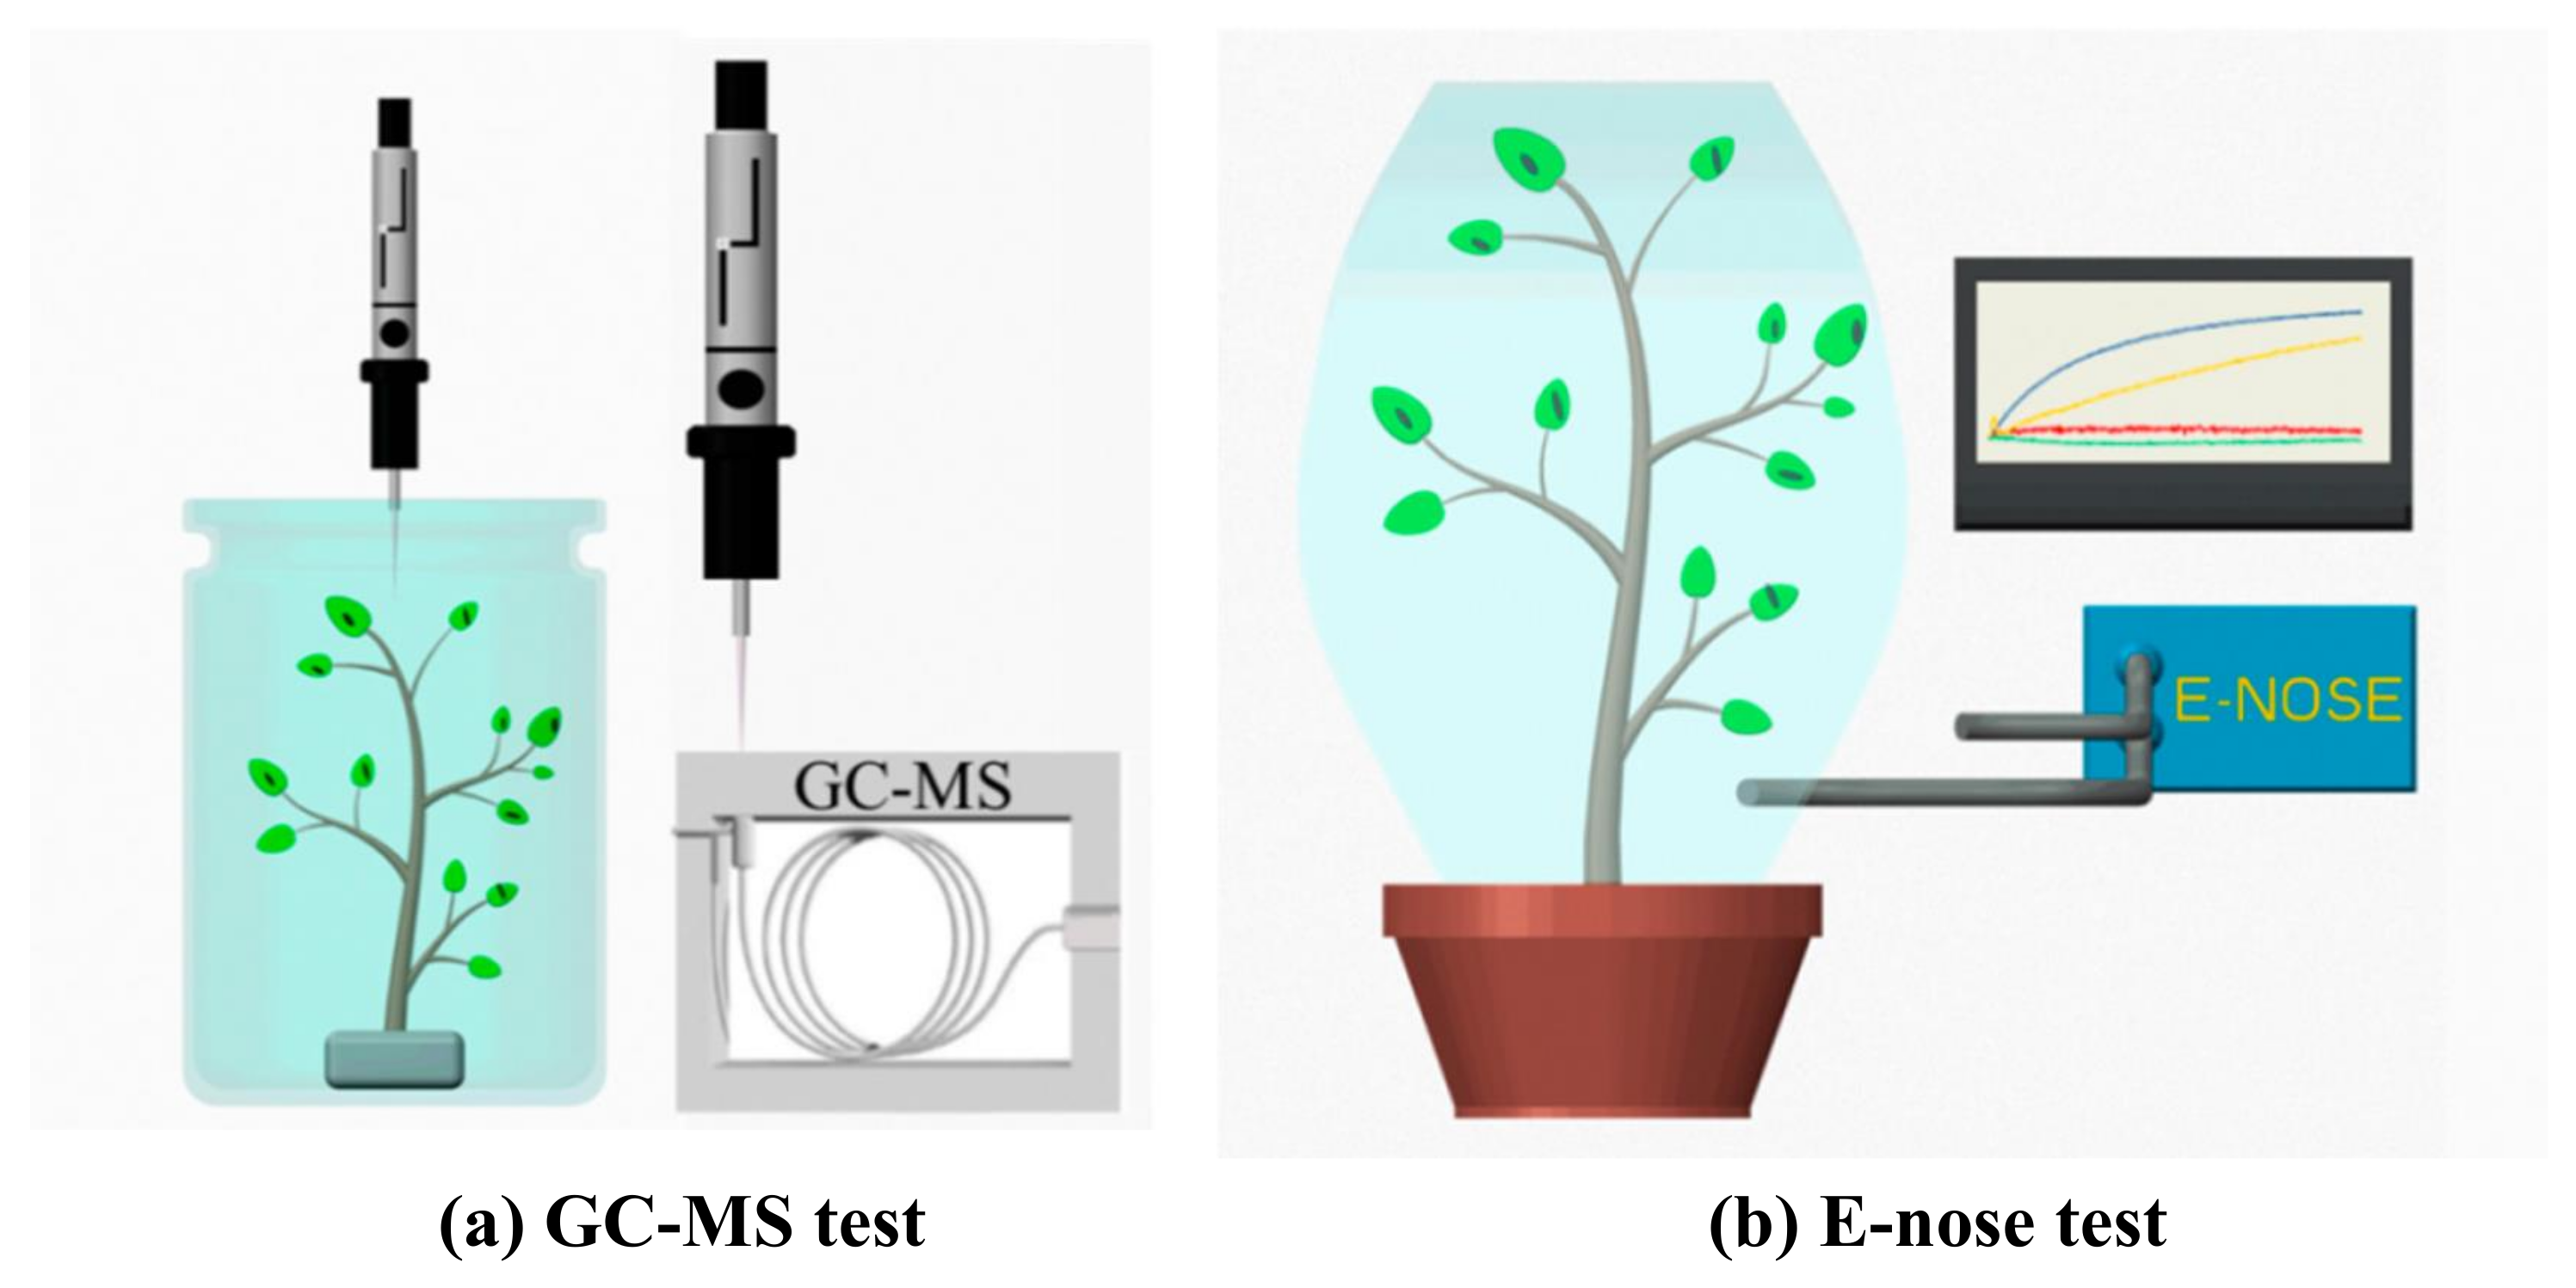
| VOC emission monitoring | Changes in gaseous emissions from plants are detected as measure of plant health. | Suitable for general plant health monitoring, non-invasive, and scope of automated continuous monitoring. | Challenging experimental set-up, complex sampling and testing, low specificity. |
| Active remote sensing methods | RADAR and LiDAR technology is used to detection symptomatic morphological changes | Suitable for large-scale non-specific plant health monitoring, LiDAR has scope to detect parameters like CO and plant water content. | High initial cost, complex sampling and data processing, low specificity. |
| Sensing Application | Brief Description | Accuracy | Strengths | Limitations | Ref., Year |
|---|---|---|---|---|---|
| Target spot and bacterial spot in tomato | 35 spectral vegetative indices and 2 classifiers were evaluated using UAV-based and benchtop-based HS imaging. | 97% to 99% | Good accuracy, in-field as well as laboratory-based operations were developed and compared | Computationally intensive, spatial resolution as well as specificity not discussed | [97], 2020 |
| Early TSWV detection in sweet pepper | Analysis method based on generative adversarial nets, named as outlier removal auxiliary classifier generative adversarial nets (OR-AC-GAN) was presented | 96.25%, under controlled conditions | Early disease detection capability exhibited, all-in-one method (from image segmentation to classification) | Computationally complex, special hardware required, in-field testing not explored | [98], 2019 |
| Charcoal rot in soybean | RGB-imaging-based segmentation followed by 3D CNN based classification | 95.73%, under controlled conditions | Importance of specific hyperspectral bands using saliency map visualizations was studied | Not applicable for early detection, in-field operation not explored | [99], 2019 |
| Yellow rust in winter wheat | Drone-borne HS imaging system, where vegetative index value was used to identify vegetation, and a DCNN-based model was employed for classification | 85% | Field-deployable, good accuracy and resolution | Expensive hardware, complex computations required | [100], 2019 |
| Early detection Of TMV in tobacco plant | Spectral as well as textural features were extracted, where several machine learning algorithms were evaluated to classify disease stages with effective wavelengths, texture features, and data fusion, respectively | 95% | Good accuracy, early disease detection exhibited | Computationally complex, no clear conclusions were made on selecting a machine learning classifier | [101], 2017 |
| TSWV detection in capsicum plants | Discriminatory features were extracted using the full spectrum, a variety of vegetation indices, and probabilistic topic models. An SVM-based classifier was trained | 90% | Good accuracy under controlled imaging conditions | Requires sophisticated hardware and complex software, in-field operation not evaluated | [95], 2017 |
| Late blight and early blight in potato | 10 different spectral and textiral features were extracted and a multi-class SVM-based classification model was developed | 95% | Good accuracy under controlled imaging conditions | Dependent on visual features therefore, pre-symptomatic detection is not feasible | [102], 2017 |
| Sensing Application | Brief Description | Performance | Strengths | Limitations | Ref., Year |
|---|---|---|---|---|---|
| Green- house insect pest monitoring | Sticky traps were used to sample pests for spatio-temporal monitoring, RGB images were classified using an SVM-based approach | 93% (accuracy) | Good accuracy, low-cost system, and integrated humidity, temperature and light sensors | Lacks specificity | [140], 2020 |
| Monitoring asian citrus psyllid in orchards | Ground-based vehicle was equipped with trapping and imaging set-up. Taken images were classified using CNN-based approach | 80% (precision) 95% (recall) | Field-deployable, easy sampling of each tree, good performance | Expensive, not for generalized use (application specific) | [141], 2019 |
| Monitoring banana corm weevil in banana | Various parts of the plants (shoot, fruit and leaves) were imaged, and three CNN-based architectures were evaluated | 90% (average accuracy) | Large dataset created, good accuracy | Complex sampling procedure | [142], 2019 |
| Multi-class pest detection (16 species) | Region Proposal Network (RPN) for providing pest regions and Position-Sensitive Score Map (PSSM) for pest classification and bounding box regression was proposed | 75.46% (mAP) | Multi-pest detection system, created a large dataset, images were collected in-field conditions | Moderate accuracy, not fully automated | [143], 2019 |
| Multi-class pest detection (10 pests) | A human-vision-inspired feature extraction model coupled with an SVM-based classifier was developed | 85.5% (recognition rate) | Good performance, multi-pest sensing system | In-field operation was not demonstrated | [144], 2018 |
| Detection of Thrips in strawberry greenhouse | A mobile robot equipped with photography hardware and software, image processing coupled with SVM-based classifier | 2.25% (mean percent error) | Mobile system that travel along the rows of plants, good accuracy | Limited operation capability | [145], 2017 |
| Monitoring Codling moths | Moths images were sampled in the field using pheromone traps. The images were then pre-processed, and classified using a CNN-based algorithm | 93.4% (P-R-AUC) | In-field operation demonstrated, good performance | Specificity not tested, not automated | [146], 2016 |
| Whitefly and Thrips detection in greenhouses | Sticky insect traps were imaged, the captured images were processed, and then, classified using a feed-forward multi-layer artificial neural network | 92% to 96% (precision) using sample images | Semi-automated, good specificity between the insect species | Performance drops during in-field operation | [147], 2016 |
| Detection of aphids in wheat fields | A maximally stable extremal region descriptor was used to process the images, and an SVM-based classifier was used for identification | 86.81% (average accuracy) | In-field operation tested, moderate accuracy | Manual image collection procedure | [148], 2016 |
Publisher’s Note: MDPI stays neutral with regard to jurisdictional claims in published maps and institutional affiliations. |
© 2021 by the authors. Licensee MDPI, Basel, Switzerland. This article is an open access article distributed under the terms and conditions of the Creative Commons Attribution (CC BY) license (https://creativecommons.org/licenses/by/4.0/).
Share and Cite
Kashyap, B.; Kumar, R. Sensing Methodologies in Agriculture for Monitoring Biotic Stress in Plants Due to Pathogens and Pests. Inventions 2021, 6, 29. https://doi.org/10.3390/inventions6020029
Kashyap B, Kumar R. Sensing Methodologies in Agriculture for Monitoring Biotic Stress in Plants Due to Pathogens and Pests. Inventions. 2021; 6(2):29. https://doi.org/10.3390/inventions6020029
Chicago/Turabian StyleKashyap, Bhuwan, and Ratnesh Kumar. 2021. "Sensing Methodologies in Agriculture for Monitoring Biotic Stress in Plants Due to Pathogens and Pests" Inventions 6, no. 2: 29. https://doi.org/10.3390/inventions6020029