Article

Efficient Battery Models for Performance Studies-Lithium Ion and Nickel Metal Hydride Battery

by
Umapathi Krishnamoorthy
1,*,
Parimala Gandhi Ayyavu
2,
Hitesh Panchal
3,
Dayana Shanmugam
1,
Sukanya Balasubramani
1,
Ali Jawad Al-rubaie
4,
Ameer Al-khaykan
5,
Ankit D. Oza
6,
Sagram Hembrom
7,
Tvarit Patel
8,
Petrica Vizureanu
9,10 and
Diana-Petronela Burduhos-Nergis
10,*
1
Department of Electrical and Electronics Engineering, M. Kumarasamy College of Engineering, Karur 639113, India
2
Department of Electronics and Communication Engineering, Kalaignar Karunanidhi Institute of Technology, Coimbatore 641402, India
3
Department of Mechanical Engineering, Government Engineering College, Patan 384265, India
4
Department of Medical Instrumentation Engineering Techniques, Al-Mustaqbal University College, Hillah 51001, Iraq
5
Department of Air Conditions and Refrigeration Techniques, Al-Mustaqbal University College, Hillah 51001, Iraq
6
Department of Computer Sciences and Engineering, Institute of Advanced Research, The University for Innovation, Gandhinagar 382426, India
7
Department of Metallurgical Engineering, B.I.T. Sindri, Dhanbad 828123, India
8
Department of Biological Sciences and Biotechnology, Institute of Advanced Research, The University for Innovation, Gandhinagar 382426, India
9
Faculty of Materials Science and Engineering, “Gheorghe Asachi” Technical University, 700050 Iasi, Romania
10
Technical Sciences Academy of Romania, Dacia Blvd 26, 030167 Bucharest, Romania
*
Authors to whom correspondence should be addressed.
Batteries 2023, 9(1), 52; https://doi.org/10.3390/batteries9010052
Submission received: 7 October 2022 / Revised: 10 December 2022 / Accepted: 9 January 2023 / Published: 12 January 2023

Abstract

:
Apart from being emission-free, electric vehicles enjoy benefits such as low maintenance and operating costs, noise-free, easy to drive, and the convenience of charging at home. All these benefits are directly dependent on the performance of the battery used in the vehicle. In this paper, one-dimensional modeling of Li-ion and NiMH batteries was developed, and their performances were studied. The performance characteristics of the batteries, such as the charging and discharging characteristics, the constituent losses of over-potential voltage, and the electrolyte concentration profile at various stages of charge and discharge cycles, were also studied. It is found that the electrolyte concentration profiles of Li-ion batteries show a drooping behavior at the start of the discharge cycle and a rising behavior at the end of discharge because of the concentration polarization due to the low diffusion coefficient. The electrolyte concentration profiles of NiMH batteries show rising behavior throughout the discharge cycle without any deviations. The reason behind this even behavior throughout the discharge cycle is attributed to the reduced concentration polarization due to electrolyte transport limitations. It is found that the losses associated with the NiMH battery are larger and almost constant throughout the battery’s operation. Whereas for the Li-ion batteries, the losses are less variable. The electrolyte concentration directly affects the overpotential losses incurred during the charging and discharging phases.

1. Introduction

Enlightened to create a green and safe environment for our future generations, humans have started exploring ways to stop global warming. One-fifth of the total carbon dioxide emissions contributing to global warming is from the transportation division. In addition, this reveals to us the importance of moving toward greener transportation systems. With this said, countries have started encouraging the research, development, and utilization of electric vehicles by funding researchers, reducing taxes and giving subsidies for electric vehicles.
A varied range of research are being done on electric vehicles from the performance metrics of electric drives used, charging station utilization, Electromagnetic Interferences, testing of EVs., etc and a review of them is done with the objective of listing the recent research areas in electric vehicle design. A finite element analysis is carried out on a permanent magnet synchronous motor at different operating speeds in order to evaluate its performance metrics in [1]. Optimized charge scheduling is a means of reducing traffic jams at charging stations and with this objective an effective charge scheduling algorithm is developed say Grey Sail Fish Optimization based on grey wolf and sail fish optimizers in [2]. An emulator framework is proposed based on arduino UNO for testing of E-bicycles in [3]. A switched reluctance motor design for high torque is proposed in [4] based on the concept of slotting the stator’s periphery. The various electromagnetic interferences that intrude an electric vehicle performance are studied and an LC filter design explained in [5]. A simple electric vehicle model is created and analyzed in [6] whereas a fuzzy logic based energy management technique is proposed in [7] for hybrid vehicles. A simulation model of the electric drive system is carried out in [8] with the aim of improving the speed torque performance of a BLDC motor drive system. A neuro-fuzzy based ANFIS controller is proposed with the aim of improving the power quality of a PV powered system in [9]. A deep learning based driver assistance and detection system is proposed in [10].
Most portable electronic devices, from smartphones to laptops to huge electric vehicles, use Li-ion batteries, preferably due to their many benefits. The primary advantages of using Li-ion batteries include their higher energy density, lower self-discharge rates, low maintenance, higher cell voltage, constant load characteristics, and no priming required. The major drawback of LIBs is that they are not robust and require a protection circuit to keep the charging and discharging levels within safe limits and a cell temperature monitoring circuit to prevent temperature extremes. Another drawback is the aging of the battery with the number of charging and discharging cycles, and lithium-ion batteries are 40% more expensive than nickel-cadmium batteries. Li-ion batteries are still blossoming, and many performance improvements are needed, creating much room for research and development.
NiMH batteries exhibit a lower energy density than Li-ion batteries but can tolerate overcharging and discharging, and environmental compatibility and safety, making them suitable for portable power tools and hybrid electric vehicles. NiMH batteries are less expensive than Li-ion batteries but are less durable than the others. A Li-ion battery interacts with fabric properties to determine how depleted and charged it is. A developer can examine the effects of various design factors such as separator length, electrode, charge duration, and an initial electrolyte salt.
Modeling results for Li-ion batteries are made, and it is found that there is a good agreement between simulation and experimental results [11]. Neglecting the diffusion of nickel oxide active material, a NiMH battery model is explained in [12]. It is also discovered to be sensitive to the material’s kinetic parameters. Comprehensive modeling considering the kinetic parameters, Ohm’s law, and charge balances are explained in [13]. A 3D model of a Li-ion battery is created and used to investigate thermal behaviors. It is found that overcharging of the battery leads to a massive rise in temperature and a sharp gradient within the battery [14]. Ref. [15] introduced a 2D model of the NiMH battery to study temperature variations. Results in [16] indicate that a nominally uniform temperature profile can be achieved when the thermal conductivity increases. A planar electrode approximation is used in modeling a NiMH cell, accounting for active species, electrochemical kinetics, and ohmic effects. The predictions show results on par with the experimental data presented in [17].
A fast-rechargeable NiMH battery model is presented in [18]. Online simulation is used to model the high-capacity battery cell for plug-in HEV research [19]. The various electrode materials used to improve battery performance are summarized in [20,21]. A thin-film lithium-ion battery design is presented in [22]. A model that helps find the operational parameters for the battery is presented in [23]. A review of the effects of lithium deposition in Li-cells is discussed in [24]. Efficient techniques for the characterization and detection of battery degradation are explained in the references [25,26]. The effect of rapid battery charging on the age of the battery is described in [27]. A detailed review of the literature reveals that modeling Li-ion and NiMH batteries will be necessary for research. Thus, this paper addresses the modeling of both batteries and highlights their various characteristics.
As the battery model based on the Adaptive Battery State Estimator (ABSE) is inaccurate because load dependencies are eliminated, a new, improved ABSE-based model is proposed in [28]. It estimates a battery’s state of charge and available power. A performance-enhanced reduced electrochemical model along with a dual non-linear filter to obtain the online parameters is suggested in [29] for the estimation of the state of charge (SoC) and state of health (SoH). In [30], an electrolyte-enhanced composite single-particle model of lithium-ion batteries is proposed, and the performance of the same is found to be better than the standard single-particle model.
The non-linear behavior of the lithium batteries is accounted for by introducing the Weiner structure into the traditional equivalent circuit model, and a 1.5% improvement in SOC concentration is attained [31]. When modeling a battery, it is well known that reduced-order models are faster and data-driven models are more accurate; thus, in [32], a two-level model of a lithium battery is created by combining the two. In addition, it was demonstrated that combining the two produced better results than operating separately.SOH estimation using a 2RC model is proposed in [33] and has shown to be effective with lower root mean square error when compared to the 1RC model. A convolutional neural network that learns the temporal and conditional dynamics of the lithium-ion battery is used to study the degradation trends of the battery [34] and such a model is found to predict future conditions accurately. Ref. [35] conducts a study of the features and modeling of lithium-ion batteries. A data model is described to predict the battery characteristics in [36] effectively. A generic model that can be used for evaluating any battery cell is modeled and verified in [37]. A finite element analysis is used to predict the thermal performance capability of a NiMH battery, and this model is found to help simulate charging and discharging cycles [38]. A non-chemical, partial non-linear model is developed for lead-acid batteries and found to predict SOC accurately. This model described in [39] can also be applied to other battery types by making proper modifications to parameter values. In [40], a simple model independent of self-discharge, temperature, and the number of cycles of discharge is developed for NiMH and Li-ion batteries, and it is found that the model build data is less than 0.4% in error from the validated experimental data. In [41], battery models were developed based on Thevenin’s equivalent circuit. It is found that the third-order model matches the experimental data very well compared to the other lower-order models.
A mechanical analogy of an electrochemical battery is modeled in [42], and it was found to produce near-experimental results for the time-domain response of the battery. An ANN-based prediction model based on a dataset developed from Thevenin’s equivalent model is described in [43] and found to work with an average error of 4%. The basics of various parameters and characteristics to be studied for effective modeling of NiMH batteries are explained in [44]. A temperature analysis model based on the finite element method is detailed in [45]. It compared the temperature variation with the geometry of the cell. A thermal model of a battery with embedded and distributed temperature sensors is proposed to measure the real-time distributed measurement of lithium-ion battery internal and surface temperature profiles [46]. An algorithmic framework based on a deep reinforcement learning-based optimizer is introduced for the fast charging of the lithium-ion battery [47].

2. Lithium-Ion Battery Model

The negative porous electrode domain dimensions of the Battery are 320 mm, the polymer electrolyte domain dimensions are 52 mm, and the positive porous electrode domain dimensions are 183 mm. This model is built by having an electrolyte of 2 M LiPF6 salt with LiyMn2O4 for the anode and a carbon-based cathode. The parameters of Material balance and Ionic Charge balance are modeled using a polymer matrix and a 1:1 electrolyte of plasticized Ethylene Carbonate/Di-Methyl Carbonate. The total electrolyte volume is the composition of the electrolyte in a liquid state that is available as a polymer.
The cell’s voltage while in a conducting state is calculated using ionic charge balance and Ohm’s law. The charge transfer reactions result in high and low voltages. As the electrodes are porous, while modeling their conductivities, porosity and tortuosity are considered and are given by, σ s eff
σ s eff = σ s ε γ
γ is the Bruggeman co-efficient set to 3.3 when the diffusivity and electrolyte conductivity are treated similarly. Spherical coordinates describe the diffusion equation. In addition, Butler-Volmer equations introduce high and low terms.

2.1. Boundary Conditions

After generating the current density waveform with 0 V applied to the negative electrode and a given potential at the positive electrode, it was discovered that the current density discharged, went to zero for a brief period, and then entered the charging stage. The boundaries are considered insulating for both material and ionic charge balance.

2.2. Material Properties

As said before, an electrolyte of 2 M LiPF6 salt with LiyMn2O4 for the anode and carbon-based cathode. Moreover, the electrolyte of plasticized Ethylene Carbonate/Di-Methyl Carbonate in the ratio of 1:2 is used. Significant variations in the electrolyte conductivity and the equilibrium potential are noticed during the charging and discharging phases of the battery’s characteristics. Figure 1 shows the interpolation of the parameter ionic conductivity with the increase in electrolyte concentration whereas Figure 2 and Figure 3 depicts the potential variations at the electrodes.

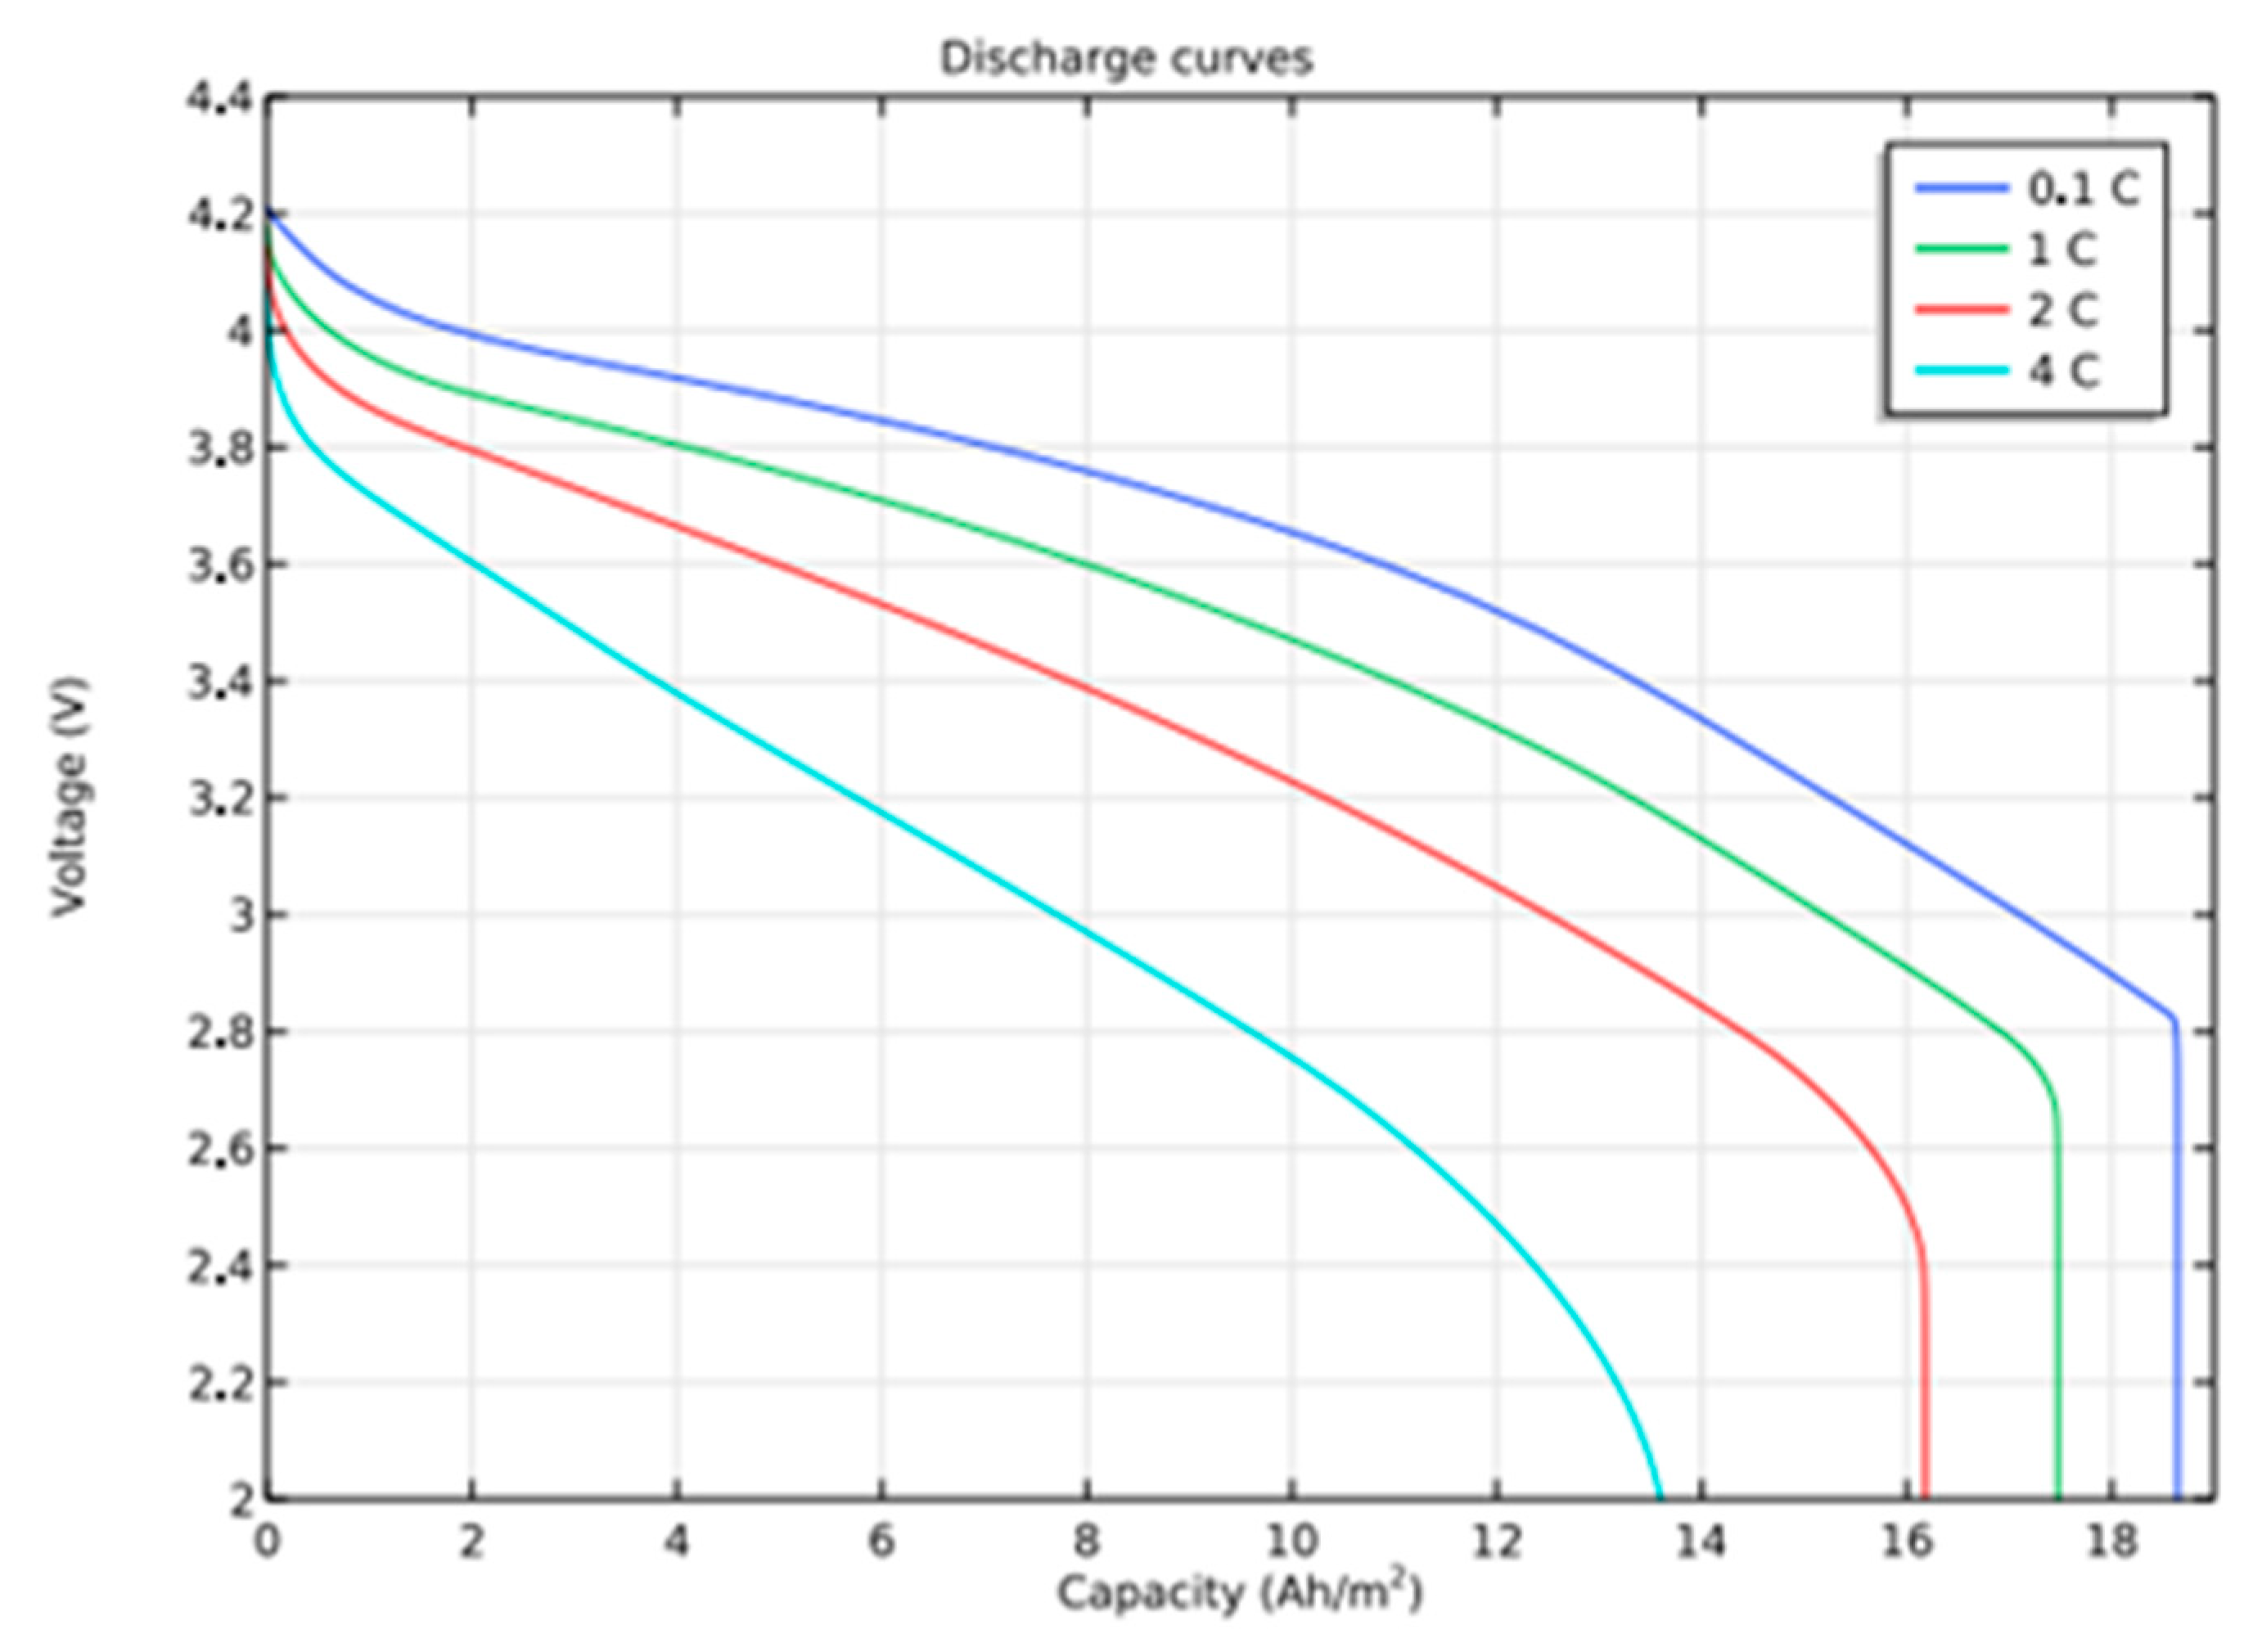
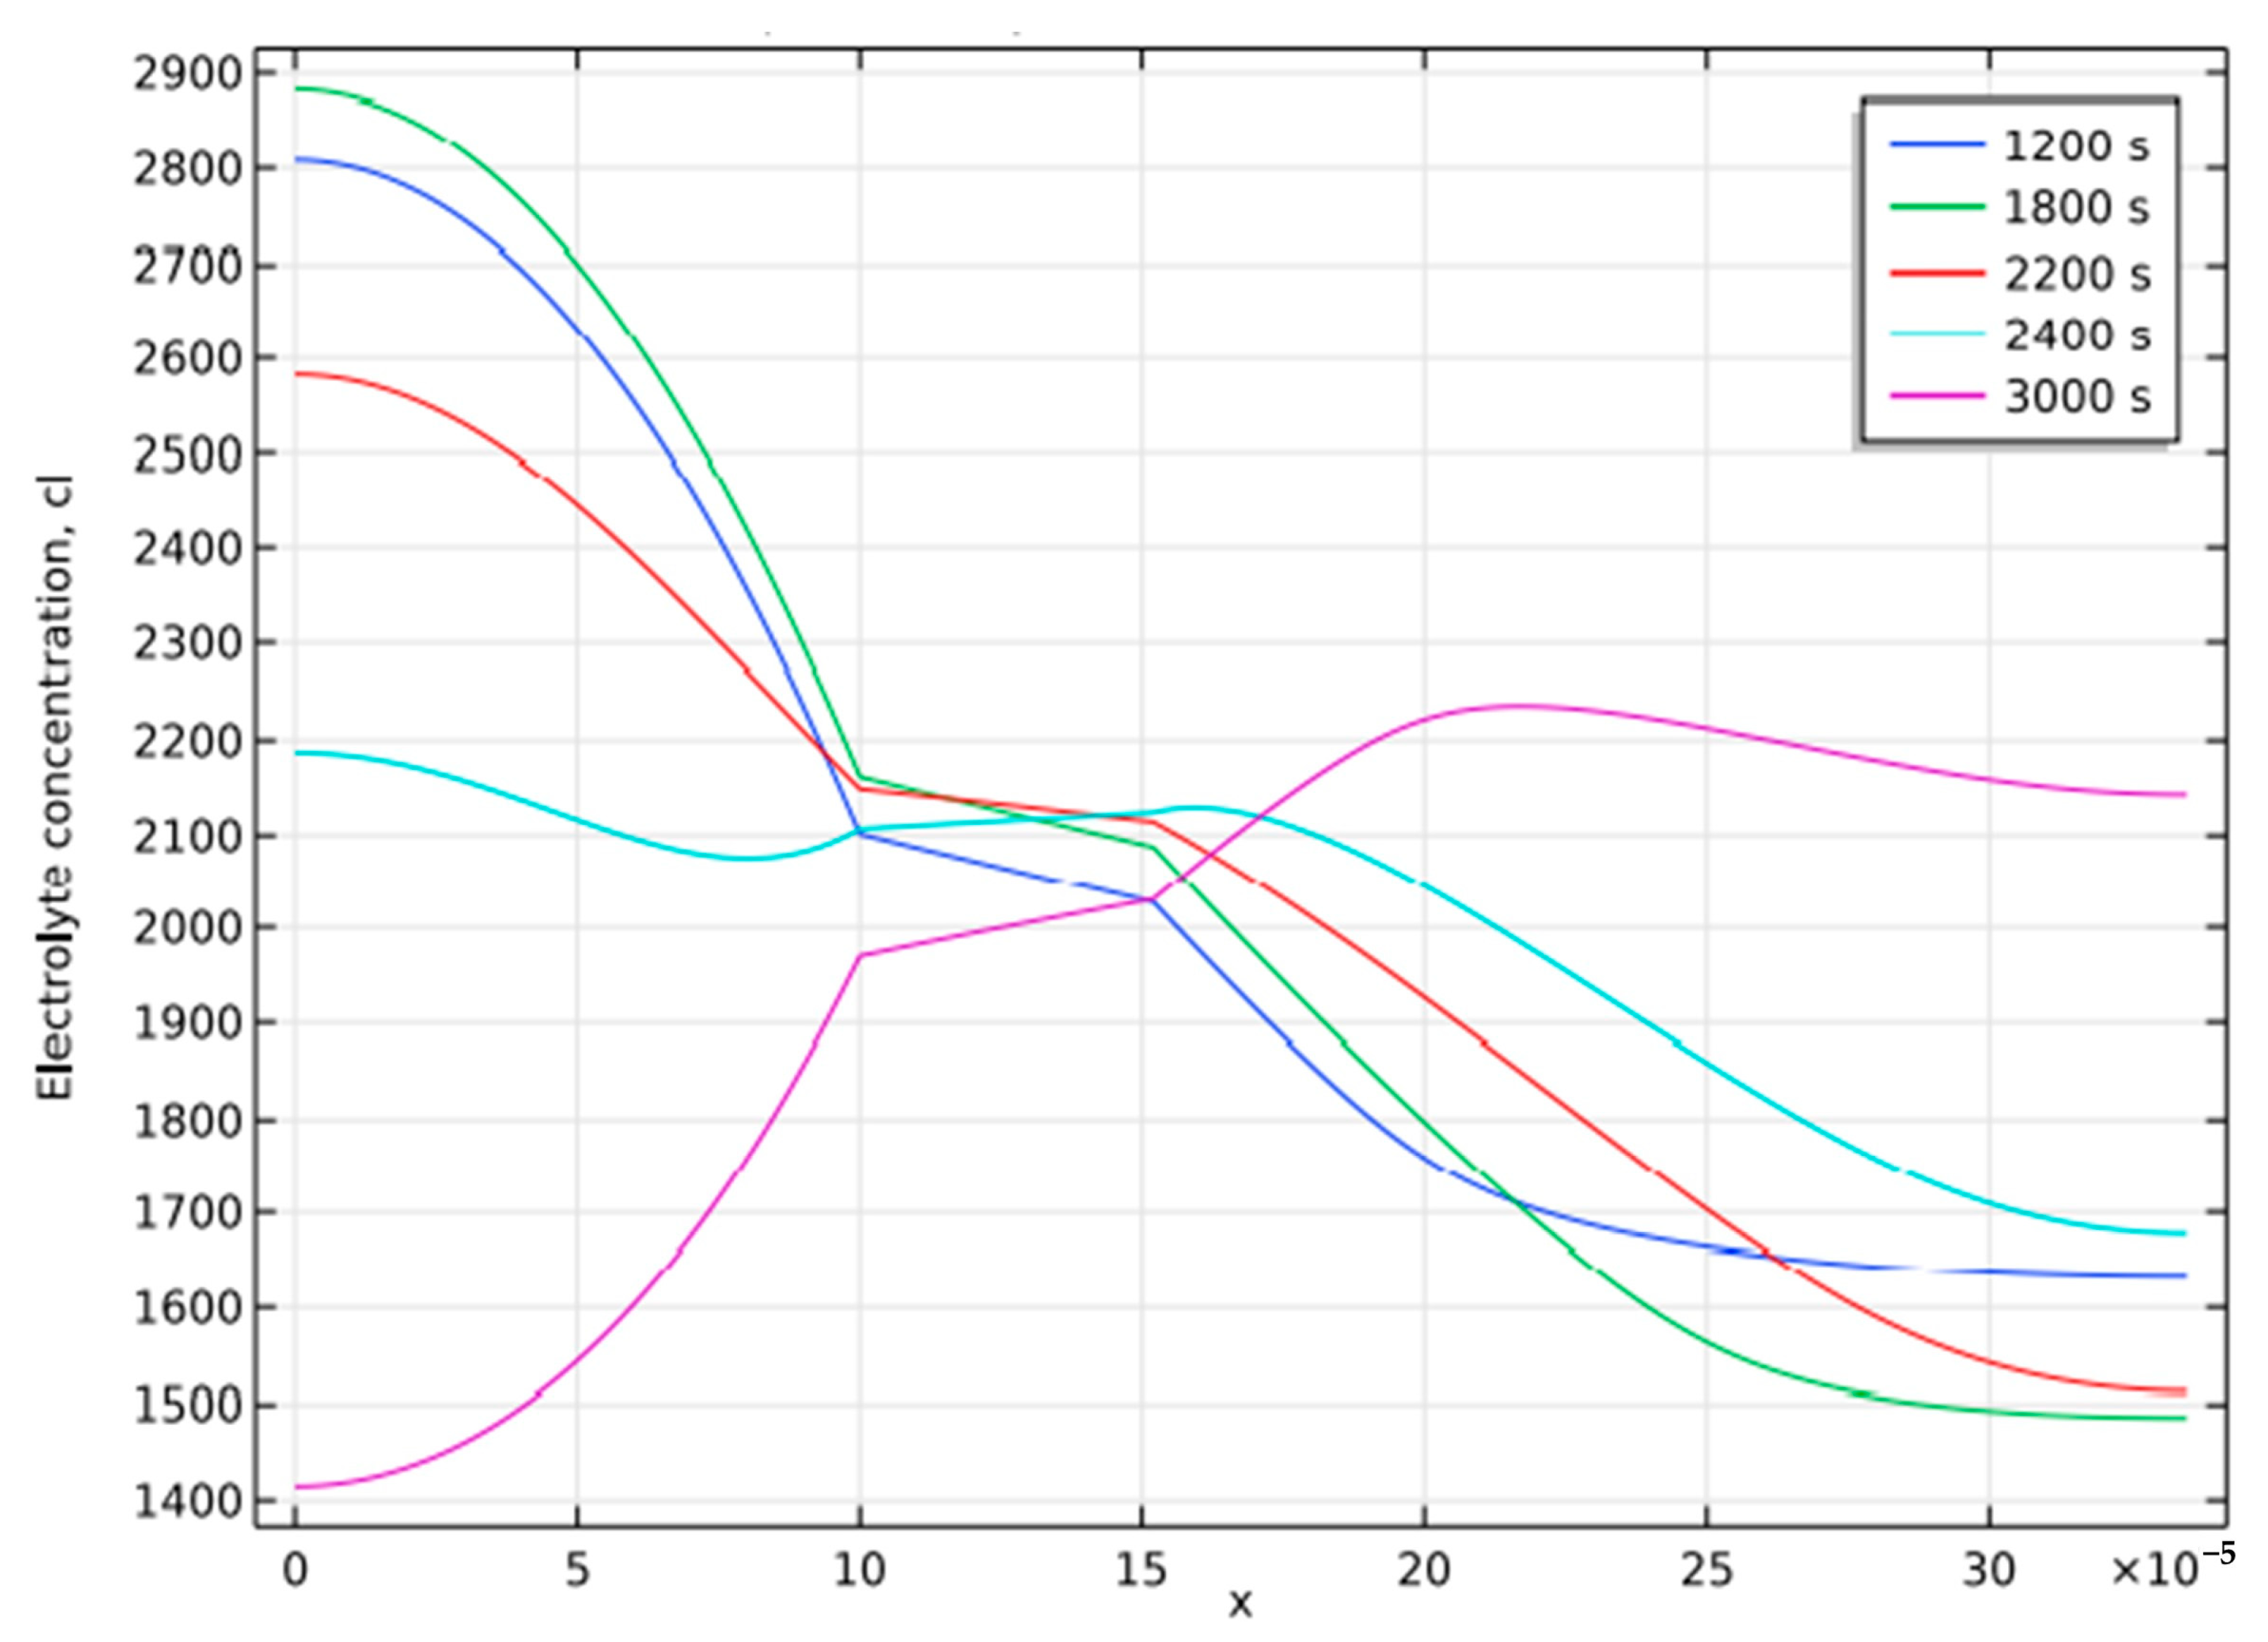
2.3. Discharge Characteristics

The battery capacity is studied at different discharge rates by studying the behavior of the battery at various current densities. When the cell voltage drops below 3 volts, it is considered to be the end of discharge. It is found that the full theoretical discharge occurs for 1 C, and the corresponding current density is 17.6 A/m2.
Initial SoC values of 0.17 and 0.56 are assigned for the positive and negative electrodes that contribute approximately 4.22 V at full charge, which is nothing but the open circuit cell voltage. Figure 4 shows that the maximum discharge occurs for 1 C, which is 1.75 A/m2. A charge density grows, discharge ends quickly, and for 4 C, the battery delivers over 50% before 3 V, the end of discharge.

2.4. Charging and Discharging Cycles

Figure 5 below shows the charge-discharge cycles of the model. The graph shows that the cycle has the 2000 s of discharge, 300 s of open circuit, and then 2000 s of charging at a relatively small current density before becoming an open circuit. At zero current, the ohmic loss is around 100 mV, and the concentration increases over a potential of 50 mV. The constituent losses due to overpotential at the start and end of discharging can be visualized for further analysis. These variations can be brought into the same plot by varying the bias values at the start and end of the discharge plot. The reaction over potential is shown without bias to obtain the beginning of discharge (at 148 mV) and ending of discharge (558 mV). This way, all the plots will be within the same range of potential.
Figure 6 is the plot that shows the details of the constituents of the over-potential losses during the start and end of the discharge cycle, along with the reaction over-potential. The charging and discharging curves for different electrolyte concentration profiles can be used to investigate the cause of the steep voltage decrease.
Figure 7 depicts the electrolyte concentration profile (y-axis) across the cell’s width (x-axis) at various stages of the discharging and charging cycles for the Li-ion battery model. The electrolyte occupies a distance of 100 µm to 150 µm across the width of the cell, and the electrolyte concentration across this distance remains almost constant. For simulation, a discharge of 2000 s at nominal current density, 300 at open circuit, and 2000 of charging at nominal current density is applied before the circuit is finally open-circuited. Thus, the interval from the 2000 s to the 2400 s depicts the losses due to ohmic resistance and concentration overpotential when a cell is in open circuit condition. Then it transitions to the charging stage. These two losses are reflected as a drooping electrolyte concentration profile across the cell width, whereas the charging cycle starts at 3000 s, increasing the electrolyte concentration. Hence, at 3000 s, the concentration variation is reversed. The reason for this concentration variation is the concentration polarization induced by a low diffusion coefficient. These variations are studied to find the reason for the variation in over-potential losses during the discharging and charging periods, as depicted in Figure 6. For lithium-ion batteries, over-potential losses are greater at the end of the discharge than at the beginning.

3. Nickel Metal Hydride Battery Model

The battery domain dimensions are 350 µm metal hydride for the porous cathode, 250 µm electrolyte separator, and 443 µm nickel oxide for the porous anode. This model is built by having an electrolyte of KOH diluted in water to a 30% (wt) solution. The parameters of material balance and ionic charge balance are modeled for a 1:1 binary electrolyte. The electrode reactions involve both an ion (OH-) and a solvent (H2O).
The cell’s voltage while in a conducting state is calculated using ionic charge balance and Ohm’s law. The charge transfer reactions result in high and low voltages. Because the electrodes are porous, porosity and tortuosity are taken into account when modeling their conductivities and are given by σ s eff (same as Equation (1)). the Bruggeman co-efficient is set to 1.5, corresponding to spherical particles. Spherical coordinates describe the diffusion equation. In addition, the Butler-Volmer equations define the charge density in the electrodes by introducing high and low terms.

3.1. Boundary Conditions

The negative electrode is set to 0 V, the potential at the positive electrode is specified, and then the current density waveform is generated. It is found that the current density discharges, then becomes zero for a short duration, and finally enters the charging stage. The boundaries are considered insulating for both material and ionic charge balance.

3.2. Material Properties

A metal hydride (LaNi5Hx)-based negative electrode, a nickel oxide (NiOHOHy) for the positive electrode, and an electrolyte of KOH, diluted in water to 30%,wt., are used. Figure 8 and Figure 9 depicts the potential variations at negative and positive electrodes at equilibrium based on State of Charge.
Significant variations in electrolyte conductivity and the potential at equilibrium are noticed during the charging and discharging phases of the battery’s life.

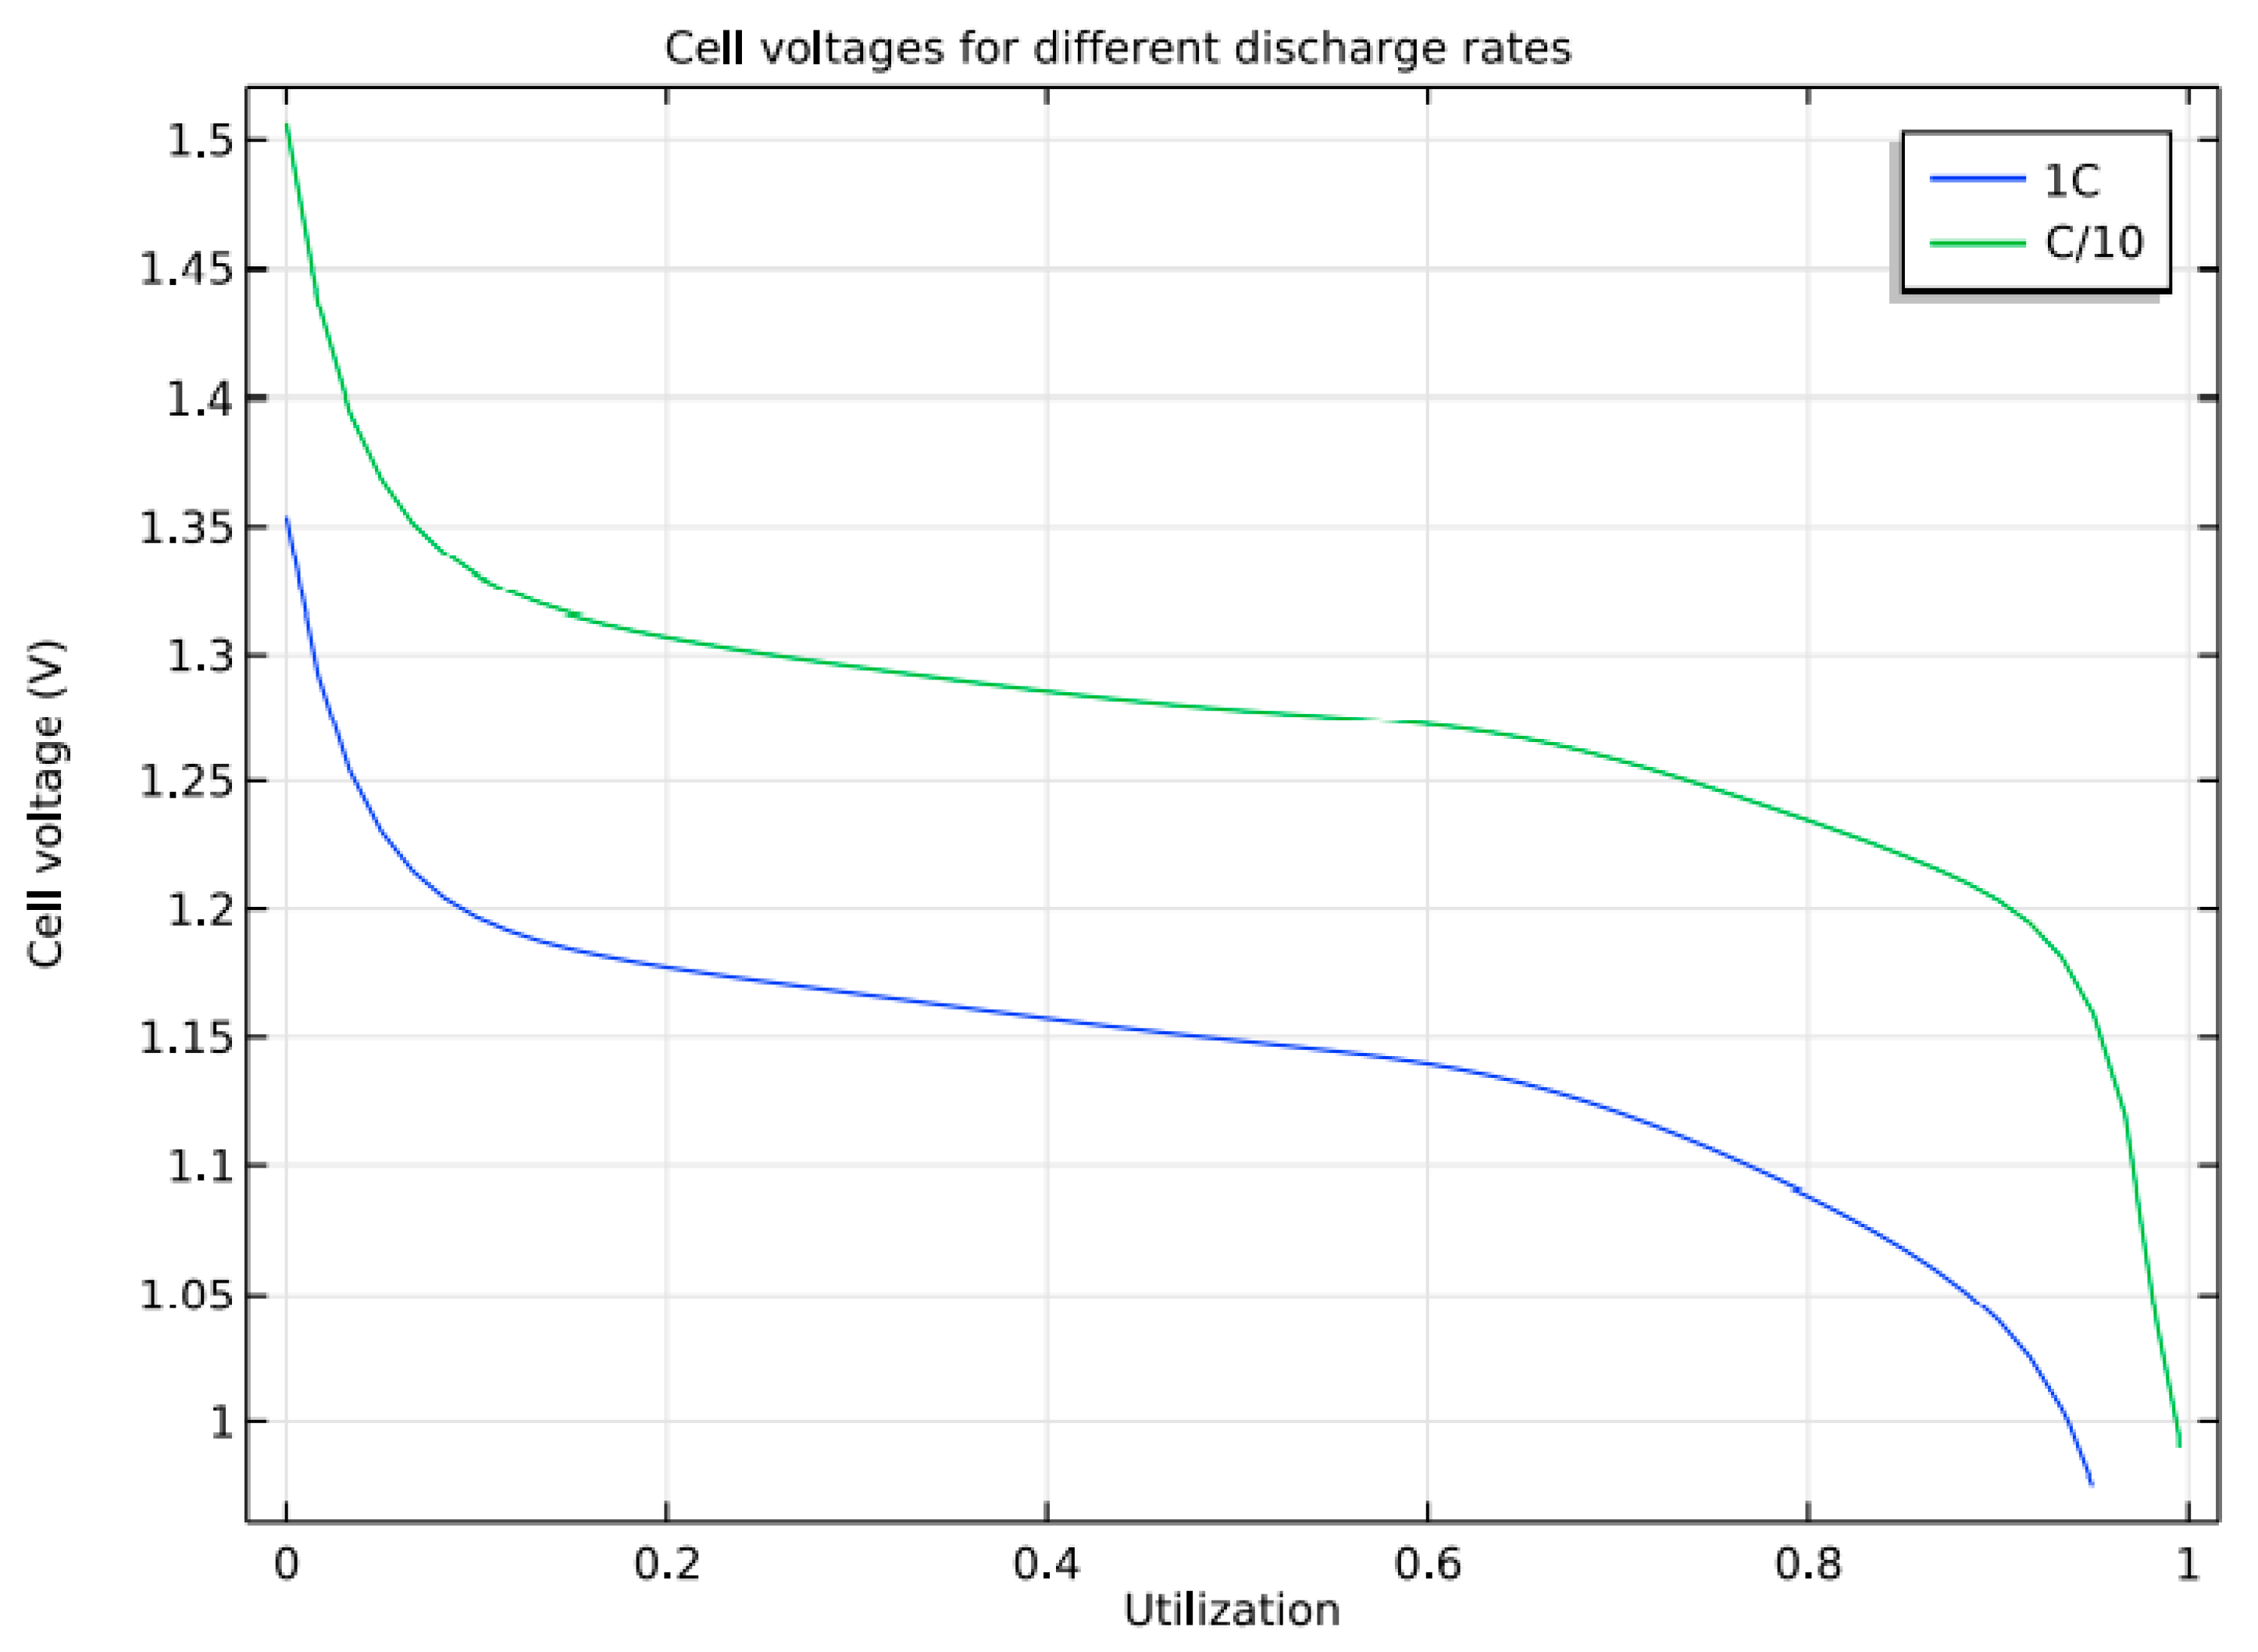
3.3. Discharge Characteristics

Initially, the battery is assumed to be fully charged, and the discharges at two different current densities are simulated to study its characteristics. When the cell voltage drops below 0.99 V, it is considered the end of discharge. It is found that the full theoretical discharge occurs at 1 C, and the corresponding current density is 430 A/m2.
Figure 10 shows that the maximum discharge capacity is obtained for a current density of 43 A/m2 at 0.1 C. At 1 C, the battery reaches 90% of its theoretical capacity before it reaches 1 V. As there is no side reaction in the model, the voltage is higher than normal as discharge begins. Similar to the case with Li-ion batteries, the contribution of other losses to total overpotential can be studied by introducing a bias of 0.91 V. Figure 11 shows other losses contributing to the over-potential loss at 1 C discharge.
The causes of the steep voltage decrease can be studied by investigating the charging and discharging cycles at different time intervals. As electrolyte transport has limitations, the cell experiences little polarization due to concentration variations at different intervals. The causes of the steep voltage decrease can be studied by investigating the charging and discharging cycles at different time intervals. As electrolyte transport has limitations, the cell experiences little polarization due to concentration variations at different intervals.
Figure 12 depicts the NiMH battery model’s electrolyte concentration profile (y-axis) across the cell’s width (x-axis) at various discharging and charging cycle stages. The electrolyte occupies a distance of 350 µm to 600 µm across the cell’s width, and the electrolyte concentration across this distance remains almost constant. For simulation, similar to Li-ion battery modeling, a discharge of 2000 s at nominal current density, 300 s at open circuit, and 2000 s of charging at nominal current density are applied before the battery is finally open-circuited. Because of electrolyte transport limitations, there is only little polarization; hence, gradients are pretty low across the discharging and charging cycles. This results in a more or less constant local charge transfer current density, but it is a considerable over-voltage loss in the battery.

4. Conclusions

This paper analyzes the behavior of the Li-ion and NiMH battery 1D models under isothermal operating conditions. The advantage of using battery models is their ability to predict the cell’s current, voltage distribution, and electrolyte concentration under operating conditions. The uniqueness of this work is that it compares the electrolyte concentration variation across the battery’s discharging, open circuit, and charging phases, i.e., from 0 to 2000 s, 2000 s to 2300 s, 2300 s to 3000 s, respectively, for a 1D model of Li-ion and NiMH batteries. The performance characteristics of the batteries, such as the charging and discharging characteristics, the constituent losses of over-potential voltage, and the electrolyte concentration profile at various stages of charge and discharge cycles, were also studied. This work helps analyze and understand the variation in over-potential losses associated with the different stages of battery operation. Voltage and current changes during operation are analyzed, as well as the effect of electrolyte concentration on the losses. These models help to understand the battery performance under different operating conditions for electric vehicles. The results prove that the electrolyte concentration directly affects the losses incurred during the charging and discharging of batteries. This model can be integrated with a machine-learning algorithm for prediction in the future to improve its performance.

Author Contributions

U.K.–Conceptualization; writing—original draft preparation; P.G.A.—methodology; writing—original draft preparation; A.J.A.-r.—formal analysis; data curation; methodology; H.P.—writing—original draft preparation; formal analysis; data curation; D.S.—methodology; data curation; S.B.—investigation, methodology; A.A.-k.—validation, investigation; A.D.O.—project administration; formal analysis; S.H.- formal analysis; data curation; methodology; T.P.—investigation, methodology; P.V.—writing—review and editing; funding acquisition; D.-P.B.-N.—writing—review and editing; funding acquisition. All authors have read and agreed to the published version of the manuscript.

Funding

This work was supported by the Gheorghe Asachi Technical University of Iaşi—TUIASI-Romania, Scientific Research Funds, FCSU-2022.

Institutional Review Board Statement

Not applicable.

Informed Consent Statement

Not applicable.

Data Availability Statement

Not applicable.

Conflicts of Interest

The authors declare that they have no conflict of interest.

References

  1. Sheela, A.; Suresh, M.; Shankar, V.G.; Panchal, H.; Priya, V.; Atshaya, M.; Sadasivuni, K.K.; Dharaskar, S. FEA based analysis and design of PMSM for electric vehicle applications using magnet software. Int. J. Ambient. Energy 2022, 43, 2742–2747. [Google Scholar] [CrossRef]
  2. Rajamoorthy, R.; Arunachalam, G.; Kasinathan, P.; Devendiran, R.; Ahmadi, P.; Pandiyan, S.; Muthusamy, S.; Panchal, H.; Kazem, H.A.; Sharma, P. A novel intelligent transport system charging scheduling for electric vehicles using Grey Wolf Optimizer and Sail Fish Optimization algorithms. Energy Sources Part A Recovery Util. Environ. Eff. 2022, 44, 3555–3575. [Google Scholar] [CrossRef]
  3. Ashokkumar, R.; Suresh, M.; Sharmila, B.; Panchal, H.; Gokul, C.; Udhayanatchi, K.V.; Sadasivuni, K.K.; Israr, M. A novel method for Arduino based electric vehicle emulator. Int. J. Ambient. Energy 2022, 43, 4299–4304. [Google Scholar] [CrossRef]
  4. Patel, M.A.; Asad, K.; Patel, Z.; Tiwari, M.; Prajapati, P.; Panchal, H.; Suresh, M.; Sangno, R.; Israr, M. Design and optimisation of slotted stator tooth switched reluctance motor for torque enhancement for electric vehicle applications. Int. J. Ambient. Energy 2022, 43, 4283–4288. [Google Scholar] [CrossRef]
  5. Karthik, M.; Usha, S.; Venkateswaran, K.; Panchal, H.; Suresh, M.; Priya, V.; Hinduja, K.K. Evaluation of electromagnetic intrusion in brushless DC motor drive for electric vehicle applications with manifestation of mitigating the electromagnetic interference. Int. J. Ambient. Energy 2020. [Google Scholar] [CrossRef]
  6. Sharmila, B.; Srinivasan, K.; Devasena, D.; Suresh, M.; Panchal, H.; Ashokkumar, R.; Meenakumari, R.; Kumar Sadasivuni, K.; Shah, R.R. Modelling and performance analysis of electric vehicle. Int. J. Ambient. Energy 2022, 43, 5034–5040. [Google Scholar] [CrossRef]
  7. Anbazhagan, G.; Jayakumar, S.; Muthusamy, S.; Sundararajan, S.C.; Panchal, H.; Sadasivuni, K.K. An effective energy management strategy in hybrid electric vehicles using Taguchi based approach for improved performance. Energy Sources Part A Recovery Util. Environ. Eff. 2022, 44, 3418–3435. [Google Scholar] [CrossRef]
  8. Balan, G.; Sundararajan, S.C.; Arumugam, S.; Manoharan, M.; Muthukrishnan, K.; Muthusamy, S.; Panchal, H.; Varadharaj, K.; Sadasivuni, K.K.; Jayakumar, S. Performance analysis and enhancement of brain emotion-based intelligent controller and its impact on PMBLDC motor drive for electric vehicle applications. Energy Sources Part A Recovery Util. Environ. Eff. 2022, 44, 5640–5664. [Google Scholar] [CrossRef]
  9. Cholamuthu, P.; Irusappan, B.; Paramasivam, S.K.; Ramu, S.K.; Muthusamy, S.; Panchal, H.; Nuvvula, R.S.S.; Kumar, P.P.; Khan, B. A Grid-Connected Solar PV/Wind Turbine Based Hybrid Energy System Using ANFIS Controller for Hybrid Series Active Power Filter to Improve the Power Quality. Int. Trans. Electr. Energy Syst. 2022, 2022, 9374638. [Google Scholar] [CrossRef]
  10. Balan, G.; Arumugam, S.; Muthusamy, S.; Panchal, H.; Kotb, H.; Bajaj, M.; Ghoneim, S.S.M.; Kitmo, U. An Improved Deep Learning-Based Technique for Driver Detection and Driver Assistance in Electric Vehicles with Better Performance. Int. Trans. Electr. Energy Syst. 2022, 2022, 854817. [Google Scholar] [CrossRef]
  11. Doyle, M.; Newman, J.; Gozdz, A.S.; Schmutz, C.N.; Tarascon, J.M. Comparison of Modeling Predictions with Experimental Data from Plastic Lithium Ion Cells. J. Electrochem. Soc. 1996, 143, 1890–1903. [Google Scholar] [CrossRef]
  12. Paxton, B.; Newman, J. Modeling of Nickel/Metal Hydride Batteries. J. Electrochem. Soc. 1997, 144, 3818–3831. [Google Scholar] [CrossRef]
  13. Albertus, P.; Christensen, J.; Newman, J. Modeling Side Reactions and Non-isothermal Effects in Nickel Metal-Hydride Batteries. J. Electrochem. Soc. 2008, 155, A48–A60. [Google Scholar] [CrossRef]
  14. Jahantigh, N.; Afsharia, E. Thermal analysis of nickel/metal (Ni/MH) hydride battery during charge cycle. In Proceedings of the 3rd IASME/WSEAS international conference on Energy & Environment (EE’08), Cambridge, UK, 23–25 February 2008; World Scientific and Engineering Academy and Society (WSEAS): Stevens Point, WI, USA, 2008; pp. 73–78. [Google Scholar]
  15. Shi, J.; Wu, F.; Chen, S.; Zhang, C. Thermal analysis of rapid charging nickel/metal hydride batteries. J. Power Sources 2006, 157, 592–599. [Google Scholar] [CrossRef]
  16. Araki, T.; Nakayama, M.; Fukuda, K.; Onda, K. Thermal Behavior of Small Ni/MH Battery during Rapid Charge and Discharge Cycles. J. Electrochem. Soc. 2005, 152, A1128–A1135. [Google Scholar] [CrossRef]
  17. Wu, B.; Mohammed, M.; Brigham, D.; Elder, R.; White, R.E. Anon–isothermal model of a nickel/metal hydridecell. J. Power Sources 2001, 101, 149–157. [Google Scholar] [CrossRef]
  18. Xiao, G.Y. Fast Charging Nickel-Metal Hydride Traction Batteries. J. Electrochem. Soc. 2007, 171, A265–A272. [Google Scholar]
  19. Shin, D.-H.; Jeong, J.-B.; Kim, T.-H.; Kim, H.-J. Modeling of Lithium Battery Cells for Plug-In Hybrid Vehicles. J. Power Electron. 2013, 13, 429–436. [Google Scholar] [CrossRef] [Green Version]
  20. Hayner, C.M.; Zhao, X.; Kung, H.H. Materials for Rechargeable Lithium-Ion Batteries. Annu. Rev. Chem. Biomol. Eng. 2012, 3, 445–471. [Google Scholar] [CrossRef]
  21. Ali, E. Low Voltage Anode Materials for Lithium–Ion Batteries. Energy Storage Mater. 2017, 7, 157–180. [Google Scholar]
  22. Hu, L.; Wu, H.; La Mantia, F.; Yang, Y.; Cui, Y. Thin, Flexible Secondary Li-Ion Paper Batteries. ACSNANO 2010, 4, 5843–5848. [Google Scholar] [CrossRef]
  23. Krieger, E.M.; Arnold, C.B. Effects of undercharge and internal loss on the rate dependence of battery charge storage efficiency. J. Power Sources 2012, 210, 286–291. [Google Scholar] [CrossRef]
  24. Waldmann, T.; Hogg, B.-I.; Wohlfahrt-Mehrens, M. Li plating as unwanted side reaction in commercial Li-ion cells—A review. J. Power Sources 2018, 384, 107–124. [Google Scholar] [CrossRef]
  25. Smith, A.J.; Svens, P.; Varini, M.; Lindbergh, G.; Lindström, R.W. Expanded in Situ Aging Indicators for Lithium-Ion Batteries with a Blended NMC-LMO Electrode Cycled at Sub-Ambient Temperature. J. Electrochem. Soc. 2021, 168, 110530. [Google Scholar] [CrossRef]
  26. Epding, B.; Rumberg, B.; Jahnke, H.; Stradtmann, I.; Kwade, A. Investigation of significant capacity recovery effects due to long rest periods during high current cyclic aging tests in automotive lithium ion cells and their influence on lifetime. J. Energy Storage 2019, 22, 249–256. [Google Scholar] [CrossRef]
  27. Mussa, A.S.; Liivat, A.; Marzano, F.; Klett, M.; Philippe, B.; Tengstedt, C.; Lindbergh, G.; Edström, K.; Lindström, R.W.; Svens, P. Fast-charging effects on ageing for energy-optimized automotive LiNi1/3Mn1/3Co1/3O2/graphite prismatic lithium-ion cells. J. Power Sources 2019, 422, 175–184. [Google Scholar] [CrossRef]
  28. Zhang, W.; Wang, L.; Wang, L.; Liao, C.; Zhang, Y. Joint State-of-Charge and State-of-Available-Power Estimation Based on the Online Parameter Identification of Lithium-Ion Battery Model. IEEE Trans. Ind. Electron. 2021, 69, 3677–3688. [Google Scholar] [CrossRef]
  29. Gao, Y.; Liu, K.; Zhu, C.; Zhang, X.; Zhang, D. Co-Estimation of State-of-Charge and State-of- Health for Lithium-Ion Batteries Using an Enhanced Electrochemical Model. IEEE Trans. Ind. Electron. 2021, 69, 2684–2696. [Google Scholar] [CrossRef]
  30. Gopalakrishnan, K.; Offer, G.J. A Composite Single Particle Lithium-Ion Battery Model Through System Identification. IEEE Trans. Control Syst. Technol. 2021, 30, 1–13. [Google Scholar] [CrossRef]
  31. Naseri, F.; Schaltz, E.; Stroe, D.-I.; Gismero, A.; Farjah, E. An Enhanced Equivalent Circuit Model with Real-Time Parameter Identification for Battery State-of-Charge Estimation. IEEE Trans. Ind. Electron. 2021, 69, 3743–3751. [Google Scholar] [CrossRef]
  32. Shui, Z.Y.; Li, X.H.; Feng, Y.; Wang, B.C.; Wang, Y. Combining Reduced-Order Model with Data-Driven Model for Parameter Estimation of Lithium-Ion Battery. IEEE Trans. Ind. Electronics 2023, 70, 1521–1531. [Google Scholar] [CrossRef]
  33. Amir, S.; Gulzar, M.; Tarar, M.O.; Naqvi, I.H.; Zaffar, N.A.; Pecht, M.G. Dynamic Equivalent Circuit Model to Estimate State-of-Health of Lithium-Ion Batteries. IEEE Access 2022, 10, 18279–18288. [Google Scholar] [CrossRef]
  34. Wang, J.; Xiang, Y. Fast Modeling of the Capacity Degradation of Lithium-Ion Batteries via a Conditional Temporal Convolutional Encoder–Decoder. IEEE Trans. Transp. Electrif. 2022, 8, 1695–1709. [Google Scholar] [CrossRef]
  35. Vermeer, W.; Mouli, G.R.C.; Bauer, P. A Comprehensive Review on the Characteristics and Modeling of Lithium-Ion Battery Aging. IEEE Trans. Transp. Electrif. 2022, 8, 2205–2232. [Google Scholar] [CrossRef]
  36. Ni, Z.; Yang, Y. A Combined Data-Model Method for State-of-Charge Estimation of Lithium-Ion Batteries. IEEE Trans. Instrum. Meas. 2022, 71, 2503611. [Google Scholar] [CrossRef]
  37. Cao, Y.; Kroeze, R.C.; Krein, P.T. Multi-timescale Parametric Electrical Battery Model for Use in Dynamic Electric Vehicle Simulations. IEEE Trans. Transp. Electrif. 2016, 2, 432–442. [Google Scholar] [CrossRef]
  38. Renhart, W.; Magele, C.; Schweighofer, B. FEM-Based Thermal Analysis of NiMH Batteries for Hybrid Vehicles. IEEE Trans. Magn. 2008, 44, 802–805. [Google Scholar] [CrossRef]
  39. Agarwal, V.; Uthaichana, K.; DeCarlo, R.A.; Tsoukalas, L.H. Development and Validation of a Battery Model Useful for Discharging and Charging Power Control and Lifetime Estimation. IEEE Trans. Energy Convers. 2010, 25, 821–835. [Google Scholar] [CrossRef]
  40. Chen, M.; Rincon-Mora, G.A. Accurate electrical battery model capable of predicting runtime and I-V performance. IEEE Trans. Energy Convers. 2006, 21, 504–511. [Google Scholar] [CrossRef]
  41. Hu, T.; Zanchi, B.; Zhao, J. Simple Analytical Method for Determining Parameters of Discharging Batteries. IEEE Trans. Energy Convers. 2011, 26, 787–798. [Google Scholar] [CrossRef]
  42. Alsharif, K.I.; Pesch, A.H.; Borra, V.; Li, F.X.; Cortes, P.; Macdonald, E.; Choo, K. A Novel Modal Representation of Battery Dynamics. IEEE Access 2022, 10, 16793–16806. [Google Scholar] [CrossRef]
  43. Piao, C.; Yang, X.; Teng, C.; Yang, H. An improved model based on artificial neural networks and Thevenin model for nickel metal hydride power battery. In Proceedings of the 2010 International Conference on Optics, Photonics and Energy Engineering (OPEE), Wuhan, China, 10–11 May 2010; pp. 115–118. [Google Scholar] [CrossRef]
  44. Tarabay, J.; Karami, N. Nickel Metal Hydride battery: Structure, chemical reaction, and circuit model. In Proceedings of the 2015 Third International Conference on Technological Advances in Electrical, Electronics and Computer Engineering (TAEECE), Beirut, Lebanon, 29 April –1 May 2015; pp. 22–26. [Google Scholar] [CrossRef]
  45. Bharathan, D.; Pesaran, A.; Vlahinos, A.; Kim, G.-H. Improving battery design with electro-thermal modeling. In Proceedings of the 2005 IEEE Vehicle Power and Propulsion Conference, Chicago, IL, USA, 7 September 2005; p. 8. [Google Scholar] [CrossRef] [Green Version]
  46. Wei, Z.; Hu, J.; He, H.; Yu, Y.; Marco, J. Embedded Distributed Temperature Sensing Enabled Multistate Joint Observation of Smart Lithium-Ion Battery. IEEE Trans. Ind. Electron. 2023, 70, 555–565. [Google Scholar] [CrossRef]
  47. Wei, Z.; Quan, Z.; Wu, J.; Li, Y.; Pou, J.; Zhong, H. Deep Deterministic Policy Gradient-DRL Enabled Multiphysics-Constrained Fast Charging of Lithium-Ion Battery. IEEE Trans. Ind. Electron. 2022, 69, 2588–2598. [Google Scholar] [CrossRef]
Figure 1. The Interpolation of ionic conductivity with electrolyte concentration.
Batteries 09 00052 g001
Figure 2. Potential of the two electrodes at Equilibrium based on (SOC).
Batteries 09 00052 g002
Figure 3. Potential Variation in the electrode at equilibrium.
Batteries 09 00052 g003
Figure 4. Discharge Curves for different rates of discharge.
Batteries 09 00052 g004
Figure 5. V&I curve over the discharging and charging time.
Batteries 09 00052 g005
Figure 6. Constituent losses of over potential loss in Battery.
Batteries 09 00052 g006
Figure 7. Concentration profile at various stages.
Batteries 09 00052 g007
Figure 8. Potential of the two electrodes at Equilibrium based on (SOC).
Batteries 09 00052 g008
Figure 9. Equilibrium voltage of electrode materials.
Batteries 09 00052 g009
Figure 10. Discharge Curves for a different rate of discharge.
Batteries 09 00052 g010
Figure 11. Constituent losses of over potential loss in Battery.
Batteries 09 00052 g011
Figure 12. Concentration profile at various stages.
Batteries 09 00052 g012
Disclaimer/Publisher’s Note: The statements, opinions and data contained in all publications are solely those of the individual author(s) and contributor(s) and not of MDPI and/or the editor(s). MDPI and/or the editor(s) disclaim responsibility for any injury to people or property resulting from any ideas, methods, instructions or products referred to in the content.

