Article

Unveil Overcharge Performances of Activated Carbon Cathode in Various Li-Ion Electrolytes

1
Institute of Electrical Engineering, Chinese Academy of Sciences, Beijing 100190, China
2
Institute of Electrical Engineering and Advanced Electromagnetic Drive Technology (AEDT), Qilu Zhongke, Jinan 250013, China
3
School of Engineering Sciences, University of Chinese Academy of Sciences, Beijing 100049, China
4
School of Materials Science & Engineering, University of Jinan, Jinan 250022, China
*
Authors to whom correspondence should be addressed.
Batteries 2023, 9(1), 11; https://doi.org/10.3390/batteries9010011
Submission received: 3 November 2022 / Revised: 11 December 2022 / Accepted: 21 December 2022 / Published: 24 December 2022

Abstract

:
Typically, the practical lithium-ion capacitor (LIC) is composed of a capacitive cathode (activated carbon, AC) and a battery-type anode (graphite, soft carbon, hard carbon). There is a risk of the LIC cell overcharging to an unsafe voltage under electrical abuse conditions. Since the anode potential is usually quite low during the charging process and can be controlled by adjusting the amount of anode materials, the overcharge performances of LIC full-cell mainly depend on the AC cathode. Thus, it is necessary to independently investigate the overcharge behaviors of the AC cathode in nonaqueous Li-ion electrolytes without the interference of the anode electrode. In this work, the stable upper potential limits of the AC electrode in three types of lithium-ion electrolytes were determined to be 4.0−4.1 V via the energy efficiency method. Then, the AC//Li half-cells were charged to 5.0 V and 10.0 V, respectively, to investigate the overcharge behaviors. For the half-cells with propylene carbonate (PC)-based electrolytes, the voltage increased sharply to 10.0 V with a vertical straight line at the end of the overcharging process, indicating that the deposits of electrolyte decomposition had separated the AC electrode surface from the electrolytes, forming a self-protective passivation film with a dielectric capacitor behavior. The dense and compact passivation film is significant in separating the AC electrode surface from the electrolytes and preventing LIC cells from volume expansion and explosion risks under electrical abuse and overcharging conditions.

1. Introduction

The lithium-ion capacitor (LIC) is a type of novel asymmetric supercapacitor that combines the lithium-ion intercalated electrode of Li-ion batteries (LIBs) with the electrical double-layer electrode of supercapacitors [1,2,3,4,5,6]. In 2002, Kanebo Ltd. and Fuji Heavy Industry developed practical LICs employing porous carbon cathodes, pre-lithiated polyacenic semiconductor (PAS) anodes, and electrolytes using a laminated structure. After that, other companies, e.g., the JM Energy corporation (Musashi Energy Solutions Co., Yamanashi, Japan) and TAIYO YUDEN company (Tokyo, Japan), also pushed the commercialization of LICs based on various technical routes [7]. After pre-lithiation treatments [8,9], the anode potential reduces, and the stable working voltage of the practical LIC cell increases to 3.8 V [10,11].
However, sometimes LIC cells can be charged to a voltage higher than the rated voltage, also known as overcharge, under electrical abuse conditions such as the malfunction of charging equipment and/or the inappropriate design of the capacitor management system (CMS) [12,13,14,15]. Oca et al. [12] examined the overcharge process of commercial 1100 F LIC pouch and 3300 F LIC prismatic cells. When the LIC cell was charged to the high voltage of 4.6 V, the LIC cell revealed an exothermic reaction, accompanied by gaseous products and a remarkable swelling of the pouch cell. For the prismatic LIC cell, the endothermic process was observed for a voltage lower than 4.4 V, and with the overcharge period continuing, the cell temperature increased gradually. After the LIC cell voltage reached 5.0 V, the cell voltage dropped, and the cell temperature could be as high as 76 °C. Due to a large amount of gas products and the high pressure in the metallic case, the vent of the laminate cell opened [12]. Bolufawi et al. [13] studied the overcharging performance of a 200-F LIC cell manufactured by General Capacitor LLC. The LIC cell was charged from 4.0 V to the maximum voltage of 6.7 V, and then the voltage dropped. Accordingly, the cell temperature increased from the ambient temperature to about 37 °C, along with swelling and gassing.
Considering that the anode potential of the LIC full-cell is usually confined to a relatively small range (e.g., 0.1–0.5 V vs. Li+/Li), and the anode potential can even be ca. 0 V vs. Li+/Li in a fully charged state [16,17,18], it is presumed that the upper potential of the cathode can exceed the oxidative decomposition limits of electrolyte in the case of overcharging. Therefore, the overcharge behaviors of LICs mainly depend on the activated carbon (AC) cathode [19,20]. Thus, it is necessary to independently investigate the overcharge behaviors of AC cathode in nonaqueous Li-ion electrolytes without the interference of the anode electrode. In this work, the stable upper potential limits of AC electrodes in various electrolytes were determined through the energy efficiency (EE) method, and the AC//Li half-cells were overcharged to 5.0 V to assess the overcharge performances of the AC electrode. Furthermore, the AC//Li half-cells were charged as high as 10.0 V, and a substantial self-protective passivation effect was observed.

2. Materials and Methods

The AC electrodes were provided by the Tianjin Planno Energy Technology company. Three common nonaqueous electrolytes were adopted in this study. 1 M lithium bis(fluorosulfonyl)imide (LiFSI) solution in propylene carbonate (PC), denoted as PCE; 1 M lithium hexafluorophosphate (LiPF6) dissolved in the mixture solvent of ethylene carbonate (EC), diethyl carbonate (DEC), and dimethyl carbonate (DMC) in a 1:1:1 volume ratio, denoted as EDD; and 1 M LiFSI dissolved in the solvent mixture with EC, PC and DEC in a volume ratio of 3:1:4, denoted as EPD.
The AC electrodes were cut into a suitable shape with a width of 35 mm and a length of 40 mm, cold pressed under 6 MPa, and then dried in a vacuum oven for more than 8 h at 80 °C. In this work, the pouch cell was employed, which consisted of one single-faced AC electrode and one Li foil counter electrode. The AC electrode was separated with a Li electrode by an FPC3018 composite cellulose separator composed of cellulose and polyester (Mitsubishi Paper Mills, Ltd., Tokyo, Japan). In an argon-filled controlled-atmosphere glove box (MBRAUN, Shanghai, China, H2O < 0.1 ppm, O2 < 0.1 ppm). After the Li-ion electrolyte solution was injected, the aluminum-plastic package was hermetically sealed.
The AC//Li half-cells were galvanostatic charged and discharged using a Neware battery charger (CT-4008T-5V10mA-164, Shenzhen, China) and overcharged to 10.0 V using a VMP3 electrochemical station (BioLogic, Seyssinet-Pariset, France). The surface morphologies of AC electrodes after overcharging process were observed by a CIQTEK scanning electron microscope (SEM3100, Hefei, China) coupled with energy-dispersive X-ray spectroscopy analysis (Element EDS, EDAX, Pleasanton, CA, USA). The released gaseous products at high voltage were analyzed on a Thermo Scientific TRACE 1300 series gas chromatograph (Shanghai, China).

3. Results

3.1. Stable Upper Potential Limits of AC Electrode

Energy efficiency (EE) variation can be adopted as a useful tool to determine the stable upper and lower potential limits of AC electrodes in aqueous or nonaqueous electrolytes [16,21,22,23]. According to the galvanostatic charging and discharging profiles of the AC//Li half-cell, EE is defined as the ratio of the discharge energy to the charge energy, which considers the impacts of the capacity loss and the voltage drop during the charging and discharging processes. In addition, the Coulombic efficiency (CE) is termed as the ratio of the discharged capacity to the charged capacity, and the voltage efficiency (VE) is termed as the ratio between the discharging plateau voltage and the charging plateau voltage of the AC//Li half-cell. When the subtle redox reaction (charge transfer reaction) occurs at the electrode/electrolyte interface on the AC electrode, the electrolyte decomposition reactions can result in the deposition of insoluble products and the formation of passivation film (cathode electrolyte interphase, CEI) on the surface or in the accessible pores of the AC electrode. Here, EE is much more sensitive to irreversible redox reactions than CE due to the cumulative effect of VE and CE [23]. Therefore, the sudden drop in EE can be used as a basis for judgment of the stable upper potential limit of the AC electrode. The change trends of CE and VE can be used as references.
The AC//Li half-cells with different Li-ion electrolytes were galvanostatic charged and discharged from the potential of zero charge (abbreviated as pzc, about 3.08 V) [24] to various cut-off voltages at 2 mA. The vertex voltage increased from 3.4 V to 4.5 V with a 0.1 V-step, as shown in Figure 1a. The EE, CE, and VE values as functions of vertex voltage are shown in Figure 1b. According to the EE criterion to determine the cut-off voltage, the stable upper potential limits of AC electrodes in EDD, EPD, and PCE electrolytes can be determined to be 4.0 V, 4.0 V, and 4.1 V, respectively, which are consistent with the experimental results reported in our previous publication [16].

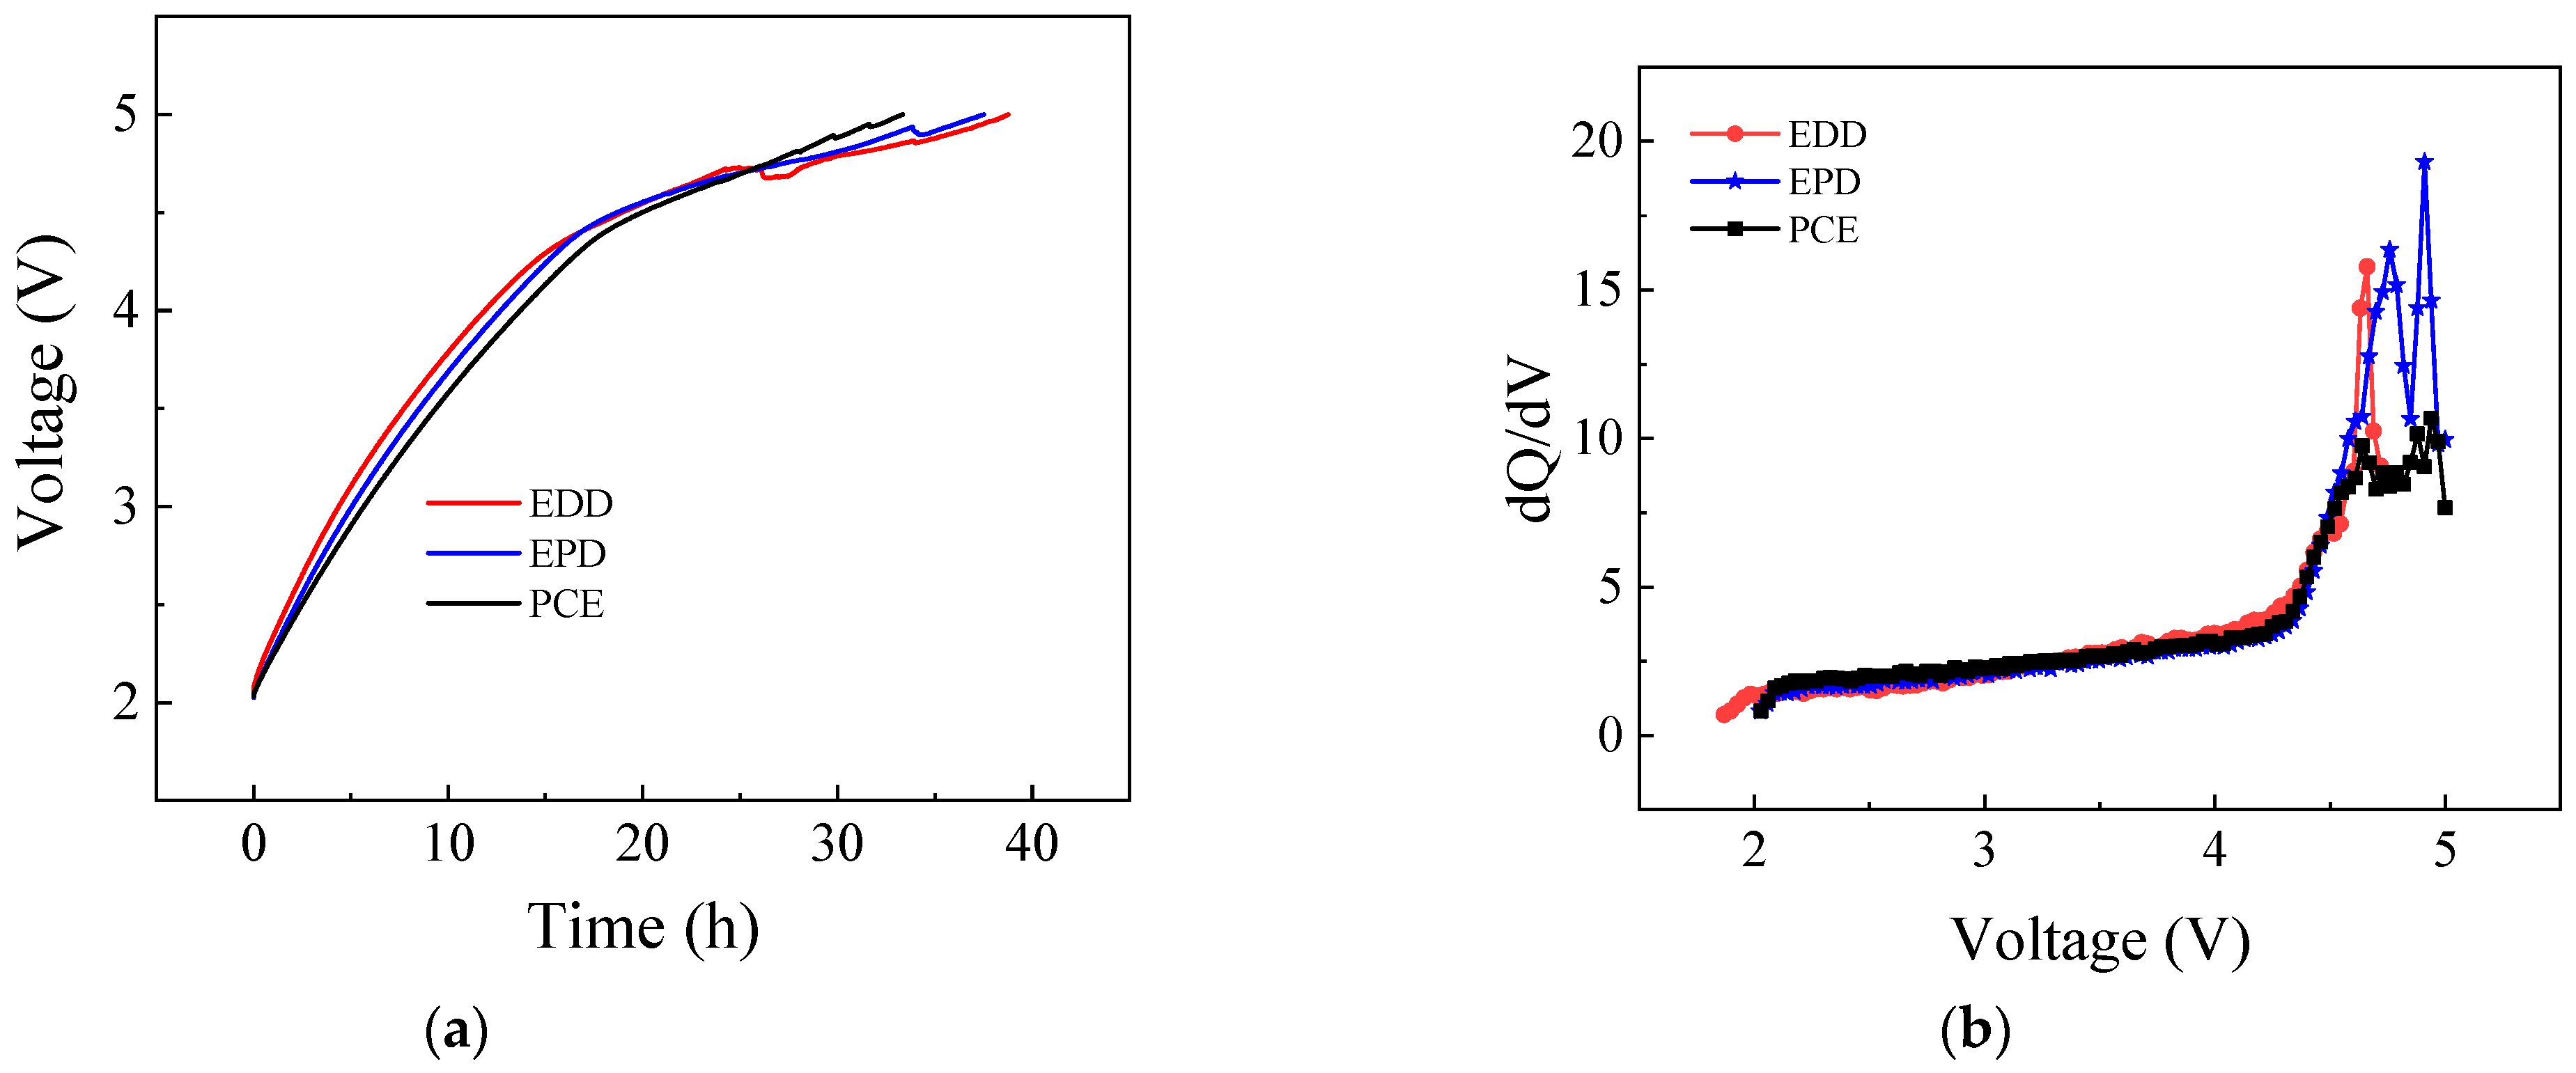
3.2. Overcharge to 5.0 V

Considering that the high-voltage limits of LICs mainly depend on the oxidative decomposition of Li-ion electrolytes on the AC surface, the overcharging behaviors of AC//Li half-cells have been investigated. The AC//Li half-cells using EPD, PCE, and EDD electrolytes were first overcharged to 5.0 V at a current of 0.5 mA. The voltage-versus-time curves for the AC//Li half-cells are plotted and shown in Figure 2a. The voltage changed with time almost linearly below 4.2 V for all the half-cells. When the half-cells were charged to higher voltages of over 4.2 V, the upward trend became slow (knee point). Then the voltage dropped at several voltage points, ascribed to the decomposition of electrolyte components [25]. As shown in Figure 2b, the mutation points are 4.59 V, 4.69 V, and 4.94 V for the EPD half-cell, 4.81 V, 4.89 V, and 4.95 V for the PCE half-cell, and 4.67 V and 4.94 V for the EDD half-cell, representing the cathodic peaks of electrolyte oxidation reaction on the interface between electrolyte and AC.

3.3. Overcharge to 10.0 V

Furthermore, the half-cells were set to charge to 10.0 V at a current of 25 mA using the VMP3 electrochemical station. The voltage versus time profiles for AC electrodes in EDD, EPD, and EDD electrolytes are depicted in Figure 3a. For instance, when the voltage of the EPD half-cell reached 5 V, it decreased rapidly with the increase of charge time and charged capacity. The half-cell voltage dropped to 4.4 V after being charged to 21.6 times the rated capacity (about 4.4 h). It stayed nearly unchanged for the subsequent period, during which 28 times of rated capacity was additionally charged (5.6 h). Then, the half-cell voltage increased to 6.8 V linearly after being charged an additional 22.5 times the rated capacity (4.5 h). Finally, the half-cell voltage sharply increased to 10.0 V with a vertical straight line after being charged for a total of 14.4 h, which indicated that the deposits of electrolyte decomposition had separated the surface of the AC cathode and electrolyte, revealing a dielectric capacitor behavior. The PCE AC//Li half-cell revealed similar behaviors. The voltage rose to about 5 V voltage and dropped to 4.6 V, and then reached the fully polarized state with less dwell time. During these processes, there was only a very slight gas evolution. On the contrary, the voltage of the EDD half-cell only rose to about 8 V, accompanying continuous electrolyte decomposition and huge volume expansion. The photos of the half-cells with EPD, PCE, and EDD electrolytes after the overcharging process are respectively illustrated in Figure 3b–d. For all three half-cells, a less noticeable temperature rise was observed just by touching them. After the overcharging processes, the voltage of half-cells rapidly dropped to 4.2–4.3 V upon rest period, which can be attributed to the large leakage current at a voltage higher than the stable voltage range [26].

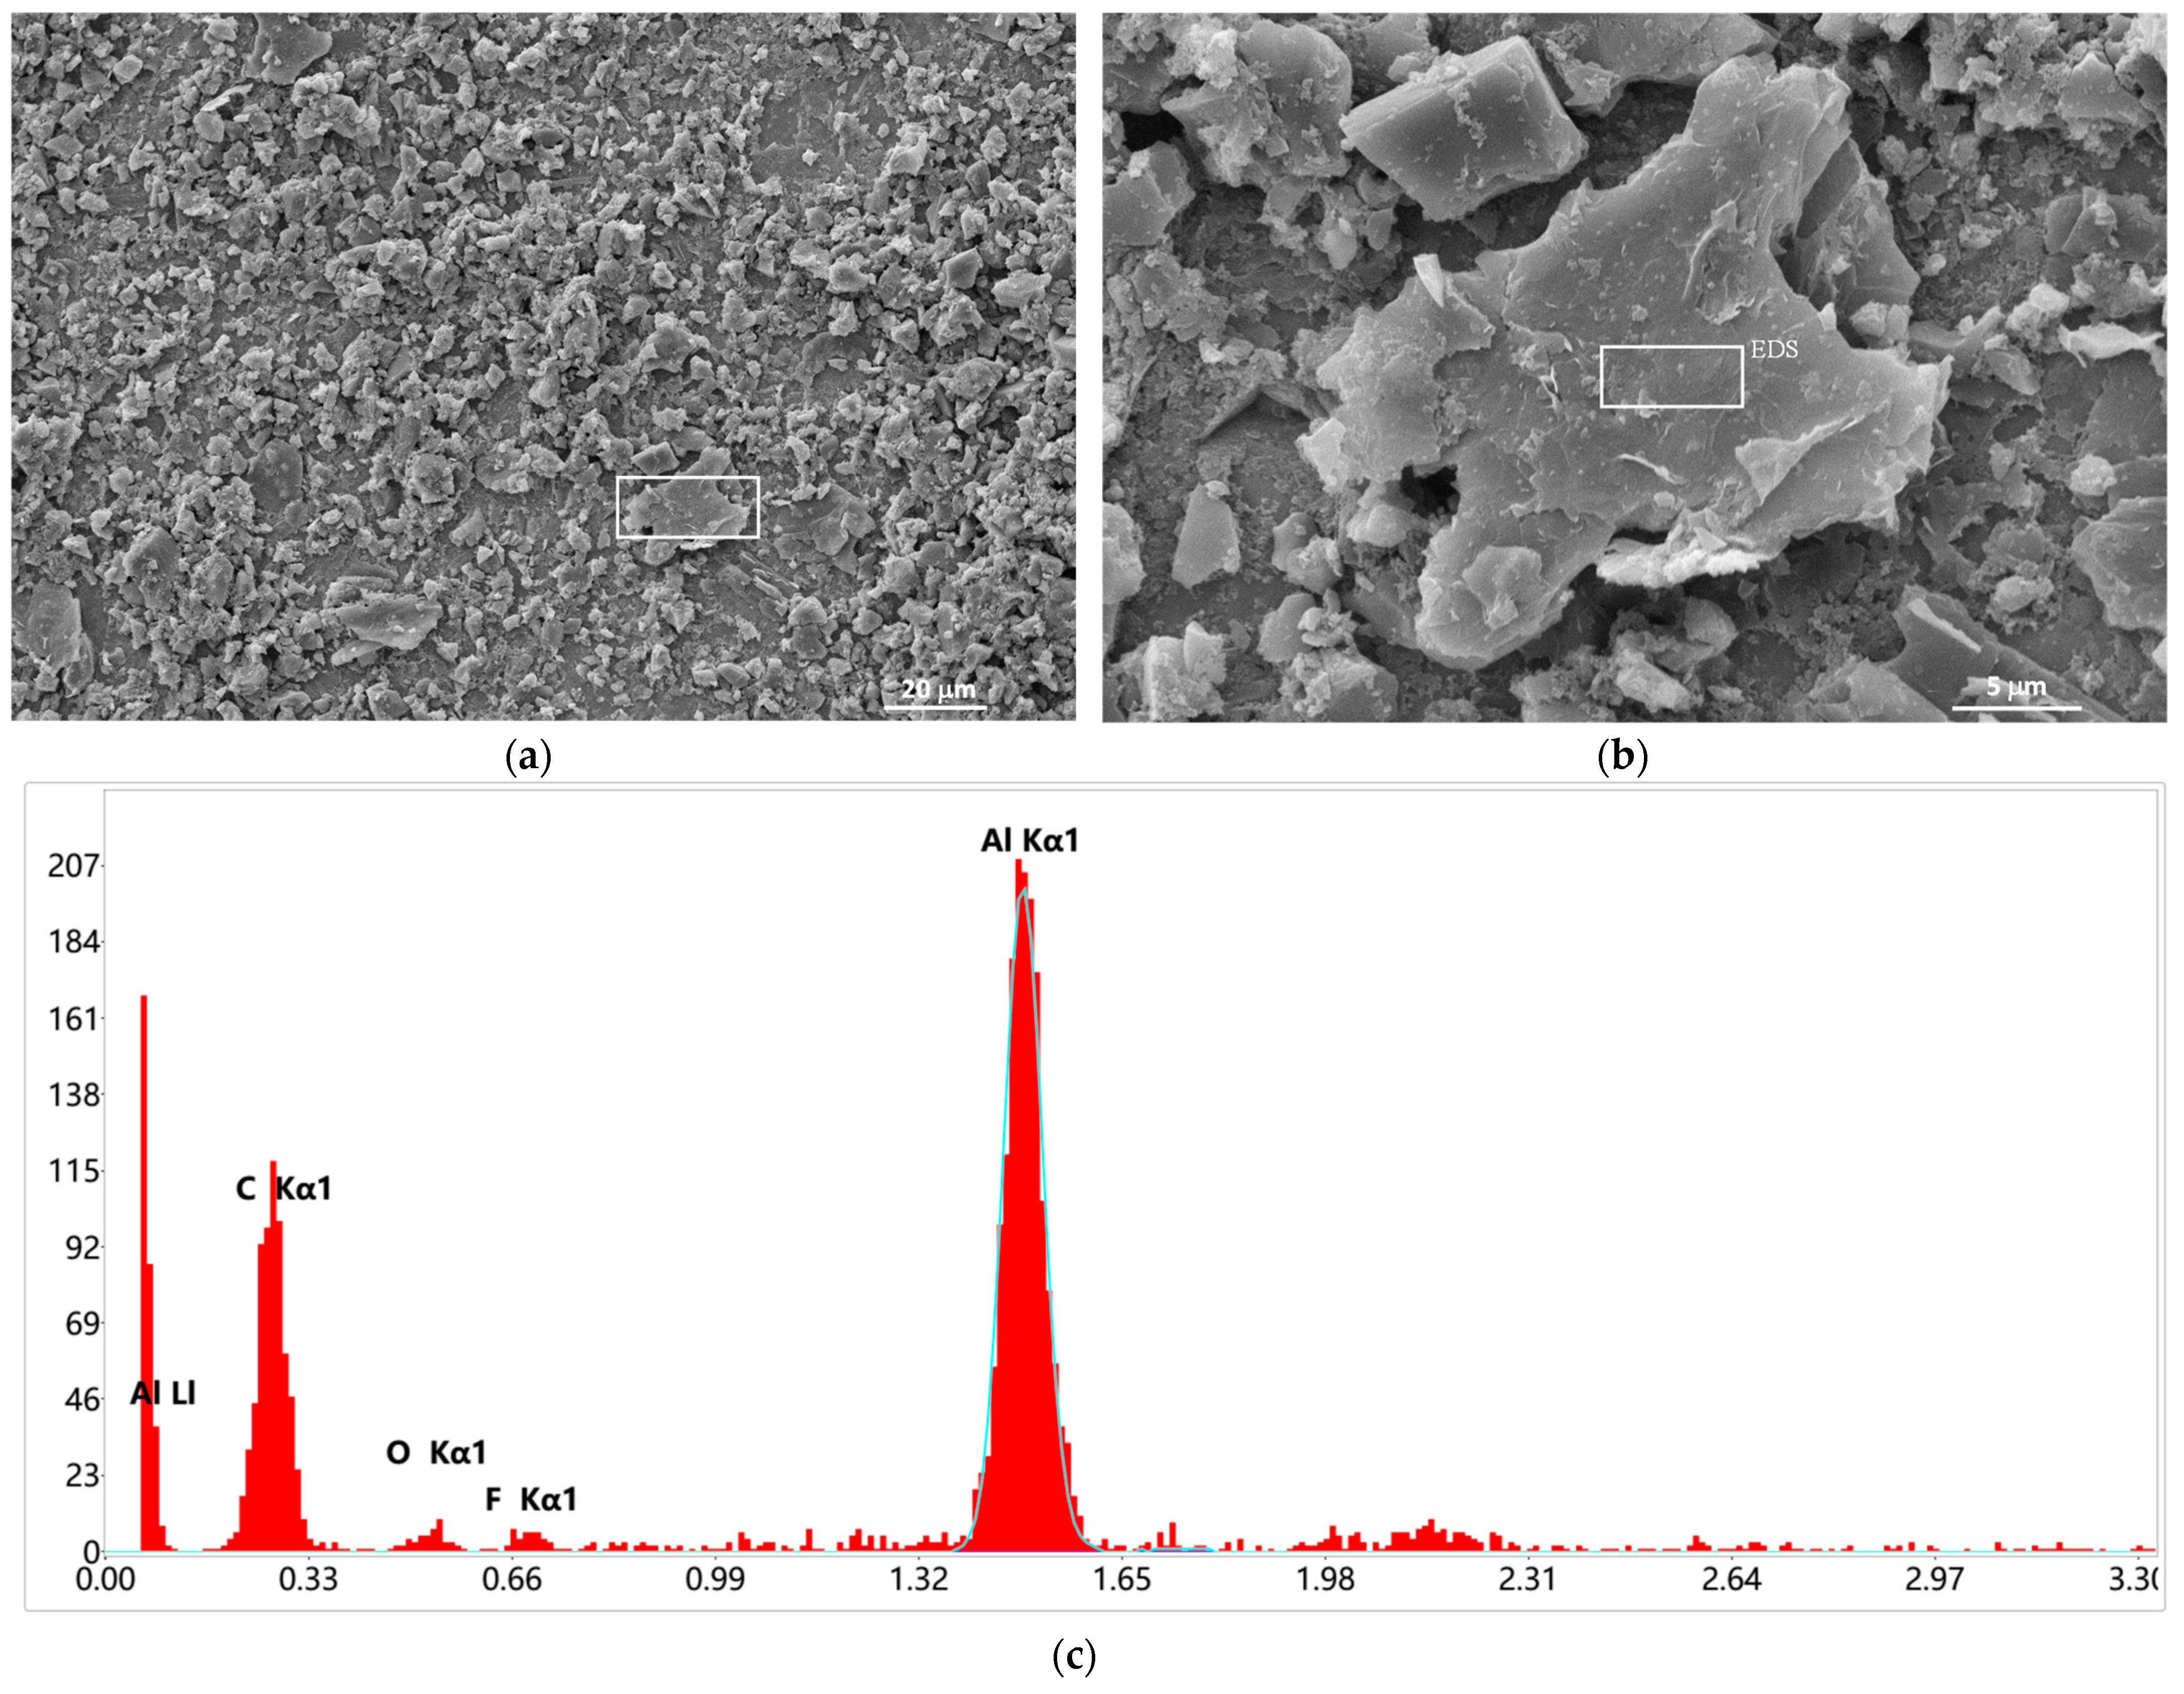
3.4. Post-Mortem Analysis of Half-Cells

Since the AC//Li half-cell with PCE electrolyte can be overcharged to the high voltage of 10.0 V, it is assumed that the deposits of electrolyte decomposition had separated the AC electrode surface and electrolyte through the substantial passivation film. After the overcharging process, three half-cells were disassembled in the glove box, and the AC electrodes were thoroughly washed with DMC solvent and immersed in DMC overnight. Then the electrodes were dried in an argon atmosphere. The SEM morphologies and the compositions of the AC electrode surface were characterized. As reported in our previous publication [16], after the AC electrode was charged to 4.5 V in the PCE electrolyte, a thin film layer was formed on the electrode surface, which made the edges of the AC and carbon black particles no longer clear. The AC electrode has been covered with thicker electrolyte decomposition deposits after being cycled 2000 times between pzc and 4.5 V. By comparing the SEM images of the fresh AC electrode (Figure 4a) and overcharged AC electrode (Figure 4b), it can be found that a very thick passivation film covers the overcharged AC electrode surface, which consists of two phases, i.e., sphere-like small particles (zone 1), and the amorphous deposits (zone 2). The EDS spectra illustrated that the contents of O and S elements are high in zone 1, as shown in Figure 5a. On the contrary, zone 2 has a large content of F and S elements, and it contains fewer O elements, as shown in Figure 5b. From the cross-sectional view of the SEM images in Figure 4c, it can be observed that the thickness of the passivation film is about 1 μm. Similarly, the thick passivation films formed on the AC electrode surface, which was obtained from the AC//Li half-cell with EPD electrolyte after overcharging, as shown in Figure 4c.
For the overcharged half-cell with EDD electrolytes, the gaseous products were collected and analyzed through a gas chromatograph, as shown in Figure 6a,b. It was identified that the emitted gas mainly consisted of H2, CO2, CH4, and CO, and the relative volume ratio is 46.0%, 45.3%, 3.6%, and 5.1%, respectively. Other organic alkane gas is hardly found. The relative volume ratio between N2 and O2 is 3.0, which is near the composition of air (78%:21%), and the two gas components are mainly ascribed to the mixed air during sampling. The gas evolution of CO2 is attributed to the oxidative decomposition of solvent on the AC electrode surface. CO, CH4, and H2 gas are mainly ascribed to the reductive decomposition of solvent and trace amount of H2O/HF on metallic Li electrode surface [27,28,29]. Since the linear solvents, e.g., dimethyl carbonate (DMC), are more prone to degradation than those of cyclic solvents of ethylene carbonate (EC) and propylene carbonate (PC) [30], the decomposition of DMC is taken as an example, and the possible reactions are as follows [31,32]:
Figure 6. Identification and quantification of emitted gases: (a) gas chromatograph spectrum; (b) normalized relative volume ratio of the released gas products.
Batteries 09 00011 g006
When the EDD half-cell was disassembled, the remaining electrolyte had turned from the clear color of fresh electrolyte to brownish black, and the Li electrode was covered with light black deposits. The SEM image indicates that the morphology of deposits on the AC electrode surface for the EDD sample is different from the abovementioned samples, as shown in Figure 7a,b. The deposits show a sheet-like shape, which tends to exfoliate from the AC electrode surface due to the low adhesion. In some areas, there are fewer deposits on the AC electrode surface. Moreover, the deposited layer seems to be not dense enough to completely separate the electrolyte and AC electrodes. The EDS results illustrated that the deposits have a large content of Al, O, and F elements, as shown in Figure 7c. The composition of these light black deposits may consist of AlF3, Li2CO3, ROLi, and ROCO2Li.

4. Discussion

From the above results, it can be found that the self-protective passivation film can be formed on an AC electrode surface by EPD and PCE electrolytes. The mechanism of passivation is still not very clear, as we need more advanced interface characterizations to distinguish the contributions of lithium salt and organic solvent in this system, e.g., transmission electron microscopy (TEM), X-ray photoelectron spectroscopy (XPS), Fourier transform infrared spectroscopy (FT-IR), and cryo-electron microscopy (cryo-EM). A possible explanation is that the passivation effects are due to the synergistic effect of both lithium salt and solvent. It is noticed that the passivation film is rich in S elements, especially the sphere-like small particles. This phase is thought to involve the inorganic compounds containing Li, S, F, and O elements, which are derived from LiFSI salt and solvents. The composition of the passivation layer is presumed to be composed of LiF, Li2CO3, Li2SO3, ROLi, ROCO2Li, and RSO2Li. The dense and compact passivation film, called the solid electrolyte interphase (SEI) or cathodic electrolyte interface (CEI), is of great significance in separating the AC electrode surface from the electrolytes upon overcharging period. This self-protective passivation effect is desirable, and its formation process can be illustrated in Figure 8. Under electrical abuse and overcharging conditions, the superior overcharge endurance of EPD and PCE systems can prevent LIC cells from volume expansion, explosion, and catching fire risks. In further work, the composition and the formation mechanism of the passivation layer will be investigated in more depth. Accordingly, the electrolyte composition is expected to be optimized to bring about the self-protective passivation effect in a more reversible way.

5. Conclusions

In this work, the stable upper potential limits of AC electrodes in three types of Li-ion electrolytes were evaluated and determined to be 4.0−4.1 V through the energy efficiency approach. Then, the AC//Li half-cells were charged to 5.0 V and 10.0 V to study the decomposition of electrolyte components. It was noticed that the self-protective passivation film could form on the AC electrode surface in EPD and PCE electrolytes, mainly ascribed to the insoluble decomposition products of LiFSI salt and organic solvent. The composition of the passivation layer is presumed to be composed of LiF, Li2CO3, Li2SO3, ROLi, ROCO2Li, and RSO2Li, and the dense and compact passivation film is greatly significant in separating the AC electrode surface from the electrolytes and restraining further electrolyte decomposition. This self-protective passivation effect is beneficial for preventing LIC cells from volume expansion and explosion risks under electrical abuse and overcharging conditions.

Author Contributions

X.S.: Conceptualization, Investigation, Writing—original draft, Writing—review & editing. Y.A.: Investigation. X.Z. (Xiong Zhang): Formal analysis, Writing—review & editing, Funding acquisition, Resources. K.W.: Funding acquisition, Formal analysis, Writing—review & editing. C.Y.: Funding acquisition, Formal analysis, Writing—review & editing. X.Z. (Xiaohu Zhang): Investigation, Validation. C.L.: Funding acquisition, Resources. Y.X.: Funding acquisition, Resources. Y.M.: Conceptualization, Methodology, Resources, Supervision, Funding acquisition. All authors have read and agreed to the published version of the manuscript.

Funding

This work was financially supported by the National Natural Science Foundation of China (Nos. 52077207, 51907193, 52171211), Youth Innovation Promotion Association, CAS (No. Y2021052), Natural Science Foundation of Shandong Province (No. ZR2021QE012), and Taishan Scholars (No. ts201712050).

Institutional Review Board Statement

Not applicable.

Informed Consent Statement

Not applicable.

Data Availability Statement

Not applicable.

Acknowledgments

Linbin Geng is thanked for her support of this work.

Conflicts of Interest

The authors declare no conflict of interest.

References

  1. Simon, P.; Gogotsi, Y. Perspectives for electrochemical capacitors and related devices. Nat. Mater 2020, 19, 1151–1163. [Google Scholar] [PubMed]
  2. Feng, X.; Shi, X.; Ning, J.; Wang, D.; Zhang, J.; Hao, Y.; Wu, Z.-S. Recent advances in micro-supercapacitors for AC line-filtering performance: From fundamental models to emerging applications. eScience 2021, 1, 124–140. [Google Scholar] [CrossRef]
  3. Karimi, D.; Behi, H.; Van Mierlo, J.; Berecibar, M. A Comprehensive Review of Lithium-Ion Capacitor Technology: Theory, Development, Modeling, Thermal Management Systems, and Applications. Molecules 2022, 27, 3119. [Google Scholar] [CrossRef]
  4. Eguchi, T.; Sugawara, R.; Abe, Y.; Tomioka, M.; Kumagai, S. Impact of full prelithiation of Si-based anodes on the rate and cycle performance of Li-ion capacitors. Batteries 2022, 8, 49. [Google Scholar] [CrossRef]
  5. Han, F.; Qian, O.; Meng, G.; Lin, D.; Chen, G.; Zhang, S.; Pan, Q.; Zhang, X.; Zhu, X.; Wei, B. Structurally integrated 3D carbon tube grid-based high-performance filter capacitor. Science 2022, 377, 1004. [Google Scholar]
  6. Ding, J.; Hu, W.; Paek, E.; Mitlin, D. Review of hybrid ion capacitors: From aqueous to lithium to sodium. Chem. Rev. 2018, 118, 6457–6498. [Google Scholar] [CrossRef]
  7. Han, P.X.; Xu, G.J.; Han, X.Q.; Zhao, J.W.; Zhou, X.H.; Cui, G.L. Lithium ion capacitors in organic electrolyte system: Scientific problems, material development, and key technologies. Adv. Energy Mater. 2018, 8, 1801243. [Google Scholar] [CrossRef]
  8. Arnaiz, M.; Canal-Rodríguez, M.; Carriazo, D.; Villaverde, A.; Ajuria, J. Enabling versatile, custom-made lithium-ion capacitor prototypes: Benefits and drawbacks of using hard carbon instead of graphite. Electrochim. Acta 2023, 437, 141456. [Google Scholar] [CrossRef]
  9. Arnaiz, M.; Ajuria, J. Pre-lithiation strategies for lithium ion capacitors: Past, present, and future. Batter. Supercaps 2021, 4, 733–748. [Google Scholar] [CrossRef]
  10. Yuan, J.; Qin, N.; Lu, Y.; Jin, L.; Zheng, J.; Zheng, J.P. The effect of electrolyte additives on the rate performance of hard carbon anode at low temperature for lithium-ion capacitor. Chin. Chem. Lett. 2022, 33, 3889–3893. [Google Scholar] [CrossRef]
  11. Jin, L.M.; Yuan, J.M.; Shellikeri, A.; Naderi, R.; Qin, N.; Lu, Y.Y.; Fan, R.L.; Wu, Q.; Zheng, J.S.; Zhang, C.M.; et al. An overview on design parameters of practical lithium-ion capacitors. Batter. Supercaps 2021, 4, 749. [Google Scholar] [CrossRef]
  12. Oca, L.; Guillet, N.; Tessard, R.; Iraola, U. Lithium-ion capacitor safety assessment under electrical abuse tests based on ultrasound characterization and cell opening. J. Energy Storage 2019, 23, 29. [Google Scholar] [CrossRef]
  13. Bolufawi, O.; Shellikeri, A.; Zheng, J.P. Lithium-ion capacitor safety testing for commercial application. Batteries 2019, 5, 74. [Google Scholar] [CrossRef] [Green Version]
  14. Soltani, M.; Beheshti, S.H. A comprehensive review of lithium ion capacitor: Development, modelling, thermal management and applications. J. Energy Storage 2021, 34, 102019. [Google Scholar] [CrossRef]
  15. Wang, Z.Y.; Jiang, L.H.; Liang, C.; Zhao, C.P.; Wei, Z.S.; Wang, Q.S. Effects of 3-fluoroanisol as an electrolyte additive on enhancing the overcharge endurance and thermal stability of lithium-ion batteries. J. Electrochem. Soc. 2020, 167, 130517. [Google Scholar] [CrossRef]
  16. Sun, X.; Zhang, X.; Wang, K.; An, Y.; Zhang, X.; Li, C.; Ma, Y. Determination strategy of stable electrochemical operating voltage window for practical lithium-ion capacitors. Electrochim. Acta 2022, 428, 140972. [Google Scholar] [CrossRef]
  17. Liang, J.; Wang, D.W. Design Rationale and Device Configuration of Lithium-Ion Capacitors. Adv. Energy Mater 2022, 12, 2200920. [Google Scholar] [CrossRef]
  18. Jin, L.; Guo, X.; Shen, C.; Qin, N.; Zheng, J.; Wu, Q.; Zhang, C.; Zheng, J.P. A universal matching approach for high power-density and high cycling-stability lithium ion capacitor. J. Power Sources 2019, 441, 227211. [Google Scholar] [CrossRef]
  19. El Ghossein, N.; Sari, A.; Venet, P. Development of a capacitance versus voltage model for lithium-ion capacitors. Batteries 2020, 6, 54. [Google Scholar] [CrossRef]
  20. Zheng, W.; Li, Z.; Han, G.; Zhao, Q.; Lu, G.; Hu, X.; Sun, J.; Wang, R.; Xu, C. Nitrogen-doped activated porous carbon for 4.5 V lithium-ion capacitor with high energy and power density. J. Energy Storage 2022, 47, 103675. [Google Scholar] [CrossRef]
  21. Santos, M.C.G.; Silva, G.G.; Santamaria, R.; Ortega, P.F.R.; Lavall, R.L. Discussion on operational voltage and efficiencies of ionic-liquid-based electrochemical capacitors. J. Phys. Chem. C. 2019, 123, 8541. [Google Scholar] [CrossRef]
  22. Bahdanchyk, M.; Hashempour, M.; Vicenzo, A. Evaluation of the operating potential window of electrochemical capacitors. Electrochim. Acta 2020, 332, 135503. [Google Scholar] [CrossRef] [Green Version]
  23. Cougnon, C. Exploring the interdependence between the coulombic, voltage and energy efficiencies. Electrochem. Commun. 2020, 120, 106832. [Google Scholar] [CrossRef]
  24. Levi, M.; Levy, N.; Sigalov, S.; Salitra, G.; Aurbach, D.; Maier, J. Electrochemical quartz crystal microbalance (EQCM) studies of ions and solvents insertion into highly porous activated carbons. J. Am. Chem. Soc. 2010, 132, 13220. [Google Scholar] [CrossRef] [PubMed]
  25. Qin, N.; Jin, L.; Lu, Y.; Wu, Q.; Zheng, J.; Zhang, C.; Chen, Z.; Zheng, J.P. Over-potential tailored thin and dense lithium carbonate growth in solid electrolyte interphase for advanced lithium ion batteries. Adv. Energy Mater. 2022, 12, 2103402. [Google Scholar] [CrossRef]
  26. Sun, X.; An, Y.; Geng, L.; Zhang, X.; Wang, K.; Yin, J.; Huo, Q.; Wei, T.; Zhang, X.; Ma, Y. Leakage current and self-discharge in lithium-ion capacitor. J. Electroanal. Chem. 2019, 850, 113386. [Google Scholar] [CrossRef]
  27. Ishimoto, S.; Asakawa, Y.; Shinya, M.; Naoi, K. Degradation responses of activated-carbon-based EDLCs for higher voltage operation and their factors. J. Electrochem. Soc. 2009, 156, A563. [Google Scholar] [CrossRef]
  28. An, Z.; Xu, X.; Fan, L.; Yang, C.; Xu, J. Investigation of Electrochemical Performance and Gas Swelling Behavior on Li4Ti5O12/Activated Carbon Lithium-Ion Capacitor with Acetonitrile-Based and Ester-Based Electrolytes. Electronics 2021, 10, 2623. [Google Scholar] [CrossRef]
  29. Cao, W.; Li, Q.; Yu, X.; Li, H. Controlling Li deposition below the interface. eScience 2022, 2, 47. [Google Scholar] [CrossRef]
  30. Fernandes, Y.; Bry, A.; de Persis, S. Thermal degradation analyses of carbonate solvents used in Li-ion batteries. J. Power Sources 2019, 414, 250. [Google Scholar] [CrossRef]
  31. Wang, Q.; Mao, B.; Stoliarov, S.I.; Sun, J. A review of lithium ion battery failure mechanisms and fire prevention strategies. Prog. Energy Combust. Sci. 2019, 73, 95. [Google Scholar] [CrossRef]
  32. Fernandes, Y.; Bry, A.; de Persis, S. Identification and quantification of gases emitted during abuse tests by overcharge of a commercial Li-ion battery. J. Power Sources. 2018, 389, 106. [Google Scholar] [CrossRef]
Figure 1. Galvanostatic charging and discharging curves of AC//Li half-cells upon the voltage ranges from pzc to various vertex voltages in different Li-ion electrolytes: (a) EDD, (c) EPD, and (e) PCE; the corresponding EE, CE, and VE values as functions of the vertex voltage: (b) EDD, (d) EPD, and (f) PCE.
Batteries 09 00011 g001
Figure 2. Overcharged to 5.0 V of AC//Li half-cells using EDD, EPD, and PCE electrolytes, respectively: (a) Voltage versus time curves, (b) dQ/dV versus voltage curves.
Batteries 09 00011 g002
Figure 3. Overcharged to 10.0 V of AC//Li half-cells: (a) voltage versus time profiles, and photos of the half-cells after overcharging process with different electrolytes: (b) EPD, (c) PCE and (d) EDD.
Batteries 09 00011 g003
Figure 4. SEM images of (a) fresh AC electrode and the AC electrodes from the AC//Li half-cell charged to the high voltage of 10.0 V with different electrolytes; (b,c) PCE; (d) EPD.
Batteries 09 00011 g004
Figure 5. EDS spectra of AC electrodes obtained from the AC//Li half-cell with PCE electrolyte after overcharging to the high voltage of 10.0 V: (a) zone 1; (b) zone 2.
Batteries 09 00011 g005
Figure 7. (a,b) SEM image of AC electrode after overcharging, and (c) EDS analysis.
Batteries 09 00011 g007
Figure 8. Schematic diagram of the decomposition of electrolyte on AC surface upon overcharging.
Batteries 09 00011 g008
Disclaimer/Publisher’s Note: The statements, opinions and data contained in all publications are solely those of the individual author(s) and contributor(s) and not of MDPI and/or the editor(s). MDPI and/or the editor(s) disclaim responsibility for any injury to people or property resulting from any ideas, methods, instructions or products referred to in the content.

