
Production and Characterization of Poly(3-hydroxybutyrate) from Halomonas boliviensis LC1 Cultivated in Hydrolysates of Quinoa Stalks

 , , , , , , ,
  ,
,  and
and 
Abstract
:1. Introduction
2. Materials and Methods
2.1. Microorganism
2.2. Raw Material
2.3. Preparation of the Cellulosic Hydrolysate
2.3.1. Sulfuric Acid-Catalyzed Hydrothermal Pretreatment
2.3.2. Enzymatic Saccharification
2.4. Media
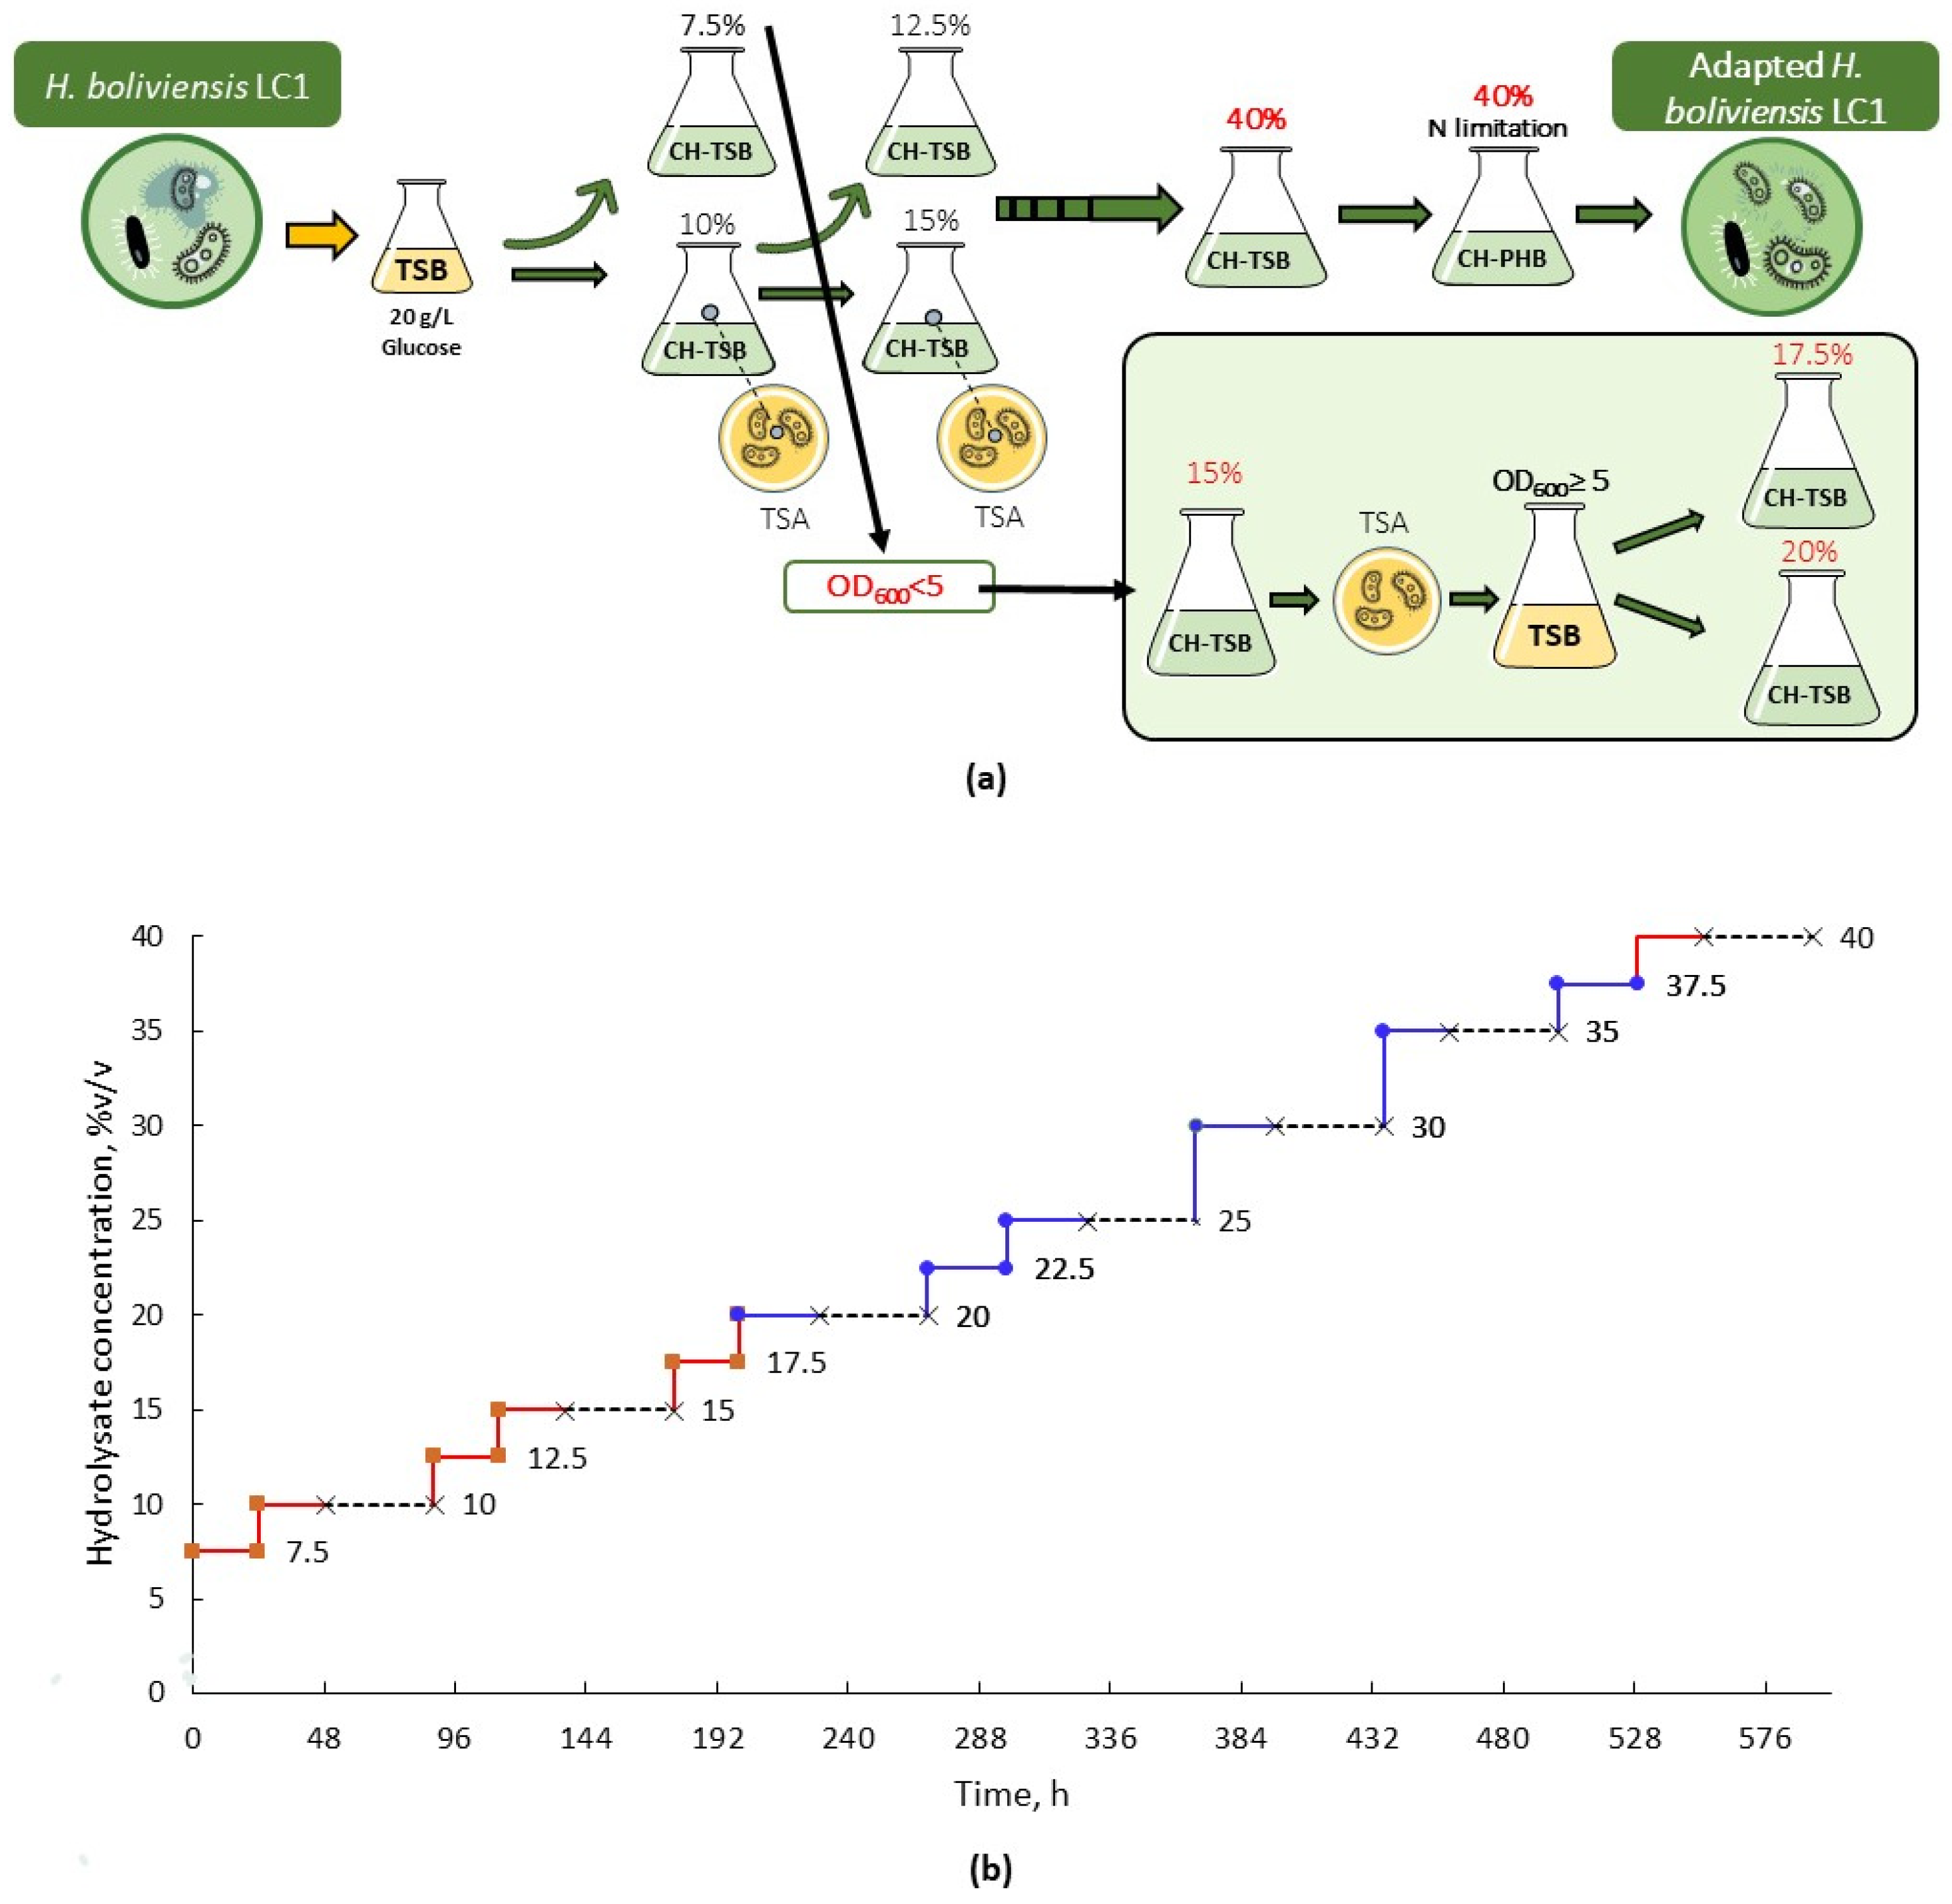
2.5. Adaptation
2.6. Bacterial Cultivation
2.7. Isolation, Purification, and Quantification of the PHB
2.8. Analysis of the Hydrolysates and Cultivation Samples
2.9. Calculations
2.10. Characterization of PHB
2.10.1. High-Performance Size-Exclusion Chromatography (HPSEC)
2.10.2. Fourier Transform Infrared (FTIR) Spectroscopy
2.10.3. 1H nuclear Magnetic Resonance (NMR) Spectroscopy
2.10.4. Scanning Electron Microscopy (SEM)
2.10.5. X-ray Diffraction (XRD)
2.10.6. Thermogravimetric Analysis (TGA)
3. Results and Discussion
3.1. Adaptation of H. boliviensis LC1 to Cellulosic Hydrolysate
3.2. Cultivation of the Adapted H. boliviensis LC1 in Synthetic Media and Cellulosic Hydrolysates
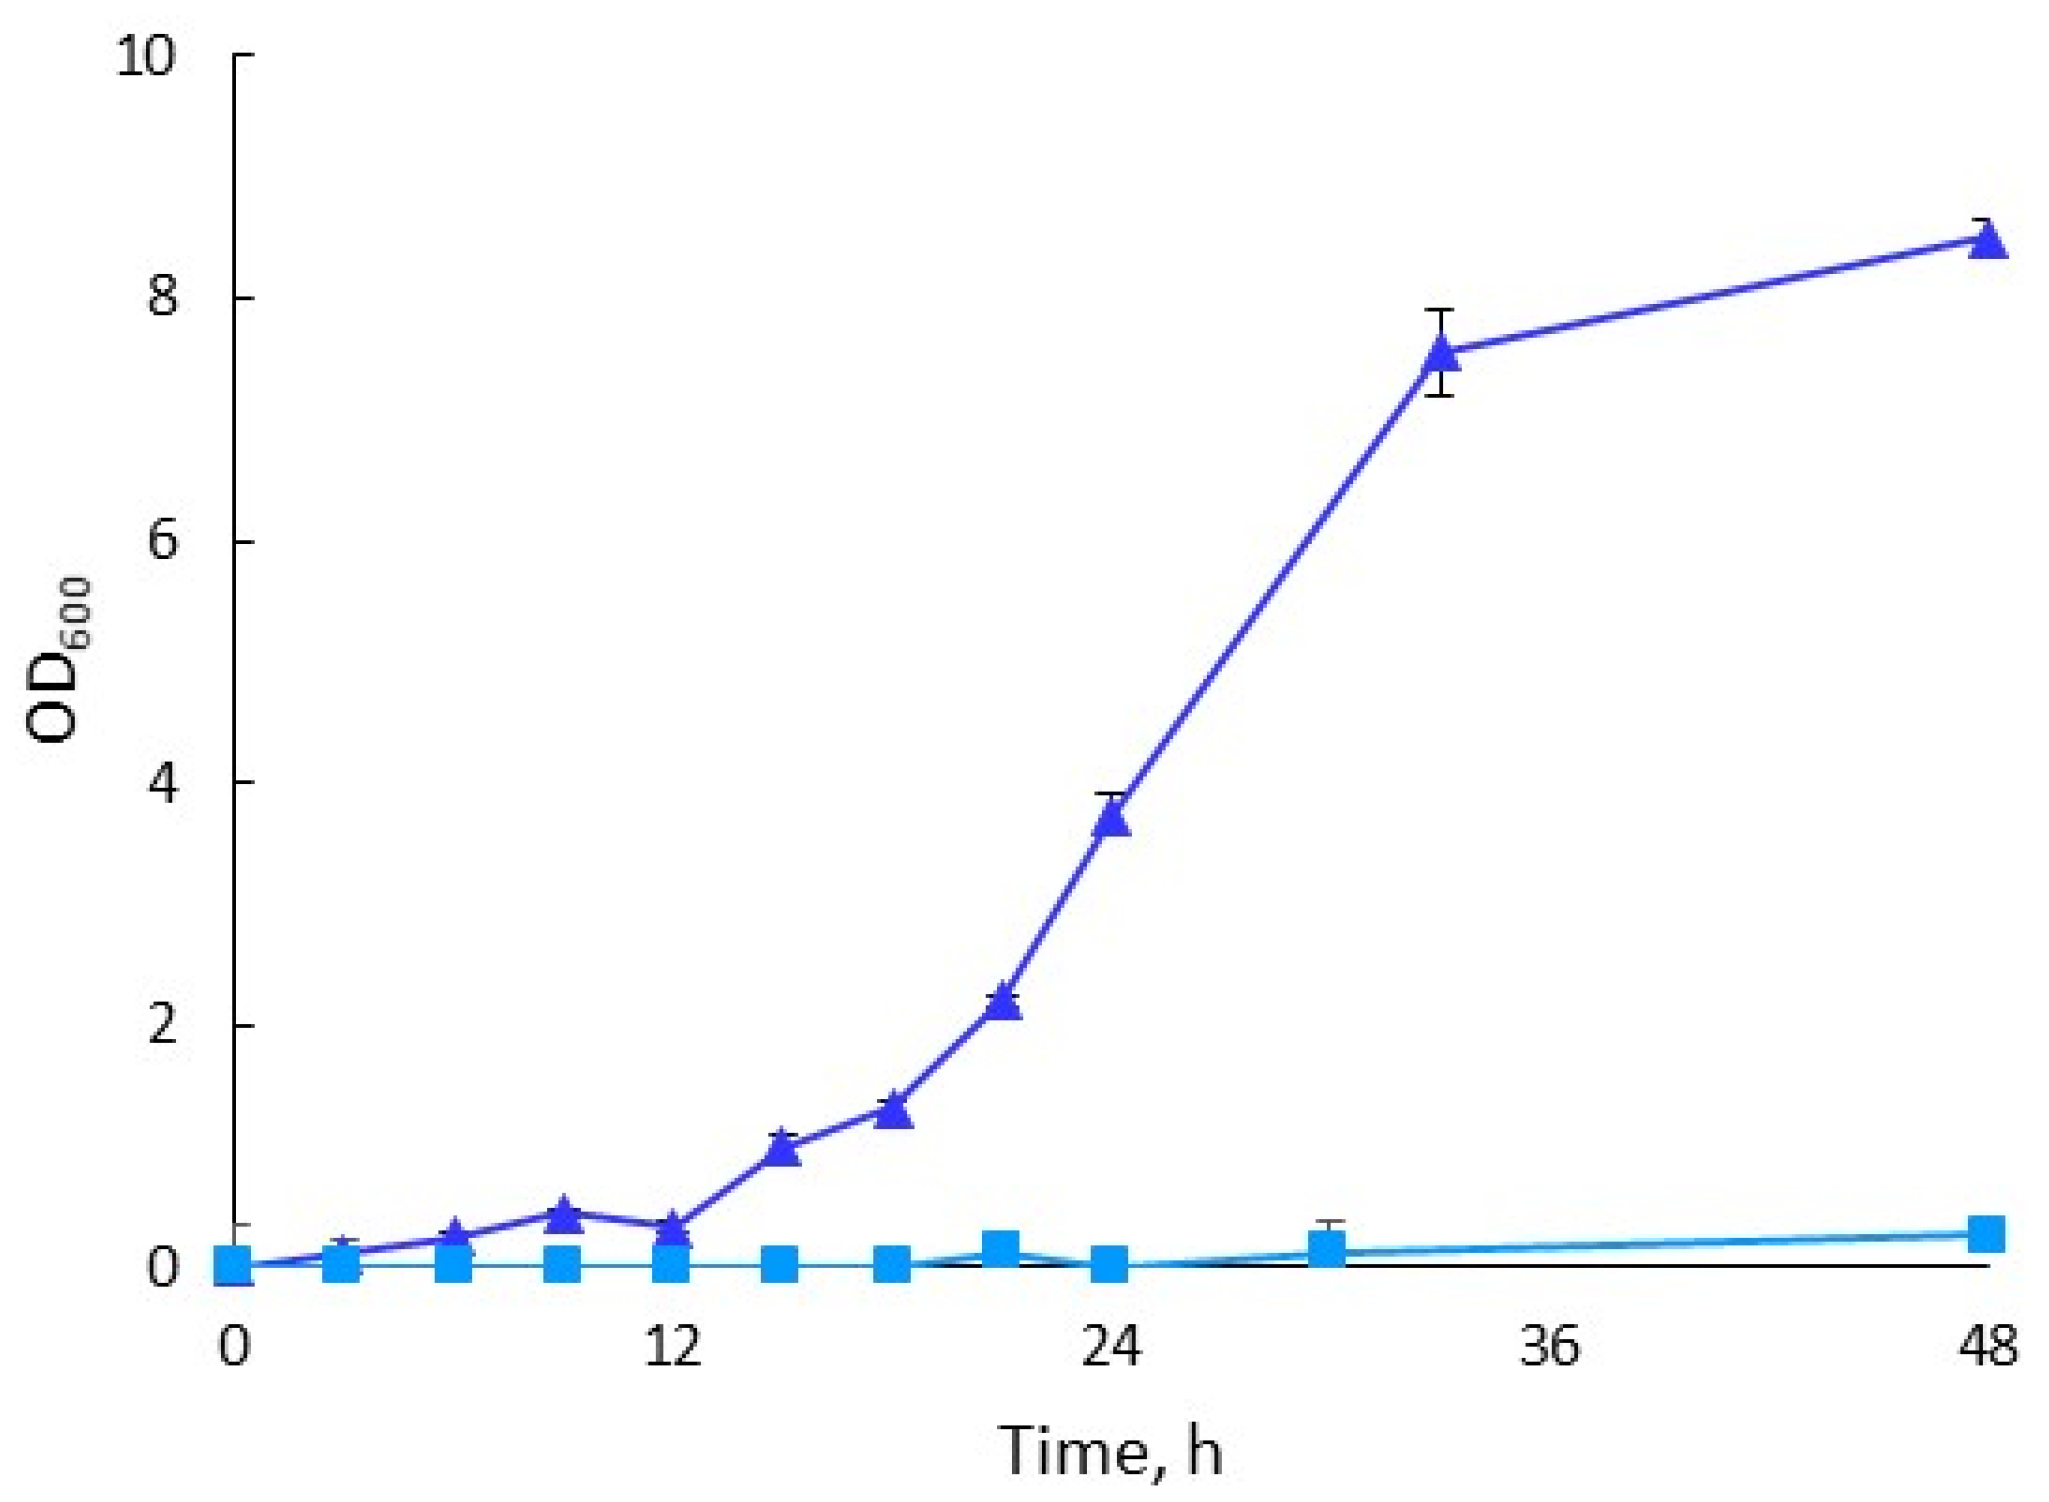
3.2.1. Comparison of Bacterial Growth and PHB Formation in Synthetic- and Hydrolysate-Based Media
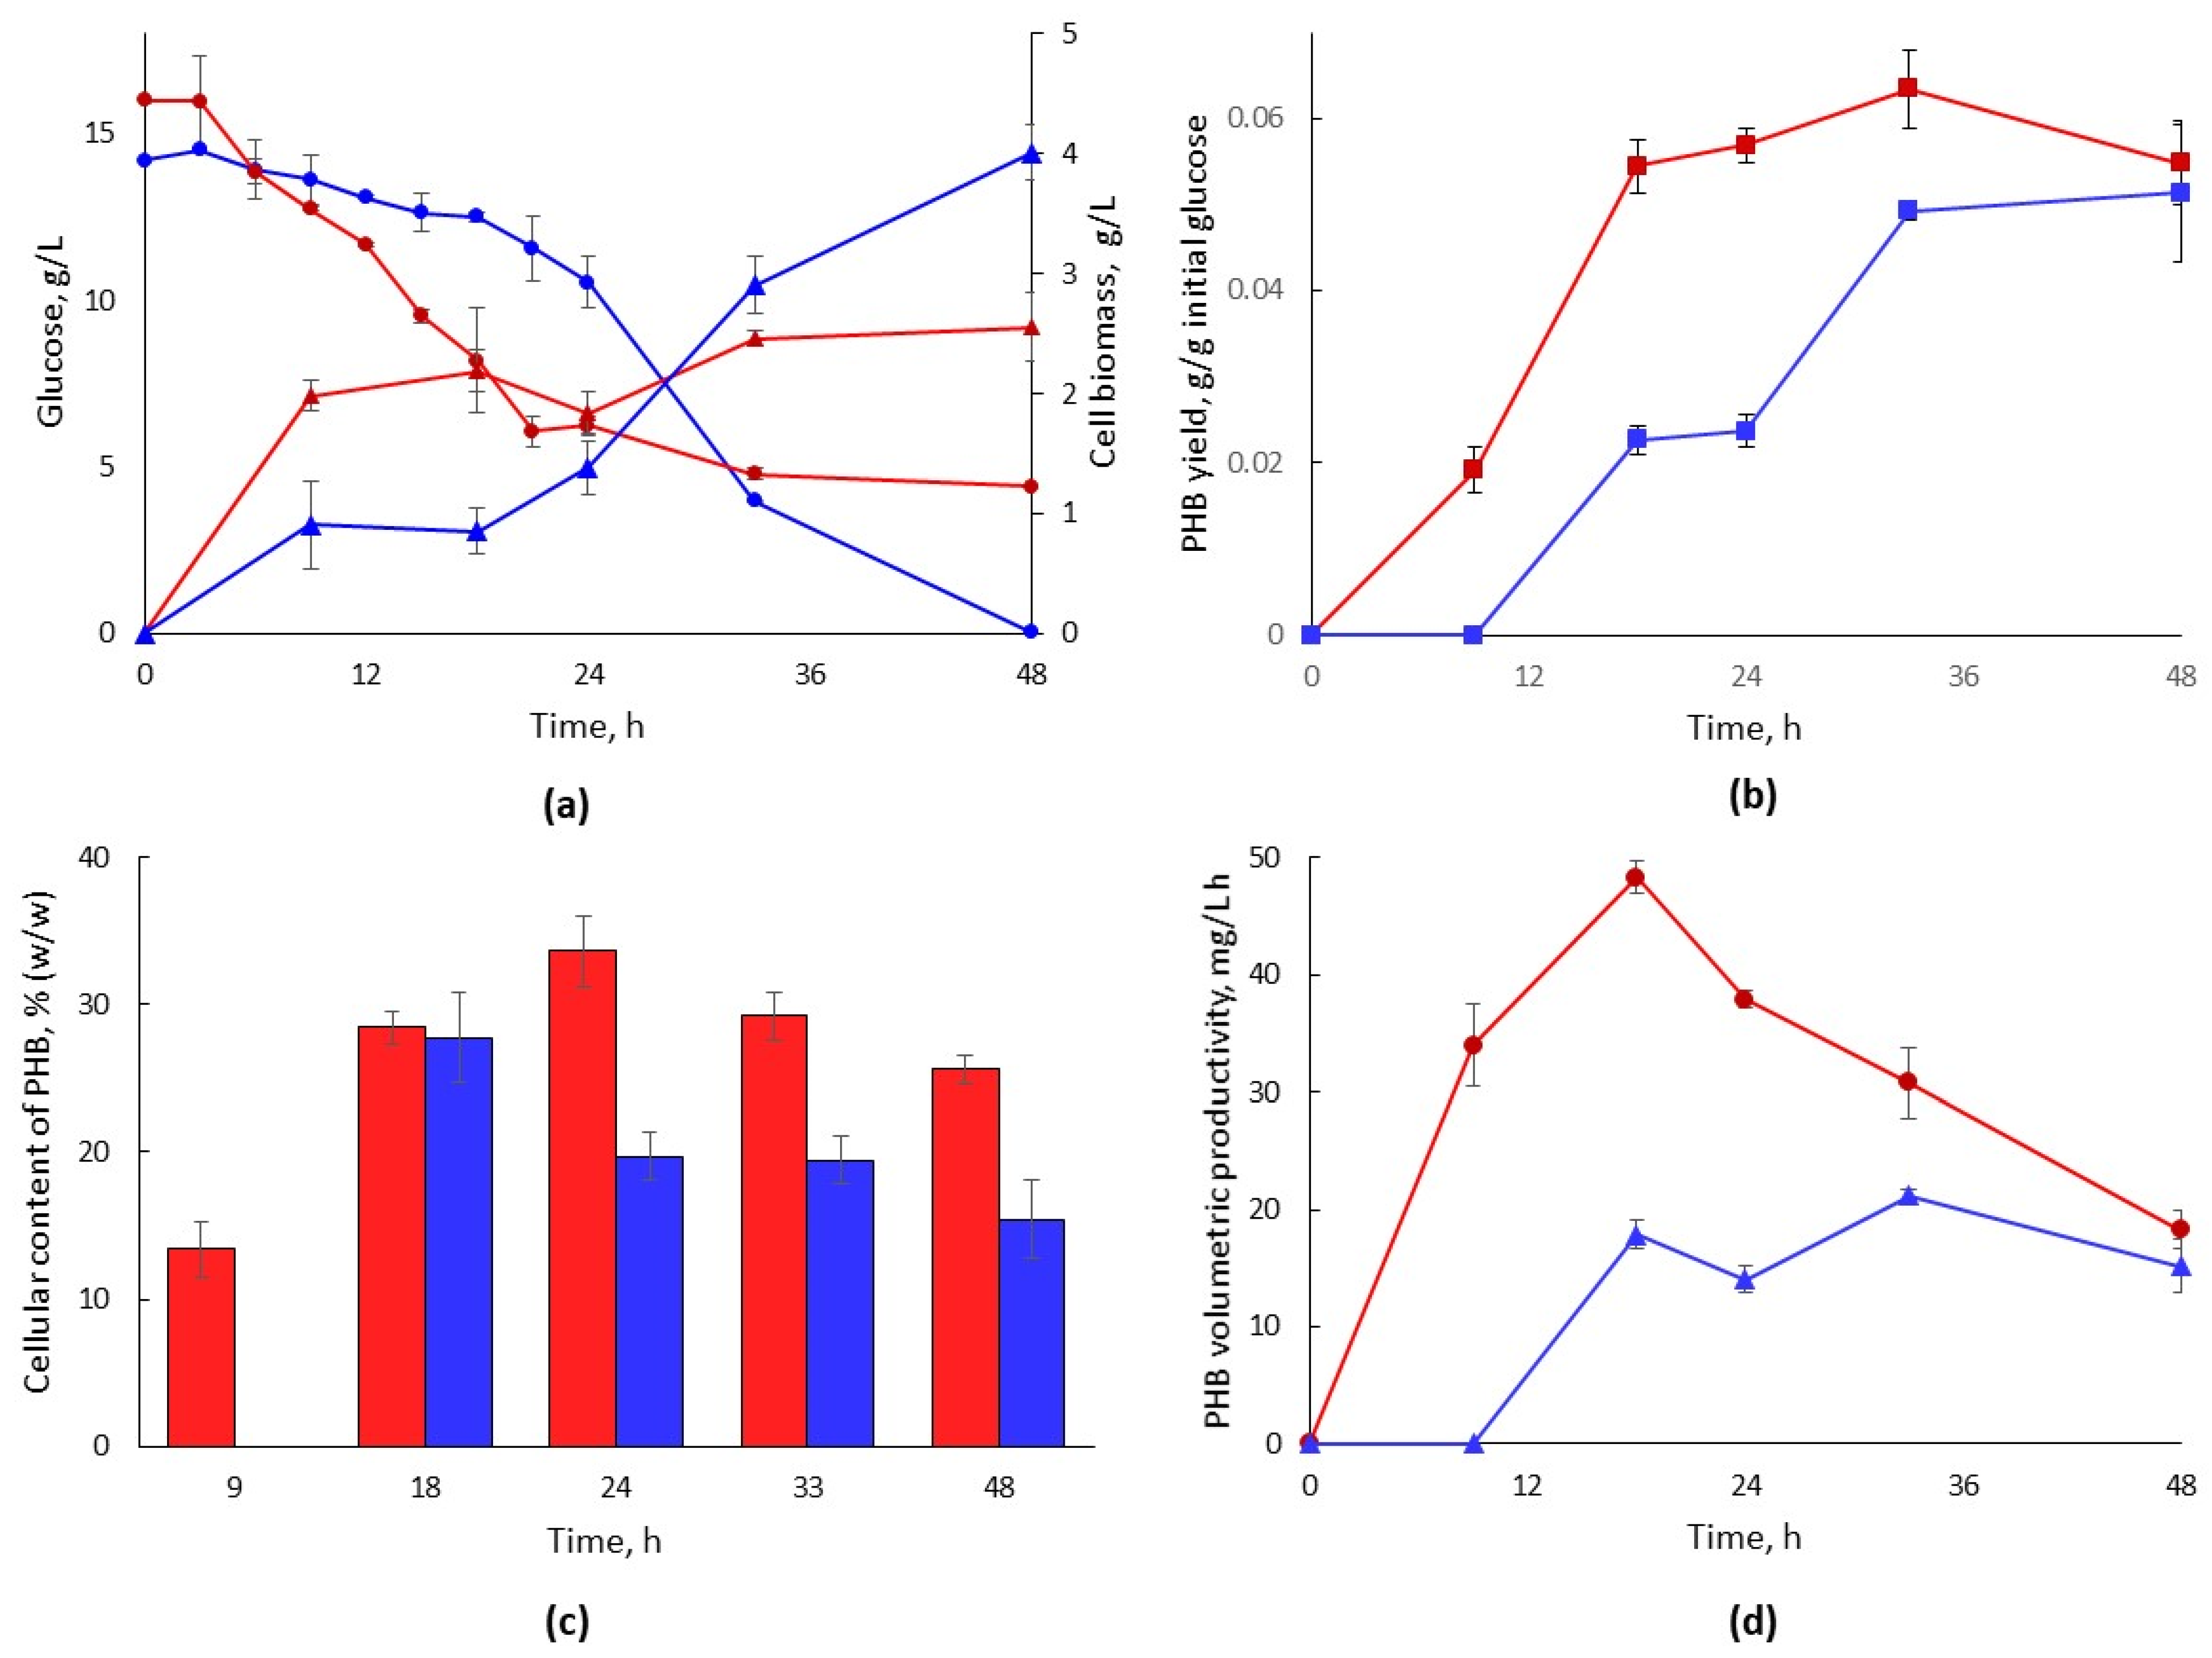
3.2.2. Bacterial Growth and PHB Formation in Hydrolysate-Based Media with Different Glucose Concentrations
3.2.3. PHB Production and Isolation for Characterization
3.3. PHB Characterization
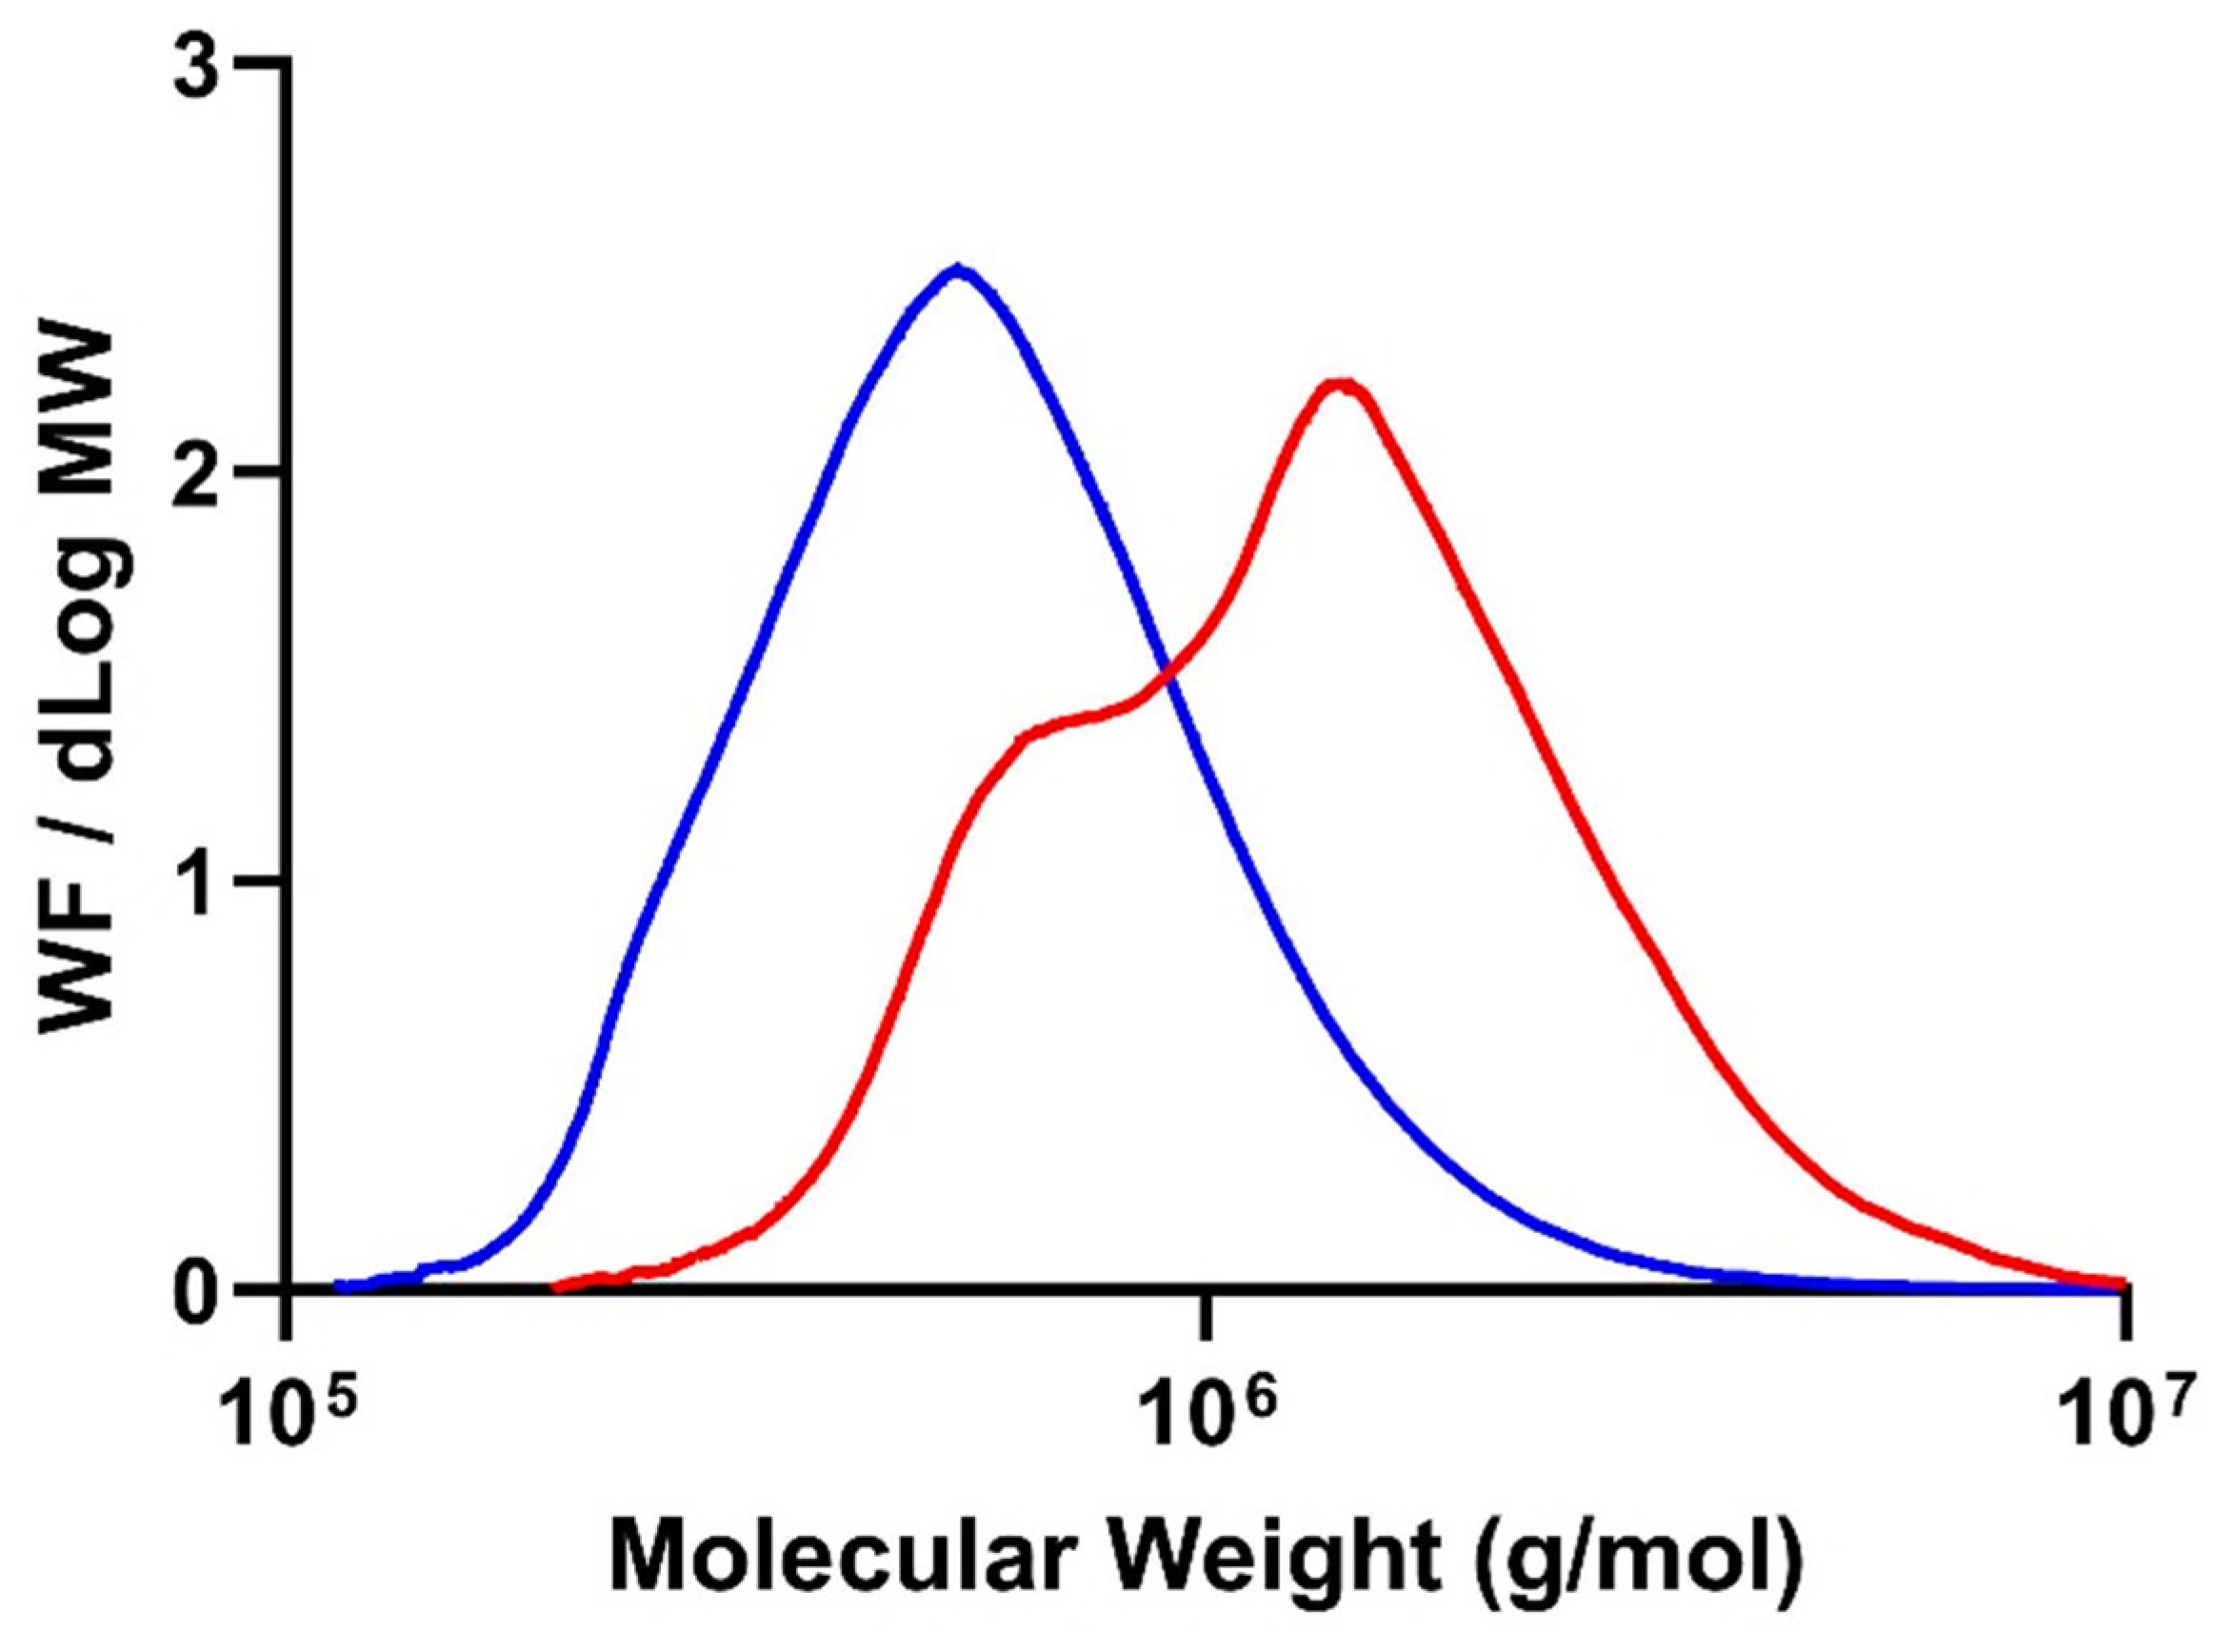
3.3.1. High-Performance Size-Exclusion Chromatography (HPSEC)
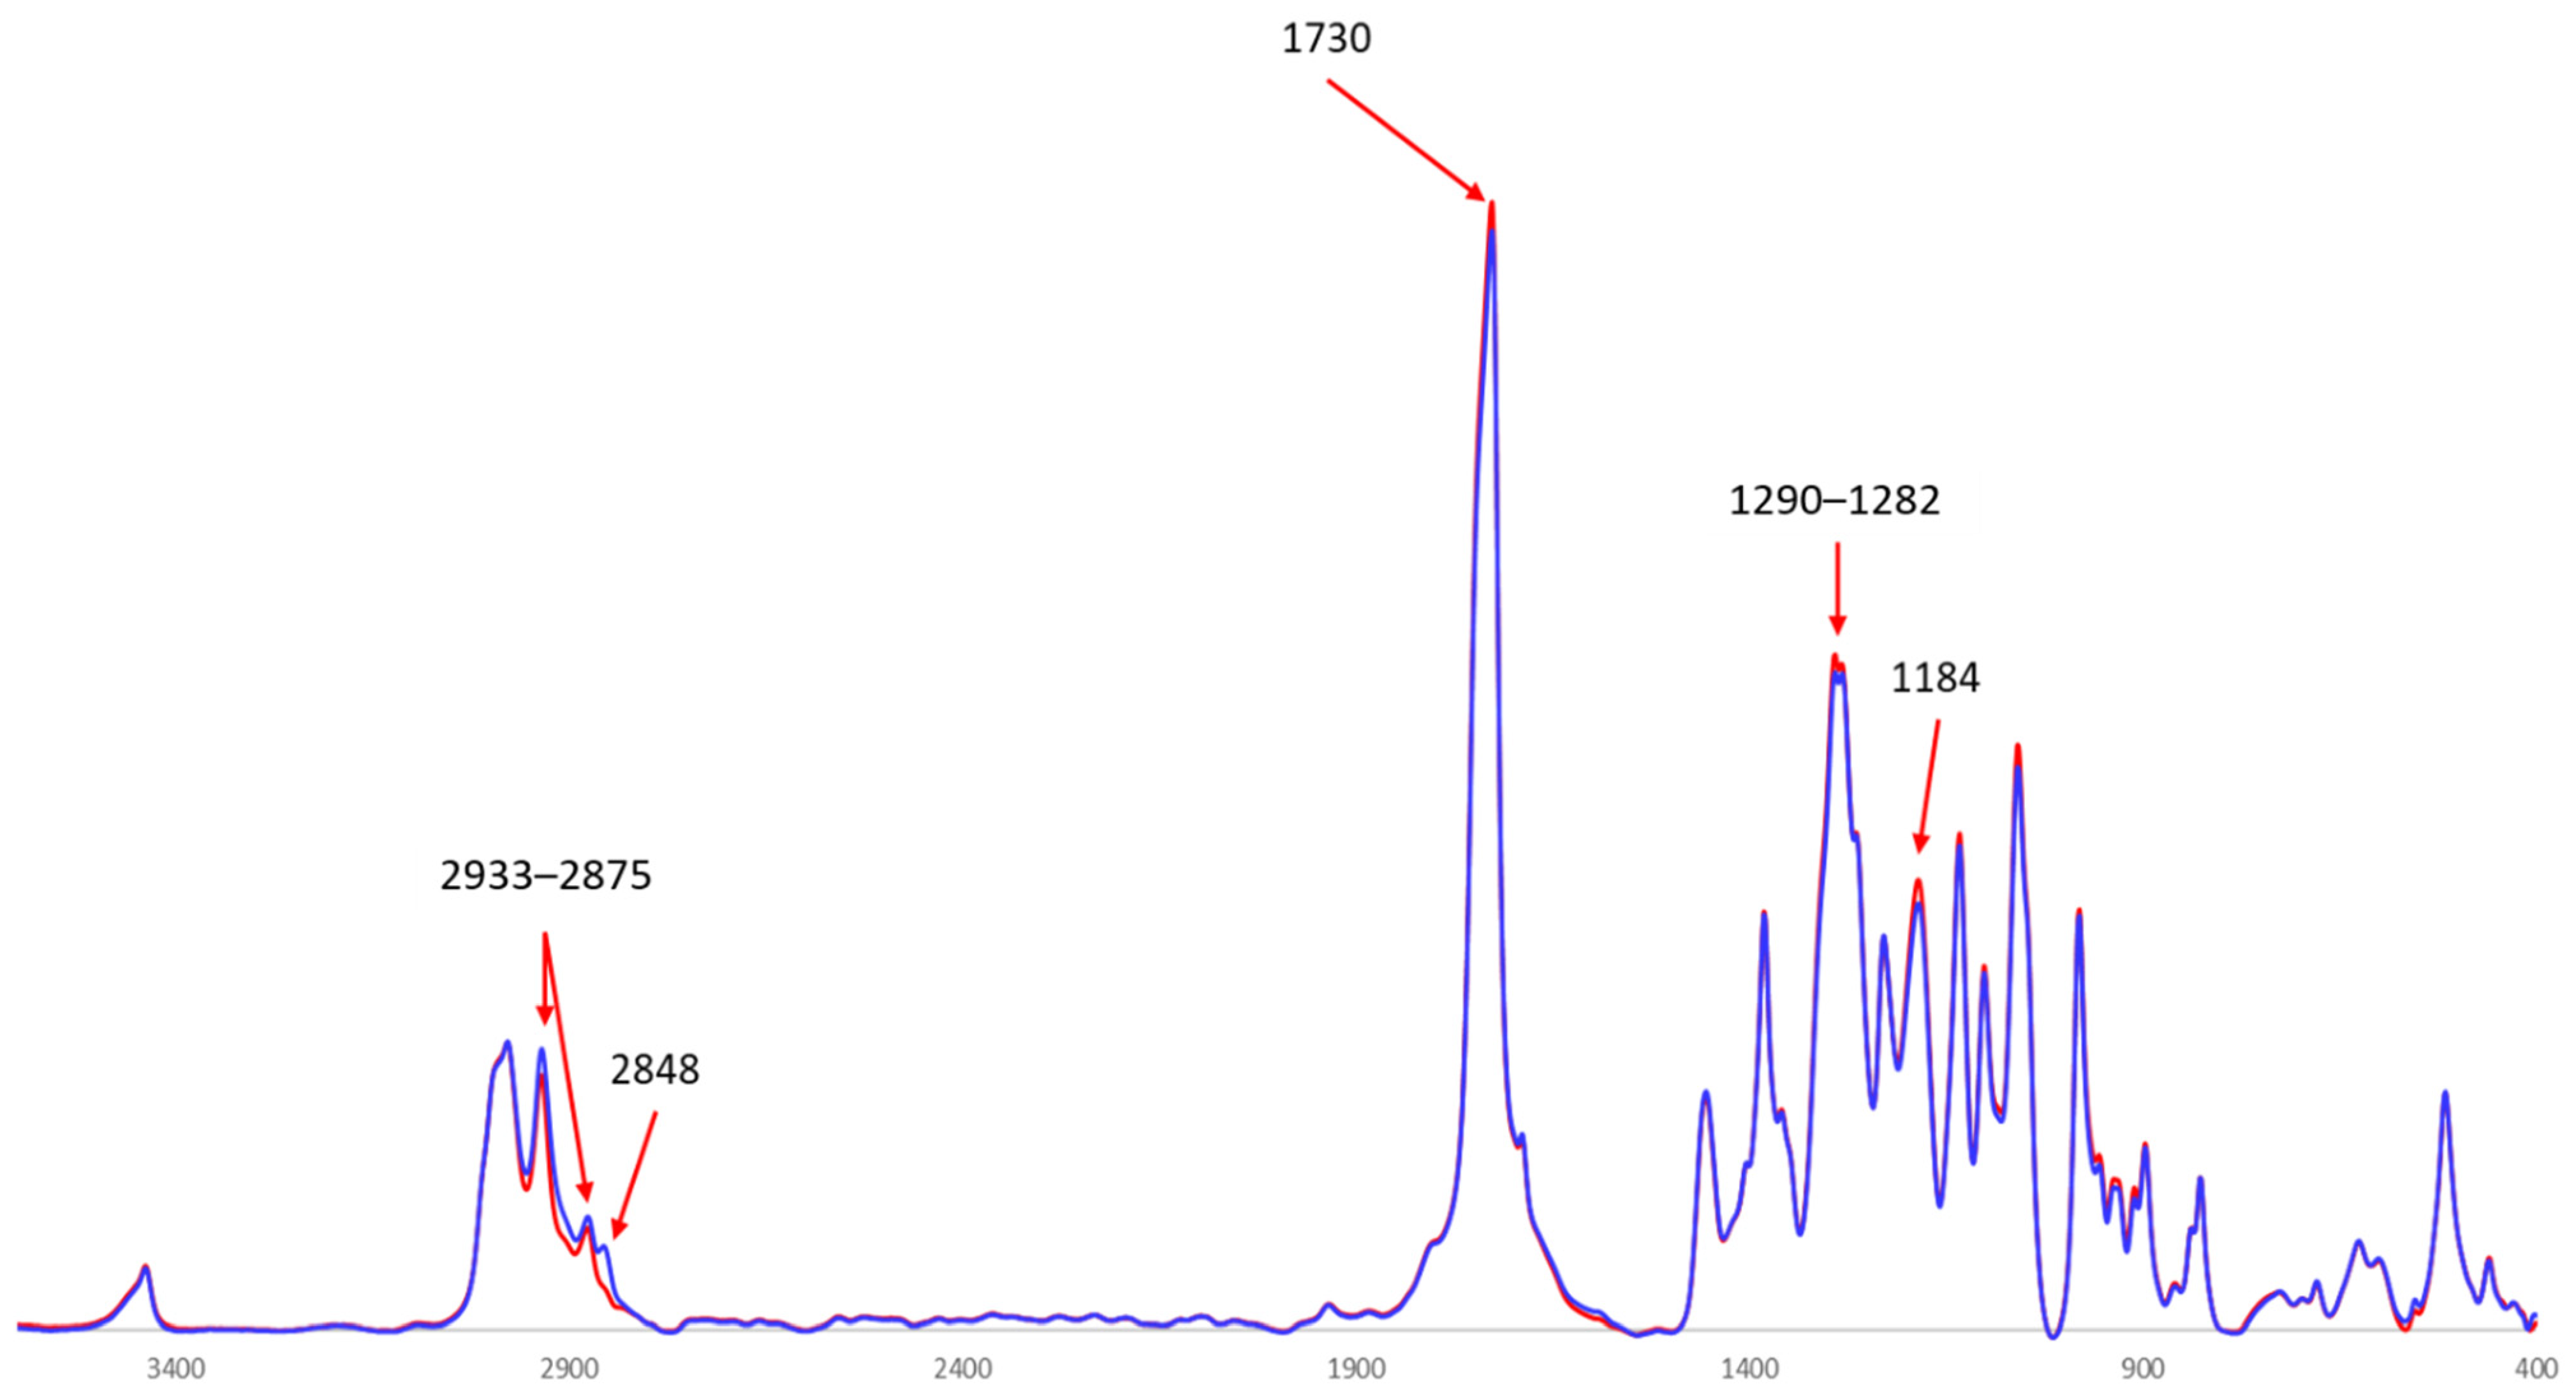
3.3.2. Fourier Transform Infrared (FTIR) Spectroscopy
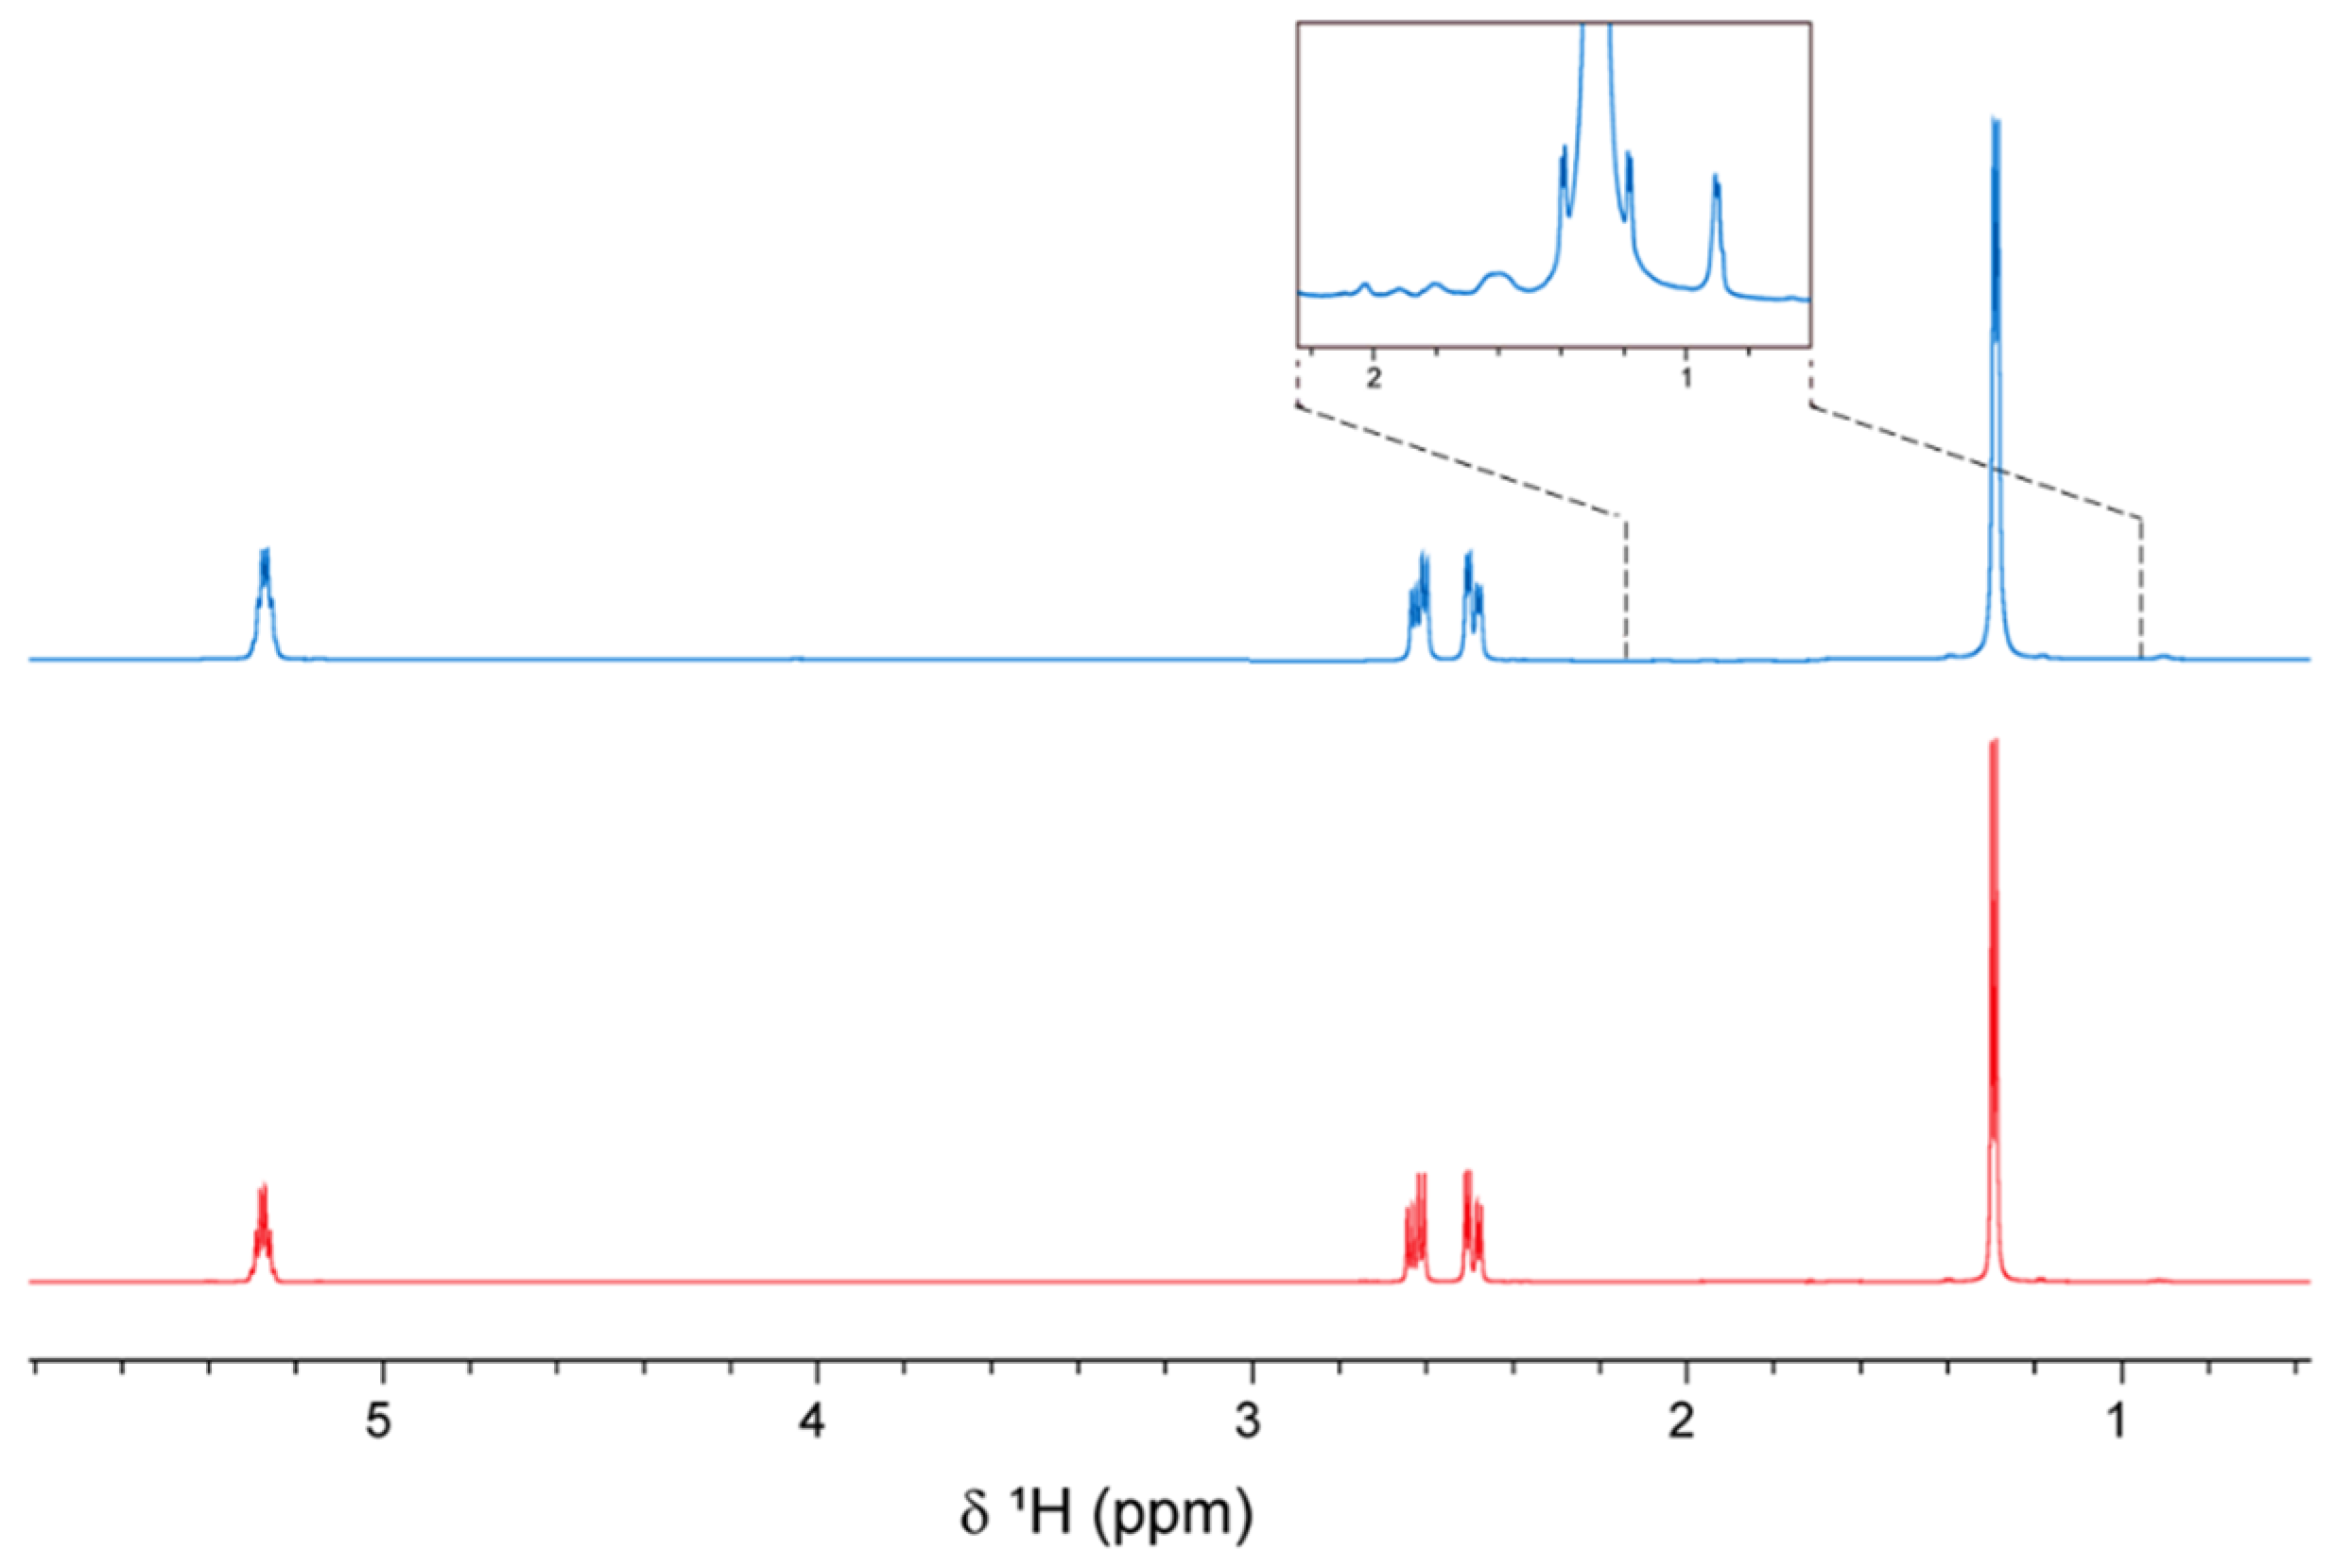
3.3.3. 1H Nuclear Magnetic Resonance (NMR) Spectroscopy
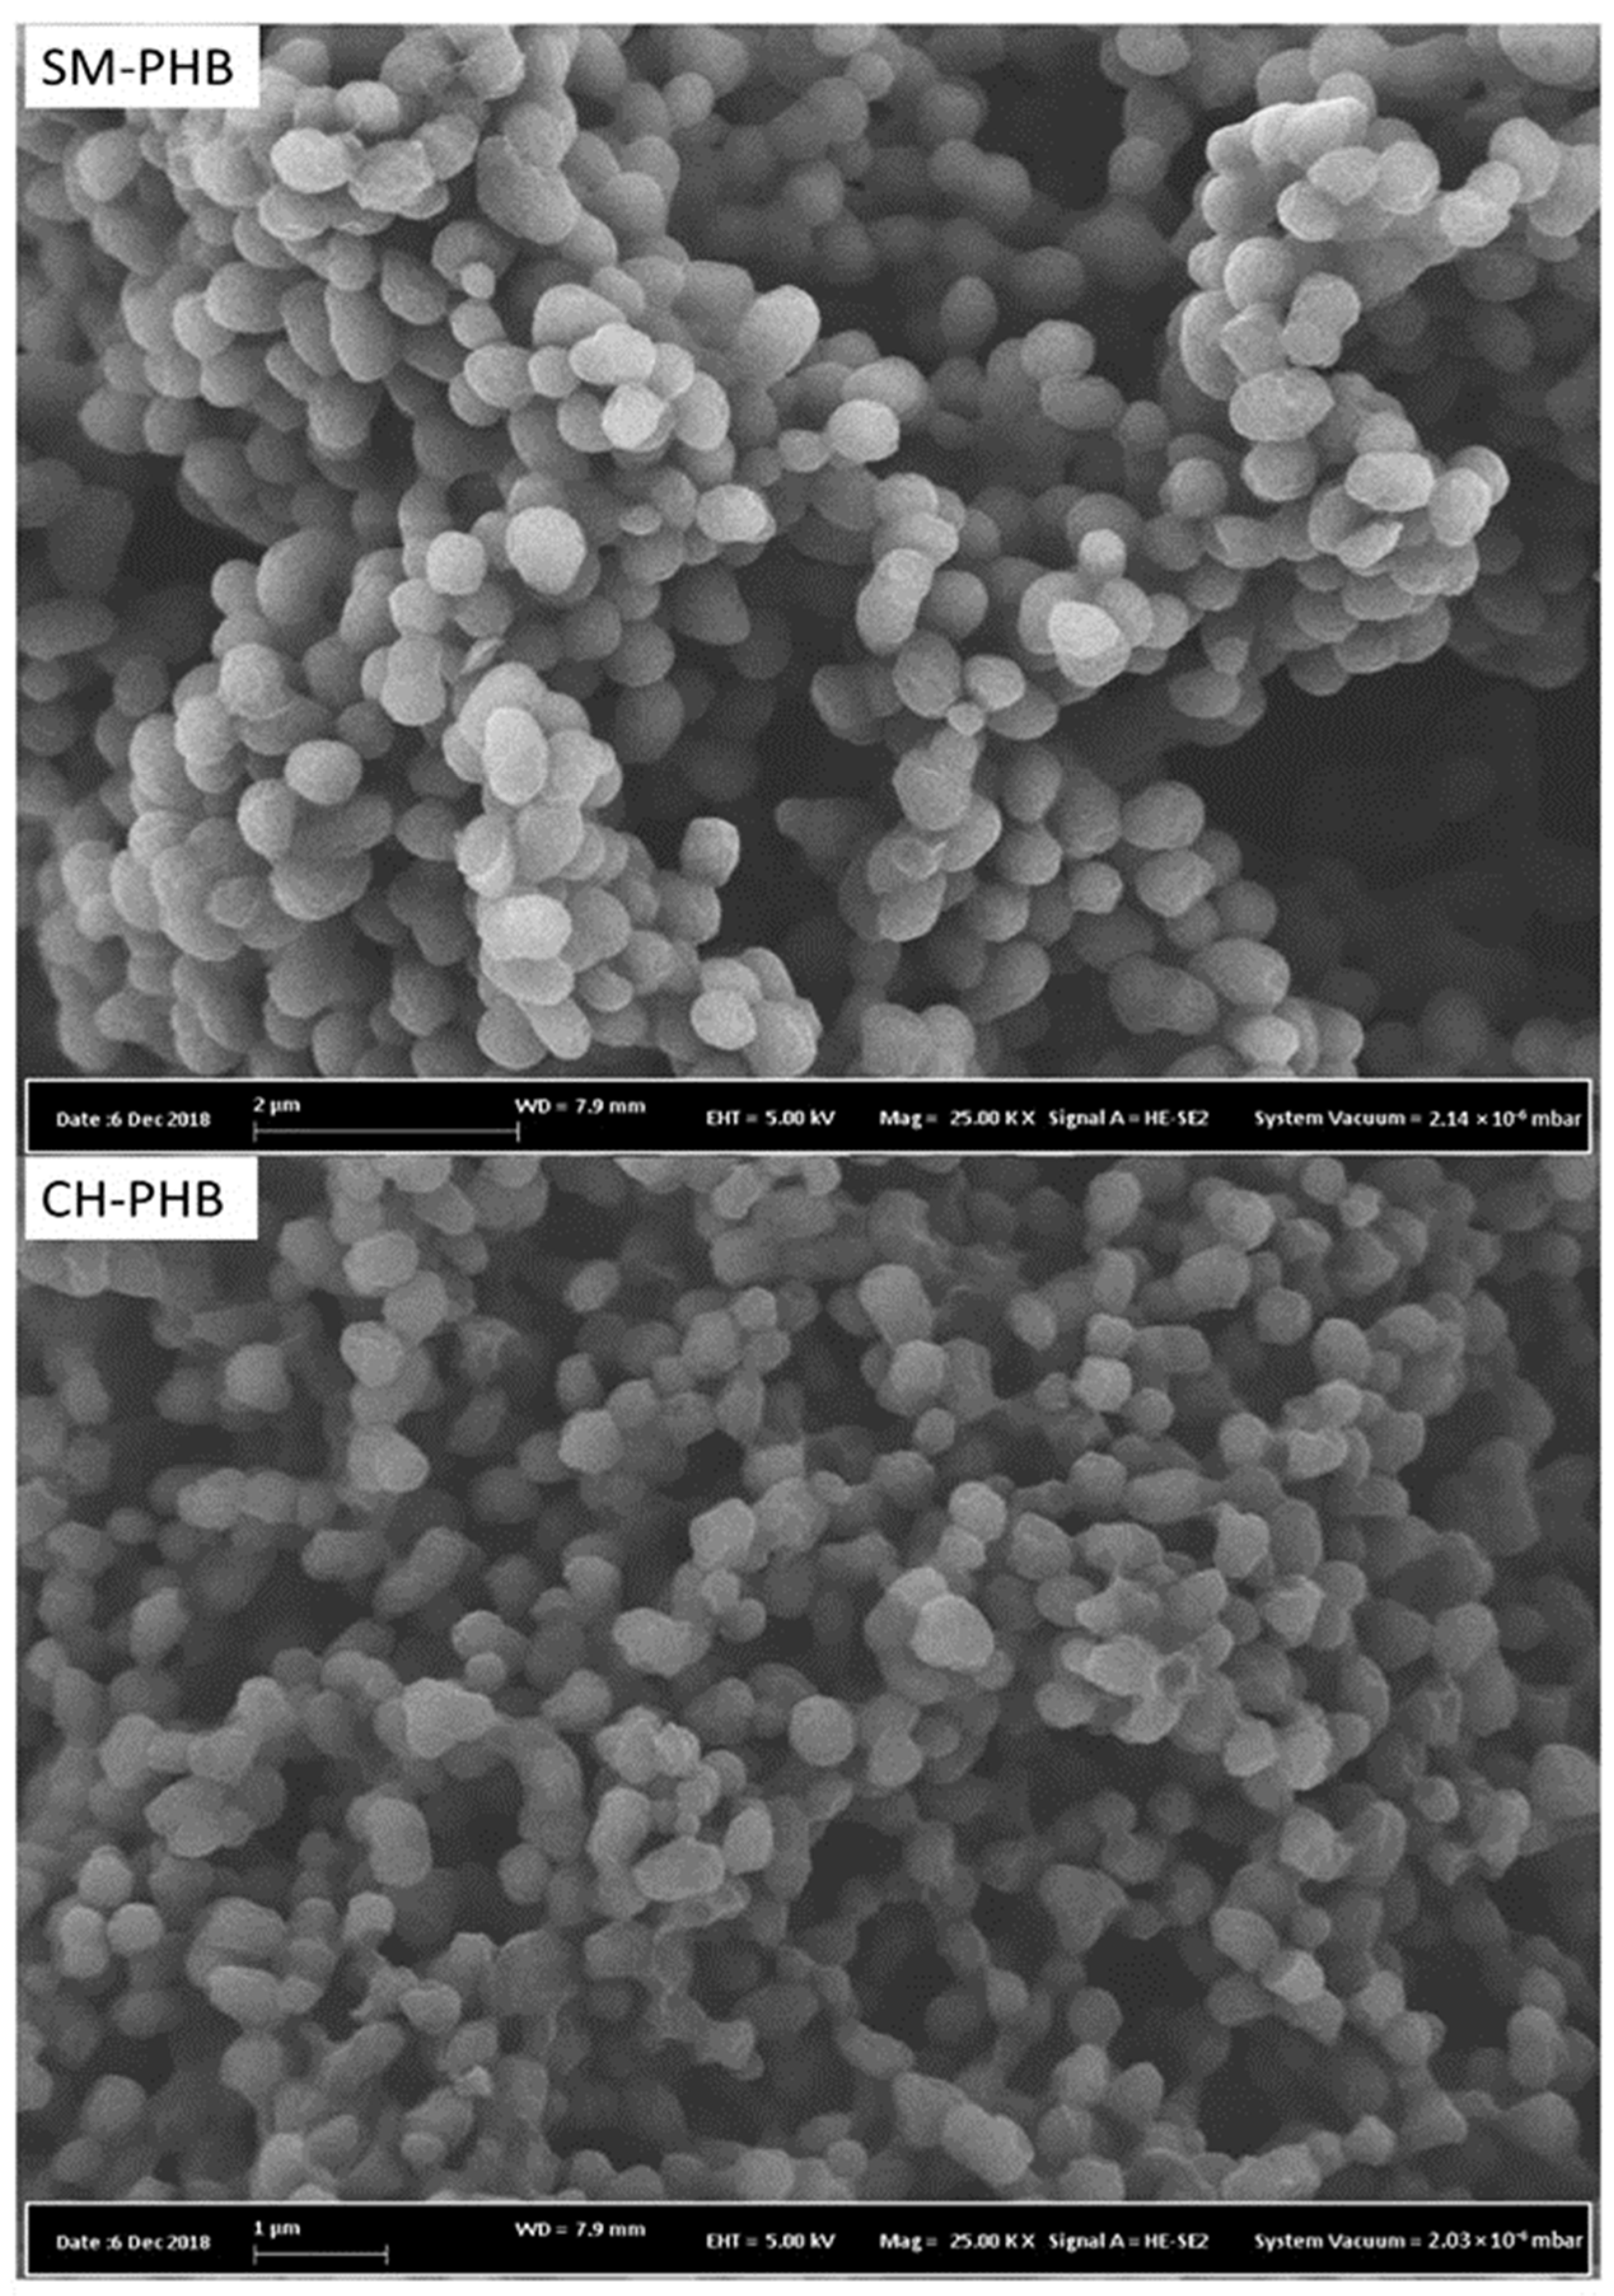
3.3.4. Scanning Electron Microscopy (SEM)
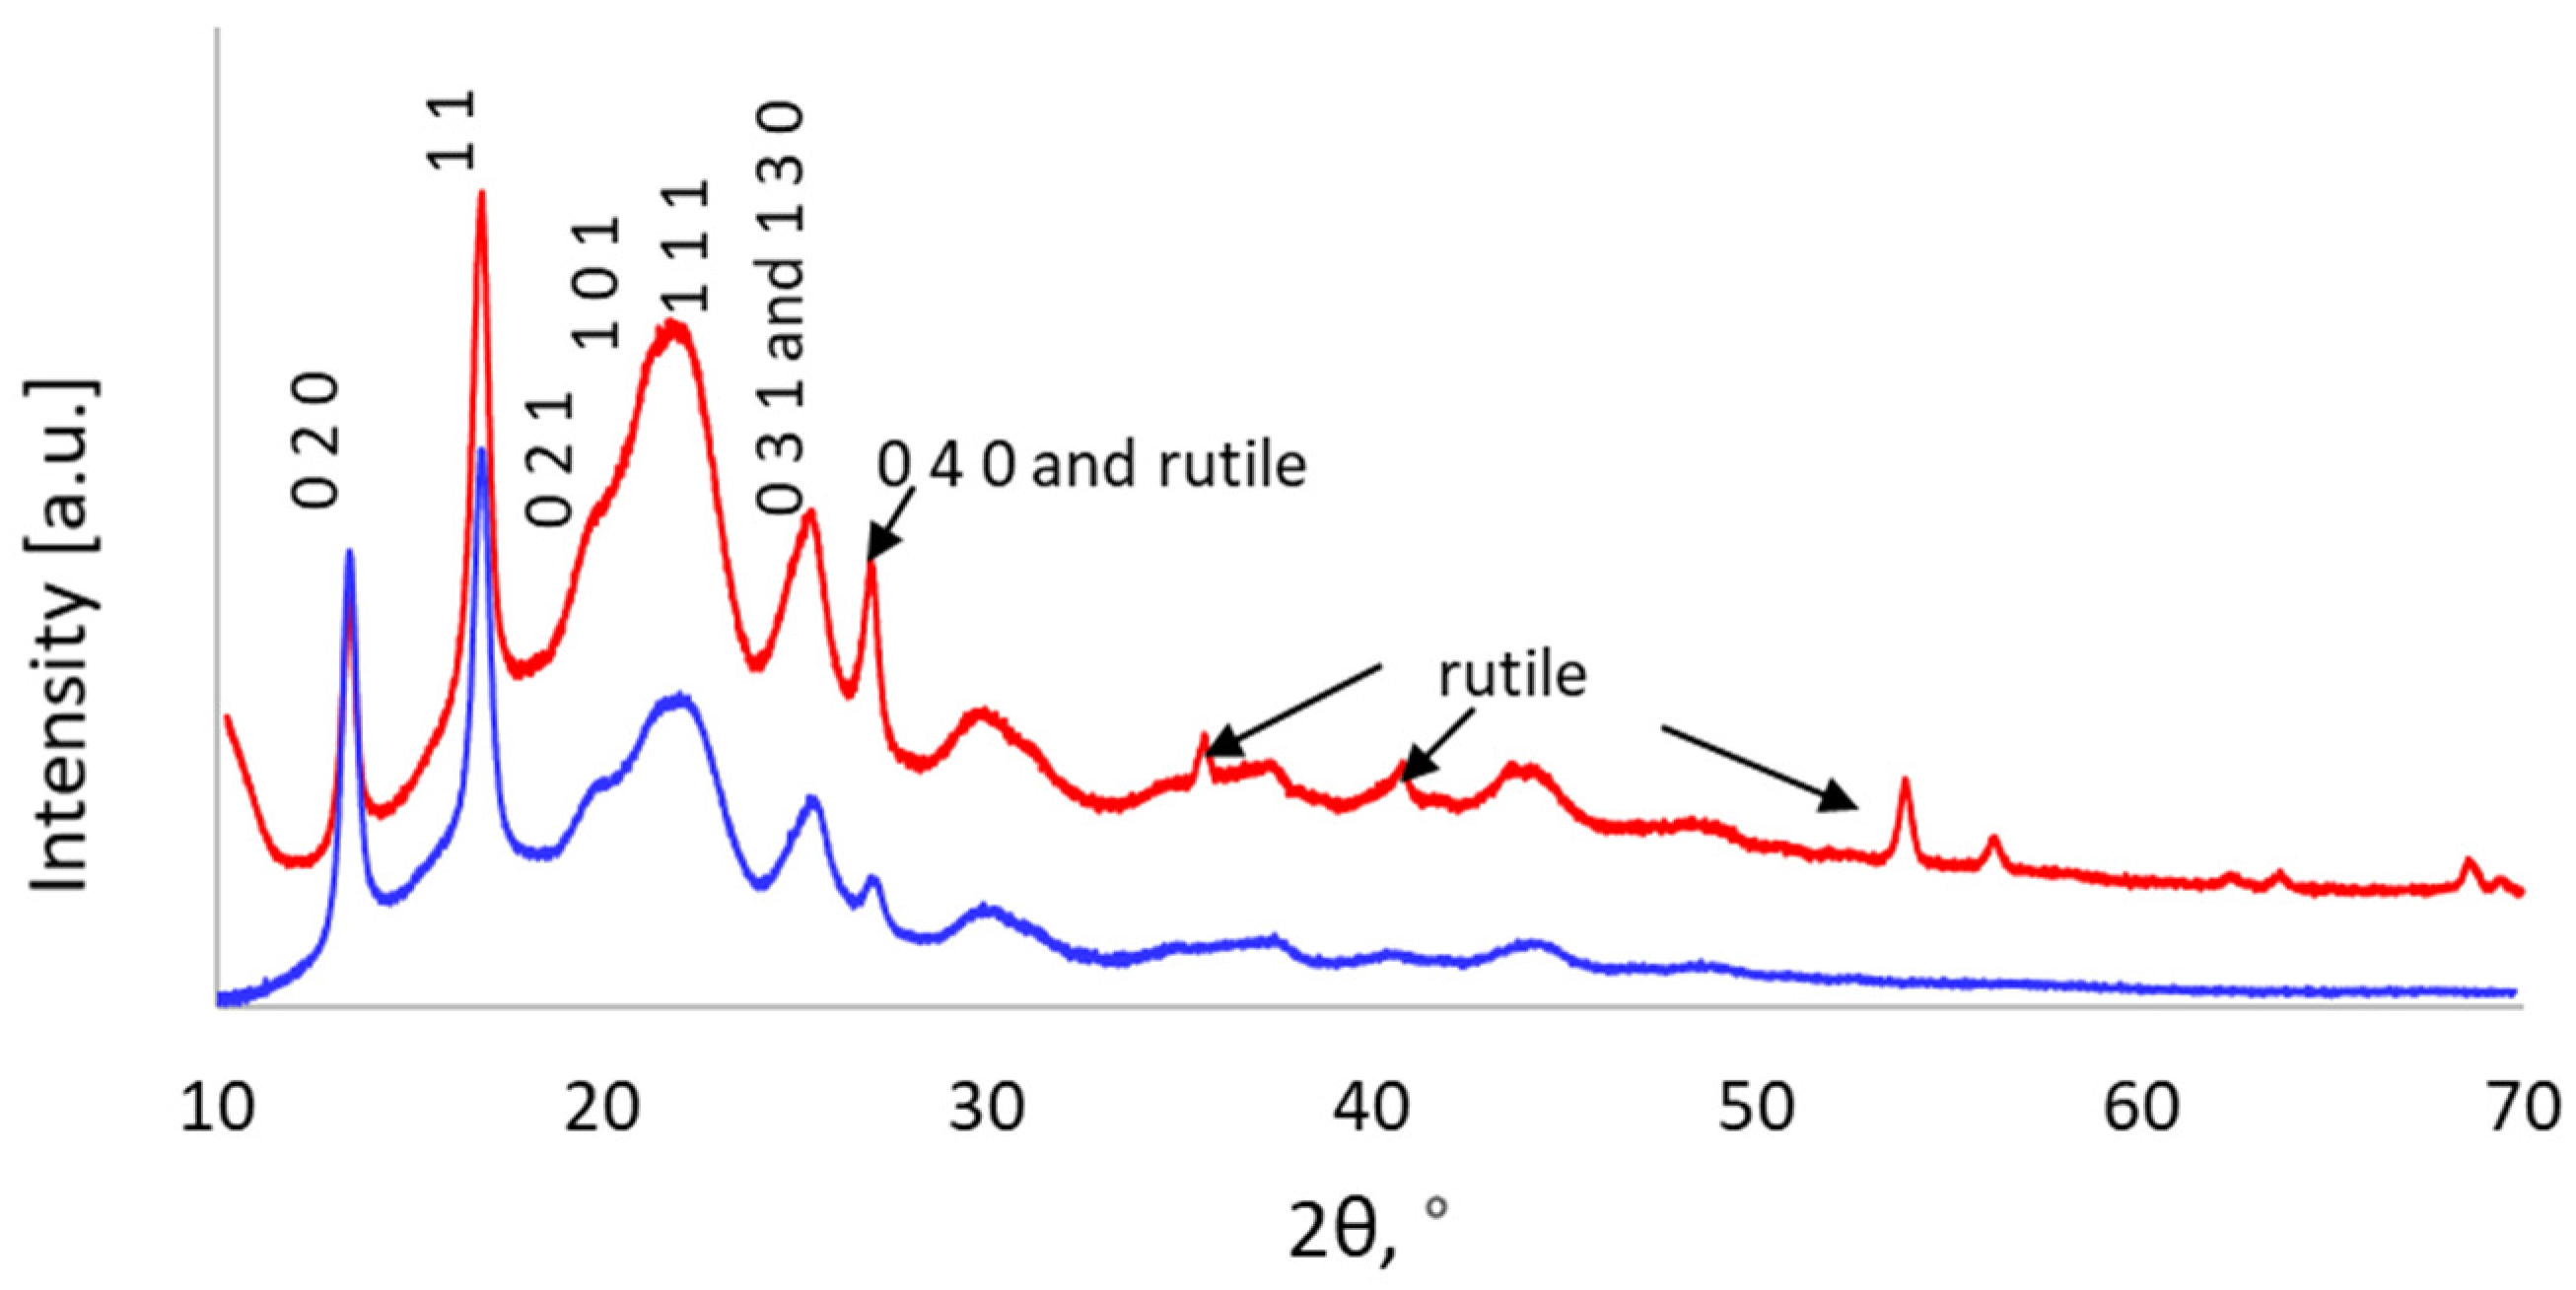
3.3.5. X-ray Diffraction (XRD)
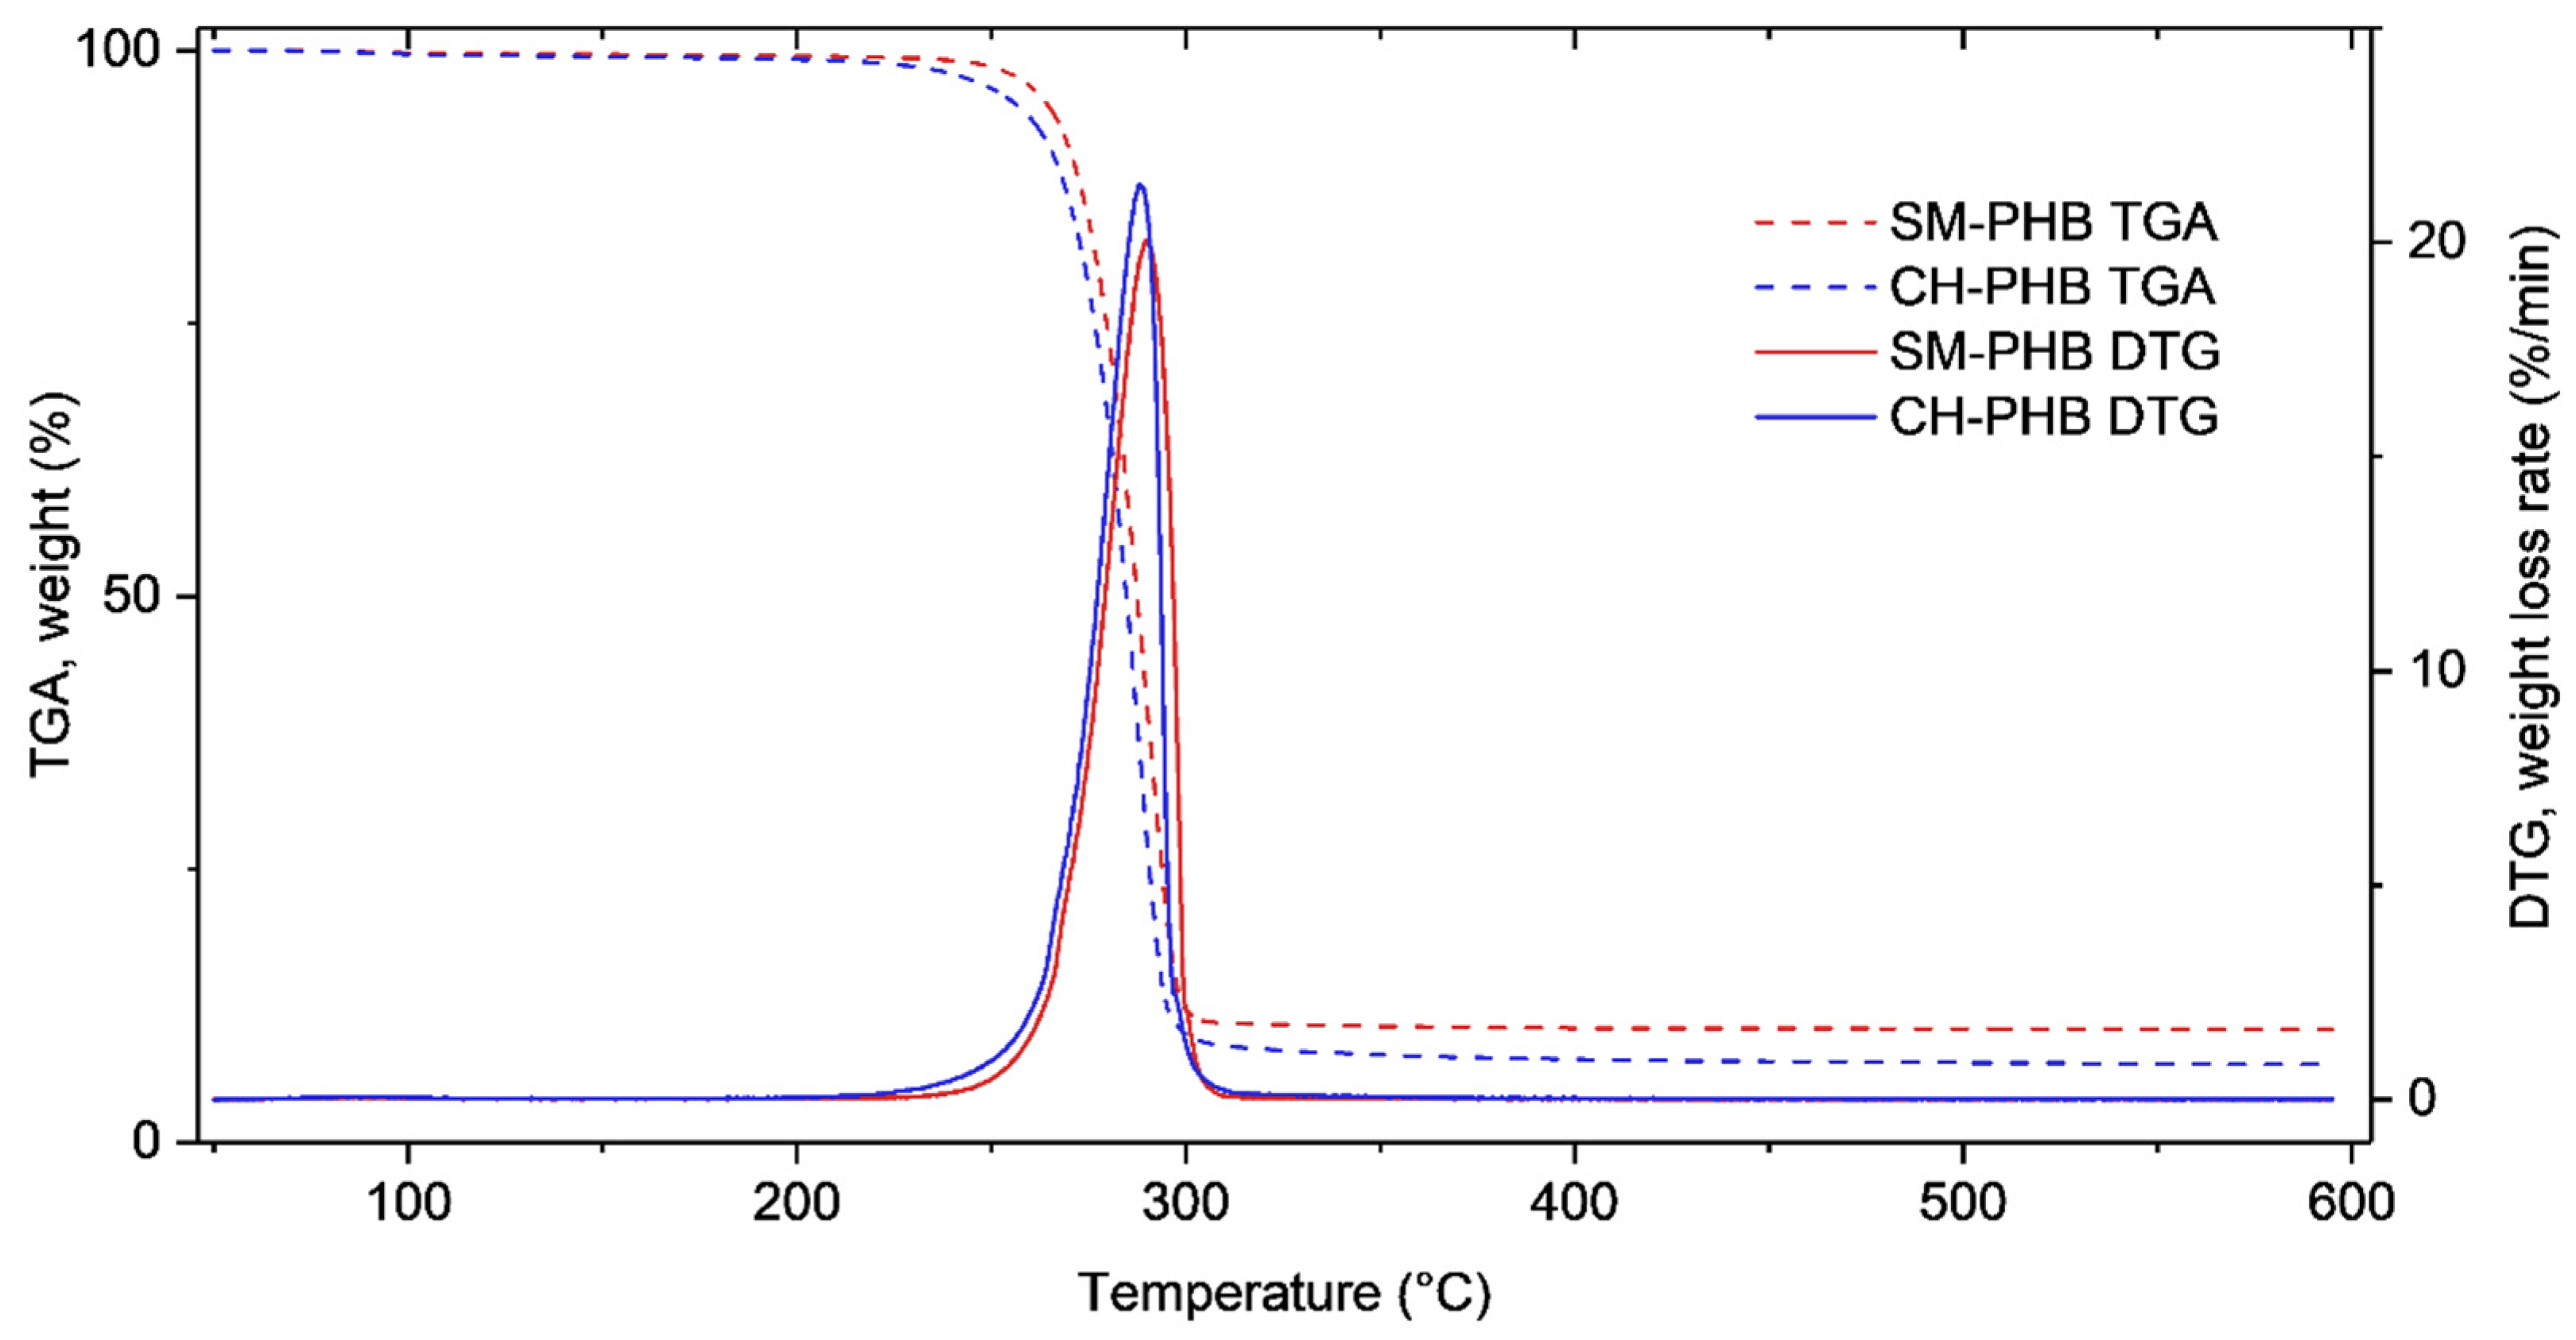
3.3.6. Thermogravimetric Analysis (TGA)
4. Conclusions
Author Contributions
Funding
Institutional Review Board Statement
Informed Consent Statement
Data Availability Statement
Acknowledgments
Conflicts of Interest
References
- Statista. Annual Production of Plastics Worldwide from 1950 to 2021. Available online: https://www.statista.com/statistics/282732/global-production-of-plastics-since-1950/ (accessed on 20 January 2023).
- Benson, N.U.; Bassey, D.E.; Palanisami, T. COVID pollution: Impact of COVID-19 pandemic on global plastic waste footprint. Heliyon 2021, 7, e06343. [Google Scholar] [CrossRef] [PubMed]
- Walker, S.; Rothman, R. Life cycle assessment of bio-based and fossil-based plastic: A review. J. Clean. Prod. 2020, 261, 121158. [Google Scholar] [CrossRef]
- Amobonye, A.; Bhagwat, P.; Singh, S.; Pillai, S. Plastic biodegradation: Frontline microbes and their enzymes. Sci. Total Environ. 2021, 759, 143536. [Google Scholar] [CrossRef] [PubMed]
- Nanda, S.; Patra, B.R.; Patel, R.; Bakos, J.; Dalai, A.K. Innovations in applications and prospects of bioplastics and biopolymers: A review. Environ. Chem. Lett. 2022, 20, 379–395. [Google Scholar] [CrossRef] [PubMed]
- Dake, M. Biodegradable polymers: Renewable nature, life cycle, and applications. Microbial Factories: Biodiversity, Biopolymers. Bioact. Mol. 2016, 2, 29–56. [Google Scholar] [CrossRef]
- Moradali, M.F.; Rehm, B.H.A. Bacterial biopolymers: From pathogenesis to advanced materials. Nat. Rev. Microbiol. 2020, 18, 195–210. [Google Scholar] [CrossRef]
- Meereboer, K.W.; Misra, M.; Mohanty, A.K. Review of recent advances in the biodegradability of polyhydroxyalkanoate (PHA) bioplastics and their composites. Green Chem. 2020, 22, 5519–5558. [Google Scholar] [CrossRef]
- Müller-Santos, M.; Koskimäki, J.J.; Silveira, L.P.; de Souza, E.M.; Jendrossek, D.; Pirttilä, A.M. The protective role of PHB and its degradation products against stress situations in bacteria. FEMS Microbiol. Rev. 2021, 45, fuaa058. [Google Scholar] [CrossRef]
- Mohammadalipour, M.; Behzad, T.; Karbasi, S. Optimization and characterization of polyhydroxybutyrate/lignin electro-spun scaffolds for tissue engineering applications. Int. J. Biol. Macromol. 2022, 218, 317–334. [Google Scholar] [CrossRef]
- Fedorov, M.B.; Vikhoreva, G.A.; Mokhova, O.N.; Bonartseva, G.A. Antimicrobial Activity of Core–Sheath Surgical Sutures Modified with Poly-3-hydroxybutyrate. Appl. Biochem. Microbiol. 2007, 43, 611–615. [Google Scholar] [CrossRef]
- Reis, M.A.M.; Serafim, L.S.; Lemos, P.C.; Ramos, A.M. Production of polyhydroxyalkanoates by mixed microbial cultures. Bioprocess Biosyst Eng. 2003, 25, 377–385. [Google Scholar] [CrossRef]
- Ahmad, N.H.; Mustafa, S.; Man, Y.B.C. Microbial polysaccharides and their modification approaches: A review. Int. J. Food Prop. 2015, 18, 332–347. [Google Scholar] [CrossRef] [Green Version]
- Romero-Soto, L.; Byrne, E.; van Niel, E.W.J.; Sayed, M.; Carrasco, C.; Hatti-Kaul, R. Hydrogen and polyhydroxybutyrate production from wheat straw hydrolysate using Caldicellulosiruptor species and Ralstonia eutropha in a coupled process. Bioresour. Technol. 2019, 272, 259–266. [Google Scholar] [CrossRef] [PubMed]
- Gupta, G.N.; Srivastava, S.; Khare, S.K.; Prakash, V. Extremophiles: An Overview of Microorganism from Extreme Environment. Int. J. Agric. Environ. Biotechnol. 2014, 7, 371. [Google Scholar] [CrossRef]
- Quillaguamán, J.; Hatti-kaul, R.; Mattiasson, B.; Alvarez, M.T.; Delgado, O. Halomonas boliviensis sp. nov., an alkalitolerant, moderate halophile isolated from soil around a Bolivian hypersaline lake. Int. J. Syst. Evol. Microbiol. 2004, 54, 721–725. [Google Scholar] [CrossRef]
- FAOSTAT. Crops and Livestock Products. Available online: https://www.fao.org/faostat/en/#data/QCL (accessed on 1 February 2023).
- Filik, G. Biodegradability of quinoa stalks: The potential of quinoa stalks as a forage source or as biomass for energy production. Fuel 2020, 266, 117064. [Google Scholar] [CrossRef]
- Carrasco, C.; Cuno, D.; Carlqvist, K. SO 2 -catalysed steam pretreatment of quinoa stalks. J. Chem. Technol. Biotechnol. 2014, 90, 64–71. [Google Scholar] [CrossRef]
- Carrasco, C.; Jönsson, L.J.; Martín, C. Hydrothermal pretreatment of water-extracted and aqueous ethanol-extracted quinoa stalks for enzymatic saccharification of cellulose. Energies 2021, 14, 4102. [Google Scholar] [CrossRef]
- Martín, C.; Carrasco, C.; Jönsson, L.J.; Romero-Soto, L.; Chambi, D.; Oliva-Taravilla, A. Biorefining of quinoa residues for production of advanced biofuels and biopolymers. In Proceedings of the 30th European Biomass Conference and Exhibition Proceedings, online, 9–12 May 2022; pp. 1126–1130. [Google Scholar]
- Chambi, D.; Romero-Soto, L.; Villca, R.; Orozco-Gutiérrez, F.; Vega-Baudrit, J.; Quillaguamán, J.; Hatti-Kaul, R.; Martín, C.; Carrasco, C. Exopolysaccharides Production by Cultivating a Bacterial Isolate from the Hypersaline Environment of Salar de Uyuni (Bolivia) in Pretreatment Liquids of Steam-Exploded Quinoa Stalks and Enzymatic Hydrolysates of Curupaú Sawdust. Fermentation 2021, 7, 33. [Google Scholar] [CrossRef]
- Chambi, D.; Lundqvist, J.; Nygren, E.; Romero-Soto, L.; Marin, K.; Gorzsás, A.; Hedenström, M.; Carlborg, M.; Broström, M.; Sundman, O.; et al. Production of Exopolysaccharides by Cultivation of Halotolerant Bacillus atrophaeus BU4 in Glucose- and Xylose-Based Synthetic Media and in Hydrolysates of Quinoa Stalks. Fermentation 2022, 8, 79. [Google Scholar] [CrossRef]
- Law, J.H.; Slepecky, R.A. Assay of poly-beta-hydroxybutyric acid. J. Bacteriol. 1961, 82, 33–36. [Google Scholar] [CrossRef] [PubMed] [Green Version]
- Quillaguamán, J.; Doan-Van, T.; Guzmán, H.; Guzmán, D.; Martín, J.; Everest, A.; Hatti-Kaul, R. Poly(3-hydroxybutyrate) production by Halomonas boliviensis in fed-batch culture. Appl. Microbiol. Biotechnol. 2008, 78, 227–232. [Google Scholar] [CrossRef] [PubMed]
- Jönsson, L.J.; Martín, C. Pretreatment of lignocellulose: Formation of inhibitory by-products and strategies for minimizing their effects. Bioresour. Technol. 2016, 199, 103–112. [Google Scholar] [CrossRef] [PubMed] [Green Version]
- Mavrommati, M.; Daskalaki, A.; Papanikolaou, S.; Aggelis, G. Adaptive laboratory evolution principles and applications in industrial biotechnology. Biotechnol. Adv. 2022, 54, 107795. [Google Scholar] [CrossRef]
- Rivera-Terceros, P.; Tito, E.; Torrico, S.; Carballo, S.; Van-Thuoc, D.; Quillaguaman, J. Production of poly (3-hydroxybutyrate) by Halomonas boliviensis in an air-lift reactor. J. Biol. Res. 2015, 22, 1–9. [Google Scholar] [CrossRef] [Green Version]
- Jacquel, N.; Lo, C.W.; Wei, Y.H.; Wu, H.S.; Wang, S.S. Isolation and purification of bacterial poly(3-hydroxyalkanoates). Biochem. Eng. J. 2008, 39, 15–27. [Google Scholar] [CrossRef]
- Quillaguamán, J.; Muñoz, M.; Mattiasson, B.; Hatti-Kaul, R. Optimizing conditions for poly(β-hydroxybutyrate) production by Halomonas boliviensis LC1 in batch culture with sucrose as carbon source. Appl. Microbiol. Biotechnol. 2007, 74, 981–986. [Google Scholar] [CrossRef]
- Van-Thuoc, D.; Quillaguamán, J.; Mamo, G.; Mattiasson, B. Utilization of agricultural residues for poly(3-hydroxybutyrate) production by Halomonas boliviensis LC1. J. Appl. Microbiol. 2008, 104, 420–428. [Google Scholar] [CrossRef]
- Sun, S.; Ding, Y.; Liu, M.; Xian, M.; Zhao, G. Comparison of glucose, acetate and ethanol as carbon resource for production of poly(3-hydroxybutyrate) and other Acetyl-CoA derivatives. Front. Bioeng. Biotechnol. 2020, 8, 833. [Google Scholar] [CrossRef]
- Aramvash, A.; Moazzeni Zavareh, F.; Gholami Banadkuki, N. Comparison of different solvents for extraction of polyhydroxybutyrate from Cupriavidus necator. Eng. Life Sci. 2018, 18, 20–28. [Google Scholar] [CrossRef] [Green Version]
- Adaya, L.; Millán, M.; Peña, C.; Jendrossek, D.; Espín, G.; Tinoco-Valencia, R.; Guzmán, J.; Pfeiffer, D.; Segura, D. Inactivation of an intracellular poly-3-hydroxybutyrate depolymerase of Azotobacter vinelandii allows to obtain a polymer of uniform high molecular mass. Appl. Microbiol. Biotechnol. 2018, 102, 2693–2707. [Google Scholar] [CrossRef] [PubMed]
- Zhang, Y.; Li, T.; Shen, Y.; Wang, L.; Zhang, H.; Qian, H.; Qi, X. Preparation, statistical optimization and characterization of poly(3-hydroxybutyrate) fermented by Cupriavidus necator utilizing various hydrolysates of alligator weed (Alternanthera philoxeroides) as a sole carbon source. Biotechnol. Prog. 2020, 36, e2992. [Google Scholar] [CrossRef] [PubMed]
- Sanhueza, C.; Diaz-Rodriguez, P.; Villegas, P.; González, A.; Seeger, M.; Suárez-González, J.; Concheiro, A.; Alvarez-Lorenzo, C.; Acevedo, F. Influence of the carbon source on the properties of poly-(3)-hydroxybutyrate produced by Paraburkholderia xenovorans LB400 and its electrospun fibers. Int. J. Biol. Macromol. 2020, 152, 11–20. [Google Scholar] [CrossRef]
- Naumann, D. FT-infrared and FT-Raman spectroscopy in biomedical research. Appl. Spectrosc. Rev. 2001, 36, 239. [Google Scholar] [CrossRef]
- Jayakumar, A.; Prabhu, K.; Shah, L.; Radha, P. Biologically and environmentally benign approach for PHB-silver nanocomposite synthesis and its characterization. Polym. Test. 2020, 81, 106197. [Google Scholar] [CrossRef]
- Asran, A.S.; Razghandi, K.; Aggarwal, N.; Michler, G.H.; Groth, T. Nanofibers from blends of polyvinyl alcohol and polyhydroxy butyrate as potential scaffold material for tissue engineering of skin. Biomacromolecules 2010, 11, 3413–3421. [Google Scholar] [CrossRef]
- Getachew, A.; Woldesenbet, F. Production of biodegradable plastic by polyhydroxybutyrate (PHB) accumulating bacteria using low cost agricultural waste material. BMC Res. Notes 2016, 9, 509. [Google Scholar] [CrossRef] [Green Version]
- Mohan Nair, A.; Annamalai, K.; Kamala Kannan, S.; Kuppusamy, S. Characterization of polyhydroxyalkanoates produced by Bacillus subtilis isolated from soil samples. Malaya J. Biosci. 2014, 1, 8–12. [Google Scholar]
- Drusilla Wendy, Y.B.; Nor Fauziah, M.Z.; Siti Baidurah, Y.; Tong, W.Y.; Lee, C.K. Production and characterization of polyhydroxybutyrate (PHB) by Burkholderia cepacia BPT1213 using waste glycerol as carbon source. Biocatal. Agric. Biotechnol. 2022, 41, 102310. [Google Scholar] [CrossRef]
- Kansiz, K.; Billman-Jacobe, H.; McNaughton, D. Quantitative determination of the biodegradable polymer poly(β-hydroxybutyrate) in a recombinant Escherichia coli strain by use of mid-infrared spectroscopy and multivariative statistics. Appl. Environ. Microbiol. 2000, 66, 3415–3420. [Google Scholar] [CrossRef] [Green Version]
- Pradhan, S.; Dikshit, P.K.; Moholkar, V.S. Production, ultrasonic extraction, and characterization of poly (3-hydroxybutyrate) (PHB) using Bacillus megaterium and Cupriavidus necator. Polym. Adv. Technol. 2018, 29, 2392–2400. [Google Scholar] [CrossRef]
- Rohini, D.; Phadnis, S.; Rawal, S.K. Synthesis and characterization of poly-β-hydroxybutyrate from Bacillus thuringiensis R1. Indian J. Biotechnol. 2006, 5, 276–283. [Google Scholar]
- Li, R.; Jiang, Y.; Wang, X.; Yang, J.; Gao, Y.; Zi, X.; Zhang, X.; Gao, H.; Hu, N. Psychrotrophic Pseudomonas mandelii CBS-1 produces high levels of poly-β-hydroxybutyrate. Springerplus 2013, 2, 1–7. [Google Scholar] [CrossRef] [PubMed] [Green Version]
- Gottlieb, H.E.; Kotlyar, V.; Nudelman, A. NMR Chemical Shifts of Common Laboratory Solvents as Trace Impurities. J. Org. Chem. 1997, 62, 7512–7515. [Google Scholar] [CrossRef] [PubMed]
- Mahishi, L.H.; Tripathi, G.; Rawal, S.K. Poly(3-hydroxybutyrate) (PHB) synthesis by recombinant Escherichia coli harbouring Streptomyces aureofaciens PHB biosynthesis genes: Effect of various carbon and nitrogen sources. Microbiol. Res. 2003, 158, 19–27. [Google Scholar] [CrossRef]
- Park, S.; Baker, J.O.; Himmel, M.E.; Parilla, P.A.; K Johnson, D. Cellulose crystallinity index: Measurement techniques and their impact on interpreting cellulase performance. Biotechnol. Biofuels 2010, 3, 1–10. [Google Scholar] [CrossRef] [Green Version]
- Yokouchi, M.; Chatani, Y.; Tadokoro, H.; Teranishi, K.; Tani, H. Structural studies of polyesters: 5. Molecular and crystal structures of optically active and racemic poly (β-hydroxybutyrate). Polymer 1973, 14, 267–272. [Google Scholar] [CrossRef]
- Anbukarasu, P.; Sauvageau, D.; Elias, A. Tuning the properties of polyhydroxybutyrate films using acetic acid via solvent casting. Sci. Rep. 2015, 5, 17884. [Google Scholar] [CrossRef] [Green Version]
- Naser, A.Z.; Deiab, I.; Darras, B.M. Poly(lactic acid) (PLA) and polyhydroxyalkanoates (PHAs), green alternatives to petroleum-based plastics: A review. RSC Adv. 2021, 11, 17151–17196. [Google Scholar] [CrossRef]
- Vahabi, H.; Michely, L.; Moradkhani, G.; Akbari, V.; Cochez, M.; Vagner, C.; Renard, E.; Saeb, M.R.; Langlois, V. Thermal stability and flammability behavior of poly(3-hydroxybutyrate) (PHB) based composites. Materials 2019, 12, 2239. [Google Scholar] [CrossRef] [Green Version]
- Galego, N.; Rozsa, C. Thermal decomposition of some poly(β-hydroxyalkanoates). Polym. Int. 1999, 48, 1202–1204. [Google Scholar] [CrossRef]


| CH-PHB-15 | CH-PHB-20 | |
|---|---|---|
| Glucose consumption rate, g/(L h) | 0.15 (0.04) | 0.14 (0.03) |
| Overall glucose consumption, % of initial amount | 99.75 (0.04) | 92.84 (3.64) |
| PHB yield on consumed glucose (YCG), g/g | 0.10 (0.03) | 0.08 (0.03) |
| Volumetric productivity of PHB, mg/(L h) | 14.02 (1.17) | 10.89 (1.16) |
| Cell biomass, g/L | 1.38 (0.22) | 1.18 (0.24) |
Disclaimer/Publisher’s Note: The statements, opinions and data contained in all publications are solely those of the individual author(s) and contributor(s) and not of MDPI and/or the editor(s). MDPI and/or the editor(s) disclaim responsibility for any injury to people or property resulting from any ideas, methods, instructions or products referred to in the content. |
© 2023 by the authors. Licensee MDPI, Basel, Switzerland. This article is an open access article distributed under the terms and conditions of the Creative Commons Attribution (CC BY) license (https://creativecommons.org/licenses/by/4.0/).
Share and Cite
Miranda, D.A.; Marín, K.; Sundman, O.; Hedenström, M.; Quillaguaman, J.; Gorzsás, A.; Broström, M.; Carlborg, M.; Lundqvist, J.; Romero-Soto, L.; et al. Production and Characterization of Poly(3-hydroxybutyrate) from Halomonas boliviensis LC1 Cultivated in Hydrolysates of Quinoa Stalks. Fermentation 2023, 9, 556. https://doi.org/10.3390/fermentation9060556
Miranda DA, Marín K, Sundman O, Hedenström M, Quillaguaman J, Gorzsás A, Broström M, Carlborg M, Lundqvist J, Romero-Soto L, et al. Production and Characterization of Poly(3-hydroxybutyrate) from Halomonas boliviensis LC1 Cultivated in Hydrolysates of Quinoa Stalks. Fermentation. 2023; 9(6):556. https://doi.org/10.3390/fermentation9060556
Chicago/Turabian StyleMiranda, Diego A., Katherine Marín, Ola Sundman, Mattias Hedenström, Jorge Quillaguaman, András Gorzsás, Markus Broström, Markus Carlborg, Jenny Lundqvist, Luis Romero-Soto, and et al. 2023. "Production and Characterization of Poly(3-hydroxybutyrate) from Halomonas boliviensis LC1 Cultivated in Hydrolysates of Quinoa Stalks" Fermentation 9, no. 6: 556. https://doi.org/10.3390/fermentation9060556