Article

Optimization of Milbemycin Component Ratio by Coordinating Acyl-Coenzyme A Supply Pathways in Streptomyces bingchenggensis

1
State Key Laboratory for Biology of Plant Diseases and Insect Pests, Institute of Plant Protection, Chinese Academy of Agricultural Sciences, No. 2 Yuanmingyuan West Road, Haidian District, Beijing 100193, China
2
School of Life Science, Northeast Agricultural University, No. 59 Mucai Street, Xiangfang District, Harbin 150030, China
3
Heilongjiang Academy of Black Soil Conservation & Utilization, Postdoctoral Station of Heilongjiang Academy of Agricultural Sciences, No. 800, Innovation 3rd Road, Songbei District, Harbin 150086, China
*
Authors to whom correspondence should be addressed.
These authors contributed equally to this work.
Fermentation 2023, 9(6), 555; https://doi.org/10.3390/fermentation9060555
Submission received: 15 May 2023 / Revised: 28 May 2023 / Accepted: 30 May 2023 / Published: 10 June 2023

Abstract

:
Milbemycins are a group of macrolide pesticides with great potential in the agricultural field owing to their high insecticidal activity and environmental compatibility. Milbemycin A3 and A4 with high bioactivities are the main components of milbemycin-derived products, which require a component ratio A4:A3 of 2.3- to 4.0-fold. Streptomyces bingchenggensis BC04 is a promising milbemycin producer, whereas the component ratio of its products (A4:A3 of 9.0-fold) could not meet the requirement for industrial production. To address this issue, we reconstructed the precursor biosynthetic pathways to fine tune the supply of different acyl-coenzyme A precursors required for milbemycin biosynthesis. Based on an analysis of the intracellular acyl-coenzyme A precursors, we reconstructed stepwise heterogeneous biosynthetic pathways of extender units for milbemycin biosynthesis. Then, we coordinated the supply of milbemycin biosynthetic starter units with temporal promoters. Thanks to these manipulations, we obtained an engineered strain with 39.5% milbemycin titer improvement to 3417.88 mg/L and a qualified component ratio A4:A3 of 3.3-fold. This work demonstrated that coordinating the precursor supply is a simple and effective approach to optimize the component ratio of A4:A3 in milbemycin fermentation products. Moreover, this strategy might also be useful to construct high-yield strains with optimized component ratios of fermentation products in other Streptomyces.

1. Introduction

Streptomyces species are well known for their great capacity to produce numerous natural products, including a plethora of valuable pharmaceuticals that have been widely used in the medicine; veterinary and agriculture areas, such as daptomycin, tetracycline and avermectins [1,2]. Generally, a native Streptomyces producer can generate several related molecules via a unique biosynthetic gene cluster (BGC), and sometimes, more than one bioactive compound can be present in such complex mixtures. For example, avermectins produced by Streptomyces avermitilis contain eight different components, and the B1a and B2 components show excellent insecticidal activities. Other pharmaceuticals such as polynactin and tetramycin also contain different components [3]. Maintaining an appropriate ratio of bioactive components could facilitate the product separation and purification processes, as well as reduce the production costs. However, such a ratio in native producers generally could not fulfill the requirements of the industrial sector. Therefore, it is quite necessary to engineer metabolic pathways to optimize the composition ratio of target compounds.
Homologs from the same BGC can be biosynthesized using different starter and extender units or subjected to different post-modification processes. Hence, optimization of the target composition of Streptomyces products can be achieved by different approaches. For example, the use of 2-methylbutyryl-coenzyme A or isobutyryl-coenzyme A as the starter unit determines the formation of “a” or “b” components of avermectins; thus, the titer improvement of B1a can be achieved by enhancing the precursor supply of 2-methylbutyryl-coenzyme A [4], the use of 2-ethylmalonyl-CoA as an extender unit could change the formation of FK506 from FK520 [5] and balancing cellular acyl coenzyme A (acyl-CoA) supply pathways significantly enhanced salinomycin production [6]. These studies suggest that the coordination of acyl-coenzyme A supply pathways is an effective approach to optimize the component ratio of target products in Streptomyces.
Milbemycins, which were first discovered in Streptomyces hygroscopicus [7], are a group of polyketide compounds with attractive insecticidal and acaricidal bioactivities [8,9]. Milbemycins is the mixture of milbemycin A3 and A4 possess higher insecticidal activity and lower toxicity than the well-known biopesticide avermectins [10]. Other milbemycin-derived commercial products such as lepimectin and latidectin also show great potential in the agricultural field [11,12]. Commercial milbemycin products require component ratios of A4:A3 of 2.3- to 4.0-fold to generate high insecticidal activity; therefore, obtaining milbemycin-producing strains with qualified ratios of A4:A3 facilitates downstream production processes after fermentation, which are important for cost control and the broad application of milbemycin products. S. bingchenggensis is a good milbemycin producer screened by our group [13,14], and the ratio of A4:A3 in the wild-type strain is 1.0-fold. In the past decade, our group tried to improve the milbemycin titer in S. bingchenggensis by using various approaches, including random mutagenesis [13,15], rational engineering such as transcription regulator engineering [16,17,18] and metabolic pathway reconstruction [19,20]. During this process, despite the composition ratio of A4:A3 of the current producers changing from 1.0- to about 9.0-fold, it still could not fulfill the industrial production requirements. This revealed a research gap to optimize the composition ratio of A4:A3 in milbemycin-producing strains.
Milbemycin A3 and A4 employ acetyl-coenzyme A (AcCoA) and propionyl-coenzyme A (PropCoA) as the starter unit, respectively, while they share the same extender units of malonyl-coenzyme A (MalCoA) and methylmalonyl-coenzyme A (MMCoA). Thus, in the present work, we aimed to optimize the composition ratio of A3:A4 by coordinating the precursor supply. We first overexpressed acetyl-CoA carboxylase (ACC) to increase the MalCoA supply and then finely tuned the supply of PropCoA using temporal promoters. Finally, optimization of the intracellular level of multiple precursors improved milbemycin production, as well as the ratio of milbemycin A4:A3. Our strategy increased the final titer of milbemycin by 39.5% to 3417.88 mg/L; moreover, the composition ratio of A4:A3 was optimized to 3.3-fold, which was in the qualified range between 2.3- and 4.0-fold. This work provides an effective strategy to optimize the proportions of the key components of natural products in Streptomyces.

2. Materials and Methods

2.1. Bacterial Strains, and Culture Conditions

All strains used in this work are listed in Table S1. S. bingchenggensis BC-101-4 is a wild-type milbemycin producer and S. bingchenggensis BC04 is an industrial milbemycin producer [11]. All E. coli strains were grown in Luria–Bertani (LB) medium supplemented with antibiotics as required at 37 °C [21]. For conjugation, E. coli ET12567 (pUZ8002) was used for transferring plasmids from E. coli to Streptomyces, and S. bingchenggensis strains were grown in MS agar at 28 °C [22]. For spore collection, S. bingchenggensis and its derivatives were grown at 28 °C on SKYM agar plates [11]. Flask fermentation for the production of milbemycins was the same as previously reported [11]. The spore suspension was inoculated into the 25 mL SSPY medium in a 250 mL flask and cultivated for 46 h as the seed cultures in a rotary shaker at 250 rpm and 28 °C; then, 1.5 mL of the seed cultures were transferred into the 25 mL fermentation medium for milbemycin production and intracellular acyl-CoA ester concentrations.

2.2. Gene Cloning and Plasmid Construction

All plasmids and primers used in this work are listed in Tables S1 and S2, respectively. pSET152 and pIJ10500, which can integrate into the Streptomyces chromosome by site-specific recombination at the phage ΦC31 or ΦBT1 attachment site (attB), respectively, was used to create recombinant plasmids for overexpressed mutant strains [23]. All plasmids were constructed by Gibson DNA Assembly. Genes encoding accA2, accB and accE were amplified with primer pairs accA2-F/accA2-R and accBE-F/accBE-R. The DNA fragment including 500 bp upstream of milR (PmilR) was amplified by PCR using the primer pair PmilR-F/PmilR-R. Then, the resultant DNA segments were cloned to the NdeI and SpeI sites of pIJ10500 to give plasmid pIJ10500::PmilR::ACC. The same method was used to construct plasmids pIJ10500::Porf1::ACC, pIJ10500::PmilA1::ACC, pIJ10500::PmilA2::ACC, pIJ10500::PmilA4::ACC and pIJ10500::PmilF::ACC.
For the construction of pSET152::PmilR::PCS, the coding sequence of sbi_01198 was amplified by PCR using the primer pair SBI_01198-F/SBI_01198-R. The PCR product and the milR promoter fragment amplified by PCR using the primer pair milR-F/milR-R from plasmids pIJ10500::PmilR were cloned at the XbaI and EcoRI sites of pSET152. For the construction of pSET152::PmilR::PCC, the coding sequences of accAI and pccB were amplified by PCR using the primer pairs SBI_04611-F/SBI_04611-R and SBI_04601-F/SBI_04601-R. To generate pSET152::PmilR::PCS::PCC, the coding sequences of pcs, accAI and pccB were amplified by PCR using the primer pairs SBI_01198-F/SBI_01198E-R, SBI_04611-F/SBI_04611-R and SBI_04601-F/SBI_04601-R, respectively.
For the construction of pSET152::PmilR::sbi_03740::sbi_03754, the coding sequence of sbi_03740 was amplified by PCR using the primer pair SBI_03740-F/SBI_03740-R, and the coding sequence of sbi_03754 was amplified by PCR using the primer pair SBI_03754-F1/SBI_03754-R. For pSET152::PmilR::sbi_04700::sbi_03754, the coding sequence of sbi_04700 was amplified by PCR using the primer pair SBI_04700-F/SBI_04700-R, and the coding sequence of sbi_03754 was amplified by PCR using the primer pair SBI_03754-F2/SBI_03754-R.
The promoter region P972 (500 bp upstream of sbi_00972) was amplified with primer pair PSBI_00972-F/PSBI_00972-R. The PCR product was cloned to the SpeI and ScaI sites of Pset152::PmilR::PCS::PCC to obtain Pset152::PmilR::PCS::P972PCC. The same method was used to construct plasmids by using primers PSBI_05175-F/PSBI_05175-R, PSBI_05992-F/PSBI_05992-R, PSBI_04950-F/PSBI_04950-R, PSBI_09717-F/PSBI_09717-R, PSBI_04323-F/PSBI_04323-R, PSBI_04187-F/PSBI_04187-R, PSBI_09292-F/PSBI_09292-R, PSBI_03281-F/PSBI_03281-R and PSBI_03269-F/PSBI_03269-R to amplify different promoter regions.

2.3. Detection of Acyl-CoAs of S. bingchenggensis

For acyl-CoAs detection, fermentation broth organisms of S. bingchenggensis for 2, 4 and 6 days were collected, and the cells were rapidly quenched with 60% methanol, then washed twice with pre-cooled ultrapure water and immediately stored at −80 °C overnight before liquid nitrogen grinding. The milled 200 mg cells were resuspended in 1.3 mL of pre-chilled 10% TCAA and vortex-lysed for 3 min at 0 °C. The lysate was centrifuged at 12,000× g and 0 °C for 10 min. The supernatant was added to 2 mL of pre-chilled ether and shaken repeatedly to remove TCAA, and the supernatant was quickly transferred to −80 °C for pre-freezing and vacuum freeze-dried overnight. The lyophilized extract was dissolved with 300 μL of pre-chilled 25 mM ammonium formate buffer, and the dissolved solution was filtered through 0.22 μM membrane for sterilization and the assay. The mass spectrometry conditions for the detection of the acyl-CoA esters were the same as previously reported [24]. The samples (20 μL) were analyzed by liquid chromatography-tandem mass spectrometry (LC-MS/MS) using a C18 analytical column (Gemini 150 × 2.0 mm, particle size 3 μM; Phenomenex) at a flow rate of 220 μL min−1. Solvent A was 50 mM formic acid adjusted to pH 8.1 with NH4OH, and solvent B was methanol. The following gradient of B was applied: 0 min, 5%; 1 min, 5%; 10 min, 23%; 20 min, 80%; 22 min, 80%. Acyl-CoAs were detected in the multiple reaction monitoring (MRM) mode with the m/z parent > m/z daughter (acetyl-CoA 808.1 > 407.9, malonyl-CoA 852.2 > 407.9, methylmalonyl-CoA 866.1 > 407.7 and propionyl-CoA, 822.2 > 407.5) by LC–MS/MS.

2.4. Sequence Analysis

DNA and amino acid homology analysis, NCBI BLAST: (https://blast.ncbi.nlm.nih.gov/Blast.cgi (the access time should be in 2020 and 2021)).
DNA sequence ORF prediction, Frameplot 2.3 server: (http://nocardia.nih.go.jp/fp4/ (the access time should be in 2020 and 2021))
Online analysis of conserved alignment patterns of homologous genes, KEGG: (http://www.genome.jp/kegg/kegg2.html (the access time should be in 2020 and 2021)).

2.5. Time–Course Transcriptome Data Analysis

The time–course transcriptome used in this work can be found in the GEO database (GSE147644). For branched-chain alpha-keto acid dehydrogenase (BCKDH), phosphate acetyltransferase (PAT), acetate kinase (ACK) and propionyl-CoA synthetase (PCS), the gene expression levels were expressed by the expected number of Fragments Per Kilobase of transcript sequence per Millions base pairs sequenced (FPKM). The FPKM value of each strain obtained from 0.75 days was set as the control. The gene transcription level change was expressed by normalizing the data to the control. The data shown in the heatmap were the log2-transformed values of gene transcription level changes. The heatmap was generated by using the pheatmap package of R software. Profiles of ten native promoters used in this work were represented by time–course transcription level changes of the genes they individually controlled.

2.6. Determination of Cell Dry Weight

Two-milliliter cell cultures were collected by vacuum filtration and dried at 55 °C to a constant weight.

2.7. Detection of Milbemycins

The detection method of milbemycin A3/A4 was the same as previously reported [11]. The fermentation broth of S. bingchenggensis was extracted with 3 volumes of ethanol, then quantitated by Agilent 1260 high-performance liquid chromatography (HPLC) with an SB-C18 column (Zorbax, 4.6 mm × 250 mm, 5 mm) at a flow rate of 1.0 mL/min. The following gradient of B was applied from 0 to 100% for 15 min (Solvent A: acetonitrile: water: methanol (7:1:2, v/v/v); Solvent B: methanol), and the samples were detected at 242 nm.

2.8. Statistical Analysis

All experiments were run for three biological triplicates independently. The data were presented as averages of three triplicates. The significance was analyzed by the Student’s t-test, and the significance was presented as follows: * p < 0.05, ** p < 0.01 and *** p < 0.001, and “ns” means no significant difference.

3. Results

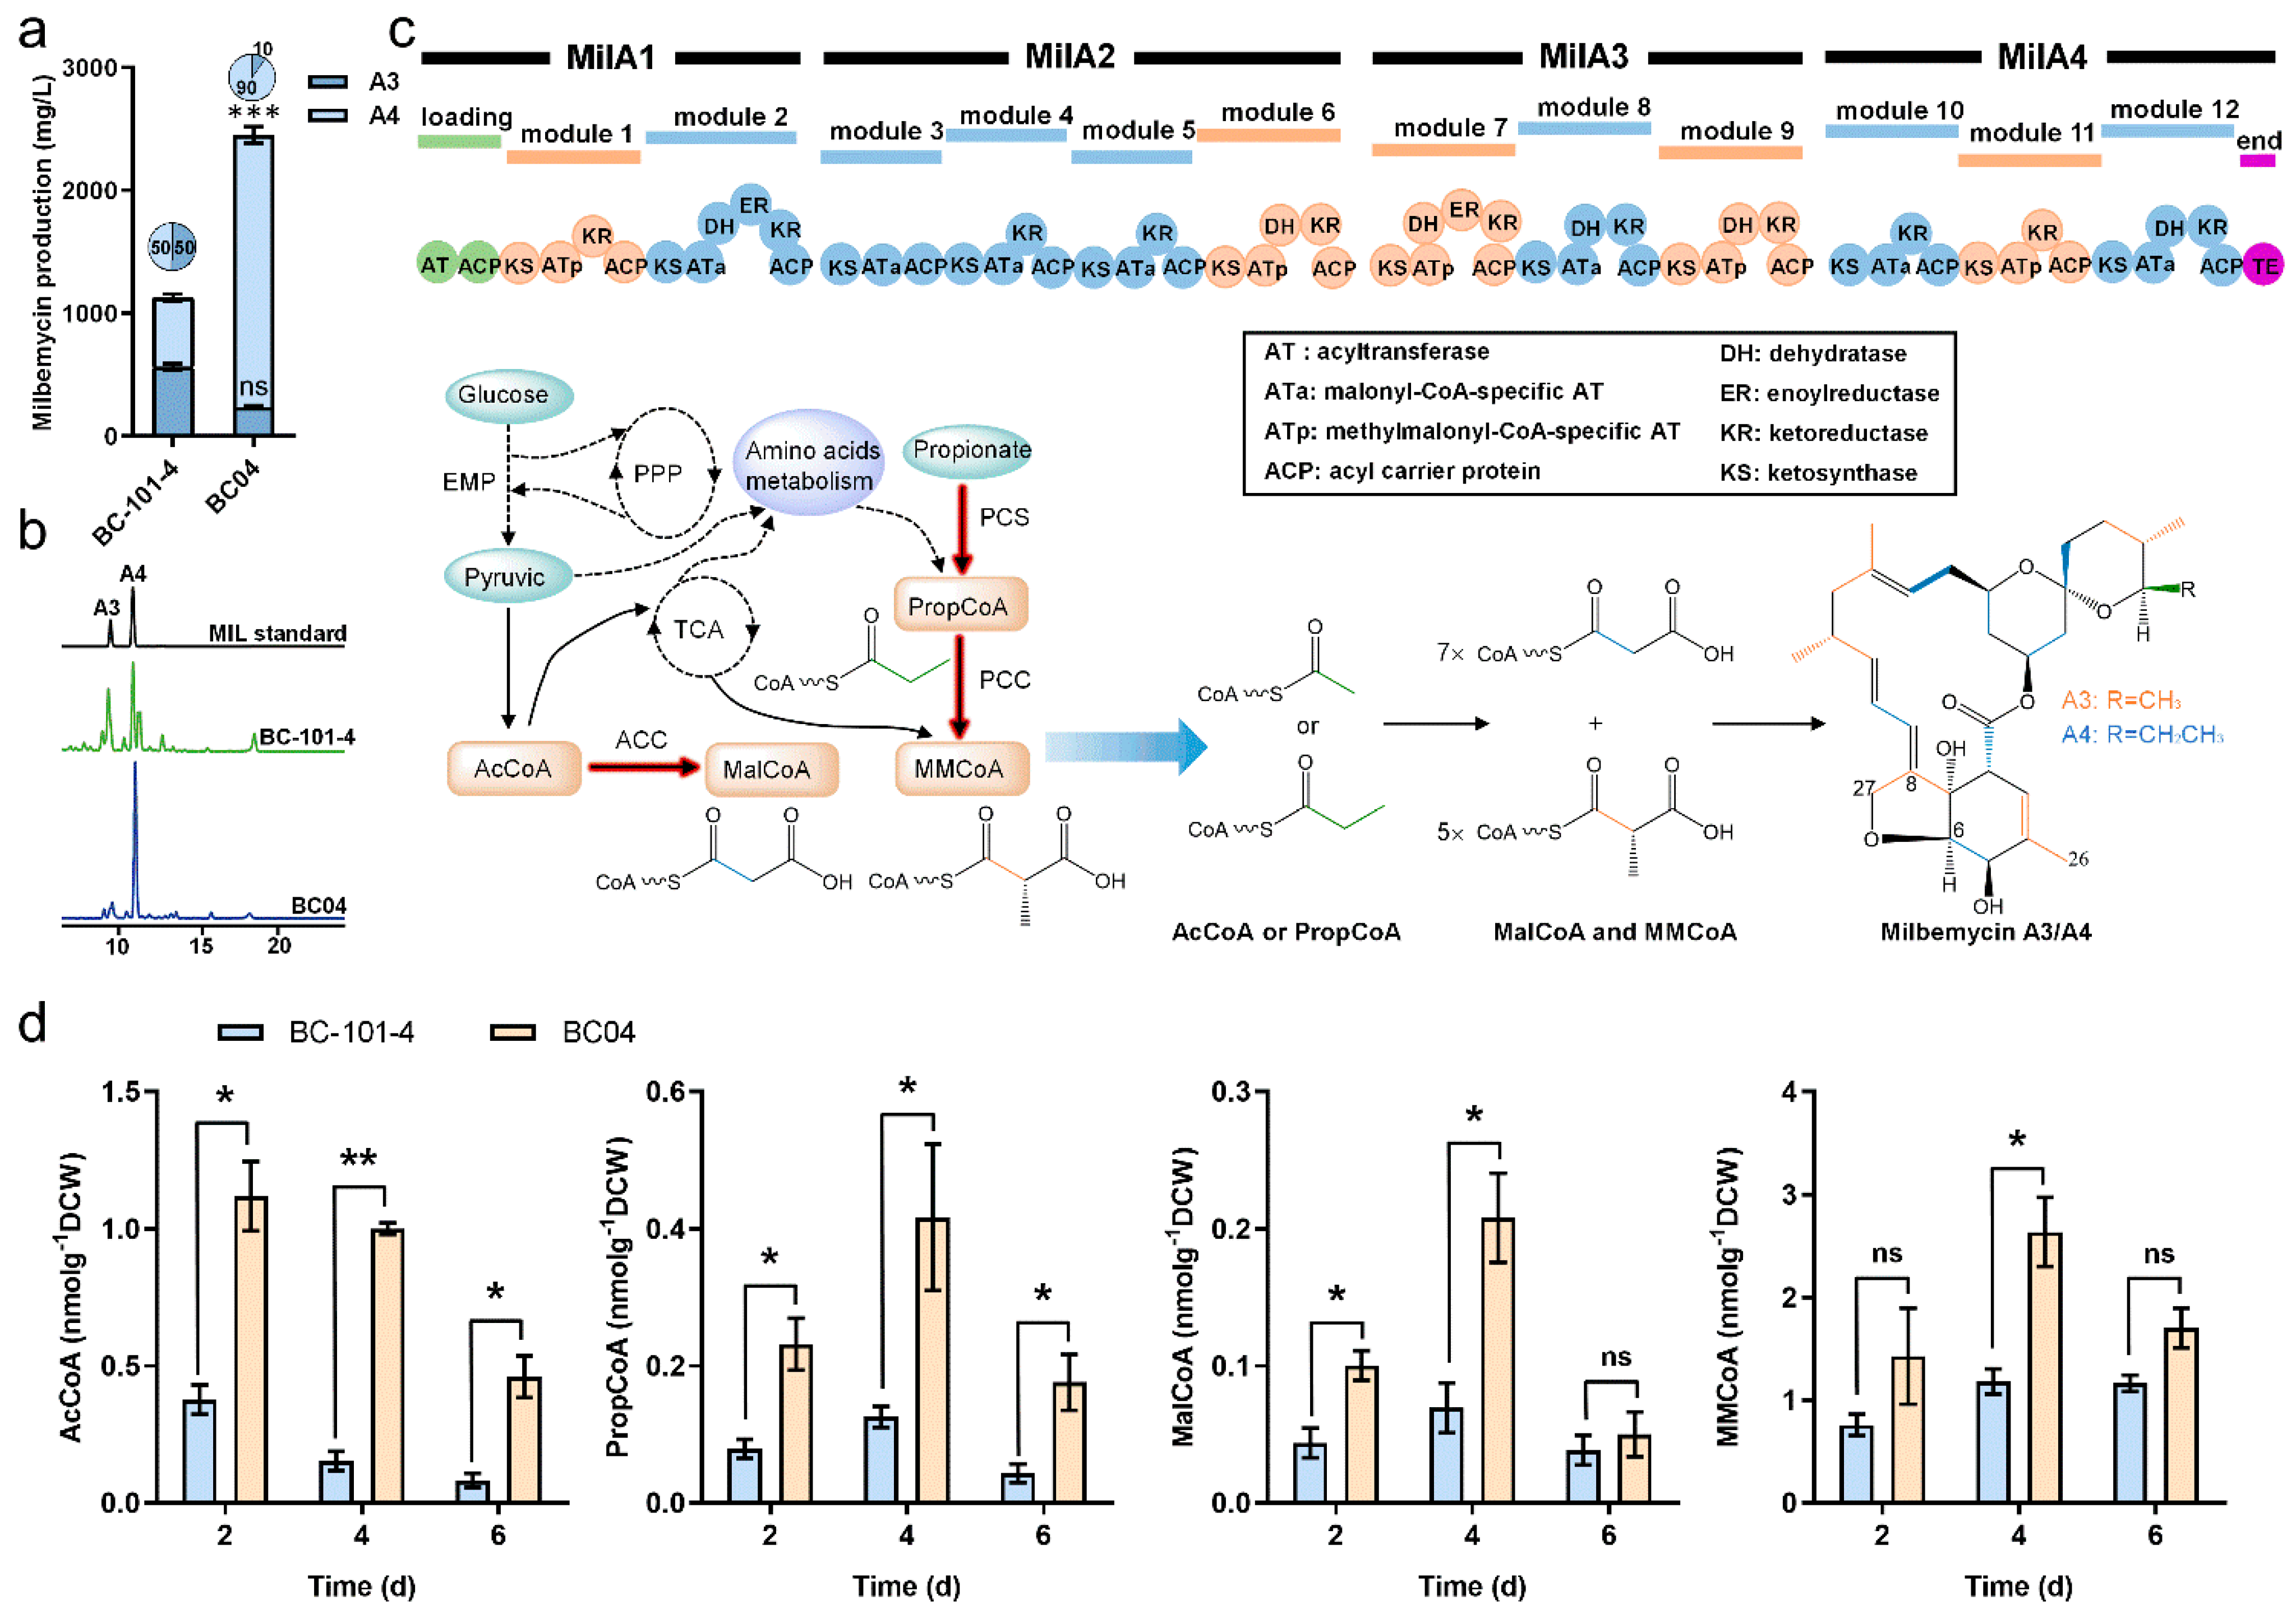
3.1. Analysis of Key Precursors of Milbemycin Biosynthesis

S. bingchenggensis BC04 is a high milbemycin-producing strain (about 2500 mg/L) obtained by random mutagenesis from the wild-type strain BC-101-4 (about 1200 mg/L) by our team. The component ratio of A4:A3 in BC-101-4 and BC04 is 1.0- and 9.0-fold, respectively (Figure 1a,b). BC04 possesses a higher milbemycin production capacity than the wild-type strain, but its A4:A3 ratio needs to be improved to fulfil the industrial production requirements ranging from 2.3- to 4.0-fold. Based on the biosynthetic logic of milbemycins (Figure 1c), we speculated that the production of milbemycins could be improved by enhancing the supply of four essential acyl-CoA precursors, while the component ratios of A3 and A4 could be finely tuned by changing the supply of AcCoA and PropCoA, which is required for A3 and A4, respectively. Given the closed relationship among the four precursors, we first investigated the cellular concentrations of these acyl-CoAs at different fermentation stages, including the fast cell growth stage (2 day) and early and middle milbemycin-producing stages (4 day and 6 day) (Figure S1).
The data showed that each acyl-CoA precursor had higher concentrations in BC04 than that in BC-101-4 during the whole fermentation stage. As anticipated, the concentrations of these acyl-CoA precursors decreased when milbemycin production started (after 4 days) (Figure 1d and Figure S1). At the sixth day, the concentrations of AcCoA and PropCoA in BC04 were 4.7- and 3.2-fold higher than those in BC-101-4, while those of MalCoA and MMCoA were only 31.6% and 41.7% higher, suggesting a limitation in the extender units. Since MalCoA showed a 40.5% higher consumption rate than MMCoA (Figure 1d), we tried to improve the MalCoA supply in BC04 by overexpressing acetyl-CoA carboxylase (ACC), which catalyzes the formation of MMCoA from AcCoA.

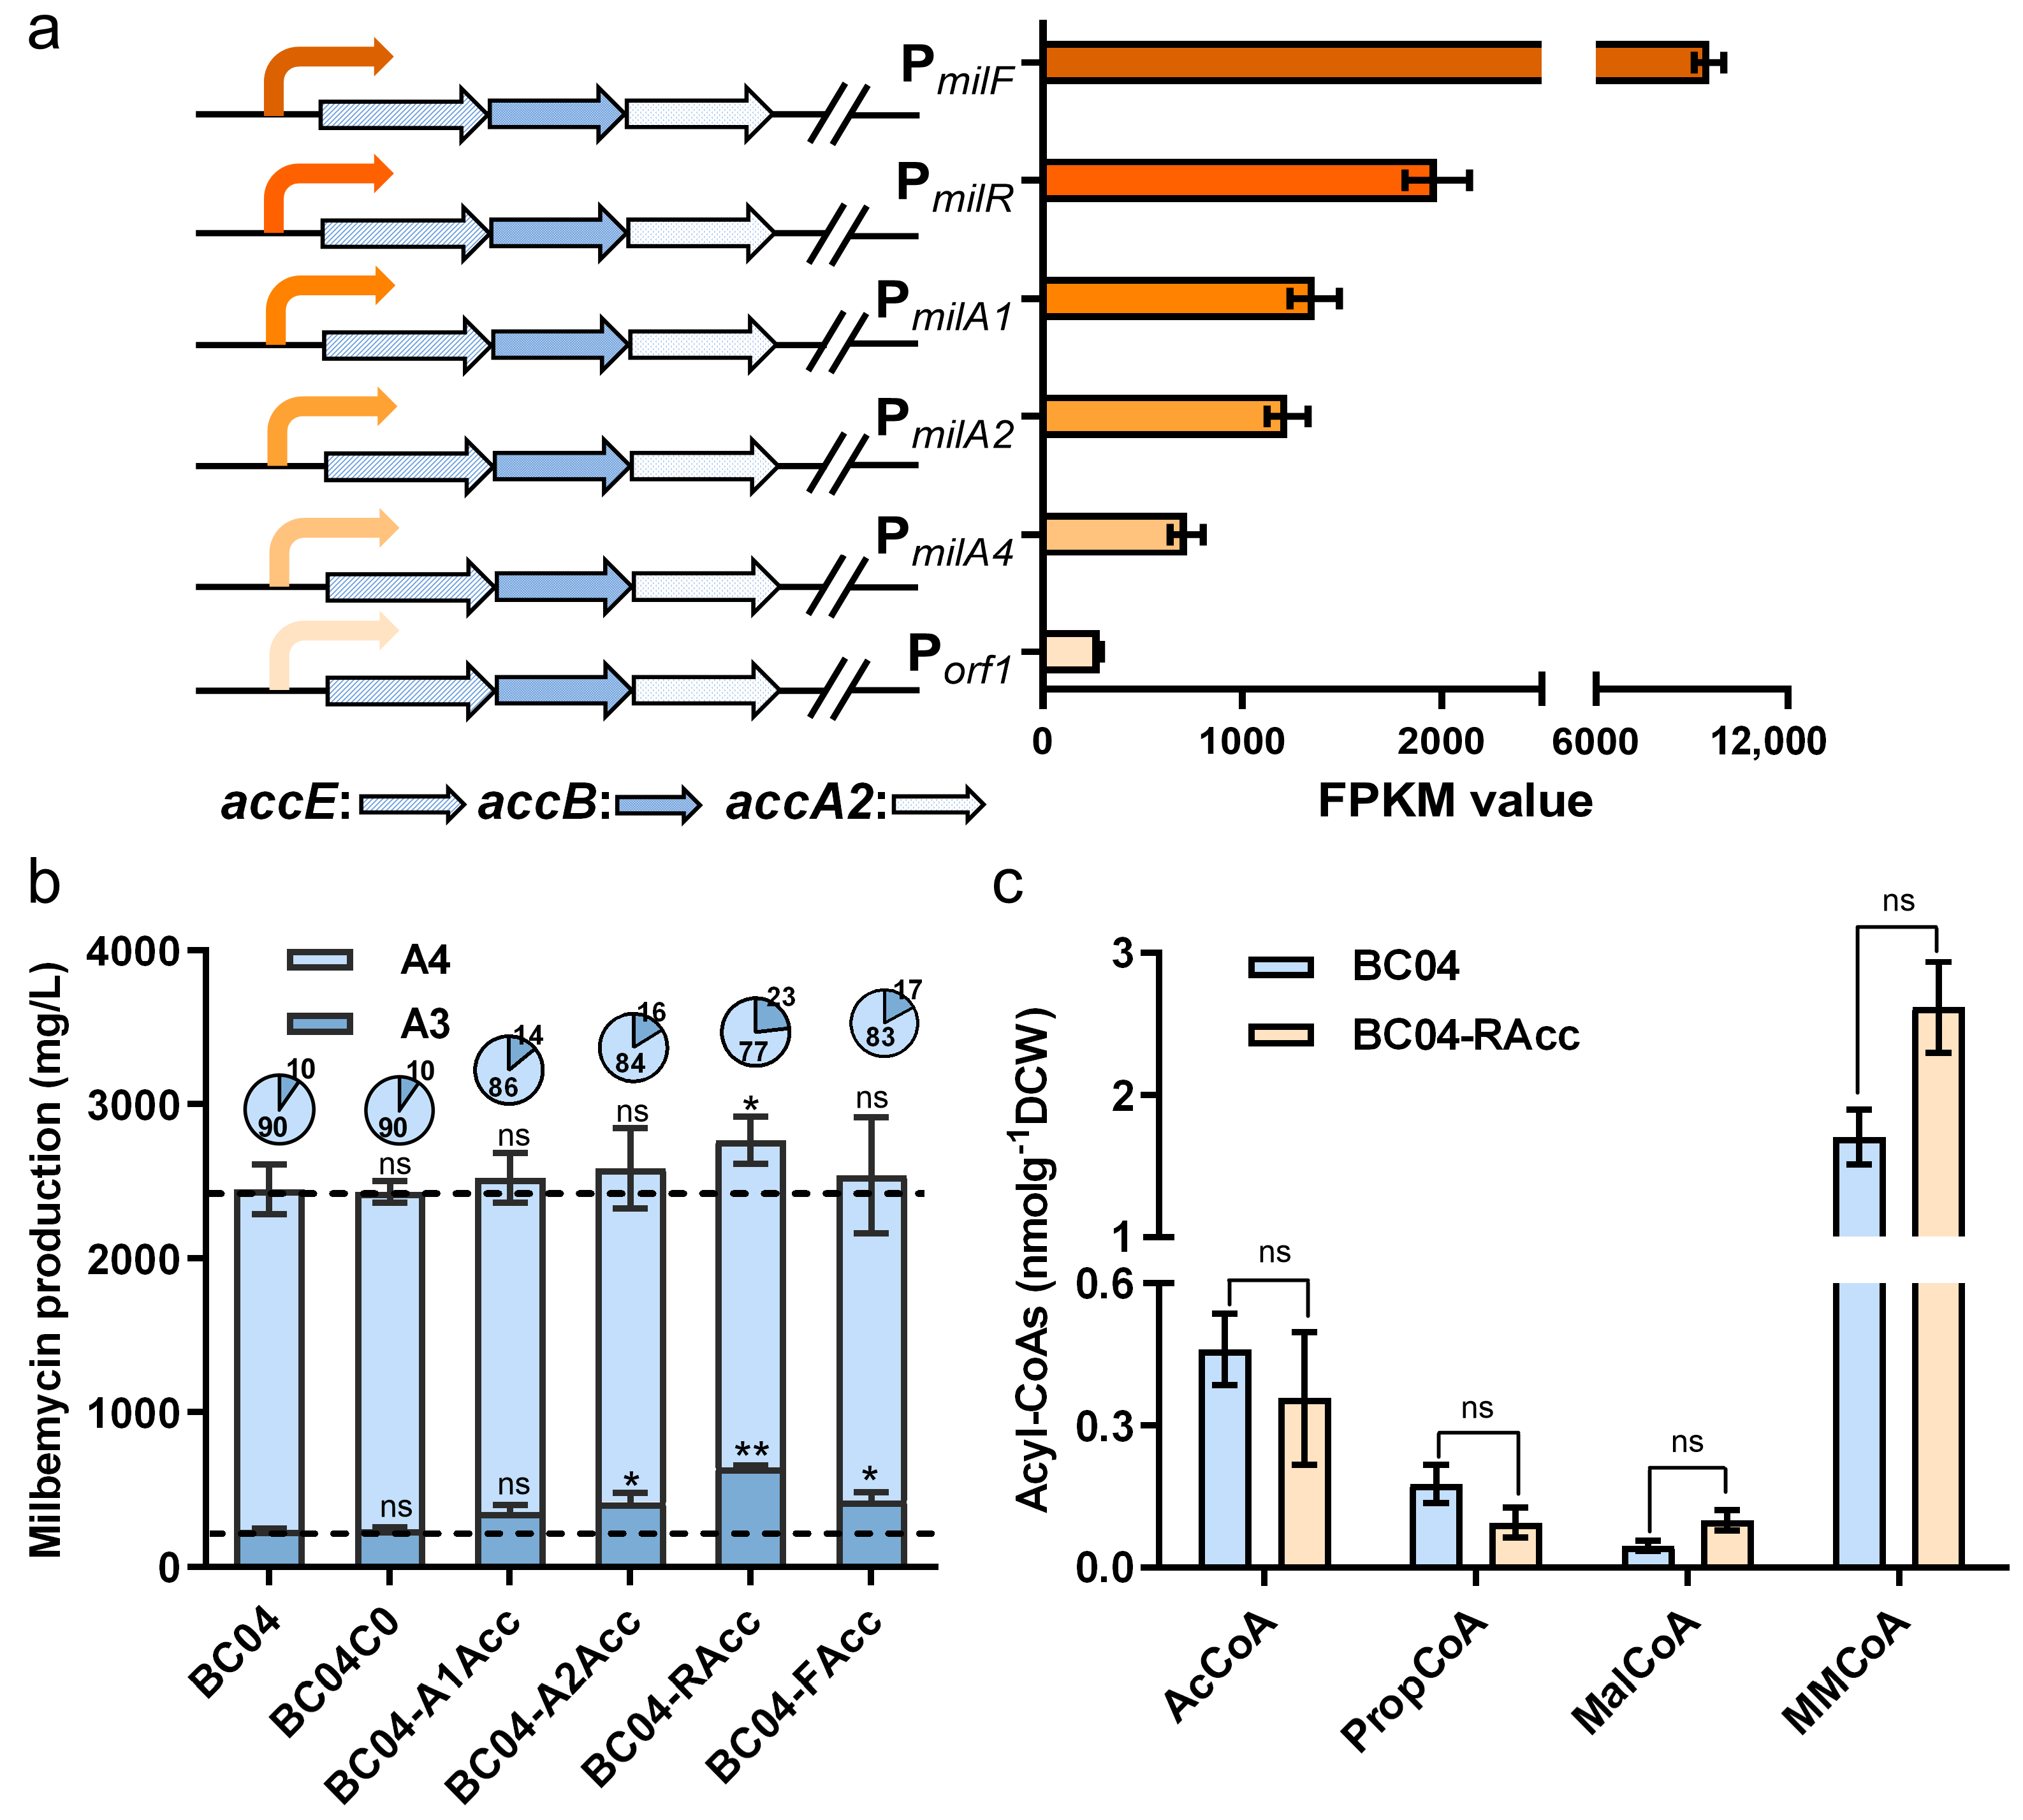
3.2. Fine-Tuning of MalCoA Precursor Supply

Acetyl-CoA carboxylase (ACC) catalyzes the formation of MalCoA from AcCoA in two steps: first, biotin carboxylase (BC) catalyzes the transfer of the carboxyl group to biotin to form carboxybiotin, which is attached to the biotin carboxyl carrier protein (BCCP); second, carboxyltransferase (CT) catalyzes the transfer of the carboxyl group from biotin to AcCoA, forming MalCoA. BCCP is a homodimer (subunit ε, AccE), while CT is a heterotetramer composed of two copies with two different subunits: α (AccA2) and β (AccB) [25]. Three genes encoding putative ACC were identified in Streptomyces coelicolor: sco4921, sco5535 and sco5536. Overexpression of these genes enhanced actinorhodin production about six-fold [26]. Orthologs of these genes were searched in S. bingchenggensis, and sbi_06761, sbi_03527 and sbi_03526, which showed 84%, 89% and 65% identity with sco4921, sco5535 and sco5536, respectively, were identified. We first put the expression of these subunits of ACC under the control of the constitutive promoter of hrdB, whereas the total titer of milbemycin A3/A4 showed little improvement (Figure S2). We speculated that this might be due to the metabolic burden caused by the strong constitutive expression of ACC. To address this issue, we tested different promoters of genes belonging to the milbemycin biosynthetic gene cluster (PmilF, PmilR, PmilA1, PmilA2, PmilA4 and Porf1) to coordinate the precursor supply and milbemycin biosynthetic requirements (Figure 2a).
The results showed that three temporal promoters (PmilA2, PmilR and PmilF) led to the titer improvement of milbemycin A3, while none of them resulted in the titer enhancement of milbemycin A4 (Figure 2b). In the strain BC04-Racc, using the PmilR promoter, A3 production was improved 1.7-fold and the component ratio of A4:A3 reduced 3.3-fold. However, the total milbemycin productions only increased by 12.9% to 2757.24 mg/L, and A4 production was almost unchanged (Figure 2b). We further analyzed the cellular concentrations of different acyl-CoA precursors in BC04 and BC04-Racc to explore the reasons. The data showed that, on the sixth day, ACC overexpression almost did not change the cellular concentration in AcCoA, whereas the MalCoA concentration was enhanced by 117% (Figure 2c). This indicated that ACC efficiently converted AcCoA into MalcoA and that the cellular pool of AcCoA was adequate. Meanwhile, we also found that the PropCoA concentration was only 34.7% lower in BC04-Racc than in BC04, while the MMCoA concentration was not significantly changed. Since the cellular AcCoA levels were much higher than that of PropCoA (Figure 1d), milbemycin A3 employing AcCoA as the starter unit should theoretically be more abundantly synthesized than milbemycin A4 when the abundance of the extender units is adequate. These data also suggest that it might be necessary to manipulate pathways contributing to the supplying of PropCoA and MMCoA for further titer improvements of milbemycin A3 and A4.

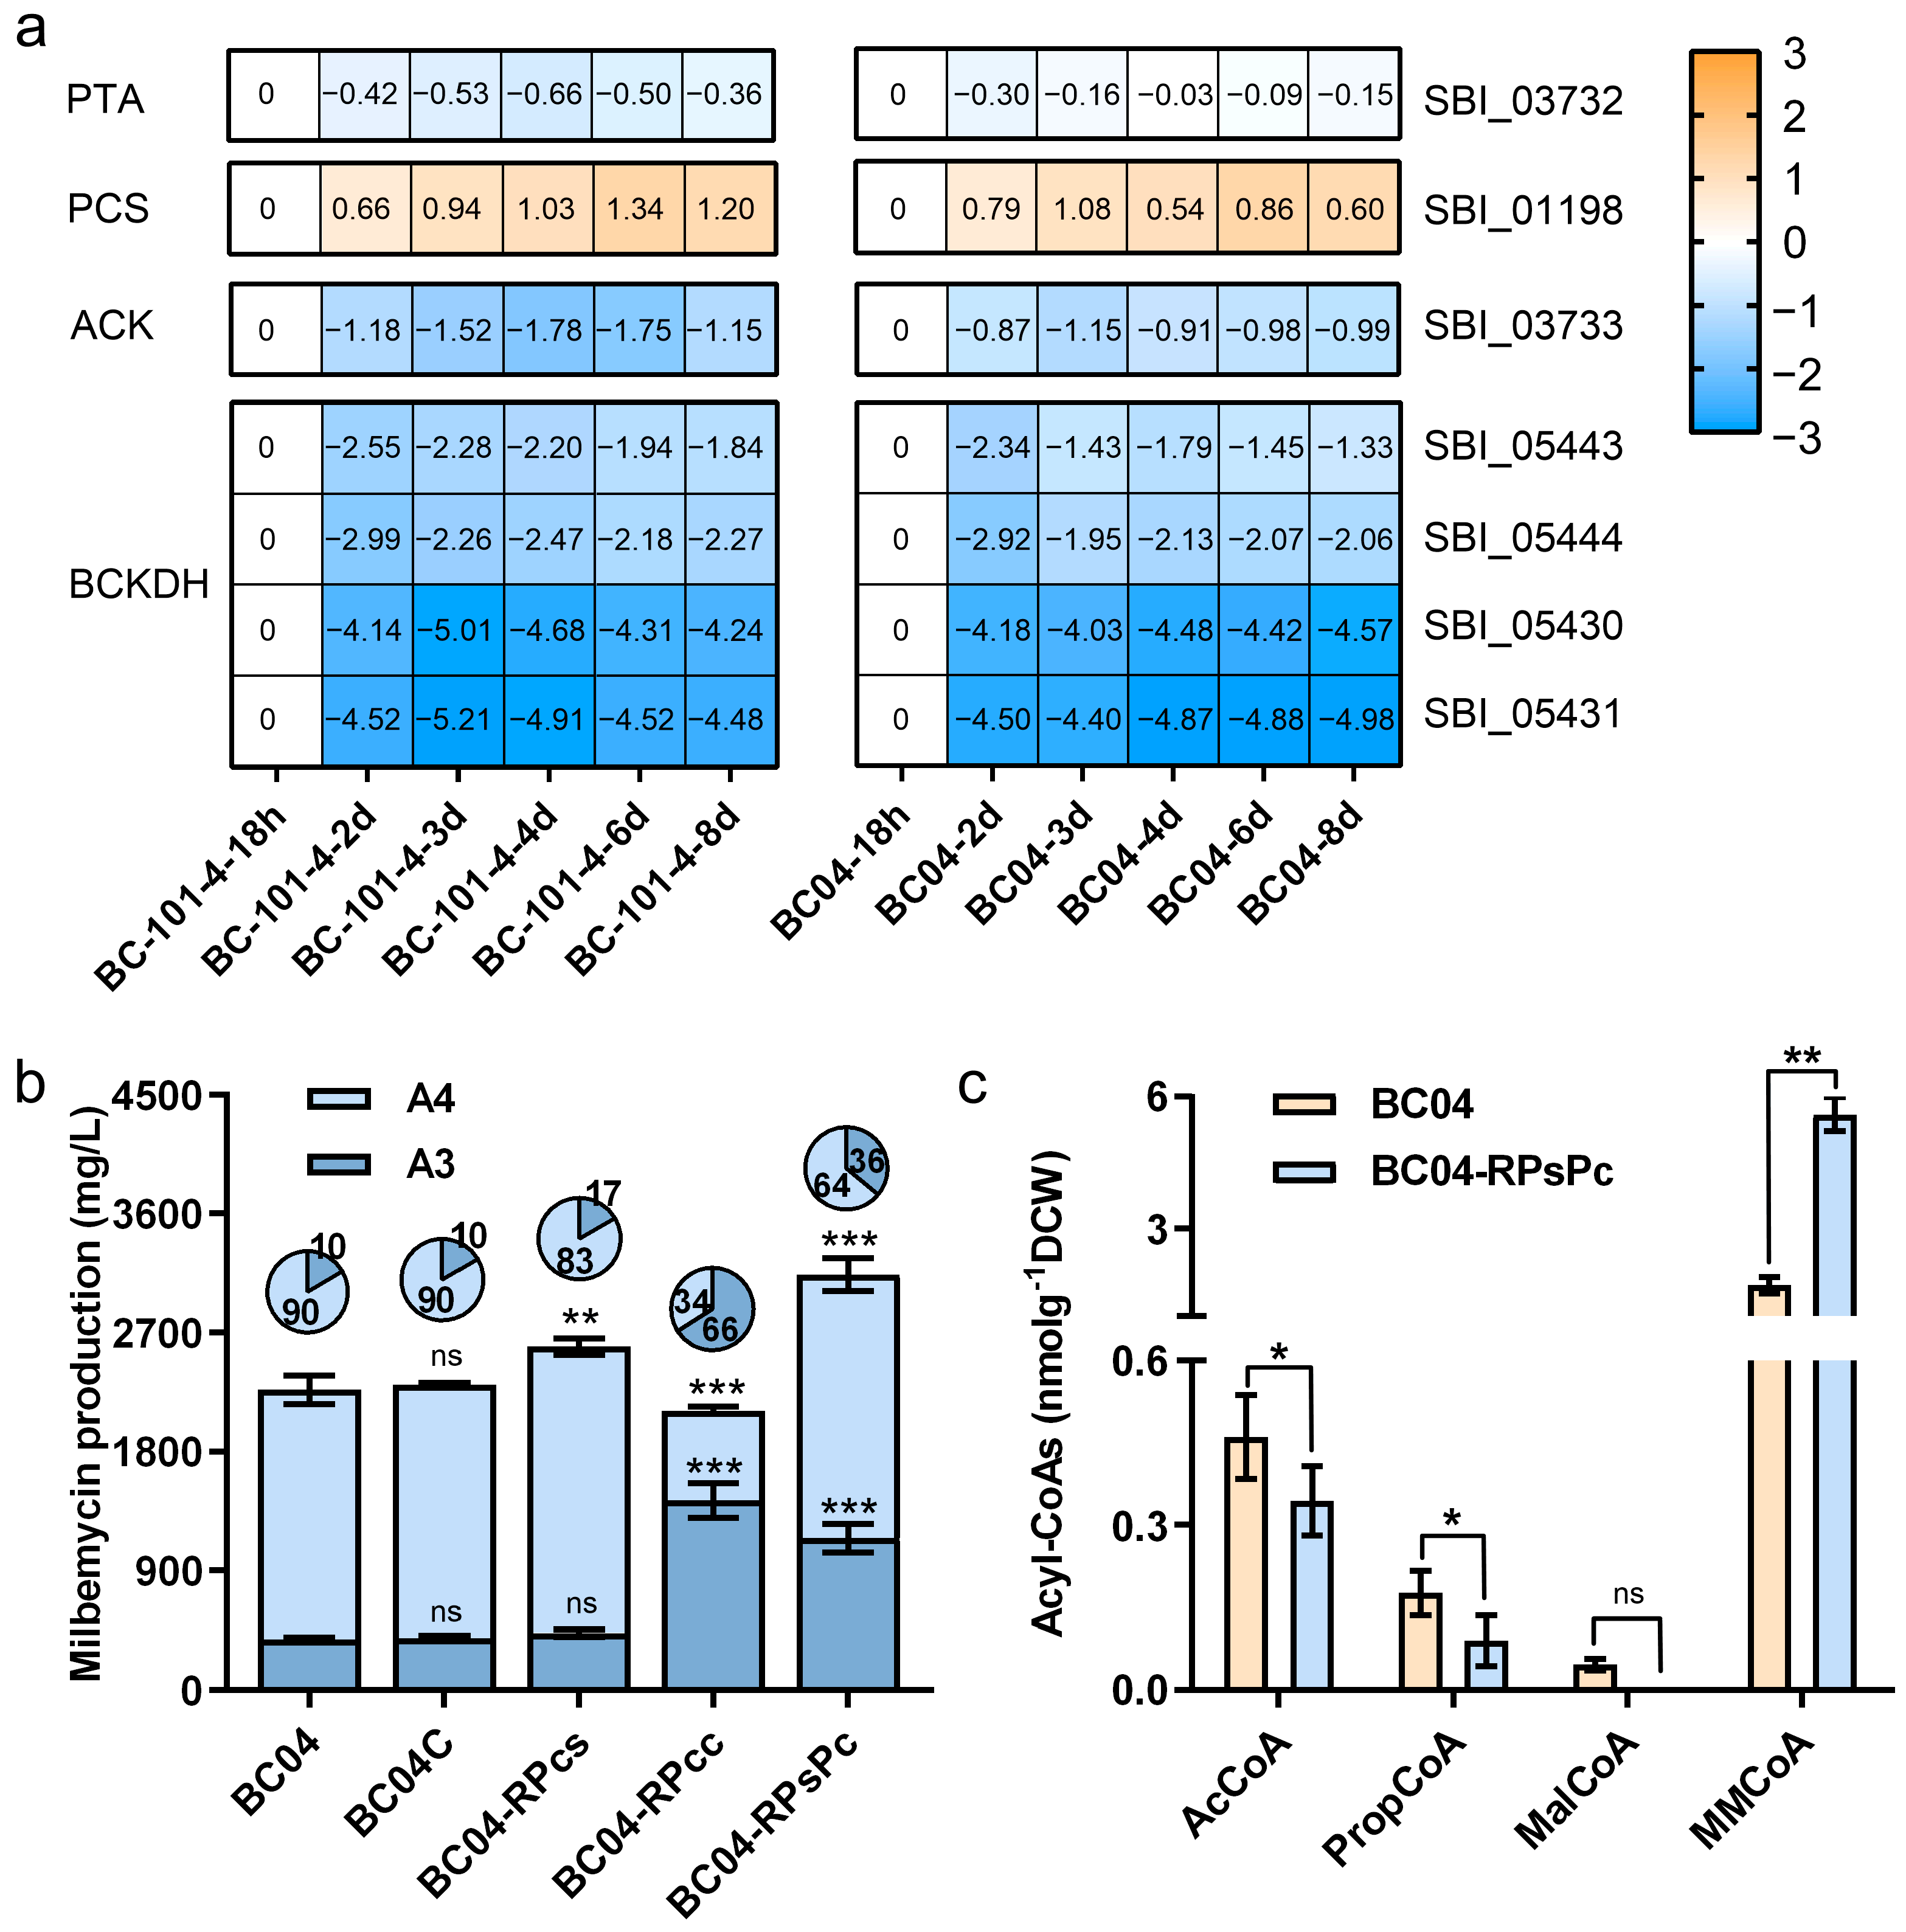
3.3. Engineering the PropCoA and MMCoA Supply Pathway

PropCoA can be biosynthesized from 2-oxobutanoate primarily via three pathways catalyzed by BCKDH, PAT, ACK and PCS. According to the time–course transcriptome data of S. bingchenggensis, we found that the transcription levels of genes encoding BCKDH and ACK were significantly reduced and that PTA was almost unchanged, while PCS was significantly enhanced in both BC-101-4 and BC04 (Figure 3a). These data suggested that PCS might play an important role in PropCoA supply. Given the relatively low transcription level of PCS-encoding gene sbi_01198, we further overexpressed this gene under the control of promoter PmilR. This led to 22.4% and 14.3% higher milbemycin titers, as well as to 32.6% and 14.7% increases of milbemycin A4 in BC-101-4 and BC04, respectively (Figure 3b and Figure S3), which indicated that the PropCoA supply was improved. Furthermore, we aimed to increase the ratio of A3 by increasing the MMCoA supply.
MMCoA can be derived from succinyl-CoA (SucCoA) after isomerization or from PropCoA via a carboxylation reaction. We first investigated the influence of the metabolic pathway linking SucCoA and MMCoA, which involved methylmalonyl-CoA mutase (MCM) and methylmalonyl-CoA epimerase (MCE). In S. bingchenggensis, MCM is encoded by genes sbi_03740 and sbi_04700, while MCE is encoded by gene sbi_03754. We co-overexpressed MCM and MCE by PmilR. The data showed that, despite the titers of total milbemycin A3/A4 improved in BC-101-4, such a manipulation seemed less useful in BC04 (Figure S4). We further examined the influence of propionyl-CoA carboxylase (PCC). PCC contains two subunits: α and β. Since PCC in S. coelicolor has been investigated, we selected SBI_04611 and SBI_04601, possessing high protein similarities with the known PCC of S. coelicolor, and overexpressed both of them by PmilR in S. bingchenggensis. Attractively, PCC overexpression significantly increased the proportion of A3 by 50.4% and 274.4% in BC-101-4 and BC04, respectively (Figure 3b and Figure S3). Further, we co-overexpressed PCS and PCC in S. bingchenggensis, which resulted in 64.2% and 38.4% higher milbemycin A3/A4 compared to their individual parent strains BC-101-4 and BC04, respectively (Figure 3b and Figure S3). Nevertheless, the proportion of A3 in both the PCS and PCC co-overexpressed strains was higher than their parental strains (Figure 3b and Figure S3). The cellular acyl-CoA analysis revealed that the concentrations of AcCoA and PropCoA in BC04-RPsPc were 25.4% and 49.0% lower, respectively, than in BC04, and MalCoA could not be detected. In contrast, the concentration of MMCoA was 229.4% higher in BC04-RPsPc than in BC04 (Figure 3c). Although the co-overexpression of PCS and PCC resulted in an enhanced precursor supply, which led to milbemycin titer improvement, the A4:A3 ratio remained unsatisfactory. This suggested that the levels of overexpression of PCS and PCC need to be finely tuned.

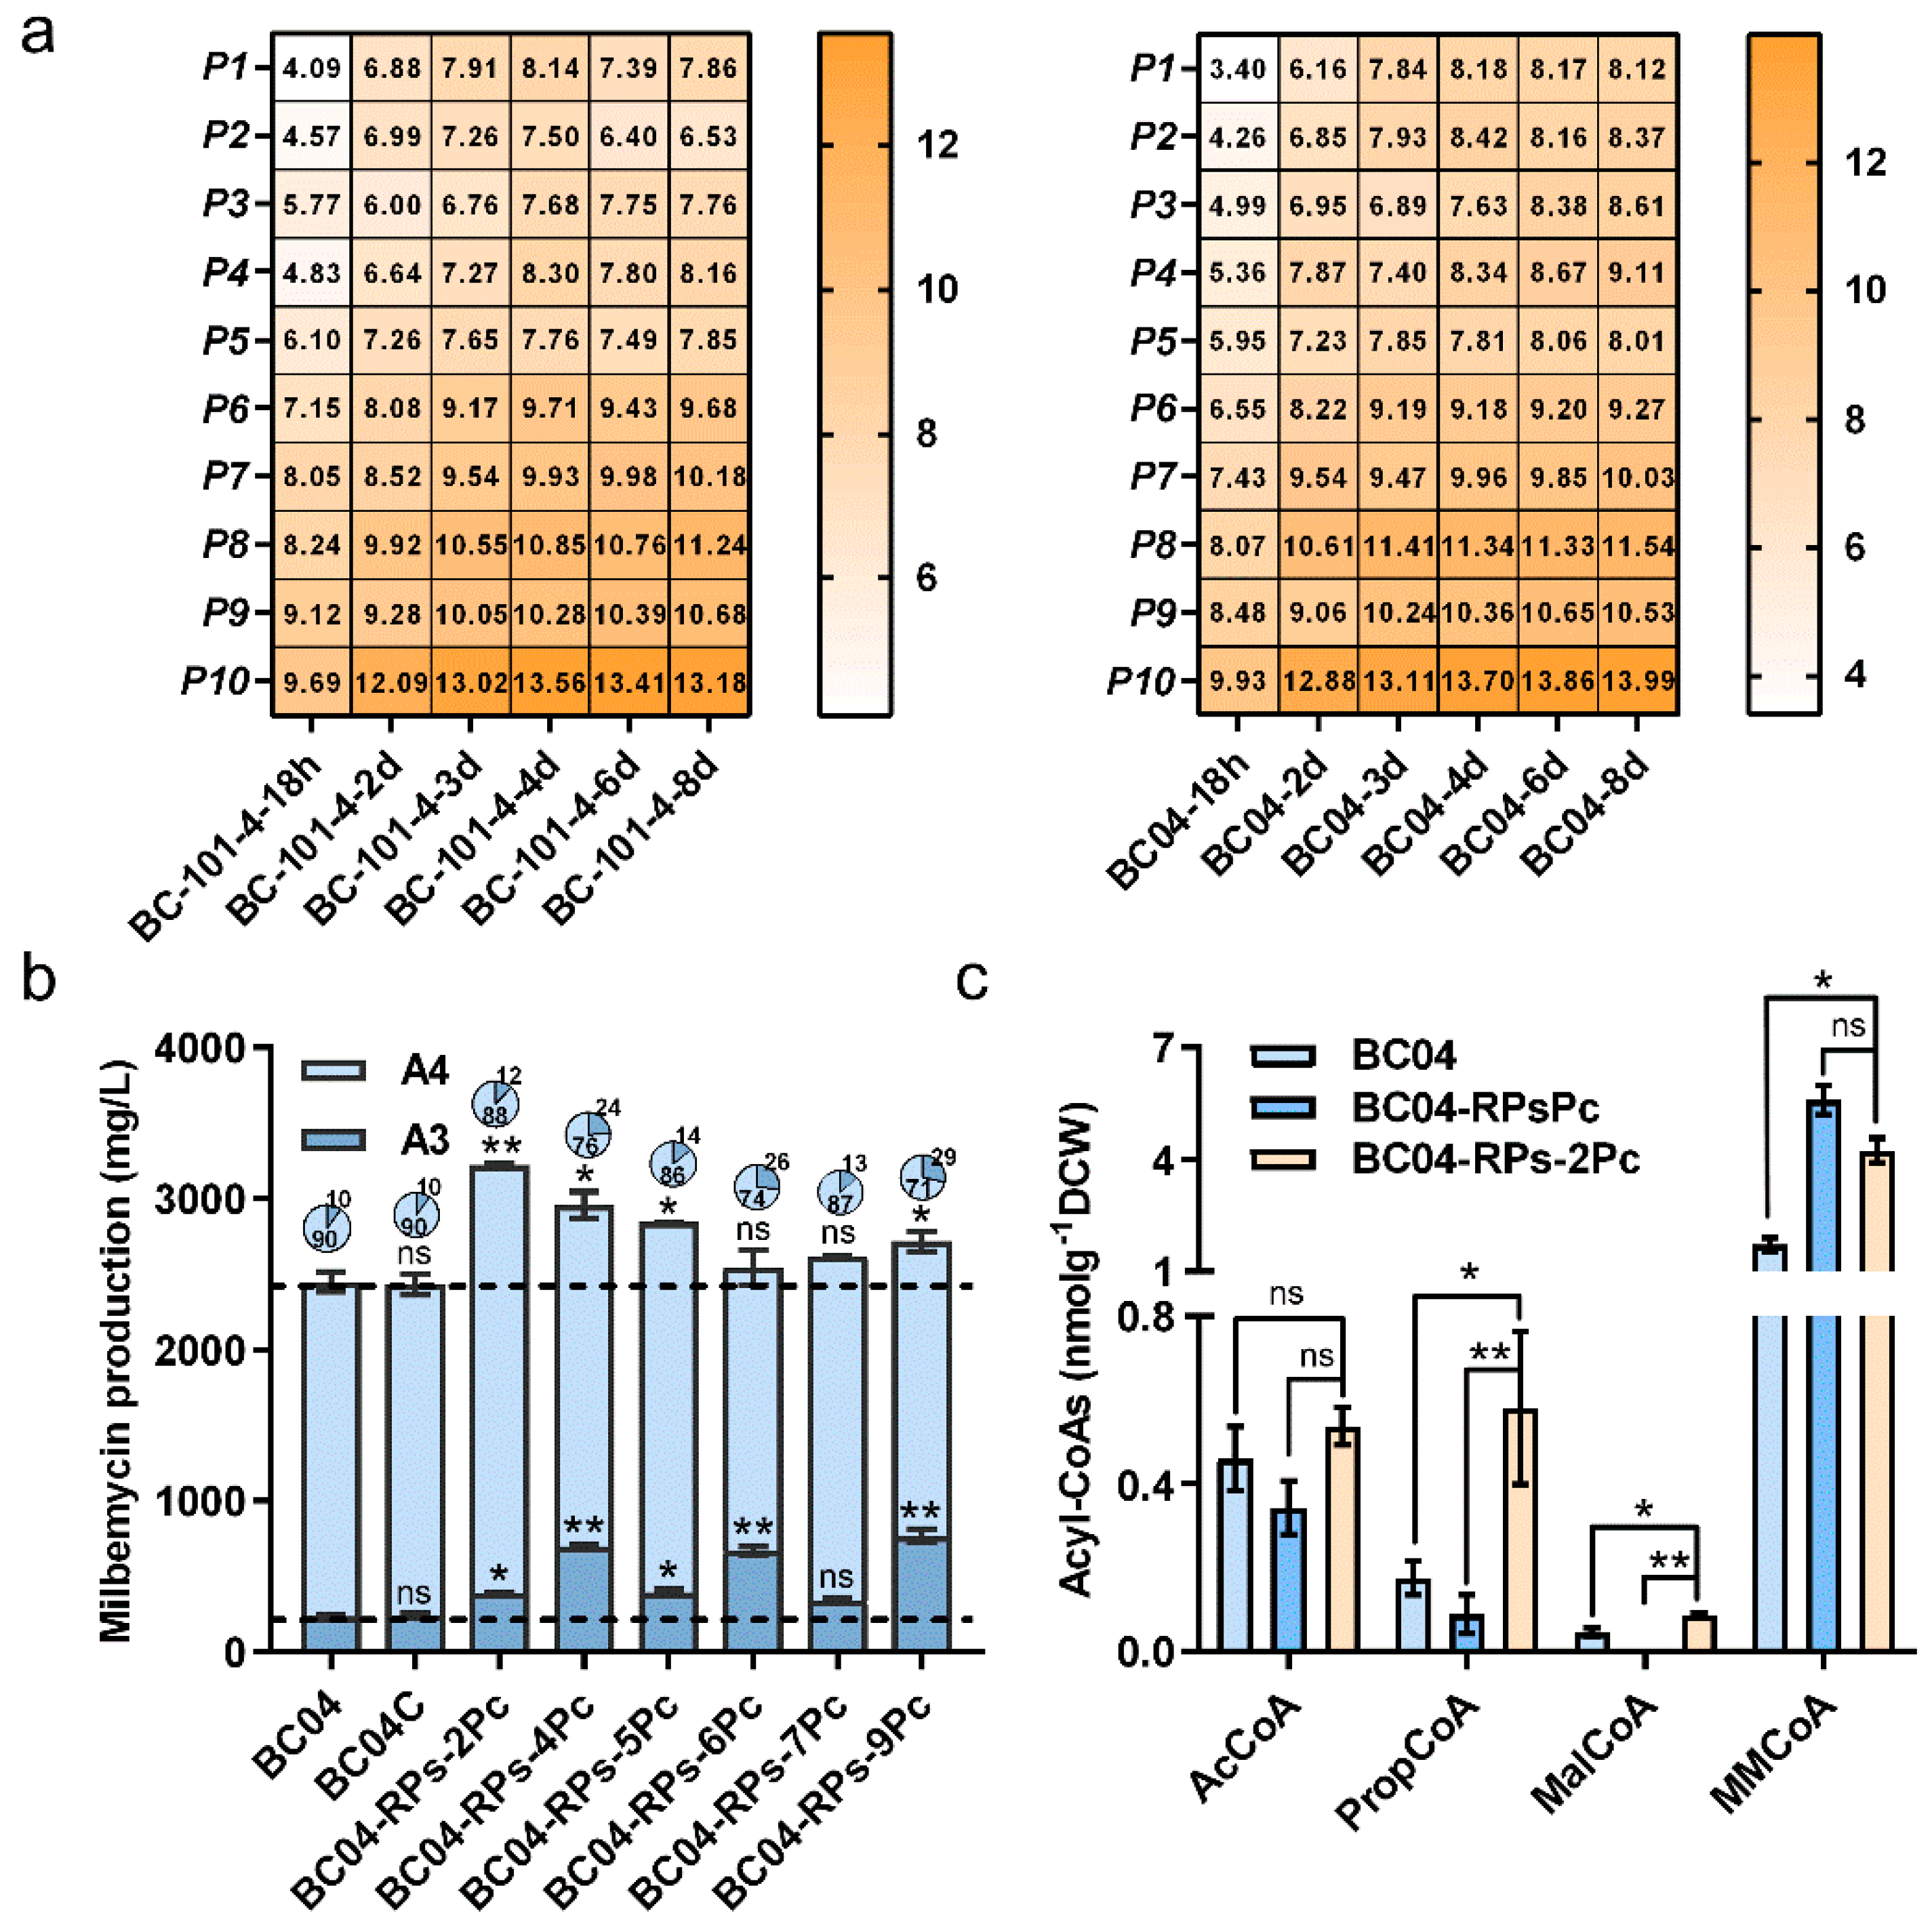
3.4. Fine-Tuning of PCC Expression Level

Based on the above results, we found the overexpression level of PCC had a crucial influence on the A4:A3 ratio (Figure 3b and Figure S4). We thus focused on fine-tuning the expression level of PCC in the PCS overexpressed strains. Ten native temporal promoters with significantly increased promoter strength after three days were selected based on the time–course transcriptome data of S. bingchenggensis (Figure 4a and Table S3). By using these promoters to control PCC overexpression, we found that six (P2, P4, P5, P6, P7 and P9) of them led to increased milbemycins. The engineered strain BC04-RPs-2Pc using the P2 promoter showed the highest milbemycin production of 3223.97 mg/L, which was 31.6% higher than that of BC04 (Figure 4b). Although the titers of A3 and A4 were enhanced 63.1% and 28.2%, the component ratio of A4:A3 was 7.3-fold (Figure 4b), which was not in the qualified range between 2.3- and 4.0-fold. The analyses of concentrations of different acyl-CoA precursors indicated that the MMCoA and PropCoA levels were increased by 148.8% and 230.6%, respectively, in strain BC04-RPs-2Pc in comparison with strain BC04 (Figure 4c). In contrast, the MMCoA and PropCoA levels were reduced by 24.5% and increased by 548.0%, respectively, in strain BC04-RPs-2Pc in comparison with strain BC04-RPsPc. These results suggested that the dynamic regulation of the PCC expression level could possibly correct the imbalance ratio between the starter unit PropCoA and the extender unit MMCoA and thus maintain a qualified A4:A3 ratio while increasing the production of milbemycins.

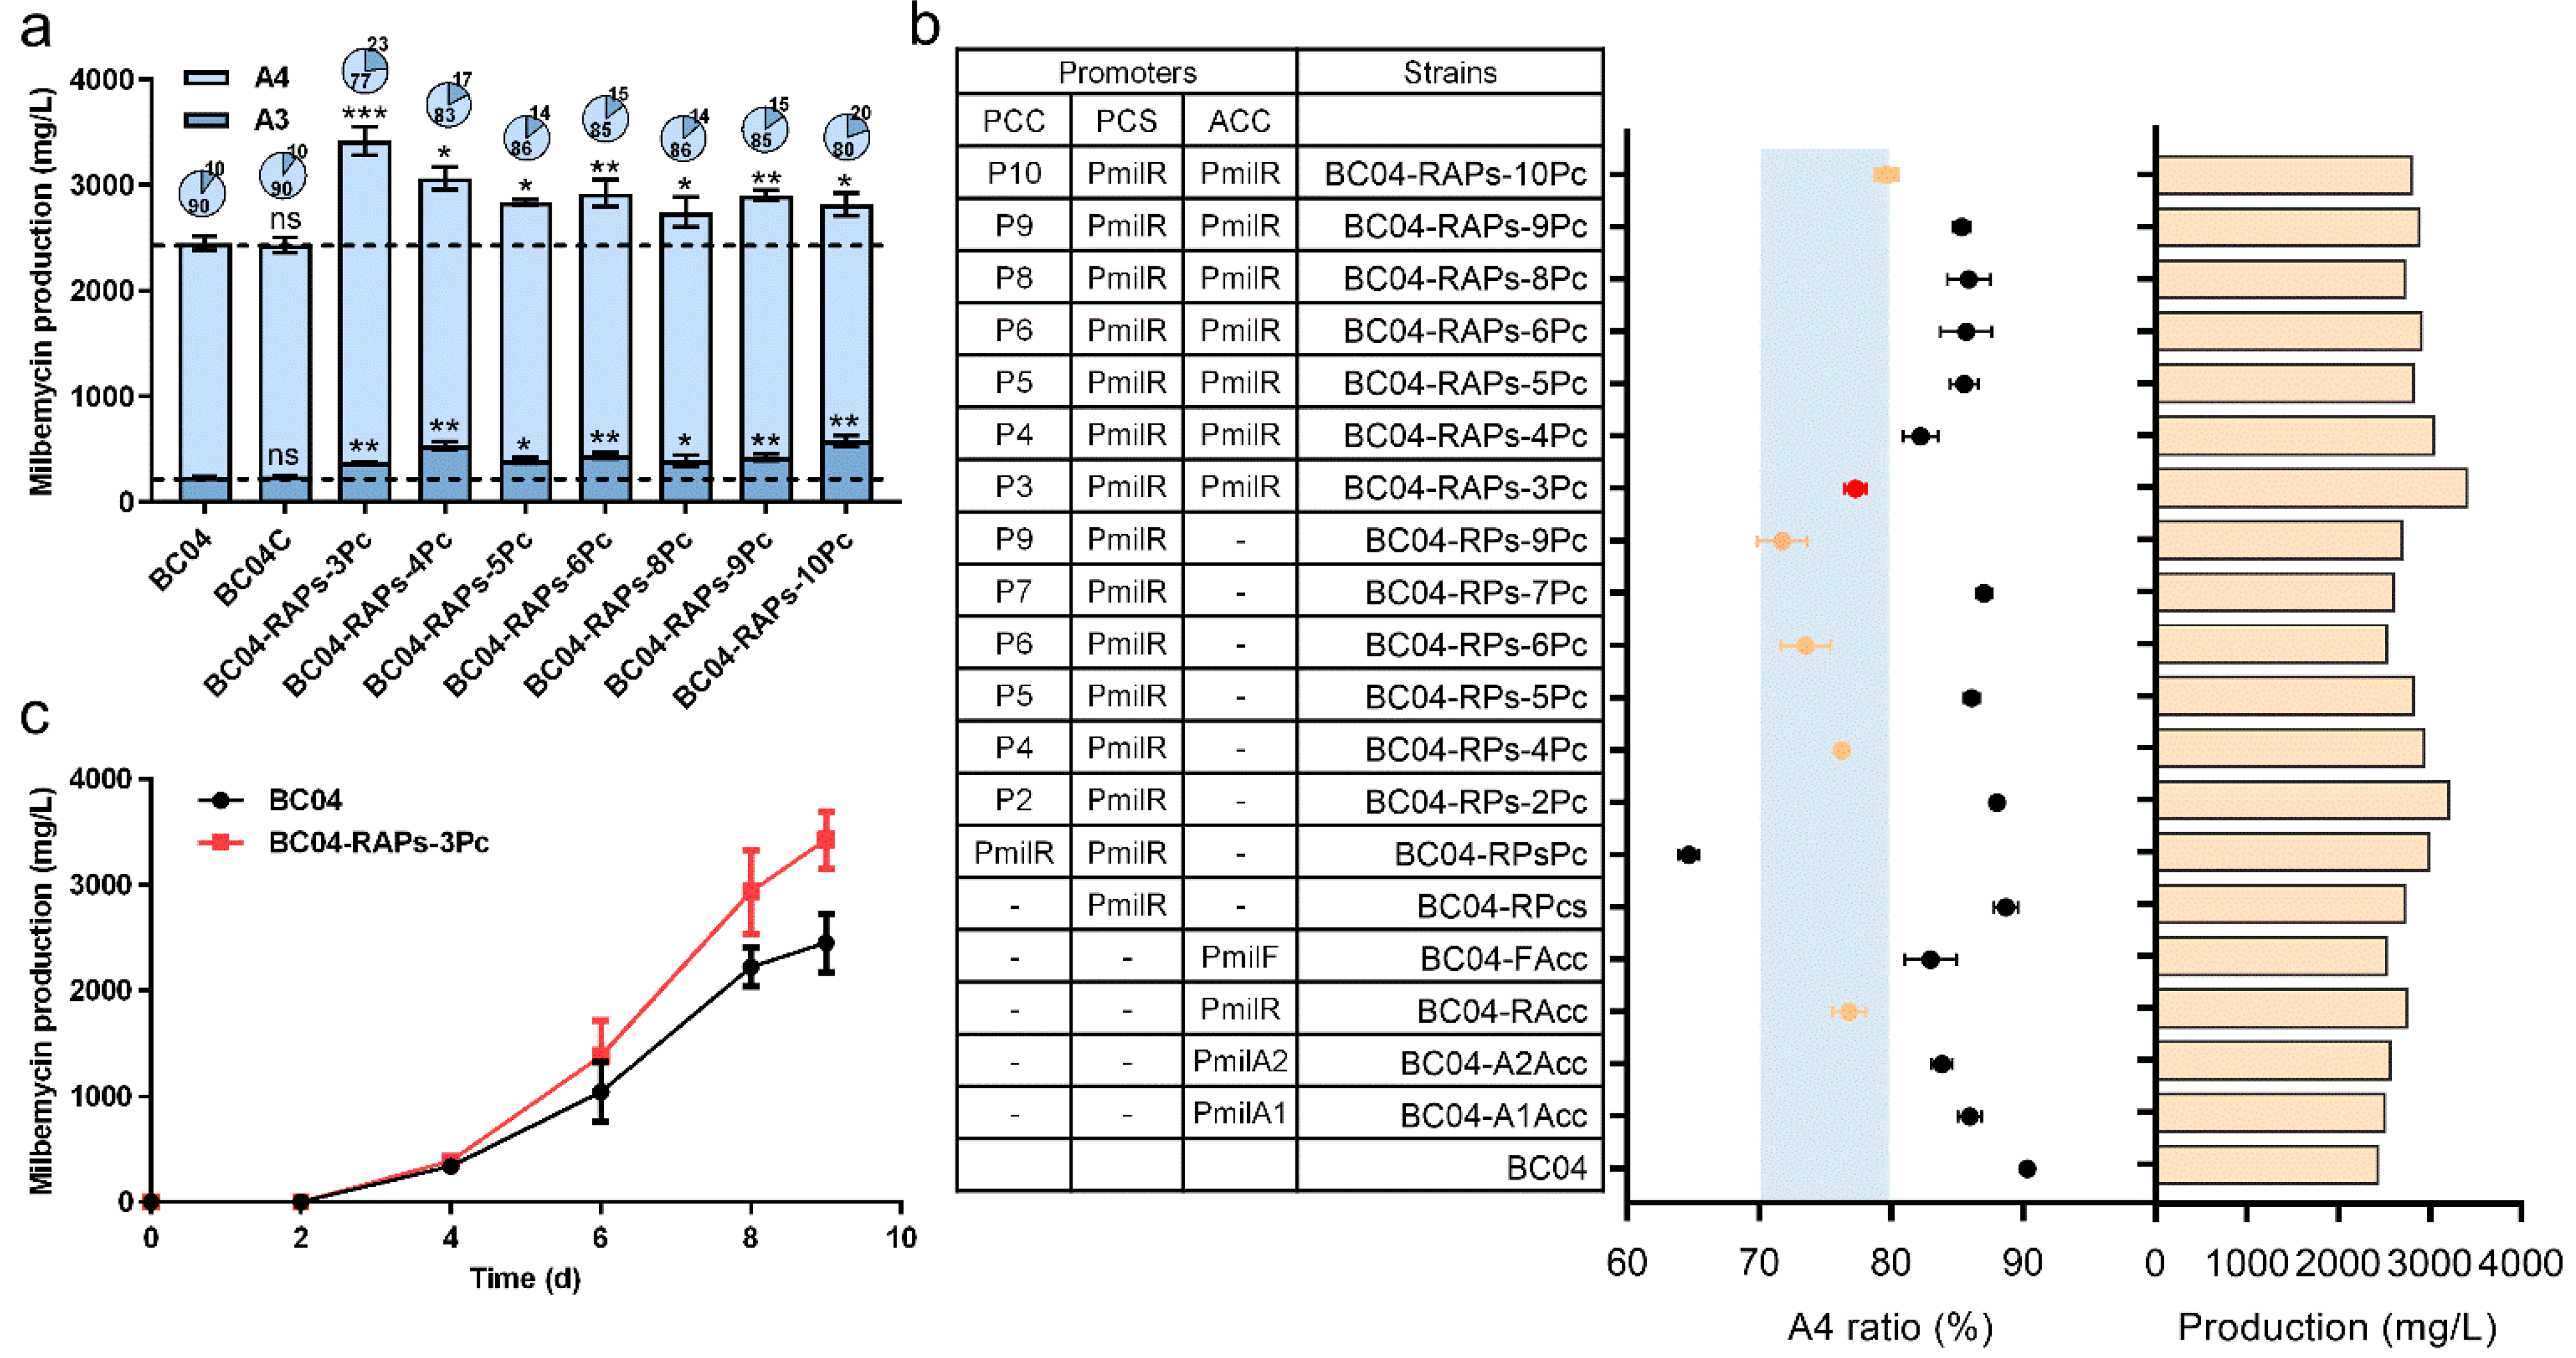
3.5. System Modulation of Precursor Supply for Improved Ratio of Milbemycin A3 and A4

The concentration of MalCoA was relatively lower in BC04-RPs-2Pc than the other acyl-CoA precursors (Figure 4d); we thus focused on improving the MalCoA supply by the further overexpression of ACC in BC04-RPs-2Pc. The results showed that seven strains significantly increased milbemycin production compared with BC04, and two of them had a qualified component ratio of A4:A3 (Figure 5a,b). Among the 19 engineered strains with increased milbemycin titers, six showed a qualified component ratio of A4:A3 (Figure 5b). In the best strain of BC04-RAPs-3Pc, milbemycin production was increased by 39.5% to 3417.88 mg/L and a qualified component ratio A4:A3 of 3.3-fold (Figure 5c). An analysis of the intracellular contents of each precursor showed that the amounts of MMCoA, AcCoA and PropCoA were 163.5%, 167.4% and 513.6%, respectively, higher in strain BC04-RAPs-3Pc than in strain BC04 (Figure S5). These results indicated that the fine-tuning of the availability of multiple key intracellular precursors was far more efficient to improve milbemycin titers than the tuning of a single precursor pathway.

4. Discussion

For commercialized application of natural products, it is necessary to control the nature and proportion of the relevant precursors. Byproducts competing for precursors and energy could be eliminated or reduced by various strategies, such as multi-omics-based techniques, metabolic engineering and the optimization of fermentation conditions used to increase the ratios of highly active components [27,28,29]. Milbemycin A4 and A3 are the main active components of milbemycins and its derivatives, and a ratio of A4:A3 ranging from 2.3- to 4-fold is required for optimal activity. However, the current milbemycin producers still cannot meet this requirement, which constitutes a bottleneck in the milbemycin fermentation industry. Our study aimed to optimize the composition ratio of milbemycin A4 and A3 by fine-tuning the precursor supply using temporal promoters, and our approach simultaneously promoted milbemycin production.
The primary metabolites of central carbon metabolism usually provide precursors for the biosynthesis of secondary metabolites in Streptomyces. According to metabolomics data, the concentrations of both the starter units and extender units of milbemycin A3/A4 in high-yielding strain BC04 were higher than wild-type strain BC-101-4 (Figure 1d), indicating that the enhancement of the precursors promotes milbemycin biosynthesis. Moreover, numerous studies demonstrated that an increase in the precursor supply by metabolic engineering as an effective way to increase the yield of target products to reach industrially relevant product titers [30,31,32,33]. For instance, the titers of rapamycin and FK506 were improved by the engineering of PCC in S. hygroscopicus and Streptomyces clavuligerus, respectively [34,35]. In our case, since the difference in the biosynthesis of milbemycin A3 and A4 is the nature of the starter unit, it should be possible to obtain a qualified producer by finely tuning and enhancing the supply of different starter units, as well as of extender units. Milbemycin biosynthesis requires four different precursors, and the extender units come from starter units. Therefore, it is crucial to find out what is the limiting precursor for titer improvement and/or composition optimization. Based on the cellular acyl-CoA analysis, we found that the extender unit, MalCoA, exhibited the lowest concentration and the fastest consumption rate (Figure 1d). Since MalCoA is the essential precursor for polyketide biosynthesis, we first focused on its enhancement by overexpressing an ACC. This strategy promoted the biosynthesis of both milbemycin A3 and A4 (Figure 2b), but the resulting limited PropCoA availability restricted A4 biosynthesis, further hindering the titer improvement of milbemycins (Figure 2c). Additionally, Prop-CoA is, at the same time, the starter unit of A4, as well as the direct precursor of another essential extender unit, MMCoA. Therefore, it was necessary to finely tune the overexpression level of PCC to balance the PropCoA and MMCoA availability. We tested ten native promoters whose expression was upregulated after 3 days of cultivation to dynamically regulate the expression levels of PCC. The results showed that these manipulations corrected the imbalance ratio between starter unit PropCoA and extender unit MMCoA (Figure 4), indicating that the supply of MMCoA was increased while starter unit MalCoA was not overconsumed. We finally obtained six strains with qualified A4:A3 ratios by engineering precursor supply pathways. Among them, the highest milbemycin production strain reached 3417.88 mg/L, which might be useful to further develop the industrial producer.
Our data suggest that the fine-tuning of the precursor supply using temporal promoters is a useful approach to optimize the A4 and A3 composition ratio of milbemycins, as well as to improve milbemycin titers. Moreover, this strategy might also be useful in constructing high-yield strains with optimized component ratios for other bioactive compounds originating from different Streptomyces species.

Supplementary Materials

The following supporting information can be downloaded at: https://www.mdpi.com/article/10.3390/fermentation9060555/s1: Figure S1: Time–course curves of cell growth and milbemycin production. Figure S2: Mutant strains without significant effects on milbemycin production in the precursor coordination strategy. Figure S3: The milbemycin production of PCS and PCC overexpression strains in BC-101-4. Figure S4: The milbemycin production of MCM and MCE overexpression strains in BC-101-4 and BC04. Figure S5: The precursor concentrations of strains BC04 and BC04-RAPs-3Pc. Table S1: Strains and plasmids used in this work. Table S2: Primers used in this work. Table S3, Temporal promoters and their strengths in BC-101-4 and BC04 used in this work.

Author Contributions

Conceptualization, X.Y., P.J., S.L. and W.X.; Methodology, X.Y. and P.J.; Validation, X.Y., P.J. and S.L.; Formal Analysis, Z.D.; Visualization, X.Y.; Writing—Original Draft Preparation, X.Y. and P.J.; Writing—Review and Editing, Y.Z., S.L. and W.X.; Supervision, S.L. and W.X.; Project Administration, S.L. and W.X. and Funding Acquisition, S.L. and Y.Z. All authors have read and agreed to the published version of the manuscript.

Funding

This work received financial support from the National Natural Science Foundation of China (31972348, 32172502 and 32272635).

Institutional Review Board Statement

Not applicable.

Informed Consent Statement

Not applicable.

Data Availability Statement

The datasets supporting the conclusions of this article are included within the article and the Supplementary Materials.

Conflicts of Interest

The authors declare no conflict of interest.

References

  1. Newman, D.J.; Cragg, G.M. Natural products as sources of new drugs over the 30 years from 1981 to 2010. J. Nat. Prod. 2012, 75, 311–335. [Google Scholar] [CrossRef] [PubMed] [Green Version]
  2. Liu, G.; Chater, K.F.; Chandra, G.; Niu, G.; Tan, H. Molecular regulation of antibiotic biosynthesis in Streptomyces. Microbiol. Mol. Biol. Rev. 2013, 77, 112–143. [Google Scholar] [CrossRef] [PubMed] [Green Version]
  3. Li, S.; Yang, B.; Tan, G.Y.; Ouyang, L.M.; Qiu, S.; Wang, W.; Xiang, W.; Zhang, L. Polyketide pesticides from actinomycetes. Curr. Opin. Biotechnol. 2021, 69, 299–307. [Google Scholar] [CrossRef] [PubMed]
  4. Ikeda, H.; Nonomiya, T.; Usami, M.; Ohta, T.; Omura, S. Organization of the biosynthetic gene cluster for the polyketide anthelmintic macrolide avermectin in Streptomyces avermitilis. Proc. Natl. Acad. Sci. USA 1999, 96, 9509–9514. [Google Scholar] [CrossRef] [PubMed] [Green Version]
  5. Hertweck, C. The biosynthetic logic of polyketide diversity. Angew. Chem. Int. Ed. Engl. 2009, 48, 4688–4716. [Google Scholar] [CrossRef] [PubMed]
  6. Lu, C.; Zhang, X.; Jiang, M.; Bai, L. Enhanced salinomycin production by adjusting the supply of polyketide extender units in Streptomyces albus. Metab. Eng. 2016, 35, 129–137. [Google Scholar] [CrossRef] [PubMed]
  7. Takiguchi, Y.; Mishima, H.; Okuda, M.; Terao, M.; Aoki, A.; Fukuda, R. Milbemycins, a new family of macrolide antibiotics: Fermentation, isolation and physico-chemical properties. J. Antibiot. 1980, 33, 1120–1127. [Google Scholar] [CrossRef] [Green Version]
  8. Kim, M.S.; Cho, W.J.; Song, M.C.; Park, S.W.; Kim, K.; Kim, E.; Lee, N.; Nam, S.J.; Oh, K.H.; Yoon, Y.J. Engineered biosynthesis of milbemycins in the avermectin high-producing strain Streptomyces avermitilis. Microb. Cell Factories 2017, 16, 9. [Google Scholar] [CrossRef] [Green Version]
  9. Campbell, W.C. History of avermectin and ivermectin, with notes on the history of other macrocyclic lactone antiparasitic agents. Curr. Pharm. Biotechnol. 2012, 13, 853–865. [Google Scholar] [CrossRef]
  10. Zhao, J.; Xu, X.; Ji, M.; Cheng, J.; Zhu, G. Design, synthesis, and biological activities of milbemycin analogues. J. Agric. Food Chem. 2011, 59, 4836–4850. [Google Scholar] [CrossRef]
  11. Zhang, Y.; He, H.; Liu, H.; Wang, H.; Wang, X.; Xiang, W. Characterization of a pathway-specific activator of milbemycin biosynthesis and improved milbemycin production by its overexpression in Streptomyces bingchenggensis. Microb. Cell Factories 2016, 15, 152. [Google Scholar] [CrossRef] [PubMed] [Green Version]
  12. Yan, Y.; Xia, H. Recent advances in the research of milbemycin biosynthesis and regulation as well as strategies for strain improvement. Arch. Microbiol. 2021, 203, 5849–5857. [Google Scholar] [CrossRef]
  13. Wang, X.; Wang, X.; Xiang, W. Improvement of milbemycin-producing Streptomyces bingchenggensis by rational screening of ultraviolet- and chemically induced mutants. World J. Microbiol. Biotechnol. 2009, 25, 1051–1056. [Google Scholar] [CrossRef]
  14. Xiang, W.; Wang, J.; Wang, X.; Zhang, J. Two new beta-class milbemycins from Streptomyces bingchenggensis: Fermentation, isolation, structure elucidation and biological properties. J. Antibiot. 2007, 60, 351–356. [Google Scholar] [CrossRef] [PubMed] [Green Version]
  15. Wang, H.; Zhang, J.; Zhang, Y.; Zhang, B.; Liu, C.; He, H.; Wang, X.; Xiang, W. Combined application of plasma mutagenesis and gene engineering leads to 5-oxomilbemycins A3/A4 as main components from Streptomyces bingchenggensis. Appl. Microbiol. Biotechnol. 2014, 98, 9703–9712. [Google Scholar] [CrossRef]
  16. He, H.; Ye, L.; Li, C.; Wang, H.; Guo, X.; Wang, X.; Zhang, Y.; Xiang, W. SbbR/SbbA, an Important ArpA/AfsA-Like System, Regulates Milbemycin Production in Streptomyces bingchenggensis. Front. Microbiol. 2018, 9, 1064. [Google Scholar] [CrossRef] [Green Version]
  17. Yang, X.; Zhang, Y.; Li, S.; Ye, L.; Wang, X.; Xiang, W. SspH, a Novel HATPase Family Regulator, Controls Antibiotic Biosynthesis in Streptomyces. Antibiotics 2022, 11, 538. [Google Scholar] [CrossRef]
  18. Ye, L.; Zhang, Y.; Li, S.; He, H.; Ai, G.; Wang, X.; Xiang, W. Transcriptome-guided identification of a four-component system, SbrH1-R, that modulates milbemycin biosynthesis by influencing gene cluster expression, precursor supply, and antibiotic efflux. Synth. Syst. Biotechnol. 2022, 7, 705–717. [Google Scholar] [CrossRef]
  19. Jin, P.; Li, S.; Zhang, Y.; Chu, L.; He, H.; Dong, Z.; Xiang, W. Mining and fine-tuning sugar uptake system for titer improvement of milbemycins in Streptomyces bingchenggensis. Synth. Syst. Biotechnol. 2020, 5, 214–221. [Google Scholar] [CrossRef]
  20. Chu, L.; Li, S.; Dong, Z.; Zhang, Y.; Jin, P.; Ye, L.; Wang, X.; Xiang, W. Mining and engineering exporters for titer improvement of macrolide biopesticides in Streptomyces. Microb. Biotechnol. 2022, 15, 1120–1132. [Google Scholar] [CrossRef]
  21. Sambrock, J.; Russel, D.J.I. Molecular Cloning: A Laboratory Manual; Cold Spring Harbour Laboratory Press: New York, NY, USA, 2001; Volume 49, pp. 895–909. [Google Scholar]
  22. Keiser, T.; Bipp, M.; Buttner, M.; Chater, K.F.; Hopwood, D.A. Practical Streptomyces Genetics; The John Innes Foundation: Norwich, UK, 2000. [Google Scholar]
  23. Bierman, M.; Logan, R.; O’Brien, K.; Seno, E.T.; Rao, R.N.; Schoner, B.E. Plasmid cloning vectors for the conjugal transfer of DNA from Escherichia coli to Streptomyces spp. Gene 1992, 116, 43–49. [Google Scholar] [CrossRef] [PubMed]
  24. Peyraud, R.; Kiefer, P.; Christen, P.; Massou, S.; Portais, J.C.; Vorholt, J.A. Demonstration of the ethylmalonyl-CoA pathway by using 13C metabolomics. Proc. Natl. Acad. Sci. USA 2009, 106, 4846–4851. [Google Scholar] [CrossRef] [PubMed] [Green Version]
  25. Vance, D.E.; Vance, J.E. Biochemistry of Lipids, Lipoproteins and Membranes; Elsevier Science: New York, NY, USA, 2002. [Google Scholar]
  26. Ryu, Y.G.; Butler, M.J.; Chater, K.F.; Lee, K.J. Engineering of primary carbohydrate metabolism for increased production of actinorhodin in Streptomyces coelicolor. Appl. Environ. Microbiol. 2006, 72, 7132–7139. [Google Scholar] [CrossRef] [PubMed] [Green Version]
  27. Zheng, J.; Li, Y.; Guan, H.; Li, J.; Li, D.; Zhang, J.; Tan, H. Component Optimization of Neomycin Biosynthesis via the Reconstitution of a Combinatorial Mini-Gene-Cluster in Streptomyces fradiae. ACS Synth. Biol. 2020, 9, 2493–2501. [Google Scholar] [CrossRef] [PubMed]
  28. Siegl, T.; Tokovenko, B.; Myronovskyi, M.; Luzhetskyy, A. Design, construction and characterisation of a synthetic promoter library for fine-tuned gene expression in actinomycetes. Metab. Eng. 2013, 19, 98–106. [Google Scholar] [CrossRef]
  29. Cropp, A.; Chen, S.; Liu, H.; Zhang, W.; Reynolds, K.A. Genetic approaches for controlling ratios of related polyketide products in fermentation processes. J. Ind. Microbiol. Biotechnol. 2001, 27, 368–377. [Google Scholar] [CrossRef]
  30. Milke, L.; Marienhagen, J. Engineering intracellular malonyl-CoA availability in microbial hosts and its impact on polyketide and fatty acid synthesis. Appl. Microbiol. Biotechnol. 2020, 104, 6057–6065. [Google Scholar] [CrossRef]
  31. Zabala, D.; Braña, A.F.; Flórez, A.B.; Salas, J.A.; Méndez, C. Engineering precursor metabolite pools for increasing production of antitumor mithramycins in Streptomyces argillaceus. Metab. Eng. 2013, 20, 187–197. [Google Scholar] [CrossRef]
  32. Gao, Q.; Tan, G.Y.; Xia, X.; Zhang, L. Learn from microbial intelligence for avermectins overproduction. Curr. Opin. Biotechnol. 2017, 48, 251–257. [Google Scholar] [CrossRef]
  33. Bilyk, O.; Luzhetskyy, A. Metabolic engineering of natural product biosynthesis in actinobacteria. Curr. Opin. Biotechnol. 2016, 42, 98–107. [Google Scholar] [CrossRef]
  34. Mo, S.; Lee, S.K.; Jin, Y.; Oh, C.; Suh, J.W. Application of a combined approach involving classical random mutagenesis and metabolic engineering to enhance FK506 production in Streptomyces sp. RM7011. Appl. Microbiol. Biotechnol. 2013, 97, 3053–3062. [Google Scholar] [CrossRef] [PubMed]
  35. Jung, W.S.; Yoo, Y.J.; Park, J.W.; Park, S.R.; Han, A.R.; Ban, Y.H.; Kim, E.J.; Kim, E.; Yoon, Y.J. A combined approach of classical mutagenesis and rational metabolic engineering improves rapamycin biosynthesis and provides insights into methylmalonyl-CoA precursor supply pathway in Streptomyces hygroscopicus ATCC 29253. Appl. Microbiol. Biotechnol. 2011, 91, 1389–1397. [Google Scholar] [CrossRef] [PubMed]
Figure 1. Precursors for milbemycin biosynthesis in S. bingchenggensis. (a) Production of milbemycin A3 and A4 in BC-101-4 and BC04. (b) Analysis of milbemycin fermentation broth of milbemycins in BC-101-4 and BC04. (c) Schematic diagram of the milbemycin biosynthetic process. Abbreviations: EMP, Embden-Meyerhof pathway; PPP, pentose phosphate pathway; TCA, tricarboxylic acid cycle; AcCoA, acetyl-CoA; PropCoA, propionyl-CoA; MalCoA, malonyl-CoA; MMCoA, methylmalonyl-CoA; ACC, acetyl-CoA carboxylase; PCC, propionyl-CoA carboxylase; PCS, propionyl-CoA synthetase. (d) Intracellular concentrations of acyl-CoAs (AcCoA, PropCoA, MalCoA and MMCoA) in S. bingchenggensis BC-101-4 and BC04. Data shown are the average and s.d. of three independent experiments. Differences are analyzed by the Student’s t-test, and p < 0.05 is considered statistically significant. Levels of significance are *** p < 0.001, ** p < 0.01 and * p < 0.05, and “ns” means no significant difference.
Fermentation 09 00555 g001
Figure 2. Reconfiguration of the MalCoA synthetic pathway. (a) Schematic diagrams of ACC overexpression plasmids and relative strength of the milbemycin biosynthetic cluster gene promoters. Data were measured by RNA-seq on the 4 days. (b) The milbemycin production of ACC overexpression strains and BC04. (c) The precursor concentrations of strains BC04-Racc and BC04 on day 6. Data shown are the average and s.d. of three independent experiments. Differences are analyzed by the Student’s t-test, and p < 0.05 is considered statistically significant. Levels of significance are ** p < 0.01 and * p < 0.05, and “ns” means no significant difference.
Fermentation 09 00555 g002
Figure 3. Rewiring of the PropCoA and MMCoA supply pathways. (a) Transcription level analysis of enzyme-coding genes in the PropCoA biosynthesis pathways in S. bingchengensis. Data shown in the heatmap are the log2-transformed fold changes. (b) Milbemycin production in BC04 with PCS and/or PCC overexpression. (c) Concentration of acyl-CoA precursors of strains BC04-RPsPc and BC04 on the sixth day. Data shown are the average and s.d. of three independent experiments. Differences are analyzed by the Student’s t-test, and p < 0.05 is considered statistically significant. Levels of significance are *** p < 0.001, ** p < 0.01 and * p < 0.05, and “ns” means no significant difference.
Fermentation 09 00555 g003
Figure 4. Dynamic regulation of the PCC expression levels. (a) Transcription profile of the genes controlled by the ten selected promoters in BC-101-4 and BC04. (b) Milbemycin production of the dynamic regulation of the PCC expression strains and BC04. (c) Precursor concentrations of strains BC04-RPsPc, BC04-RPs-2Pc and BC04 on the sixth day. Data shown are the average and s.d. of three independent experiments. Differences are analyzed by the Student’s t-test, and p < 0.05 is considered statistically significant. The levels of significance are ** p < 0.01 and * p < 0.05, and “ns” means no significant difference.
Fermentation 09 00555 g004
Figure 5. Effect of optimizing multiple precursor levels on milbemycins. (a) Influence of system dynamically balancing the intracellular precursors on titer improvement. (b) Production analysis of all increased mutant strains obtained by the precursor coordination strategy. Red dots represent the highest yielding strains, and dots on a blue background represent strains with a milbemycin A3/A4 ratio between 2:8 and 3:7. (c) Time–course curves of milbemycin production in BC04 and BC04-RAPs-3Pc. Data shown are the average and s.d. of three independent experiments. Differences are analyzed by the Student’s t-test, and p < 0.05 is considered statistically significant. Levels of significance are *** p < 0.001, ** p < 0.01 and * p < 0.05, and “ns” means no significant difference.
Fermentation 09 00555 g005
Disclaimer/Publisher’s Note: The statements, opinions and data contained in all publications are solely those of the individual author(s) and contributor(s) and not of MDPI and/or the editor(s). MDPI and/or the editor(s) disclaim responsibility for any injury to people or property resulting from any ideas, methods, instructions or products referred to in the content.

