Article

Products and Properties of Components from Heat-Denatured Peanut Meal Following Solid-State Fermentation by Aspergillus oryzae and Saccharomyces cerevisiae

1
Food Engineering Innovation Team, Shandong Peanut Research Institute, Qingdao 266100, China
2
College of Life Sciences, Qingdao University, Qingdao 266071, China
*
Author to whom correspondence should be addressed.
Fermentation 2023, 9(5), 425; https://doi.org/10.3390/fermentation9050425
Submission received: 20 March 2023 / Revised: 19 April 2023 / Accepted: 26 April 2023 / Published: 28 April 2023
(This article belongs to the Special Issue Food Wastes: Feedstock for Value-Added Products: 4th Edition)

Abstract

:
In heat-denatured peanut meal (HDPM), proteins are denatured and polysaccharides are degraded and browned. It can only be used as feed or fertilizer, and not using it as such is a waste of resources. To achieve high-value HDPM use, solid-state fermentation by Aspergillus oryzae and Saccharomyces cerevisiae was investigated. Conditions were optimized by response surface methodology and high-value antioxidant peptides (APs), nonstarch polysaccharides (NSPs), and fermentation products of heat-denatured peanut meal (FHDPM) were obtained. Optimal culture conditions were strain ratio 6:5, inoculation volume 2 mL, and fermentation for 42 h at 35 °C. Under optimal conditions, the theoretical soluble nitrogen concentration, 1,1-Diphenyl-2-picrylhydrazyl radical scavenging rate, hydroxyl free radical scavenging rate, and NSP yield reached 44.78 mg/mL, 62.44%, 94.95%, and 3.73%, respectively; however, their experimental values were 46.80 ± 1.23 mg/mL, 72.18 ± 0.78%, 96.79 ± 0.55%, and 4.42 ± 0.21%, respectively. NSPs, Aps, and FHDPM exhibited four higher classes and eight types of antioxidant activities. Moreover, levels of amino acids and trace elements, and physicochemical properties including emulsion activity index, emulsion stability index, foam capacity, foam stability, water holding capacity, and oil absorption capacity were enhanced by fermentation. The results indicate that APs and NSPs could serve as promising natural antioxidants in the food industry, and FHDPM could be used as a new type of high-value nutritional product in the feed industry. The findings provide new insight for comprehensive processing and utilization of HDPM.

1. Introduction

China is the largest producer of peanuts; the total output was ~19 million tons in 2021, of which ~51.4% was used to press oil, which requires high-temperature oil expression. Peanuts are squeezed with oil to produce heat-denatured peanut meal (HDPM), which contains 45–55% protein and 20–35% polysaccharides [1,2,3,4]. However, proteins undergo severe denaturation, and polysaccharides are degraded and browned during high-temperature pressing [5,6]. Therefore, HDPM can only be sold as a low-value product for feed or fertilizer and cannot be sold at high prices to the food processing industry, representing a waste of resources. In order to improve the use value of HDPM, there is an urgent need to develop effective applications for its proteins and polysaccharides. This could also increase the nutritional value of HDPM and make it more suitable for high-quality feed.
At present, research on plant meal, such as extraction of polypeptides and polysaccharides, improving taste, changing flavors, and improving water-soluble proteins, typically involves solid-state fermentation of plant meal by microorganisms used in food. Bisly et al. used Bacillus subtilis for solid-state fermentation of heat-stabilized defatted rice bran [7]. They found that the content and free radical scavenging activity of water-soluble proteins and peptides extracted from fermented rice bran were significantly greater than those from unfermented rice bran. Solid-state fermentation also has advantages in improving plant meal protein quality, eliminating antinutrient factors and improving digestibility. Heidari et al. explored changes in the quality of mechanically graded canola meal after solid-state fungal fermentation [8]. The results showed that the protein content and in vitro digestibility of fermented canola meal increased, while the content of antinutritional factors such as sinapine, glucosinolates, and phytate decreased. In another study, Sabar et al. fermented soybean meal using B. subtilis and A. oryzae [9]. The results indicated that the fermented soybean meal had increased protein and amino acid content, and significantly reduced antinutritional factors such as hytic acid, tannin, and saponin, and the ability to scavenge 1,1-diphenyl-2-picrylhydrazyl (DPPH) radicals was also enhanced. In addition, Aydın et al. used Aspergillus niger for solid-state fermentation of cottonseed meal, sunflower seed meal, and hazelnut meal [10]. After fermentation, the crude protein content was increased in all three kinds of plant meal, consistent with the above results. Yin et al. compared the hydrolysate of soybean meal hydrolyzed by protease with that of solid-state fermentation of soybean meal by B. subtilis [11]. The results showed that after 24 h of fermentation, the bitterness of fermentation liquor disappeared completely, while the hydrolysate had obvious bitterness. They further found that the reduction in bitterness was because B. subtilis secretes a carboxypeptidase after 16 h of growth removes phenylalanine, alanine, tyrosine, and leucine from the C-terminus of the bitter peptide, eliminating the bitterness. Therefore, solid-state fermentation technology combines enzyme production and enzymatic hydrolysis into a single process, which is more efficient than simple enzymatic hydrolysis technology, and the product is of higher quality [12].
In studies on solid-state fermentation of plant meal, as well as single-strain fermentation, mixed-strain fermentation has attracted attention. In solid-state fermentation, due to differences in enzymes produced by different strains and cooperation of each strain, the quality of the fermentation products is usually better. Some researchers have studied the co-fermentation of almond meal by A. oryzae and A. niger and discussed the key factors of flavor substances in the fermentation process of almond meal [13]. Under microbial fermentation conditions, the effective flavor components of almond meal were fully released, resulting in a full flavor. The above research provided a reference for the production of meat flavor base material from almond meal Koji. Soybean meal has been fermented by B. subtilis and A. oryzae, and fermented soybean meal with a higher peptide conversion rate and better functional properties was obtained [14]. Moreover, A. niger and A. oryzae have been used to ferment soybean dregs, and the sensory properties of fermented soybean dregs were improved greatly. For example, the particle size became smaller, texture was improved, the product was more easily swallowed, and the taste was more appealing [15].
A. oryzae is an Aspergillus species widely used in food fermentation. It has a complex enzyme system involving proteases, amylases, saccharifying enzymes, cellulases, phytases, β-glucosidases, and others [16,17,18,19,20,21]. Saccharomyces cerevisiae is a yeast that can produce protein feed, and it also expresses proteases, amylases, and saccharifying enzymes [22,23,24,25]. In the present work, we combined A. oryzae and S. cerevisiae for mixed solid-state fermentation of HDPM. By utilizing the characteristics of the enzyme systems of the two organisms and making them act synergistically on proteins and polysaccharides in HDPM, it is possible to obtain high-value-added products such as antioxidant peptides (APs) and nonstarch polysaccharides (NSPs). Meanwhile, by improving the physicochemical properties of HDPM and increasing the content of nutrient components, a high-nutritional-value fermented heat-denatured peanut meal (FHDPM) feed was obtained. The findings provide a new approach for comprehensive processing and utilization of HDPM.

2. Materials and Methods

2.1. Materials

HDPM was provided by Shandong Luhua Group Co., Ltd. (Laiyang, China). A. oryzae and S. cerevisiae were isolated in our laboratory and 1,1-diphenyl-2-picrylhydrazyl (DPPH) was provided by Sigma-Aldrich Co., Ltd. (Shanghai, China). Phenol, lichenol, carbazole, anhydrous glucose, xylose, glucosaldehyde, sulfuric acid, hydrochloric acid, monopotassium phosphate acid, magnesium sulfate, and ammonium sulfate were pure reagents for analysis and provided by Sinopharm Chemical Reagent Co., Ltd. (Shanghai, China). Potato extract powder was provided by Nanjing Shenglide Biotechnology Co., Ltd. (Nanjing, China). Yeast extract was provided by Beijing Land Bridge Technology Co., Ltd. (Beijing, China).

2.2. Medium

For potato dextrose agar (PDA) liquid medium, potato leaching powder (6 g), glucose (20 g), potassium dihydrogen phosphate (1 g), magnesium sulfate (0.5 g), ammonium sulfate (0.5 g), and distilled water (1000 mL) were sterilized at 121 °C for 20 min.
For PDA solid medium, PDA liquid medium was added to agar powder (15 g) and sterilized at 121 °C for 20 min.
For yeast extract peptone glucose (YPD) liquid medium, peptone (20 g), glucose (20 g), yeast soaking powder (10 g), and distilled water (1000 mL) at pH 6.5 ± 0.2 were sterilized at 121 °C for 20 min.
For YPD solid medium, YPD liquid medium was added to 15 g of agar and sterilized at 121 °C for 20 min.
For solid fermentation medium, HDPM (crushed through a 50-mesh sieve) and nutrient salt solution (0.5% ammonium sulfate, 0.5% potassium dihydrogen phosphate, 1% urea, 1% glucose, volume to 1000 mL) was sterilized at 121 °C for 15 min. HDPM (20 g) and nutrient salt solutions (30 mL) were then mixed evenly during fermentation to generate the solid fermentation medium.

2.3. Preparation of Inoculum Cultures of Strains

For inoculum cultures of A. oryzae, cells grown on PDA solid medium were placed in 50 mL PDA liquid medium and cultured for 84 h at 30 °C.
Inoculum cultures of S. cerevisiae: the culture of S. cerevisiae on YPD solid medium was placed into 50 mL YPD liquid medium and cultured for 24 h at 30 °C.

2.4. The Mixed Microbial Solid-State Fermentation HDPM Process

Mixed inoculum cultures (A. oryzae:S. cerevisiae = 3:2–1:2) 2–4 mL were added to solid fermentation medium, fermented for 24–42 h at 30–38 °C, and the fermentation system was stirred every 12 h. After fermentation, 90 mL of distilled water was added to the fermentation system and shaken in a water bath for 6 h at 40 °C. After water bath oscillation, the supernatant was centrifuged for 10 min at 2200× g, and the volume of the supernatant was adjusted to 100 mL to generate the fermentation broth. The precipitate after centrifugation was FHDPM.

2.5. Initial Separation and Purification of the Fermentation Broth

Four volumes of absolute ethanol were added to the fermentation broth, incubated for 12 h at 4 °C, and centrifuged for 10 min at 2200× g. The supernatant was evaporated by vacuum rotation to remove ethanol, and samples were passed through a lab-scale small tangential flow system with 10 kDa and 5 kDa membranes to generate APs with a molecular weight less than 5 kDa following lyophilization. The precipitate was dissolved in 100 mL boiling water, filtered, and, after evaporation by vacuum rotation, four volumes of anhydrous ethanol were added, incubated for 12 h at 4 °C, centrifuged for 10 min at 2200× g, and the precipitate was lyophilized to obtain NSPs.

2.6. Response Surface Methodology (RSM) of the Fermentation Process

According to the results of single-factor experiments [4], the central combination experiment design principle of Box–Benhnken was adopted for in RSM; four factors (strain ratio (X1), inoculation amount (X2, mL), fermentation temperature (X3, °C), and fermentation time (X4, h)) were selected for four-factor three-level response surface analysis. The response variables were taken as the soluble nitrogen concentration (Y1, mg/mL), DPPH free radical scavenging rate (Y2, %), hydroxyl free radical scavenging rate (Y3, %), and NSP yield rate (Y4, %). RSM factors, codes, and code levels are shown in Table 1.

2.7. Determination Method

2.7.1. Determination of Soluble Nitrogen Content (Lowery Method)

The soluble nitrogen concentration was determined according to the method of Yu et al. [26]. Fermentation broth (1 mL) was added to 5 mL reagent A (4% sodium carbonate solution and 0.2 mol/L sodium hydroxide solution) to prepare sodium carbonate–sodium hydroxide solution; 1% cupric sulfate solution and 2% potassium sodium tartrate potassium sodium tartrate solution was also prepared, and the two solutions were mixed in a ratio of 50:1 to generate reagent A. The two solutions were mixed evenly and left for 10 min at room temperature. Next, 0.5 mL of Folin’s phenol reagent was added, mixed, and incubated at 30 °C in a water bath for 30 min. The zero point was adjusted using reagent blank solution, and the absorbance was determined at 750 nm.

2.7.2. Determination of NSPs Content

The NSP content was determined according to the method of Yu et al. [27]. Fermentation broth (4 mL) was added to 16 mL of 5% sulfuric acid solution and hydrolyzed for 12 h at 100 °C to obtain hydrolysate.
Hexose was determined by the phenol–sulfuric acid method. A 2 mL volume of hydrolysate was added to 1 mL of 5% phenol solution, 5 mL of sulfuric acid was added to the above mixture in an ice water bath, and then it was incubated for 10 min. The reaction solution was mixed evenly and placed for 20 min at room temperature. The zero point was adjusted using reagent blank solution, and the absorption value was determined at 490 nm.
Pentose was determined by the lichenol method. A 2 mL volume of hydrolysate was mixed with 2 mL lichenol reagent and heated for 25 min in a boiling water bath. After heating, samples were cooled immediately with cold water. The zero point was adjusted using reagent blank solution, and the absorption value was determined at 670 nm.
Uronic acid was determined by the sulfuric acid–carbazole method. In an ice water bath, 1 mL hydrolysate was mixed with 6 mL sulfuric acid. Samples were then placed for 20 min in an 85 °C water bath, and, after cooling with cold water, 0.2 mL carbazole solution was added, mixed evenly, and incubated for 2 h at room temperature. The zero point was adjusted using reagent blank solution, and the absorption value was determined at 530 nm.
NSPs content was calculated as follows:
NSPs content = (Hexose content × 0.9) + (Pentose content × 0.88) + (Uronic acid content × 0.81).

2.7.3. Determination of Antioxidant Activities

DPPH free radical scavenging rate, hydroxyl free radical scavenging rate, superoxide anion free radical scavenging rate, iron reducing power, molybdenum reducing power, iron ion chelating power, copper ion chelating power, and lipid peroxidation inhibition rate were determined according to Yu et al. [1].
Three mixture solutions were prepared, involving solution 1 (2 mL of sample solution and 2 mL of 4 mmol/L DPPH), solution 2 (2 mL of sample solution and 2 mL of anhydrous ethyl alcohol), and solution 3 (2 mL of 4 mmol/L DPPH and 2 mL of distilled water). The absorbance values Ai (solution 1), Aj (solution 2), and A0 (solution 3) were determined at 517 nm using a spectrophotometer (Unico (Shanghai) Instruments Co., Ltd., Shanghai, China) after standing for 20 min at 25 °C in a water bath. Then, DPPH free radical scavenging rate was calculated as follows:
DPPH   free   radical   scavenging   rate   ( % ) = ( 1 A i A j A 0 ) × 100
We took three identical mixed solutions (2 mL of FeSO4 (6 mmol/L) and H2O2 (6 mmol/L)) and added them to each of the following solutions involving solution 1 (2 mL of sample solution), solution 2 (2 mL of sample solution), and solution 3 (2 mL of distilled water), respectively. These mixture solutions stood for 10 min at room temperature after mixing vigorously. Then, 2 mL of salicylic acid (6 mmol/L), distilled water, and salicylic acid (6 mmol/L) were added to solutions 1, 2, and 3, respectively. The absorbance values Ai (solution 1), Aj (solution 2), and A0 (solution 3) were determined at 510 nm using a spectrophotometer (Unico (Shanghai) Instruments Co., Ltd., Shanghai, China) after they stood for 30 min at room temperature. The hydroxyl free radical scavenging rate was calculated as follows:
Hydroxyl   free   radical   scavenging   rate   ( % ) = ( 1 A i A j A 0 ) × 100
Three identical mixed solutions (2 mL of ammonium persulfate (1%), TEMED (0.1%), and oxammonium hydrochloride (0.1%)) were added to each of the following solutions involving solution 1 (2 mL of sample solution), solution 2 (2 mL of sample solution), and solution 3 (2 mL of distilled water), respectively. These mixture solutions stood for 60 min at 25 °C in a water bath after mixing vigorously. Then, 1 mL of p-aminobenzene sulfonic acid (0.33%) and α-naphthyl amine were added to mixed solution 1, 1 mL of p-aminobenzene sulfonic acid (0.33%) and distilled water were added to mixed solution 2, and 1 mL of p-aminobenzene sulfonic acid (0.33%) and α-naphthyl amine (1%) were added to mixed solution 3. The absorbance values Ai (solution 1), Aj (solution 2), and A0 (solution 3) were determined at 530 nm using a spectrophotometer (Unico (Shanghai) Instruments Co., Ltd., Shanghai, China) after they stood for 30 min at room temperature. The superoxide anion free radical scavenging rate was calculated as follows:
Superoxide   anion   free   radical   scavenging   rate   ( % ) = ( 1 A i A j A 0 ) × 100
We mixed 1.0 mL of sample solution, 2.5 mL of phosphate buffer solution (pH 6.6, 0.1 mol/L), and 2.5 mL K3Fe(CN)6 (1%) evenly and stood it for 20 min at 50 °C in a water bath. Then, 2.5 mL of TCA (10%) was added to the mixture solution and centrifuged for 10 min at 2200× g. We added 2.5 mL of distilled water and 0.5 mL FeCl3 (0.1%) into the 2.5 mL of supernatant, and the mixture solution stood for 10 min at room temperature. The absorbance value at 700 nm showed the effect of iron reducing power.
We mixed 1.0 mL of sample solution and 4.0 mL of phosphorus molybdenum blue reagent evenly and stood for 90 min at 95 °C in a water bath. The absorbance value at 695 nm showed the effect of molybdenum reducing power.
We prepared 2 mixed solutions: solution 1 (1 mL of sample solution, 2.7 mL of distilled water, and 0.1 mL of FeCl2 (2 mmol/L)) and solution 2 (3.7 mL of distilled water and 0.1 mL of FeCl2 (2 mmol/L)). Then, 0.2 mL of ferrozine (5 mmol/L) was added to solution 1 and solution 2, respectively, and mixed evenly, then the mixture solutions stood for 10 min at room temperature. The absorbance values A (solution 1) and A0 (solution 2) were determined at 562 nm using a spectrophotometer (Unico (Shanghai) Instruments Co., Ltd., Shanghai, China). Iron ion chelating rate was calculated as follows:
Iron   ion   chelating   rate   ( % ) = ( 1 A A 0 ) × 100
We prepared 2 mixed solutions: solution 1 (1 mL of sample solution, 1.0 mL of CuSO4 (2 mmol/L), 1.0 mL of pyridine (pH 7.0), and 20 μL of pyrocatechol violet (0.1%)) and solution 2 (1 mL of distilled water, 1.0 mL of CuSO4 (2 mmol/L), 1.0 mL of pyridine (pH 7.0), and 20 μL of pyrocatechol violet (0.1%)) and mixed them evenly. Then, the mixture solutions stood for 5 min at room temperature. The absorbance values A (solution 1) and A0 (solution 2) were determined at 632 nm using a spectrophotometer (Unico (Shanghai) Instruments Co., Ltd., Shanghai, China). Copper ion chelating rate was calculated as follows:
Copper   ion   chelating   rate   ( % ) = ( 1 A A 0 ) × 100
We prepared 2 mixed solutions: solution 1 (1 mL of sample solution, 1 mL of L-α-Phosphatidylcholine, 1 mL of FeCl3 (0.4 mmol/L), and 1 mL of L-Ascorbic acid (0.4 mmol/L)) and solution 2 (1 mL of distilled water, 1 mL of L-α-Phosphatidylcholine, 1 mL of FeCl3 (0.4 mmol/L), and 1 mL of L-Ascorbic acid (0.4 mmol/L)) and mixed them evenly. Then, the mixture solutions stood for 60 min at 37 °C in a water bath in the dark. A total of 2 mL of TCA-TBA-HCl was added to solution 1 and solution 2, respectively, and mixed evenly, then the mixture solutions stood for 15 min at 95 °C in a water bath. The absorbance values A (solution 1) and A0 (solution 2) were determined at 535 nm using a spectrophotometer (Unico (Shanghai) Instruments Co., Ltd., Shanghai, China). Lipid peroxidation inhibition rate was calculated as follows:
Lipid   peroxidation   inhibition   rate   ( % ) = ( 1 A A 0 ) × 100

2.7.4. Determination of Amino Acids and Trace Minerals Content

Determination of amino acids and trace minerals content was performed by Qingdao Pony Testing Co., Ltd. according to GB 5009.124-2016 (Qingdao, China) and GB5009.268-2016 (China), respectively.
The proteins in FHDPM and HDPM were hydrolyzed into free amino acids by hydrochloric acid, separated by ion exchange column, reacted with Ninhydrin solution to produce color reaction, and then determined by automatic amino acid analyzer.
FHDPM and HDPM were digested with nitric acid and then inductively coupled plasma mass spectrometry (ICP-MS) (Thermo Fisher Scientific Inc., Waltham, MA, USA) was used to determine trace minerals content.

2.7.5. Determination of the Physicochemical Properties

Physicochemical properties of FHDPM and HDPM, including solubility, emulsion activity index (EAI), emulsion stability index (ESI), foam capacity (FC), foam stability (FS), water holding capacity (WHC), and oil absorption capacity (OAC), were determined according to Yu et al. [28].
Solubility was determined according to the following method. We mixed 0.5 g of FHDPM or HDPM and 25 mL of distilled water evenly. The mixture was shaken for 60 min in 30 °C water bath and then centrifuged for 10 min at 2200× g. We added 4.0 mL biuret reagent to 1.0 mL of supernatant. After mixing vigorously, the reaction solution was allowed to stand for 30 min at room temperature. Afterwards, the absorbance value of the reaction solution was determined at 540 nm using a spectrophotometer (Unico (Shanghai) Instruments Co., Ltd., Shanghai, China).
A total of 0.03 g of FHDPM or HDPM was added to 30.0 mL of phosphate buffer solution (pH 7.0, 0.01 mol/L). The mixture was homogenized for 1 min at 10,000 r/min after adding 10.0 mL of soybean oil to the above solution. Then, 100 μL of the homogenized emulsion was added to 5.0 mL of sodium dodecyl sulfate (SDS) solution (0.1%) and mixed vigorously. The absorbance value of the reaction solution was determined at 500 nm using a spectrophotometer (Unico (Shanghai) Instruments Co., Ltd., Shanghai, China). EAI and ESI were calculated as follows:
E A I   ( m 2 / g ) = 2 × 2.303 × A 0 × D F × 10 6 C × ϕ × L
where EAI (m2/g) is emulsion activity index, A0 is the absorbance value of the reaction solution, DF is the dilution factor of the emulsion, C (g/mL) is the concentration of FHDPM or HDPM, Φ is the percentage of the oil phase, and L (0.01 m) is the optical path of colorimetry.
E S I   ( % ) = E A I 10 min E A I 0 min × 100
where ESI (%) is emulsion stability index, EAI10min is EAI of the emulsion after standing 10 min, and EAI0min is EAI of the emulsion after homogenizing.
We added 0.45 g of FHDPM or HDPM to 30 mL (B) of distilled water and the mixture was homogenized for 2 min at 10,000 r/min. Foam volume A1 (mL) of the homogeneous solution was recorded. When the homogeneous solution was stood for 30 min at room temperature, foam volume A2 (mL) was recorded. Then, FC and FS were calculated as follows:
F C   ( % ) = A 1 B × 100
F S   ( % ) = A 2 A 1 × 100
We mixed 0.5 g (W) of FHDPM or HDPM and 10 mL (V1) of distilled water evenly and stood for 60 min at room temperature. Then, the mixture was centrifuged for 20 min at 2200× g. The volume V2 (mL) of supernatant was recorded. WHC was calculated as follows:
W H C   ( mL / g ) = V 1 V 2 W × 100
We added 0.5 g (W) of FHDPM or HDPM to 5.0 g (W1) of soybean oil. Then, the mixture was mixed for 20 min every 5 min and centrifuged for 20 min at 2200× g. The weight W2 (g) of supernatant soybean oil was recorded. OAC was calculated as follows:
O A C   ( g / g ) = W 1 W 2 W × 100

2.8. Statistical Analysis

All experiments were performed in triplicate and results are expressed as means and standard deviations. SPSS Statistics 17.0 (IBM Inc., Armonk, NY, USA) was used to perform an analysis of variance on results with least significant difference (LSD). The design and analysis of the RSM experiments were carried out using Design-expert software (Version 8.0; Stat-Ease Int. Co., Minneapolis, MN, USA).

3. Results and Discussion

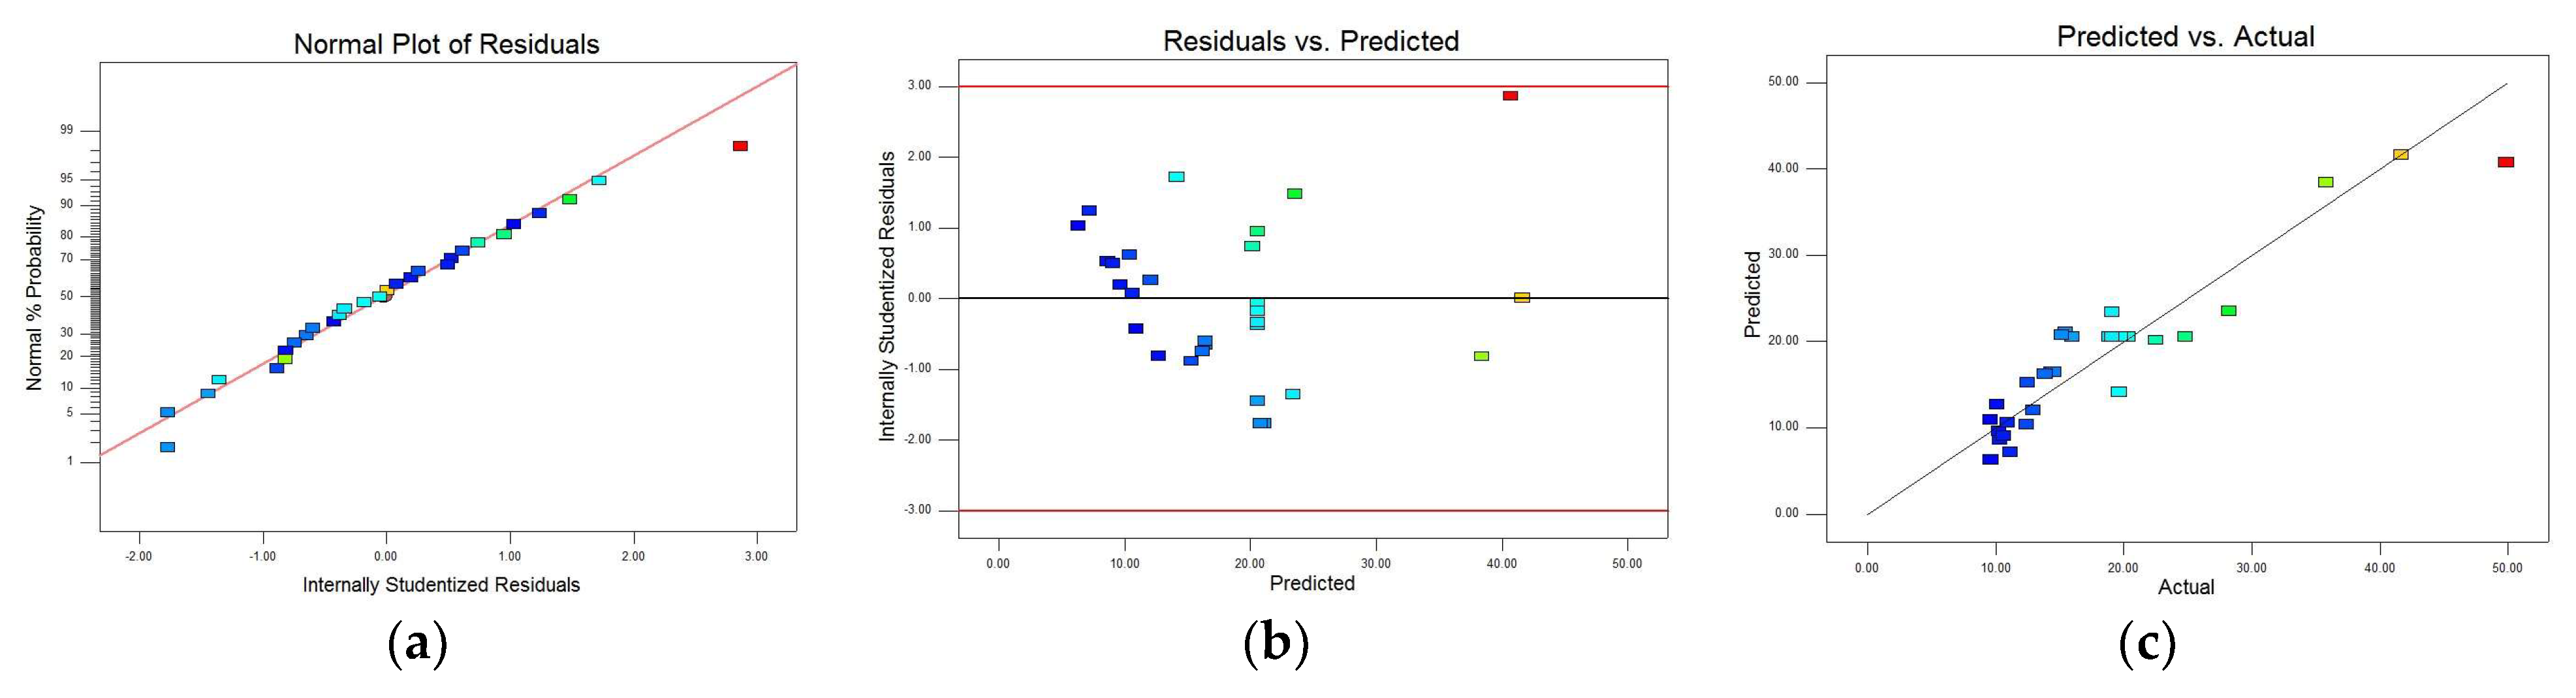
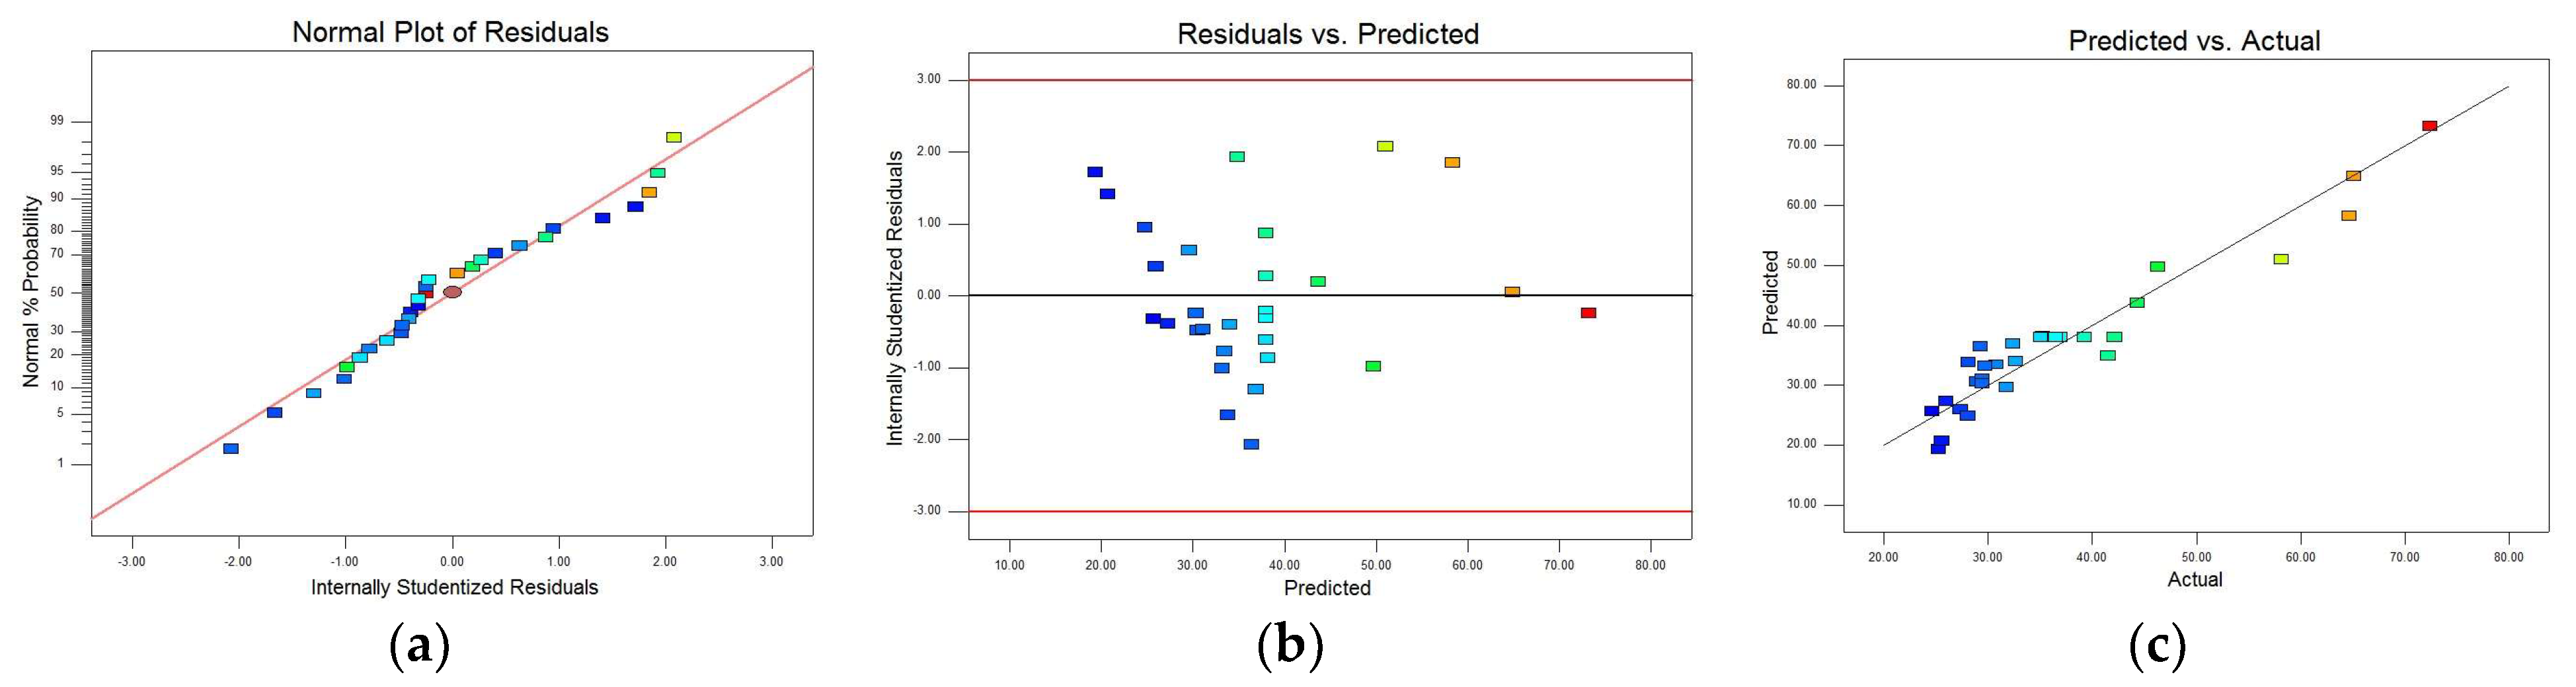
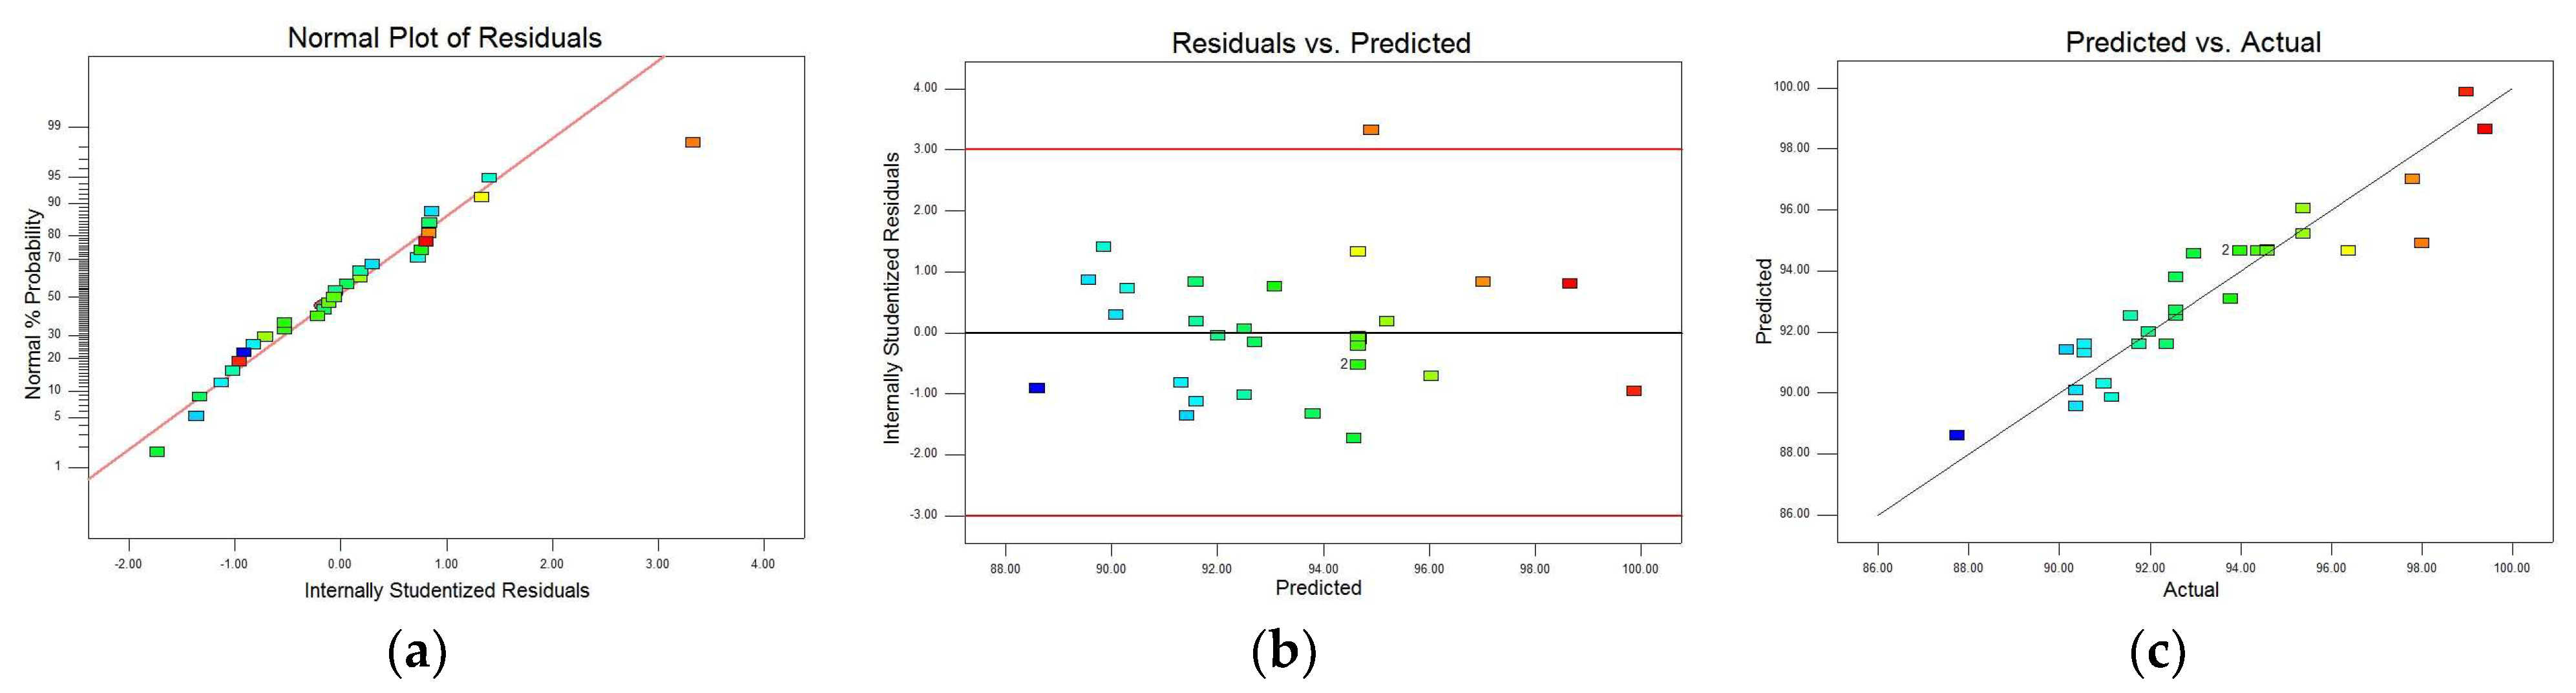
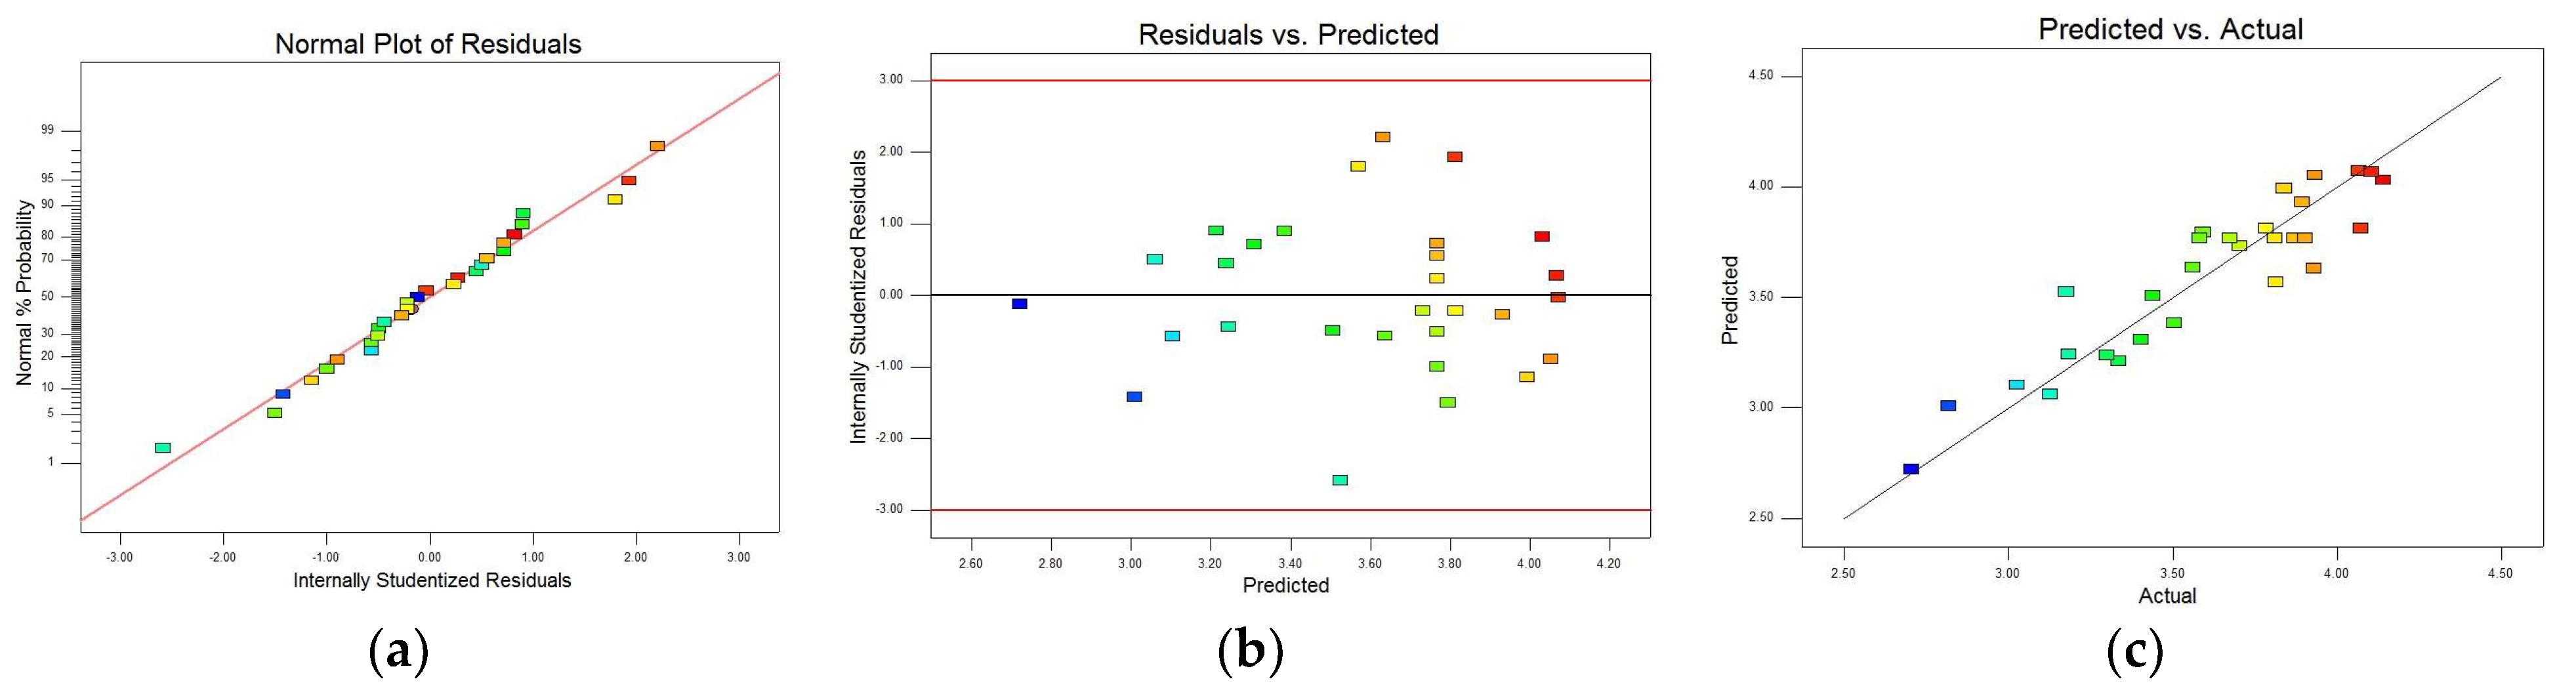
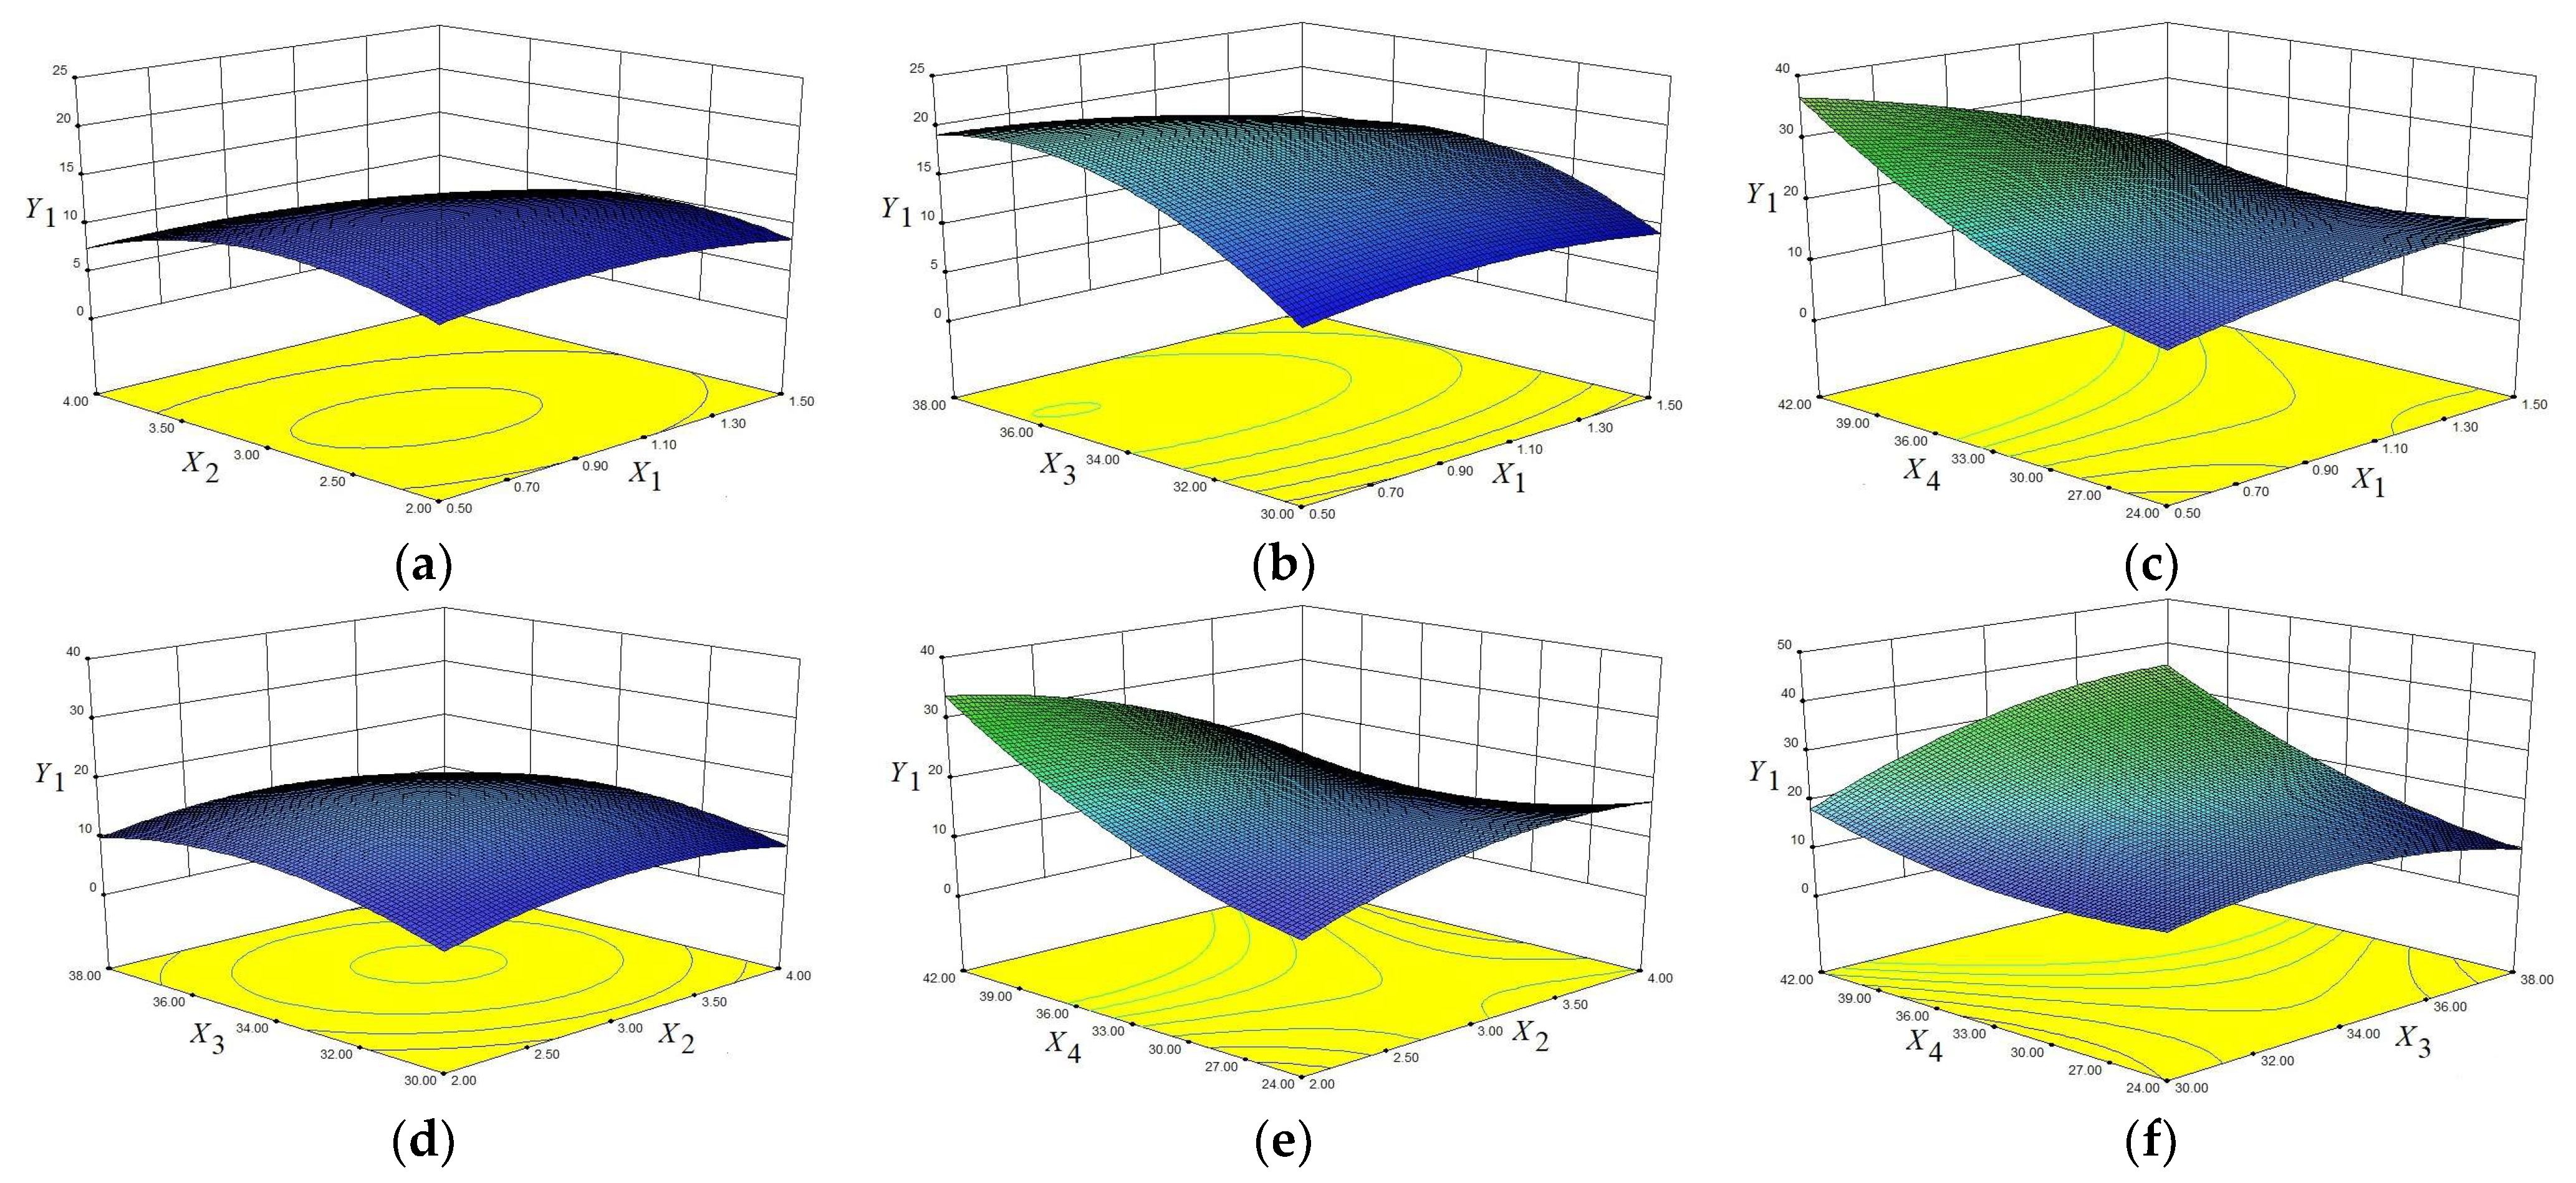
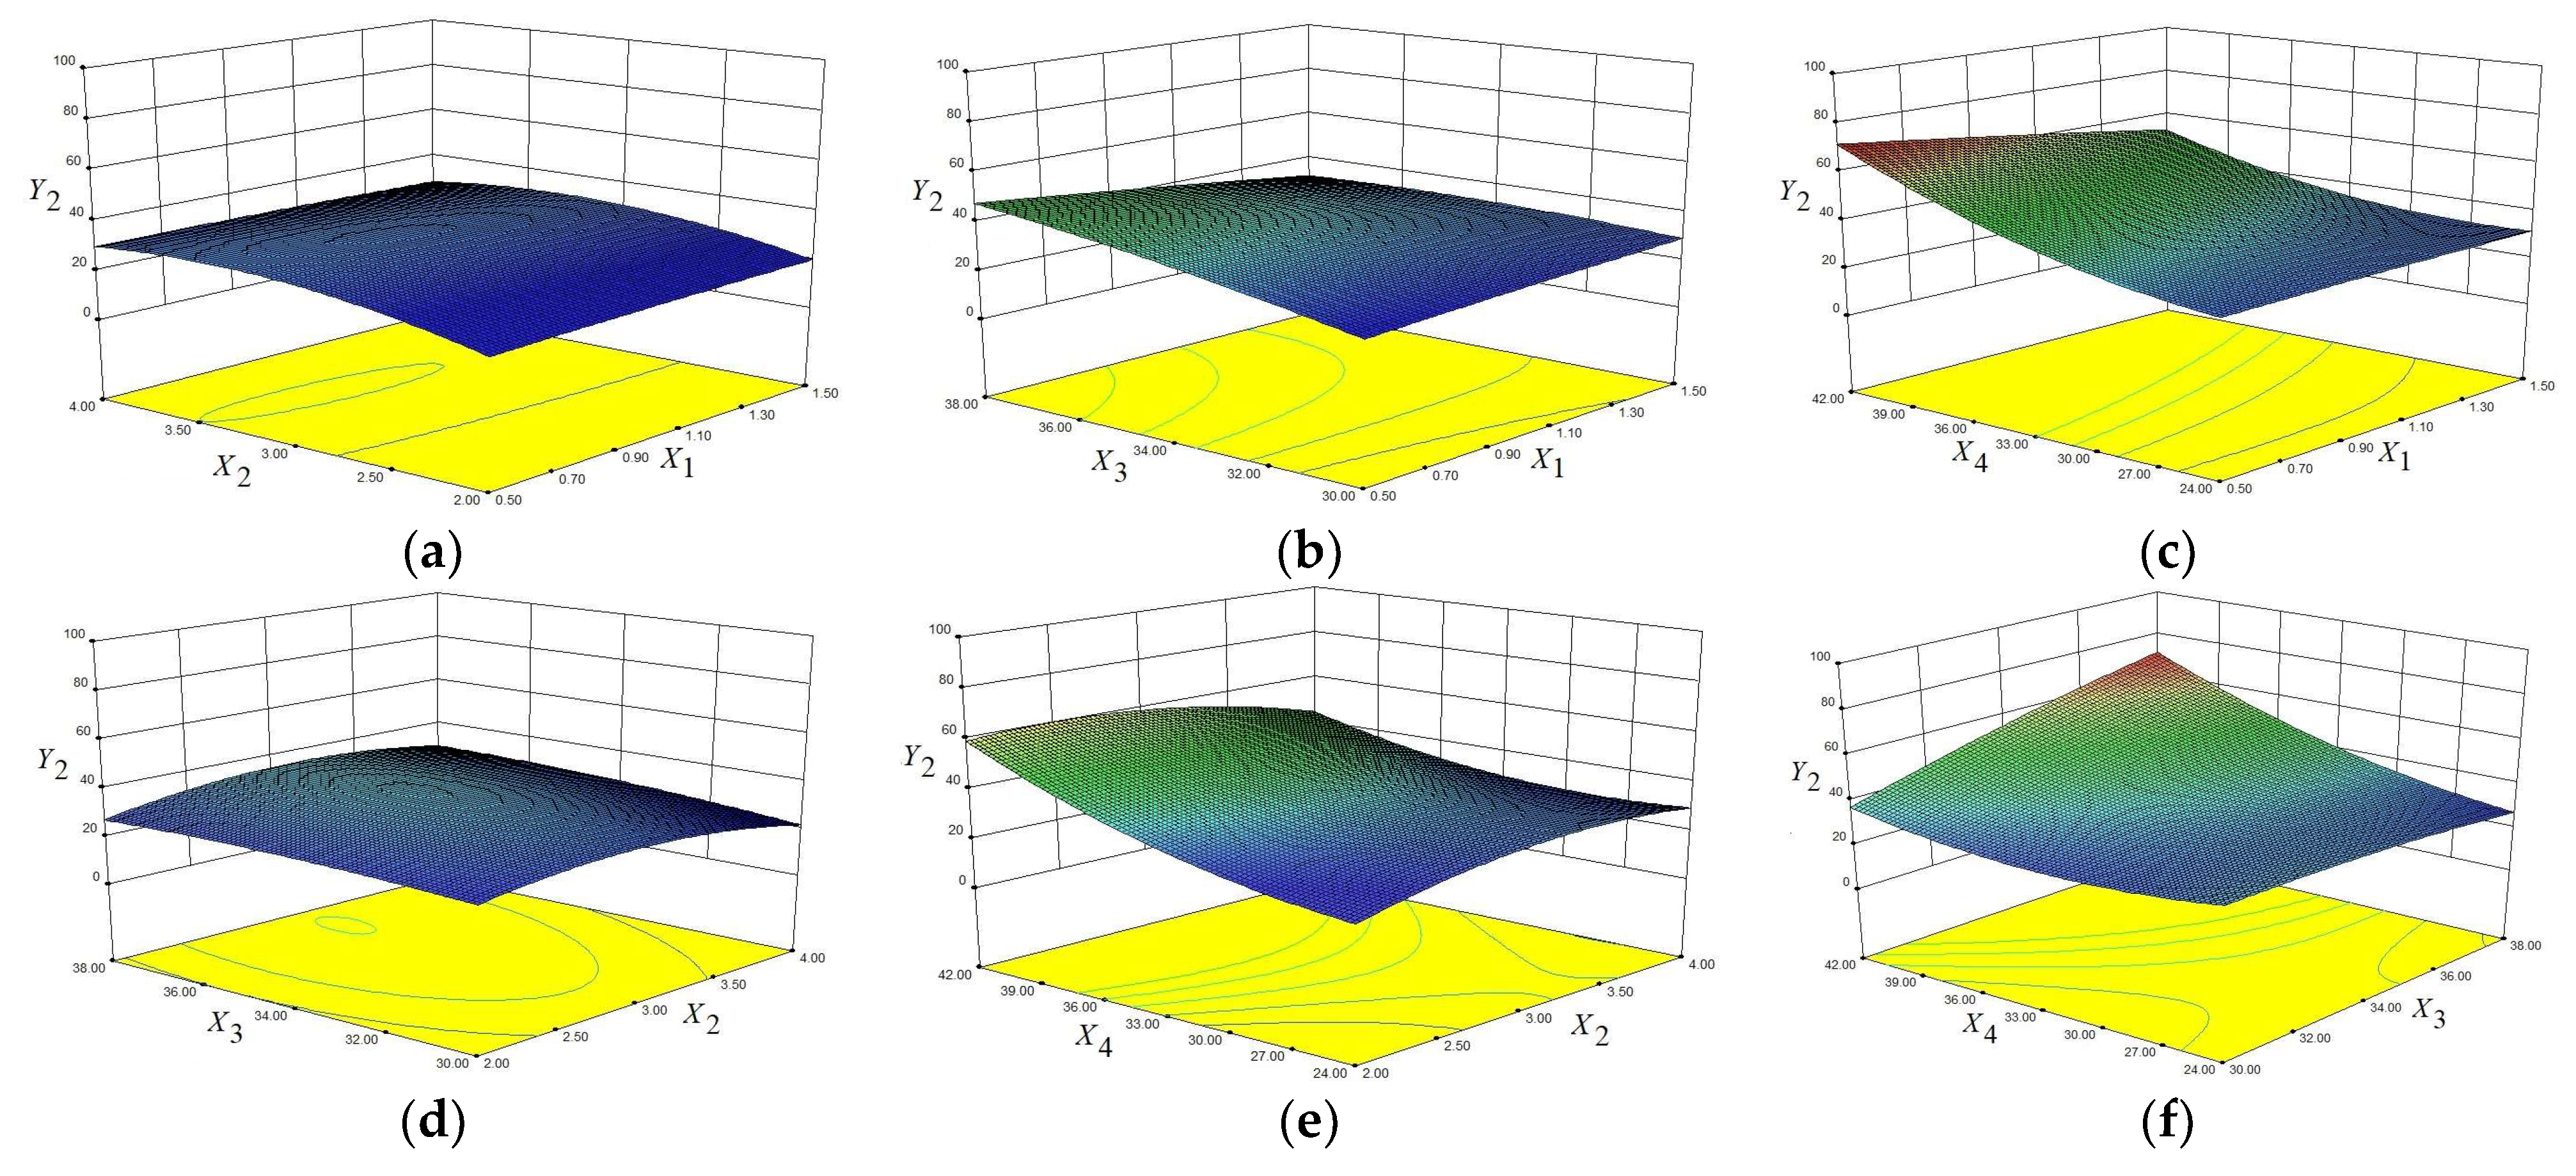
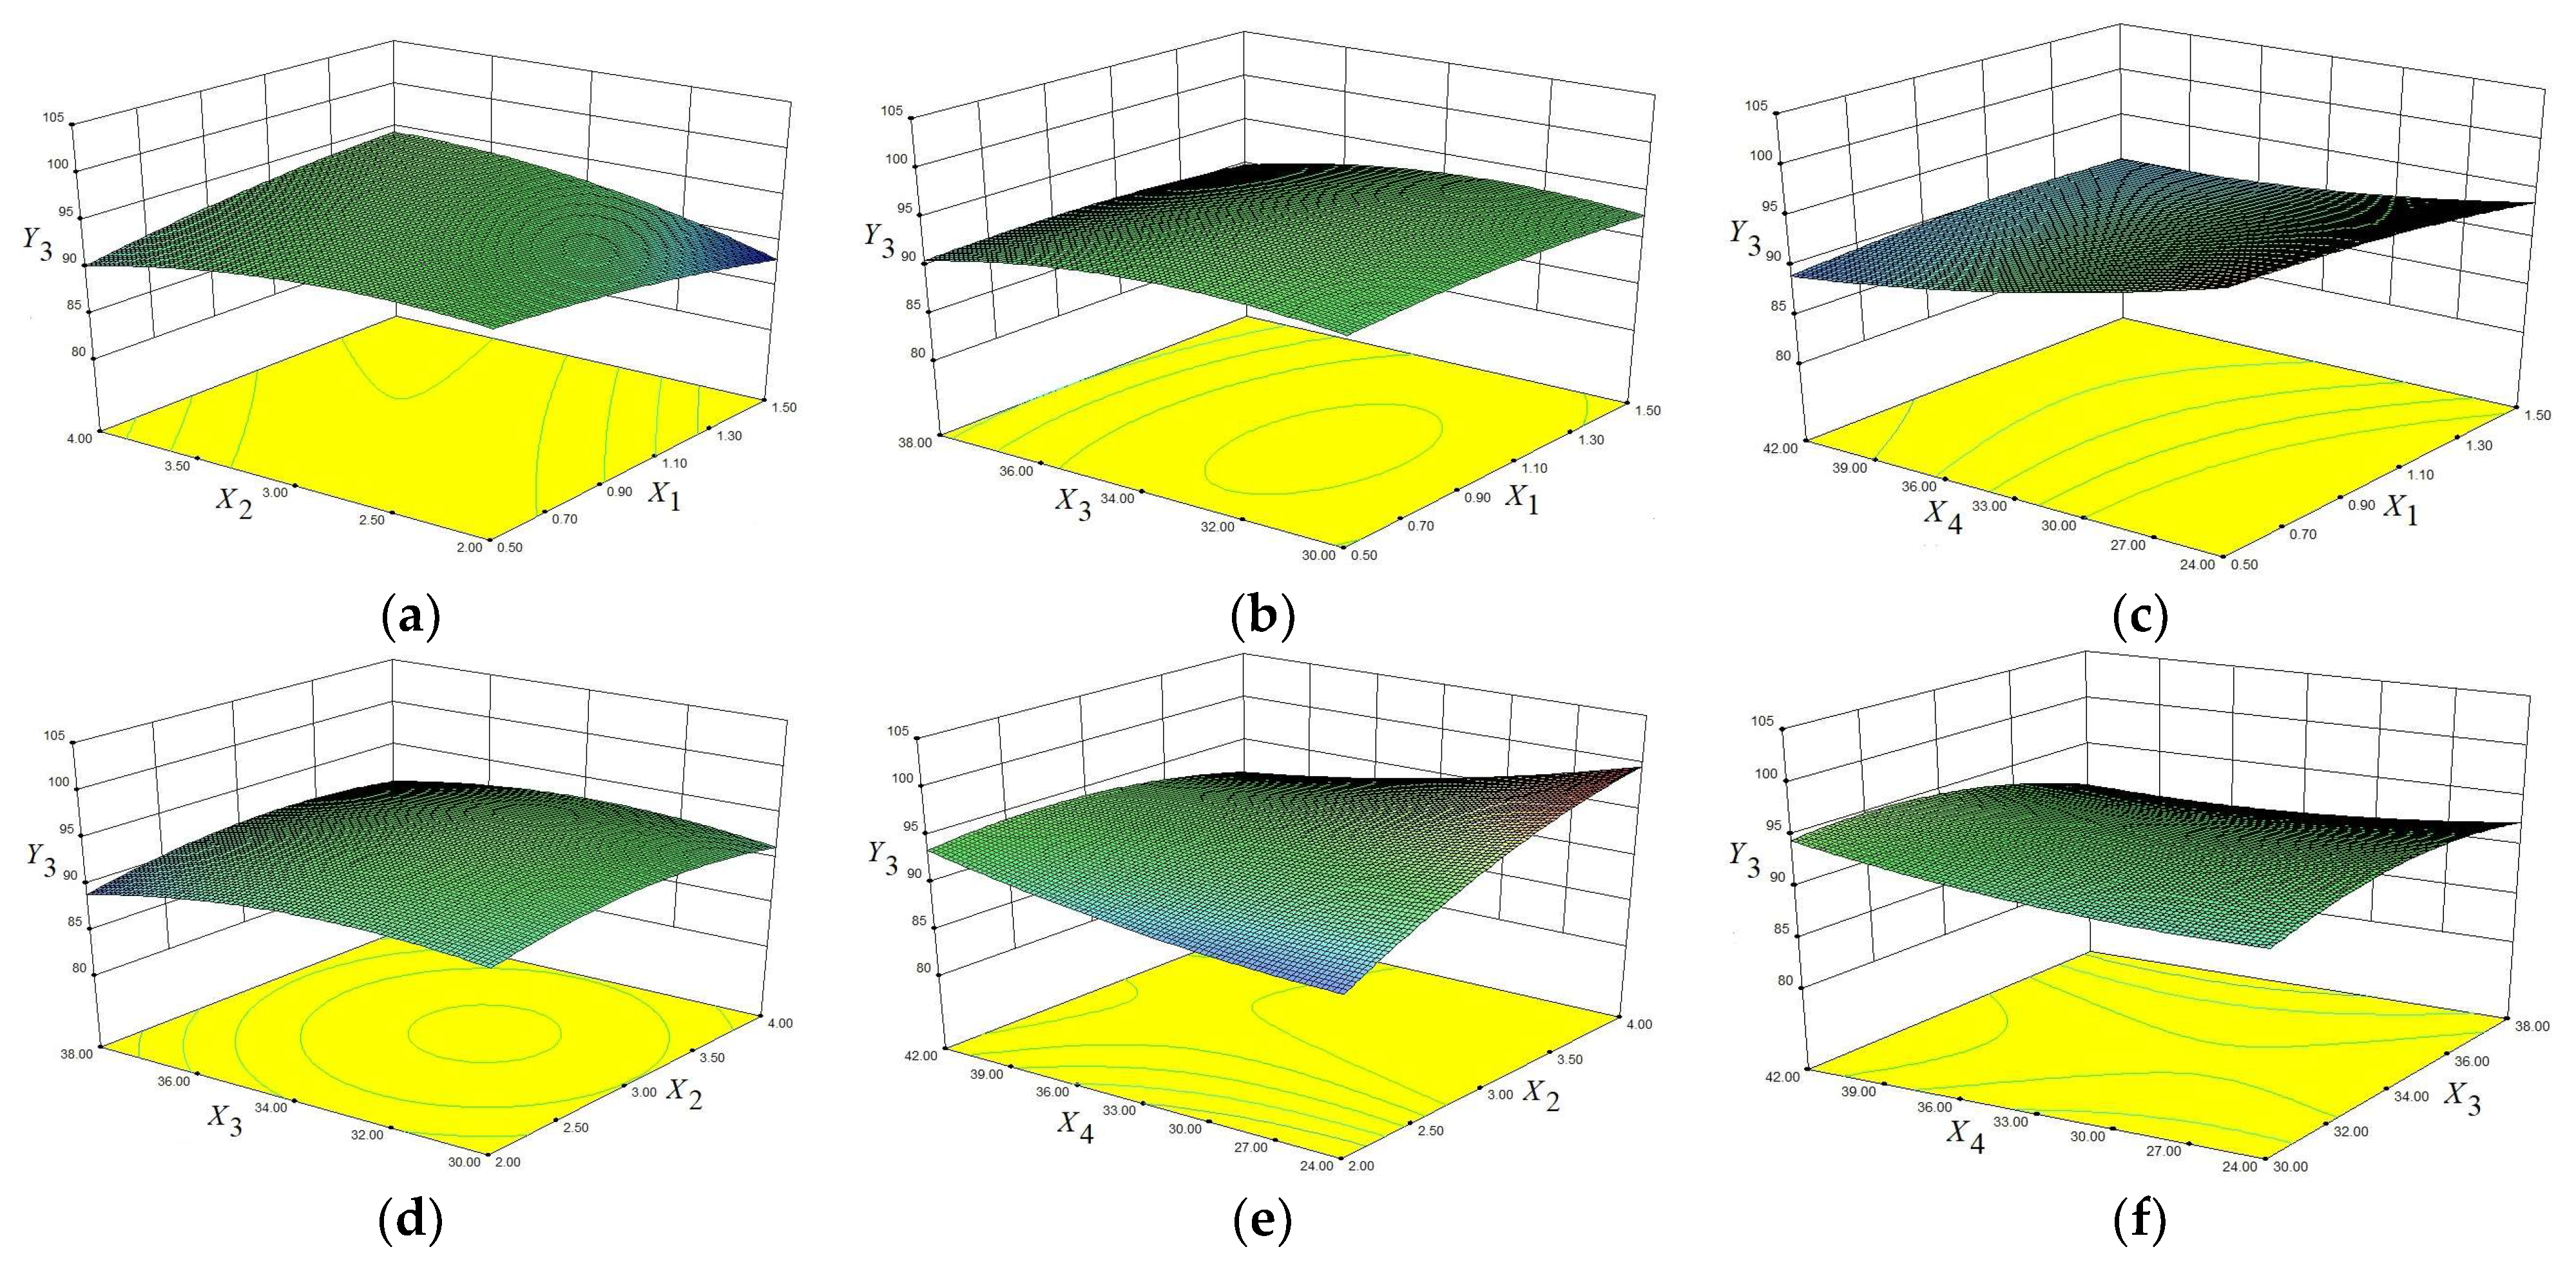
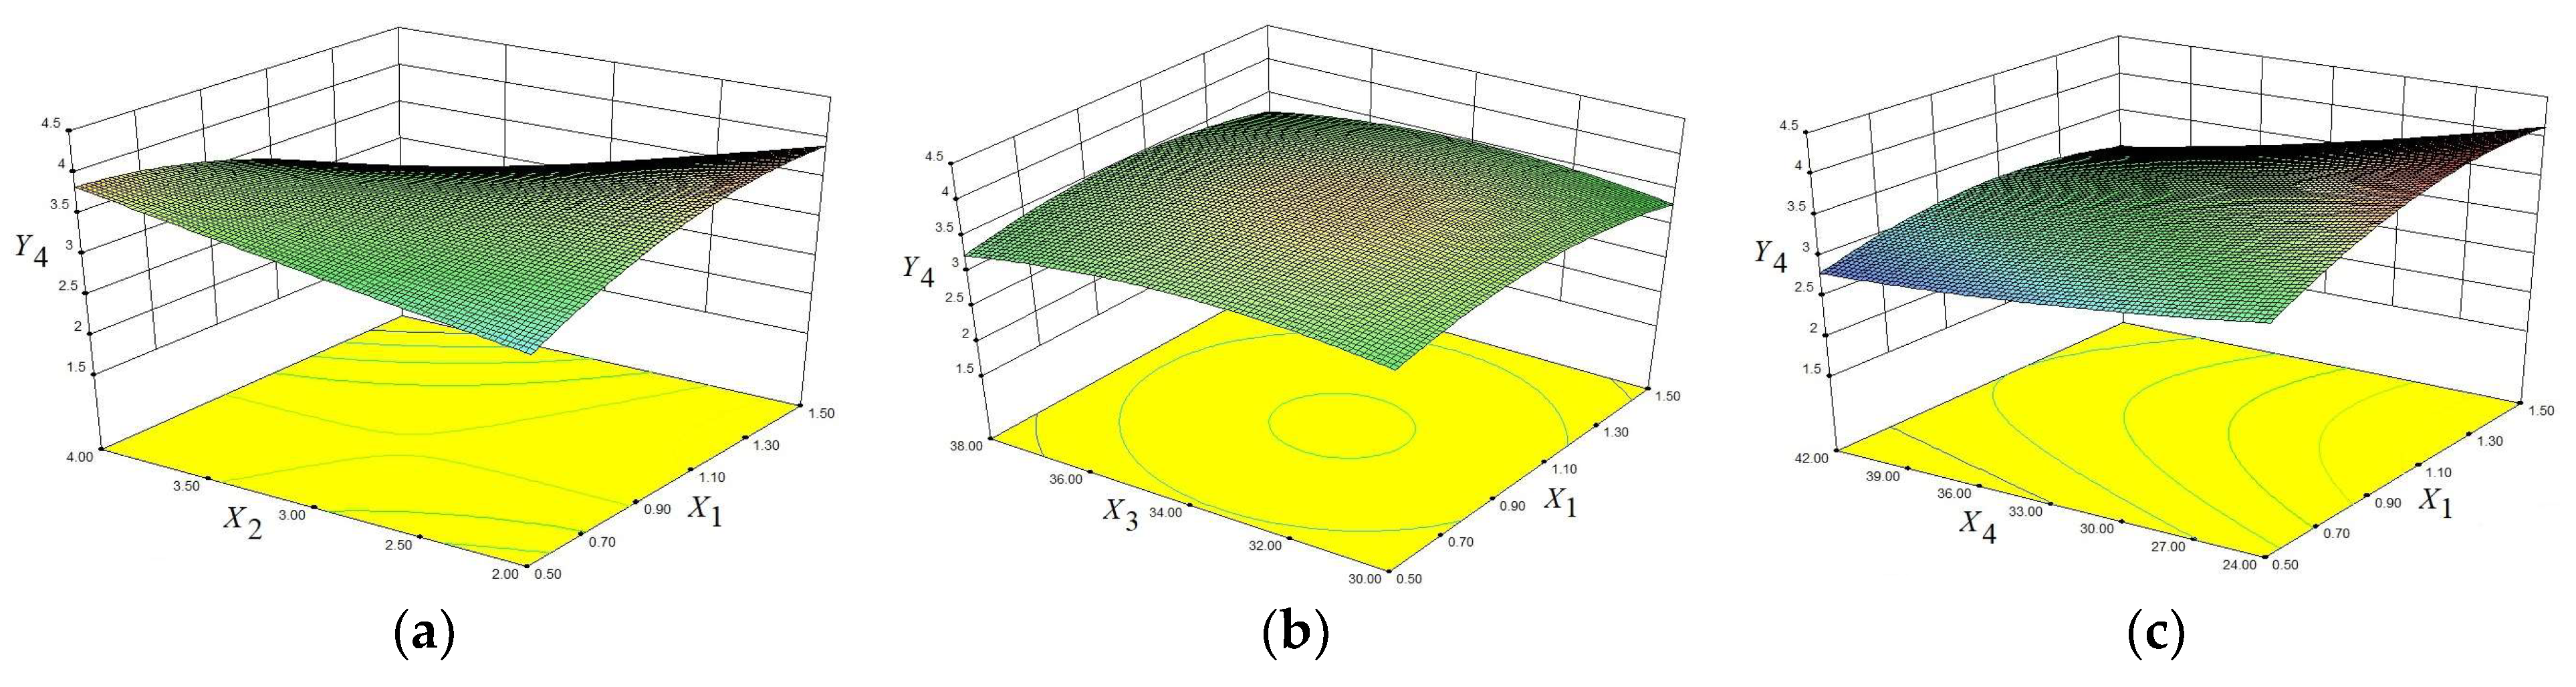
3.1. Response Surface Methodology (RSM) Results Analysis

3.1.1. Model Building and Significance Analysis

According to the RSM design, 29 experimental points were selected, and Table 2 shows the results of the RSM design and the response variables including soluble nitrogen concentration (Y1, mg/mL), DPPH free radical scavenging rate (Y2, %), hydroxyl free radical scavenging rate (Y3, %), and NSP yield rate (Y4, %). Four factors, namely, strain ratio (X1), inoculation amount (X2, mL), fermentation temperature (X3, °C), and fermentation time (X4, h), were selected in the RSM design. The results in Table 2 were fitted by quadratic polynomial regression according to Design-expert software (Version 8.0), and the quadratic regression equations of the response values and the influencing factors were obtained as follows:
Y1 = 20.57 − 3.1X1 − 3.11X2 + 4.14X3 + 9.6X4 − 0.78X1X2 − 1.58X1X3 − 6X1X4 − 0.96X2X3 − 7.17X2X4 + 4.78X3X4
1.42X12 − 3.5X22 − 4.45X32 + 3.78X42
Y2 = 37.98 − 2.7X1 − 1.25X2 + 7.28X3 + 12.75X4 − 1.05X1X2 − 5.37X1X3 − 4.91X1X4 + 1.48X2X3 − 6.06X2X4 +
10.23X3X4 − 0.36X12 − 6.67X22 − 1.95X32 + 6.95X42
Y3 = 94.66 − 0.1X1 + 0.27X2 − 0.35X3 − 2.32X4 + 2.41X1X2 − 0.1X1X3 + 1.21X1X4 + 0.4X2X3 − 3.31X2X4 − 1.26X3X4
0.63X12 − 1.69X22 − 1.86X32 + X42
Y4 = 3.77 − 0.11X1 − 0.13X2 − 0.11X3 − 0.2X4 − 0.54X1X2 − 0.1X1X3 + 1.21X1X4 + 0.4X2X3 − 3.31X2X4 − 1.26X3X4
0.63X12 − 1.69X22 − 1.86X32 + X42
To test the reliability and accuracy of the equations, the variance and significance of the four regression models were analyzed. The results are shown in Table 3. The results of all four models were highly significant (p ≤ 0.001), which indicated that the equations fitted the test results well; thus, the regression equations could be used to analyze and predict the true values of the experiments. The adjusted coefficients of determination (RAdj2) of the models were 0.7461 (Y1), 0.8286 (Y2), 0.7467 (Y3), and 0.7092 (Y4), respectively, indicating that the four response values were ~74%, 82%, 74%, and 70% of the variation distributed among the four related factors studied, and only 26%, 18%, 26%, and 30% of the total variability could not be explained by the models. The correlation coefficients (r) of the models were 0.9343 (Y1), 0.9562 (Y2), 0.9346 (Y3), and 0.9244 (Y4), indicating a high correlation between the predicted and experimental values for all four response values. The lack of fit values (p = 0.0589 (Y1), 0.073 (Y2), 0.1919 (Y3), and 0.1592 (Y4)) were all >0.05. This shows that the misfit error was not significant compared with the pure error, and the non-normal error accounts for a small proportion of the difference between the actual equation and the actual fitting. The linear relationship between the independent variables and the response values was significant; thus, the four models could be used for theoretical prediction of the response values.
Furthermore, the coefficient of variation (CV) of the models was only 27.1% (Y1), 14.36% (Y2), 1.54% (Y3), and 5.81% (Y4), which also shows that the equations fitted well. A signal-to-noise ratio (Adeq Precision) > 4 is satisfactory. Signal-to-noise ratios for the four models were 9.919 (Y1), 14.041 (Y2), 10.914 (Y3), and 8.976 (Y4), indicating that these models had sufficiently strong signals for the fitted design space. Normal plots of residuals, residual vs. predicted values, and predicted vs. actual values for the four models are shown in Figure 1, Figure 2, Figure 3 and Figure 4. The normal probability distribution of residuals is essentially a straight line, the distribution of the predicted residuals is irregular, and the actual residuals converge near a straight line. This is in line with the model establishment law; thus, the models were sufficiently accurate, and could be used to analyze and predict the fermentation process.
The results of significance testing of the regression coefficients for the four quadratic models are shown in Table 4. In model (1), factors X1, X2, X3, X32, X1X4, and X2X4 had a significant effect on the soluble nitrogen concentration, and factor X4 had an extremely significant effect. In model (2), factors X2, X4, and X2X4 had a significant effect on DPPH free radical scavenging rate, and factors X22, X42, and X3X4 had a highly significant effect. In model (3), factors X4 and X1X2 had an extremely significant effect on hydroxyl free radical scavenging rate, and factors X22, X32, and X1X2 had a highly significant effect. In model (4), factors X2, X32, and X3X4 had a significant effect on NSP yield rate, factors X4 and X12 had a highly significant effect, and X1X2 had an extremely significant effect. Significance testing of the four quadratic models showed that the experimental factors were not simple linear relations to the response values; rather, the quadratic terms were strongly correlated with the response values, and the interaction terms had significant influence. By comparing the variance of the first term in the quadratic polynomial equation of the response surface models, we can judge the primary and secondary order of the influencing factors. The degree of influence of each factor on the soluble nitrogen concentration, DPPH free radical scavenging rate, hydroxyl free radical scavenging rate, and NSP yield rate were ordered X4 > X3 > X2 > X1, X4 > X3 > X1 > X2, X4 > X3 > X2 > X1 and X4 > X2 > X1 > X3.

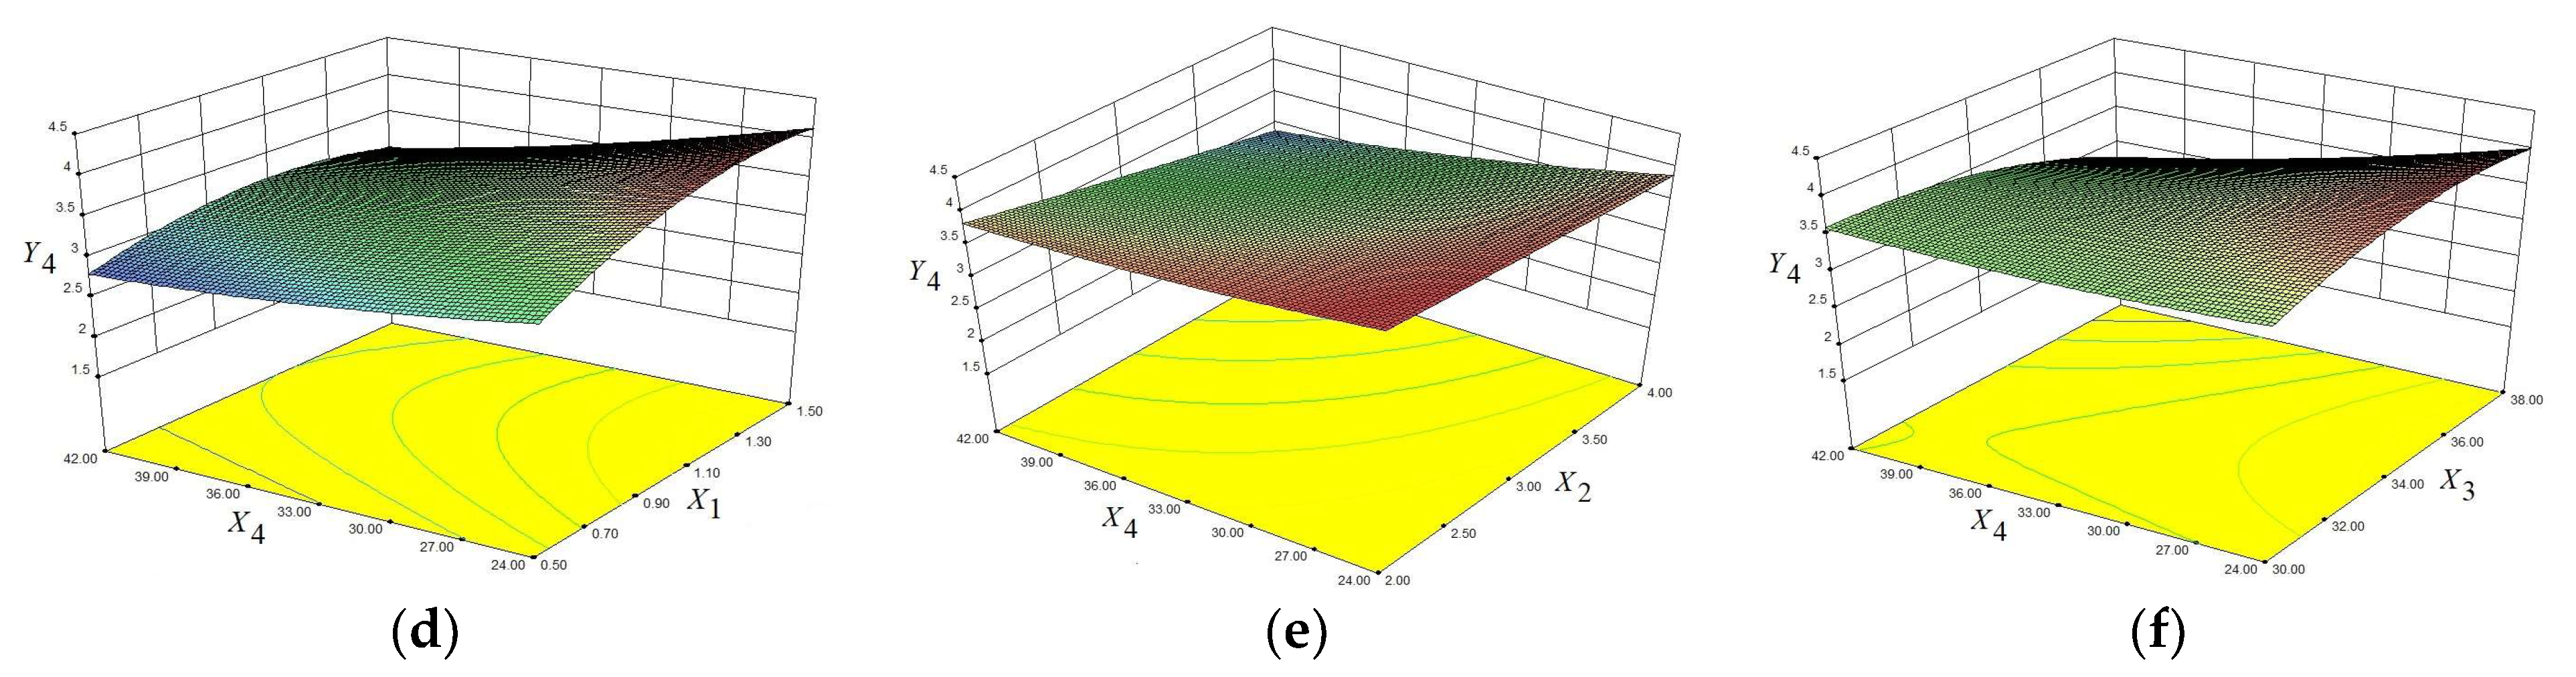
3.1.2. Intuitive Analysis of RSM

From the RSM regression equations, we concluded that the strain ratio and the four response values were negatively correlated; inoculation amount was positively correlated with hydroxyl radicals and negatively correlated with the other three response values; fermentation temperature and time were positively correlated with the soluble nitrogen concentration and DPPH free radical scavenging rate, and negatively correlated with the other two response values.
Figure 5, Figure 6, Figure 7 and Figure 8 show the response surface analysis diagrams of the four factors interacting with response values. In the interactions between the soluble nitrogen concentration and the four factors, the soluble nitrogen concentration first decreased then increased with increasing fermentation duration when the strain ratio was fixed; conversely, when the fermentation duration was fixed, the soluble nitrogen concentration decreased with increasing strain ratio; this indicated that the interaction between the two was significant (p < 0.05; Figure 5c). When the inoculation amount was fixed, the soluble nitrogen concentration decreased with increasing fermentation duration; whereas when the fermentation duration was fixed, the soluble nitrogen concentration decreased with increasing inoculation amount, indicating that the interaction between them was significant (p < 0.05; Figure 5e).
Figure 6 shows the effect of inoculation amount and fermentation duration on DPPH free radical scavenging rate. The scavenging rate increased with the prolongation of fermentation duration when the inoculation amount was fixed, whereas when the fermentation duration was fixed, the scavenging rate first increased then decreased with increasing inoculation amount, indicating that the interaction between the two was significant (p < 0.05, Figure 6e). Figure 6f shows the effect of fermentation temperature and time on the DPPH free radical scavenging rate. When the fermentation temperature was fixed, the scavenging rate increased with the prolongation of fermentation duration, whereas when the fermentation duration was fixed, the scavenging rate increased with increasing inoculation amount, indicating that the interaction between the two was highly significant (p < 0.01).
In the interactions between the hydroxyl free radical scavenging rate and the four factors, the scavenging rate increased with increasing inoculation amount when the strain ratio was fixed; however, when the inoculation amount was constant, the scavenging rate increased with increasing strain ratio, indicating that the interaction between the two was highly significant (p < 0.01; Figure 7a). The hydroxyl free radical scavenging rate decreased with increasing fermentation duration, whereas, when the fermentation duration was fixed, the scavenging rate increased slowly at first then decreased with increasing inoculation amount, indicating that the interaction between the two was extremely significant (p < 0.001; Figure 7e).
In the interaction between the NSP yield rate and the four factors, the NSP yield rate decreased with increasing inoculation amount when the strain ratio was fixed; however, when the inoculation amount was constant, NSP yield rate decreased with increasing of strain ratio, indicating that the interaction between the two was extremely significant (p < 0.001; Figure 8a). When the fermentation temperature was fixed, the NSP yield rate decreased with increasing fermentation duration, whereas when the fermentation duration was fixed, NSP yield rate decreased with increasing fermentation temperature, indicating that the interaction between the two was significant (p < 0.05; Figure 8f).

3.1.3. Determination of Optimum Conditions

The optimum conditions for solid-state fermentation of HDPM by A. oryzae and S. cerevisiae were determined, based on a typical analysis of an experimental model, and found to be strain ratio 1.21, inoculation amount 2 mL, fermentation temperature 34.32 °C and fermentation duration 42 h. Under optimum conditions, the soluble nitrogen concentration, DPPH free radical scavenging rate, hydroxyl free radical scavenging rate, and NSP yield rate reached 44.78 mg/mL, 62.44%, 94.95%, and 3.73%, respectively.
To test the feasibility of the RSM and to consider the convenience of the actual operation, the optimum parameters were modified to a strain ratio 1.2 (6:5), inoculation amount 2 mL, fermentation temperature 35 °C, and fermentation time 42 h. The results of verification tests revealed that the soluble nitrogen concentration, DPPH free radical scavenging rate, hydroxyl free radical scavenging rate, and NSP yield rate reached 46.80 ± 1.23 mg/mL, 72.18 ± 0.78%, 96.79 ± 0.55%, and 4.42 ± 0.21%, respectively. All response values reached the levels of theoretical values, which showed that the models fitted the actual situations well, and this confirmed the correctness of the predicted models. Consequently, the optimal conditions for solid-state fermentation of HDPM by A. oryzae and S. cerevisiae are likely to be suitable and have practical application value.

3.2. Analysis of Antioxidant Activities

Antioxidant activities of APs with molecular weight < 5 kDa, NSPs, and FHDPM are shown in Table 5. APs, NSPs, and FHDPM had four major antioxidant activities involving free radical scavenging activity, reducing power, lipid peroxidation inhibition activity, and metal ion chelating power. In DPPH free radical and superoxide anion free radical scavenging experiments, FHDPM showed the strongest activity. In hydroxyl free radical scavenging experiments, activity of NSPs was highest. Activity of APs was best in both iron- and molybdenum-reducing power experiments. In lipid peroxidation inhibition experiments, activity of NSPs was highest. Activities of APs and NSPs were best in both iron and copper chelating capacity experiments.
Due to denaturation of proteins and degradation and browning of polysaccharides, HDPM cannot be directly used in the food industry, and can instead only be used as low-value feed or fertilizer, representing a great waste of resources [29,30,31]. However, protein and polysaccharides macromolecules in HDPM alter their molecular structures and conformations at high temperature, which is beneficial to the utilization of A. oryzae and S. cerevisiae [32,33]. During solid-state fermentation, protein from HDPM was used as the nitrogen source and polysaccharides as the carbon source. Because A. oryzae and S. cerevisiae can produce proteases, amylases, saccharifying enzymes, and cellulases during the fermentation process, these enzymes can hydrolyze proteins into peptides and amino acids, while polysaccharides are hydrolyzed into oligosaccharides [34,35]. Consequently, fermentation products were further separated and purified to obtain APs, NSPs, and FHDPM with improved physicochemical properties.
Using solid-state fermentation technology, Bacillus licheniformis was used to produce FHDPM with improved nutritional and antioxidant properties. Compared with HDPM, FHDPM had higher levels of crude protein, oligopeptides, and amino acids, and antioxidant activities such as reducing power, free radicals scavenging activity, and metal ion chelating capacity [5]. Another study also found that the free radical scavenging activity, reducing power, metal ion chelating power, and inhibition of linoleic acid autoxidation of peanut peptides produced from HDPM fermented by B. subtilis were significantly increased compared with unfermented HDPM [36]. After further separation, purification, and identification, a natural antioxidant dipeptide was obtained from the mixture of peanut peptides fermented by B. subtilis [37]. The results of the present study are similar to those of previous studies. After solid-state fermentation treatment, the obtained APs, NSPs, and FHDPM had better antioxidant activities such as free radical scavenging activities, reducing power, metal ion chelating capacity, and lipid peroxidation inhibition capacity compared with unfermented HDPM. Therefore, a variety of products with high-added-value and high physiological activities can be obtained from low-value HDPM, which provides potential for the efficient utilization of HDPM.
In addition to single-strain solid-state fermentation technology, some studies have focused on using A. oryzae, S. cerevisiae, and other microorganisms for mixed fermentation of plant meals to obtain fermentation products with high antioxidant activity. When rapeseed meal was fermented by B. subtilis and S. cerevisiae for 48 h, the content of short peptides (molecular weight < 3 kDa) and the DPPH free radical scavenging activity reached maximum levels. Furthermore, rats fed with fermentation products had higher levels of total superoxide dismutase (T-SOD) in serum and liver, and malondialdehyde (MDA) content was lower [38]. Another study on the antioxidant activities of fermentation products revealed that after solid-state fermentation of soybean meal by Bacillus amyloliquefaciens, Lactobacillus, and S. cerevisiae, their free radical scavenging capacity, reducing power, and calcium ion chelating power were all increased [39]. Liu et al. studied the preparation of water-soluble fermented rice bran extract (FRBE) by solid-state fermentation of rice bran with S. cerevisiae, B. subtilis, and Lactobacillus plantarum. In an antioxidant experiment of zebrafish embryos, compared with water-soluble unfermented rice bran extract, FBRE could significantly reduce reactive oxygen species (ROS), lipid peroxidation (LPO) levels, and 2,2′-azobis (2-methylpropionamidine) dihydrochloride (AAPH)-induced cell death, and increase superoxide dismutase (SOD) and chloramphenicol acetyltransferase (CAT) activities [40]. Zhang et al. investigated the effect of mixed solid-state fermentation of hulless barley grain by S. cerevisiae and L. plantarum. The results showed that the content of water-soluble dietary fiber and amino acids increased after fermentation, and 2, 2’-azino-bis(3-ethylbenzothiazoline-6-sulfonic acid) (ABTS) free radical scavenging capacity and total antioxidant activity were significantly increased [41]. The APs, NSPs, and FHDPM obtained in the present study are consistent with the results of the above studies, and all have better antioxidant activities. Consequently, these results indicate that solid-state fermentation of plant meal using single or mixed strains can generate products with antioxidant activities.

3.3. Amino Acid and Trace Minerals Analysis

The results of amino acids and partial trace minerals analysis of HDPM and FHDPM are shown in Table 6. Compared with HDPM, the total amino acid content of FHDPM was increased by 11.88%. The contents of all 18 amino acids in FHDPM were higher than those of HDPM, among which methionine, histidine, and threonine increased the most, by 55.00%, 47.83%, and 32.04%, respectively. The 12 amino acids (Arg, His, Ile, Leu, Lys, Met, Met + Cys, Phe, Phe + Tyr, Thr, Trp, and Val) in the ideal protein model in FHDPM were increased by 14.44% compared with HDPM after fermentation. Moreover, the total amount of essential amino acids was increased by 15.62%. Levels of Se, Zn, and Cu were increased by 70.59%, 51.89%, and 48.21%, respectively, and K was the only trace mineral that decreased compared with HDPM after fermentation. The proteases produced by A. oryzae and S. cerevisiae hydrolyzed peanut protein into smaller proteins and polypeptides. In addition, A. oryzae and S. cerevisiae grew and multiplied during the fermentation process, and they are also good protein sources themselves. For example, studies by Kiros et al. found that S. cerevisiae fermentation extract was a good nutritional protein substitute for piglet feed because it contained 50–60% protein, free amino acids, and active peptide components [42]. Using RNA-free A. oryzae as a substitute for animal meat protein, Olasky et al. developed a new method using A. oryzae, flour, quinoa flour, rice flour, carboxymethyl cellulose, TGA enzymes, the colorant beet extract, and mahogany to make barbecue burgers [43]. The protein content of the burgers was higher than that of traditional hamburger products. It can be inferred that the proliferation of A. oryzae and S. cerevisiae also contributed to the increase in amino acid content in FHDPM. Together, these factors increased the content of amino acids in FHDPM.
Sabar et al. mechanically treated soybean meal then performed solid-state fermentation by B. subtilis and A. oryzae [9], and Chen et al. fermented soybean meal generated by A. oryzae [44]. Both studies showed that the total protein and amino acid content of soybean meal increased significantly after fermentation. In the present study, levels of 18 amino acids and total amino acids in FHDPM were higher than in HDPM, consistent with the results of the above two studies. In another study, Shi et al. found that the contents of trichloroacetic acid soluble protein, small peptides, and free amino acids increased, but the total amino acid contents remained unchanged after corn–soybean meal was fermented by both B. subtilis and Enterococcus faecium [45]. In particular, the contents of polar amino acids such as Arg, Asp, and Glu decreased after fermentation. By contrast, in the present study, Arg, Asp, and Glu contents in FHDPM were increased by 3.98, 10.17, and 8.57%, respectively, compared with HDPM. The reason for this difference may be that the contents of hydrolyzed amino acids and total amino acids of FHDPM were increased.
Trace minerals, especially calcium, iron, and zinc, are very important for the health of humans and monogastric animals. Humer et al. showed that the absorption rate of trace minerals in fermented food or feed was higher than that in unfermented food or feed. This may be because during the fermentation process, microorganisms produce abundant enzymes including phytase, cellulase, protease, and amylase. Additionally, some ingredients in food or feed such as phytic acid, cellulose, and protein are enzymatically hydrolyzed, which is beneficial to the release, absorption, and utilization of trace mineral elements, especially calcium, iron, and zinc [46]. It can be concluded that the contents of trace minerals in FHDPM increase after fermentation by A. oryzae and S. cerevisiae. Kwak et al. used Enterobacter sp., Bacillus sp., Lactobacillus sp., and Saccharomyces sp. to ferment common feed enriched with trace minerals such as zinc and copper, then fed the fermented feed to sheep. The results revealed that the bioavailability and retention of zinc, copper, and other trace minerals in sheep was increased, but there was no adverse effect on sheep [47]. Shah et al. conducted a study on feeding male rabbits with hybrid pennisetum silage fermented by L. plantarum and Pediococcus acidilactici. Compared with the untreated group, the weekly body weight of male rabbits fed with fermented feed was increased significantly. In addition, trace minerals such as copper, iron, manganese, and zinc in meat of the treated group were significantly more abundant than in the untreated group [48]. These results showed that fermented feed was rich in beneficial amino acids and trace mineral elements, benefitting the healthy growth of domestic animals. Thus, FHDPM could serve as a high-quality alternative to basic feed due to increases in 18 amino acids, total amino acids, and 6 trace mineral elements in FHDPM.

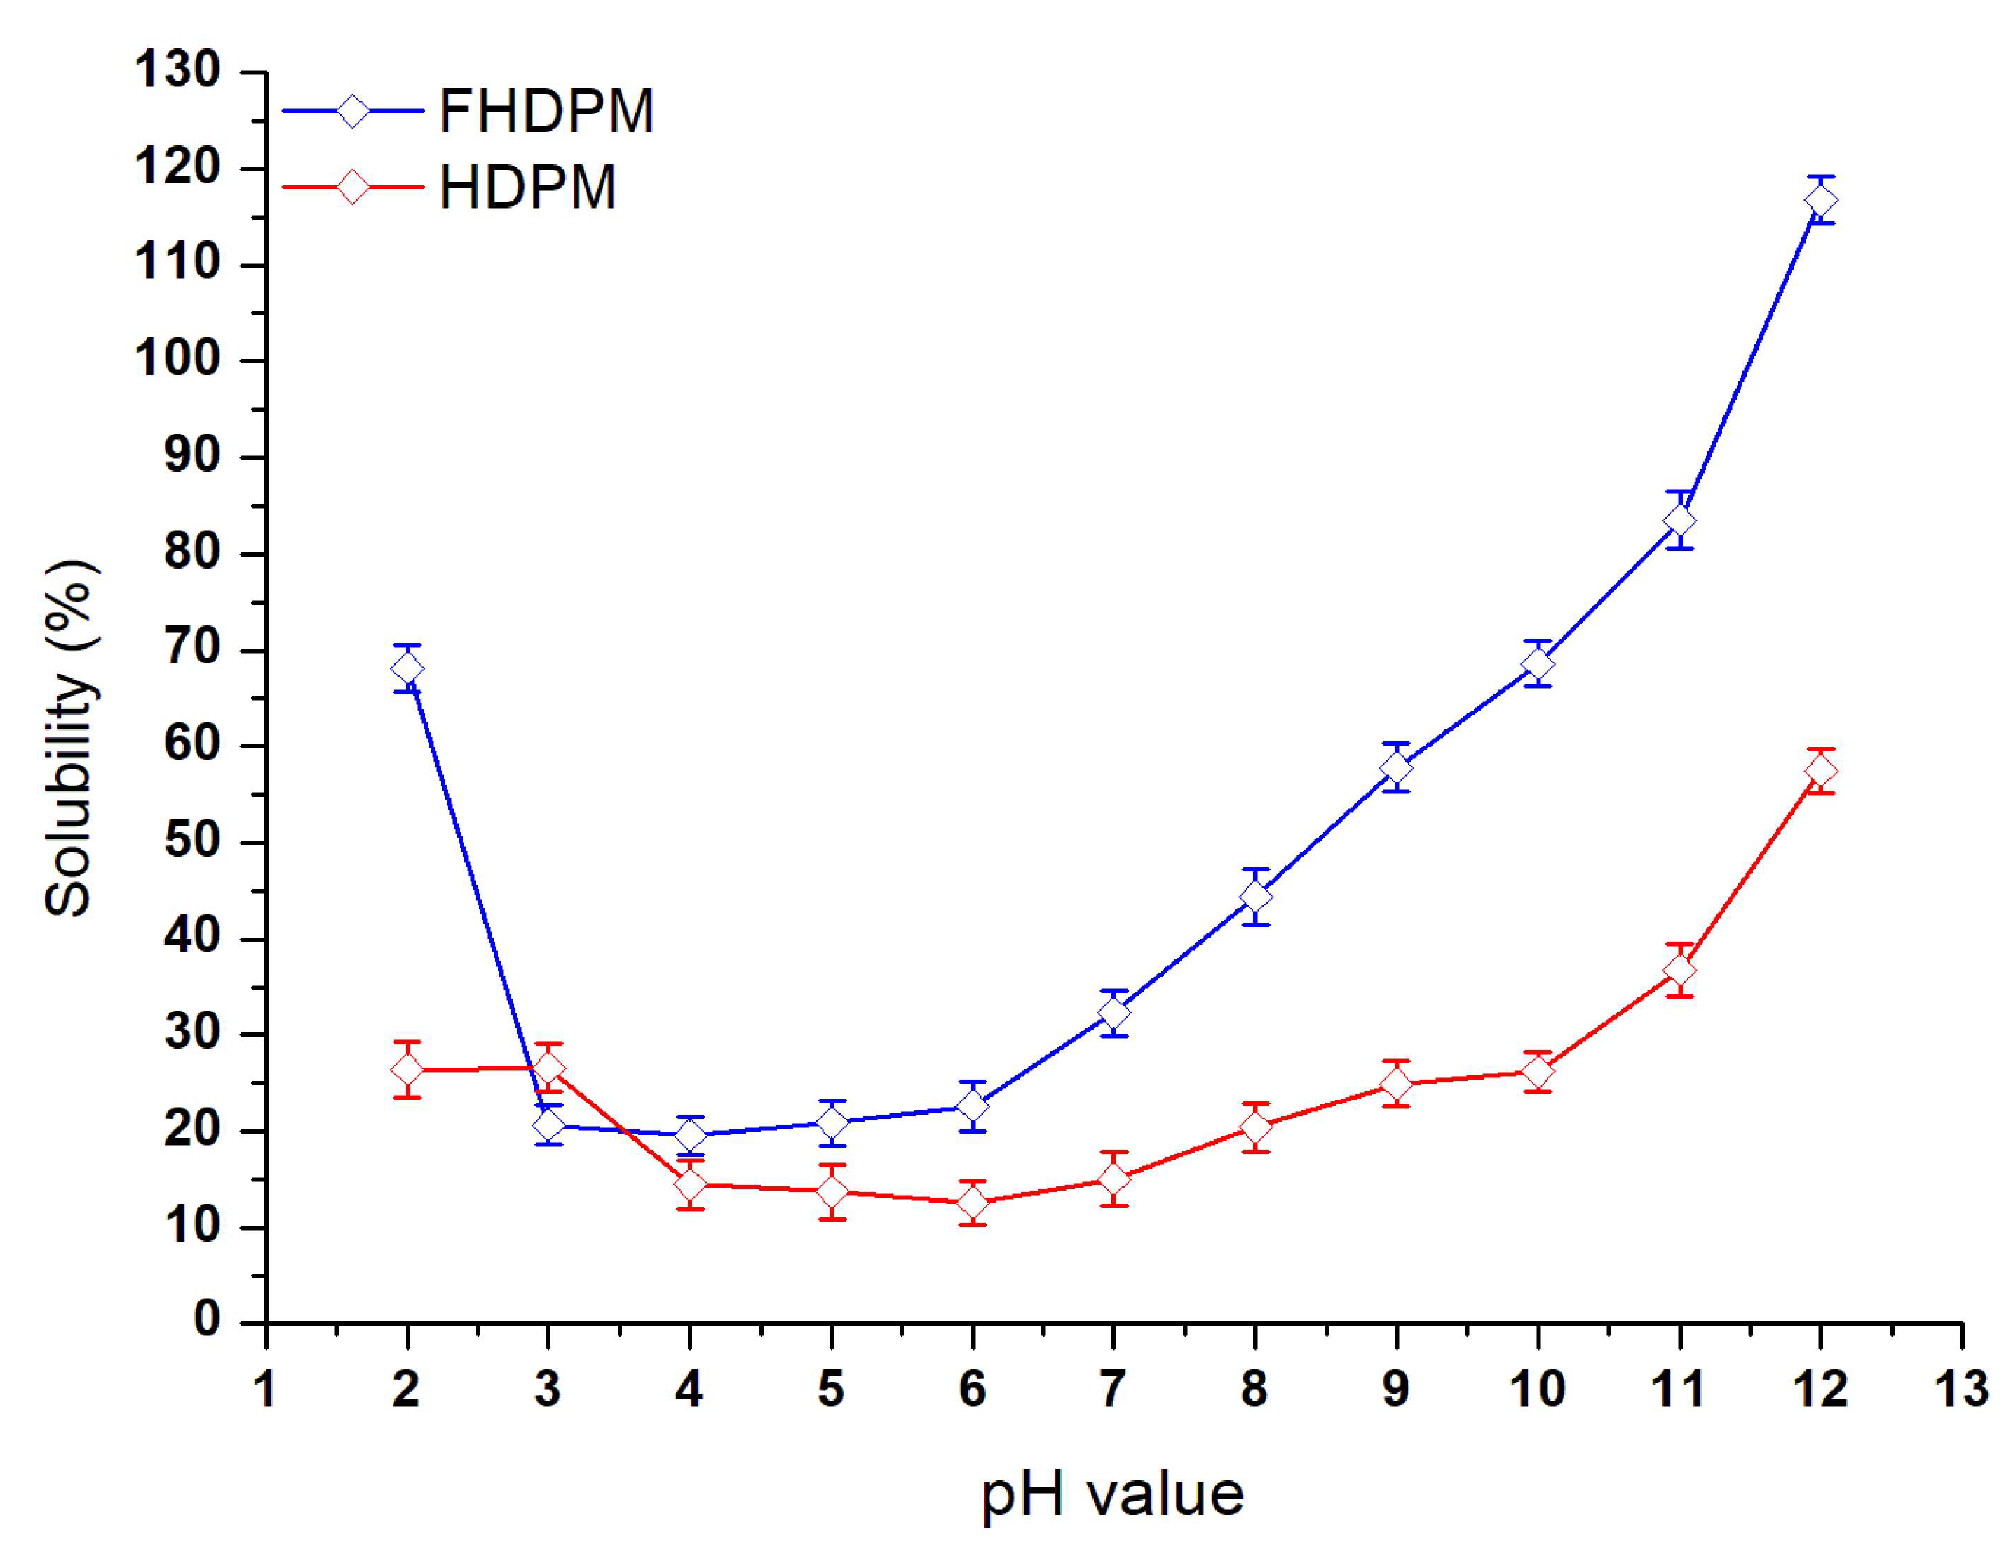
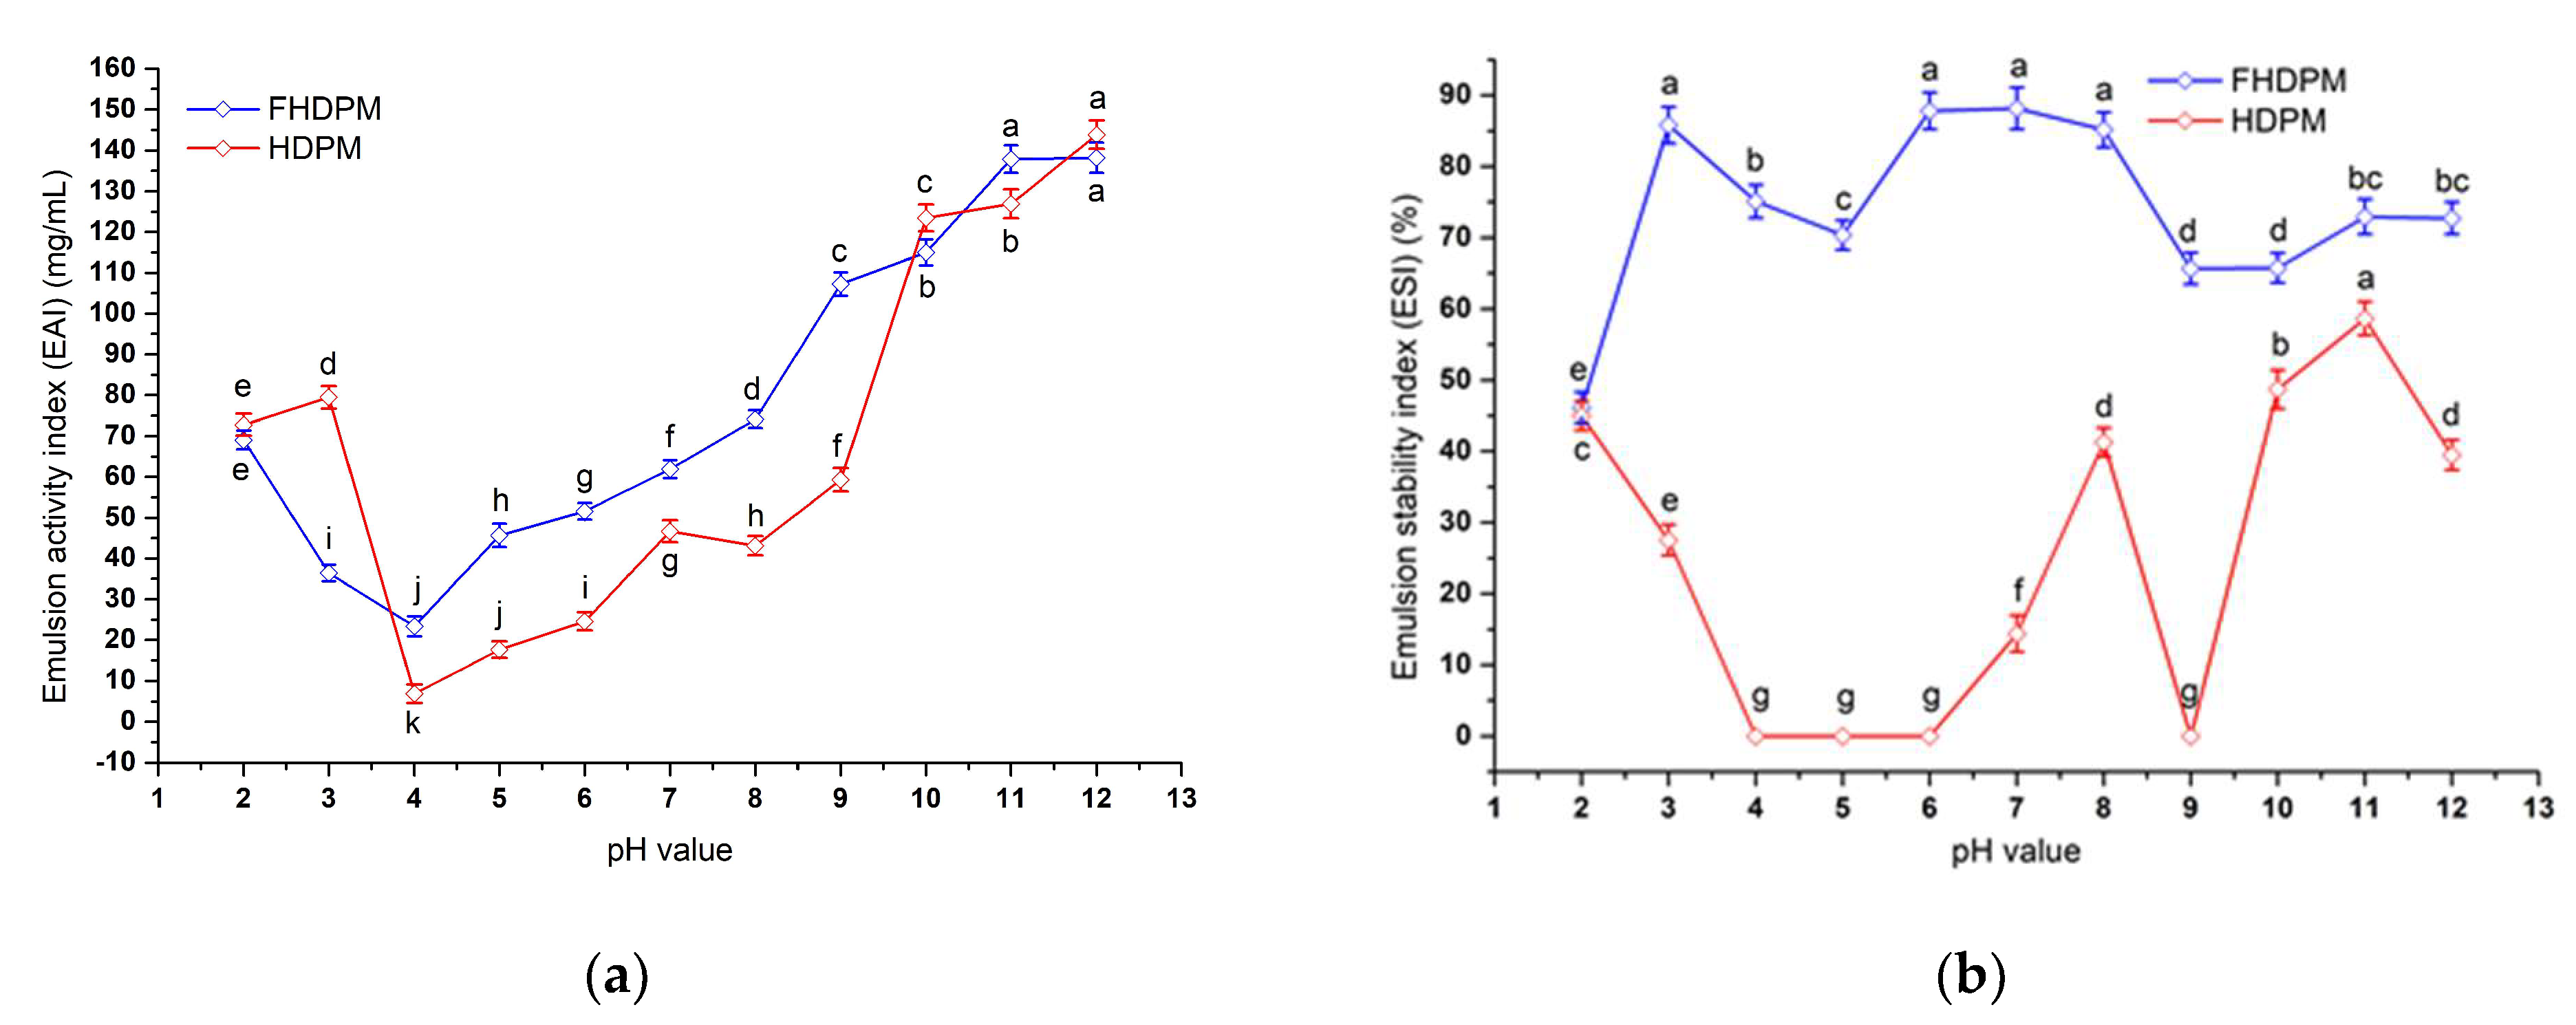
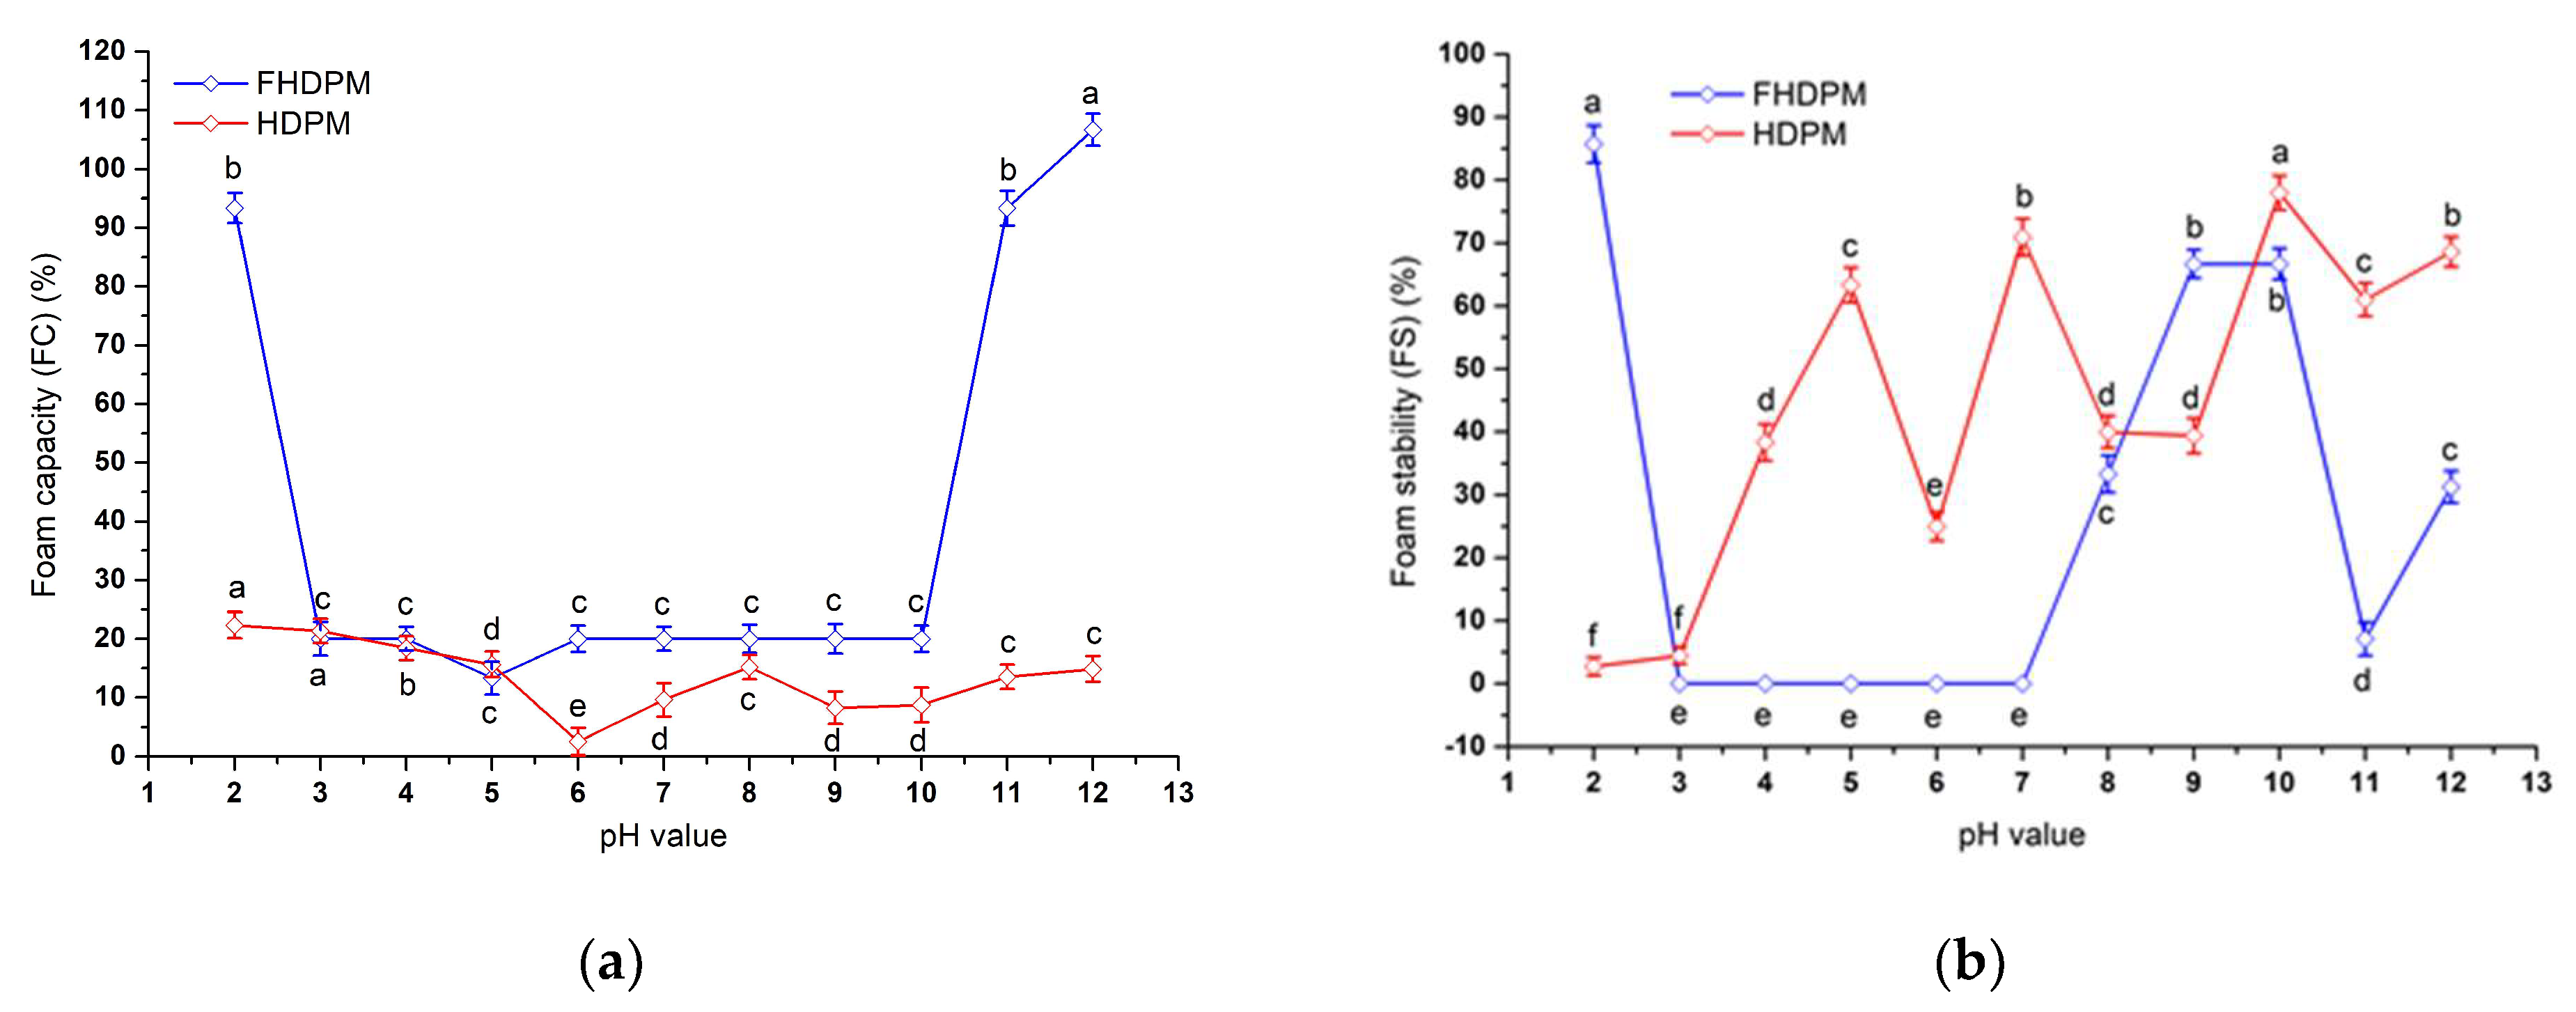
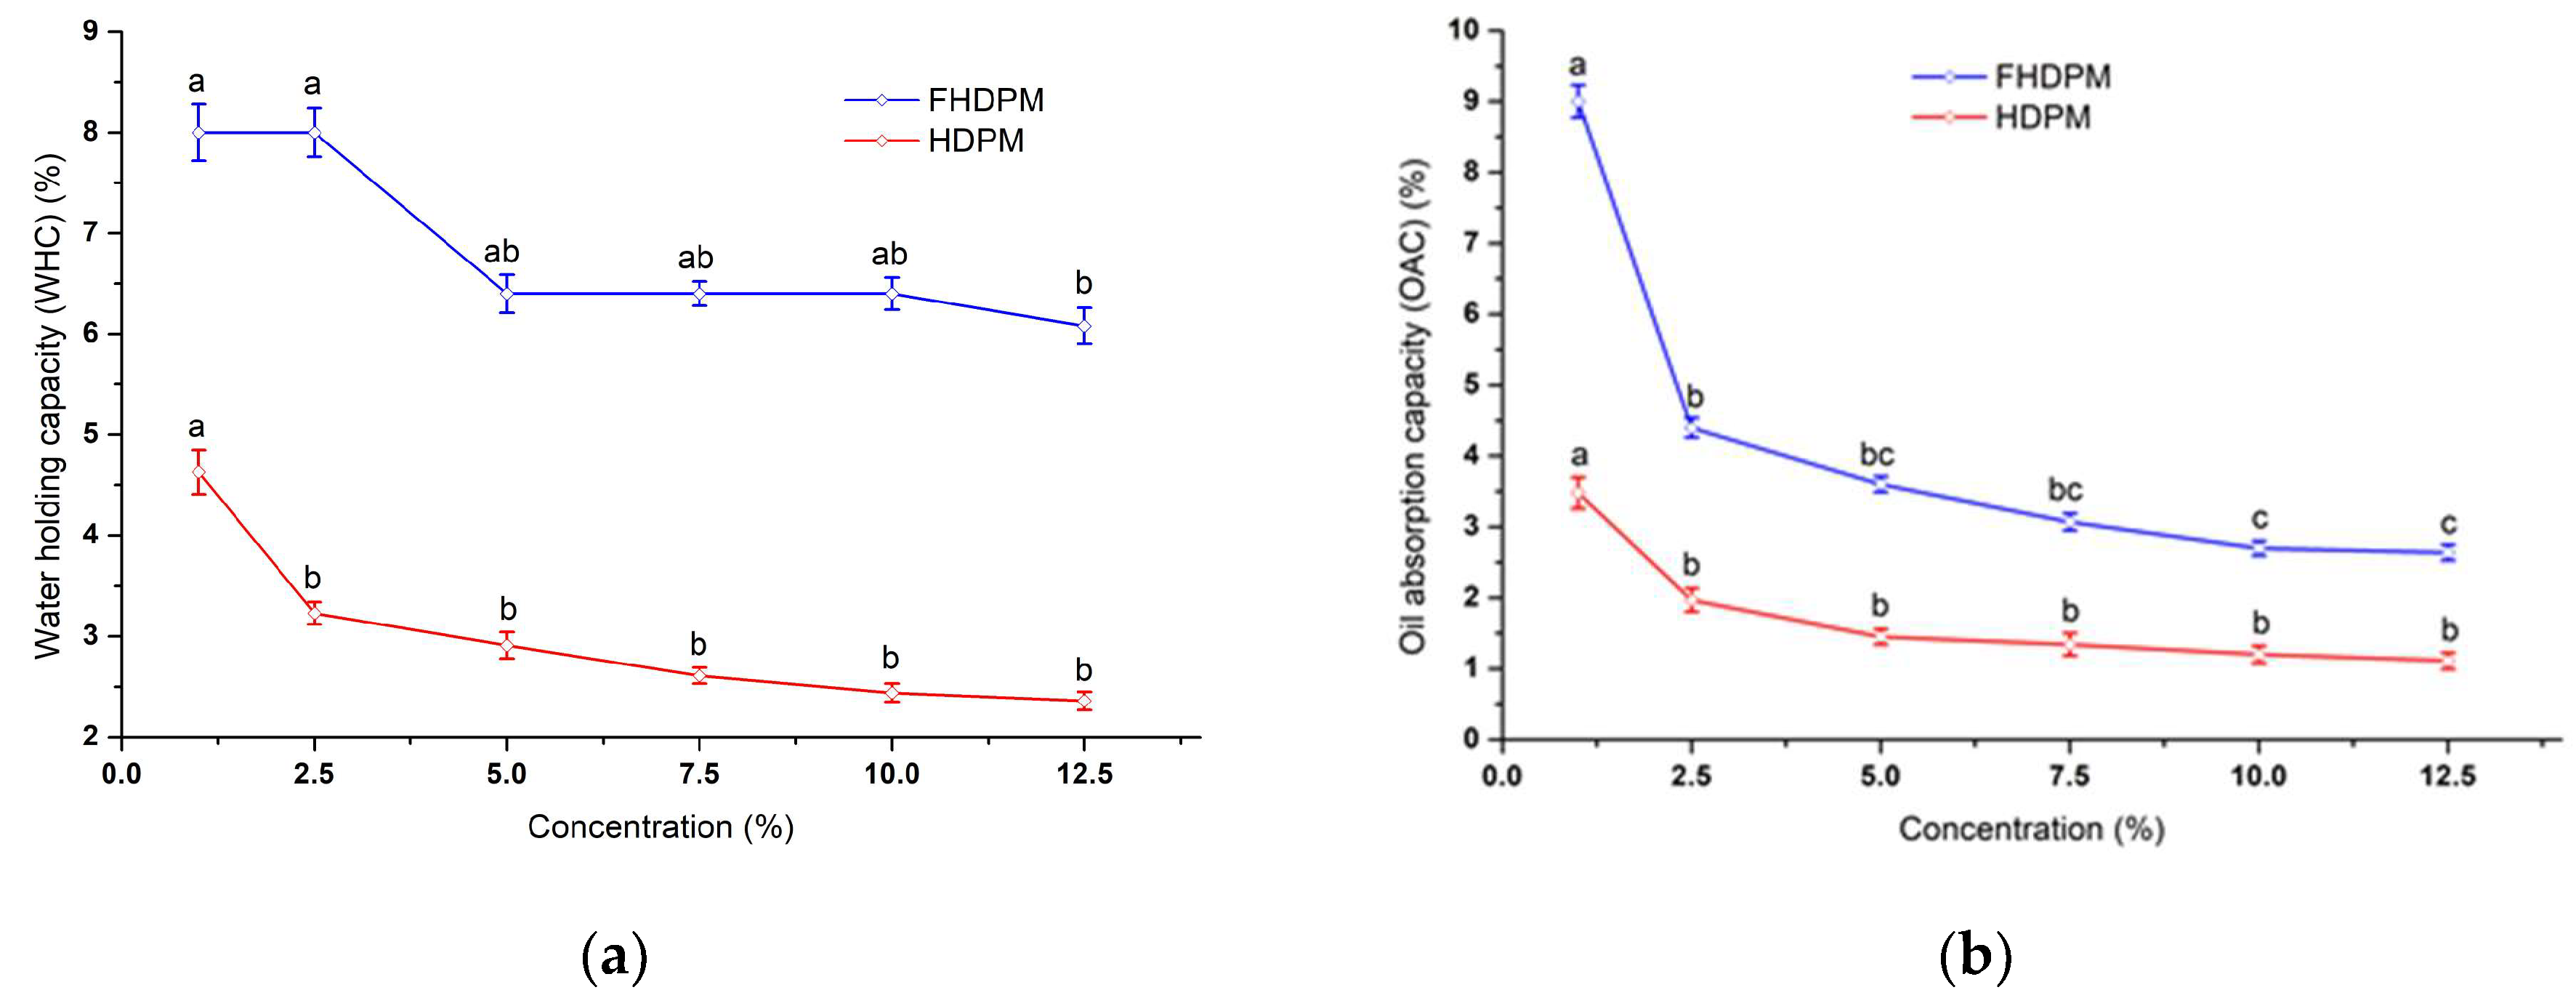
3.4. Physicochemical Properties of FHDPM and HDPM

The solubility, emulsion activity index (EAI), emulsion stability index (ESI), foam capacity (FC), foam stability (FS), water holding capacity (WHC), and oil absorption capacity (OAC) results for FHDPM and HDPM are shown in Figure 9, Figure 10, Figure 11 and Figure 12. In the solubility experiment, the solubility of FHDPM was more than two times higher than that of HDPM in the range of pH 7–12 and pH 2 (Figure 9). In addition, except for pH 3, the solubility of FHDPM was also greater than that of HDPM in the range of pH 4–6. In the solubility vs. pH curves for FHDPM and HDPM, the solubility of pH 12 was significantly higher than at other pH values (p < 0.05). Upadhaya et al. fed pigs fermented soybean meal with three different solubilities (52.4%, 62.0%, and 71.8%) [49]. Compared with unfermented soybean meal, the physiological activity of fermented soybean meal with higher solubility (71.8%) performed better. Their results showed that the apparent ileal digestibility of dry matter, nitrogen, Ile, Phe, Val, and Lys, and the standardized ileal digestibility of crude protein, Lys, and Iso, in fermented soybean meal was greater than that of unfermented soybean meal.
In the emulsion activity experiment, although the EAI of HDPM was higher than that of FHDPM at pH 2, 3, 10, and 12, the EAI of FHDPM was higher than that of HDPM at all other pH values (Figure 10a). The EAI of FHDPM at pH 11 and pH 12 was significantly higher than at other pH values (p < 0.05). In the pH 2–12 range, the ESI of FHDPM was higher than that of HDPM (Figure 10b). Lu et al. simulated the natural fermentation process of soybean meal by B. subtilis and obtained fermented soybean meal [50]. The results showed that the antioxidant activity, angiotensin-converting enzyme (ACE) inhibitory activity, emulsion activity and stability, total amino acid content, and essential amino acid content of fermented soybean meal were higher than those of unfermented soybean meal. The in vitro antioxidant activity, emulsion activity and stability, and total amino acid and essential amino acid content of FHDPM were superior to those of HDPM in the study. Our results are consistent with the above studies, and suggest that the nutritional and physicochemical properties of plant meal can be improved after fermentation.
At pH 5, the FC of FHDPM was slightly less than that of HDPM, but the FCs of FHDPM were greater than those of HDPM at all other pH values tests. As can be seen from Figure 11a, the FC of FHDPM at pH 12 was significantly greater than that at other pH values (p < 0.05). The FS of FHDPM was better than that of HDPM at pH 2 and 9, but overall, the FS of FHDPM was lower than that of HDPM (Figure 11b). The FS diagram of HDPM shows that FS at pH 10 was significantly higher than at other pH values (p < 0.05). Ma and colleagues used Monascus purpureus to ferment heat-denatured soybean meal and measured changes in nutritional composition, antioxidant activities, and physicochemical properties of fermented soybean meal [51]. The results showed that the contents of polysaccharide and amino acids, antioxidant activities, emulsifying properties, and foaming abilities of the fermented heat-denatured soybean meal were significantly increased. These results are consistent with those of the present study showing that the nutritional components, antioxidant activities, and physicochemical properties of FHDPM from the heat-denatured peanut meal generated by mixed solid-state fermentation using A. oryzae and S. cerevisiae were correspondingly improved. These results further demonstrate that microbial fermentation can improve the quality of HDPM and facilitate its high-value utilization.
In the gradient concentration range of 1–12.5, the WHC and OAC of FHDPM were 1.7–2.6 times and 2.2–2.6 times higher than those of HDPM, respectively (Figure 12a,b). In the process of fermentation, A. oryzae and S. cerevisiae hydrolyzed HDPM into small proteins, polypeptides, polysaccharides, and oligosaccharides. The structures of proteins and polysaccharides were altered, and the physicochemical properties of FHDPM were enhanced. The results of solid-state fermentation of canola meal with Aspergillus sojae and Aspergillus ficuum reported by Olukomaiya et al. are consistent with the above conclusion [52]. Their research found that the molecular weights of fermented protein products were decreased, the color became lighter, and the WHC increased. Therefore, microbial fermentation technology is an effective method for improving the physicochemical properties of peanut meal and other plant meals, which can enhance their processing characteristics and palatability, making them more suitable for broader applications.

4. Conclusions

RSM was used to optimize the solid-state mixed fermentation process of HDPM by A. oryzae and S. cerevisiae. The optimal process parameters were determined by variance analysis, significance tests, intuitive analysis, and condition optimization screening of the quadratic regression model with four response values. The optimum parameters were strain ratio 1.2 (6:5), inoculation amount 2 mL, fermentation temperature 35 °C, and fermentation duration 42 h. Under the optimal fermentation conditions, APs, NSPs, and FHDPM could be obtained. The results of the antioxidant activity experiment showed that Aps, NSPs, and FHDPM had good free radical scavenging activity, reducing power, metal ion chelating capacity, and lipid peroxidation inhibitory activity. Thus, they are likely to be suitable for use in food and feed industries as potential natural antioxidants. In addition, the contents of 18 amino acids, total amino acids, 6 trace minerals, and physicochemical properties of FHDPM were superior to those of HDPM. Thus, high-value-added products (APs and NSPs) and FHDPM with high nutritional value and good physicochemical properties could be obtained after solid-state fermentation of HDPM by A. oryzae and S. cerevisiae. This study lays a foundation for the utilization of low-value HDPM. In the future, APs and NSPs are expected to replace synthetic antioxidants in baked goods, meat products, flour products, and other food processing fields due to their high nutritional and good antioxidant activities. This could simultaneously increase the nutritional value of food products and improve food safety. Furthermore, FHDPM can also be used in the livestock industry as a high nutritional feed that is easily absorbed and utilized by livestock, with good processing characteristics. In conclusion, the solid-state mixed fermentation process is simple and practical, and the AP, NSP, and FHDPM products obtained have good antioxidant activity and physicochemical properties and may expand the peanut processing industry chain.

Author Contributions

Conceptualization, L.Y., C.S. and M.W.; data curation, L.Y., J.B., Y.S. and H.Q.; formal analysis, L.Y., J.B., C.J., X.C. and W.Y.; funding acquisition, W.Y., C.S., Q.G. and M.W.; investigation, L.Y., X.C., C.S. and Q.G.; methodology, L.Y., J.B., X.C. and M.W.; project administration, L.Y., C.J. and H.Q.; resources, C.J., H.Q., W.Y., C.S. and Q.G.; validation, L.Y., Y.S., H.Q., W.Y. and Q.G.; writing—original draft, L.Y., J.B. and Y.S.; writing—review and editing, L.Y., Y.S., C.J., X.C. and M.W. All authors have read and agreed to the published version of the manuscript.

Funding

This research was funded by Qingdao Bureau of Science and Technology, Qingdao Science and Technology Huimin County Demonstration Project of China (project No: 20-3-4-33-nsh), Shandong Natural Science Foundation of China (grant number ZR2021MC049), Shandong Province People’s Government, Taishan Scholar Project Funding of China (project No: tsqn201812121), and Agricultural Innovation Project of Shandong Academy of Agricultural Sciences of China (project name: Study on the key technology of quality safety and deep processing of corn and peanut; project No: CXGC2023A39).

Institutional Review Board Statement

Not applicable.

Informed Consent Statement

Not applicable.

Data Availability Statement

Not applicable.

Conflicts of Interest

The authors declare no conflict of interest.

References

  1. Yu, L.; Sun, J.; Liu, S.; Bi, J.; Zhang, C.; Yang, Q. Ultrasonic-assisted enzymolysis to improve the antioxidant activities of peanut (Arachin conarachin L.) antioxidant hydrolysate. Int. J. Mol. Sci. 2012, 13, 9051–9068. [Google Scholar] [CrossRef] [PubMed]
  2. Yu, L.; Qi, H.; Zhang, C.; Bi, J.; Wang, M.; Yang, W.; Sun, J.; Xu, T. Optimization of peanut antibacterial peptides preparation with ultrasonic-assisted enzymolysis by response surface methodology. J. Nucl. Agric. Sci. 2018, 32, 740–750. [Google Scholar]
  3. Mao, X.; Zhang, C.; Chen, X.; Lin, S.; Huang, X.; Zeng, Q. Study on the preparation of peanut polypeptides from hot pressed peanut cake by enzymatic hydrolysis. Mod. Food Sci. Technol. 2013, 29, 150–152, 166. [Google Scholar]
  4. Yu, L.; Wang, W.; Sun, J.; Bi, J.; Zhang, C.; Yang, Q. Synchronous extraction technology of peanut (Arachin conarachin L.) non-starch polysaccharides and antioxidant peptide. J. Peanut Sci. 2014, 43, 7–15. [Google Scholar]
  5. Yang, X.; Teng, D.; Wang, X.; Guan, Q.; Mao, R.; Hao, Y.; Wang, J. Enhancement of Nutritional and Antioxidant Properties of Peanut Meal by Bio-modification with Bacillus licheniformis. Appl. Biochem. Biotech. 2016, 180, 1227–1242. [Google Scholar] [CrossRef] [PubMed]
  6. Kain, R.J.; Chen, Z. Physicochemical characterisation of heat and cold pressed peanut meal flours. Asian J. Biochem. 2008, 3, 256–266. [Google Scholar]
  7. Bisly, A.A.; Hettiarachchy, N.S.; Kumar, T.K.S.; Lay, J.O. Antioxidant activities of solid-state fermentation derived proteins and peptides from heat-stabilized defatted rice bran. J. Aml. Oil Chem. Soc. 2021, 99, 215–228. [Google Scholar] [CrossRef]
  8. Heidari, F.; Øverland, M.; Hansen, J.Ø.; Mydland, L.T.; Urriola, P.E.; Chen, C.; Shurson, G.C.; Hu, B. Solid-state fermentation of Pleurotus ostreatus to improve the nutritional profile of mechanically-fractionated canola meal. Biochem. Eng. J. 2022, 187, 108591. [Google Scholar] [CrossRef]
  9. Sabar, S.W.P.; Adi, R.; Novi, A.; Fathoni, H.R.; Wahyu, S.; Agung, I. Changes in nutritional and antinutritional aspects of soybean meals by mechanical and solid-state fermentation treatments with Bacillus subtilis and Aspergillus oryzae. Bioresour. Technol. Rep. 2022, 17, 100925. [Google Scholar]
  10. Aydın, A.; Emrah, G.; Güray, E. Improvement of nutritional quality of some oilseed meals through solid-state fermentation using Aspergillus niger. Turk. J. Agric. Food Sci. Technol. 2019, 7, 1411–1414. [Google Scholar]
  11. Yin, H.; Jia, F.; Huang, J. The variation of two extracellular enzymes and soybean meal bitterness during solid-state fermentation of Bacillus subtilis. Grain Oil Sci. Technol. B 2019, 2, 39–43. [Google Scholar] [CrossRef]
  12. Zhao, Y.; Sun-Waterhouse, D.X.; Zhao, M.; Zhao, Q.; Qiu, C.; Su, G. Effects of solid-state fermentation and proteolytic hydrolysis on defatted soybean meal. LWT—Food Sci. Technol. 2018, 97, 496–502. [Google Scholar] [CrossRef]
  13. Ling, C.; Tang, H.; Zhou, C.; Yang, C.; Wang, J. Changes of flavor components of almond meal by synergistic fermentation with Aspergillus oryzae and Aspergillus niger. J. Tianjin Univ. Sci. Technol. 2021, 36, 10–15. [Google Scholar]
  14. Wu, B.; Song, J. The research of Bacillus subtilis and Aspergillus oryzae mixing fermentation to make bean pulp feed stuffs. J. Shandong Inst. Light Ind. 2010, 24, 12–15. [Google Scholar]
  15. Li, Y.; Hao, J.; Cheng, Y.; Zhao, R.; Yin, L.; Li, L. Improvement of okara mouthfeel by Aspergillus niger and Aspergillus oryzae fermentation. Trans. Chin. Soc. Agric. Eng. 2012, 28, 248–253. [Google Scholar]
  16. Vittorio, S.; Manuel, B.B.J.; Claudia, B.; Sandro, C.P.; Riccardo, C.; Michael, G.D.; Konrad, G.; Evgenia, L.; Alicja, M.; Gilles, R.; et al. Safety evaluation of the food enzyme α-amylase from Aspergillus oryzae (strain DP-Bzb41). EFSA J. 2019, 17, e05899. [Google Scholar]
  17. Pham, T.A.; Tran, L.N.; Dam, T.H.; To, K.A. Valorization of cassava bagasse using co-culture of Aspergillus oryzae VS1 and Sporidiobolus pararoseus O1 in solid-state fermentation. Waste Biomass Valoriz. 2022, 13, 3003–3012. [Google Scholar] [CrossRef]
  18. Fadel, M.; Sawsan, A.-H.; Hayat, S.; Ahmed, Y.; Mayar, A. Production of glucoamylase, α-amylase and cellulase by Aspergillus oryzae F-923 cultivated on wheat bran under solid state fermentation. J. Adv. Biol. Biotechnol. 2020, 23, 8–22. [Google Scholar] [CrossRef]
  19. Watanabe, A.; Suzuki, M.; Ujiie, S.; Gomi, K. Purification and enzymatic characterization of a novel β-1,6-glucosidase from Aspergillus oryzae. J. Biosci. Bioeng. 2016, 121, 259–264. [Google Scholar] [CrossRef]
  20. El-Deen, A.M.N.; Shata, H.M.A.H.; Farid, M.A.F. Improvement of β-glucosidase production by co-culture of Aspergillus niger and A. oryzae under solid state fermentation through feeding process. Ann. Microbiol. 2014, 64, 627–637. [Google Scholar] [CrossRef]
  21. Liu, J.; Liu, H.; Zhao, Q.; Jiang, L.; Zhang, X.; Zhang, Y. Cloning, expression and characterization of three novel histidine acid phytases from Aspergillus niger, Aspergillus oryzae and Penicillium sp. J. Pure Appl. Microbiol. 2013, 7, 11–19. [Google Scholar]
  22. Santiesteban-Lopez, N.A.; Ceron-Carrillo, T.G.; Carmona-Silva, J.L.; Chavez-Medina, J. Cultivation of Aspergillus oryzae and Saccharomyces cerevisiae in whey for the production of single-celled protein intended for feeding cattle. Int. J. Food Sci. Biotechnol. 2020, 5, 12–21. [Google Scholar] [CrossRef]
  23. Song, L.; Chen, Y.; Du, Y.; Wang, X.; Guo, X.; Dong, J.; Xiao, D. Saccharomyces cerevisiae proteinase A excretion and wine making. World J. Microbiol. Biotechnol. 2017, 33, 210. [Google Scholar] [CrossRef] [PubMed]
  24. Wang, Y.; Li, X.; Chen, X.; Siewers, V. CRISPR/Cas9-mediated point mutations improve α-amylase secretion in Saccharomyces cerevisiae. FEMS Yeast Res. 2022, 22, foac033. [Google Scholar] [CrossRef]
  25. Lee, W.-H.; Jin, Y. Improved ethanol production by engineered Saccharomyces cerevisiae expressing a mutated cellobiose transporter during simultaneous saccharification and fermentation. J. Biotechnol. 2017, 245, 1–8. [Google Scholar] [CrossRef]
  26. Yu, L.; Xu, T.; Zhang, C.; Sun, J.; Bi, J. Technology optimization on preparation of peanut antioxidant peptides by Bacillus subtilis solid state fermentation method. Appl. Mech. Mater. 2016, 835, 103–108. [Google Scholar] [CrossRef]
  27. Yu, L.; Gong, Q.; Yang, Q.; Sun, J.; Bi, J.; Zhang, C. Technology optimization on microwave-assisted extraction water soluble dietary fiber from peanut hull and its antioxidant activity. Food Sci. Technol. Res. 2011, 27, 401–408. [Google Scholar] [CrossRef]
  28. Yu, L.; Yang, W.; Sun, J.; Zhang, C.; Bi, J.; Yang, Q. Preparation, characterisation and physicochemical properties of the phosphate modified peanut protein obtained from Arachin Conarachin L. Food Chem. 2015, 170, 169–179. [Google Scholar] [CrossRef]
  29. Dos Soares, F.S.; Signoretti, R.D.; de Oliveira, J.S.; da Silva, G.T.; de Oliverira Alves Rufino, M.; de Souza, C.G.; Pinheiro, J.K.; Neto, S.G. Nitrogen balance and microbial protein synthesis in dairy cows fed with peanut meal to replace soybean meal. Trop. Anim. Health Prod. 2022, 54, 335. [Google Scholar]
  30. Li, M.H.; Lucas, P.M. Evaluation of peanut meal as an alternative dietary protein source for channel catfish. N. Am. J. Aquac. 2017, 79, 95–99. [Google Scholar] [CrossRef]
  31. Da Silva, R.L.; Damasceno, F.M.; Rocha, M.K.H.R.; Sartori, M.M.P.; Barros, M.M.; Pezzato, L.E. Replacement of soybean meal by peanut meal in diets for juvenile Nile tilapia, Oreochromis niloticus. Lat. Am. J. Aquat. Res. 2017, 45, 1044–1053. [Google Scholar] [CrossRef]
  32. Zhang, L.; Fang, Q.; Huang, D.; Liu, Y.; Zeng, Y.; Xie, Y.; Luo, J. Anaerobic fermentation of peanut meal to produce even-chain volatile fatty acids using Saccharomyces cerevisiae inoculum. Environ. Technol. 2021, 42, 3820–3831. [Google Scholar] [CrossRef] [PubMed]
  33. Mao, X.; Lin, S.; Zhang, C.; Chen, X.; Lai, J.; Zhou, Y.; Zeng, Q. Research on improving nutritional value of peanut meal by solid-state fermentation with manifold strains. Food Res. Dev. 2015, 36, 91–94. [Google Scholar]
  34. Zhao, G.; Ding, L.; Pan, Z.; Kong, D.; Hadiatullah, H.; Fan, Z. Proteinase and glycoside hydrolase production is enhanced in solid-state fermentation by manipulating the carbon and nitrogen fluxes in Aspergillus oryzae. Food Chem. 2019, 271, 606–613. [Google Scholar] [CrossRef]
  35. Meini, M.-R.; Cabezudo, I.; Galetto, C.S.; Romanini, D. Production of grape pomace extracts with enhanced antioxidant and prebiotic activities through solid-state fermentation by Aspergillus niger and Aspergillus oryzae. Food Biosci. 2021, 42, 101168. [Google Scholar] [CrossRef]
  36. Zhang, Y.; Zhang, H.; Wang, L.; Guo, X.; Qi, X.; Qian, H. Influence of the degree of hydrolysis (DH) on antioxidant properties and radical-scavenging activities of peanut peptides prepared from fermented peanut meal. Eur. Food Res. Technol. 2011, 232, 941–950. [Google Scholar] [CrossRef]
  37. Zhang, Y.; Liu, J.; Lu, X.; Zhang, H.; Wang, L.; Guo, X.; Qi, X.; Qian, H. Isolation and identification of an antioxidant peptide prepared from fermented peanut meal using Bacillus subtilis fermentation. Int. J. Food Prop. 2014, 17, 1237–1253. [Google Scholar] [CrossRef]
  38. Wang, Y.; Sun, H.; Han, B.; Li, H.; Liu, X. Improvement of nutritional value, molecular weight patterns (soluble peptides), free amino acid patterns, total phenolics and antioxidant activity of fermented extrusion pretreatment rapeseed meal with Bacillus subtilis YY-1 and Saccharomyces cerevisiae YY-2. LWT—Food Sci. Technol. 2022, 160, 113280. [Google Scholar]
  39. Chi, C.; Cho, S.-J. Improvement of bioactivity of soybean meal by solid-state fermentation with Bacillus amyloliquefaciens versus Lactobacillus spp. and Saccharomyces cerevisiae. LWT—Food Sci. Technol. 2016, 68, 619–625. [Google Scholar] [CrossRef]
  40. Liu, N.; Wang, Y.; An, X.; Qi, J. Study on the enhancement of antioxidant properties of rice bran using mixed-bacteria solid-state fermentation. Fermentation 2022, 8, 212. [Google Scholar] [CrossRef]
  41. Zhang, D.; Tan, B.; Zhang, Y.; Ye, Y.; Gao, K. Improved nutritional and antioxidant properties of hulless barley following solid-state fermentation with Saccharomyces cerevisiae and Lactobacillus plantarum. J. Food Process. Preserv. 2021, 46, e16245. [Google Scholar] [CrossRef]
  42. Kiros, T.G.; Nadege, R.; Marden, J.P.; Kuhn, G.; Catunda, F. Yeast proteins extracted from Saccharomyces cerevisiae as alternative sources of protein in swine nutrition. J. Anim. Sci. 2021, 99, 212. [Google Scholar] [CrossRef]
  43. Olasky, G.C.; Nicolás, E.M.; Angelis, M.S.; María, H.C.; Silvia, R. Meat Substitute Development from Fungal Protein (Aspergillus oryzae). Foods 2022, 11, 2940. [Google Scholar]
  44. Chen, L.; Madl, R.L.; Vadlani, P.V. Nutritional enhancement of soy meal via Aspergillus oryzae solid-state fermentation. Cereal Chem. 2013, 90, 529–534. [Google Scholar] [CrossRef]
  45. Shi, C.; Zhang, Y.; Lu, Z.; Wang, Y. Solid-state fermentation of corn-soybean meal mixed feed with Bacillus subtilis and Enterococcus faecium for degrading antinutritional factors and enhancing nutritional value. J. Anim. Sci. Biotechnol. 2017, 8, 50. [Google Scholar] [CrossRef]
  46. Humer, E.; Schedle, K. Fermentation of food and feed: A technology for efficient utilization of macro and trace elements in monogastrics. J. Trace Elem. Med. Biol. 2016, 378, 69–77. [Google Scholar] [CrossRef] [PubMed]
  47. Kwak, W.S.; Kim, Y.I.; Choi, D.Y.; Lee, Y.H. Effect of feeding mixed microbial culture fortified with trace minerals on ruminal fermentation, nutrient digestibility, nitrogen and trace mineral balance in sheep. J. Anim. Sci. Technol. 2016, 58, 21. [Google Scholar] [CrossRef]
  48. Shah, A.A.; Liu, Z.; Qian, C.; Wu, J.; Sultana, N.; Zhong, X. Potential effect of the microbial fermented feed utilization on physicochemical traits, antioxidant enzyme and trace mineral analysis in rabbit meat. J. Anim. Physiol. Anim. Nutr. 2020, 104, 767–775. [Google Scholar] [CrossRef]
  49. Upadhaya, S.D.; Ryu, J.H.; Kang, K.I.; Cho, S.J.; Kim, I.H. Effect of fermentation of soybean meal with varying protein solubility on ileal digestibility of nutrients in growing pigs. Anim. Prod. Sci. 2016, 156, 2023. [Google Scholar] [CrossRef]
  50. Lu, F.; Alenyorege, E.A.; Ouyang, N.; Zhou, A.; Ma, H. Simulated natural and high temperature solid-state fermentation of soybean meal: A comparative study regarding microorganisms, functional properties and structural characteristics. LWT—Food Sci. Technol. 2022, 159, 113125. [Google Scholar] [CrossRef]
  51. Ma, J.; Zhu, X.; Shi, L.; Ni, C.; Hou, J.; Cheng, J. Enhancement of soluble protein, polypeptide production and functional properties of heat-denatured soybean meal by fermentation of Monascus purpureus 04093. CyTA—J. Food 2019, 17, 1014–1022. [Google Scholar] [CrossRef]
  52. Olukomaiya, O.O.; Fernando, W.C.; Mereddy, R.; Li, X.; Sultanbawa, Y. Solid-state fermentation of canola meal with Aspergillus sojae, Aspergillus ficuum and their co-cultures: Effects on physicochemical, microbiological and functional properties. LWT—Food Sci. Technol. 2020, 127, 109362. [Google Scholar] [CrossRef]
Figure 1. (a) Normal plot of residuals of soluble nitrogen concentration; (b) residuals vs. predicted of soluble nitrogen concentration; (c) predicted vs. actual of soluble nitrogen concentration.
Fermentation 09 00425 g001
Figure 2. (a) Normal plot of residuals of DPPH free radical scavenging rate; (b) residuals vs. predicted of DPPH free radical scavenging rate; (c) predicted vs. actual of DPPH free radical scavenging rate.
Fermentation 09 00425 g002
Figure 3. (a) Normal plot of residuals of hydroxyl free radical scavenging rate; (b) residuals vs. predicted of hydroxyl free radical scavenging rate; (c) predicted vs. actual of hydroxyl free radical scavenging rate.
Fermentation 09 00425 g003
Figure 4. (a) Normal plot of residuals of NSPs yield rate; (b) residuals vs. predicted of NSPs yield rate; (c) predicted vs. actual of NSPs yield rate.
Fermentation 09 00425 g004
Figure 5. Effects of various factors ((a) X1 and X2; (b) X1 and X3; (c) X1 and X4; (d) X2 and X3; (e) X2 and X4; (f) X3 and X4) on soluble nitrogen concentration.
Fermentation 09 00425 g005
Figure 6. Effects of various factors ((a) X1 and X2; (b) X1 and X3; (c) X1 and X4; (d) X2 and X3; (e) X2 and X4; (f) X3 and X4) on DPPH free radical scavenging rate.
Fermentation 09 00425 g006
Figure 7. Effects of various factors ((a) X1 and X2; (b) X1 and X3; (c) X1 and X4; (d) X2 and X3; (e) X2 and X4; (f) X3 and X4) on hydroxyl free radical scavenging rate.
Fermentation 09 00425 g007
Figure 8. Effects of various factors ((a) X1 and X2; (b) X1 and X3; (c) X1 and X4; (d) X2 and X3; (e) X2 and X4; (f) X3 and X4) on NSPs yield rate.
Fermentation 09 00425 g008aFermentation 09 00425 g008b
Figure 9. Solubility of FHDPM and HDPM. Different letters in each of curve mean significant difference at 0.05 level (p < 0.05, n = 3).
Fermentation 09 00425 g009
Figure 10. Emulsion activity index (EAI) (a) and emulsion stability index (ESI) (b) of FHDPM and HDPM. Different letters in each of curve mean significant difference at 0.05 level (p < 0.05, n = 3).
Fermentation 09 00425 g010
Figure 11. Foam capacity (FC) (a) and foam stability (FS) (b) of FHDPM and HDPM. Different letters in each of curve mean significant difference at 0.05 level (p < 0.05, n = 3).
Fermentation 09 00425 g011
Figure 12. Water holding capacity (WHC) (a) and oil absorption capacity (OAC) (b) of FHDPM and HDPM. Different letters in each of curve mean significant difference at 0.05 level (p < 0.05, n = 3).
Fermentation 09 00425 g012
Table 1. Design of RSM experimental factors and codes.
FactorsCodesCode Level
−101
Strain ratioX11.5 (3:2)1.0 (2:2)0.5 (1:2)
Inoculation amount (mL)X2234
Fermentation temperature (°C)X3303438
Fermentation time (h)X4243342
Table 2. RSM experiment design and results.
NumberX1X2X3X4Y1Y2Y3Y4
1−1−10015.4328.1192.973.34
21−10014.3728.9090.364.07
3−110014.5230.7890.984.14
4110010.3327.3697.992.71
500−1−19.5829.7095.383.93
6001−110.2825.9597.793.84
700−1115.9735.2493.784.07
8001135.8172.3991.162.82
9−100−112.3931.7899.403.70
10100−113.8532.6595.383.78
11−100141.6565.1091.773.56
12100119.1146.3192.573.03
130−1−1010.8928.0792.373.59
1401−109.6325.2890.563.18
150−11015.1829.2890.363.81
16011010.0932.4090.163.40
17−10−1012.9024.6192.573.44
1810−1010.6329.4591.573.30
19−101028.2558.1891.973.18
20101019.6541.5290.563.13
210−10−111.1525.5792.573.93
22010−112.4829.4998.984.10
230−10149.8764.6894.583.89
24010122.5444.3687.753.51
25000018.8936.9493.983.67
26000020.3536.4894.383.58
27000024.7942.1596.373.87
28000019.7739.2894.583.90
29000019.0735.0793.983.81
Note: X1: strain ratio; X2: inoculation amount (mL); X3: fermentation temperature (°C); X4: fermentation time (h); Y1: soluble nitrogen concentration (mg/mL); Y2: DPPH free radical scavenging rate (%); Y3: hydroxyl free radical scavenging rate (%); Y4: NSPs yield rate (%).
Table 3. Variance analysis of regression model.
SourceSum of SquaresdfMean SquareF ValueProb > F
Y1 Model2356.9214168.356.880.0005
Residual342.781424.48//
Lack of fit319.211031.925.420.0589
Pure error23.5745.89//
Cor total2699.728///
R2 = 0.8730; RAdj2 = 0.7461; CV(%) = 27.1; RPred2 = 0.3053; Adeq Precision = 9.919
Y2 Model4251.1714303.6610.67<0.0001
Residual398.431428.46//
Lack of fit367.551036.764.760.073
Pure error30.8847.72//
Cor total4649.628///
R2 = 0.9143; RAdj2 = 0.8286; CV(%) = 14.36; RPred2 = 0.5343; Adeq Precision = 14.041
Y3 Model199.011414.216.90.0004
Residual28.85142.06//
Lack of fit24.92102.492.530.1919
Pure error3.9340.98//
Cor total227.8628///
R2 = 0.8734; RAdj2 = 0.7467; CV(%) = 1.54; RPred2 = 0.3431; Adeq Precision = 10.914
Y4 Model3.59140.265.880.001
Residual0.61140.044//
Lack of fit0.54100.0542.890.1592
Pure error0.07440.019//
Cor total4.2128///
R2 = 0.8546; RAdj2 = 0.7092; CV(%) = 5.81; RPred2 = 0.2369; Adeq Precision = 8.976
Note: df: degrees of freedom; R2: square of the correlation coefficient; RAdj2: square of the adjustment coefficient; CV: coefficient of variation; RPred2: square of the prediction coefficient; Adeq Precision: signal-to-noise ratio.
Table 4. Significance test for regression coefficient.
Y1Y2Y3Y4
FactorF valueProb > FF valueProb > FF valueProb > FF valueProb > F
Intercept6.870.000510.67<0.00016.880.00045.880.001
X14.710.04773.070.10180.060.80973.50.0826
X24.740.04710.650.43210.420.52954.860.0447
X38.390.011722.350.00030.720.4113.340.0889
X445.16<0.000168.47<0.000131.41<0.000111.140.0049
X1X20.0990.75730.160.699411.220.004826.850.0001
X1X30.410.53294.060.06360.020.89080.0410.8418
X1X45.880.02953.390.08672.810.11562.160.164
X2X30.150.70460.310.58820.310.58490.00040.9849
X2X48.390.01175.160.039421.210.00041.80.2017
X3X43.740.073614.690.00183.050.10257.750.0146
X120.540.47580.030.86571.250.282211.050.005
X223.240.093310.140.00668.950.00970.0310.8627
X325.250.0380.870.36810.910.00528.050.0132
X423.770.072410.980.00513.120.09920.870.3668
Note: Factors found to have significant effects on the response values (p ≤ 0.05); have highly significant effects on the response values (p ≤ 0.01); have extremely significant effects on the response values (p ≤ 0.001); have no significant effect on the response values (p > 0.05); X1: strain ratio; X2: inoculation amount (mL); X3: fermentation temperature (°C); X4: fermentation time (h); Y1: soluble nitrogen concentration (mg/mL); Y2: DPPH free radical scavenging rate (%); Y3: hydroxyl free radical scavenging rate (%); Y4: NSP yield rate (%).
Table 5. Antioxidant activities.
Regression EquationR2IC50 (mg/mL)
DPPH free radical scavenging rateAPsy = −1.2102x2 + 20.987x + 4.16380.99702.56
NSPsy = −0.4579x2 + 13.977x − 1.72140.99824.31
FHDPMy = −1.2002x2 + 19.125x + 19.2360.99141.82
Hydroxyl free radical scavenging rateAPsy = −2.1839x2 + 32.572x − 24.5550.99242.82
NSPsy = −10.784x2 + 63.632x +13.7950.98740.64
FHDPMy = −0.4686x2 + 13.244x + 6.93260.99873.75
Superoxide anion free radical scavenging rateAPsy = −2.9775x2 + 24.782x + 31.270.99650.84
NSPsy = −0.7168x2 + 13.326x + 31.5080.99461.51
FHDPMy = −36.089x2 + 120.29x − 6.49930.97790.57
Lipid peroxidation inhibition rateAPsy = −0.7943x2 + 12.098x + 13.6540.99734.12
NSPsy = −1.4515x2 + 20.449x – 2.12510.99523.34
FHDPMy = −0.0067x2 + 4.2687x + 5.40670.997910.62
Iron reducing powerAPsy = −0.0036x2 + 0.1303x − 0.00950.99864.46
NSPsy = 0.0017x2 + 0.0413x − 0.06370.99599.74
FHDPMy = −0.0027x2 + 0.112x + 0.01280.99414.94
Molybdenum reducing powerAPsy = −0.0091x2 + 0.4308x + 0.0080.99901.17
NSPsy = 0.0459x2 + 0.1557x + 0.22120.99951.30
FHDPMy = −0.0048x2 + 0.1482x + 0.25850.98241.73
Iron ion chelating rateAPsy = −0.2258x2 + 2.0863x + 47.530.99851.39
NSPsy = −0.898x2 + 11.871x + 30.870.99231.88
FHDPMy = −0.3387x2 + 8.5743x + 13.6750.99045.38
Copper ion chelating rateAPsy = −0.4724x2 + 8.8103x + 27.5230.99863.05
NSPsy = −3.0012x2 + 29.943x + 20.970.99371.09
FHDPMy = −1.1271x2 + 21.003x − 3.00020.98543.01
Note: DPPH: 1,1-diphenyl-2-picrylhydrazyl; APs: antioxidant peptides; NSPs: nonstarch polysaccharides; FHDPM: fermentation products of heat-denatured peanut meal.
Table 6. Amino acids and trace minerals in HDPM and FHDPM.
HDPMFHDPM HDPMFHDPM
Aspartic acid (Asp) (%)5.906.50Tyrosine (Tyr) (%)1.641.96
Glutamic acid (Glu) (%)10.511.4Valine (Val) (%)1.962.30
Serine (Ser) (%)2.552.88Methionine (Met) (%)0.200.31
Glycine (Gly) (%)3.253.45Cysteine (Cys) (%)0.690.81
Histidine (His) (%)0.921.36Isoleucine (Ile) (%)1.561.79
Arginine (Arg) (%)5.776.00Leucine (Leu) (%)3.303.83
Threonine (Thr) (%)1.031.36Phenylalanine (Phe) (%)2.472.79
Alanine (Ala) (%)2.022.37Lysine (Lys) (%)1.791.87
Proline (Pro) (%)2.162.46Tryptophan (Trp) (%)0.240.26
Total amino acid (%)48.053.7Potassium (K) (mg/kg)12,839.28080.2
Calcium (Ca) (mg/kg)1497.41679.8Cuprum (Cu) (mg/kg)16.824.9
Zinc (Zn) (mg/kg)55.784.6Ferrum (Fe) (mg/kg)109.8142.5
Selenium (Se) (mg/kg)0.170.29Manganese (Mn) (mg/kg)75.380.9
Disclaimer/Publisher’s Note: The statements, opinions and data contained in all publications are solely those of the individual author(s) and contributor(s) and not of MDPI and/or the editor(s). MDPI and/or the editor(s) disclaim responsibility for any injury to people or property resulting from any ideas, methods, instructions or products referred to in the content.

