Article

A Mock Circulation Loop to Characterize In Vitro Hemodynamics in Human Systemic Arteries with Stenosis

1
Department of Mechanical and Energy Engineering, Indiana University-Purdue University, Indianapolis, IN 46202, USA
2
Department of Vascular Surgery, Indiana University School of Medicine, Indianapolis, IN 46202, USA
3
School of Mechanical Engineering, Purdue University, West Lafayette, IN 47907, USA
4
Vascular Diagnostic Center, Indiana University Health, Indianapolis, IN 46220, USA
5
Vascular Surgery, The Affiliated Hangzhou First People’s Hospital, Zhejiang University School of Medicine, Hangzhou 310006, China
6
Ultrasound, The Affiliated Hangzhou First People’s Hospital, Zhejiang University School of Medicine, Hangzhou 310006, China
*
Authors to whom correspondence should be addressed.
Fluids 2023, 8(7), 198; https://doi.org/10.3390/fluids8070198
Submission received: 18 May 2023 / Revised: 27 June 2023 / Accepted: 28 June 2023 / Published: 29 June 2023
(This article belongs to the Special Issue Image-Based Computational and Experimental Biomedical Flows)

Abstract

:
Vascular disease is the leading cause of morbidity and mortality and a major cause of disability for Americans, and arterial stenosis is its most common form in systemic arteries. Hemodynamic characterization in a stenosed arterial system plays a crucial role in the diagnosis of its lesion severity and the decision-making process for revascularization, but it is not readily available in the current clinical measurements. The newly emerged image-based computational hemodynamics (ICHD) technique provides great potential to characterize the hemodynamics with fine temporospatial resolutions in realistic human vessels, but medical data is rather limited for validation requirements. We present an image-based experimental hemodynamics (IEHD) technique through a mock circulation loop (MCL) to bridge this critical gap. The MCL mimics blood circulation in human stenosed systemic arterial systems that can be either 3D-printed silicone, artificial, or cadaver arteries and thus enables in vitro measurement of hemodynamics. In this work, we focus on the development and validation of the MCL for the in vitro measurement of blood pressure in stenosed silicone arteries anatomically extracted from medical imaging data. Five renal and six iliac patient cases are studied. The pressure data from IEHD were compared with those from ICHD and medical measurement. The good agreements demonstrate the reliability of IEHD. We also conducted two parametric studies to demonstrate the medical applicability of IEHD. One was the cardiovascular response to MCL parameters. We found that blood pressure has a linear correlation with stroke volume and heart rate. Another was the effect of arterial stenosis, characterized by the volumetric reduction (VR) of the arterial lumen, on the trans-stenotic pressure gradient (TSPG). We parametrically varied the stenosis degree and measured the corresponding TSPG. The TSPG-VR curve provides a critical VR that can be used to assess the true hemodynamic severity of the stenosis. Meanwhile, the TSPG at VR = 0 can predict the potential pressure improvement after revascularization. Unlike the majority of existing MCLs that are mainly used to test medical devices involving heart function, this MCL is unique in its specific focus on pressure measurement in stenosed human systemic arteries. Meanwhile, rigorous hemodynamic characterization through concurrent IEHD and ICHD will significantly enhance our current understanding of the pathophysiology of stenosis and contribute to advancements in the medical treatment of arterial stenosis.

1. Introduction

Vascular disease, including coronary, extracranial, and peripheral arterial beds, is the leading cause of morbidity and mortality and a major cause of disability for Americans. Arterial stenosis is one of the most common vascular diseases that can lead to life- and limb-threatening consequences, including myocardial ischemia, ischemic stroke, and limb amputation. It is a condition that involves blockage of blood flow mainly due to an atherosclerotic narrowing of the arterial lumen, which commonly occurs in systemic arteries. While stenosis can be observed by imaging modalities such as computed tomography angiogram (CTA), magnetic resonance imaging (MRI), and Doppler ultrasound sonography (DUS), direct and effective noninvasive means to evaluate the true hemodynamic severity of stenosis are lacking in current clinical practice. For coronary stenosis, fractional flow reserve (FFR) [1], defined as the ratio between the distal pressure p d and the proximal pressure p a to the stenosis; namely, p d / p a , is used to determine the hemodynamic severity of myocardial ischemia [2,3,4]. However, trans-stenotic pressure gradient (TSPG), defined as the difference between p a and p d , has been popularly used for assessing the hemodynamic severity of non-coronary stenoses. Evidence, including ours, has shown that TSPG is an indicator to determine the amount of blood flow blockage caused by renal [5,6,7], iliac and femoral [8,9,10], and carotid [11] stenoses and can help guide the proper decision-making of interventional treatment. Nevertheless, the clinical application of either FFR or TSPG is rather limited [12], as they rely on the invasive pressure measurement of the local pressure values, i.e., p d and p a , which may expose patients to surgical complications and medical costs.
Newly emerging image-based computational hemodynamics (ICHD) [13,14,15,16,17] has great potential to address this unmet medical need, as seen in a recent review [16] and the references therein. Based on medical imaging data, ICHD enables noninvasive characterization of hemodynamics, including velocity, pressure, and stress, in the diseased human arterial system with a fine spatiotemporal resolution, resulting in important hemodynamic indicators, such as FFR and TSPG, for arterial stenosis. For example, image-based FFR has been a well-established clinical application of ICHD by HeartFlow Inc. (Redwood City, CA, USA). Obtained from a purely anatomical, noninvasive dataset of coronary CTA images [18] by utilizing ICHD, the FFR determines the hemodynamic severity of the coronary stenosis and then guides the decision-making of the interventional treatment for it. We have recently developed a proprietary ICHD technique [19] for a new noninvasive and patient-specific hemodynamic index that can assess the hemodynamic severity of non-coronary arterial stenosis and applied it to renal stenosis [6,7]. In addition to the application of ICHD for arterial stenosis, many studies have demonstrated the feasibility and validity of ICHD for vascular diseases caused by aneurysms [20,21,22]. Despite its great potential for medical applications, ICHD needs significant resources for model development and sophisticated verification and validation (V&V) before it can be translated into medical applications. First, most ICHD studies assume incompressible and Newtonian flow in rigid arterial walls [7,17,19], whereas vascular circulation is much more complicated. The anatomical flow domain is arbitrarily curved with moving walls. Blood consists of plasma, blood cells, and platelets. When severe arterial stenosis exists, the blood flow may become turbulent. Each of them needs to be modeled in ICHD. In general, more model inclusion in ICHD means higher computational costs. Models for insignificant effects will indeed introduce inaccuracies. Thus, it is crucially important to determine which and how models should be introduced in ICHD through V&V. Second, since only a segment of the blood circulation system is involved in ICHD, boundary conditions are required at the inlet(s) and outlet(s) of the vessel segment to represent the remaining vascular network. The choices of the outflow boundary condition in ICHD vary among zero pressure or zero traction conditions, resistance or impedance conditions, reduced-order models, which can be an open or closed loop, and reduced-order one-dimensional wave propagation equations [23,24,25,26]. To capture the interaction between the local 3-dimensional (3D) vessel segment and the 1-dimensional (1D) global circulation, the ICHD must be coupled to a reduced-order lumped-parameter network model. Among them, the 3-element WindKessel model [27,28,29,30,31] (WK3) has been commonly used to construct such a network, in which a Windkessel circuit is adopted to model the distal vasculature with one capacitor, modeling vessel compliance, and two resistors, modeling proximal and distal flow resistances, respectively. Evidence has shown that the WK3 can reproduce physiological pressure waves [32,33,34] in large vessels. In the state-of-the-art ICHD, the required proximal resistance, compliance of the distal vasculature, and distal resistance in the WK3 model are empirical [6], as no medical data are available.
Image-based experimental hemodynamics (IEHD) can provide a suitable test platform to address the aforementioned two needs of ICHD. A mock circulation loop (MCL) can simulate the pathophysiological environment of blood flow and measure the velocity and pressure waveforms as an alternative resource to medical measurements for the V&V of ICHD. Since its introduction by Westerhof [35] in 1971 as a simple artificial arterial system for pumping hearts in experimental labs, numerous studies have highlighted the potential of mock loop systems to create finely controlled and maintained simulated physiological conditions. Replicating these conditions in animal models or clinical settings is challenging, making MCLs advantageous for the design and testing of total artificial hearts [36,37,38] or ventricular assist devices [39,40,41,42,43,44,45]. The reliable real-time control and feedback capabilities of MCLs have demonstrated their applicability in studying human cardiovascular circulations [46,47], early stages of congestive heart failure [48,49], pediatric cardiopulmonary diseases [50,51,52], surgical procedures [53], and drug tests [54]. By offering safe and effective methods, MCLs allow for the investigation and analysis of the complex hemodynamics of human cardiocirculatory systems. To explore and characterize hemodynamic abnormalities in diseased human arterial circulations, researchers have worked on developing MCLs integrated with 3D-printed patient-specific models of the pulmonary artery [55,56], aorta [57,58], and coronary artery [59,60]. These patient-specific models, created through 3D printing, provide anatomically accurate features for MCLs, enabling precise simulations of the physiological hemodynamics of complex systems. In this study, we present a new MCL specifically for the characterization of in vitro hemodynamics in realistic human systemic arteries with stenosis, focusing on the reliable measurement of TSPG. We validate the accuracy of our pressure measurements using available medical and ICHD data. Subsequently, we conduct parametric studies to investigate the factors that influence blood pressure in these stenosed renal and iliac arterial systems.
The remainder of this paper is organized as follows: Section 2 includes the materials, including the medical cases and the corresponding 3D-printed silicone arterial systems, and the establishment of the MCL together with its instrumentations. Our application studies and experimental results are presented in Section 3. Finally, Section 4 concludes the paper with a summary and discussion.

2. Materials and Methods

2.1. Medical Data

We studied five renal and six iliac medical cases as listed in Table 1. The cases were from IU Health Methodist Hospital in Indianapolis, IN, USA (Renal cases I–II and Iliac cases I–V) with IRB (Institutional Review Board) approvals, #1405073181 and #1812589521, respectively, and Hangzhou First People’s Hospital in Zhejiang, China (Renal cases III–V and iliac case VI) with a study approval (#116-01) by the Ethics Committee of the hospital. Each patient case contains diagnostic imaging data, including CTA DICOM (Digital Imaging and Communications in Medicine) slices and DUS M(motion)-mode velocity waveforms, together with blood pressure waveforms at specified locations invasively measured during digital subtraction angiography (DSA) for interventional treatments. The pressure waveforms are used to validate the corresponding computed ones [6,7,61] from our previous ICHD studies and the experimentally measured ones in this work.

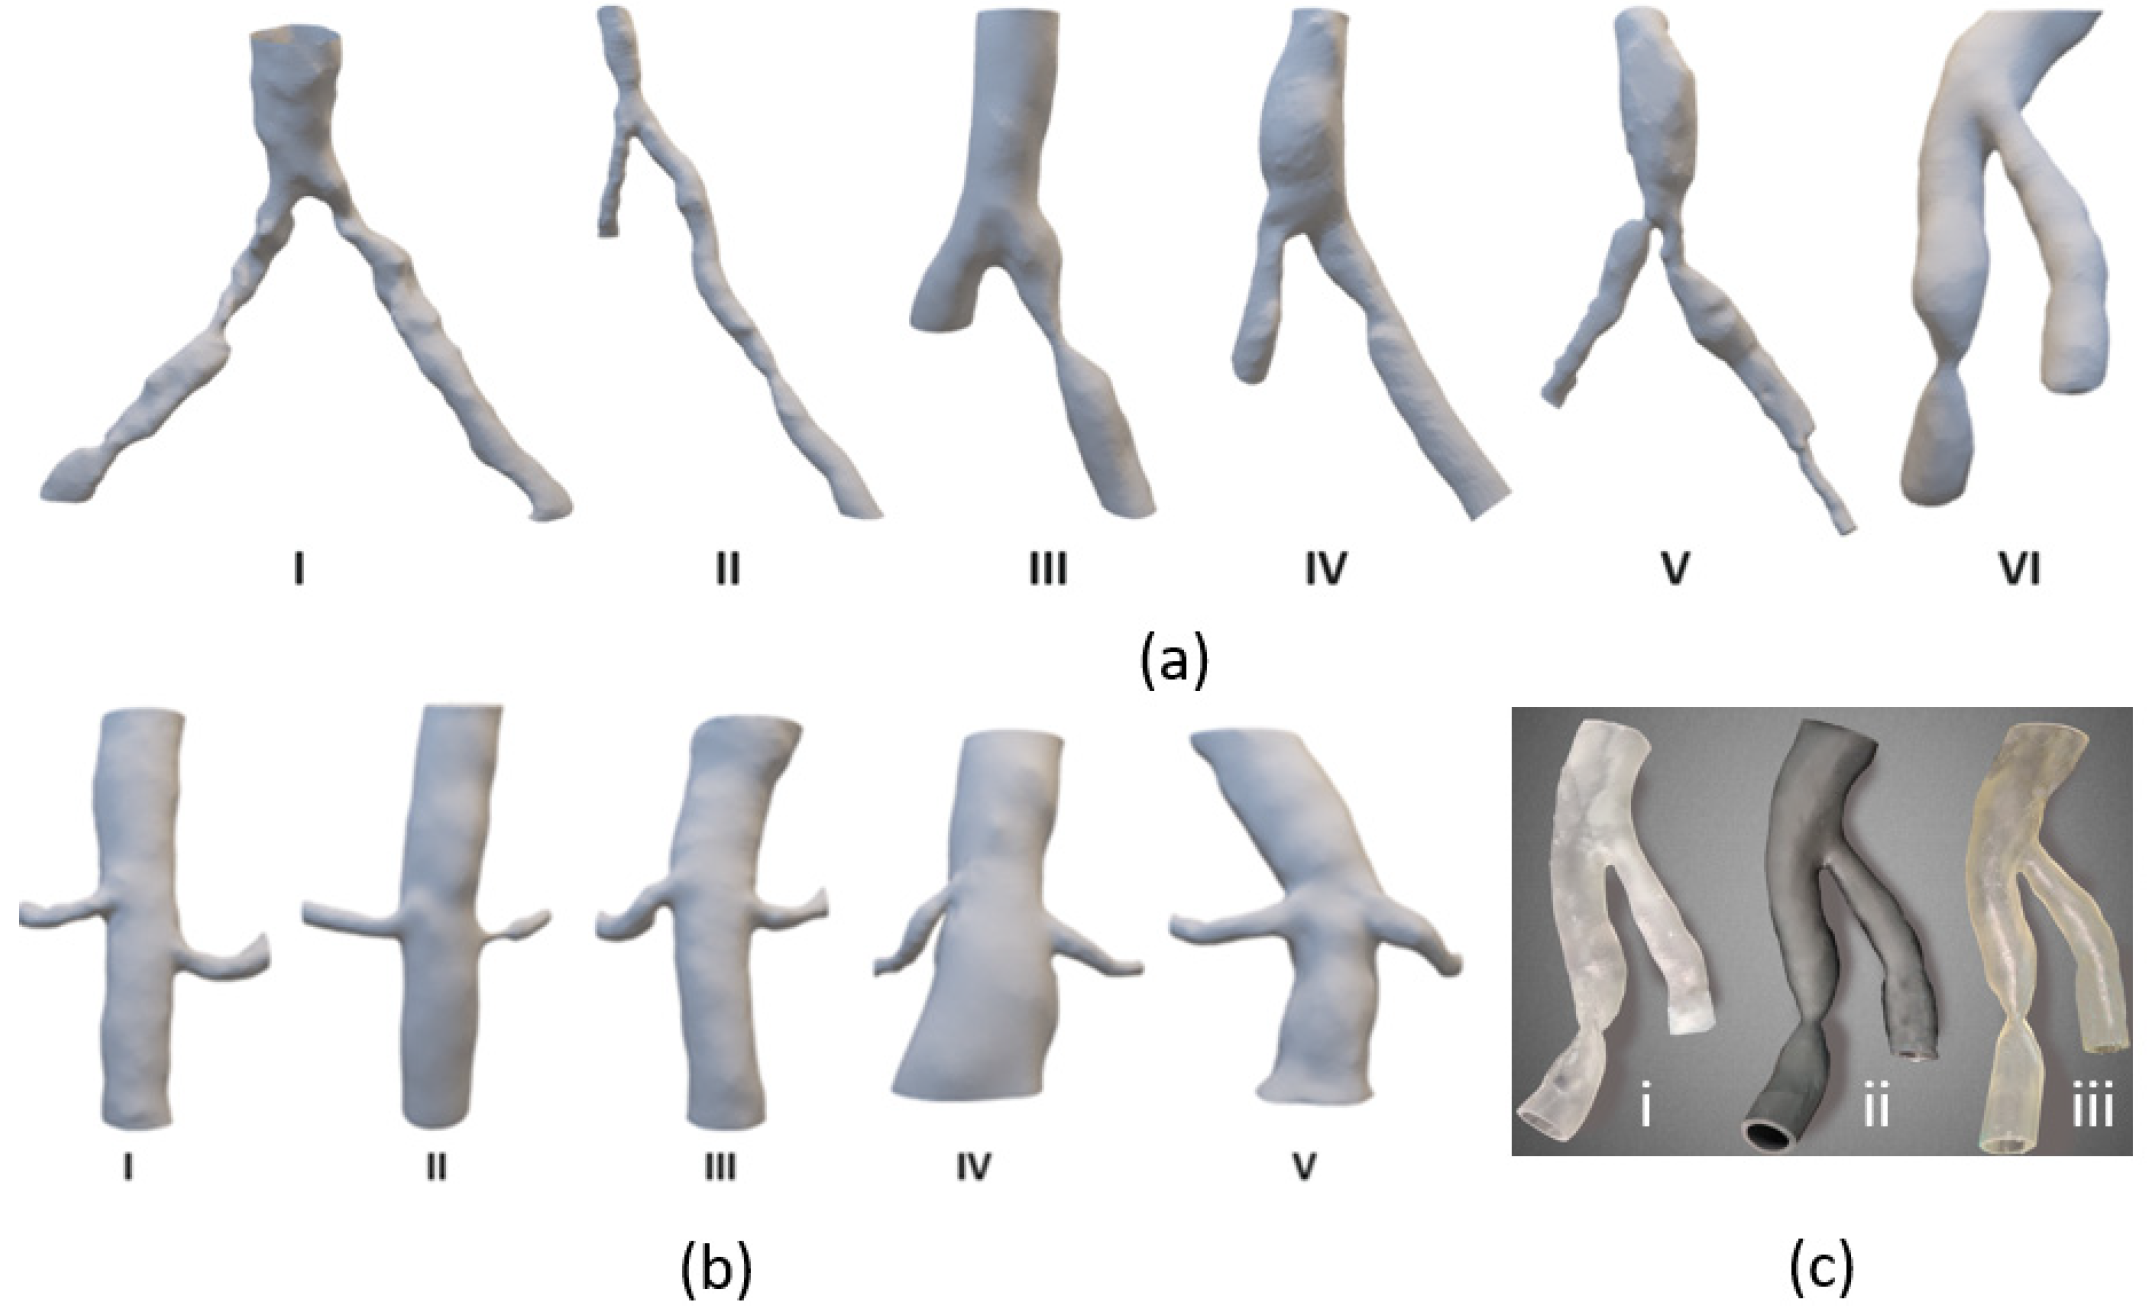
2.2. D-Printed Silicone Arterial Systems

We used MIMICS Materialise (Materialise NV, Leuven, Belgium) to anatomically extract the aortoiliac and aortorenal arterial systems, shown in Figure 1a,b, respectively. The CTA resolution is approximately 0.752 × 2.0 mm3 (IU Health Methodist Hospital cases) and 0.652 × 0.6 mm3 (Hangzhou First People’s Hospital cases). The CTA images are in sliced DICOM format. The 3D morphological geometry of each arterial system was output using Standard Tessellation Language (STL), a file format commonly used for 3D printing. We then use our in-house Form 3 Stereolithography 3D printer (Formlabs, Somerville, MA, USA) to fabricate each of the 3D silicone arterial systems. Three printing materials, Clear Resin, Flexible 80A Resin, and Elastic 50A Resin, as shown in Figure 1c, are available to print rigid, flexible, and elastic silicone arterial systems, respectively, for different study purposes. In this study, we use Elastic 50A Resin to print the silicone arterial systems, unless otherwise indicated.

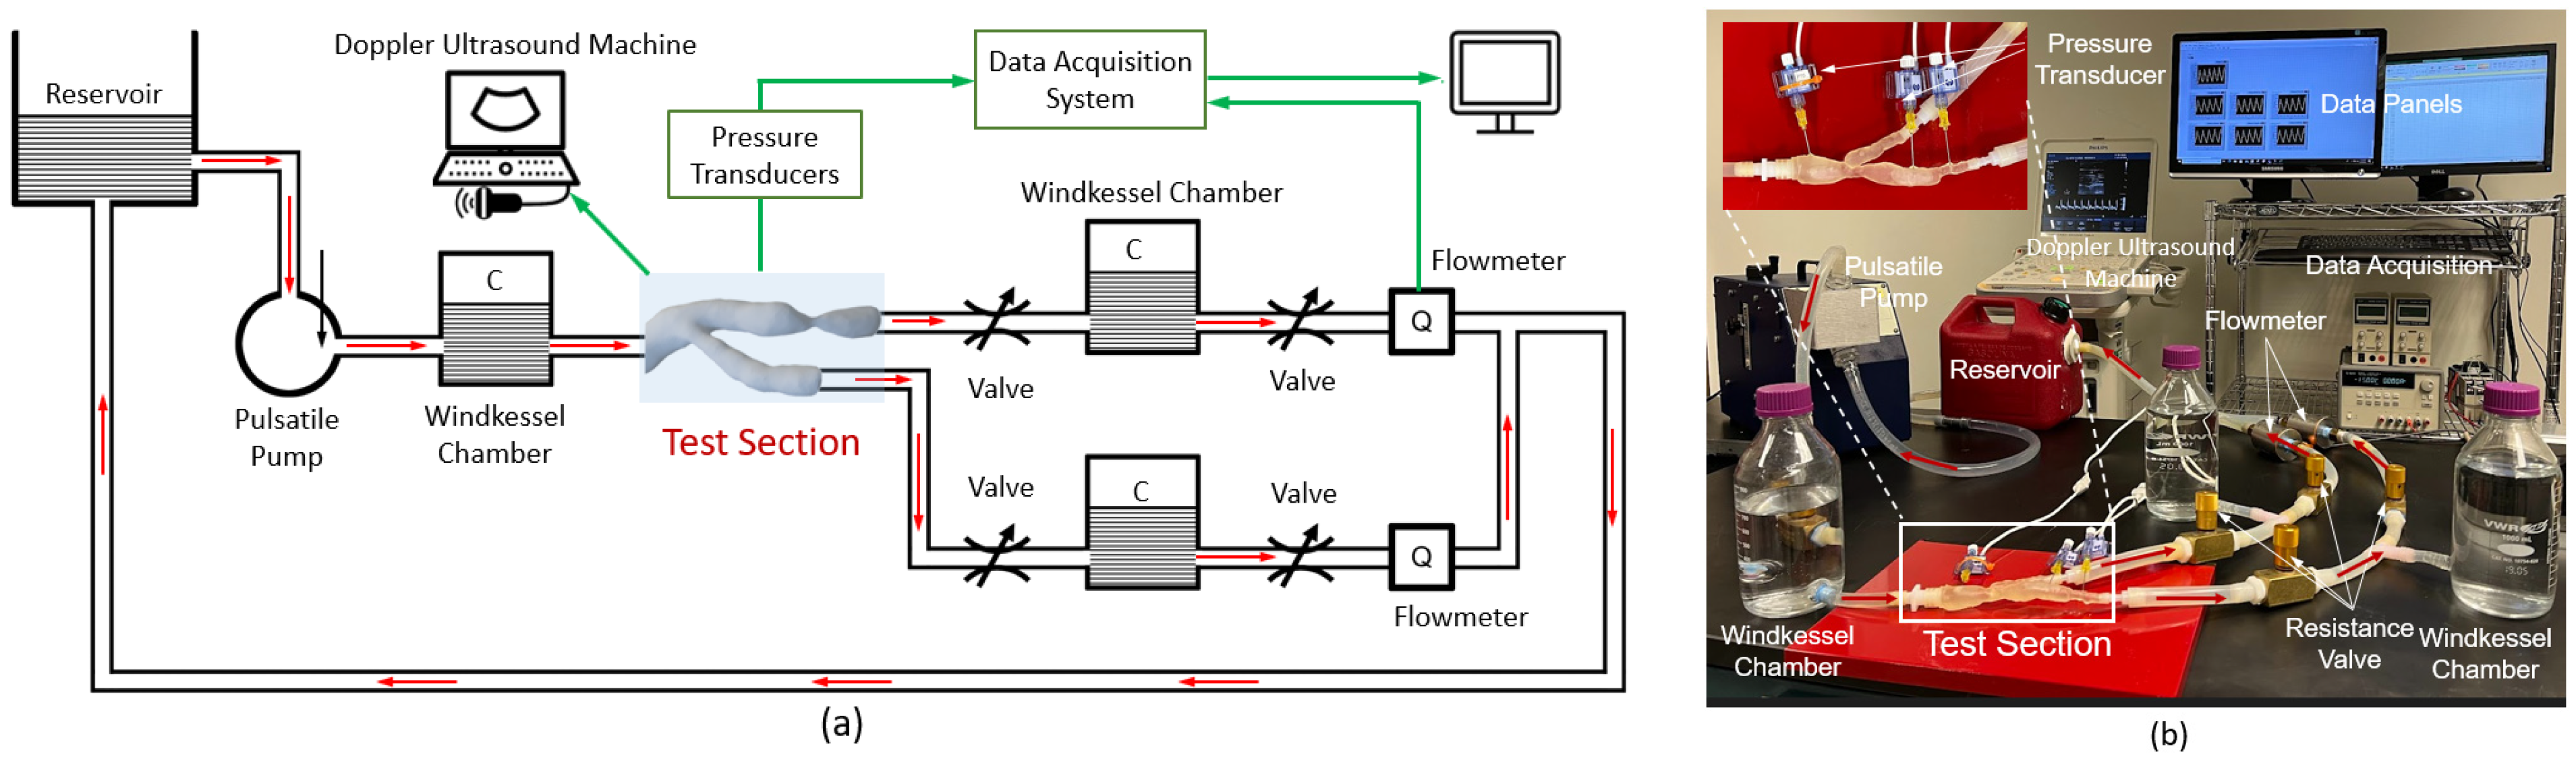
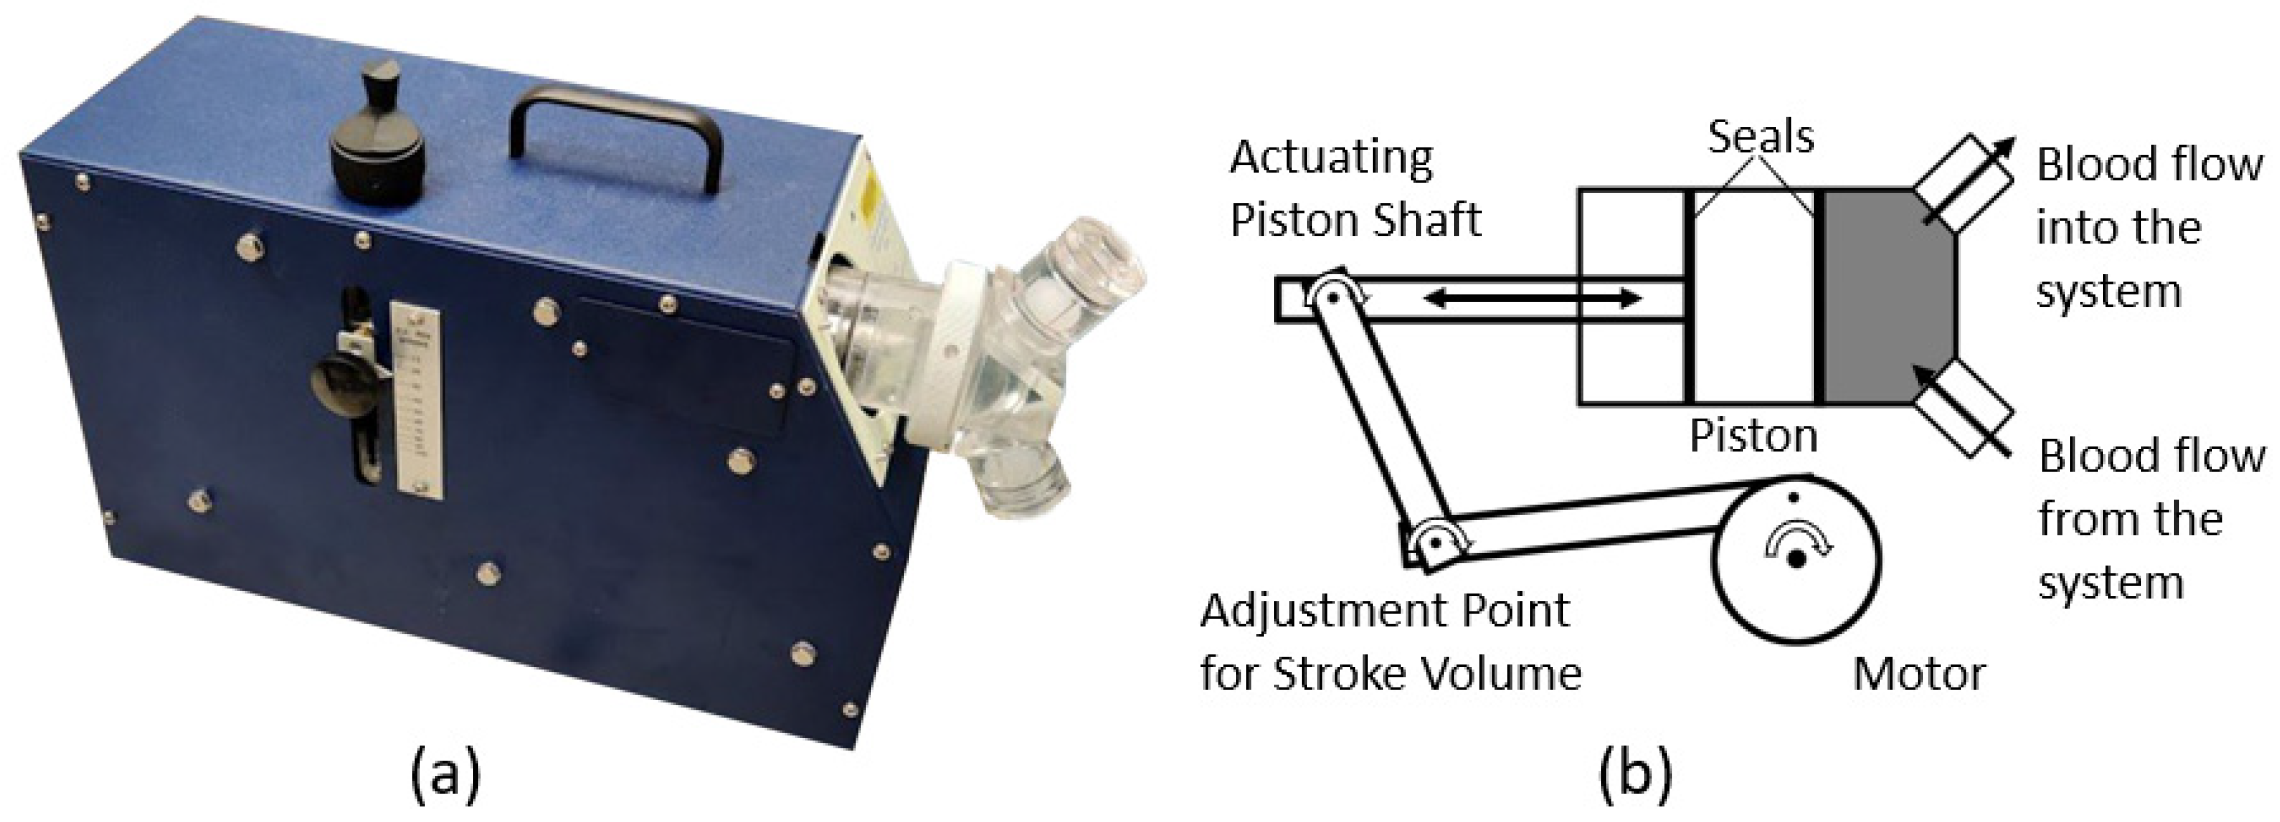
2.3. A Mock Circulation Loop for Human Systemic Arterial Systems

The MCL is designed to mimic the blood flow in stenosed human systemic arterial systems, enabling in vitro measurement of pressure waveforms proximal or distal to the stenosis. We intend not to include coronary stenosis, so no heart model is included. An arterial system can be either 3D-printed silicone, clinically used artificial arteries, or cadaver arteries. In this work, we focus on silicone arteries. The schematic diagram and the corresponding benchtop setup of the MCL are shown in Figure 2a,b, respectively, for a stenosed arterial system. The MCL consists of a reservoir (5.5-L), a pulsatile blood pump (Figure 3a, HARVARD APPARATUS, Model 1434), a test section holding the silicone arterial system, Windkessel chambers, and resistance valves. The pulsatile blood pump mimics the ventricular ejection from the heart in large animals by pumping the fluid via an oscillation mechanism, as schematized in Figure 3b. It is equipped with controls to continuously vary heart rate (HR), stroke volume (SV), and output phase ratio (systole to diastole in one stroke) in the ranges of 0–100 beats per min (bpm), 15–100 mm (mL), and 25/75 to 50/50, respectively. The pump is placed at the same elevation level as the test section to imitate the bedrest condition, avoiding pressure drops caused by gravity. The Windkessel effect [28] in the MCL is modeled by the Windkessel chambers (fractionally filled chambers with trapped-air compliance elements). The Windkessel chamber is a cylindrical glass bottle measuring 10 cm in diameter and 20 cm in height. It is equipped with 0.5-inch inlet and outlet ports. The water column height within the chamber is adjusted between 10 cm and 20 cm, allowing for varying compliance to accommodate different scenarios. It imitates the compliance of large vessels. One Windkessle chamber is mounted upstream of the inlet of the test section, mimicking upper-body systemic compliance. At each of the arterial outlets, one Windkessel chamber and two resistance valves are adopted to model the vessel compliance and the proximal and distal flow resistances, respectively. This setting is consistent with the WK3 model used in our ICHD [6]. All the components are connected by flexible silicone tubing (with an inner diameter of 0.5 inches).

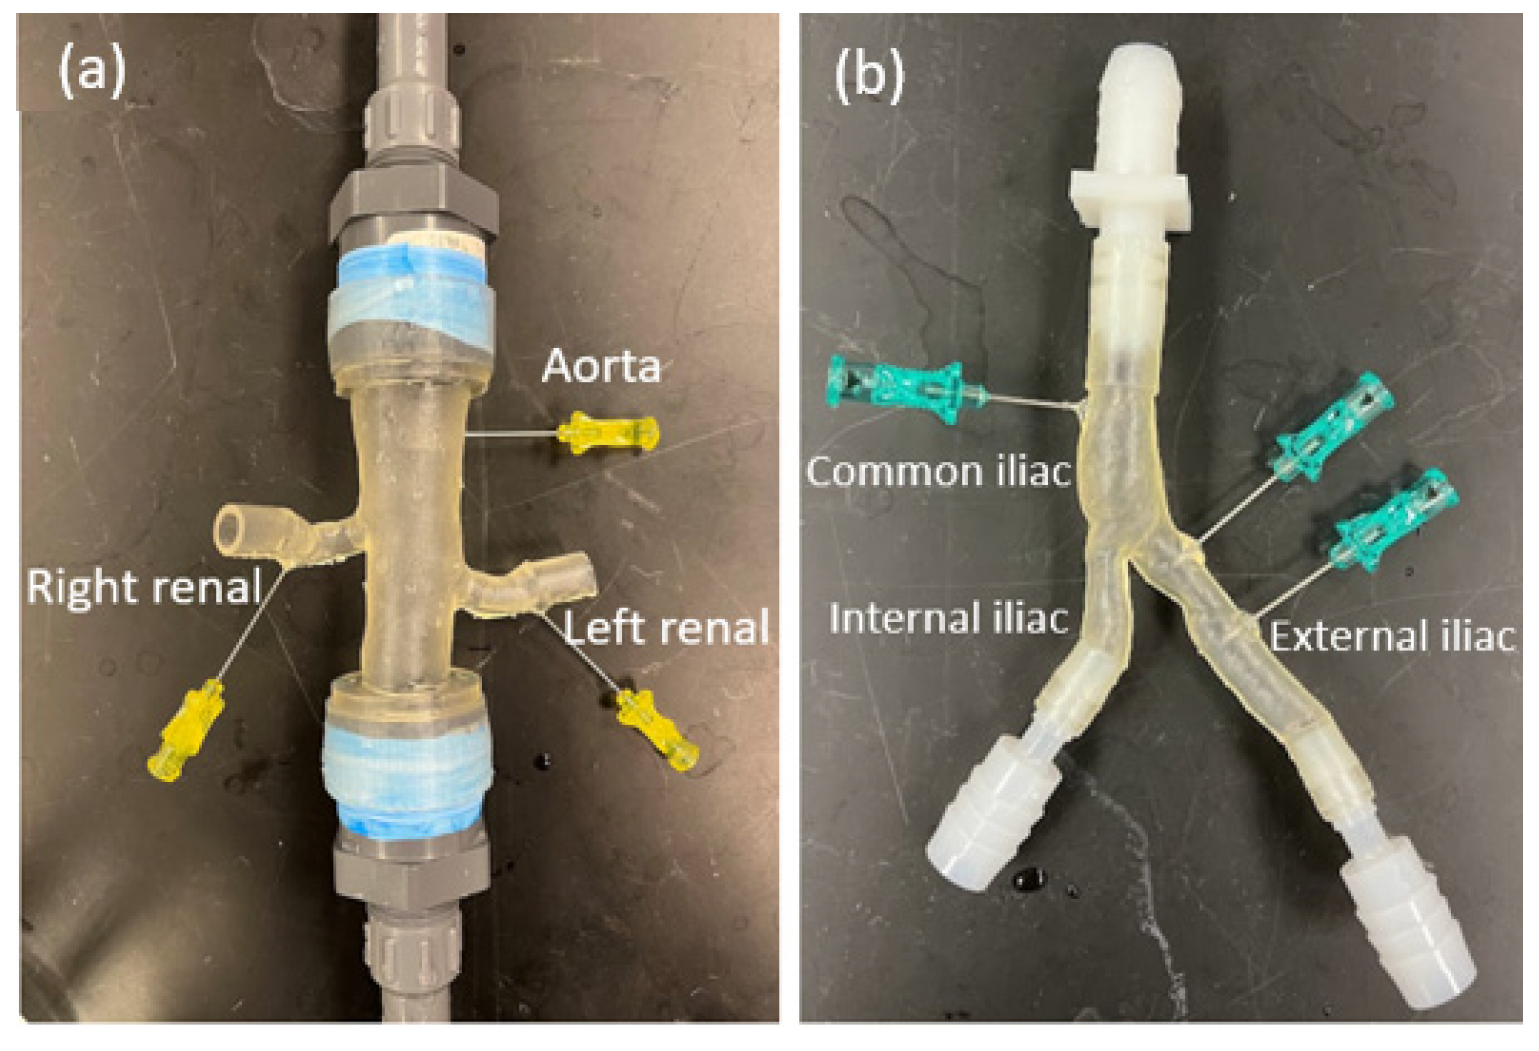
2.4. Instrumentations

The measuring instruments of the MCL include a Doppler ultrasound machine, a DAQ system, pressure transducers, and flowmeters, as shown in Figure 2. Each medical-grade pressure transducer (Deltran®, model 6069) is connected to the flow at a measuring location in a silicone aortorenal (Figure 4a) and aortoiliac (Figure 4b) arterial systems through a 21 g needle (NAD21T21WP, Qosina, Ronkonkoma, NY, USA). A voltage change detected by the deformable membrane in the pressure transducer reflects the pressure pulsation. The pressure waveform is read through a data acquisition (DAQ) system equipped with amplification by a Wheatstone bridge module (DV-10, Honeywell, Columbus, OH, USA) and digitization by an analog-to-digital converter (NI-9201, National Instruments, Austin, TX, USA). This MCL can acquire up to 8 pressure signals simultaneously. Each pressure transducer is individually calibrated using a hydrostatic water column. A magnetic inductive flowmeter (SM6004, IFM Efector Inc., Malvern, PA, USA) acquires a flowrate waveform. The range of the output current signal is from 4 to 20 × 103 amps(mA). The readings of the flowmeters are collected by another analog-to-digital converter (NI-9203, National Instruments) in the DAQ. The DAQ system is connected to a desktop computer (3.6 GHz CPU, RAM 8.0 GB) through an in-house program based on Labview software. The digital signals are collected at a sampling rate of 1000 Hz. The portable ultrasound machine (CX50 w/C5-1 PureWave curved transducer and L12-3 broadband linear transducer, Philips Electronics) can be used to measure the velocity waveforms of the blood flow.

3. Application Studies and Experimental Results

We study five aortorenal and six aortoiliac arterial systems, listed in Table 1, using the MCL. The corresponding 3D aortoiliac and aortorenal silicone arterial systems anatomically extracted from patients’ CTA images are shown in Figure 1a,b, respectively. Each of them has invasively measured and noninvasively computed pressure waveforms at specified locations. The numerical simulations were performed using our in-house ICHD solver. In the past 10 years or so, this solver has been continuously developed and refined [17,62,63,64,65,66]. Recently, it has been applied to quantify the TSPG of renal artery stenosis [6,7] and iliac artery stenosis [67]. The corresponding experimental pressure waveform was averaged over three cardiac cycles. First, we compare the pressure waveforms among the noninvasive in vitro measurements and computations and the invasive measurements to demonstrate the reliability of IEHD by reproducing the ICHD-computed pressure waveforms. The methodology of ICHD and related physical variables and boundary conditions are referred to in the references [6,17,67]. Then, we conduct two application studies to demonstrate the applicability of IEHD for medical applications. In what follows, we use the representative iliac case (Figure 1a(VI)) and renal case (Figure 1b(IV)) with HR = 78 bpm and SV = 15 mL to present the results unless otherwise indicated. We first test the effect of the fluid on the pressure measurement in the iliac case using water (viscosity of 1 cP) and glycerol aqueous solution (45 vol. % glycerol with a viscosity of 3.5 cP). As shown in Figure 5, the measured pressure waveforms do not show a noticeable difference when choosing glycerol aqueous solution or water as the working fluid (blood surrogate). Thereafter, we use water as the running fluid in this study.

3.1. Reliability of In Vitro Pressure Measurement Using MCL

We first evaluate the pressure measurement using a representative iliac case, Figure 1a(VI). The arterial system includes the right common iliac artery (RCIA), the right external iliac artery (REIA), and the right internal iliac artery (RIIA), as seen in Figure 6a. The medical pressure measurement data are available at the three locations. We compare the systolic blood pressure (SBP), diastolic blood pressure (DBP), and mean arterial pressure (MAP) that are calculated from S B P + 2 D B P / 3 ), in millimeters of mercury (mmHg), among the medical measurement (M), computation (C), and experimental measurement (E) in Figure 6b.
The relative errors of experimental measurement and computation on the medical data vary from 0 to 6.6% with a mean of 2.21% for ICHD and from 0 to 1.64% with a mean of 0.16% for IEHD. The pressure waveform comparisons among medical measurement (solid line), numerical computation (dotted line), and experimental measurement (dashed line) in RCIA and REIA are shown in Figure 6c,d, respectively. The experimental measurements agree well with the medical and computational data. Correlation scatter plots using the 6 iliac cases with 12 measurement samples and the 5 renal cases with 13 measurement samples are shown in Figure 7 for (a) iliac SBP, (b) iliac DBP, (c) renal SBP, and (d) renal DBP. In each plot, r E , M is the Pearson correlation coefficient between experimental (E) and medical (M) measurements is shown, and the line is diagonal, representing the equal pressure measurement between E and M. r E , M is calculated from the ratio of the covariance of E and M vs. the product of the standard deviation of E and the standard deviation of M. The r E , M s for iliac SBP, iliac DBP, renal SBP, and renal DBP are 0.99 with p < 0.05, 0.96 with p < 0.05, 0.96 with p < 0.05, and 0.93 with p < 0.05. These results indicate good correlations between E and M measurements of blood pressure. Overall, the experimental pressure measurement through the MCL is reliable.

3.2. Parametric Studies and Experimental Results

In this section, we perform two parametric studies and present the corresponding results.

3.2.1. Cardiovascular Responses to MCL Parameters

Cardiac output, defined as the product of HR and SV, can be adjusted by the pulsatile heart pump in the MCL. The SV, in milliliters (mL), is the volume of blood pumped out of the pulsatile pump per cardiac cycle, and the HR, in beats per minute (bpm), is the number of heartbeats per minute. The MAP, in mmHg, is an important pathophysiological indicator of cardiovascular diseases. We use a renal case, i.e., Figure 1b(IV), to study how SV and HR affect the MAP measurement when keeping the compliance and resistances the same. Figure 8 shows the effects of HR (triangles) and SV (squares) on the MAP in the aortic artery of the aortorenal arterial system. The error bars for MAP in Figure 8 exhibit a typical range of 0.5 to 0.8 mmHg, which is too small to be visually distinguished when compared to the size of the data symbols. Consequently, they were not included in the plot. We keep constant SV (55 mL) when varying HR and constant HR (77 bpm) when varying SV. The MAP shows strong linear correlations to HR and SV, with R2 of 0.97 and 0.99, respectively. The general understanding of the result is as follows: When either HR or SV increases, the cardiac output into the MCL increases, leading to an increment in blood pressure [68,69]. Systolic pressure and diastolic pressure would both increase when either SV [69] or HR [70,71,72] increased. Therefore, MAP increases.

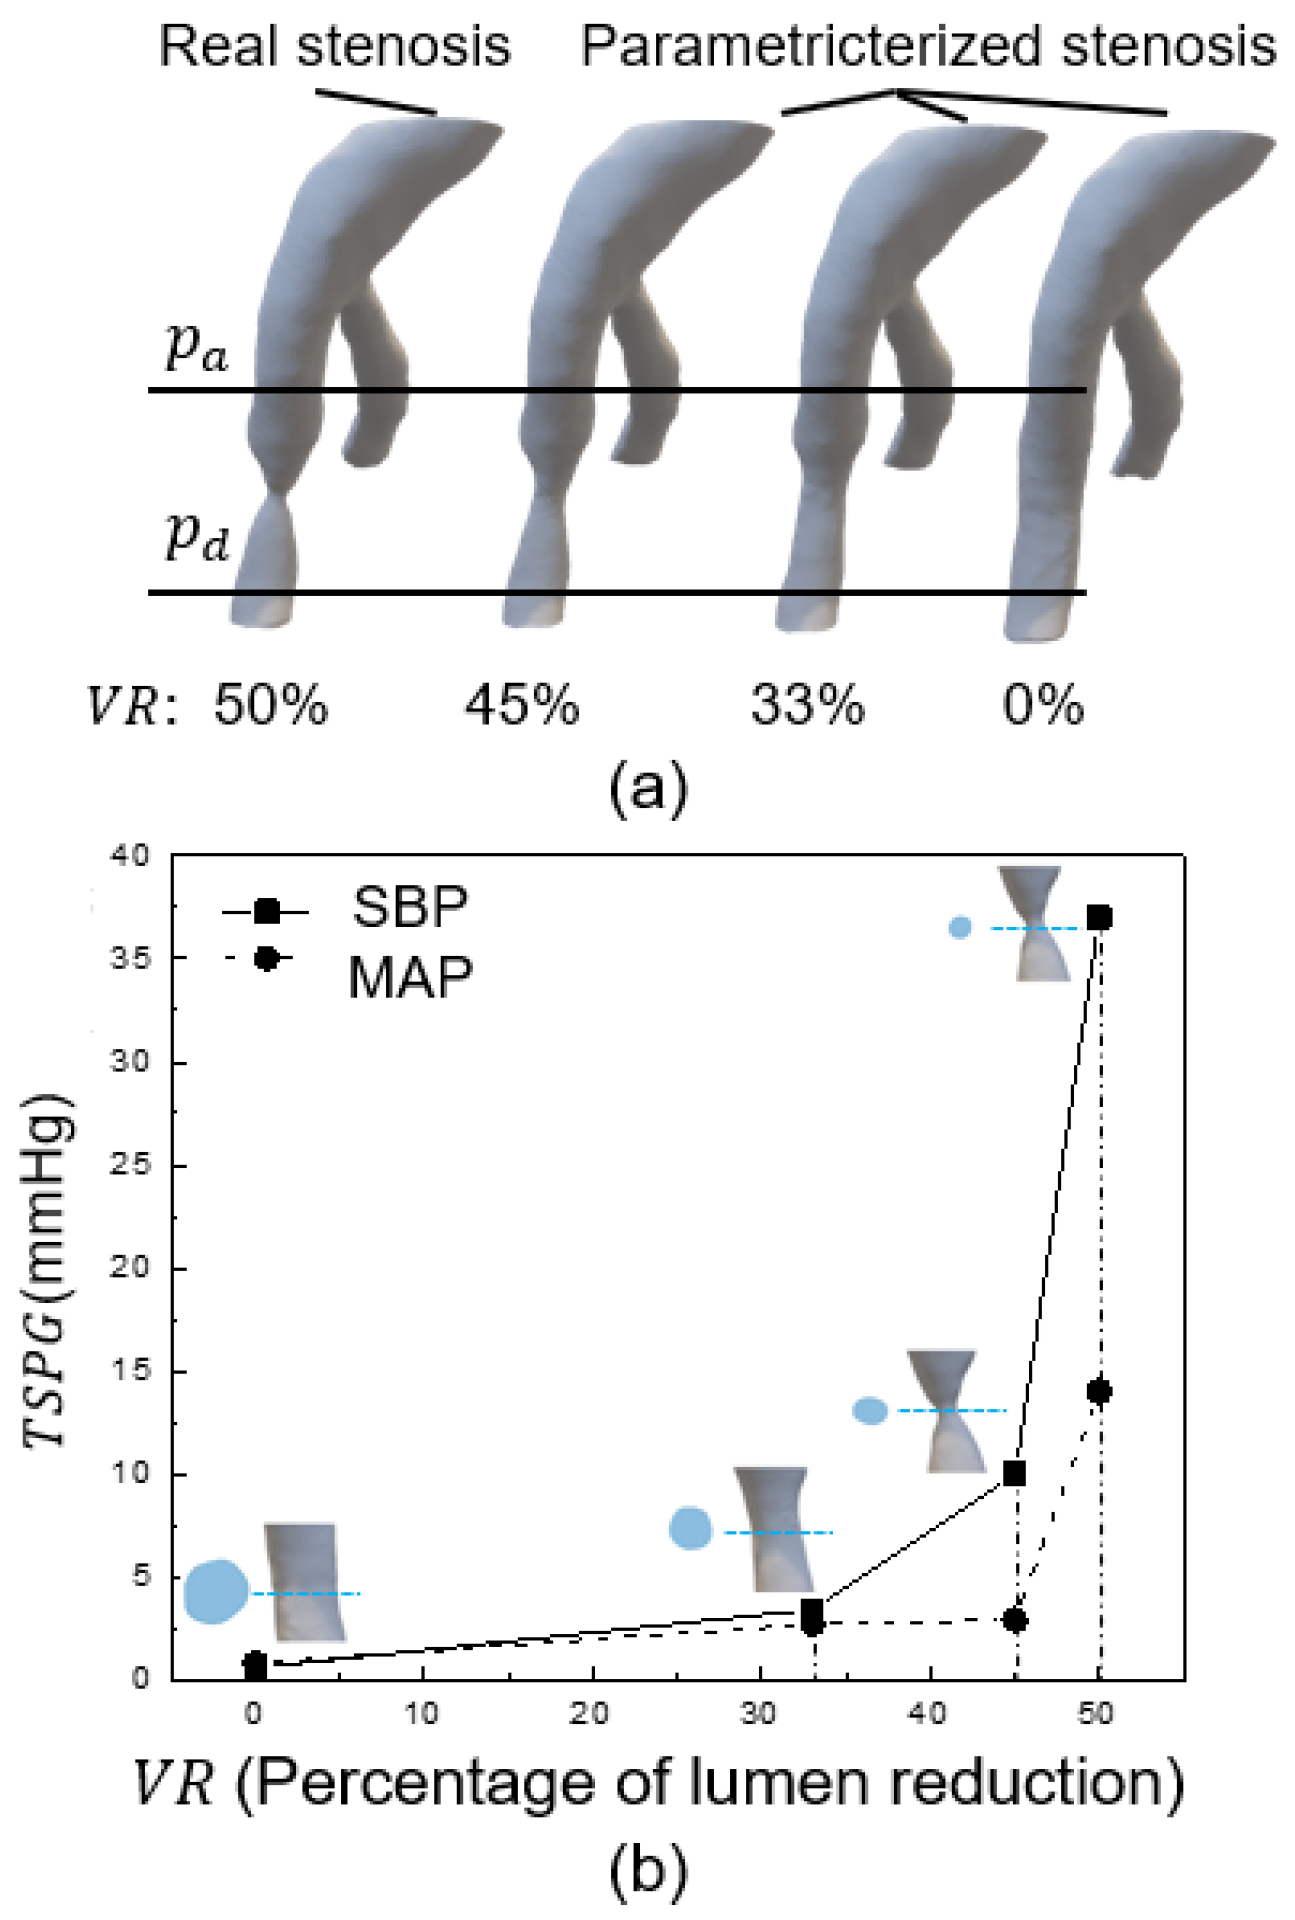
3.2.2. Effects of Stenosis Degree on TSPG

As indicated in Section 1, TSPG has been popularly used for assessing the hemodynamic severity of non-coronary arterial stenosis. We have recently developed a noninvasive functional assessment technique via ICHD [6,7,19] to assess the true hemodynamic severity, mild or severe, of arterial stenosis, together with a recommendation of yes (if severe) or no (if mild) for interventional treatment. In cases of severe stenosis, we can predict the potential outcomes of revascularization. Such a new non-invasive hemodynamic assessment will especially benefit the patient group with moderate arterial stenosis, avoiding under- and over-interventional treatment to promote public health. In ICHD, we have found [7] that the volume reduction (VR) of the arterial lumen is closer to TSPG than the diameter reduction of the cross-section. To demonstrate the applicability of the MCL for translational medical research, we studied how the degree of stenosis affects TSPG. As shown in Figure 9a, we parameterize the degree of stenosis using a real iliac stenosis case (Figure 1a(VI)) from the current (real) 50% of VR to 45%, 33%, and 0%. It is noted that 0% of VR corresponds to the removal of stenosis through a stenting treatment. We cropped a stenosed segment between the two pressure measurement locations for p a and p d to the stenosis. The VR is defined as the volume ratio of the reduced lumen volume due to a stenosis vs. the normal lumen volume without a stenosis. We experimentally measured p a and p d for each of the four stenosis cases, from which the T S P G ( = p a p d ) is calculated. We plotted the relation between the TSPG of SBP (squares) and MAP (dots) and VR in Figure 9b. It is seen that TSPG increases when the stenosis progresses. The TSPG~VR curve is flat when VR is relatively small (<45%) but steep when VR is relatively high ( 45 % ). On the flat side, increasing VR from 0% to 45% results in TSPG increases of 9 mmHg and 2 mmHg for SBP and MAP, respectively. On the steep side, increasing VR from 45% to 50% results in TSPG increases from 10 to 37 mmHg for SBP and 3 to 14 mmHg for MAP. From the slope of the TSPG~VR curve, one can identify a threshold of VR, denoted as VRms, which separates mild (VR < VRms) and severe (VR > VRms) stenosis conditions. For the case studied, VRms = 45%. On the mild side (VR < VRms), a one percent increase in VR causes a 0.2 mmHg and 0.047 mmHg increase of TSPG for SBP and MAP, respectively. Whereas on the severe side (VR > VRms), a one percent increase in VR causes 5.4 mmHg and 2.2 mmHg increases in TSPG for SBP and MAP, respectively. Using VRms (=45%), one can assess that the existing stenosis of the case being studied, VR = 50 % , is severe. The recommendation for stenting therapy is then made. Our recommendation based on the noninvasive assessment agrees with the clinical treatment for this case. In our recent study of ICHD, we applied the same technique to assess renal stenoses and achieved good agreement with clinical treatments [7,19]. Meanwhile, TSPG = 1   mmHg for both SBP and MAP at VR = 0 means that if the stenosis is interventionally stented, the TSPG will be back to a normal condition, implying that stenting therapy will benefit the patient. Similarly to Figure 8, the error bars for TSPG in Figure 9 span the ranges of 0.12 to 0.21 mmHg for MAP and 0.33 to 0.38 mmHg for SBP, respectively. Their small magnitudes make them visually indistinguishable when compared to the size of the data symbols. Therefore, we have also omitted them from the plot.

4. Summary and Discussion

We have developed and validated a new MCL that mimics the blood circulation in stenosed human systemic arterial systems and enables in vitro measurement of velocity and pressure waveforms in 3D-printed silicone arterial systems anatomically extracted from patient CTA imaging data. The MCL mainly consists of a human blood pump, a test section, a reservoir, Windkessel chambers, and resistance valves. Its measurement instruments include a DAQ system, a Doppler ultrasound machine, pressure transducers, and flowmeters. In this work, we focus on the in vitro measurement of blood pressure in the aortoiliac and aortorenal arterial systems. The objectives include reliably reproducing the computed blood pressures from ICHD using the same arterial system and the same flow conditions and revealing the pathophysiological properties that are essential to the ICHD modeling but are not readily available from current standard clinical measurements. Through this, we systematically studied five renal and six iliac cases to demonstrate the reliability of IEHD measurement and the applicability of IEHD for medical applications. The comparisons of the pressure data among the IEHD measurement, ICHD computation, and medical measurement indicate that both IEHD and ICHD are reliable for the noninvasive quantification of blood pressure in diseased human arteries. The IEHD-measured pressure waveforms agree well with those invasively measured and numerically simulated. A statistical analysis using all the iliac cases with 12 measurement samples and the renal cases with 13 measurement samples resulted in good correlations of SBP and DBP between experimental and medical measurements. The experimental measurement of SBP is more accurate than that of DBP. The reason might be that the signals the pressure transducers capture are stronger in systole than in diastole. We have also conducted two parametric studies using one renal and one iliac case. One is the cardiovascular response to MCL parameters. We found that the MAP in the aorta of an aortorenal arterial system has strong linear correlations with SV and HR, which are well understood. Another is the effect of VR of the arterial lumen on the TSPG of stenosis. Parametric variation of VR from real iliac stenosis and corresponding pressure measurements proximal and distal to the stenosis resulted in a TSPG~VR curve, which reveals a threshold of VR to assess the hemodynamic severity of the iliac stenosis. As the iliac stenosis was assessed as severe, we recommended interventional treatment for the stenosis, which agreed with the clinical treatment. Meanwhile, the TSPG at VR = 0 can predict the baseline pressure improvement after a potential revascularization, e.g., stenting, of the stenosis.
In addition to the in vitro pressure measurements, the MCL is being continuously developed for more research capabilities to support ICHD. We are interested in addressing the following open questions in the near future. First, how necessary is it to model the interaction between pulsatile blood flow and vessel deformation? Real arteries are deformable, but atherosclerosis (a common vascular disease in seniors) can significantly affect the elasticity of vessel walls during the cardiac cycle. Many ICHD computations use no-slip boundary conditions on arterial walls to avoid the complexity of modeling fluid-structure interaction and its demanding computation costs. IEHD can easily measure hemodynamics in deformable silicone arteries, but the deformation is affected by the 3D printing materials. The level of elasticity of a diseased artery segment is hard to determine due to a lack of available medical data. We plan to use three silicone vascular replicas (rigid, flexible, and elastic), medical artificial arteries, and cadaver arteries to study how the wall elasticity will affect the flow and pressure measurements. This study would be an important first-hand resource to guide the appropriate modeling of fluid-structure interactions in ICHD. Second, how can the patient-specific coefficients of vessel compliance and proximal and distal flow resistances in WK3 be determined? In current ICHD, these three coefficients are empirical, which significantly weakens the medical applications of ICHD. We are doing a systematic study for patient-specific vessel compliance and proximal and distal flow resistances, integrating engineering modeling in IEHD and ICHD by utilizing the available medical data. The study outcomes would advance the Windkessel model in ICHD for patient-specific applications.
The long-term goal of this research is twofold: (1) to establish a dependable resource that aids in the modeling of ICHD and validates the computational outcomes; and (2) to enable the comprehensive hemodynamic characterization of pathophysiological quantities, such as the coefficients in the WK3 model, for realistic blood flows in diseased human vessels. By leveraging the capabilities of the MCL, we can develop enhanced diagnostic tools, therapeutic strategies, and preventive measures using our powerful ICHD technique. These advancements play a critical role in improving patient care, alleviating the burden of arterial stenosis, and ultimately enhancing cardiovascular health outcomes.

Author Contributions

Conceptualization, H.Y., J.C., A.P.S. and W.H.; methodology, H.Y., J.C., W.H., J.T. and A.P.S.; formal analysis, W.H. and J.T.; investigation, H.Y., J.C., A.P.S., W.H. and J.T.; data curation, W.H. and J.T.; resources: A.P.S., D.M.R., X.F., J.L. and C.X.; writing—original draft preparation, H.Y. and W.H.; writing—review and editing, H.Y., J.C., A.P.S. and W.H.; visualization, W.H. and J.T.; supervision, H.Y., J.C. and A.P.S.; project administration, H.Y.; funding acquisition, H.Y. and A.P.S. All authors have read and agreed to the published version of the manuscript.

Funding

This research was partially supported by NSF grant CBET 1803845. This work used the Extreme Science and Engineering Discovery Environment (XSEDE), which is supported by the National Science Foundation Grant No. ACI-1548562. The first and corresponding author Yu would like to also acknowledge the IUPUI MEE Graduate Fellowship.

Data Availability Statement

The data presented in this study are available upon request from the corresponding authors. The data are not publicly available.

Conflicts of Interest

The data presented in this study are available on request from the corresponding author. The data are not publicly available.

Nomenclatures

COCardiac output
CTAComputed Tomography angiogram
DAQData acquisition system
DBPDiastolic blood pressure
DICOMDigital Imaging and Communications in Medicine
DUSDoppler ultrasound sonography
FFRFractional flow reserve
HRHeart Rate
ICHDImage-based computational hemodynamics
IEHDImage-based experimental hemodynamics
IRBInstitutional Review Board
MAPMean arterial pressure
MCLMock circulation loop
SBPSystolic blood pressure
STLStandard Tessellation Language
SVStroke volume
TSPGTrans-stenotic pressure gradient
V&VVerification and validation
WK33-element Windkessel model

References

  1. Pijls, N.H.; de Bruyne, B.; Peels, K.; van der Voort, P.H.; Bonnier, H.J.; Bartunek, J.; Koolen, J.J. Measurement of fractional flow reserve to assess the functional severity of coronary-artery stenoses. N. Engl. J. Med. 1996, 334, 1703–1708. [Google Scholar] [CrossRef] [PubMed]
  2. Nørgaard, B.L.; Fairbairn, T.A.; Safian, R.D.; Rabbat, M.G.; Ko, B.; Jensen, J.M.; Nieman, K.; Chinnaiyan, K.M.; Sand, N.P.; Matsuo, H. Coronary CT angiography-derived fractional flow reserve testing in patients with stable coronary artery disease: Recommendations on interpretation and reporting. Radiol. Cardiothorac. Imaging 2019, 1, e190050. [Google Scholar] [CrossRef] [Green Version]
  3. Ahmad, Y.; Götberg, M.; Cook, C.; Howard, J.P.; Malik, I.; Mikhail, G.; Frame, A.; Petraco, R.; Rajkumar, C.; Demir, O. Coronary hemodynamics in patients with severe aortic stenosis and coronary artery disease undergoing transcatheter aortic valve replacement: Implications for clinical indices of coronary stenosis severity. JACC Cardiovasc. Interv. 2018, 11, 2019–2031. [Google Scholar] [CrossRef] [PubMed]
  4. Lu, M.T.; Ferencik, M.; Roberts, R.S.; Lee, K.L.; Ivanov, A.; Adami, E.; Mark, D.B.; Jaffer, F.A.; Leipsic, J.A.; Douglas, P.S. Noninvasive FFR derived from coronary CT angiography: Management and outcomes in the PROMISE trial. JACC Cardiovasc. Imaging 2017, 10, 1350–1358. [Google Scholar] [CrossRef]
  5. Mangiacapra, F.; Trana, C.; Sarno, G.; Davidavicius, G.; Protasiewicz, M.; Muller, O.; Ntalianis, A.; Misonis, N.; Van Vlem, B.; Heyndrickx, G.R.; et al. Translesional pressure gradients to predict blood pressure response after renal artery stenting in patients with renovascular hypertension. Circ. Cardiovasc. Interv. 2010, 3, 537–542. [Google Scholar] [CrossRef] [Green Version]
  6. Yu, H.; Khan, M.; Wu, H.; Zhang, C.; Du, X.; Chen, R.; Fang, X.; Long, J.; Sawchuk, A. Inlet and Outlet Boundary Conditions and Uncertainty Quantification in Volumetric Lattice Boltzmann Method for Image-Based Computational Hemodynamics. Fluids 2022, 7, 30. [Google Scholar] [CrossRef]
  7. Yu, H.; Khan, M.; Wu, H.; Du, X.; Chen, R.; Rollins, D.M.; Fang, X.; Long, J.; Xu, C.; Sawchuk, A.P. A new noninvasive and patient-specific hemodynamic index for assessing the severity of renal arterial stenosis. Int. J. Numer. Methods Biomed. Eng. 2022, 38, e3611. [Google Scholar] [CrossRef] [PubMed]
  8. Heinen, S.G.; van den Heuvel, D.A.; Huberts, W.; de Boer, S.W.; van de Vosse, F.N.; Delhaas, T.; de Vries, J.P. In Vivo Validation of Patient-Specific Pressure Gradient Calculations for Iliac Artery Stenosis Severity Assessment. J. Am. Heart Assoc. 2017, 6, e007328. [Google Scholar] [CrossRef] [Green Version]
  9. Kinney, T.B.; Rose, S.C. Intraarterial pressure measurements during angiographic evaluation of peripheral vascular disease: Techniques, interpretation, applications, and limitations. Am. J. Roentgenol. 1996, 166, 277–284. [Google Scholar] [CrossRef] [Green Version]
  10. de Boer, S.; Heinen, S.; van den Heuvel, D.; van de Vosse, F.; de Vries, J. How to define the hemodynamic significance of an equivocal iliofemoral artery stenosis: Review of literature and outcomes of an international questionnaire. J. Vascular. 2017, 25, 598–608. [Google Scholar] [CrossRef]
  11. Marshall, R.S.; Pavol, M.A.; Cheung, Y.K.; Asllani, I.; Lazar, R.M. Cognitive Impairment Correlates Linearly with Mean Flow Velocity by Transcranial Doppler below a Definable Threshold. Cerebrovasc. Dis. Extra 2020, 10, 21–27. [Google Scholar] [CrossRef] [PubMed]
  12. Koo, B.-K. The present and future of fractional flow reserve. Circ. J. 2014, 78, 1048–1054. [Google Scholar] [CrossRef] [PubMed] [Green Version]
  13. Marsden, A.L.; Esmaily-Moghadam, M. Multiscale Modeling of Cardiovascular Flows for Clinical Decision Support. Appl. Mech. Rev. 2015, 67, 030804. [Google Scholar] [CrossRef]
  14. Les, A.S.; Shadden, S.C.; Figueroa, C.A.; Park, J.M.; Tedesco, M.M.; Herfkens, R.J.; Dalman, R.L.; Taylor, C.A. Quantification of hemodynamics in abdominal aortic aneurysms during rest and exercise using magnetic resonance imaging and computational fluid dynamics. Ann. Biomed. Eng. 2010, 38, 1288–1313. [Google Scholar] [CrossRef]
  15. Antiga, L.; Piccinelli, M.; Botti, L.; Ene-Iordache, B.; Remuzzi, A.; Steinman, A.D. An image-based modeling framework for patient-specific computational hemodynamics. Med. Biol. Eng. Comput. 2008, 46, 1097–1112. [Google Scholar] [CrossRef] [PubMed] [Green Version]
  16. Nguyen, T.D.; Kadri, O.E.; Voronov, R.S. An introductory overview of image-based computational modeling in personalized cardiovascular medicine. Front. Bioeng. Biotechnol. 2020, 8, 529365. [Google Scholar] [CrossRef] [PubMed]
  17. Yu, H.; Zhao, Y.; Lin, C. Unified Computational Method and System for in vivo Patient-Specific Hemodynamics. U.S. Patent 10482215, 19 November 2019. [Google Scholar]
  18. Kim, H.; Vignon-Clementel, I.; Coogan, J.; Figueroa, C.; Jansen, K.; Taylor, C. Patient-specific modeling of blood flow and pressure in human coronary arteries. Ann. Biomed. Eng. 2010, 38, 3195–3209. [Google Scholar] [CrossRef] [PubMed]
  19. Yu, H. Non-invasive Functional Assessment Technique for Determining Hemodynamics Severity of an Arterial Stenosis. U.S. Patent 11538153, 19 November 2022. [Google Scholar]
  20. Murayama, Y.; Fujimura, S.; Suzuki, T.; Takao, H. Computational fluid dynamics as a risk assessment tool for aneurysm rupture. Neurosurg. Focus 2019, 47, E12. [Google Scholar] [CrossRef] [Green Version]
  21. Liang, L.; Steinman, D.A.; Brina, O.; Chnafa, C.; Cancelliere, N.M.; Pereira, V.M. Towards the Clinical utility of CFD for assessment of intracranial aneurysm rupture—A systematic review and novel parameter-ranking tool. J. Neurointerventional Surg. 2019, 11, 153–158. [Google Scholar] [CrossRef]
  22. Can, A.; Du, R. Association of hemodynamic factors with intracranial aneurysm formation and rupture: Systematic review and meta-analysis. Neurosurgery 2015, 78, 510–520. [Google Scholar] [CrossRef]
  23. Formaggia, L.; Lamponi, D.; Quarteroni, A. One-dimensional models for blood flow in arteries. J. Eng. Math. 2003, 47, 251–276. [Google Scholar] [CrossRef]
  24. Vignon-Clementel, I.E.; Figueroa, C.; Jansen, K.; Taylor, C. Outflow boundary conditions for 3D simulations of non-periodic blood flow and pressure fields in deformable arteries. Comput. Methods Biomech. Biomed. Eng. 2010, 13, 625–640. [Google Scholar] [CrossRef] [PubMed] [Green Version]
  25. Vignon-Clementel, I.E.; Figueroa, C.A.; Jansen, K.E.; Taylor, C.A. Outflow boundary conditions for three-dimensional finite element modeling of blood flow and pressure in arteries. Comput. Methods Appl. Mech. Eng. 2006, 195, 3776–3796. [Google Scholar] [CrossRef]
  26. Gallo, D.; De Santis, G.; Negri, F.; Tresoldi, D.; Ponzini, R.; Massai, D.; Deriu, M.; Segers, P.; Verhegghe, B.; Rizzo, G. On the use of in vivo measured flow rates as boundary conditions for image-based hemodynamic models of the human aorta: Implications for indicators of abnormal flow. Ann. Biomed. Eng. 2012, 40, 729–741. [Google Scholar] [CrossRef] [PubMed]
  27. Vignon-Clementel, I.E.; Marsden, A.L.; Feinstein, J.A. A primer on computational simulation in congenital heart disease for the clinician. Prog. Pediatr. Cardiol. 2010, 30, 3–13. [Google Scholar] [CrossRef] [Green Version]
  28. Alastruey, J.; Parker, K.; Peiró, J.; Sherwin, S. Lumped parameter outflow models for 1-D blood flow simulations: Effect on pulse waves and parameter estimation. Commun. Comput. Phys. 2008, 4, 317–336. [Google Scholar]
  29. Stergiopulos, N.; Young, D.; Rogge, T. Computer simulation of arterial flow with applications to arterial and aortic stenoses. J. Biomech. 1992, 25, 1477–1488. [Google Scholar] [CrossRef]
  30. Reymond, P.; Merenda, F.; Perren, F.; Rufenacht, D.; Stergiopulos, N. Validation of a one-dimensional model of the systemic arterial tree. Am. J. Physiol. Heart Circ. Physiol. 2009, 297, H208–H222. [Google Scholar] [CrossRef] [PubMed] [Green Version]
  31. Bonfanti, M.; Balabani, S.; Greenwood, J.P.; Puppala, S.; Homer-Vanniasinkam, S.; Díaz-Zuccarini, V. Computational tools for clinical support: A multi-scale compliant model for haemodynamic simulations in an aortic dissection based on multi-modal imaging data. J. R. Soc. Interface 2017, 14, 20170632. [Google Scholar] [CrossRef] [Green Version]
  32. Pirola, S.; Cheng, Z.; Jarral, O.; O’Regan, D.; Pepper, J.; Athanasiou, T.; Xu, X. On the choice of outlet boundary conditions for patient-specific analysis of aortic flow using computational fluid dynamics. J. Biomech. 2017, 60, 15–21. [Google Scholar] [CrossRef]
  33. Morbiducci, U.; Gallo, D.; Massai, D.; Consolo, F.; Ponzini, R.; Antiga, L.; Bignardi, C.; Deriu, M.A.; Redaelli, A. Outflow conditions for image-based hemodynamic models of the carotid bifurcation: Implications for indicators of abnormal flow. J. Biomech. Eng. 2010, 132, 091005. [Google Scholar] [CrossRef] [PubMed]
  34. Antonuccio, M.N.; Mariotti, A.; Fanni, B.M.; Capellini, K.; Capelli, C.; Sauvage, E.; Celi, S. Effects of uncertainty of outlet boundary conditions in a patient-specific case of aortic coarctation. Ann. Biomed. Eng. 2021, 49, 3494–3507. [Google Scholar] [CrossRef] [PubMed]
  35. Westerhof, N.; Elzinga, G.; Sipkema, P. An artificial arterial system for pumping hearts. J. Appl. Physiol. 1971, 31, 776–781. [Google Scholar] [CrossRef] [PubMed]
  36. Ohashi, Y.; De Andrade, A.; Nosé, Y. Hemolysis in an electromechanical driven pulsatile total artificial heart. Artif. Organs 2003, 27, 1089–1093. [Google Scholar] [CrossRef] [PubMed]
  37. Nestler, F.; Bradley, A.P.; Wilson, S.J.; Timms, D.L.; Frazier, O.H.; Cohn, W.E. A hybrid mock circulation loop for a total artificial heart. Artif. Organs 2014, 38, 775–782. [Google Scholar] [CrossRef] [PubMed]
  38. Gräf, F.; Finocchiaro, T.; Laumen, M.; Mager, I.; Steinseifer, U. Mock circulation loop to investigate hemolysis in a pulsatile total artificial heart. Artif. Organs 2015, 39, 416–422. [Google Scholar] [CrossRef]
  39. Koenig, S.C.; Pantalos, G.M.; Gillars, K.J.; Ewert, D.L.; Litwak, K.N.; Etoch, S.W. Hemodynamic and pressure–volume responses to continuous and pulsatile ventricular assist in an adult mock circulation. ASAIO J. 2004, 50, 15–24. [Google Scholar] [CrossRef]
  40. Pantalos, G.M.; Koenig, S.C.; Gillars, K.J.; Giridharan, G.A.; Ewert, D.L. Characterization of an adult mock circulation for testing cardiac support devices. ASAIO J. 2004, 50, 37–46. [Google Scholar] [CrossRef]
  41. Liu, Y.; Allaire, P.; Wood, H.; Olsen, D. Design and initial testing of a mock human circulatory loop for left ventricular assist device performance testing. Artif. Organs 2005, 29, 341–345. [Google Scholar] [CrossRef] [PubMed]
  42. Timms, D.; Hayne, M.; McNeil, K.; Galbraith, A. A complete mock circulation loop for the evaluation of left, right, and biventricular assist devices. Artif. Organs 2005, 29, 564–572. [Google Scholar] [CrossRef]
  43. Colacino, F.M.; Moscato, F.; Piedimonte, F.; Danieli, G.; Nicosia, S.; Arabia, M. A modified elastance model to control mock ventricles in real-time: Numerical and experimental validation. ASAIO J. 2008, 54, 563–573. [Google Scholar] [CrossRef] [PubMed]
  44. Schampaert, S.; Pennings, K.; Van de Molengraft, M.; Pijls, N.; Van de Vosse, F.; Rutten, M. A mock circulation model for cardiovascular device evaluation. Physiol. Meas. 2014, 35, 687. [Google Scholar] [CrossRef] [PubMed]
  45. Gregory, S.D.; Pauls, J.P.; Wu, E.L.; Stephens, A.; Steinseifer, U.; Tansley, G.; Fraser, J.F. An advanced mock circulation loop for in vitro cardiovascular device evaluation. Artif. Organs 2020, 44, E238–E250. [Google Scholar] [CrossRef] [PubMed]
  46. Rezaienia, M.; Paul, G.; Avital, E.; Mozafari, S.; Rothman, M.; Korakianitis, T. In-vitro investigation of the hemodynamic responses of the cerebral, coronary and renal circulations with a rotary blood pump installed in the descending aorta. Med. Eng. Phys. 2017, 40, 2–10. [Google Scholar] [CrossRef]
  47. Gehron, J.; Zirbes, J.; Bongert, M.; Schäfer, S.; Fiebich, M.; Krombach, G.; Böning, A.; Grieshaber, P.; EMPACS (Exploration of the Mixing Phenomena during Interaction of Internal and External circulations) Study Group. Development and Validation of a Life-Sized Mock Circulatory Loop of the Human Circulation for Fluid-Mechanical Studies. ASAIO J. 2019, 65, 788–797. [Google Scholar] [CrossRef]
  48. Ruiz, P.; Rezaienia, M.A.; Rahideh, A.; Keeble, T.R.; Rothman, M.T.; Korakianitis, T. In vitro cardiovascular system emulator (bioreactor) for the simulation of normal and diseased conditions with and without mechanical circulatory support. Artif. Organs 2013, 37, 549–560. [Google Scholar] [CrossRef] [PubMed]
  49. Sénage, T.; Février, D.; Michel, M.; Pichot, E.; Duveau, D.; Tsui, S.; Trochu, J.N.; Roussel, J.C. A mock circulatory system to assess the performance of continuous-flow left ventricular assist devices (LVADs): Does axial flow unload better than centrifugal LVAD? ASAIO J. 2014, 60, 140. [Google Scholar] [CrossRef] [Green Version]
  50. Pantalos, G.M.; Ionan, C.; Koenig, S.C.; Gillars, K.J.; Horrell, T.; Sahetya, S.; Colyer, J.; Gray, L.A., Jr. Expanded pediatric cardiovascular simulator for research and training. ASAIO J. 2010, 56, 67–72. [Google Scholar] [CrossRef]
  51. Giridharan, G.A.; Ising, M.; Sobieski, M.A.; Koenig, S.C.; Chen, J.; Frankel, S.; Rodefeld, M.D. Cavopulmonary assist for the failing Fontan circulation: Impact of ventricular function on mechanical support strategy. ASAIO J. 2014, 60, 707. [Google Scholar] [CrossRef] [Green Version]
  52. Giridharan, G.A.; Koenig, S.C.; Kennington, J.; Sobieski, M.A.; Chen, J.; Frankel, S.H.; Rodefeld, M.D. Performance evaluation of a pediatric viscous impeller pump for Fontan cavopulmonary assist. J. Thorac. Cardiovasc. Surg. 2013, 145, 249–257. [Google Scholar] [CrossRef] [Green Version]
  53. Van Poucke, S.; Stevens, K.; Kicken, C.; Simons, A.; Marcus, A.; Lancé, M. Platelet function during hypothermia in experimental mock circulation. Artif. Organs 2016, 40, 288–293. [Google Scholar] [CrossRef]
  54. Bleilevens, C.; Hill, A.; Grzanna, T.; Fechter, T.; Bohnen, M.; Weber, H.-J.; Beckers, C.; Borosch, S.; Zayat, R.; Benstoem, C. In vitro head-to-head comparison of anticoagulation properties of two heparin brands in a human blood miniature mock loop. Interact. Cardiovasc. Thorac. Surg. 2019, 28, 120–127. [Google Scholar] [CrossRef] [PubMed] [Green Version]
  55. Knoops, P.G.; Biglino, G.; Hughes, A.D.; Parker, K.H.; Xu, L.; Schievano, S.; Torii, R. A mock circulatory system incorporating a compliant 3D-printed anatomical model to investigate pulmonary hemodynamics. Artif. Organs 2017, 41, 637–646. [Google Scholar] [CrossRef] [PubMed] [Green Version]
  56. Conijn, M.; Wintermans, L.; Metselaar, R.; Ruisch, J.; Bax, E.; van Egmond, C.; Nieuwenstein, B.; Warmerdam, E.; Krings, G.J.B.P.; Express, E. A 3D printed pulmonary mock loop for hemodynamic studies in congenital heart disease. Biomed. Phys. Eng. Express 2022, 8, 065003. [Google Scholar] [CrossRef] [PubMed]
  57. Vignali, E.; Gasparotti, E.; Mariotti, A.; Haxhiademi, D.; Ait-Ali, L.; Celi, S. High-versatility left ventricle pump and aortic mock circulatory loop development for patient-specific hemodynamic in vitro analysis. ASAIO J. 2022, 68, 1272–1281. [Google Scholar] [CrossRef] [PubMed]
  58. Biglino, G.; Cosentino, D.; Steeden, J.A.; De Nova, L.; Castelli, M.; Ntsinjana, H.; Pennati, G.; Taylor, A.M.; Schievano, S. Using 4D cardiovascular magnetic resonance imaging to validate computational fluid dynamics: A case study. Front. Pediatr. 2015, 3, 107. [Google Scholar] [CrossRef] [Green Version]
  59. Shepard, L.; Sommer, K.; Izzo, R.; Podgorsak, A.; Wilson, M.; Said, Z.; Rybicki, F.J.; Mitsouras, D.; Rudin, S.; Angel, E. Initial simulated FFR investigation using flow measurements in patient-specific 3D printed coronary phantoms. In Proceedings of the Medical Imaging 2017: Imaging Informatics for Healthcare, Research, and Applications, Orlando, FL, USA, 15–16 February 2017; pp. 192–203. [Google Scholar]
  60. Sommer, K.N.; Shepard, L.; Karkhanis, N.V.; Iyer, V.; Angel, E.; Wilson, M.F.; Rybicki, F.J.; Mitsouras, D.; Rudin, S.; Ionita, C.N. 3D Printed Cardiovascular Patient Specific Phantoms Used for Clinical Validation of a CT-derived FFR Diagnostic Software. In Proceedings of the Medical Imaging 2018: Biomedical Applications in Molecular, Structural, and Functional Imaging, Houston, TX, USA, 11–13 February 2018; Volume 10578, p. 105780J. [Google Scholar]
  61. Rong, C.; Chen, R.; Yan, W.; Yu, H.; Xu, Y. Hemodynamic analysis of external iliac artery based on VLBM. J. Zhejiang Univ. Sci. Technol. 2022, 34, 7–16. [Google Scholar]
  62. Zhang, X.; Gomez-Paz, J.; Chen, X.; McDonough, J.M.; Islam, M.; Andreopoulos, Y.; Zhu, L.; Yu, H. Volumetric lattice Boltzmann method for wall stresses of image-based pulsatile flows. Sci. Rep. 2022, 12, 1697. [Google Scholar] [CrossRef]
  63. An, S.; Yu, H.; Yao, J. GPU-accelerated Volumetric Lattice Boltzmann Method for Porous Media Flow. J. Petro. Sci. Eng. 2017, 156, 546–552. [Google Scholar] [CrossRef]
  64. An, S.; Yu, H.; Wang, Z.; Chen, R.; Kapadia, B.; Yao, J. Unified Mesoscopic Modeling and GPU-accelerated Computational Method for Image-based Pore-scale Porous Media Flows. Int. J. Heat Mass Trans. 2017, 115, 1192–1202. [Google Scholar] [CrossRef]
  65. Wang, Z.; Zhao, Y.; Sawchuck, A.P.; Dalsing, M.C.; Yu, H. GPU acceleration of Volumetric Lattice Boltzmann Method for patient-specific computational hemodynamics. Comput. Fluids 2015, 115, 192–200. [Google Scholar] [CrossRef]
  66. Yu, H.; Chen, X.; Wang, Z.; Deep, D.; Lima, E.; Zhao, Y.; Teague, D.S. Mass-conserved volumetric lattice Boltzmann method for complex flows with willfully moving boundaries. Phys. Rev. E 2014, 89, 063304. [Google Scholar] [CrossRef] [PubMed]
  67. Yu, H.; Rong, C.; Jin, X.; Xu, Y.; Murphy, M.; Motaganahalli, R.; Sawchuk, A. Fast and Noninvasive Evaluation of In Vivo Pressure in Stenosed Aortoiliac Arteries. J. Vasc. Surg. 2020, 72, e308–e309. [Google Scholar] [CrossRef]
  68. Monnet, X.; Letierce, A.; Hamzaoui, O.; Chemla, D.; Anguel, N.; Osman, D.; Richard, C.; Teboul, J.-L. Arterial pressure allows monitoring the changes in cardiac output induced by volume expansion but not by norepinephrine. Crit. Care Med. 2011, 39, 1394–1399. [Google Scholar] [CrossRef] [PubMed]
  69. Kluckow, M.; Evans, N. Relationship between blood pressure and cardiac output in preterm infants requiring mechanical ventilation. J. Pediatr. 1996, 129, 506–512. [Google Scholar] [CrossRef] [PubMed]
  70. Chapman, J.H.; Elliott, P. Cardiovascular effects of static and dynamic exercise. Eur. J. Appl. Physiol. Occup. Physiol. 1988, 58, 152–157. [Google Scholar] [CrossRef]
  71. Lind, A.; McNicol, G. Muscular factors which determine the cardiovascular responses to sustained and rhythmic exercise. Can. Med. Assoc. J. 1967, 96, 706. [Google Scholar]
  72. Lind, A.R. Cardiovascular responses to static exercise (Isometrics, anyone?). Circulation 1970, 41, 173–176. [Google Scholar] [CrossRef] [Green Version]
Figure 1. Antomically extracted 6 aortoiliac (a) and 5 aortorenal (b) arterial systems in STL format. (c) A 3D printed aortoiliac arterial system using (i) Clear, (ii) Flexible 80A, and (iii) Elastic 50A Resin. The arterial wall is more flexible from left to right.
Fluids 08 00198 g001
Figure 2. Illustrations of the MCL: (a) schematic diagram and (b) benchtop setup to mimic the blood flow in a 3D printed silicone arterial system for in vitro measurement of pressure and velocity waveforms. The Red arrows indicate the flow direction in the loop. The connection from a loop component to an instrument is indicated by a green arrow.
Fluids 08 00198 g002
Figure 3. Harvard apparatus pulsatile blood pump: (a) exterior appearance and (b) internal linkage with reciprocating piston.
Fluids 08 00198 g003
Figure 4. Silicone aortorenal (a) and aortoiliac (b) arterial systems with inserted 21 g needles for pressure measurement.
Fluids 08 00198 g004
Figure 5. Pressure waveforms measured in (a) RCIA and (b) REIA of the iliac case using glycerol solution (blue) and water (red).
Fluids 08 00198 g005
Figure 6. A comparison among medical measurement (M), computation (C), and experimental measurement (E) using iliac case VI at three locations in panel (a), including SBP, DBP, and MAP in panel (b), and pressure waveforms in a full cardiac cycle at RCIA and REIA in panels (c,d), respectively.
Fluids 08 00198 g006
Figure 7. Correlation scatter plots of experimentally (in vitro) vs. medically (in vivo) measured SBP ((a,c) and DBP (b,d)) pressure for iliac ((a,b) and renal (c,d)) cases. r E M is the Pearson correlation coefficient between experimentally (in vitro) and medically (in vivo) measured pressure.
Fluids 08 00198 g007
Figure 8. Effects of heart rate (left axis) and stroke volume (right axis) on mean arterial pressure in the aorta of the renal case. The measurement location is indicated by the black arrow.
Fluids 08 00198 g008
Figure 9. (a) A real (iliac case VI in Figure 1a) stenosis and its parameterization, characterized by V R . Distal ( p d ) and proximal p a pressure are measured at the indicated location. (b) T S P G ~ V R curves for SBP (squares) and MAP (dots). The cross-section area where the stenosis is located is shown in blue.
Fluids 08 00198 g009
Table 1. 11 patient cases, obtained from IU Health Methodist Hospital in Indianapolis, IN, USA (R: IV–V and I: I–V) and Hangzhou First People’s Hospital in Hangzhou, Zhejiang, China (R: I–III and I:VI).
ArteryCaseAgeGenderStenosisStenting
Renal (R)I64MaleYesNo
II87MaleYesYes
III83MaleYesNo
IV74MaleNoNo
V75MaleNoNo
Iliac (I)I63MaleYesYes
II61FemaleYesYes
III64FemaleYesYes
IV53MaleYesYes
V76FemaleYesYes
VI69MaleYesYes
Disclaimer/Publisher’s Note: The statements, opinions and data contained in all publications are solely those of the individual author(s) and contributor(s) and not of MDPI and/or the editor(s). MDPI and/or the editor(s) disclaim responsibility for any injury to people or property resulting from any ideas, methods, instructions or products referred to in the content.

