
Repaired Tetralogy of Fallot Pressure Assessment: Insights from 4D-Flow Pressure Mapping

Abstract
:1. Introduction
2. Materials and Methods
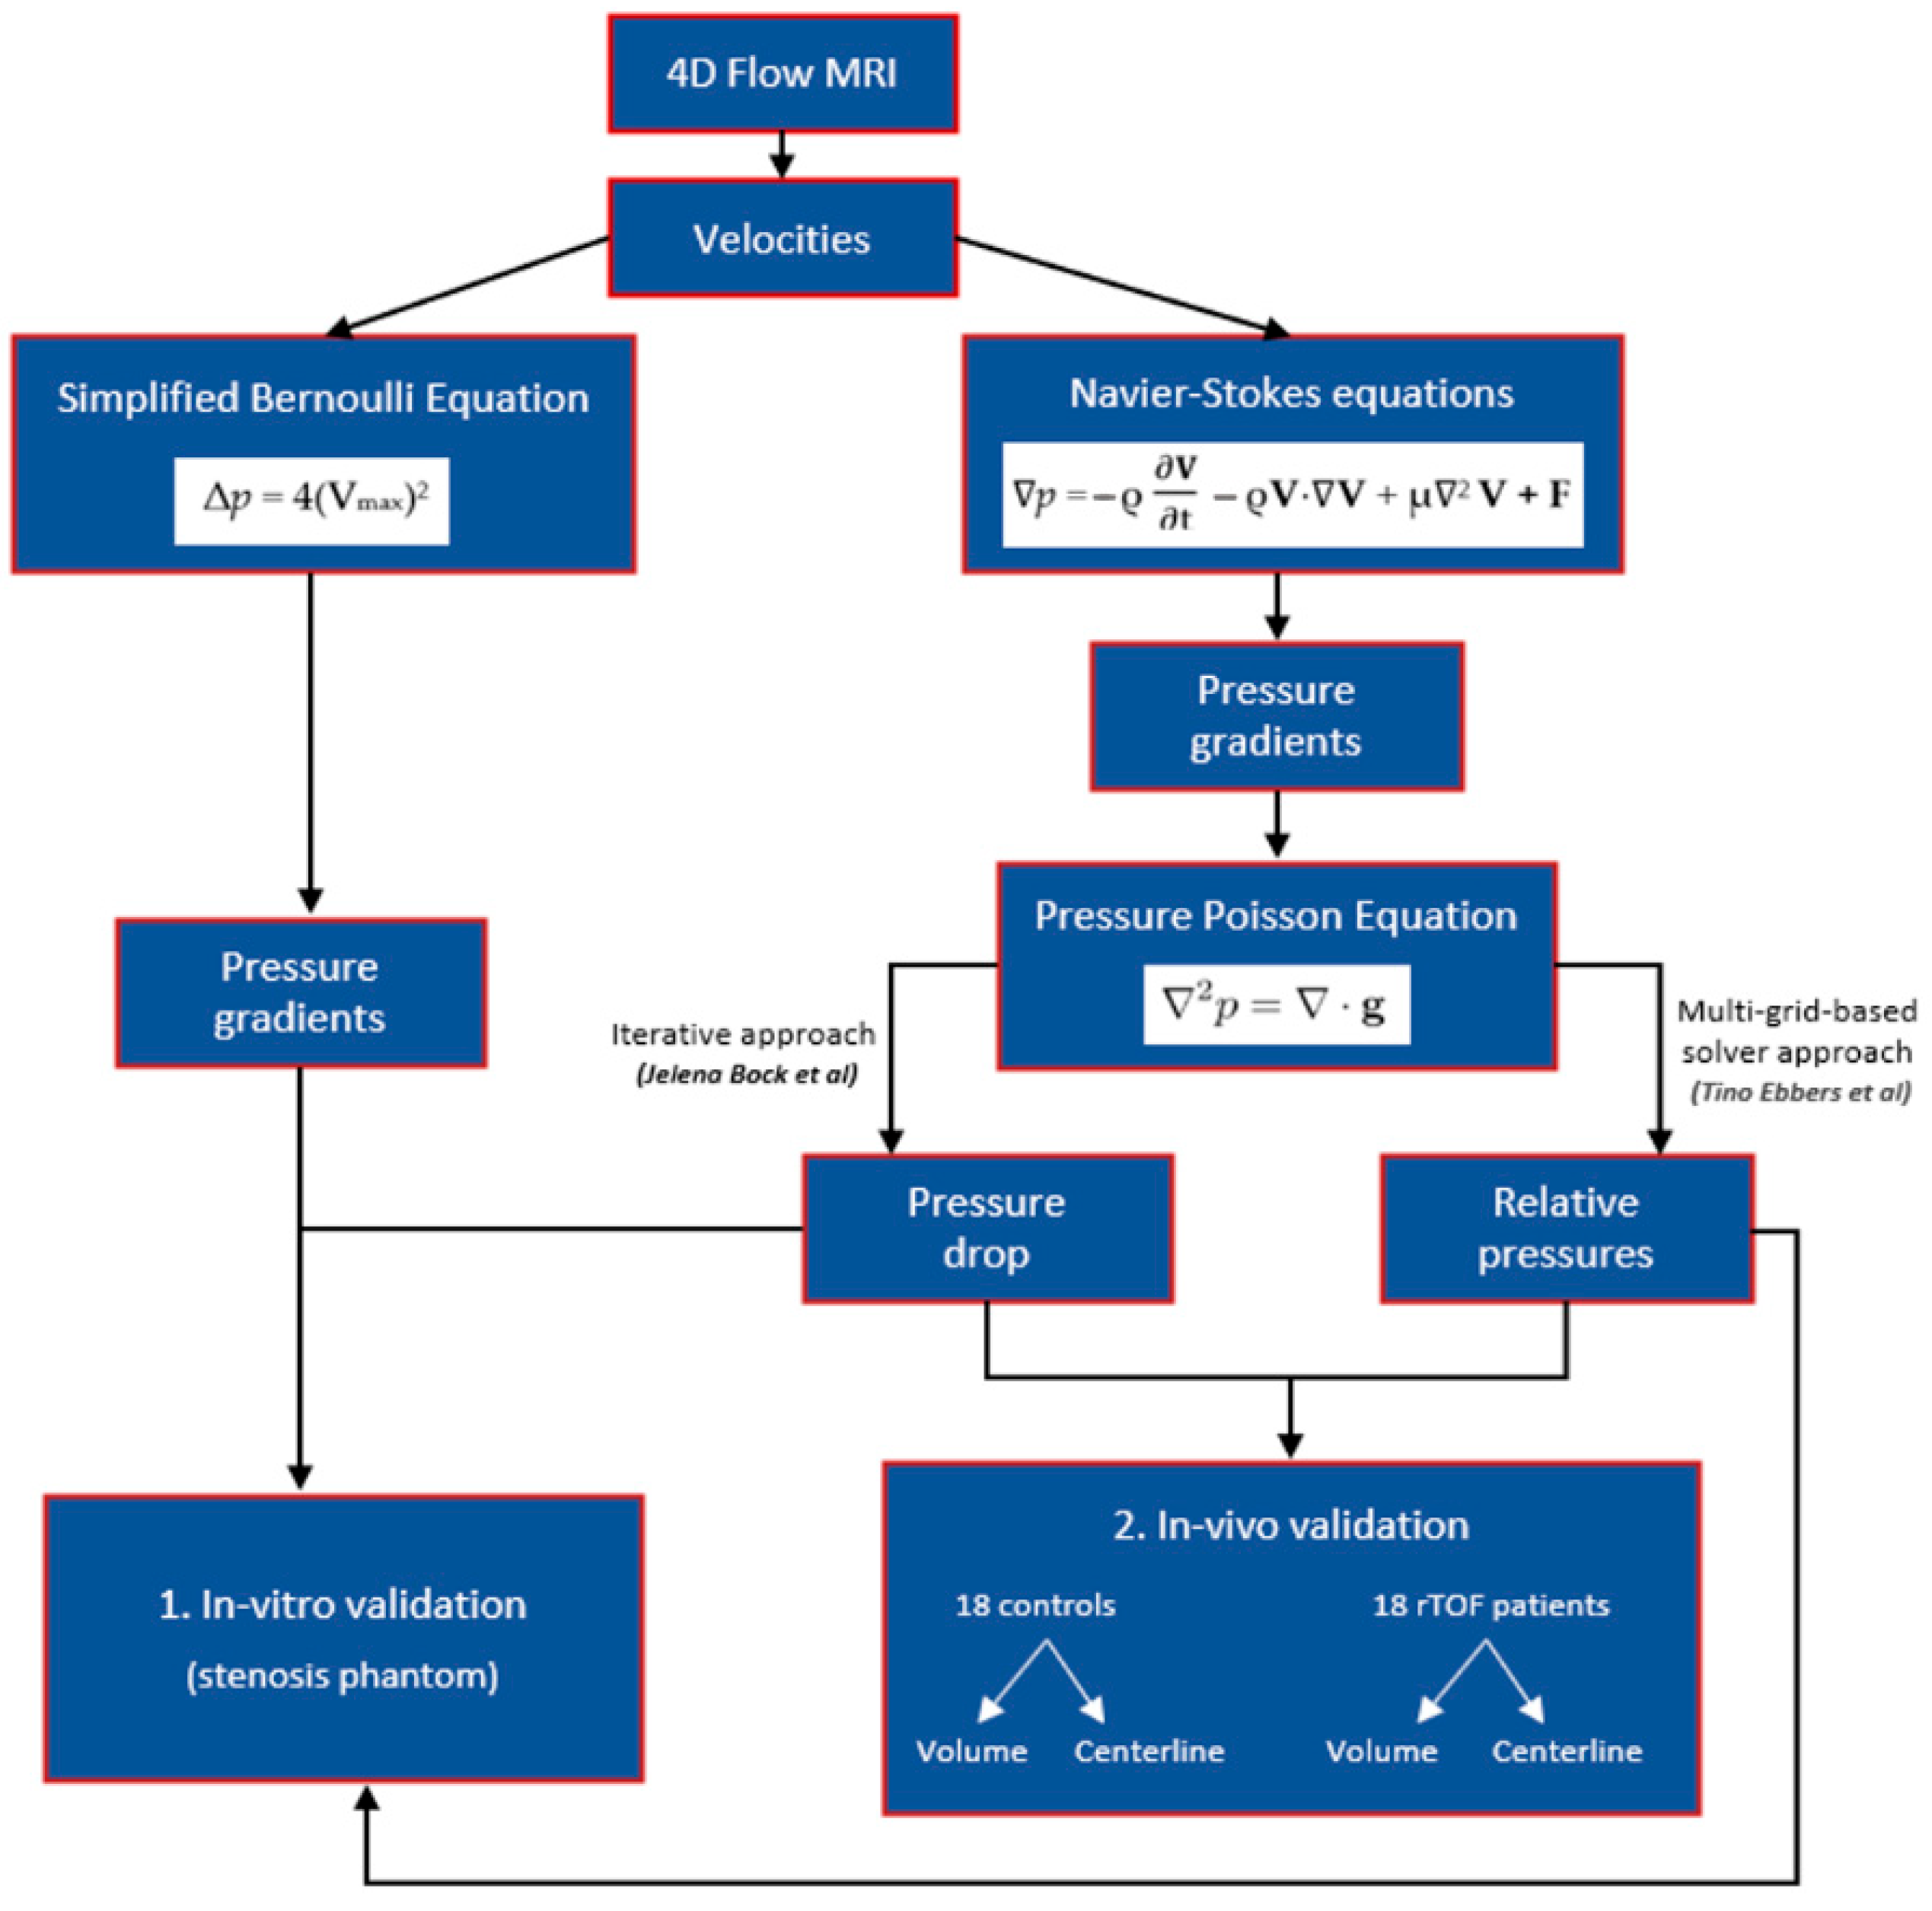
2.1. Pressure Gradients, Pressure Drop, and Relative Pressures Estimation
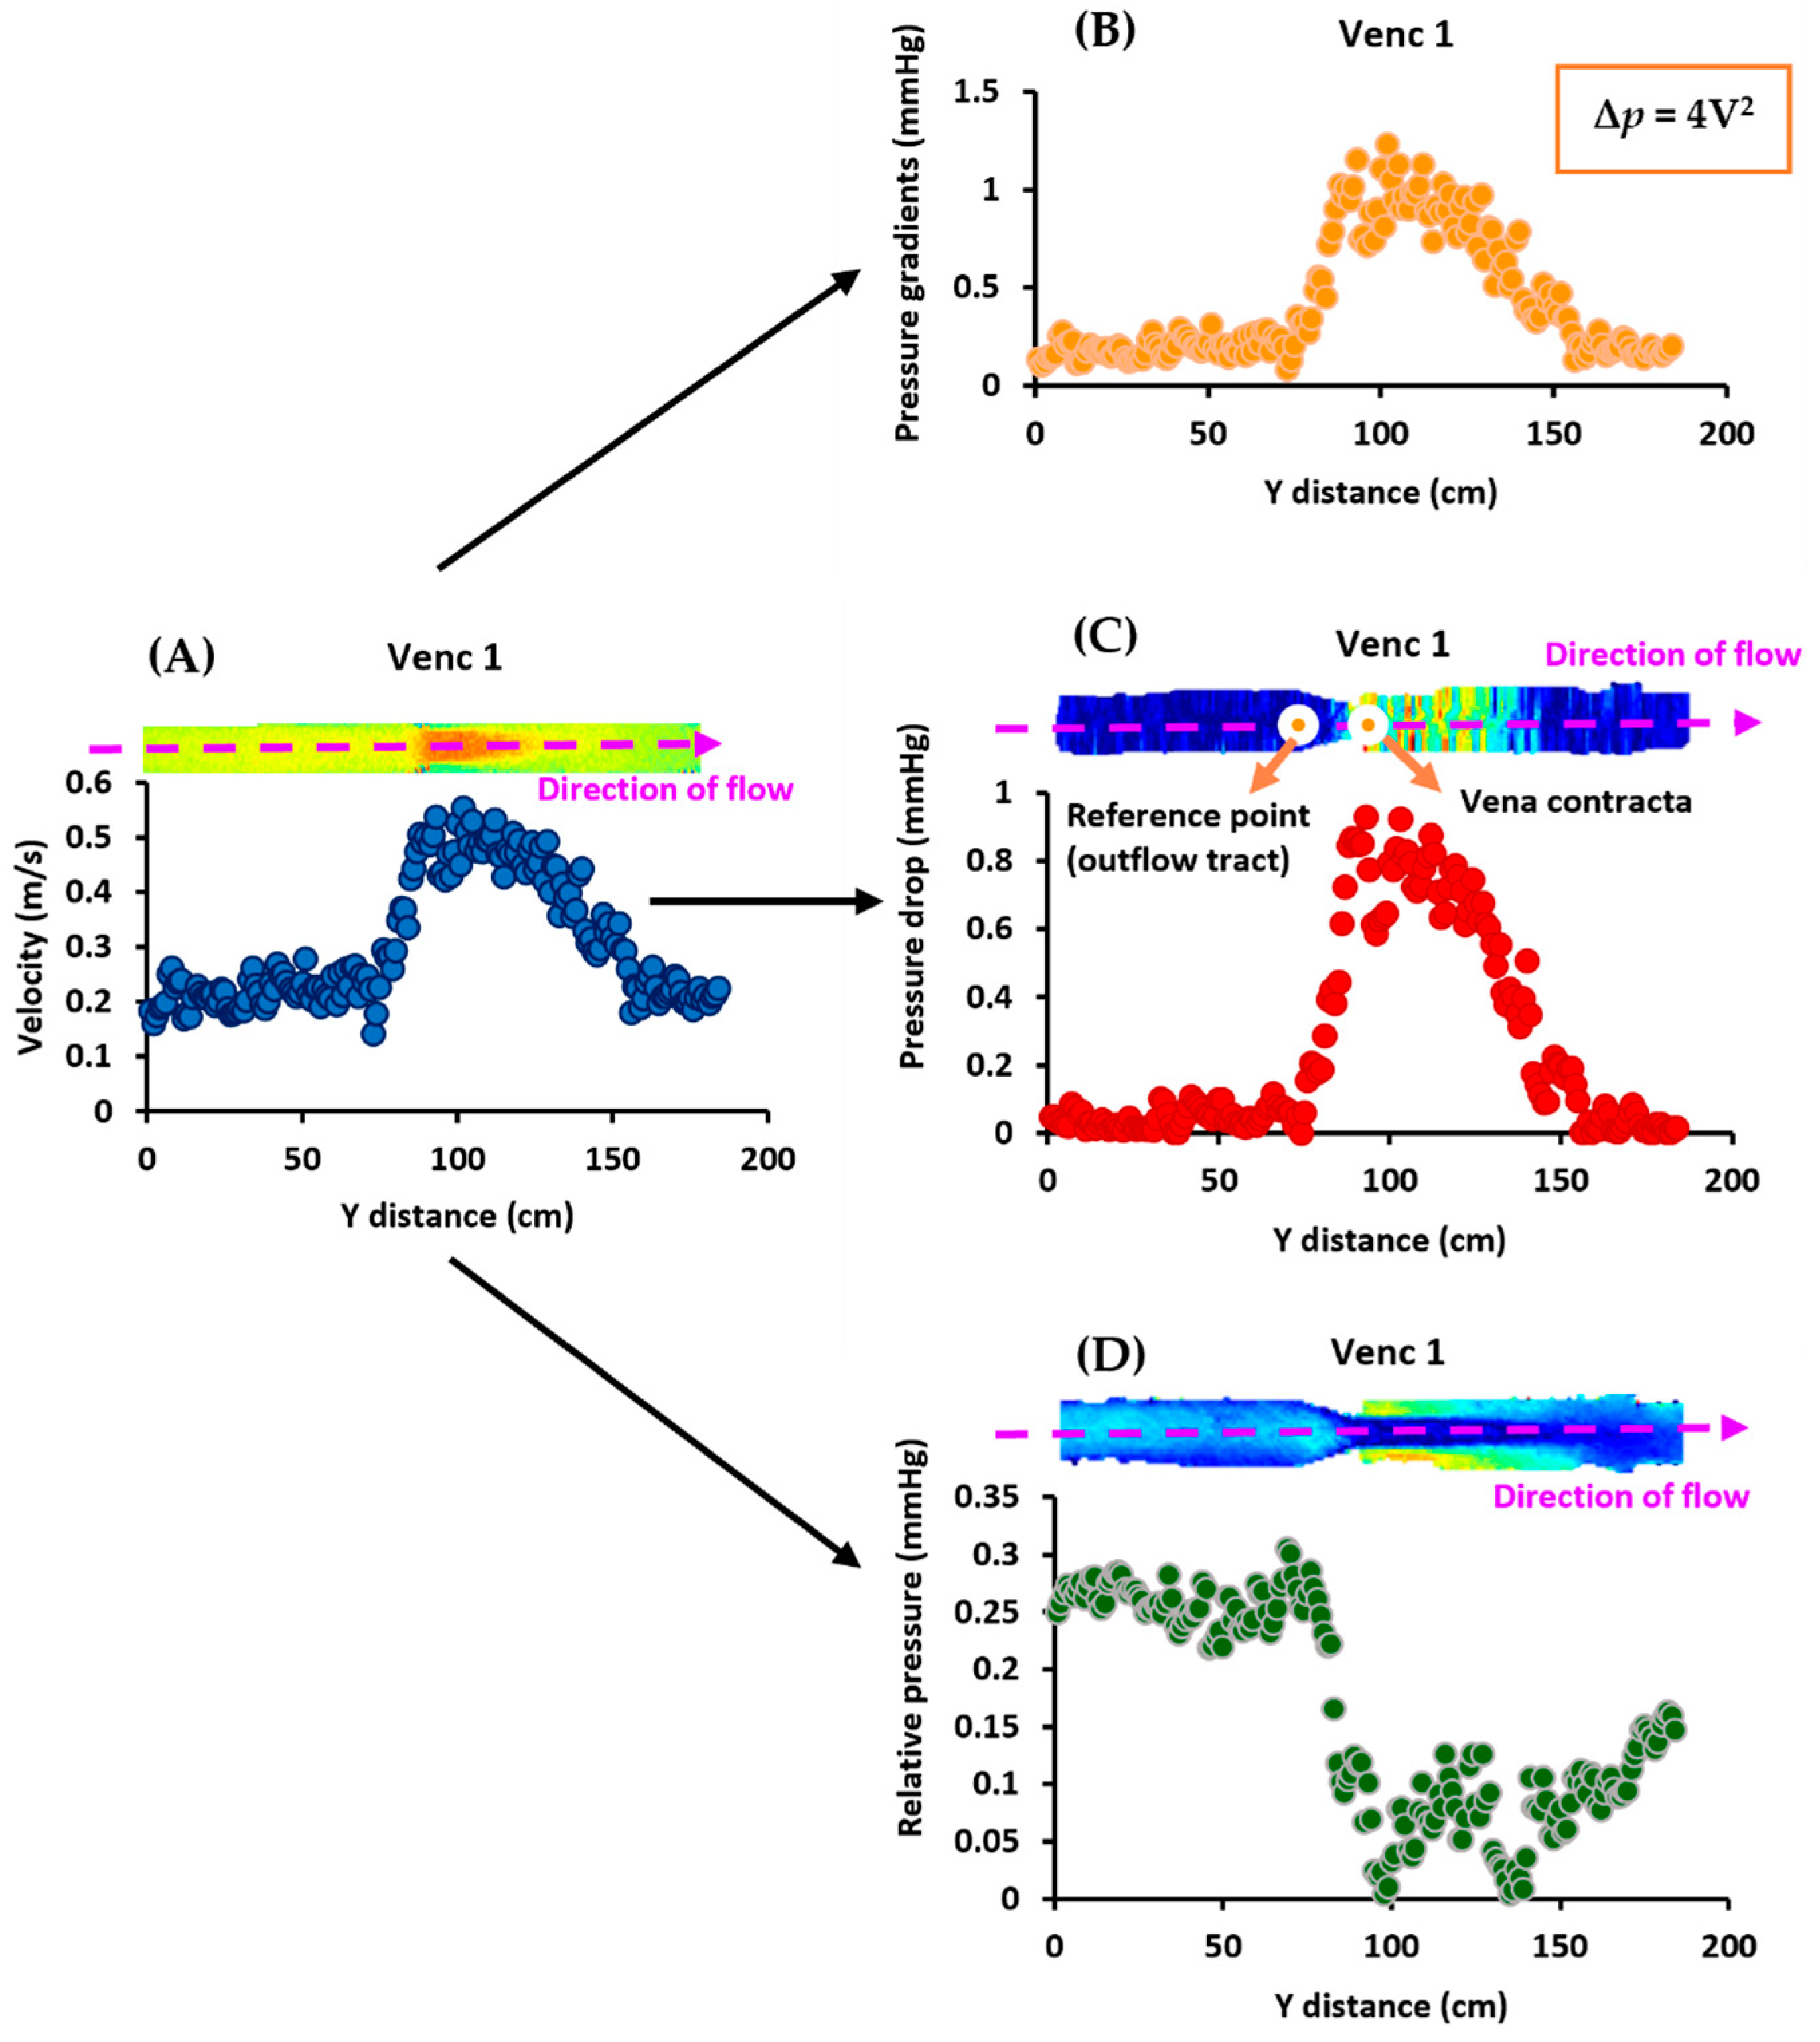
2.2. In Vitro Model
2.3. In Vivo Model
2.3.1. Study Population
2.3.2. Cardiac Magnetic Resonance Imaging Protocol
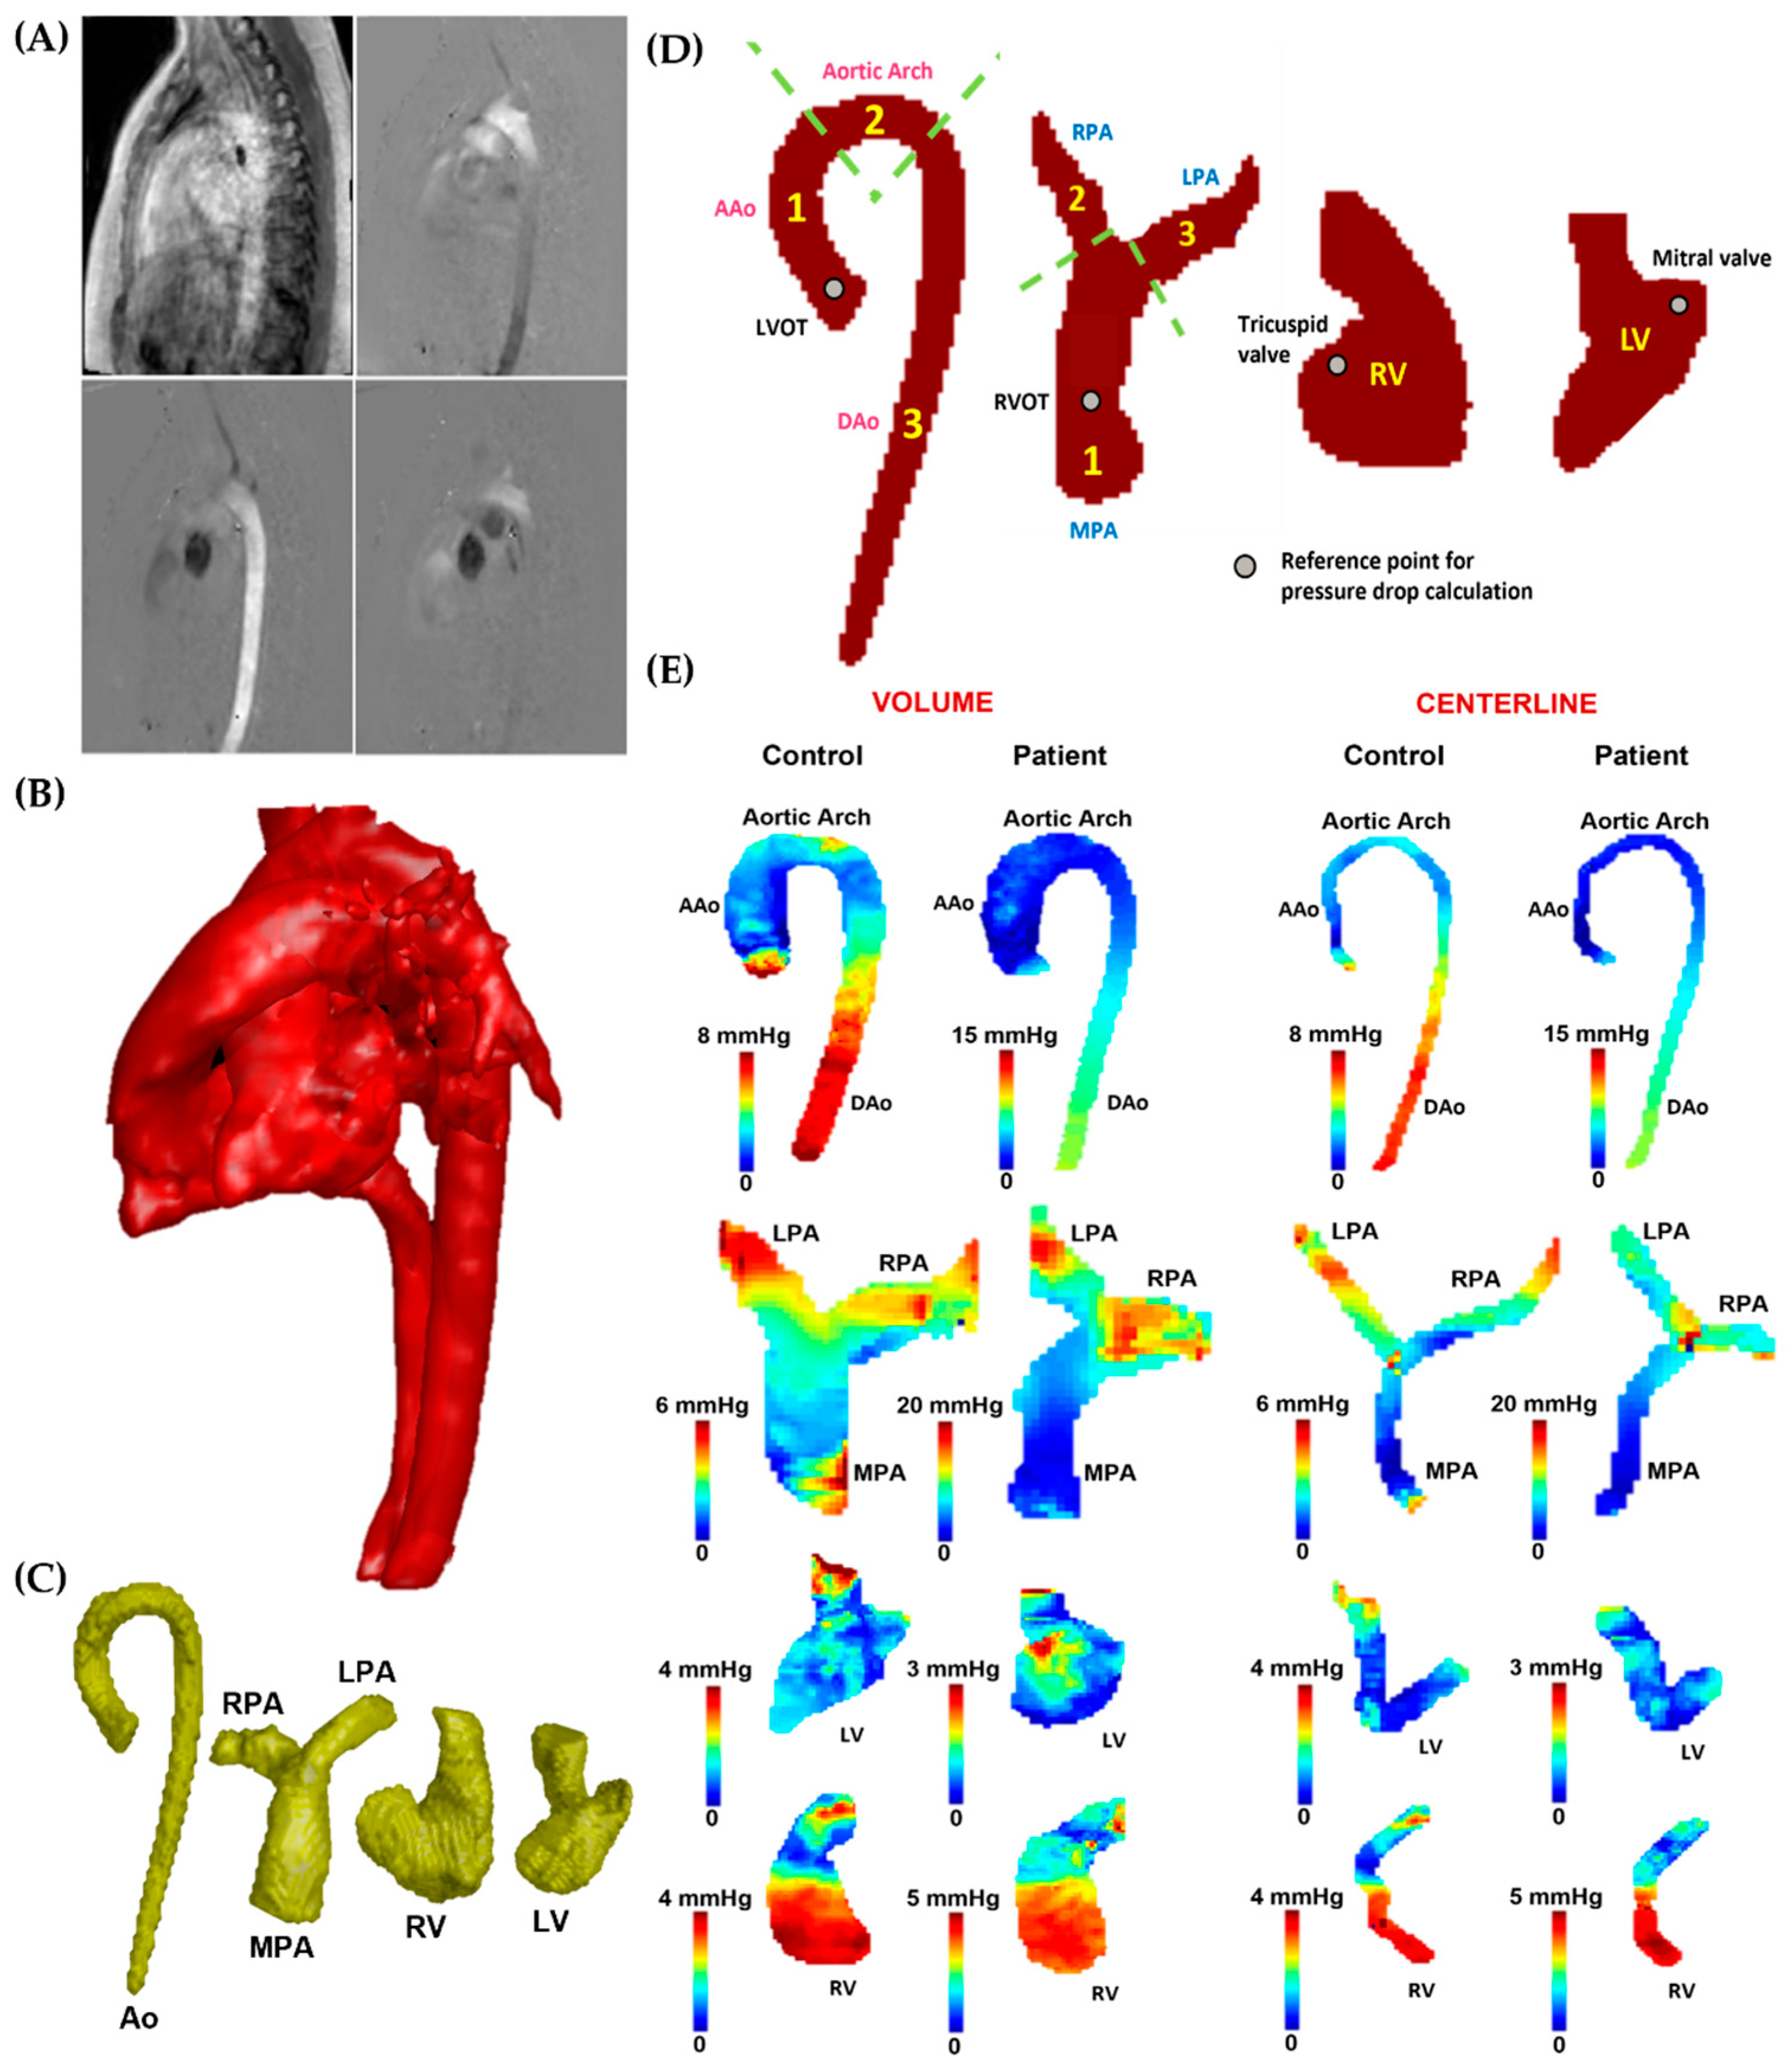
2.3.3. Cardiac Imaging and 4D-Flow Analysis
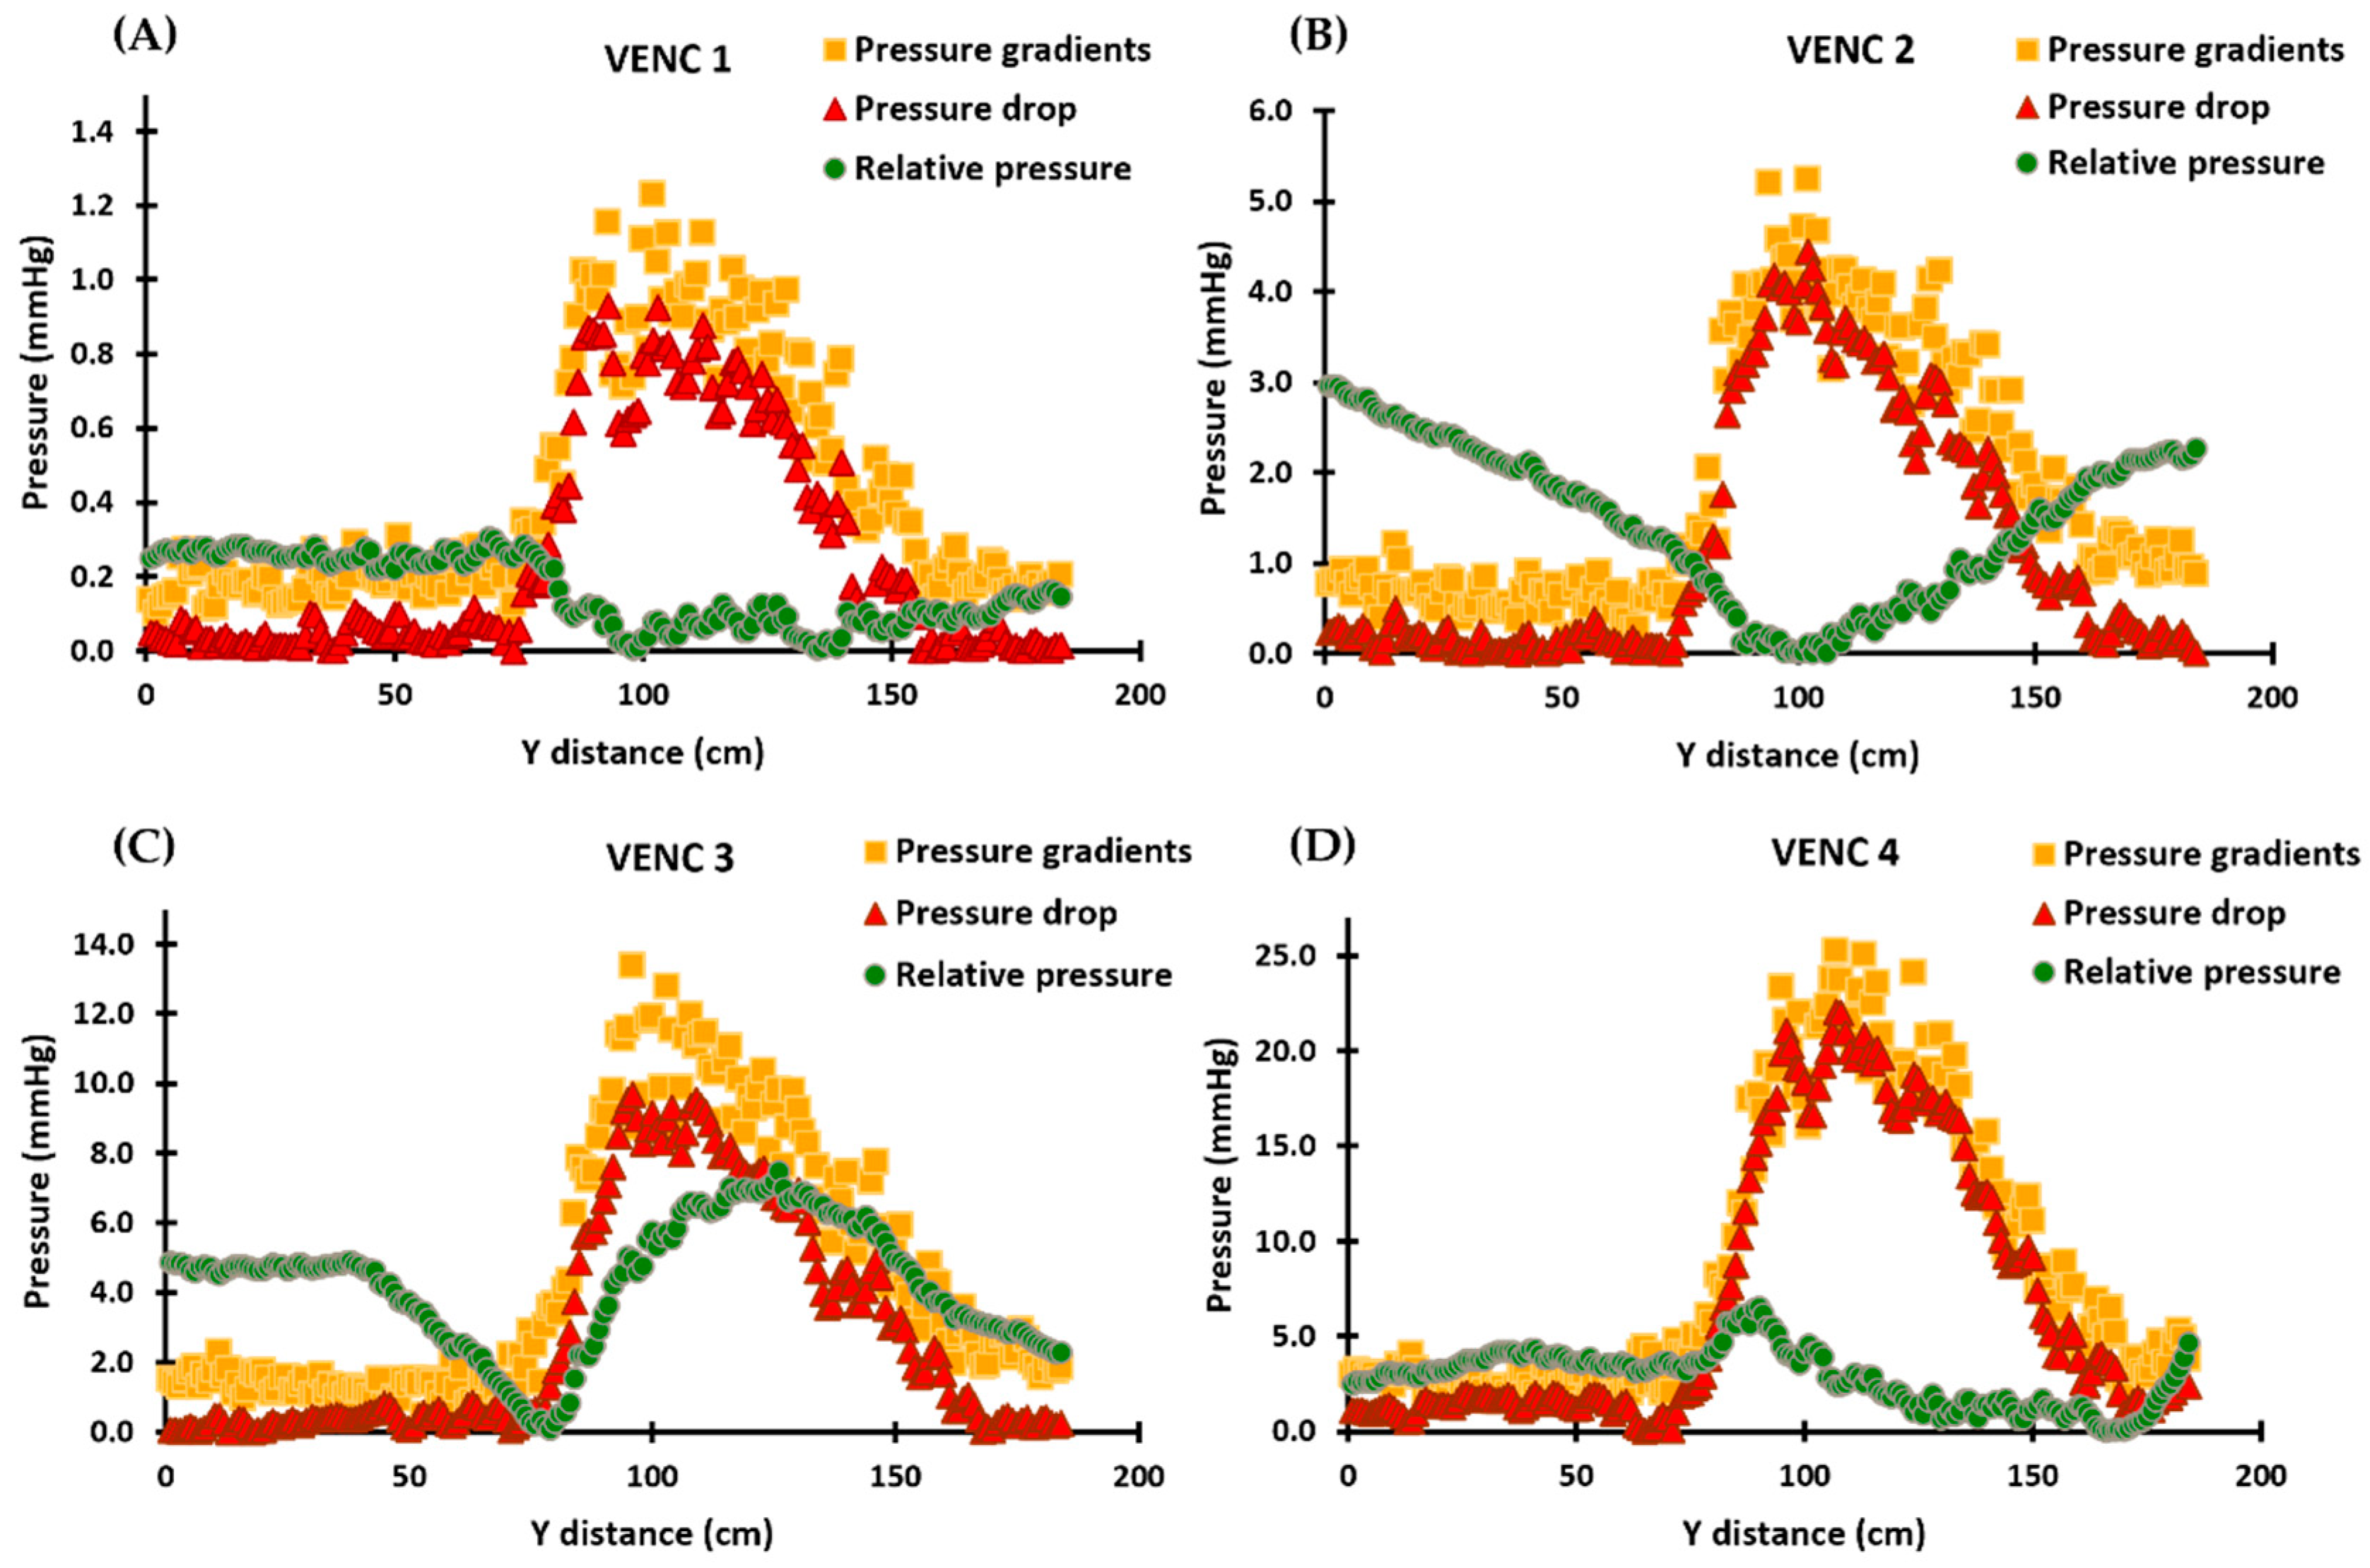
2.4. In Vitro Data Analysis
2.5. In Vivo Data Analysis
2.6. Statistical Analysis
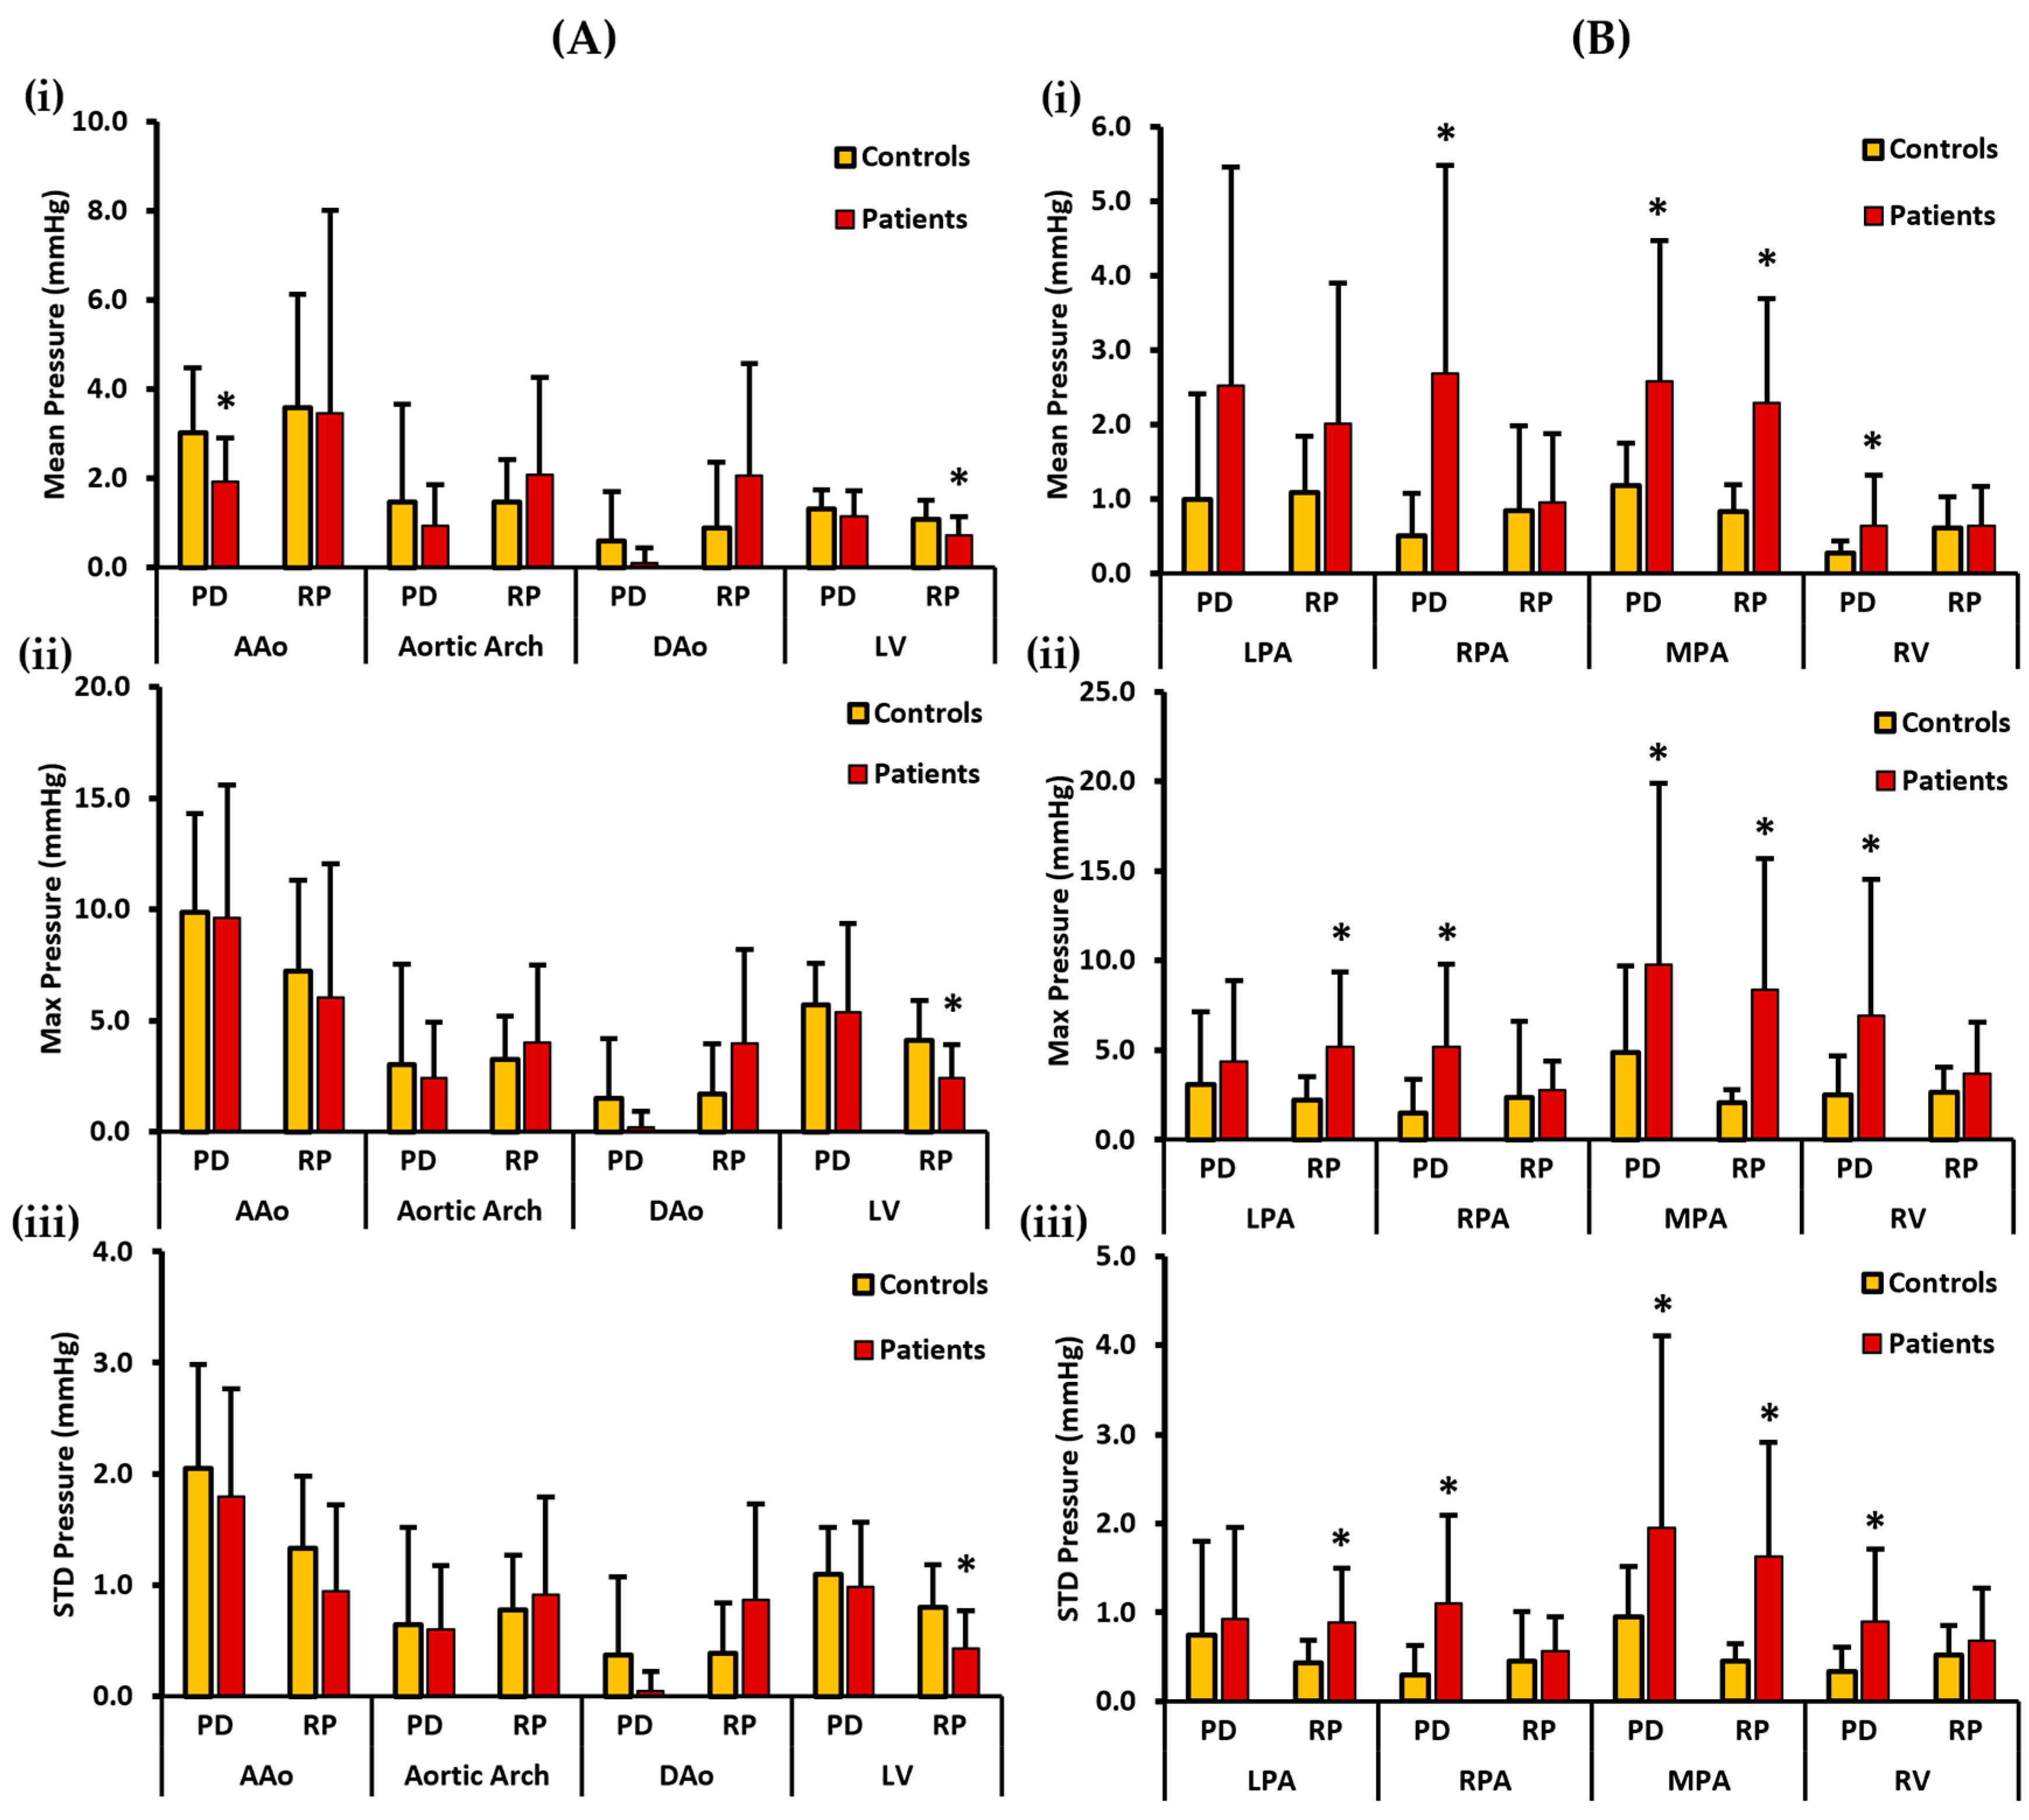
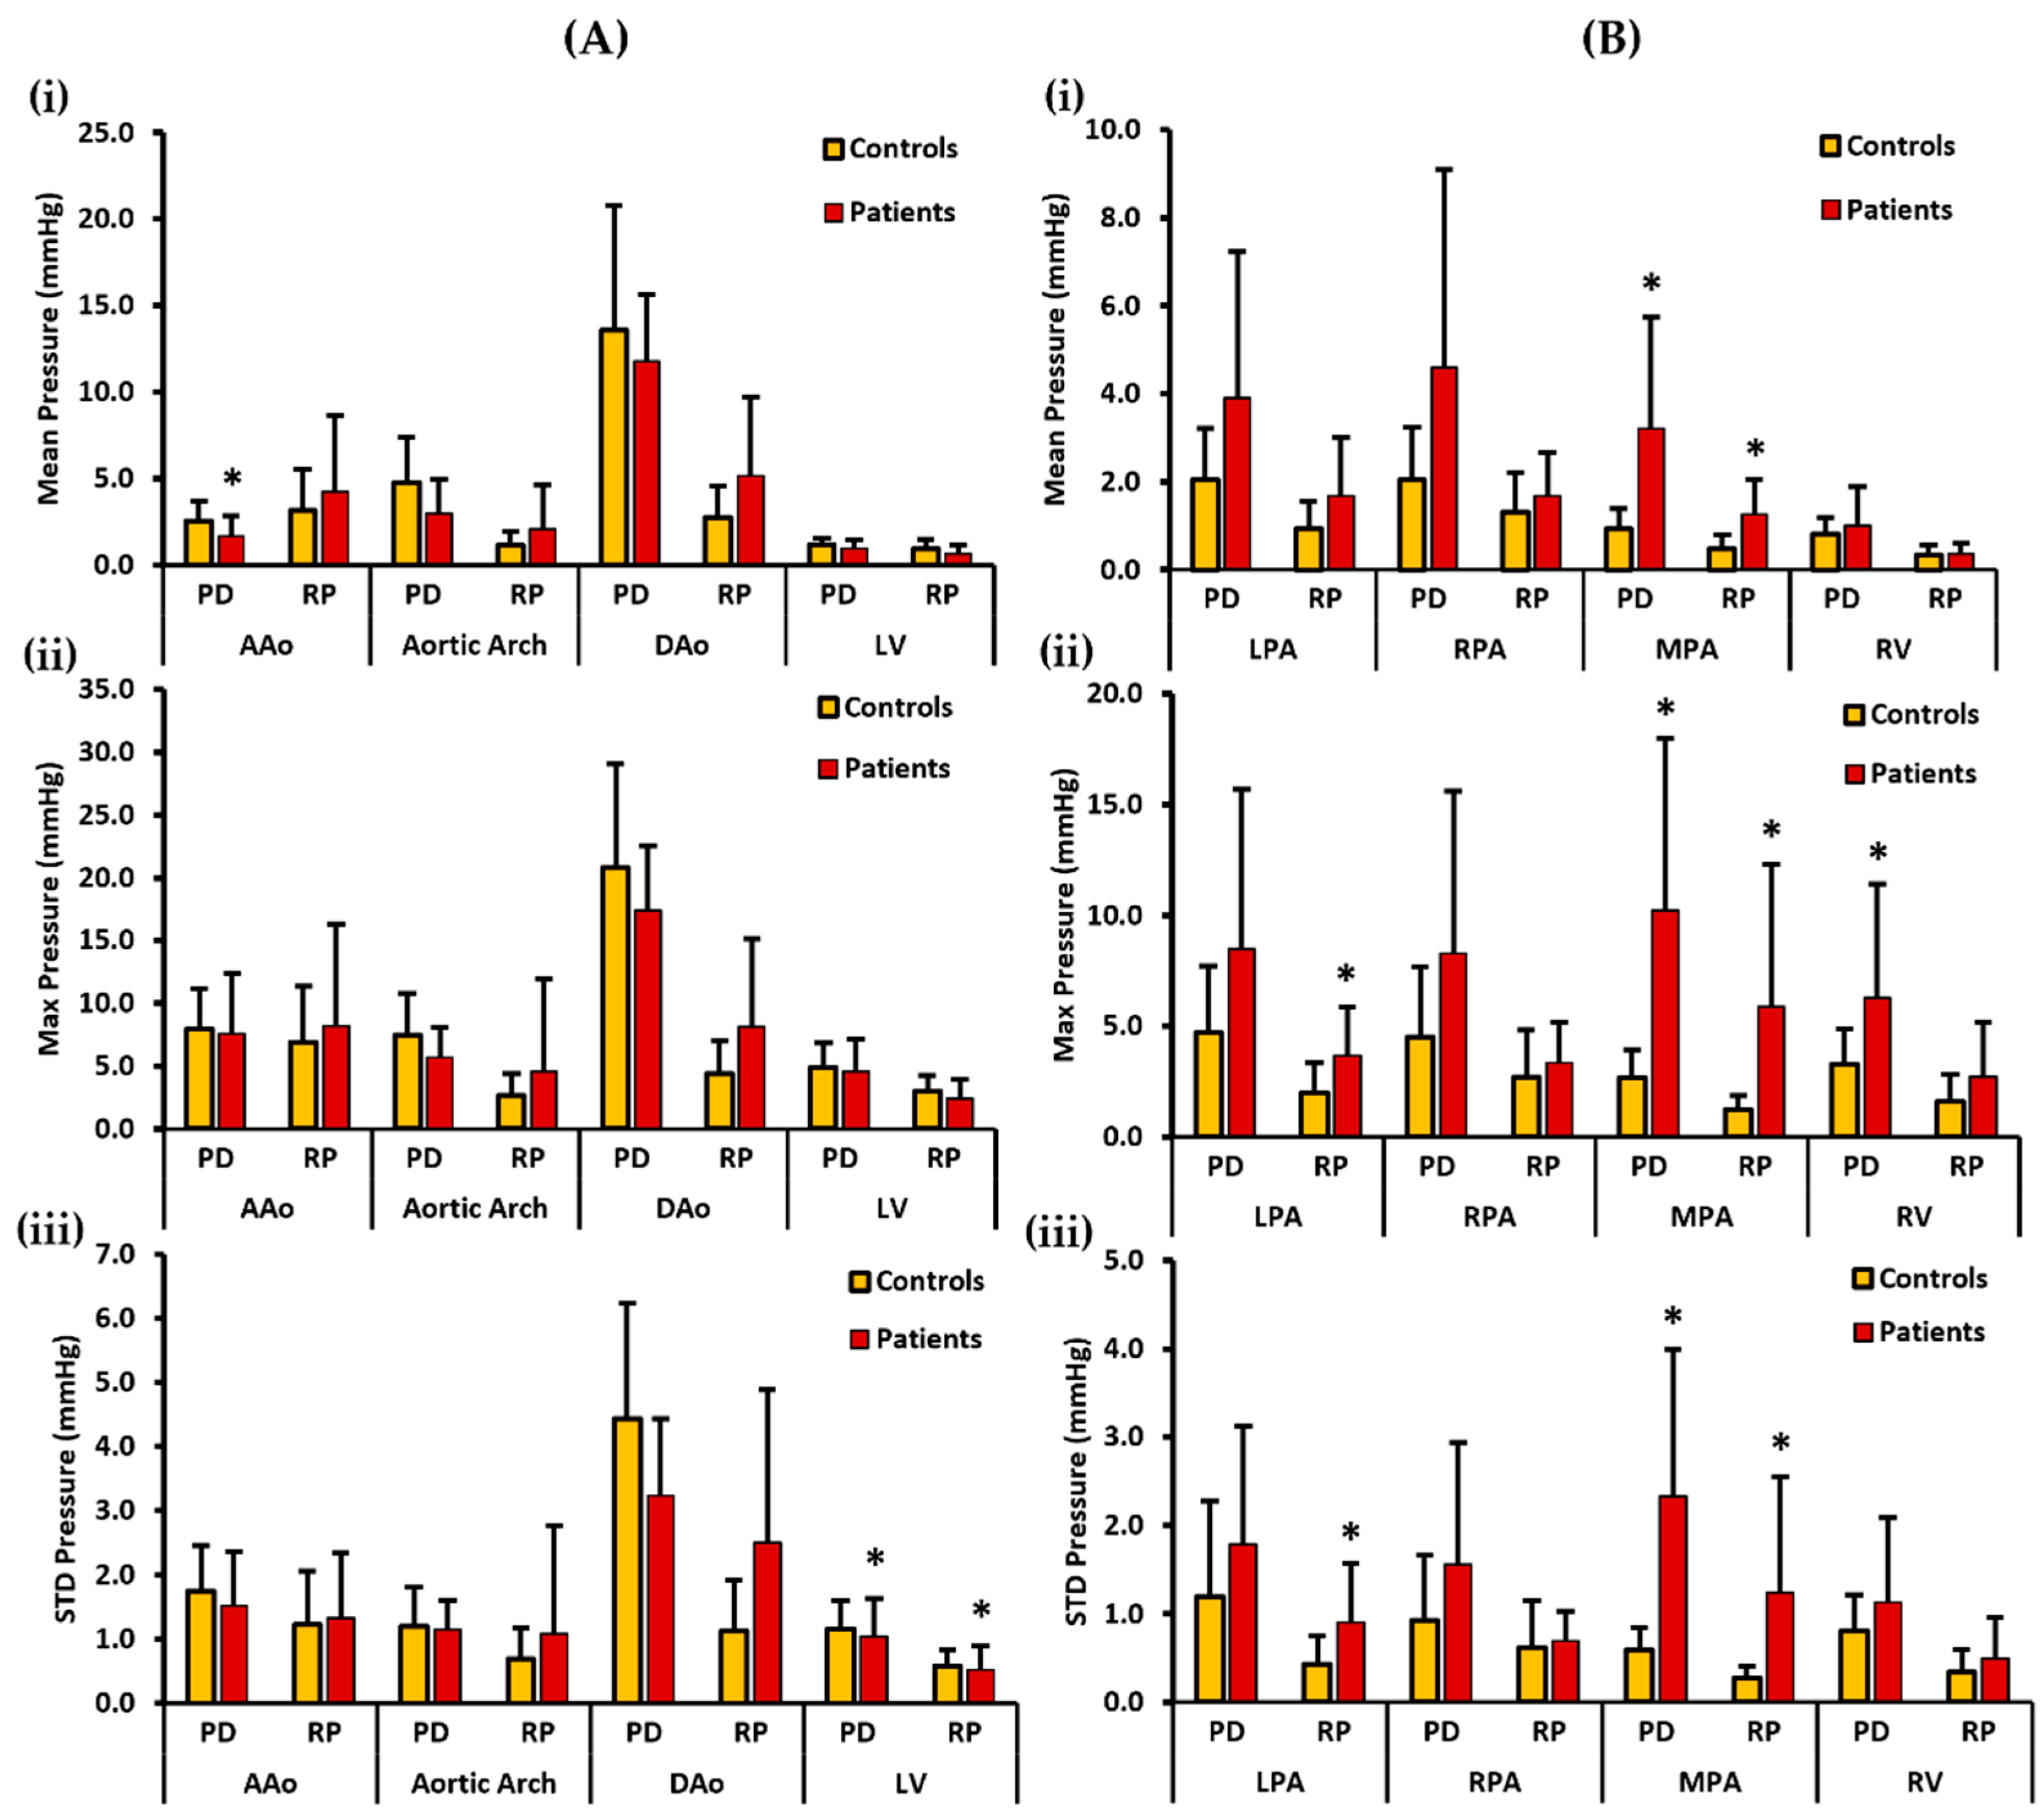
3. Results
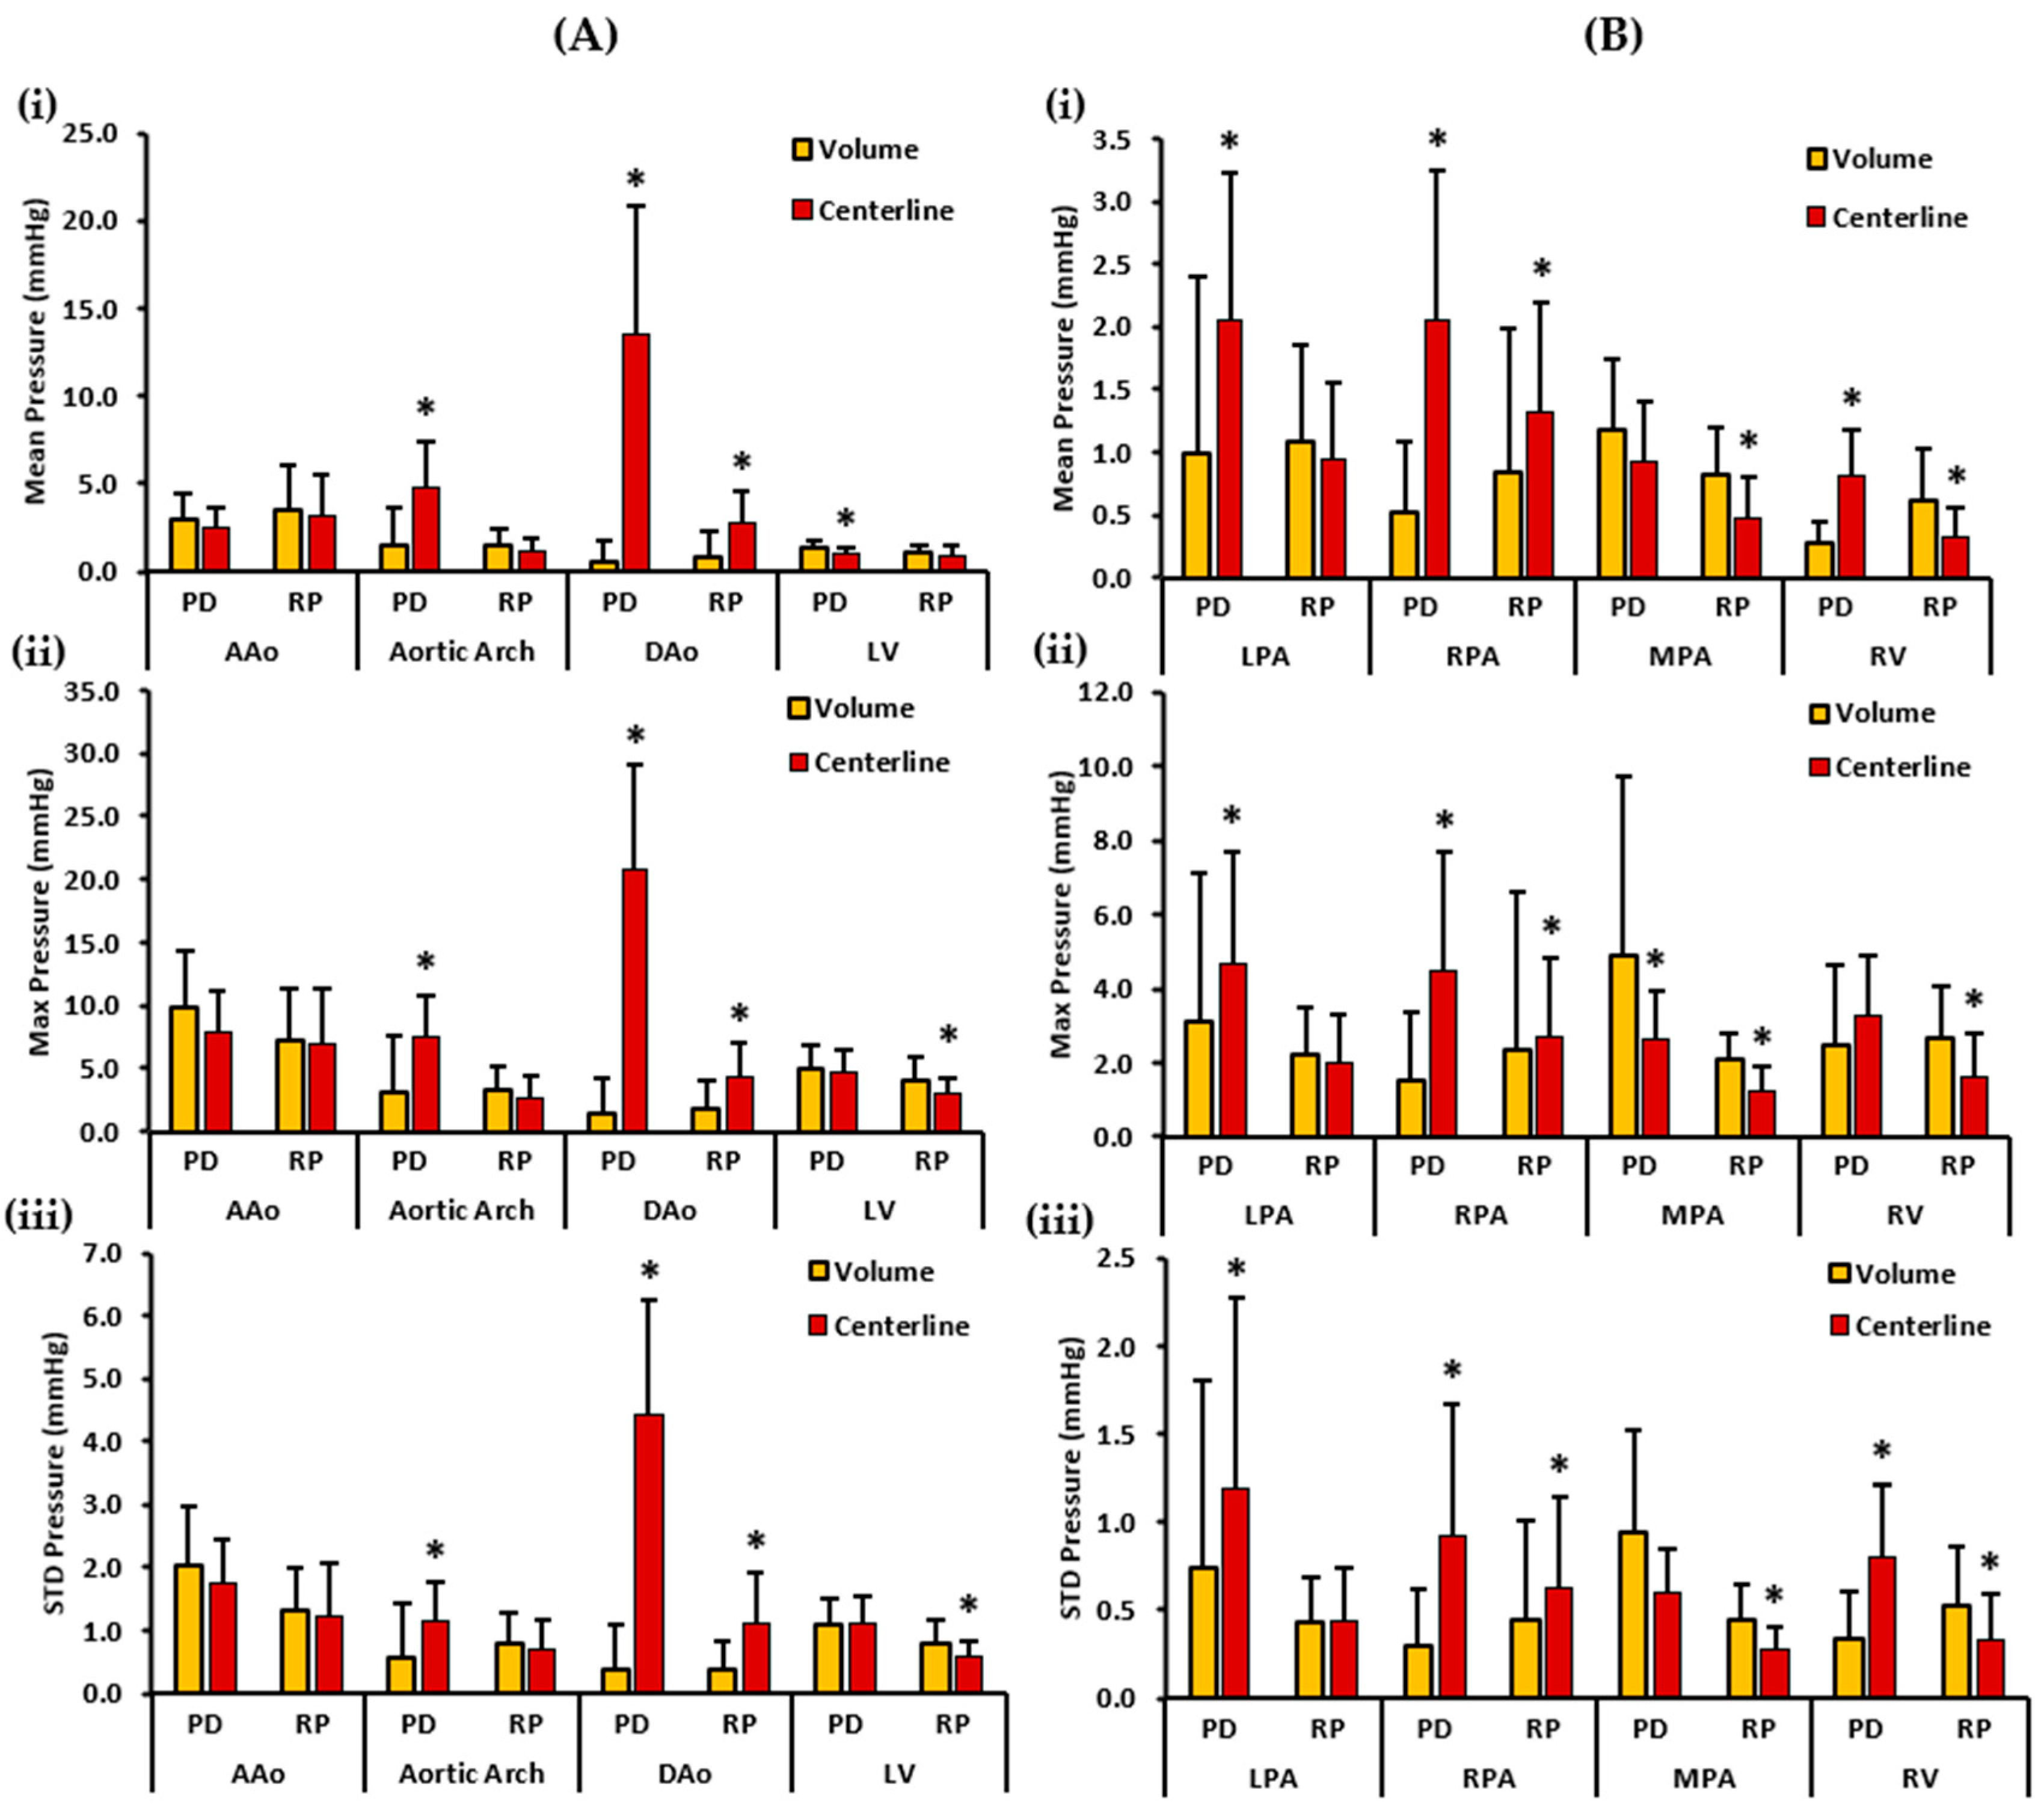
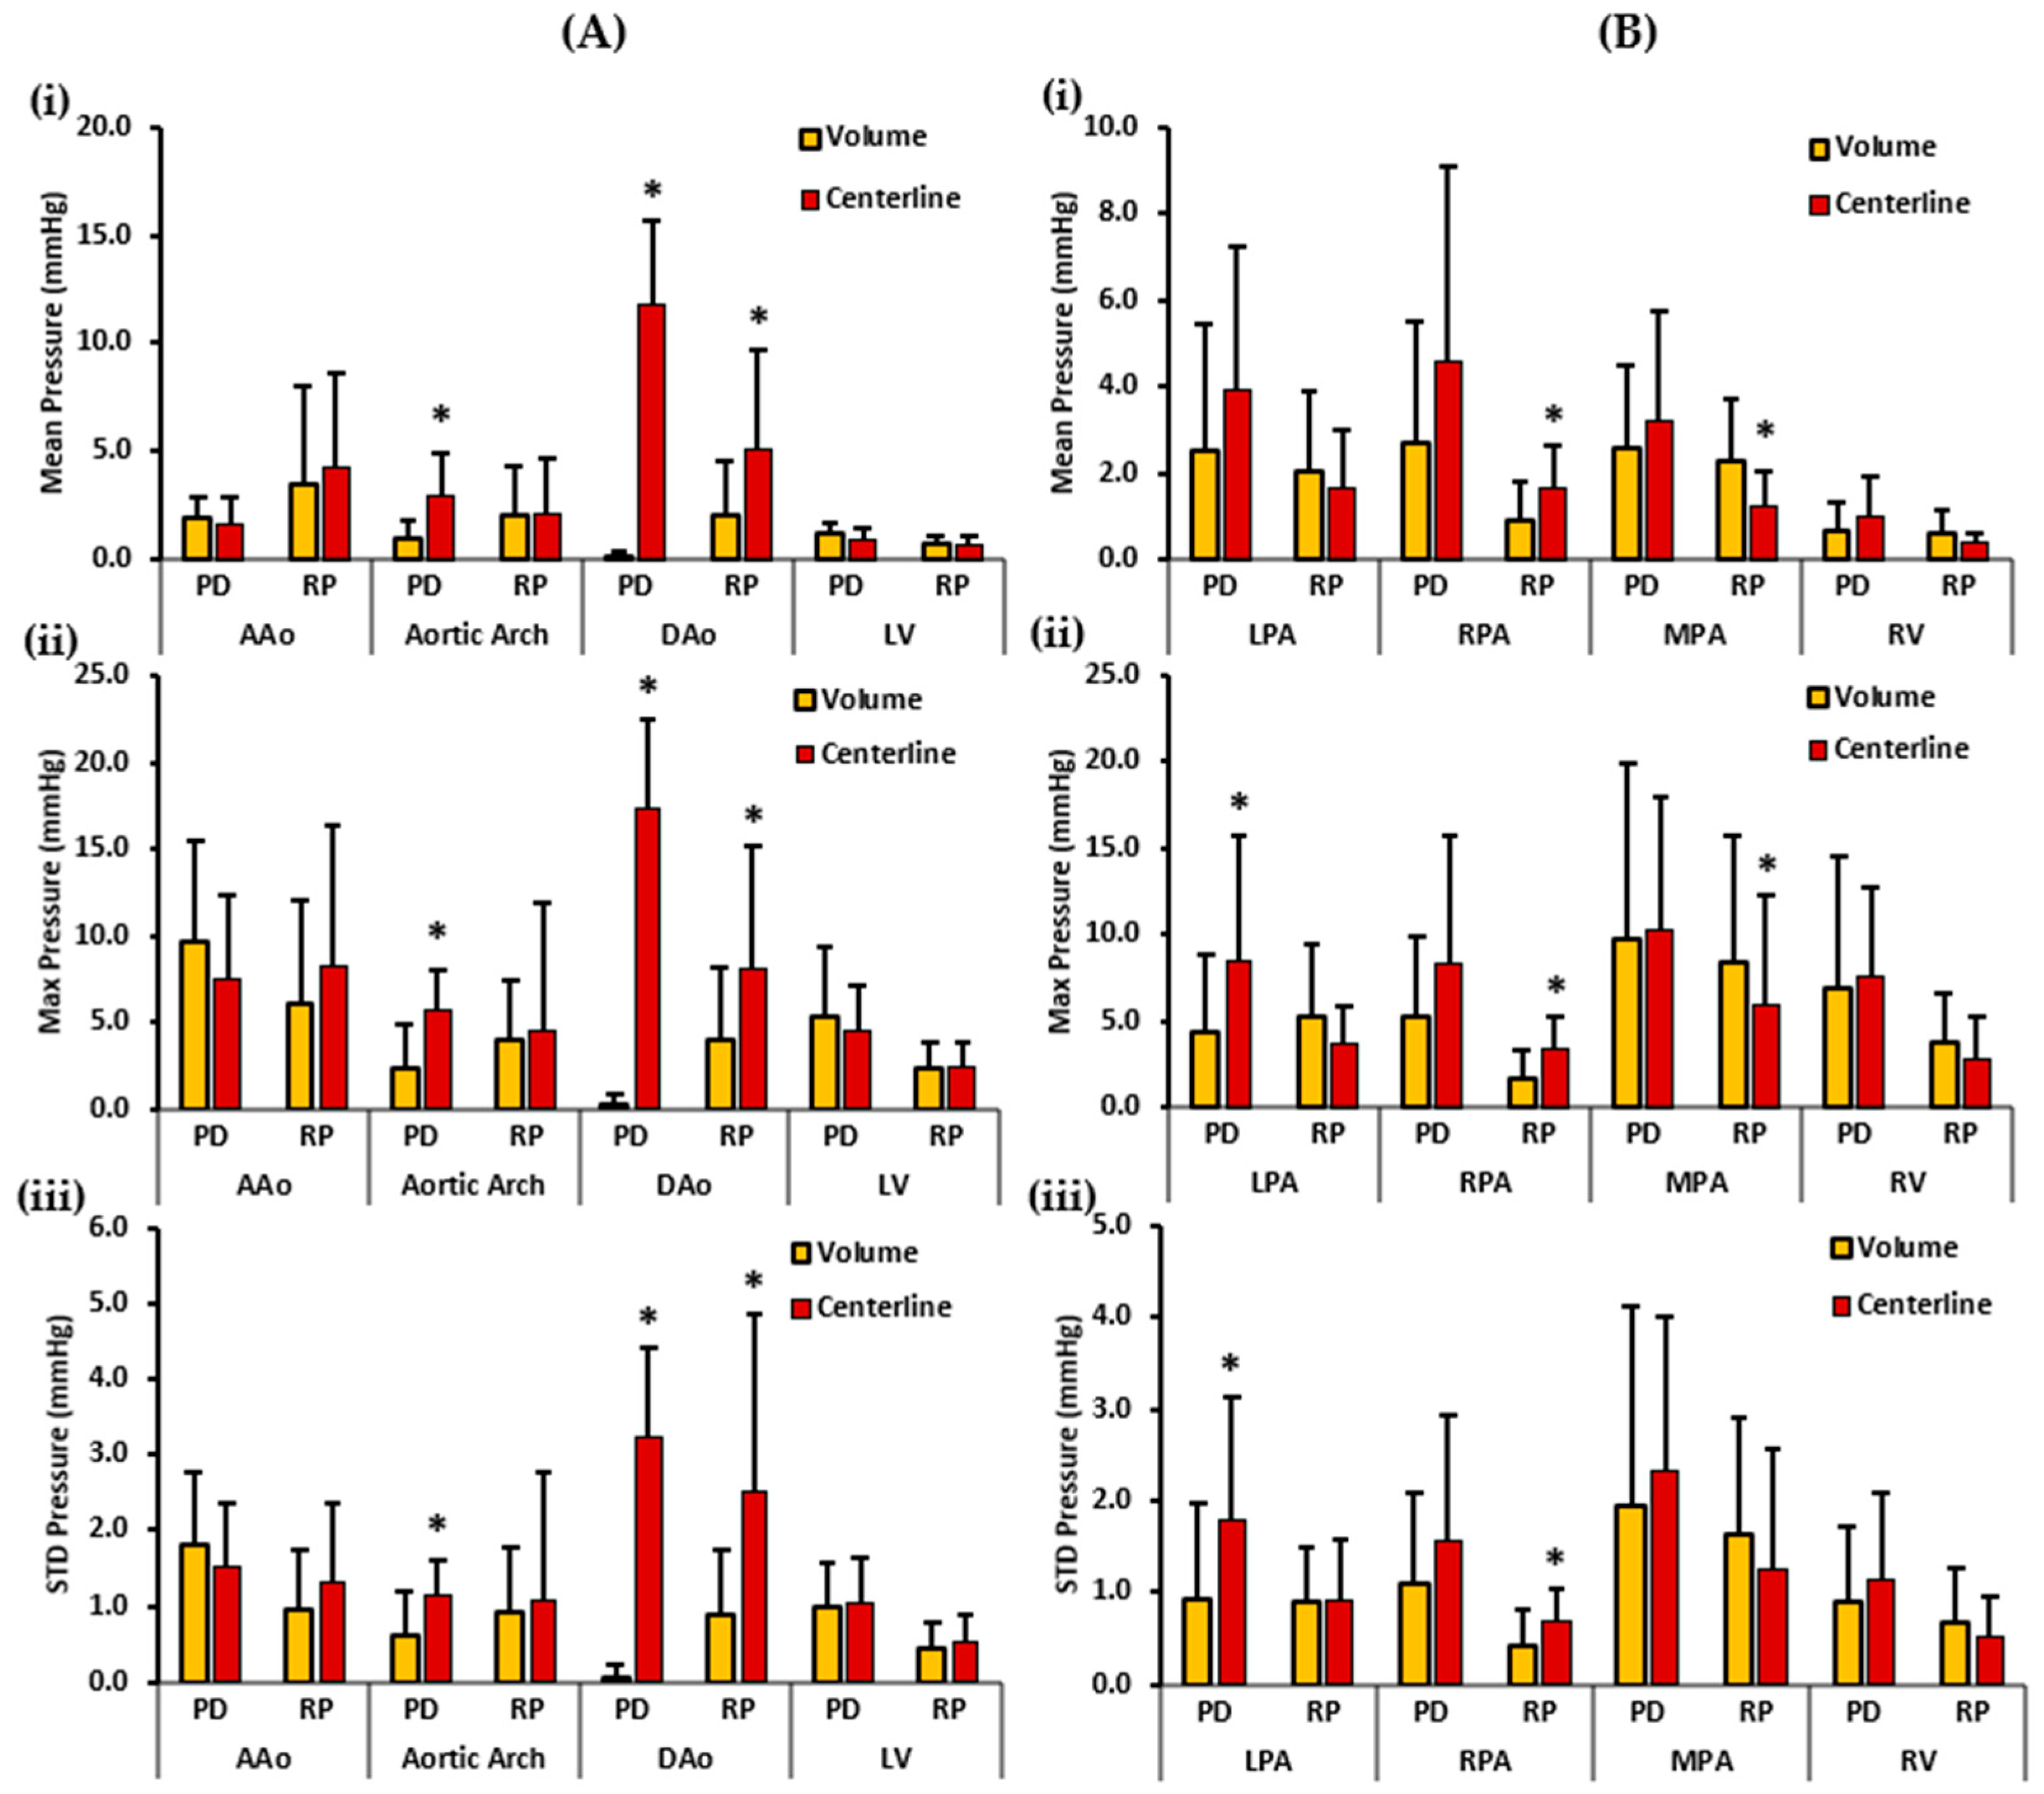
3.1. In Vitro Data
3.2. Patient Characteristics
3.3. In Vivo Data
4. Discussion
5. Conclusions
Supplementary Materials
Author Contributions
Funding
Institutional Review Board Statement
Informed Consent Statement
Data Availability Statement
Conflicts of Interest
References
- Hudani, A.; White, J.A.; Greenway, S.C.; Garcia, J. Whole-Heart Assessment of Turbulent Kinetic Energy in the Repaired Tetralogy of Fallot. Appl. Sci. 2022, 12, 10946. [Google Scholar] [CrossRef]
- Loke, Y.-H.; Capuano, F.; Kollar, S.; Cibis, M.; Kitslaar, P.; Balaras, E.; Reiber, J.H.C.; Pedrizzetti, G.; Olivieri, L. Abnormal Diastolic Hemodynamic Forces: A Link Between Right Ventricular Wall Motion, Intracardiac Flow, and Pulmonary Regurgitation in Repaired Tetralogy of Fallot. Front. Cardiovasc. Med. 2022, 9, 929470. [Google Scholar] [CrossRef] [PubMed]
- Zhuang, B.; Sirajuddin, A.; Zhao, S.; Lu, M. The role of 4D flow MRI for clinical applications in cardiovascular disease: Current status and future perspectives. Quant. Imaging Med. Surg. 2021, 11, 4193–4210. [Google Scholar] [CrossRef] [PubMed]
- van der Ven, J.P.; Bosch, E.V.D.; Bogers, A.J.; Helbing, W.A. Current outcomes and treatment of tetralogy of Fallot. F1000Research 2019, 8, 1530. [Google Scholar] [CrossRef] [PubMed] [Green Version]
- Elsayed, A.; Gilbert, K.; Scadeng, M.; Cowan, B.R.; Pushparajah, K.; Young, A.A. Four-dimensional flow cardiovascular magnetic resonance in tetralogy of Fallot: A systematic review. J. Cardiovasc. Magn. Reson. 2021, 23, 59. [Google Scholar] [CrossRef]
- Vasanawala, S.S.; Hanneman, K.; Alley, M.T.; Hsiao, A. Congenital heart disease assessment with 4D flow MRI. J. Magn. Reson. Imaging 2015, 42, 870–886. [Google Scholar] [CrossRef] [Green Version]
- Warmerdam, E.G.; Krings, G.J.; Leiner, T.; Grotenhuis, H.B. Three-dimensional and four-dimensional flow assessment in congenital heart disease. Heart 2020, 106, 421–426. [Google Scholar] [CrossRef]
- Robinson, J.D.; Rose, M.J.; Joh, M.; Jarvis, K.; Schnell, S.; Barker, A.J.; Rigsby, C.K.; Markl, M. 4-D flow magnetic-resonance-imaging-derived energetic biomarkers are abnormal in children with repaired tetralogy of Fallot and associated with disease severity. Pediatr. Radiol. 2019, 49, 308–317. [Google Scholar] [CrossRef]
- Tsuchiya, N.; Nagao, M.; Shiina, Y.; Miyazaki, S.; Inai, K.; Murayama, S.; Sakai, S. Circulation derived from 4D flow MRI correlates with right ventricular dysfunction in patients with tetralogy of Fallot. Sci. Rep. 2021, 11, 11623. [Google Scholar] [CrossRef]
- Nolte, D.; Urbina, J.; Sotelo, J.; Sok, L.; Montalba, C.; Valverde, I.; Osses, A.; Uribe, S.; Bertoglio, C. Validation of 4D Flow based relative pressure maps in aortic flows. Med. Image Anal. 2021, 74, 102195. [Google Scholar] [CrossRef]
- Bock, J.; Frydrychowicz, A.; Lorenz, R.; Hirtler, D.; Barker, A.J.; Johnson, K.M.; Arnold, R.; Burkhardt, H.; Hennig, J.; Markl, M. In vivo noninvasive 4D pressure difference mapping in the human aorta: Phantom comparison and application in healthy volunteers and patients. Magn. Reson. Med. 2011, 66, 1079–1088. [Google Scholar] [CrossRef]
- Ebbers, T.; Farnebäck, G. Improving computation of cardiovascular relative pressure fields from velocity MRI. J. Magn. Reson. Imaging 2009, 30, 54–61. [Google Scholar] [CrossRef]
- Dyverfeldt, P.; Bissell, M.; Barker, A.J.; Bolger, A.F.; Carlhäll, C.-J.; Ebbers, T.; Francios, C.J.; Frydrychowicz, A.; Geiger, J.; Giese, D.; et al. 4D flow cardiovascular magnetic resonance consensus statement. J. Cardiovasc. Magn. Reson. 2015, 17, 72. [Google Scholar] [CrossRef] [Green Version]
- Stankovic, Z.; Allen, B.D.; Garcia, J.; Jarvis, K.B.; Markl, M. 4D flow imaging with MRI. Cardiovas Diagn Ther 2014, 4, 173–192. [Google Scholar]
- Hudani, A.; Ali, S.I.; Patton, D.; Myers, K.A.; Fine, N.M.; White, J.A.; Greenway, S.; Garcia, J. 4D-Flow MRI Characterization of Pulmonary Flow in Repaired Tetralogy of Fallot. Appl. Sci. 2023, 13, 2810. [Google Scholar] [CrossRef]
- Elbaz, M.S.M.; Scott, M.B.; Barker, A.J.; McCarthy, P.; Malaisrie, C.; Collins, J.D.; Bonow, R.O.; Carr, J.; Markl, M. Four-dimensional Virtual Catheter: Noninvasive Assessment of Intra-aortic Hemodynamics in Bicuspid Aortic Valve Disease. Radiology 2019, 293, 541–550. [Google Scholar] [CrossRef]
- Hatle, L.; Brubakk, A.; Tromsdal, A.; Angelsen, B. Noninvasive assessment of pressure drop in mitral stenosis by Doppler ultrasound. Heart 1978, 40, 131–140. [Google Scholar] [CrossRef] [Green Version]
- Kramer, C.M.; Barkhausen, J.; Bucciarelli-Ducci, C.; Flamm, S.D.; Kim, R.J.; Nagel, E. Standardized cardiovascular magnetic resonance imaging (CMR) protocols: 2020 update. J. Cardiovasc. Magn. Reson. 2020, 22, 17. [Google Scholar] [CrossRef]
- Garcia, J.; Sheitt, H.; Bristow, M.S.; Lydell, C.; Howarth, A.G.; Heydari, B.; Prato, F.S.; Drangova, M.; Thornhill, R.E.; Nery, P.; et al. Left atrial vortex size and velocity distributions by 4D flow MRI in patients with paroxysmal atrial fibrillation: Associations with age and CHA2DS2-VASc risk score. J. Magn. Reson. Imaging 2019, 51, 871–884. [Google Scholar] [CrossRef]
- Geeraert, P.; Jamalidinan, F.; Burns, F.; Jarvis, K.; Bristow, M.S.; Lydell, C.; Tobon, S.S.H.; Alonso, B.D.C.; Fedak, P.W.M.; White, J.A.; et al. Hemodynamic Assessment in Bicuspid Aortic Valve Disease and Aortic Dilation: New Insights From Voxel-By-Voxel Analysis of Reverse Flow, Stasis, and Energetics. Front. Bioeng. Biotechnol. 2022, 9, 725113. [Google Scholar] [CrossRef]
- Hong, Z.M.; Garcia, J. Pulmonary Artery Remodeling and Advanced Hemodynamics: Magnetic Resonance Imaging Biomarkers of Pulmonary Hypertension. Appl. Sci. 2022, 12, 3518. [Google Scholar] [CrossRef]
- Bock, M.; Kreher, J.; Hennig, B.; Markl, J. Optimized Pre-Processing of Time-Resolved 2 D and 3 D Phase Contrast MRI Data. In Proceedings of the 15th Annual Meeting of ISMRM, Berlin, Germany, 19–25 May 2007. [Google Scholar]
- Garcia, J.; Markl, M.; Schnell, S.; Allen, B.; Entezari, P.; Mahadevia, R.; Malaisrie, S.C.; Pibarot, P.; Carr, J.; Barker, A.J. Evaluation of aortic stenosis severity using 4D flow jet shear layer detection for the measurement of valve effective orifice area. Magn. Reson. Imaging 2014, 32, 891–898. [Google Scholar] [CrossRef] [PubMed] [Green Version]
- Donati, F.; Figueroa, C.A.; Smith, N.P.; Lamata, P.; Nordsletten, D.A. Non-invasive pressure difference estimation from PC-MRI using the work-energy equation. Med. Image Anal. 2015, 26, 159–172. [Google Scholar] [CrossRef] [PubMed] [Green Version]
- Hassanabad, A.F.; Burns, F.; Bristow, M.S.; Lydell, C.; Howarth, A.G.; Heydari, B.; Gao, X.; Fedak, P.W.; White, J.A.; Garcia, J. Pressure drop mapping using 4D flow MRI in patients with bicuspid aortic valve disease: A novel marker of valvular obstruction. Magn. Reson. Imaging 2020, 65, 175–182. [Google Scholar] [CrossRef] [PubMed]
- Munson, B.; Yound, D.; Okiishi, T.; Huebsch, W. Fundamentals of Fluid Mechanics, 6th ed.; Wiley: Hoboken, NJ, USA, 2009. [Google Scholar]
- Hsiao, A.; Alley, M.T.; Massaband, P.; Herfkens, R.J.; Chan, F.P.; Vasanawala, S.S. Improved cardiovascular flow quantification with time-resolved volumetric phase-contrast MRI. Pediatr. Radiol. 2011, 41, 711–720. [Google Scholar] [CrossRef] [Green Version]
- Gabbour, M.; Schnell, S.; Jarvis, K.; Robinson, J.; Markl, M.; Rigsby, C.K. 4-D flow magnetic resonance imaging: Blood flow quantification compared to 2-D phase-contrast magnetic resonance imaging and Doppler echocardiography. Pediatr. Radiol. 2015, 45, 804–813. [Google Scholar] [CrossRef] [Green Version]
- Rizk, J. 4D flow MRI applications in congenital heart disease. Eur. Radiol. 2021, 31, 1160–1174. [Google Scholar] [CrossRef]
- Baumgartner, H.; Hung, J.; Bermejo, J.; Chambers, J.B.; Evangelista, A.; Griffin, B.P.; Iung, B.; Otto, C.M.; Pellikka, P.A.; Quiñones, M. Echocardiographic Assessment of Valve Stenosis: EAE/ASE Recommendations for Clinical Practice. J. Am. Soc. Echocardiogr. 2008, 22, 1–23. [Google Scholar] [CrossRef]
- Nishimura, R.A.; Otto, C.M.; Bonow, R.O.; Carabello, B.A.; Erwin, J.P.; Guyton, R.A.; O’gara, P.T.; Ruiz, C.E.; Skubas, N.J.; Sorajja, P.; et al. 2014 AHA/ACC Guideline for the Management of Patients With Valvular Heart Disease: Executive Summary. Circulation 2014, 129, 2440–2492. [Google Scholar] [CrossRef]
- Kazemi, A.; Padgett, D.A.; Callahan, S.; Stoddard, M.; Amini, A.A. Relative pressure estimation from 4D flow MRI using generalized Bernoulli equation in a phantom model of arterial stenosis. Magn. Reson. Mater. Phys. Biol. Med. 2022, 35, 733–748. [Google Scholar] [CrossRef]
- Yoganathan, A.P.; Valdes-Cruz, L.M.; Schmidt-Dohna, J.; Jimoh, A.; Berry, C.; Tamura, T.; Sahn, D.J. Doppler Echocardiography Continuous-wave Doppler velocities and gradients across fixed tunnel obstructions: Studies in vitro and in vivo. Circulation 1987, 76, 657–666. [Google Scholar] [CrossRef] [Green Version]
- Donati, F.; Myerson, S.; Bissell, M.M.; Smith, N.P.; Neubauer, S.; Monaghan, M.J.; Nordsletten, D.A.; Lamata, P. Beyond Bernoulli Improving the Accuracy and Precision of Non-invasive Estimation of Peak Pressure Drops. Circ. Cardiovasc. Imaging 2017, 10, e005207. [Google Scholar] [CrossRef] [Green Version]
- Pibarot, P.; Garcia, D.; Dumesnil, J.G. Energy loss index in aortic stenosis. Circulation 2013, 127, 1101–1104. [Google Scholar] [CrossRef] [Green Version]
- Geeraert, P.; Jamalidinan, F.; Hassanabad, A.F.; Sojoudi, A.; Bristow, M.; Lydell, C.; Fedak, P.W.; White, J.A.; Garcia, J. Bicuspid aortic valve disease is associated with abnormal wall shear stress, viscous energy loss, and pressure drop within the ascending thoracic aorta. Medicine 2021, 100, e26518. [Google Scholar] [CrossRef]
- Bach, D.S. Echo/Doppler Evaluation of Hemodynamics after Aortic Valve Replacement: Principles of Interrogation and Evaluation of High Gradients. JACC Cardiovasc. Imaging 2010, 3, 296–304. [Google Scholar] [CrossRef] [Green Version]
- Reddy, Y.N.V.; Miranda, W.R.; Nishimura, R.A. Measuring Pressure Gradients after Transcatheter Aortic Valve Implantation: Rethinking the Bernoulli Principle. J. Am. Heart Assoc. 2021, 10, e022515. [Google Scholar] [CrossRef]
- Levine, R.A.; Jimoh, A.; Cape, E.G.; McMillan, S.; Yoganathan, A.P.; Weyman, A.E. “Seminar on in vitro studies of cardiac flow and their applications for clinical doppler echocardiography-III” Pressure recovery distal to a stenosis: Potential cause of gradient “verestimation” by Doppler echocardiography. J. Am. Coll. Cardiol. 1989, 13, 706–715. [Google Scholar] [CrossRef]
- Casas, B.; Lantz, J.; Dyverfeldt, P.; Ebbers, T. 4D Flow MRI-based pressure loss estimation in stenotic flows: Evaluation using numerical simulations. Magn. Reson. Med. 2016, 75, 1808–1821. [Google Scholar] [CrossRef]
- White, F.M. Viscous Fluid Flow, 2nd ed.; McGraw-Hill: New York, NY, USA, 1991. [Google Scholar]
- Urbina, J.; Sotelo, J.; Andía, M.; Tejos, C.; Hurtado, D.; Irarrázabal, P.; Uribe, S. Relative pressure measurement in thoracic aorta and pulmonary artery of healthy volunteers and repaired Tetralogy of Fallot patients using the 4D Flow sequence of cardiac magnetic resonance. Rev. Chil. De Radiol. 2012, 18, 157–162. [Google Scholar]
- Kilner, P.J. Imaging congenital heart disease in adults. Br. J. Radiol. 2011, 84, S258–S268. [Google Scholar] [CrossRef]
- Valbuena-López, S.; Refoyo, E.; Rosillo, S.; Guzmán, G. Advanced Cardiovascular Magnetic Resonance Techniques in Grown-Up Congenital Heart Disease. Curr. Cardiovasc. Imaging Rep. 2018, 11, 9. [Google Scholar] [CrossRef]
- Geva, T. Repaired tetralogy of Fallot: The roles of cardiovascular magnetic resonance in evaluating pathophysiology and for pulmonary valve replacement decision support. J. Cardiovasc. Magn. Reson. 2011, 13, 9. [Google Scholar] [CrossRef] [Green Version]
- Garcia, J.; Barker, A.J.; Markl, M. The Role of Imaging of Flow Patterns by 4D Flow MRI in Aortic Stenosis. JACC: Cardiovasc. Imaging 2019, 12, 252–266. [Google Scholar] [CrossRef] [PubMed]
- François, C.J.; Srinivasan, S.; Schiebler, M.L.; Reeder, S.B.; Niespodzany, E.; Landgraf, B.R.; Wieben, O.; Frydrychowicz, A. 4D cardiovascular magnetic resonance velocity mapping of alterations of right heart flow patterns and main pulmonary artery hemodynamics in tetralogy of Fallot. J. Cardiovasc. Magn. Reson. 2012, 14, 16. [Google Scholar] [CrossRef] [PubMed] [Green Version]
- Ota, H.; Higuchi, S.; Sun, W.; Ueda, T.; Takase, K.; Tamura, H. Four-Dimensional Flow Magnetic Resonance Imaging for Cardiovascular Imaging: From Basic Concept to Clinical Application. Cardiovasc. Imaging Asia 2018, 2, 85–96. [Google Scholar] [CrossRef] [Green Version]
- Schäfer, M.; Browne, L.P.; Morgan, G.J.; Barker, A.J.; Fonseca, B.; Ivy, D.; Mitchell, M.B. Reduced proximal aortic compliance and elevated wall shear stress after early repair of tetralogy of Fallot. J. Thorac. Cardiovasc. Surg. 2018, 156, 2239–2249. [Google Scholar] [CrossRef]
- Hirtler, D.; Garcia, J.; Barker, A.; Geiger, J. Assessment of intracardiac flow and vorticity in the right heart of patients after repair of tetralogy of Fallot by flow-sensitive 4D MRI. Eur. Radiol. 2016, 26, 3598–3607. [Google Scholar] [CrossRef]
- Hu, L.; Ouyang, R.; Sun, A.; Wang, Q.; Guo, C.; Peng, Y.; Qin, Y.; Zhang, Y.; Xiang, Y.; Zhong, Y. Pulmonary artery hemodynamic assessment of blood flow characteristics in repaired tetralogy of Fallot patients versus healthy child volunteers. Quant. Imaging Med. Surg. 2020, 10, 921–933. [Google Scholar] [CrossRef]
- Jeong, D.; Anagnostopoulos, P.V.; Roldan-Alzate, A.; Srinivasan, S.; Schiebler, M.; Wieben, O.; François, C.J. Ventricular kinetic energy may provide a novel noninvasive way to assess ventricular performance in patients with repaired tetralogy of Fallot. J. Thorac. Cardiovasc. Surg. 2015, 149, 1339–1347. [Google Scholar] [CrossRef] [Green Version]
- Jeong, D.; Roldan-Alzate, A.; François, C.J. Right ventricular kinetic energy: 4D flow MRI analysis of healthy volunteers and repaired Tetralogy of Fallot. J. Cardiovasc. Magn. Reson. 2014, 16, O46. [Google Scholar] [CrossRef] [Green Version]
- Latus, H.; Stammermann, J.; Voges, I.; Waschulzik, B.; Gutberlet, M.; Diller, G.; Schranz, D.; Ewert, P.; Beerbaum, P.; Kühne, T.; et al. Impact of Right Ventricular Pressure Load After Repair of Tetralogy of Fallot. J. Am. Heart Assoc. 2022, 11, e022694. [Google Scholar] [CrossRef]
- Markl, M.; Schnell, S.; Barker, A. 4D Flow Imaging: Current Status to Future Clinical Applications. Curr. Cardiol. Rep. 2014, 16, 481. [Google Scholar] [CrossRef]
- Rose, M.J.; Jarvis, K.; Chowdhary, V.; Barker, A.J.; Allen, B.D.; Robinson, J.D.; Markl, M.; Rigsby, C.K.; Schnell, S. Efficient method for volumetric assessment of peak blood flow velocity using 4D flow MRI. J. Magn. Reson. Imaging 2016, 44, 1673–1682. [Google Scholar] [CrossRef] [Green Version]
- Ha, H.; Kim, G.B.; Kweon, J.; Kim, Y.-H.; Kim, N.; Yang, D.H.; Lee, S.J. Multi-VENC acquisition of four-dimensional phase-contrast MRI to improve precision of velocity field measurement. Magn. Reson. Med. 2016, 75, 1909–1919. [Google Scholar] [CrossRef]
- Brindise, M.C.; Rothenberger, S.; Dickerhoff, B.; Schnell, S.; Markl, M.; Saloner, D.; Rayz, V.L.; Vlachos, P.P. Multi-modality cerebral aneurysm haemodynamic analysis: In vivo 4D flow MRI, in vitro volumetric particle velocimetry and in silico computational fluid dynamics. J. R. Soc. Interface 2019, 16, 20190465. [Google Scholar] [CrossRef] [Green Version]
- Medero, R.; Falk, K.; Rutkowski, D.; Johnson, K.; Roldán-Alzate, A. In Vitro Assessment of Flow Variability in an Intracranial Aneurysm Model Using 4D Flow MRI and Tomographic PIV. Ann. Biomed. Eng. 2020, 48, 2484–2493. [Google Scholar] [CrossRef]
- Kitajima, H.D.; Sundareswaran, K.S.; Teisseyre, T.Z.; Astary, G.W.; Parks, W.J.; Skrinjar, O.; Oshinski, J.N.; Yoganathan, A.P. Comparison of Particle Image Velocimetry and Phase Contrast MRI in a Patient-Specific Extracardiac Total Cavopulmonary Connection. J. Biomech. Eng. 2008, 130, 041004. [Google Scholar] [CrossRef]
- Zhong, L.; Schrauben, E.M.; Garcia, J.; Uribe, S.; Grieve, S.M.; Elbaz, M.S.; Barker, A.J.; Geiger, J.; Nordmeyer, S.; Marsden, A.; et al. Intracardiac 4D Flow MRI in Congenital Heart Disease: Recommendations on Behalf of the ISMRM Flow & Motion Study Group. J. Magn. Reson. Imaging 2019, 50, 677–681. [Google Scholar] [CrossRef]
- García, J.; LaRose, E.; Pibarot, P.; Kadem, L. On the Evaluation of Vorticity Using Cardiovascular Magnetic Resonance Velocity Measurements. J. Biomech. Eng. 2013, 135, 124501. [Google Scholar] [CrossRef] [Green Version]
- Sotelo, J.; Urbina, J.; Valverde, I.; Mura, J.; Tejos, C.; Irarrazaval, P.; Andia, M.E.; Hurtado, D.E.; Uribe, S. Three-dimensional quantification of vorticity and helicity from 3D cine PC-MRI using finite-element interpolations. Magn. Reson. Med. 2018, 79, 541–553. [Google Scholar] [CrossRef]
- Fukuyama, A.; Isoda, H.; Morita, K.; Mori, M.; Watanabe, T.; Ishiguro, K.; Komori, Y.; Kosugi, T. Influence of Spatial Resolution in Three-dimensional Cine Phase Contrast Magnetic Resonance Imaging on the Accuracy of Hemodynamic Analysis. Magn. Reson. Med. Sci. 2017, 16, 311–316. [Google Scholar] [CrossRef] [PubMed] [Green Version]
- Sadeghi, R.; Tomka, B.; Khodaei, S.; Daeian, M.; Gandhi, K.; Garcia, J.; Keshavarz-Motamed, Z. Impact of extra-anatomical bypass on coarctation fluid dynamics using patient-specific lumped parameter and Lattice Boltzmann modeling. Sci. Rep. 2022, 12, 9718. [Google Scholar] [CrossRef] [PubMed]
- Canstein, C.; Cachot, P.; Faust, A.; Stalder, A.; Bock, J.; Frydrychowicz, A.; Küffer, J.; Hennig, J.; Markl, M. 3D MR flow analysis in realistic rapid-prototyping model systems of the thoracic aorta: Comparison with in vivo data and computational fluid dynamics in identical vessel geometries. Magn. Reson. Med. 2008, 59, 535–546. [Google Scholar] [CrossRef] [PubMed]
- Lamata, P.; Pitcher, A.; Krittian, S.; Nordsletten, D.; Bissell, M.; Cassar, T.; Barker, A.; Markl, M.; Neubauer, S.; Smith, N.P. Aortic relative pressure components derived from four-dimensional flow cardiovascular magnetic resonance. Magn. Reson. Med. 2014, 72, 1162–1169. [Google Scholar] [CrossRef]
- Fathi, M.F.; Perez-Raya, I.; Baghaie, A.; Berg, P.; Janiga, G.; Arzani, A.; D’souza, R.M. Super-resolution and denoising of 4D-Flow MRI using physics-Informed deep neural nets. Comput. Methods Programs Biomed. 2020, 197, 105729. [Google Scholar] [CrossRef]


| Characteristic | Patients (n = 18) | Controls (n = 18) | p-Value |
|---|---|---|---|
| Age at scan (year) | 32 ± 10 | 37 ± 14 | 0.39 |
| Sex (f/m) | 6/12 | 7/11 | 0.73 |
| BSA (m2) | 1.87 ± 0.19 | 1.88 ± 0.32 | 0.83 |
| HR (bpm) | 73 ± 10 | 67 ± 12 | 0.08 |
| BP systolic (mmHg) | 109 ± 8 | 107 ± 12 | 0.63 |
| BP diastolic (mmHg) | 60 ± 10 | 58 ± 12 | 0.40 |
| LVEF (%) | 58 ± 9 | 61 ± 3 | 0.11 |
| LVEDV (mL) | 151 ± 41 | 132 ± 49 | 0.14 |
| LVEDVi (mL/m2) | 80 ± 17 | 110 ± 48 | 0.09 |
| LVESV (mL) | 65 ± 26 | 52 ± 20 | 0.10 |
| LVESVi (mL/m2) | 35 ± 13 | 43 ± 19 | 0.26 |
| RVEF (%) | 46 ± 10 | 56 ± 4 | 0.00 |
| RVEDV (mL) | 253 ± 95 | 172 ± 60 | 0.02 |
| RVEDVi (mL/m2) | 135 ± 47 | 88 ± 20 | 0.00 |
| RVESV (mL) | 142 ± 74 | 77 ± 31 | 0.01 |
| RVESVi (mL/m2) | 76 ± 39 | 39 ± 12 | <0.001 |
Disclaimer/Publisher’s Note: The statements, opinions and data contained in all publications are solely those of the individual author(s) and contributor(s) and not of MDPI and/or the editor(s). MDPI and/or the editor(s) disclaim responsibility for any injury to people or property resulting from any ideas, methods, instructions or products referred to in the content. |
© 2023 by the authors. Licensee MDPI, Basel, Switzerland. This article is an open access article distributed under the terms and conditions of the Creative Commons Attribution (CC BY) license (https://creativecommons.org/licenses/by/4.0/).
Share and Cite
Ihsan Ali, S.; Patton, D.; Myers, K.A.; Garcia, J. Repaired Tetralogy of Fallot Pressure Assessment: Insights from 4D-Flow Pressure Mapping. Fluids 2023, 8, 196. https://doi.org/10.3390/fluids8070196
Ihsan Ali S, Patton D, Myers KA, Garcia J. Repaired Tetralogy of Fallot Pressure Assessment: Insights from 4D-Flow Pressure Mapping. Fluids. 2023; 8(7):196. https://doi.org/10.3390/fluids8070196
Chicago/Turabian StyleIhsan Ali, Safia, David Patton, Kimberley A. Myers, and Julio Garcia. 2023. "Repaired Tetralogy of Fallot Pressure Assessment: Insights from 4D-Flow Pressure Mapping" Fluids 8, no. 7: 196. https://doi.org/10.3390/fluids8070196