Article

Hemodynamic Investigation of the Flow Diverter Treatment of Intracranial Aneurysm

by
Maria Antonietta Boniforti
*,
Roberto Magini
and
Tania Orosco Salinas
Department of Civil, Building, and Environmental Engineering, Sapienza University, 00184 Rome, Italy
*
Author to whom correspondence should be addressed.
Fluids 2023, 8(7), 189; https://doi.org/10.3390/fluids8070189
Submission received: 12 June 2023 / Revised: 20 June 2023 / Accepted: 22 June 2023 / Published: 24 June 2023
(This article belongs to the Special Issue Image-Based Computational and Experimental Biomedical Flows)

Abstract

:
Flow diverter stents (FDS) are increasingly used for the treatment of complex intracranial aneurysms such as fusiform, giant, or wide-neck aneurysms. The primary goal of these devices is to reconstruct the diseased vascular segment by diverting blood flow from the aneurysm. The resulting intra-aneurysmal flow reduction promotes progressive aneurysm thrombosis and healing of the disease. In the present study, a numerical investigation was performed for modeling blood flow inside a patient-specific intracranial aneurysm virtually treated with FDS. The aim of the study is to investigate the effects of FDS placement prior to the actual endovascular treatment and to compare the effectiveness of devices differing in porosity. Numerical simulations were performed under pulsatile flow conditions, taking into account the non-Newtonian behavior of blood. Two possible post-operative conditions with virtual stent deployment were simulated. Hemodynamic parameters were calculated and compared between the pre-operative (no stent placement) and post-operative (virtual stent placement) aneurysm models. FDS placement significantly reduced intra-aneurysmal flow velocity and increased the Relative Residence Time (RRT) on the aneurysm, thus promoting thrombus formation within the dilatation and aneurysm occlusion. The results highlighted an increase in the effectiveness of FDS as its porosity increased. The proposed analysis provides pre-operative knowledge on the impact of FDS on intracranial hemodynamics, allowing the selection of the most effective treatment for the specific patient.

1. Introduction

Intracranial aneurysms (IA) are pathological dilatations of the arterial wall in the intracranial vasculature, most frequently observed in curves and bifurcations in the circle of Willis. They have a 3–5% incidence in the adult population [1].
Based on their shape, they are categorized into saccular and non-saccular types. Most IA remain asymptomatic during the lifetime of the patients. Nevertheless, if they rupture, subarachnoid hemorrhage occurs, which is associated with a high mortality and morbidity rate [2].
The evaluation of the risk of intracranial aneurysm rupture is still difficult and controversial. Several studies have suggested that hemodynamic changes associated with arterial dilatation might play an important role in aneurysm rupture. Many hemodynamic parameters have been correlated with the growth and rupture of the cerebral aneurysm, including low and/or high wall shear stress (WSS) and blood recirculation [3]. During the cardiac cycle, the luminal arterial surface is constantly subjected to the action of shear stress as a result of the blood flow. The temporal and spatial variations in WSS significantly affect the rates at which endothelial cells are remodeled, so that they are hypothesized to be associated with the growth and rupture of the intracranial aneurysm [4,5,6]. Conventionally, these vascular lesions were treated by surgical clipping or endovascular coiling. Insertion of coils promotes blood coagulation inside the aneurysm, reducing inflow into the arterial dilatation. Consequently, the aneurysm is gradually excluded from the main blood stream, and the risk of rupture decreases [7]. Nowadays, treatments include flow diverter stents, which offer a minimally invasive alternative to traditional methods, especially for giant or fusiform aneurysms and those with a wide neck that might be untreatable by conventional coiling [8]. The primary function of flow diverters is to redirect the flow reaching the aneurysm towards the original stream direction, decreasing inflow into the dilatation. This allows for reducing blood recirculation into the aneurysm, inducing a gradual thrombosis with subsequent healing of the disease [9]. The final result of the endovascular treatment will depend on the efficacy of the selected FDS. Thus, it is relevant to investigate the effect of different FDS on the aneurysmal hemodynamics in order to evaluate their efficacy.
Flow diverter stents can differ in porosity and pore density. The first is defined as the ratio of the metal-free surface area to the total surface area of the stent, the second indicates the number of pores per unit surface area [10]. Recently, several computational investigations analyzed the influence of stent porosity on the effectiveness of the endovascular treatment and the hemodynamic changes deter-mined by FDS placement [11,12,13].
Despite the interest of recent findings, some limitations recur in the numerical investigations on the FDS efficacy for the treatment of intracranial aneurysms. Many hemodynamic studies on cerebral aneurysms treated with flow diverter stents consider idealized models, disregarding the influence of real patient-specific geometries on WSS and the associated hemodynamic indices [14,15,16,17,18]. Furthermore, most numerical simulations of intracranial aneurysm hemodynamics model blood as a Newtonian fluid. This last hypothesis significantly affects the computational results since the characteristics of blood flow strongly depend on the rheological properties of the blood, and evidence for non-Newtonian behavior of intracranial blood flow was recently confirmed from Doppler ultrasonography measurements conducted in the cerebral arteries of 16 selected patients [19]. Furthermore, several researchers avoid the complex virtual reconstruction of the flow diverter stent and simulate the FDS as a porous medium with porosity and permeability equivalent to those of the actual FDS [11,20,21,22]. This kind of approach considers the flow through a medium with uniform spatial characteristics, whereas the mesh of flow diverter stents can be coarser in some regions and denser in others, influencing blood flow dynamics.
At last, it should be noted that, although FDS represents an effective alternative to conventional treatments, postoperative complications have been reported [23,24]. Furthermore, no firm conclusion has been reached yet about hemodynamic changes inside the aneurysm once flow diverting devices are placed into the diseased artery. For all these reasons, a better understanding of the effect of FDS placement in the intracranial aneurysm is critical for evaluating the most effective aneurysm treatment and planning surgery.
Taking into account the previous considerations, an accurate image-based computational investigation was performed for transient modeling of the blood stream inside a patient-specific intracranial aneurysm treated with flow diverter stents. The aim of the present study was to investigate the effects of FDS placement prior to the actual endovascular treatment and to compare the effectiveness of devices differing in porosity. In this way, it was possible to provide valuable insight into the most effective way to achieve the desired therapeutic outcome.
The patient-specific aneurysm model was derived from Computed Tomography Angiography (CTA) images. Following the reconstruction of the intracranial aneurysm, two FDS geometric models, differing in porosity, were realized. The flow diverter stents that, in the actual treatment, would be implanted in the patient-specific aneurysm were virtually inserted within the aneurysm, thus simulating real endovascular treatment.
Subsequently, the effect of FDS placement on the aneurysm hemodynamics was analyzed. The effectiveness of the devices was compared based on their ability to redirect blood flow towards the parent flow direction and exclude the aneurysm from blood circulation. For this purpose, numerical simulations were performed under pulsatile flow conditions in the pre-operative model (IA without stent placement) and in the post-operative ones (IA virtually treated with FDS deployment). Blood was modeled as a non-Newtonian fluid using the Carreau rheological model. As time-averaged wall shear stress (TAWSS) was found to play an important role in aneurysm growth, rupture, and thrombosis [2,3,24], hemodynamic parameters including TAWSS, oscillatory shear index (OSI), and endothelial cell activation potential (ECAP) were compared between the pre-operative and post-operative models. In addition, instantaneous velocity streamlines were analyzed. At last, a further hemodynamic parameter, the relative residence time (RRT), was evaluated to quantify the tendency toward thrombus formation and consequently the healing of the disease. This index made it possible to estimate the relative time that blood resided close to the aneurysmal wall. It was found to be a fundamental indicator of altered aneurysm hemodynamics and thrombus deposition [25,26,27], thus allowing the evaluation of the FDS’s effectiveness.
Importantly, the methodology used for the FDS reconstruction and its deployment in a real (non-ideal) patient-specific geometry allowed for evaluating the effect of FDS placement on the hemodynamics of the intracranial aneurysm and identifying the most effective treatment.

2. Materials and Methods

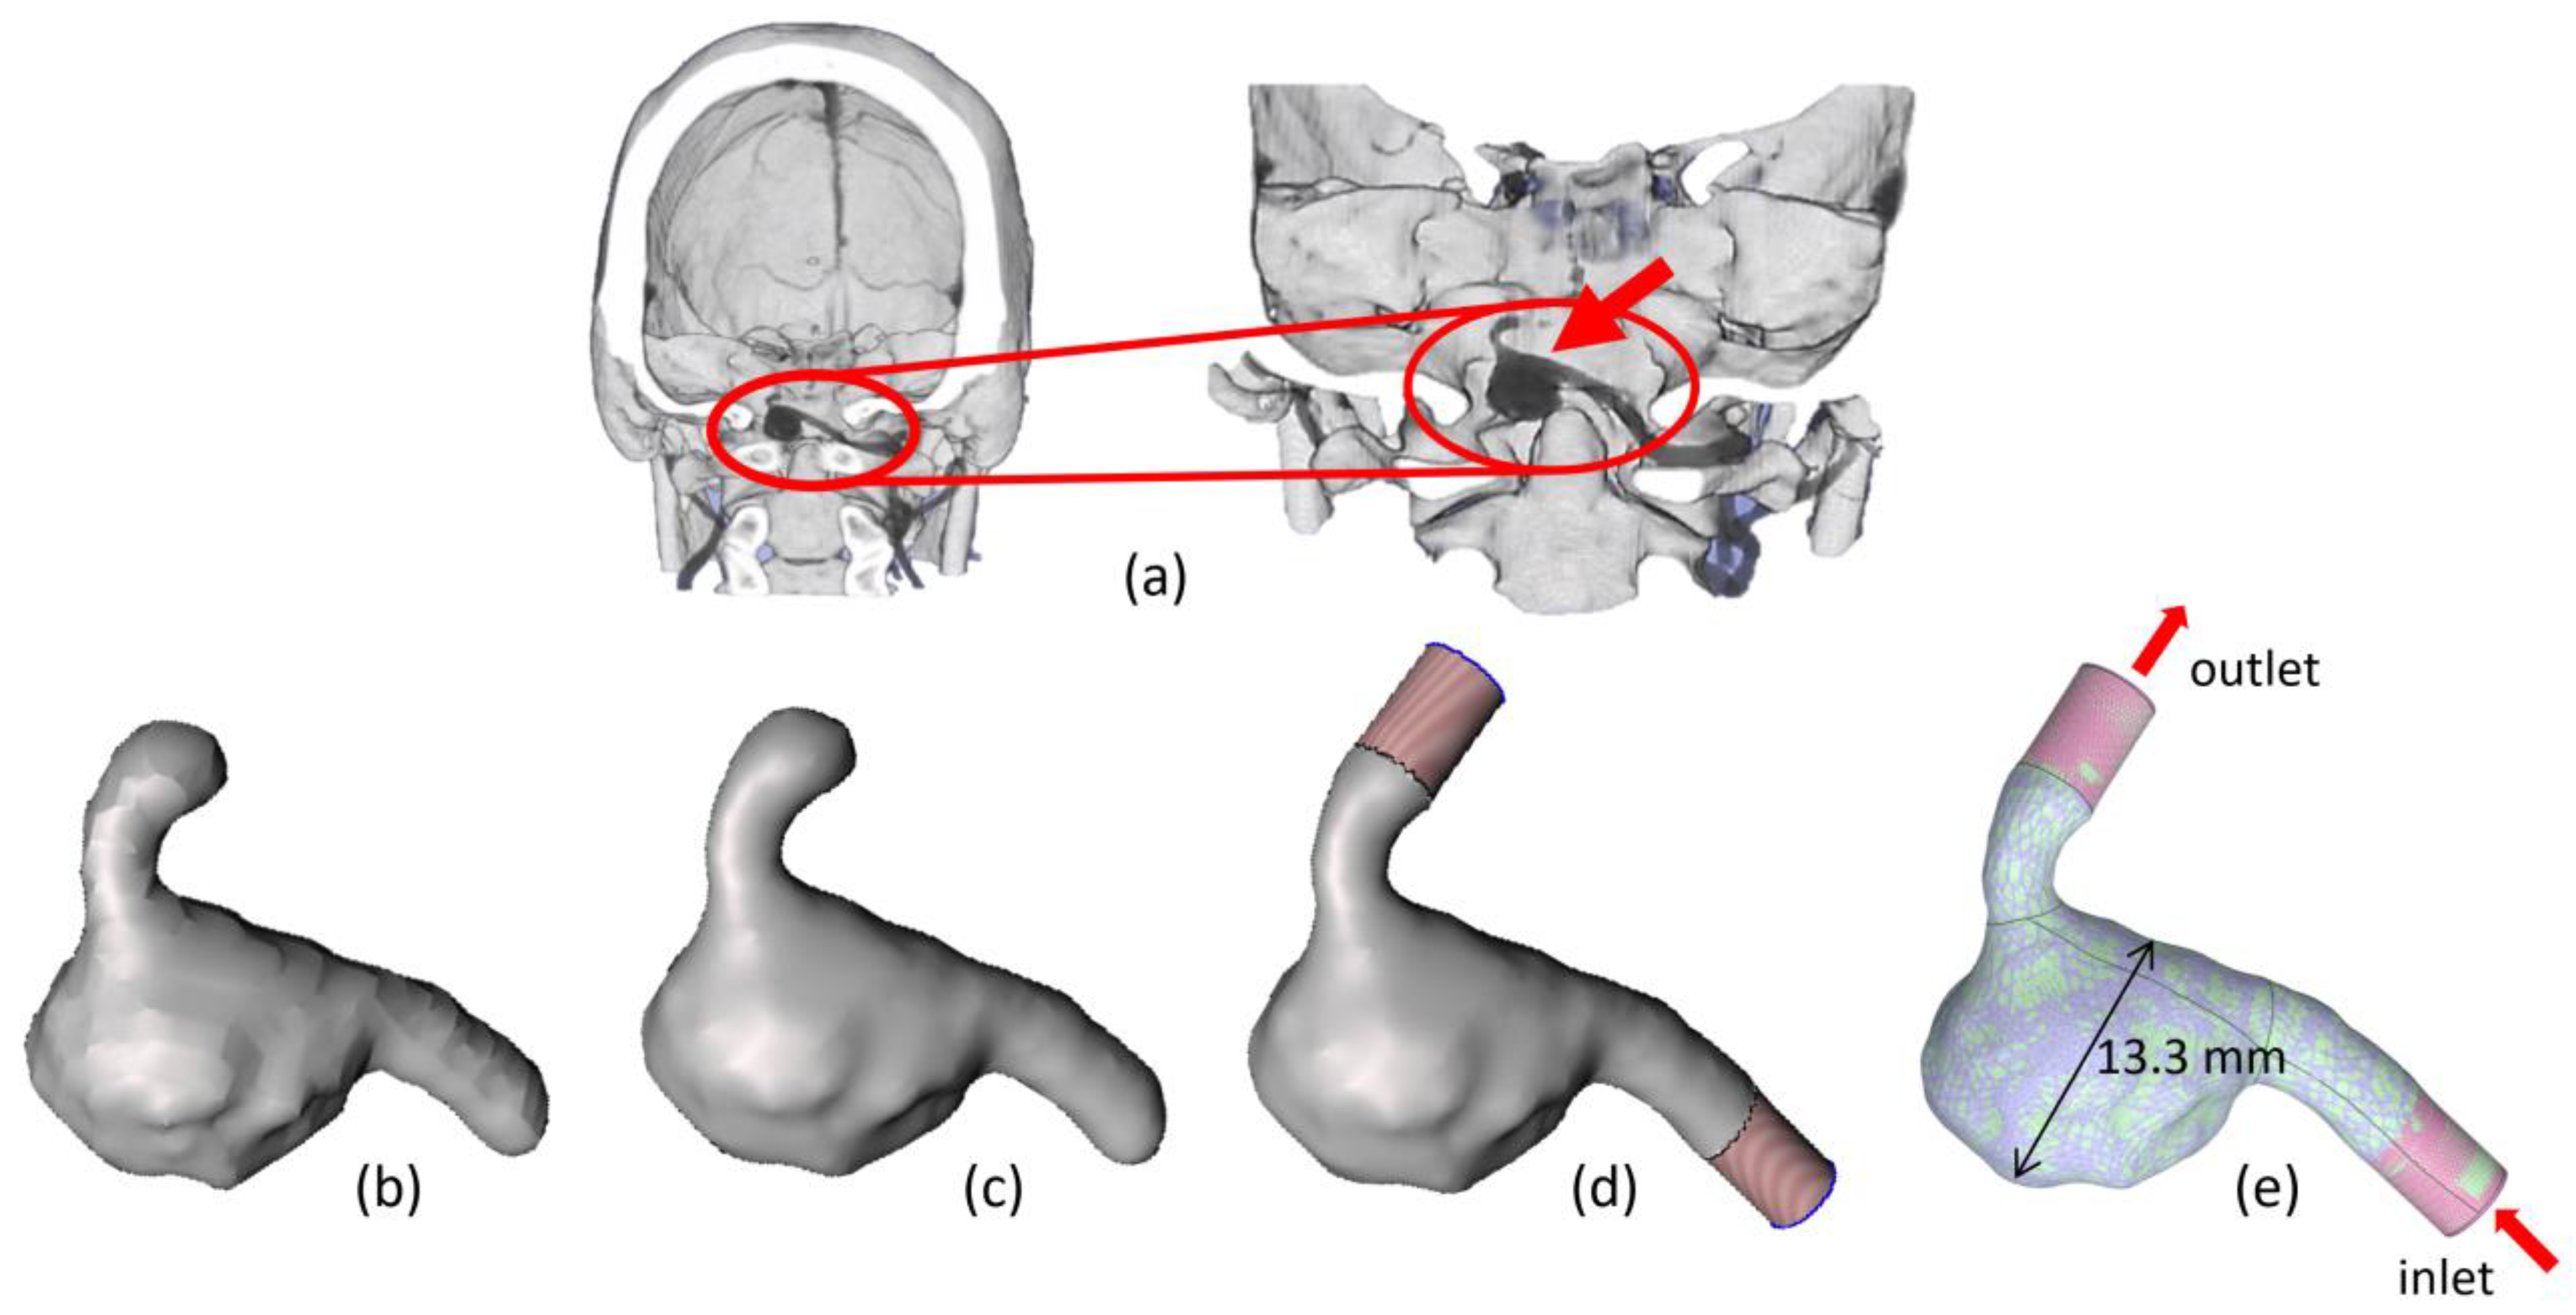
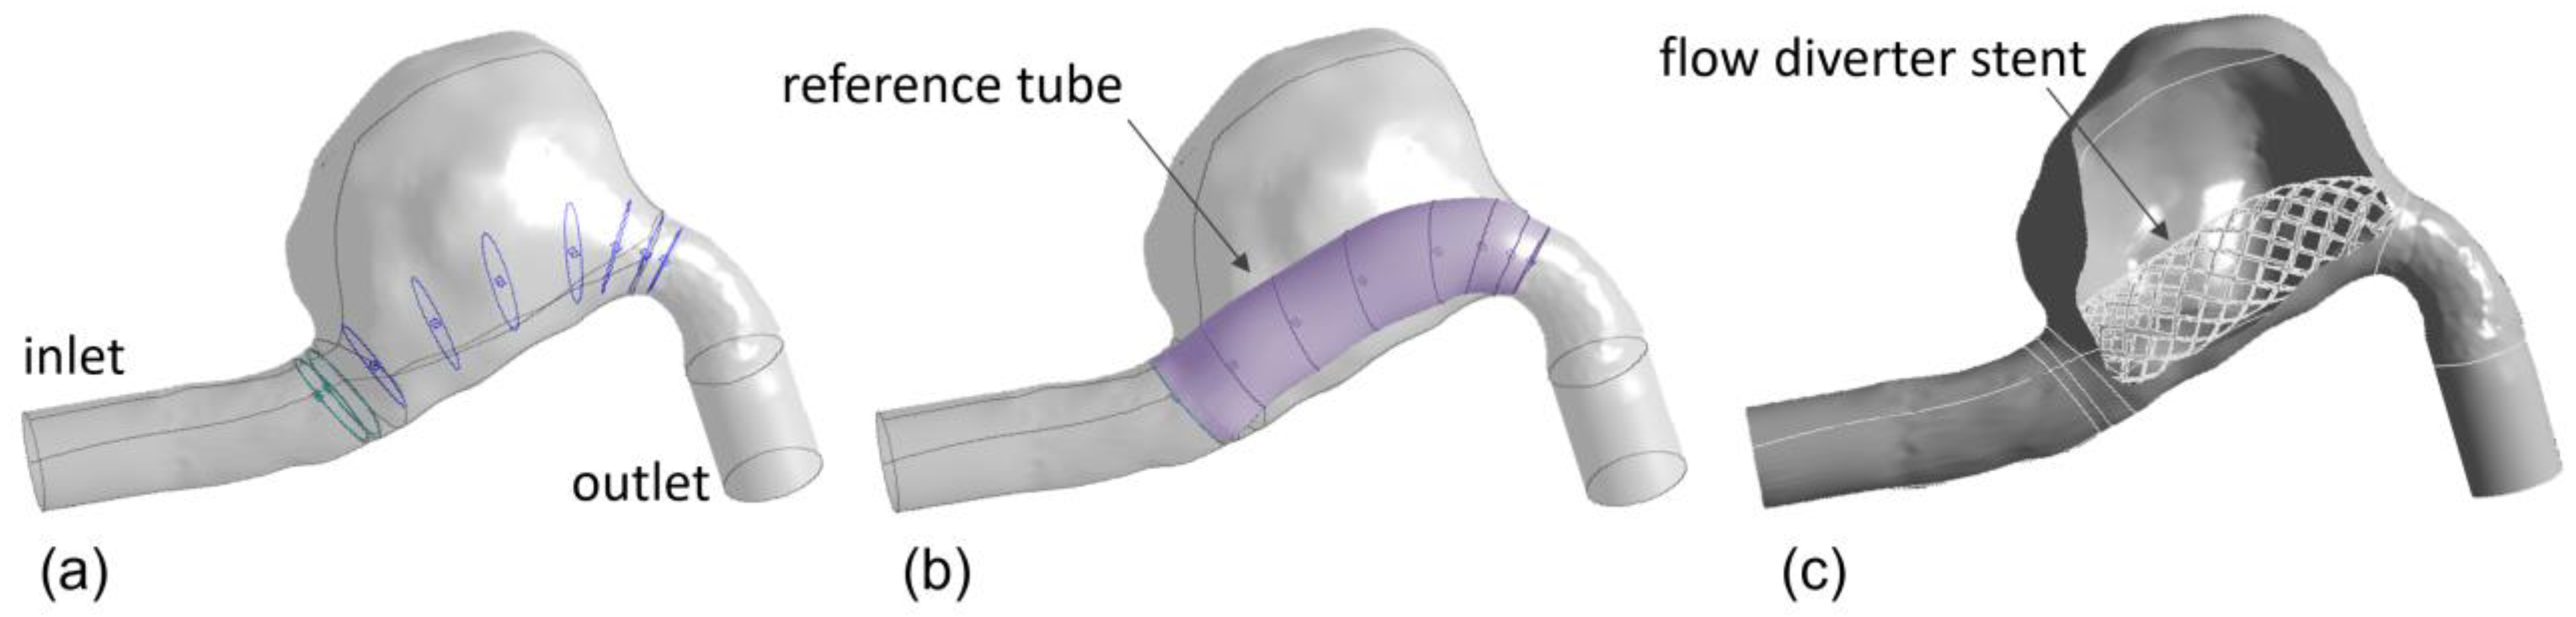
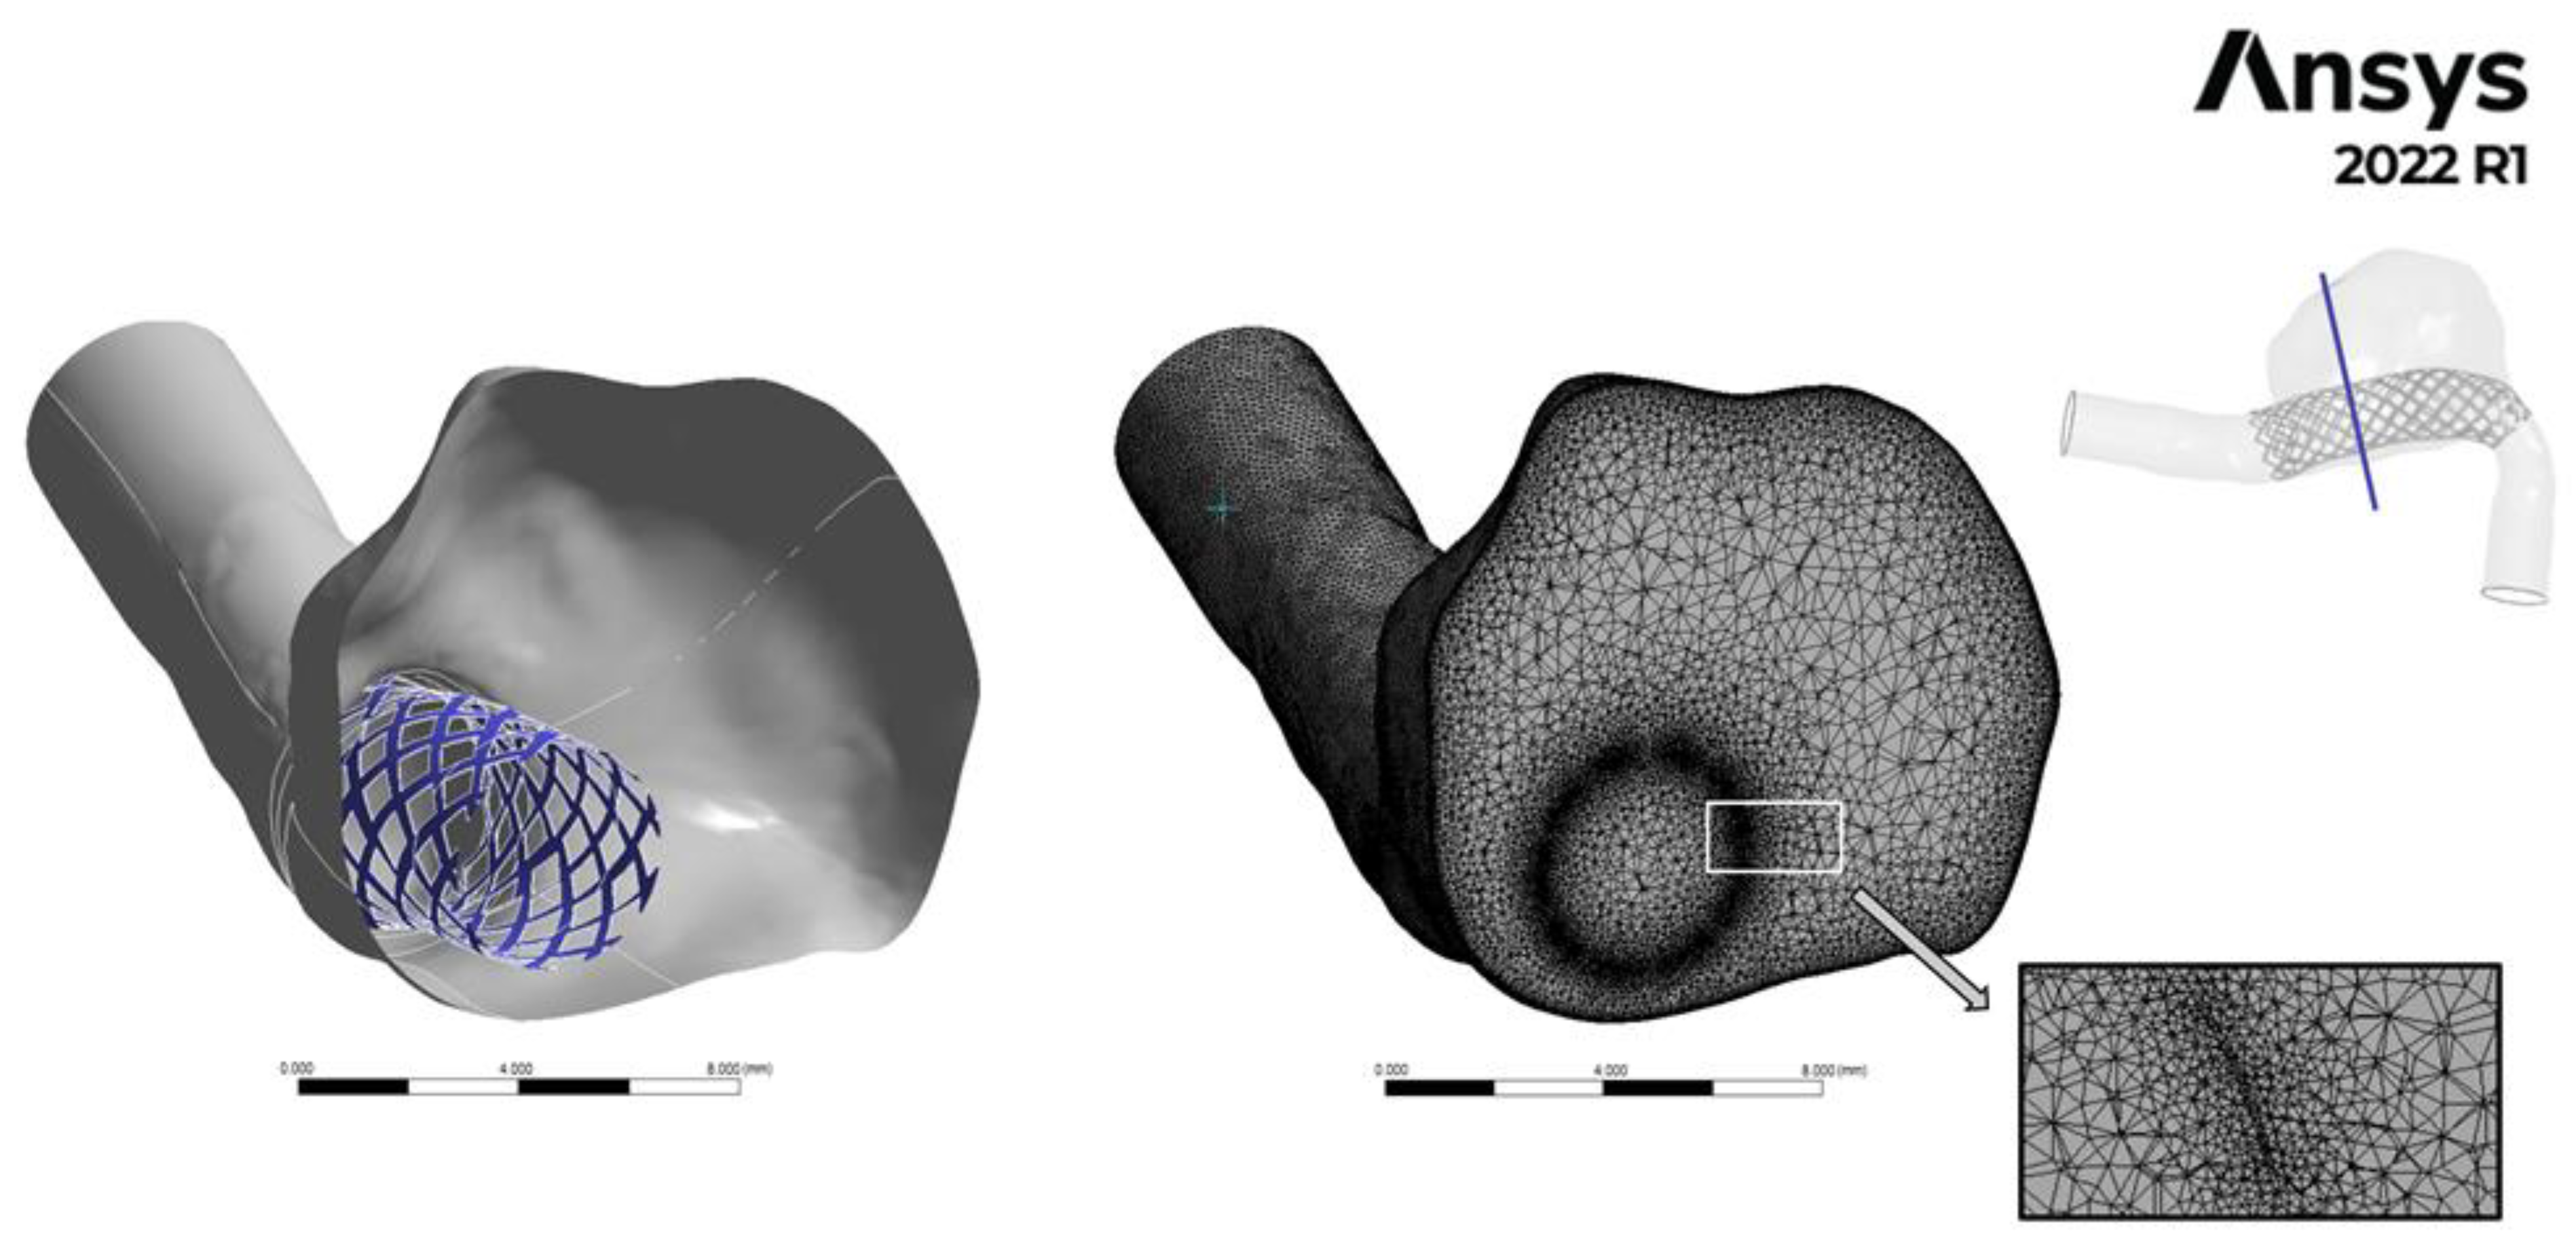
2.1. Intracranial Aneurysm and FDS Reconstruction Process

The first step to simulating the pulsatile blood flow inside patient-specific aneurysms is their accurate geometrical reconstruction. In this study, the intracranial aneurysm model was derived from anonymous patient data received in Digital Imaging and Communications in Medicine (DICOM) format from “Università Cattolica del Sacro Cuore, Policlinico A. Gemelli”, Italy. Informed consent was obtained from the patient. Computed Tomography Angiography revealed the presence of a saccular aneurysm in the vertebral artery, with a maximum diameter of about 14 mm and a wide neck of approximately 10 mm. No radiological signs of rupture were found. Endovascular repair with the deployment of a flow diverter stent was indicated for the aneurysm treatment. The procedures for patient-specific aneurysm reconstruction from the CTA images and FDS reconstruction are illustrated below.
First, a rough 3D model was reconstructed from the CTA data using the image analysis software ITK-SNAP (v.3.6.0). Subsequently, smoothing of the arterial wall was performed using the Meshmixer software (v.3.5). At last, further post-processing was performed with the software Vascular Modeling Toolkit (VMTK, v.1.4.0) to obtain the final model of the patient-specific aneurysm. In this last step, cylindrical flow extensions were added at the inlet and outlet of the aneurysm model to reduce boundary effects on numerical results and allow the flow to become fully developed before affecting the aneurysmal dilatation. Once the processing of CTA images was completed, the SpaceClaim software (v.2022 R1, ANSYS Inc., Canonsburg, PA, USA) was used to extract the luminal surface of the aneurysm, which was needed to perform the numerical simulations. The main steps of the aneurysm reconstruction process are shown in Figure 1.
Following the reconstruction of the patient-specific aneurysm, two FDS geometric models differing in porosity were created using DesignModeler software (v.2022 R1, ANSYS Inc., Canonsburg, PA, USA). The flow diverter stents that, in the actual endovascular treatment, would be implanted in the patient-specific aneurysm have been virtually inserted within the vascular model.
The method of realizing and inserting flow diverter stents into the patient-specific IA model required several steps. First, an unperforated reference tube, representing the scaffold of the flow diverter stent, was realized using DesignModeler software, approximately following the centerline of the non-dilated vessel. Then, several circular contours identifying the hypothetical healthy artery were placed inside the aneurysmal dilatation, as shown in Figure 2a. These circles identified the “skeleton” of the reference tube and allowed its reconstruction (Figure 2b).
The initial and final cross-sections of the reference tube were made equal to those of the healthy artery. The surface of the scaffold in the initial area, to a limited extent, was accurately superimposed on the arterial wall. Checking the adherence between the scaffold surface and the vessel surface in the initial area of the scaffold (before the aneurysm dilatation) limited leakage problems and ensured the correct functionality of the flow diverter. Thus, preliminary tests were performed to determine the correct placement of the scaffold in the dilated artery.
Subsequently, suitable Boolean subtraction operations allowed the holing of the reference pipe to obtain two FDS models, named FD1 and FD2, which had the same pore density but differed in porosity. The FDS porosity was calculated by the ratio of the void surface area to the total surface area of the devices, that is, the surface of the reference tube. The porosity of the reconstructed FD1 and FD2 stents was equal to 76% and 49%, respectively.
Each FDS model was virtually deployed in the previously reconstructed patient-specific aneurysm, thus simulating the clinical endovascular treatment. The deployment of the flow diverter devices inside the intracranial aneurysm was achieved using a further Boolean subtraction operation. In particular, the considered flow diverter stent was subtracted from the aneurysmal geometry, thus obtaining the final computational fluid domain corresponding to the intracranial aneurysm with virtual implantation of the flow diverter stent (Figure 2c).

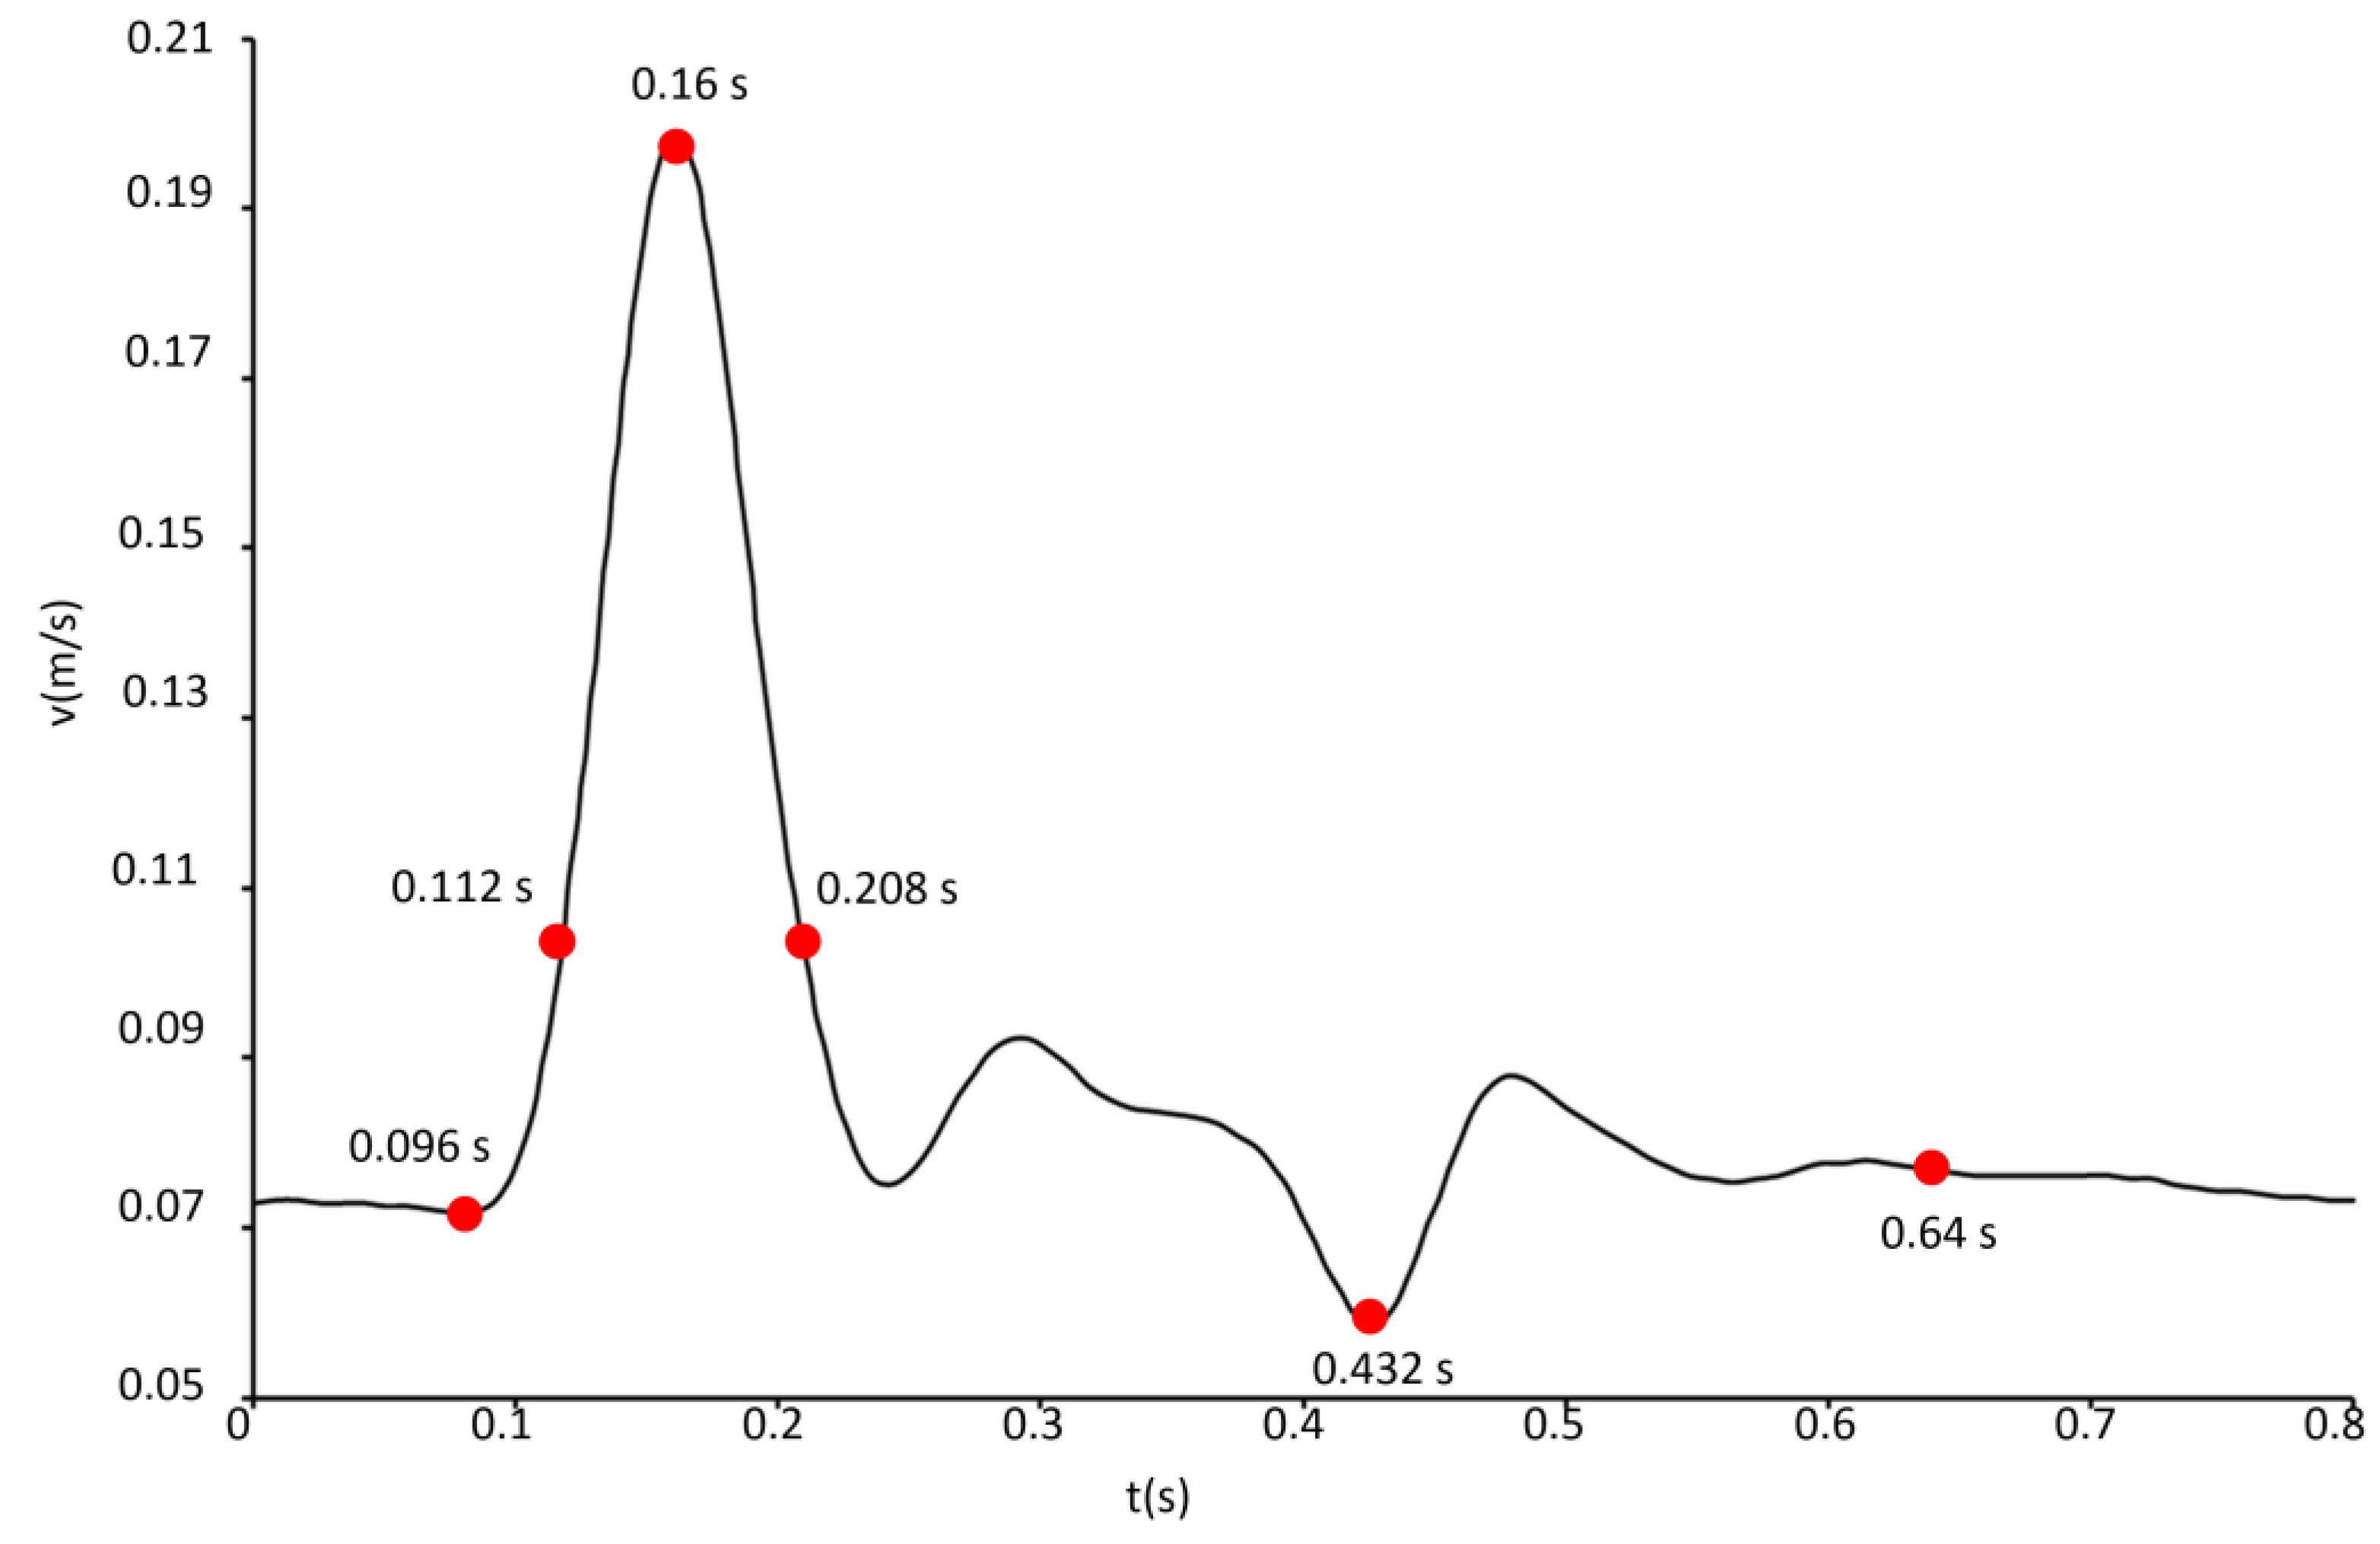
2.2. Governing Equations and Numerical Setup

The mass and momentum conservation equations for incompressible fluids and negligible gravity forces are [28]:
· u = 0
ρ u t + u u = p + · τ
where u is the velocity vector, p the pressure, and ρ the density of the fluid. The deviatoric stress tensor τ is a function of the strain rate tensor D , D = u + u T / 2 , according to the relation τ = 2 μ ( γ ˙ ) D , where µ is the dynamic viscosity of the fluid and γ ˙ is the shear rate. The system of Equations (1) and (2), with the associated boundary and initial conditions, determines the blood flow inside the aneurysm.
The pulsatile nature of the blood flow was modeled by assigning physiological boundary conditions. A no-slip condition, u = 0 , was imposed on the arterial wall of the patient-specific models; a time-dependent velocity v = v(t) was uniformly assigned at the inlet; and the pressure p = 100 mm Hg was prescribed at the outlet of the aneurysm models, that is, in the cases with and without FDS placement. Since the patient-specific velocity waveform was not available, a typical flow-rate waveform for the vertebral cerebral artery was taken from the literature [29]. Then, the inlet area of the patient-specific aneurysm was used to calculate the time-dependent velocity waveform, which was assigned at the inlet of the models (Figure 3). The period of the velocity waveform was equal to 0.8 s, the maximum velocity occurred at the systolic peak instant t = 0.16 s, and the minimum velocity was observed at the diastolic instant t = 0.432 s. Further significant instants were considered for describing hemodynamics inside the aneurysm, as illustrated in Figure 3. The instants t = 0.096 s, t = 0.112 s, and t = 0.208 s referred to the systolic phase; the instant t = 0.64 s referred to the diastolic phase.
The non-Newtonian rheological properties of blood were taken into account. The shear-thinning behavior of blood was modeled by the Carreau model, using the following relationship for the dynamic viscosity µ:
μ γ ˙ = μ + μ 0 μ [ 1 + λ γ ˙ 2 ] n 1 2
where μ0 = 0.056 kg/(m·s) is the viscosity at zero shear rate γ ˙ , μ = 0.0035 kg/(m·s) is the viscosity for an infinite shear rate, λ = 3.313 is the relaxation time, and n = 0.3568 is the power-law index [30].
A laminar blood flow was assumed, as suggested by the low value of the averaged Reynold number Re = ρUD/μ, which is based on the diameter D of the healthy artery at the model inlet (D = 0.00427 m) and the time-averaged velocity U assigned at the inlet (U = 0.1034 m/s). Assuming the blood density ρ = 1060 kg/m3 and the dynamic viscosity μ = μ = 0.0035 kg/(m·s), the averaged Reynolds number is about Re ≈ 134, and the maximum Reynolds number, corresponding to the systolic peak velocity, is Remax ≈ 257. Furthermore, the rigid wall assumption was made.
A computational investigation was performed for modeling blood flow in the patient-specific aneurysm under pulsatile flow conditions. The analyzed cases referred to the pre-operative vascular geometry obtained from the image segmentation process and the simulated post-operative ones obtained by virtual placement of the FD1 and FD2 stents inside the aneurysm. The numerical simulations were performed using ANSYS Fluent.v.2022 R1 [31]. The SIMPLE (Semi-Implicit Method for Pressure-Linked Equations) method for the pressure-velocity coupling and a second-order upwind scheme for the spatial discretization of momentum were adopted [32]. For the discretization of the temporal terms, a first-order implicit method was used.
The cardiac cycle was divided into 100 time-steps of 0.008 s, and 200 iterations were performed for each time step. The convergence criteria were set such that the residuals of velocity components and continuity were below 10−5 at each time-step. To minimize the effect of initial numerical transients at the beginning of the computation, three cardiac cycles were simulated, and only the third cycle was considered for the hemodynamic analysis.
The computational domains associated with the pre-operative condition (IA with no FDS placement) and the post-operative ones (IA with FD1 placement and IA with FD2 placement) were discretized into a large number of tetrahedral computational cells. The size of the mesh elements in the lumen was the same in all cases. However, in the cases of FD1 and FD2, the mesh was refined in the proximity of the devices.

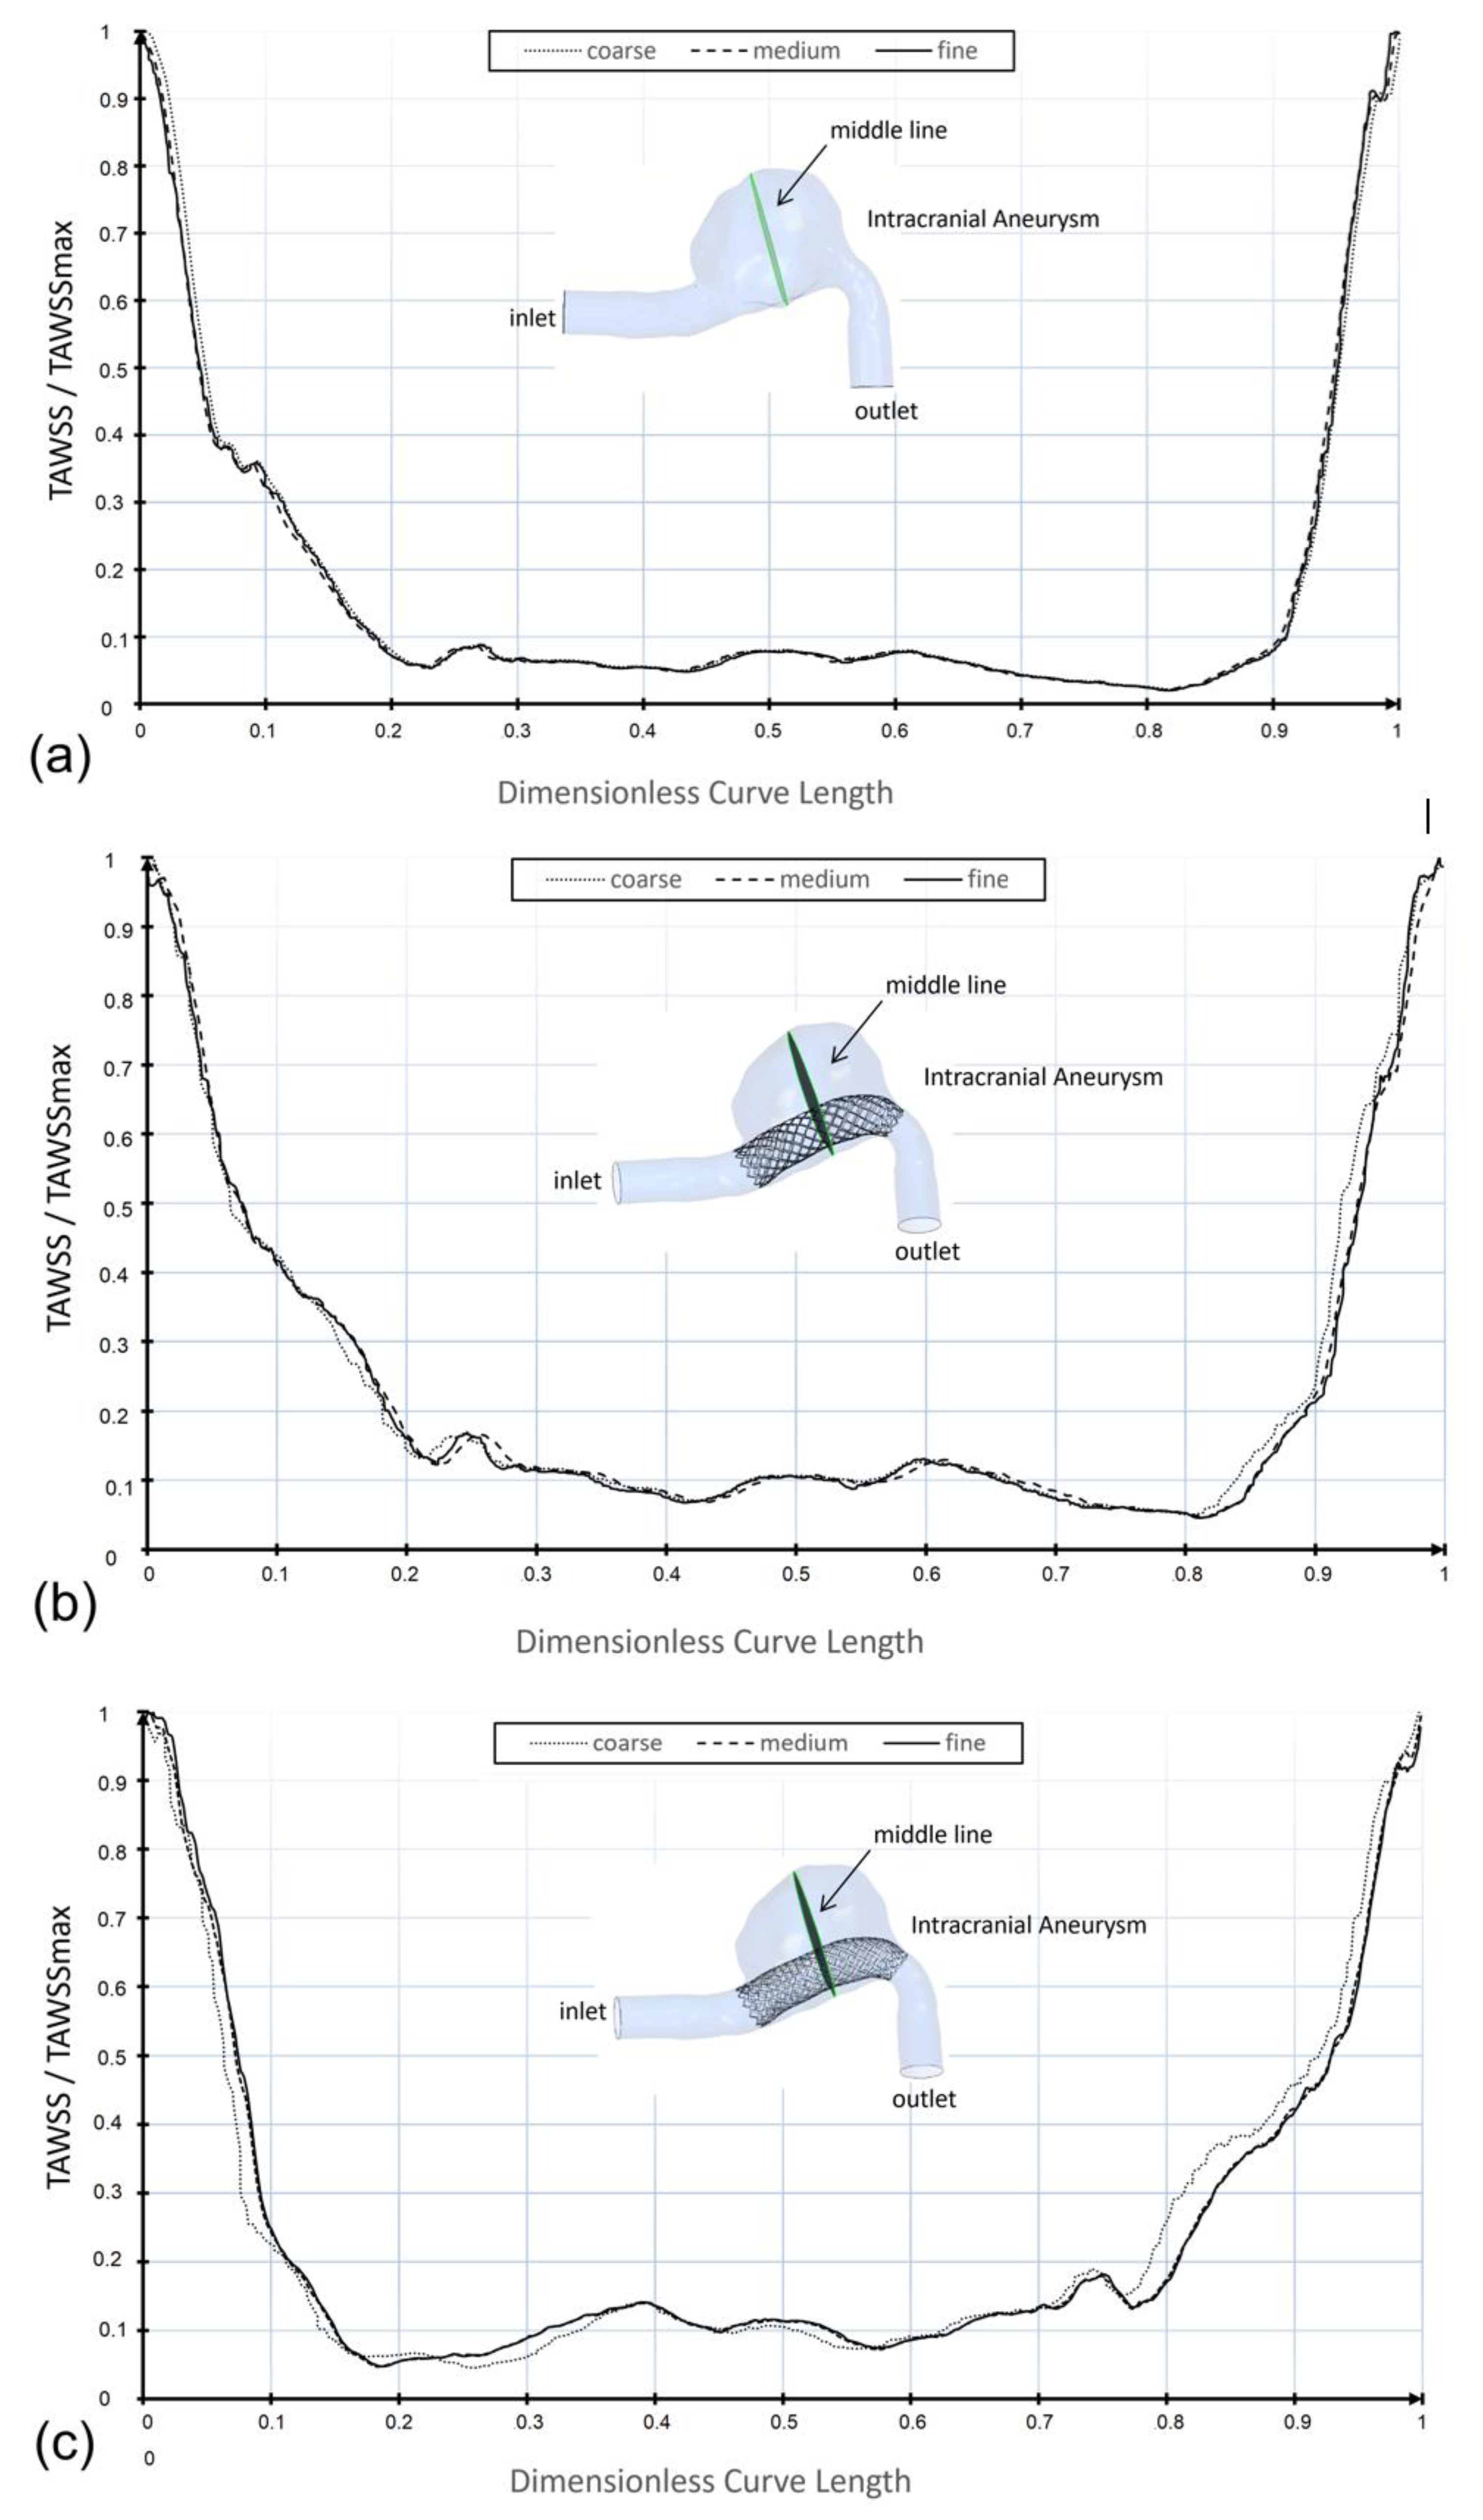
2.3. Mesh Convergence Analysis

The size of the mesh elements can greatly affect the accuracy of numerical solutions. Therefore, a mesh sensitivity analysis was performed for each IA model to ensure that the numerical results were not sensitive to the mesh size. For the mesh independence study, TAWSS values were monitored for different mesh sizes along a curve located in the middle of the aneurysmal surface. Figure 4 shows the comparison of the TAWSS values along the selected curve for the last three mesh sizes considered. The values refer to the analyzed cases, that is, the pre-operative model and the two post-operative ones. As the number of mesh elements increased, a greater agreement between the TAWSS profiles was observed, and a mesh independence condition could be assumed (Figure 4). As a further validation of the mesh independence, Table 1 shows the influence of the mesh size on the instantaneous WSS value averaged on the artery wall for the considered models. The values refer to the systolic peak instant. In all cases, only a minimal variation of less than 1% was found between the WSS values associated with the two last meshes, i.e., the meshes with the largest number of elements.
The results shown in Table 1 and the good correspondence in the TAWSS profiles for the highest numbers of mesh elements suggested the choice of the optimal mesh. In particular, the final mesh in the absence of flow diversion devices reached approximately 3 × 10⁶ elements, as opposed to approximately 4.1 × 10⁶ and 4.3 × 10⁶ elements in the presence of FD1 and FD2 devices. These values were obtained using an element size equal to 0.12 mm in the lumen for all cases and 0.05 mm in the vicinity of the flow diverter devices for FD1 and FD2 cases.
Figure 5 shows the computational mesh generated in the case of virtual FDS placement (post-operative condition) and the refinement near the flow-diverting stent. The finer mesh cells locate the FDS position.

2.4. Hemodynamic Parameters

To analyze the effect of FDS placement in the patient-specific aneurysm, the hemodynamic indicators TAWSS, OSI, ECAP, and RRT were calculated. These time-averaged parameters are able to quantify the unsteady nature of blood flow and were found to be essential for describing the altered hemodynamics in intracranial aneurysms after FDS implantation and evaluating the performance of the devices.
The time-averaged wall shear stress TAWSS furnishes the average over the cardiac cycle of the magnitude of the WSS vector, i.e.,
T A W S S = 1 T 0 T W S S d t
where T is the period of the cardiac cycle and W S S indicates the instantaneous wall shear stress vector.
The oscillatory shear index OSI is a non-dimensional parameter that takes into account directional changes of the WSS vector during the cardiac cycle with respect to the dominant direction of the flow [33].
O S I = 1 2 1 0 T W S S d t 0 T W S S d t
OSI values range from 0 to 0.5. Unidirectional shear stress, corresponding to a zero OSI value, is related to a healthy condition, while a high OSI value was recognized as inducing an inflammatory response of the artery wall [34].
Another important hemodynamic parameter is the endothelial cell activation potential (ECAP), which correlates the TAWSS values with the OSI values:
E C A P = O S I / T A W S S
This parameter is generally used to characterize the “thrombogenic susceptibility” of the aneurysm wall. The knowledge of the ECAP distribution allows us to locate areas with high ECAP values. These regions are exposed to both high OSI and low TAWSS at the same time, which identifies conditions of endothelial susceptibility [35,36].
Furthermore, according to Himburg and co-authors [25], the residence time of particles near the vessel wall can be evaluated using the RRT index:
R R T = 1 1 2 · O S I · T A W S S = 1 1 / T 0 T W S S d t
This last parameter allows us to quantify the reduction of the velocity of blood flow in the aneurysmal dilatation, thus identifying the possibility of thrombus formation and subsequent aneurysm healing. For this reason, it is particularly useful for determining the effectiveness of flow-diverting devices.

3. Results and Discussion

The primary function of flow diverters is to optimally alter the hemodynamics within the aneurysm sac, reducing flow recirculation and allowing for thrombus formation within the aneurysm. The results of the computational investigation highlighted that in the absence of FDS, the flow pattern in the aneurysmal sac was characterized by a single large, organized vortex at each instant of the cardiac cycle. The blood recirculating region was characterized by a counterclockwise vortex, as depicted in Figure 6, at a selected instant of the cardiac cycle.

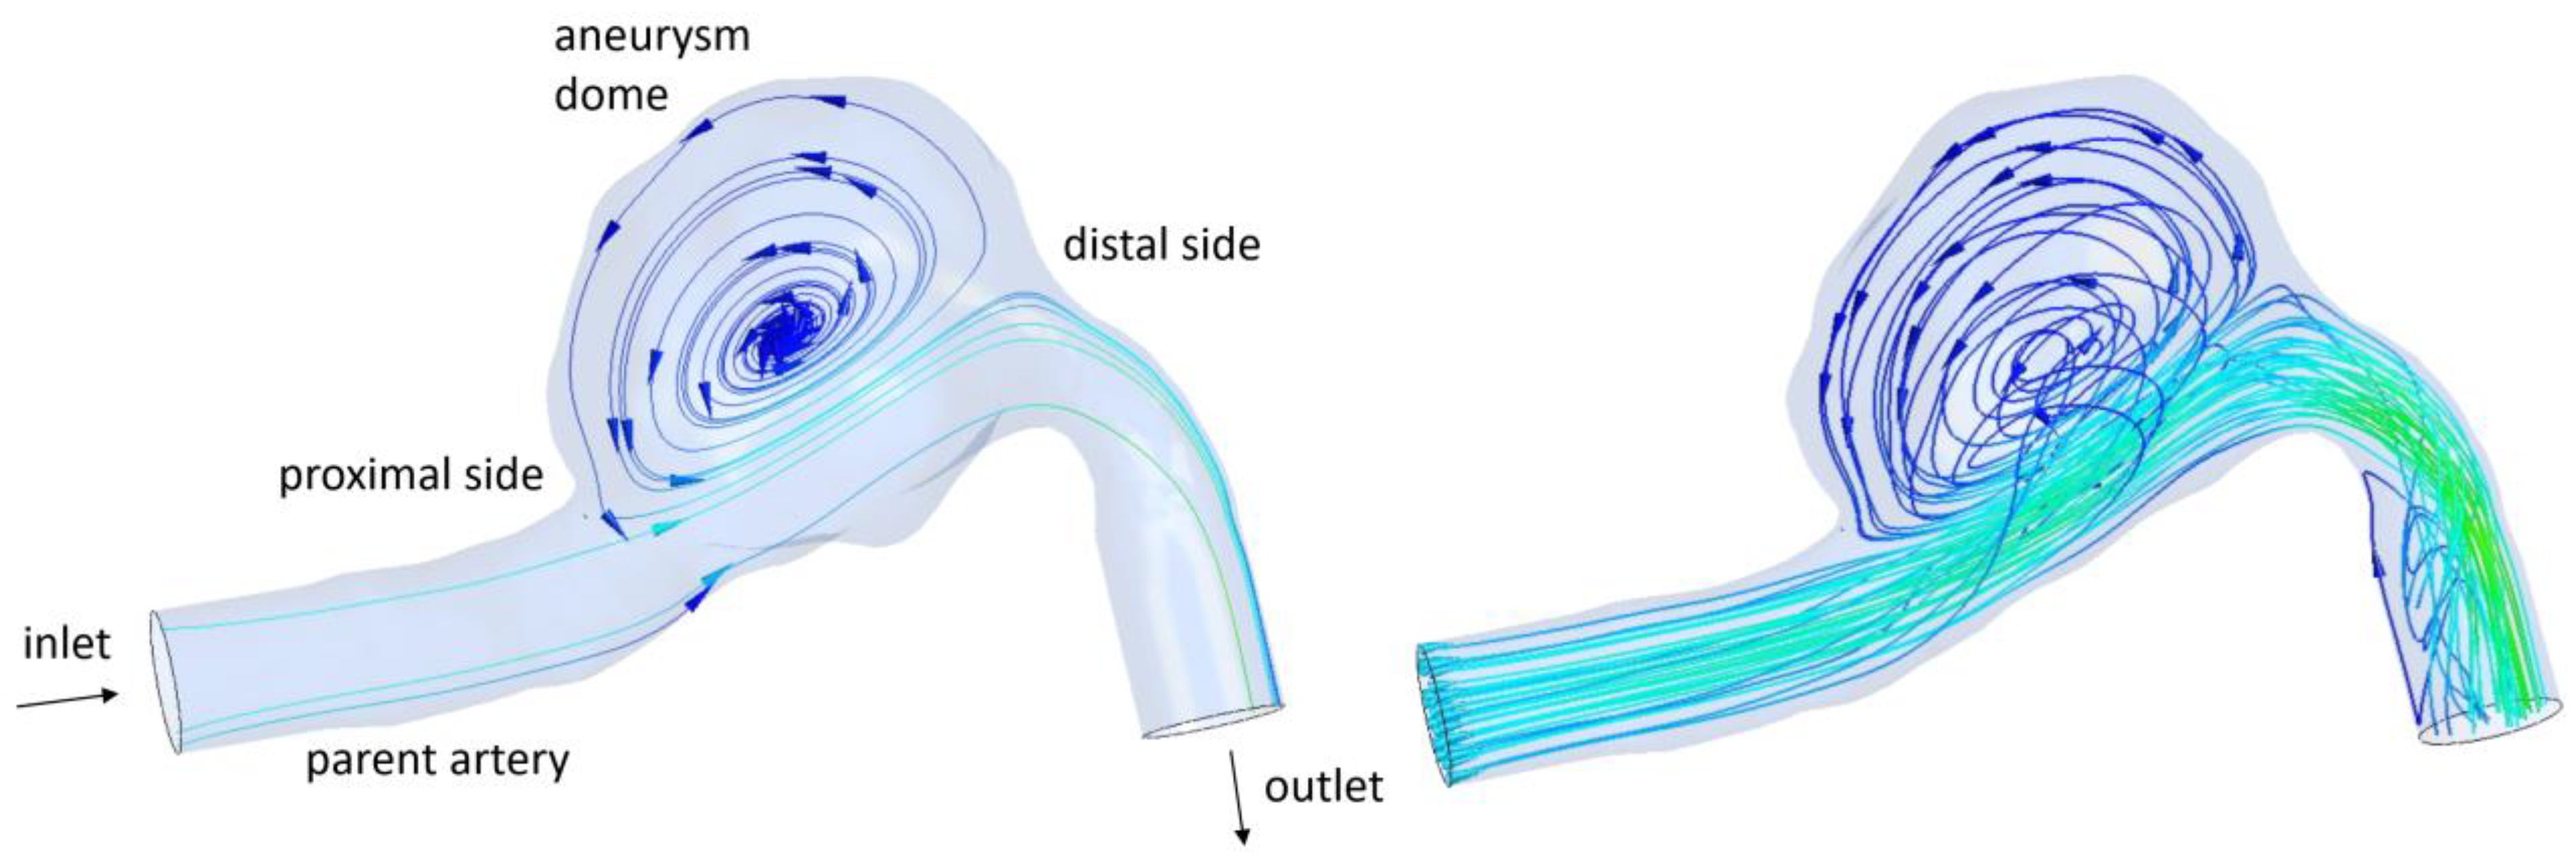
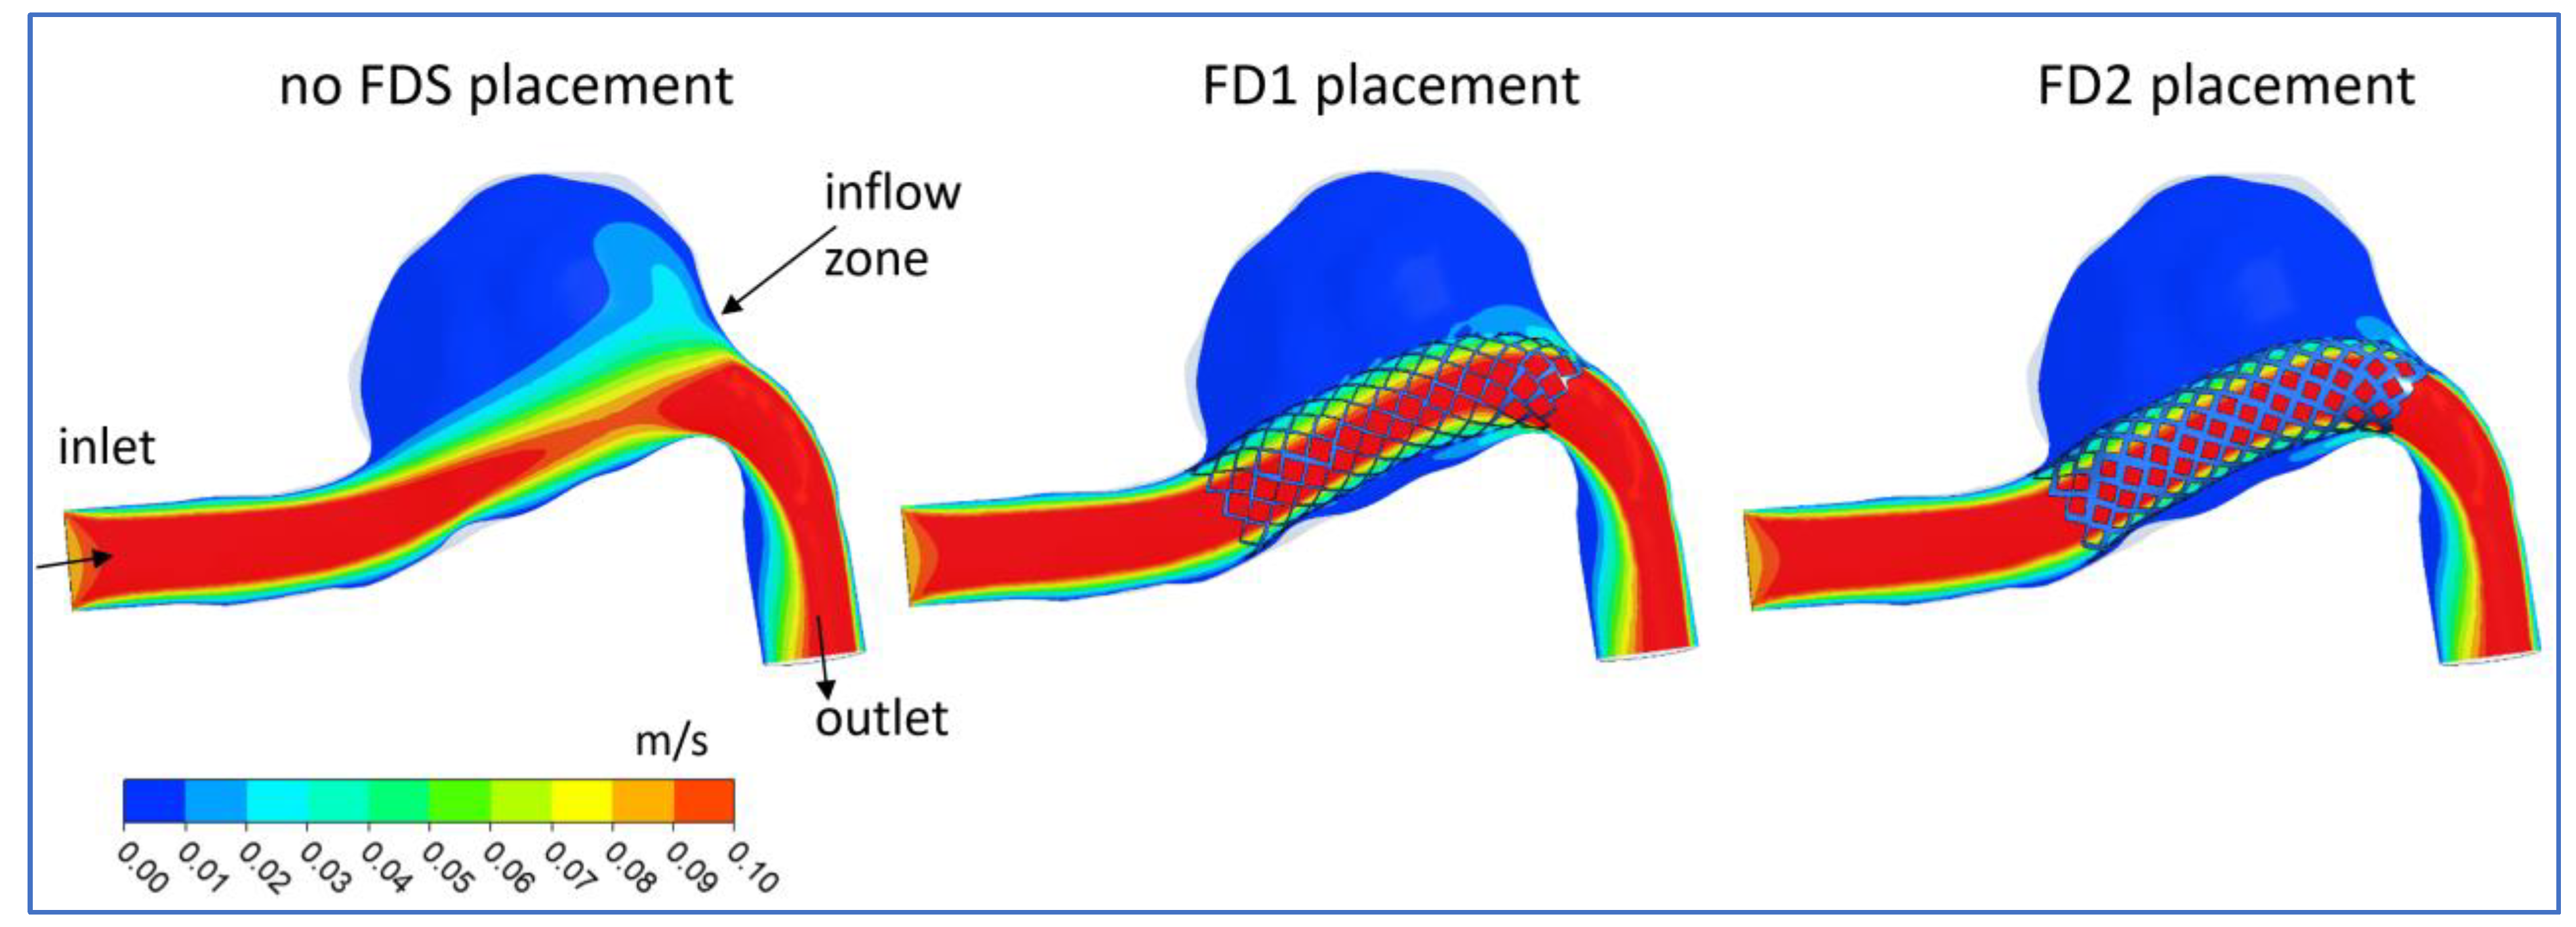
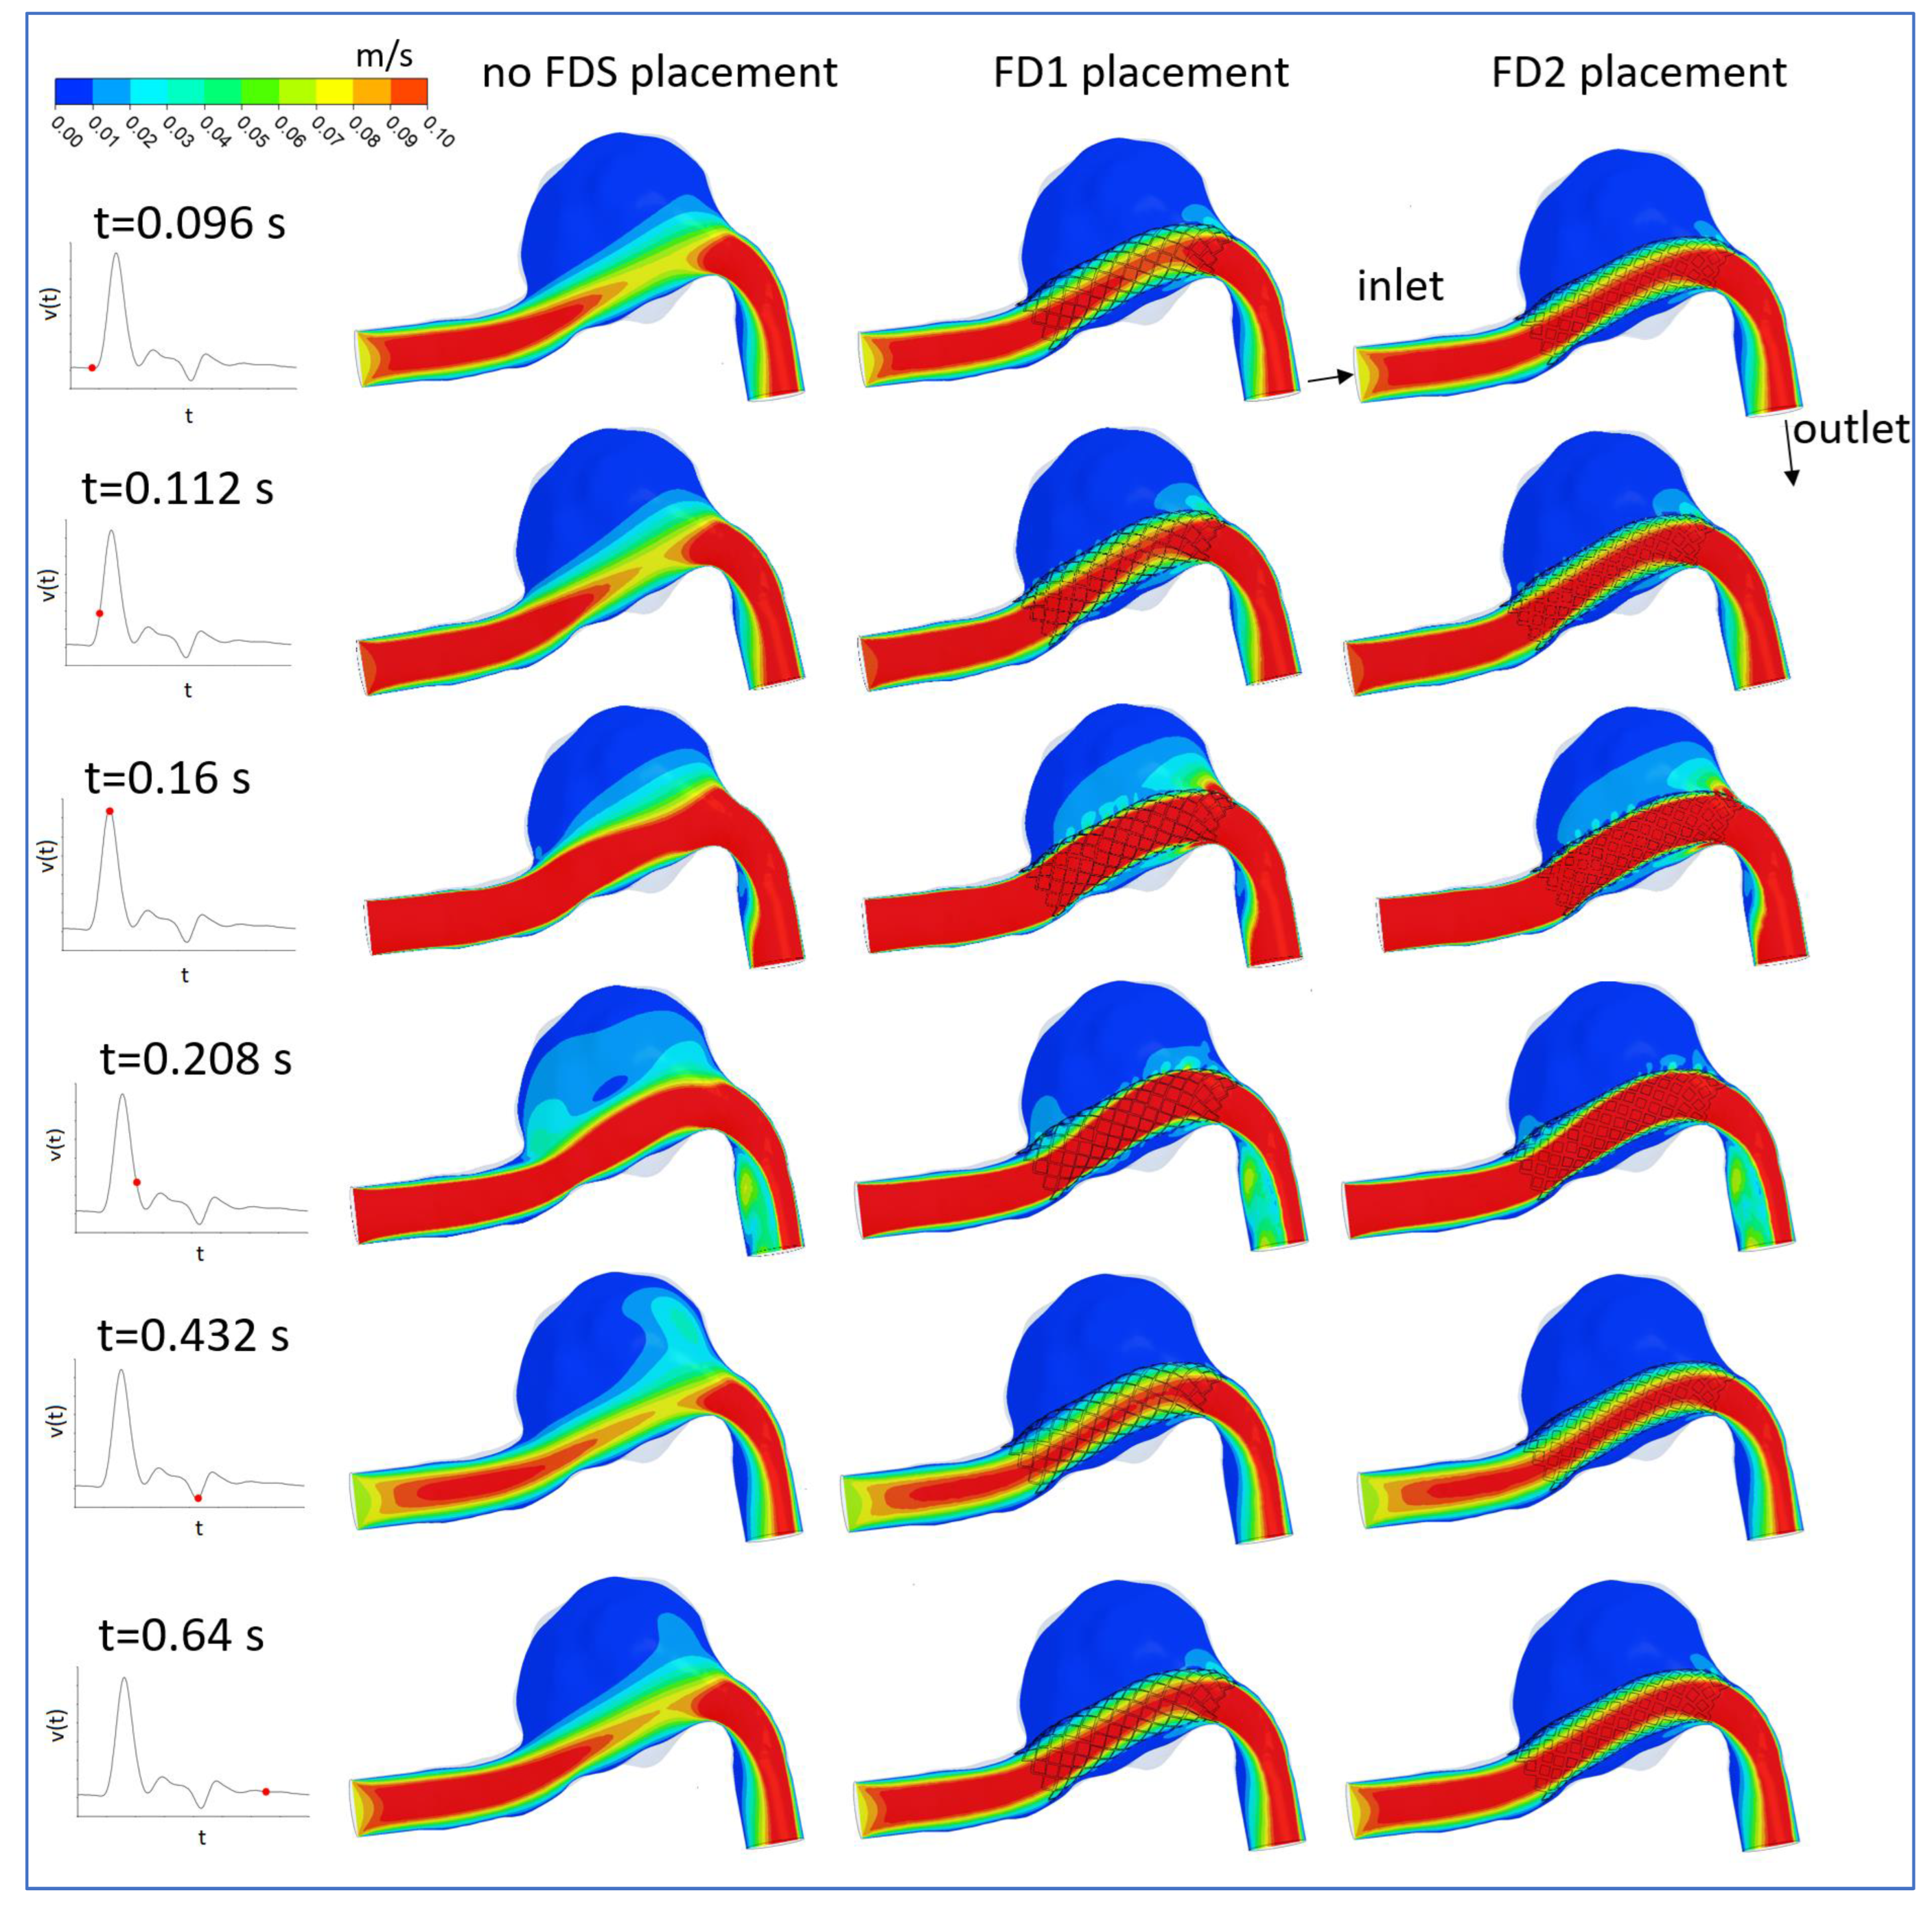
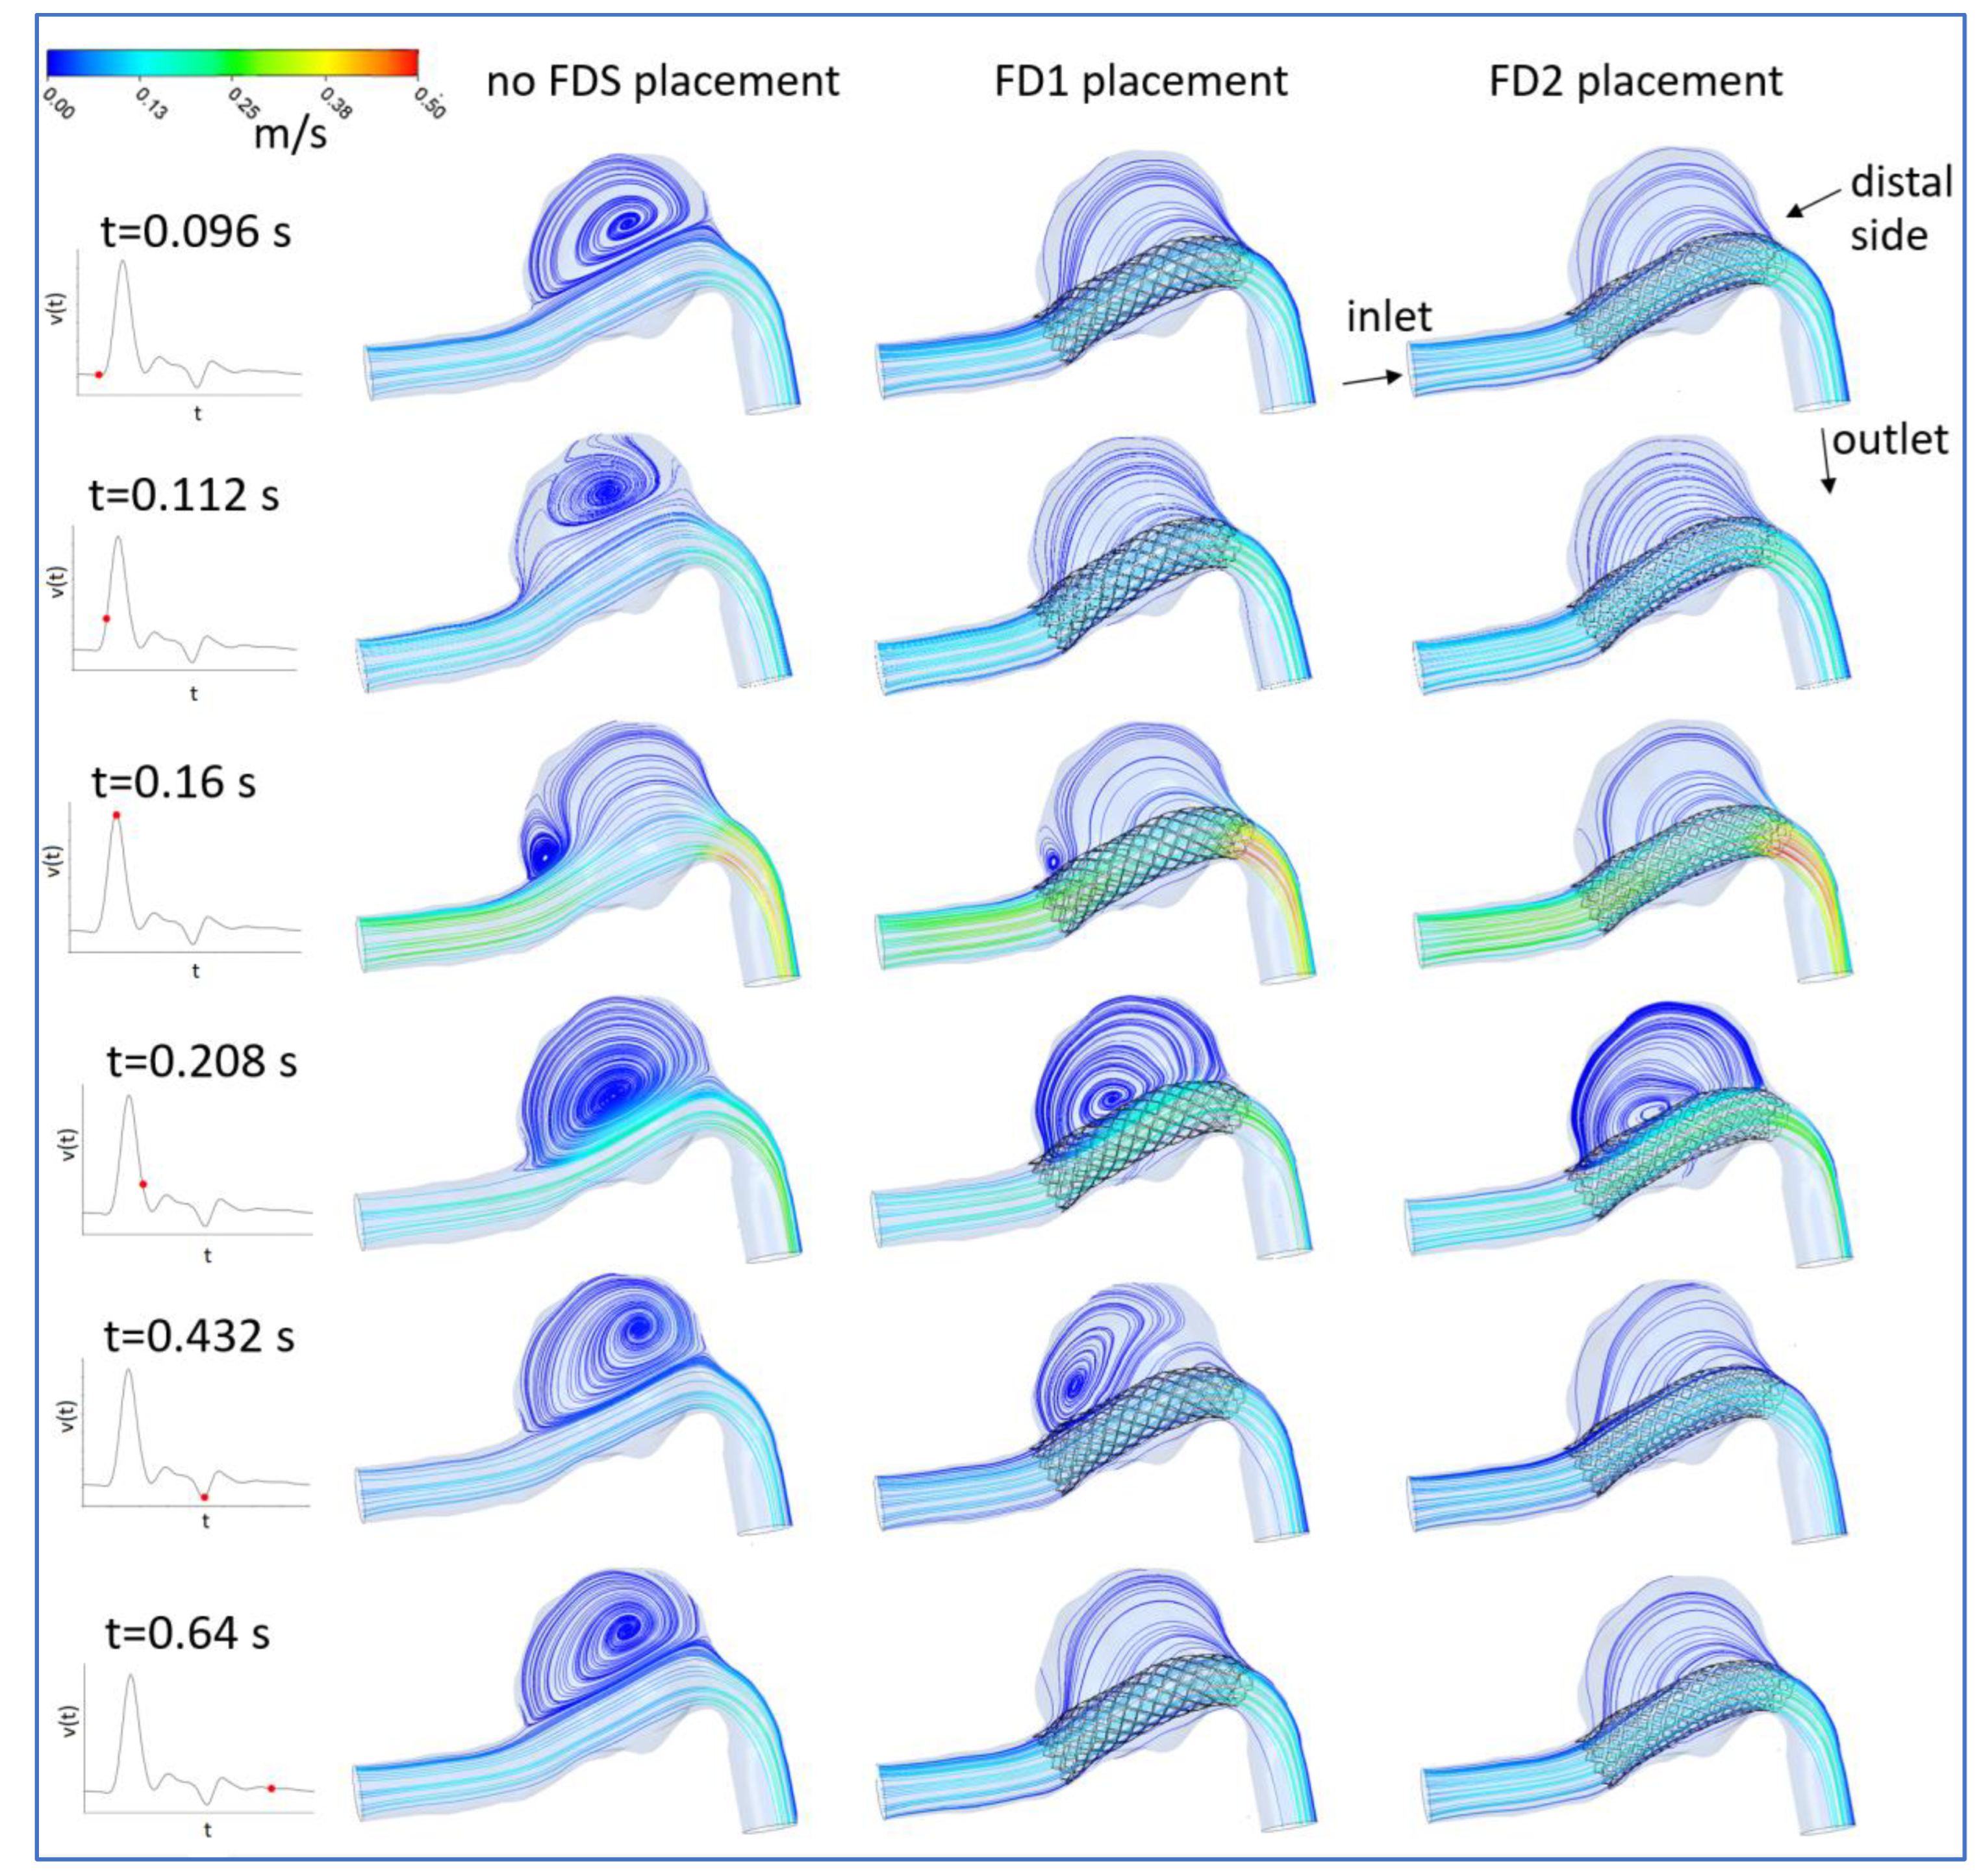
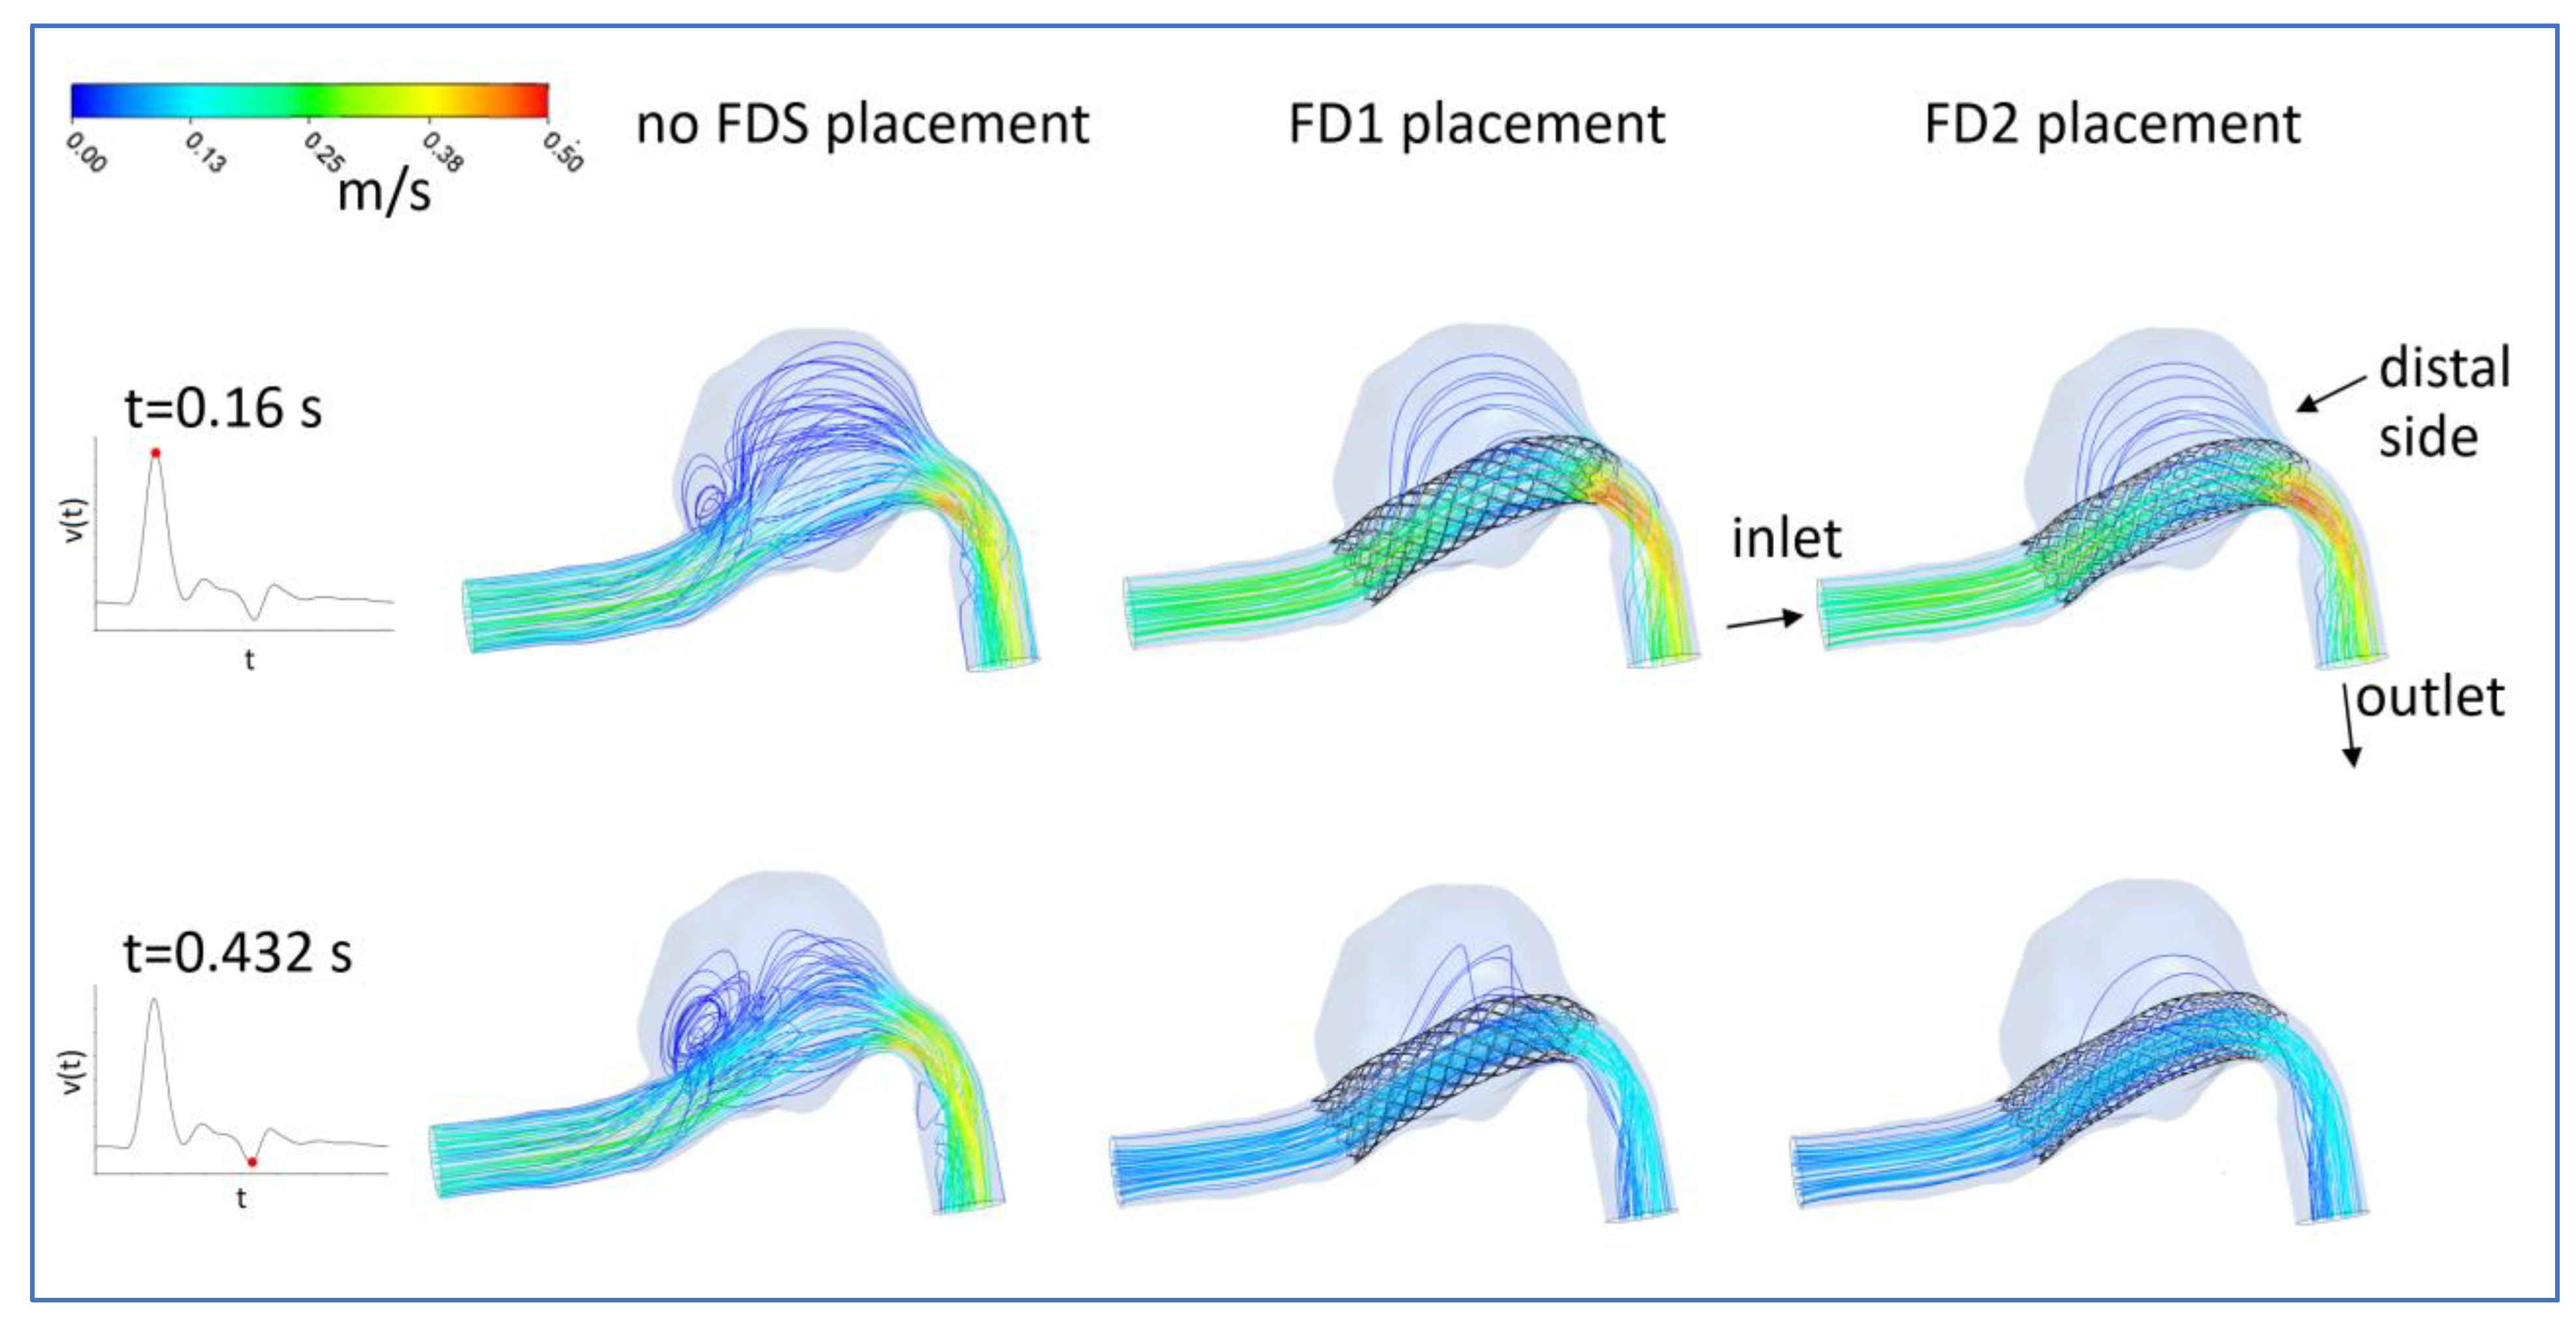
3.1. FDS Effects on Blood Flow

The deployment of the flow-diverting devices in the patient-specific geometry significantly altered the aneurysm hemodynamics. Figure 7 shows the time-averaged velocity contours on a longitudinal cross-section of the intracranial aneurysm in the analyzed conditions: the pre-operative condition, i.e., aneurysm with no FDS placement, and the simulated post-operative conditions, i.e., virtual placement of the FD1 and FD2 stents, respectively. The presence of flow diverter stents redirected blood flow within them, thus reducing the enlargement of the fluid vein in the dilatation, dampening the region of high velocity in the inflow zone, and restoring the original healthy stream direction, as shown in Figure 7. The results of the numerical investigation highlighted a significant decrease in the time-averaged velocity inside the aneurysm after FDS implantation and a greater blockage of blood supply to the aneurysm for the lower-porosity FD2 stent.
The instantaneous velocity contours on the longitudinal section of the aneurysm confirmed the diversion of blood flow from the aneurysmal sac in the majority of the cardiac cycle (Figure 8). It is interesting to note the FDS efficacy in reducing velocity inside the aneurysmal dome in almost all phases of the cardiac cycle, that is, in the systolic acceleration phase, the diastolic minimum, and the late diastole phase. On the contrary, in the absence of FDS placement, extensive regions of high velocity values were observed in the aneurysm dome, as depicted in the first column of Figure 8. At the systolic peak instant (t = 0.16 s), the FDS efficacy in decreasing the high-velocity regions in the dome was less than in the other instants, as the flow diverting devices were not able to completely contain inside them the incoming fast flow. However, unlike the other phases of the cardiac cycle, this instant was not associated with a large recirculation involving the entire aneurysm dome, as shown in Figure 9.
The last consideration suggested that the effectiveness of the devices for the treatment of intracranial aneurysms could be better evaluated by considering additional hemodynamic indicators able to take into account the complexity of the blood flow. With this aim, the distribution on the aneurysm surface of the time-averaged parameters TAWSS, OSI, ECAP, and RRT was evaluated in order to quantify the tendency toward thrombus formation and the consequent evaluation of the FDS efficacy. In addition, streamline evolution during the cardiac cycle was analyzed. The knowledge of the flow evolution during the cardiac cycle was significant because recirculating flow associated with low TAWSS has been considered responsible for the deterioration of the arterial wall [37,38]. In particular, the dynamics of the recirculation regions give rise to non-physiological WSS, which in turn appears to be negatively correlated with thrombus deposition [39].
The 2D streamline evolution during the cardiac cycle is illustrated in Figure 9. In addition, Figure 10 shows the 3D streamlines in the considered models at the instants of systolic peak (t = 0.16 s) and diastolic minimum (t = 0.64 s).
At the selected instants of the cardiac cycle, different flow patterns were observed. The flow distribution in the longitudinal plane revealed a large recirculation area in the aneurysm that was found at all instants of the cardiac cycle in the absence of FDS treatment (Figure 9, first column). Referring to this pre-operative condition, it can be observed as follows. A counterclockwise recirculation area involved the entire aneurysm dome at all instants of the cardiac cycle except the instant of the systolic peak. In the presence of this large vortex, the flow pattern was divided into two separate regions: a recirculating region confined to the aneurysm dome and an underlying fluid vein advancing in the original stream direction. In the phase of systolic acceleration, the pre-existing vortical region emerging from the previous cycle was reduced due to the action of the blood flow entering the aneurysm that compressed the vortex region, confining it to the top of the dome (Figure 9, t = 0.112 s). At the instant of the systolic peak, t = 0.16 s, only a small recirculating region caused by flow detachment from the wall was observed. This vortex was confined to the proximal area of the aneurysm by the fast blood flow advancing in the mainstream direction that widened into the dilatation. As the velocity assigned at the inlet of the IA model decreased (during the cardiac cycle), the vortex gradually widened to the entire aneurysm dome (Figure 9, t = 0.208 s). In the last phase of the cardiac cycle, the low velocity inlet values characterizing the late diastole allowed for the maintenance of a large recirculating region at all instants of the diastolic phase, as shown in Figure 9 for t = 0.432 s and t = 0.64 s. In this phase, a single large vortex was observed, caused by the slow flow entering the dilatation distally and flowing back along the aneurysm wall.
Figure 10 shows the 3D streamlines at the systolic peak instant t = 0.16 s and the diastolic minimum instant t = 0.64 s in the considered pre- and post-operative models of the intracranial aneurysm.
The presence of flow diverter stents significantly altered the described blood flow dynamics. The flow redirection effect, due to the FD1 or FD2 placement, determined a substantial reduction in flow recirculation and velocity magnitude inside the aneurysm, as depicted in the second and third columns of Figure 8, Figure 9 and Figure 10. The lower porosity of the FD2 stent enhanced this effect, determining a further decrease in the velocity values inside the aneurysm and preventing or weakening the formation of the vortex region.

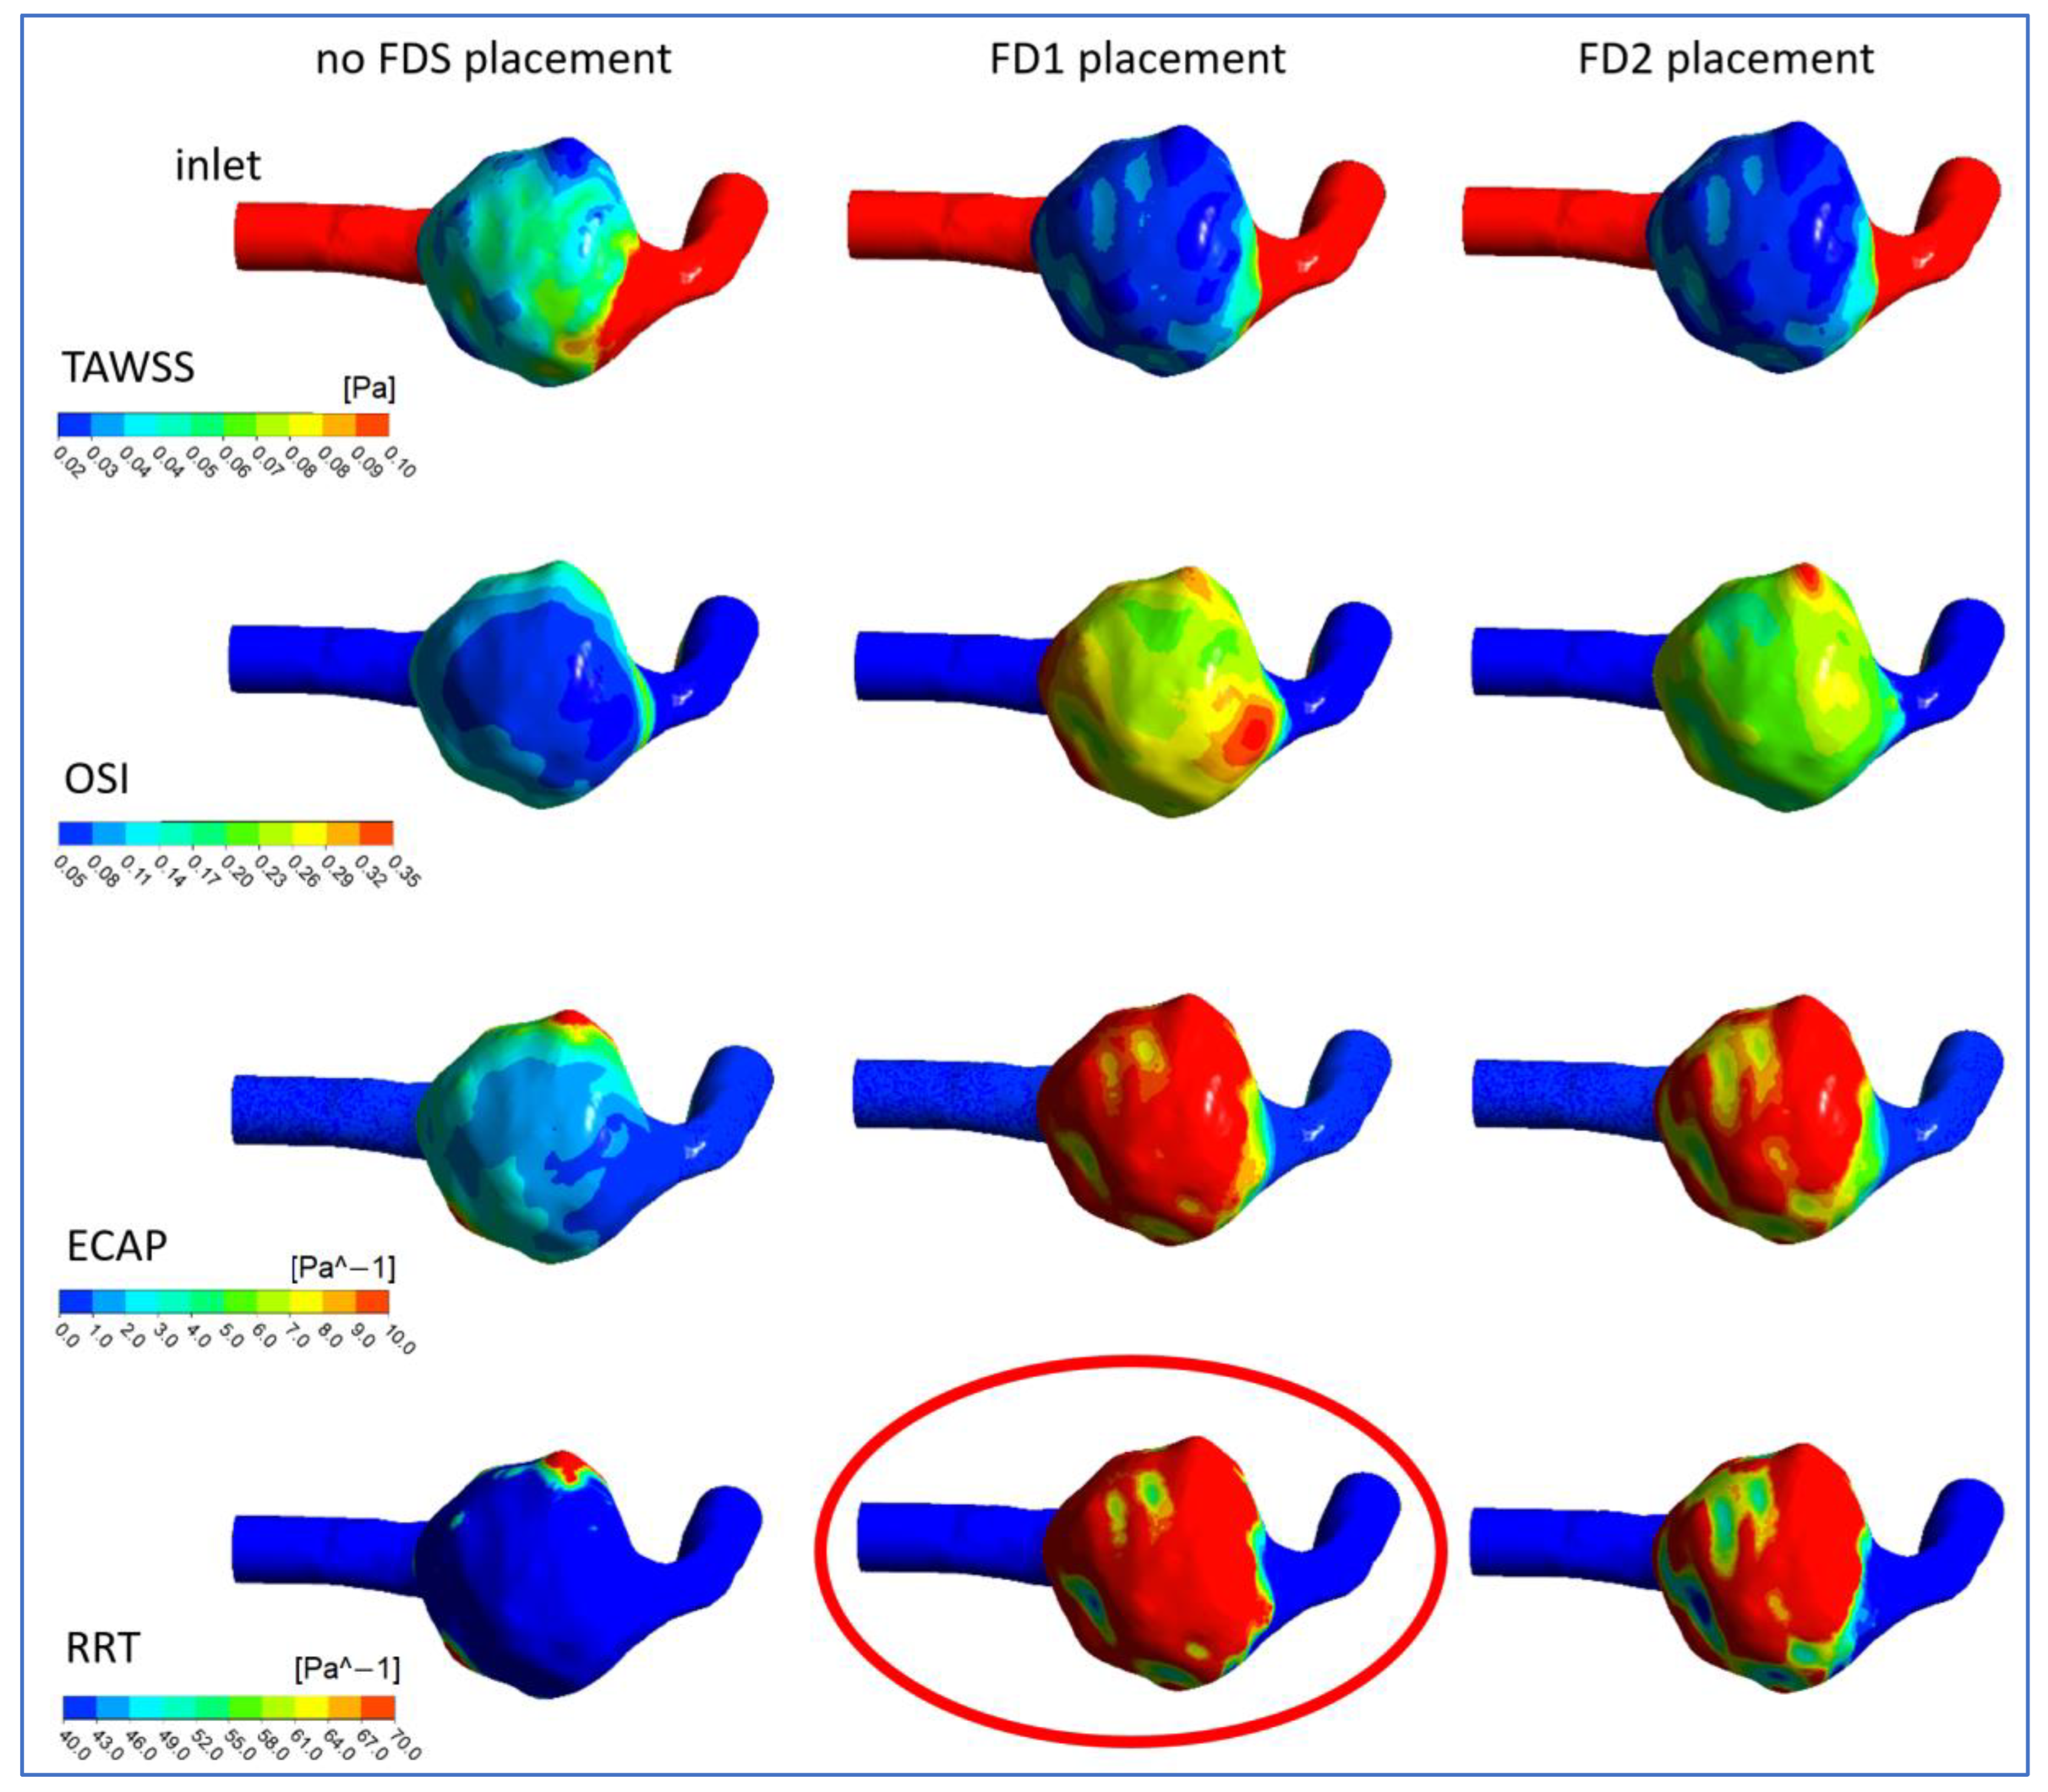
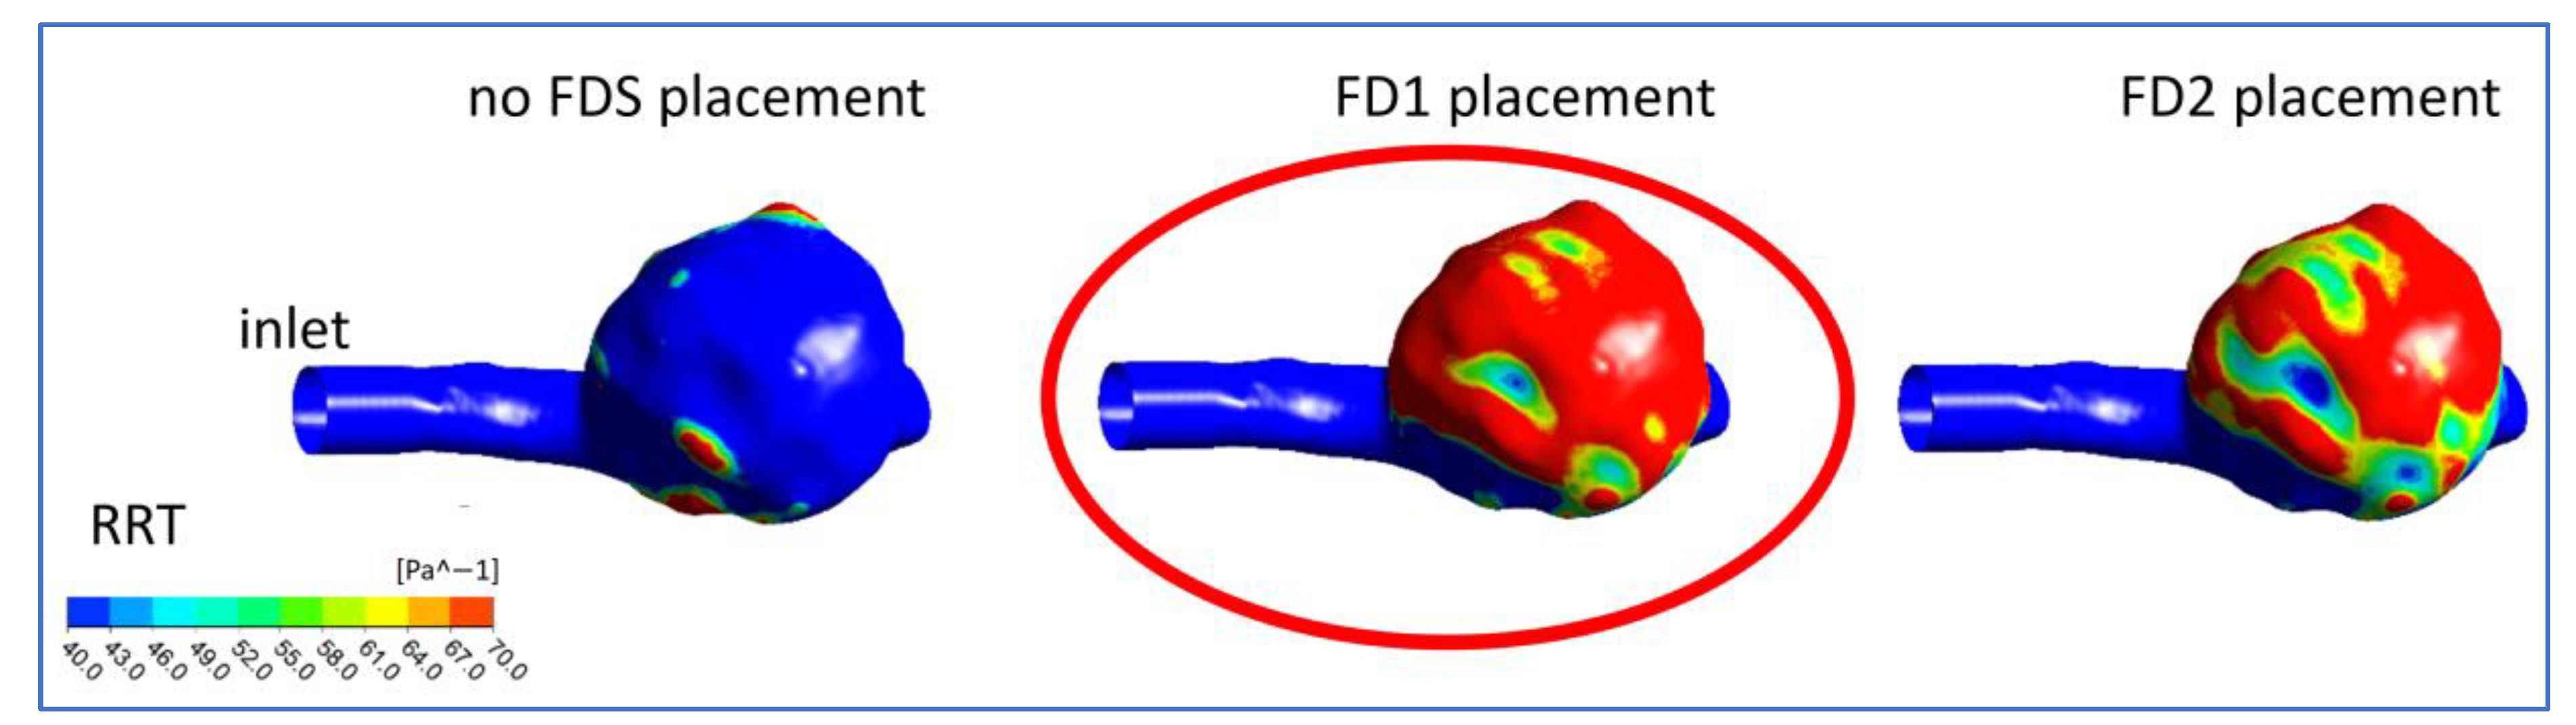
3.2. Hemodynamic Parameters

The hemodynamic parameters averaged over the cardiac cycle were significantly modified by the virtual deployment of the flow diverter stents. The distributions of TAWSS, OSI, ECAP, and RRT for the pre-operative model of the aneurysm and the post-operative ones are shown in Figure 11. After FDS placement, significant increases inside the aneurysm were observed for all hemodynamic indices except TAWSS, which, on the contrary, decreased on the surface of the aneurysm (Figure 11). In fact, the flow redirection effect due to the stent placement translated into a reduction of TAWSS values on the aneurysmal dome, determining an advantageous effect on the aneurysmal flow pattern.
Furthermore, the alteration of the flow due to the FDS treatment produced an elevation of the OSI and modified its distribution on the aneurysm wall. The higher OSI values observed in the dome indicated remarkable fluctuations of the WSS vector during the cardiac cycle in the aneurysm.
Numerical results highlighted that the high OSI region increased with the increase in the FDS porosity, that is, in the case of the FD1 placement. However, high OSI alone is not sufficient for identifying critical regions for thrombus formation, while the regions where both high OSI and low TAWSS were found, have a high probability of thrombus deposition [39]. Thus, the ECAP parameter was analyzed since it combines the effects of OSI and TAWSS, taking into account the level of the shear and its oscillatory character [36]. As well documented in the literature, this parameter is an appropriate hemodynamic indicator for identifying the endothelial susceptibility of the aneurysm wall [35]. The deployment of FD1 and FD2 stents in the parent vessel harboring the aneurysm resulted in a substantial increase in the ECAP values, especially at the top of the aneurysmal dome. Again, the higher porosity of the FD1 stent, which was less effective in reducing intra-aneurysm velocity and recirculation, determined a greater increase in the high ECAP region than in the FD2 case.
At last, a substantial increase in RRT on the aneurysm wall compared to the pre-operative condition was found in the presence of FDS placement, as shown in the last row of Figure 11 and in the different aneurysm views illustrated in Figure 12.
The extensive regions with high RRT observed in the presence of FDS treatments indicated blood flow stagnation in the aneurysmal dome and suggested the formation of thrombogenic conditions advantageous for aneurysm occlusion, confirming the efficacy of the FDS treatments. The use of the FD1 stent, characterized by the higher porosity, enhanced this beneficial effect, further increasing the residence time of blood (RRT) in the neighborhood of the vascular endothelium, as depicted in the last row of Figure 11 and in Figure 12. Although the higher porosity of this stent partially allowed blood inflow into the aneurysm, the more extensive regions of high RRT suggested the FD1’s greater efficacy in producing blood thrombosis and aneurysm occlusion.

3.3. Study Limitations

The main assumptions adopted in the current study are analyzed in the following.
Because the patient-specific velocity profile was not available, a pulsatile velocity waveform typical of the vertebral artery was taken from the literature and used as inlet boundary condition for the computational models. Despite the fact that patient-specific inflow is desirable for flow simulations in patient-specific analysis, the use of a literature waveform does not limit the validity of the numerical investigation since patient-specific inlet waveforms minimally affect the hemodynamics of patient-specific intracranial aneurysms [40]. Confirming this, a recent study conducted on 156 intracranial aneurysms indicated that patient-specific inflow boundary conditions may not be a must-have condition in CFD simulations, and hemodynamic parameters associated with rupture are the same using patient-specific and generalized inflow boundary conditions [41].
Another assumption that may affect the results of this study is the hypothesis of a rigid wall of the aneurysm, although it is commonly adopted in most computational studies on the hemodynamics of cerebral aneurysms. This assumption is justified by the loss of elastic lamina and substantial variability in collagen architecture found in cerebral aneurysms, which results in reduced wall compliance [42,43]. On the other hand, fluid–structure interaction investigations, which account for wall compliance, require information on patient-specific material properties of the arterial wall, including aneurysm wall stiffness, thrombus properties, and the local thickness of the aneurysm wall. These quantities are difficult to evaluate, and the lack of this information can result in marked differences in the distributions of the fundamental hemodynamic parameters. As an example, accounting for non-uniform wall thickness distribution in fluid-structure simulations, strong differences were found in the wall stress distribution, and much higher stress values were found in the rupture site of an intracranial aneurysm compared to a configuration with constant wall thickness [44]. Future studies will address these limitations. Furthermore, it could be interesting to investigate the influence of pore density on the efficacy of the FDS endovascular treatment.

4. Conclusions

In recent years, flow diverting devices have become an effective alternative to conventional treatments of intracranial aneurysms. Understanding FDS’s effectiveness in inducing aneurysm occlusion may be fundamental for treatment planning. To achieve this aim, a computational investigation of the hemodynamics of a patient-specific intracranial aneurysm reconstructed from medical images and virtually treated with FDS was performed. The FDS porosity was taken into account as it plays a crucial role in the effectiveness of the device. This parameter affects the stent’s ability to redirect blood flow away from the aneurysm into the parent artery. A low porosity is desirable, but if the porosity is too low, the stent might become too rigid for deployment. Two possible post-operative conditions were simulated, with the deployment of flow diverter stents differing in porosity. A comparison of the devices in modifying cerebral aneurysm hemodynamics was analyzed. The flow diverter stents were virtually implanted in the parent vessel harboring the aneurysm, with the devices covering the entire neck area. The placement of the devices determined a substantial reduction in flow recirculation and velocity magnitude inside the aneurysm. A reduction of the TAWSS values and an increase in the OSI and ECAP values were found. In particular, the relative residence time RRT on the aneurysmal wall markedly increased, indicating blood flow stagnation in the dome and thrombogenic conditions for the aneurysm occlusion.
Interestingly, the different impact of the considered flow diverter stents on the aneurysmal hemodynamics. An increase in the region occupied by higher RRT was observed for an increase in the porosity of the flow diverter device, that is, for virtual implantation of the FD1 stent. Although this higher porous stent was less effective in decreasing flow recirculation and velocity within the aneurysm dome, it determined more marked increases in the ECAP and RRT values on the aneurysm wall, thus resulting more effective in thrombus formation and aneurysm occlusion.
At last, the current study highlighted how a computational investigation of the effects of FDS placement performed before the actual surgical procedure can provide valuable information on the most effective treatment to achieve the desired therapeutic result.

Author Contributions

Conceptualization, M.A.B.; methodology, M.A.B. and T.O.S.; software, M.A.B. and T.O.S.; validation, M.A.B., R.M. and T.O.S.; formal analysis, M.A.B.; investigation, M.A.B., R.M. and T.O.S.; resources, M.A.B.; writing—original draft preparation, M.A.B. and T.O.S.; writing—review and editing, M.A.B., R.M. and T.O.S.; supervision, M.A.B.; project administration, M.A.B.; funding acquisition, M.A.B. All authors have read and agreed to the published version of the manuscript.

Funding

This research was funded by “Sapienza University of Rome” Progetti di Ricerca (Piccoli, Medi)—Progetti Piccoli, 2021. Protocol number: RP12117A5D8437A8.

Data Availability Statement

Not applicable.

Acknowledgments

The authors would like to acknowledge Enrico Marchese for providing the anonymous patient-specific medical images and useful comments about them.

Conflicts of Interest

The authors declare no conflict of interest.

References

  1. Etminan, N.; Rinkel, G.J. Unruptured intracranial aneurysms: Development, rupture and preventive management. Nat. Rev. Neurol. 2016, 12, 699–713. [Google Scholar] [CrossRef] [PubMed]
  2. Texakalidis, P.; Sweid, A.; Mouchtouris, N.; Peterson, E.C.; Sioka, C.; Rangel-Castilla, L.; Reavey-Cantwell, J.; Jabbour, P. Aneurysm Formation, Growth, and Rupture: The Biology and Physics of Cerebral Aneurysms. World Neurosurg. 2019, 130, 277–284. [Google Scholar] [CrossRef] [PubMed]
  3. Meng, H.; Tutino, V.M.; Xiang, J.; Siddiqui, A. High WSS or low WSS? Complex interactions of hemodynamics with intracranial aneurysm initiation, growth, and rupture: Toward a unifying hypothesis. AJNR Am. J. Neuroradiol. 2014, 35, 1254–1262. [Google Scholar] [CrossRef] [PubMed] [Green Version]
  4. Qiu, T.; Jin, G.; Xing, H.; Lu, H. Association between hemodynamics, morphology, and rupture risk of intracranial aneurysms: A computational fluid modeling study. Neurol. Sci. 2017, 38, 1009–1018. [Google Scholar] [CrossRef] [Green Version]
  5. Hsiai, T.K.; Cho, S.K.; Honda, H.M.; Hama, S.; Navab, M.; Demer, L.L.; Ho, C.M. Endothelial cell dynamics under pulsating flows: Significance of high versus low shear stress (d(tau)/dt). Ann. Biomed. Eng. 2002, 30, 646–656. [Google Scholar] [CrossRef] [PubMed]
  6. Murayama, Y.; Fujimura, S.; Suzuki, T.; Takao, H. Computational fluid dynamics as a risk assessment tool for aneurysm rupture. Neurosurg. Focus 2019, 47, E12. [Google Scholar] [CrossRef] [Green Version]
  7. Jin, Z.H.; Gerdroodbary, M.B.; Valipour, P.; Faraji, M.; Abu-Hamdeh, N.H. CFD investigations of the blood hemodynamic inside internal cerebral aneurysm (ICA) in the existence of coiling embolism. Alex. Eng. J. 2023, 66, 797–809. [Google Scholar] [CrossRef]
  8. Byrne, J.V.; Beltechi, R.; Yarnold, J.A.; Birks, J.; Kamran, M. Early experience in the treatment of intra-cranial aneurysms by endovascular flow diversion: A multicentre prospective study. PLoS ONE 2010, 5, e12492. [Google Scholar] [CrossRef]
  9. Venguru, S.; Nguyen, K.; Davidson, J. Intracranial Aneurysms: Evaluation of Braid Pore Configurations on Flow Disruption with Flow Diverter Devices. Biomed. Sci. Technol. 2019, 1, 18–26. [Google Scholar]
  10. Sadasivan, C.; Cesar, L.; Seong, J.; Rakian, A.; Hao, Q.; Tio, F.O.; Wakhloo, A.K.; Lieber, B.B. An original flow diversion device for the treatment of in-tracranial aneurysms: Evaluation in the rabbit elastase-induced model. Stroke 2009, 40, 952–958. [Google Scholar] [CrossRef] [PubMed] [Green Version]
  11. Mutlu, O.; Olcay, A.B.; Bilgin, C.; Hakyemez, B. Evaluating the Effectiveness of 2 Different Flow Diverter Stents Based on the Stagnation Region Formation in an Aneurysm Sac Using Lagrangian Coherent Structure. World Neurosurg. 2019, 127, e727–e737. [Google Scholar] [CrossRef]
  12. Zhang, Y.; Wang, Y.; Kao, E.; Flórez-Valencia, L.; Courbebaisse, G. Towards optimal flow diverter porosity for the treatment of intracranial aneurysm. J. Biomech. 2019, 82, 20–27. [Google Scholar] [CrossRef]
  13. Dholakia, R.; Sadasivan, C.; Fiorella, D.J.; Woo, H.H.; Lieber, B.B. Hemodynamics of flow diverters. J. Biomech. Eng. 2017, 139, 021002. [Google Scholar] [CrossRef] [Green Version]
  14. Suzuki, T.; Takao, H.; Fujimura, S.; Dahmani, C.; Ishibashi, T.; Mamori, H.; Fukushima, N.; Yamamoto, M.; Murayama, Y. Selection of helical braided flow diverter stents based on hemodynamic performance and mechanical properties. J. Neurointerv. Surg. 2017, 9, 999–1005. [Google Scholar] [CrossRef] [PubMed] [Green Version]
  15. Kim, S.; Yang, H.; Hong, I.; Oh, J.H.; Kim, Y.B. Computational Study of Hemodynamic Changes Induced by Overlapping and Compacting of Stents and Flow Diverter in Cerebral Aneurysms. Front Neurol. 2021, 12, 705841. [Google Scholar] [CrossRef] [PubMed]
  16. Nada, A.; Hassan, M.A.; Fakhr, M.A.; El-Wakad, M.T.I. Studying the effect of stent thickness and porosity on post-stent implantation hemodynamics. J. Med. Eng. Technol. 2021, 45, 408–416. [Google Scholar] [CrossRef] [PubMed]
  17. Catalán-Echeverría, B.; Kelly, M.E.; Peeling, L.; Bergstrom, D.; Chen, X.; Malvè, M. CFD-Based Comparison Study of a New Flow Diverting Stent and Commercially-Available Ones for the Treatment of Cerebral Aneurysms. Appl. Sci. 2019, 9, 1341. [Google Scholar] [CrossRef] [Green Version]
  18. Bouillot, P.; Brina, O.; Ouared, R.; Yilmaz, H.; Lovblad, K.O.; Farhat, M.; Pereira, V.M. Computational fluid dynamics with stents: Quantitative comparison with particle image velocimetry for three commercial off the shelf intracranial stents. J. Neurointerv. Surg. 2016, 8, 309–315. [Google Scholar] [CrossRef]
  19. Saqr, K.M.; Mansour, O.; Tupin, S.; Hassan, T.; Ohta, M. Evidence for non-Newtonian behavior of intracranial blood flow from Doppler ultrasonography measurements. Med. Biol. Eng. Comput. 2019, 57, 1029–1036. [Google Scholar] [CrossRef]
  20. Abdehkakha, A.; Hammond, A.L.; Patel, T.R.; Siddiqui, A.H.; Dargush, G.F.; Meng, H. Cerebral aneurysm flow diverter modeled as a thin inhomogeneous porous medium in hemodynamic simulations. Comput. Biol. Med. 2021, 139, 104988.20. [Google Scholar] [CrossRef]
  21. Ngoepe, M.N.; Ventikos, Y. Computational modelling of clot development in pa-tient-specific cerebral aneurysm cases. J. Thromb Haemost. 2016, 14, 262–272. [Google Scholar] [CrossRef] [PubMed] [Green Version]
  22. Xu, J.; Karmonik, C.; Yu, Y.; Lv, N.; Shi, Z.; Liu, J.M.; Huang, Q. Modeling flow diverters using a porous medium approach: A fast alternative to virtual flow diverter deployment. World Neurosurg. 2022, 164, e501–e508. [Google Scholar] [CrossRef] [PubMed]
  23. Rouchaud, A.; Brinjikji, W.; Lanzino, G.; Cloft, H.J.; Kadirvel, R.; Kallmes, D.F. Delayed Hemorrhagic Complications after Flow Diversion for Intracranial Aneurysms: A Literature Overview. Neuroradiology 2016, 58, 171–177. [Google Scholar] [CrossRef] [Green Version]
  24. Cebral, J.R.; Mut, F.; Raschi, M.; Scrivano, E.; Ceratto, R.; Lylyk, P.; Putman, C.M. Aneurysm rupture following treatment with flow diverting stents: Computational hemodynamics analysis of treatment. AJNR Am. J. Neuroradiol. 2011, 32, 27–33. [Google Scholar] [CrossRef] [PubMed] [Green Version]
  25. Himburg, H.A.; Grzybowski, D.M.; Hazel, A.L.; LaMack, J.A.; Li, X.M.; Friedman, M.H. Spatial comparison between wall shear stress measures and porcine arterial endothelial permeability. Am. J. Physiol. Heart Circ. Physiol. 2004, 286, H1916–H1922. [Google Scholar] [CrossRef] [Green Version]
  26. Rayz, V.; Boussel, L.; Ge, L.; Leach, J.; Martin, V.; Lawton, V.; McCulloch, V.; Saloner, D. Flow Residence Time and Regions of Intraluminal Thrombus Deposition in Intracranial Aneurysms. Ann. Biomed. Eng. 2010, 38, 3058–3069. [Google Scholar] [CrossRef] [PubMed] [Green Version]
  27. Lee, S.W.; Antiga, L.; Steinman, D.A. Correlation among indicators of disturbed flow at the normal carotid bifurcation. J. Biomech. Ing. 2009, 131, 061013. [Google Scholar] [CrossRef]
  28. Schlichting, H. Boundary Layer Theory, 7th ed.; McGraw-Hill: New York, NY, USA, 1979. [Google Scholar]
  29. Reymond, P.; Merenda, F.; Perren, F.; Rüfenacht, D.; Stergiopulos, N. Validation of a one-dimensional model of the systemic arterial tree. Am. J. Physiol. Heart Circ. Physiol. 2009, 297, H208–H222. [Google Scholar] [CrossRef] [Green Version]
  30. Shibeshi, S.S.; Collins, W.E. The rheology of blood flow in a branched arterial system. Appl. Rheol. 2005, 15, 398–405. [Google Scholar] [CrossRef]
  31. ANSYS. Workbench User’s Guide, Release 2022 R1, January 2022; ANSYS, Inc.: Canonsburg, PA, USA, 2022. [Google Scholar]
  32. Ferziger, J.H.; Peric, M. Computational Methods for Fluid Dynamics; Springer: Berlin/Heidelberg, Germany, 2001; ISBN 978-3-540-42074-3. [Google Scholar]
  33. He, X.; Ku, D.N. Pulsatile flow in the human left coronary artery bifurcation: Average conditions. J. Biomech. Eng. 1996, 118, 74–82. [Google Scholar] [CrossRef]
  34. Sorescu, G.P.; Song, H.N.; Tressel, S.L.; Hwang, J.; Dikalov, S.; Smith, D.A.; Boyd, N.L.; Platt, M.O.; Lassègue, B.; Griendling, K.K.; et al. Bone morphogenic protein 4 produced in endothelial cells by oscillatory shear stress induces monocyte adhesion by stimulating reactive oxygen species production from a nox1-based NADPH oxidase. Circ. Res. 2004, 95, 773–779. [Google Scholar] [CrossRef] [Green Version]
  35. Di Achille, P.; Tellides, G.; Figueroa, C.A.; Humphrey, J.D. A haemodynamic predictor of intraluminal thrombus formation in abdominal aortic aneurysms. Proc. R. Soc. Lond. Math. Phys. Eng. Sci. 2014, 470, 20140163. [Google Scholar] [CrossRef] [Green Version]
  36. Boniforti, M.A.; Cesaroni, M.C.; Magini, R.; Pasqui, E.; de Donato, G. Image-Based Numerical Investigation in an Impending Abdominal Aneurysm Rupture. Fluids 2022, 7, 269. [Google Scholar] [CrossRef]
  37. Cecchi, E.; Giglioli, C.; Valente, S.; Lazzeri, C.; Gensini, G.F.; Abbate, R.; Mannini, L. Role of hemodynamic shear stress in cardiovascular disease. Atherosclerosis. 2011, 214, 249–256. [Google Scholar] [CrossRef] [PubMed]
  38. Tarbell, J.M.; Shi, Z.D.; Dunn, J.; Jo, H. Fluid mechanics, arterial disease, and gene expression. Annu. Rev. Fluid Mech. 2014, 46, 591–614. [Google Scholar] [CrossRef] [Green Version]
  39. Boniforti, M.A.; Di Bella, L.; Magini, R. On the role of hemodynamics in predicting rupture of the abdominal aortic aneurysm. J. Zhejiang Univ. Sci. 2021, A 22, 957–978. [Google Scholar] [CrossRef]
  40. Xiang, J.; Siddiqui, A.H.; Meng, H. The effect of inlet waveforms on computational hemodynamics of patient-specific intracranial aneurysms. J. Biomech. 2014, 47, 3882–3890. [Google Scholar] [CrossRef] [PubMed] [Green Version]
  41. Li, W.; Wang, S.; Tian, Z.; Zhu, W.; Zhang, Y.; Zhang, Y.; Wang, Y.; Wang, K.; Yang, X.; Liu, J. Discrimination of intracranial aneurysm rupture status: Patient-specific inflow boundary may not be a must-have condition in hemodynamic simulations. Neuroradiology 2020, 62, 1485–1495. [Google Scholar] [CrossRef] [PubMed]
  42. Robertson, A.M.; Duan, X.; Aziz, K.M.; Hill, M.R.; Watkins, S.C.; Cebral, J.R. Diversity in the strength and structure of unruptured cerebral aneurysms. Ann. Biomed. Eng. 2015, 43, 1502–1515. [Google Scholar] [CrossRef] [PubMed] [Green Version]
  43. Rayz, V.L.; Cohen-Gadol, A.A. Hemodynamics of cerebral aneurysms: Connecting medical imaging and biomechanical analysis. Annu. Rev. Biomed. Eng. 2020, 22, 231–256. [Google Scholar] [CrossRef] [Green Version]
  44. Voß, S.; Glaßer, S.; Hoffmann, T.; Beuing, O.; Weigand, S.; Jachau, K.; Preim, B.; Thévenin, D.; Janiga, G. Berg, Fluid-structure simulations of a ruptured intracranial aneurysm: Constant versus patient-specific wall thickness. Comput. Math. Methods Med. 2016, 2016, 9854539. [Google Scholar] [CrossRef] [Green Version]
Figure 1. Schematic workflow chart of the intracranial aneurysm reconstruction from CTA images: (a) Volume rendering of the patient-specific intracranial aneurysm; (b) rough segmentation; (c) smoothing of the luminal surface; (d) insertion of extensions and global smoothing; (e) patient-specific final model. The arrows indicate the flow direction.
Fluids 08 00189 g001
Figure 2. (a) Patient-specific aneurysm and circles identifying the “skeleton” of the reference tube; (b) patient-specific aneurysm with the reference tube representing the scaffold of the flow diverter stents; (c) section view of the patient-specific aneurysm with virtual FDS placement.
Fluids 08 00189 g002
Figure 3. Pulsatile velocity waveform assigned at the inlet of the IA models. Red points indicate the instants of the cardiac cycle selected for the hemodynamic investigation.
Fluids 08 00189 g003
Figure 4. Dimensionless TAWSS along the middle curve in the patient-specific aneurysm for three different mesh sizes (coarse, medium, and fine): (a) pre-operative model with no FDS placement, number of mesh elements approximately equal to 1 × 10⁶, 2 × 10⁶, and 3 × 10⁶; (b,c) post-operative models with FD1 and FD2 placement respectively, number of mesh elements approximately equal to 2 × 10⁶, 3 × 10⁶, and 4 × 10⁶ in both cases.
Fluids 08 00189 g004
Figure 5. Mesh view of the cross section identified by the blue line in the intracranial aneurysm in the case of FDS placement. The finer mesh cells locate the position of the flow diverter stent.
Fluids 08 00189 g005
Figure 6. The 2D and 3D streamlines in the patient-specific aneurysm without stent placement at the instant t = 0.208 s of the cardiac cycle. The arrows highlight the direction of blood flow, coming from the parent artery, through the aneurysm dome, and towards the outlet.
Fluids 08 00189 g006
Figure 7. Time-averaged velocity contours on a longitudinal cut plane in the patient-specific intracranial aneurysm in the cases of aneurysms with no stent placement, with FD1 stent placement, and with FD2 stent placement. The inflow zone is the area of the aneurysm neck where the blood flow enters the aneurysm.
Fluids 08 00189 g007
Figure 8. Velocity magnitude contours on the longitudinal section of the intracranial aneurysm at the selected instants of the cardiac cycle. The first column refers to the pre-operative condition (absence of FDS placement); the second and third columns refer to the simulated post-operative conditions, that is, FD1 and FD2 placement, respectively.
Fluids 08 00189 g008
Figure 9. The 2D streamlines evolution during the cardiac cycle in the patient-specific aneurysm without a flow diverter stent (first column), with the FD1 stent placement (second column), and the FD2 stent placement (third columns). The streamlines were colored by the local velocity magnitude. The same number of streamlines was considered in all three cases.
Fluids 08 00189 g009
Figure 10. The 3D streamlines in the patient-specific aneurysm without a flow diverter stent (first column), with the FD1 stent placement (second column), and the FD2 stent placement (third columns) at the systolic peak instant t = 0.16 s and the diastolic minimum instant t = 0.64 s. The streamlines were colored by the local velocity magnitude. The same number of streamlines was considered in all three cases.
Fluids 08 00189 g010
Figure 11. TAWSS, OSI, ECAP, and RRT contours on the luminal surfaces of the patient-specific aneurysm in the pre-operative condition (absence of FDS placement, first column) and in the considered post-operative conditions (FD1 and FD2 flow diverter placement, second and third columns, respectively). The red circle highlights the high RRT values due to the FD1 placement.
Fluids 08 00189 g011
Figure 12. RRT contours on the luminal surfaces of the patient-specific aneurysm in the considered cases: absence of FDS placement, FD1 flow diverter placement, and FD2 flow diverter placement. The red circle highlights the high RRT values due to the FD1 placement.
Fluids 08 00189 g012
Table 1. WSS at the systolic peak instant (t = 0.16 s), averaged on the artery wall, for different numbers of mesh elements in the pre-operative IA model and in the two post-operative ones.
No FDS Placement FD1 Placement FD2 Placement
Elements
(approximate number)
WSS (Pa)Elements
(approximate number)
WSS (Pa)Elements
(approximate number)
WSS (Pa)
1 × 10⁶ 1.24014 2 × 10⁶ 1.27182 × 10⁶ 1.22263
2 × 10⁶ 1.231363 × 10⁶ 1.233663 × 10⁶ 1.21016
3 × 10⁶ 1.240954 × 10⁶ 1.23314 × 10⁶ 1.2181
Disclaimer/Publisher’s Note: The statements, opinions and data contained in all publications are solely those of the individual author(s) and contributor(s) and not of MDPI and/or the editor(s). MDPI and/or the editor(s) disclaim responsibility for any injury to people or property resulting from any ideas, methods, instructions or products referred to in the content.

