1. Introduction
The discharge of non-Newtonian, complex fluids is a ubiquitous but often problematic process due to the complex rheology of such fluids that can reduce or even prevent their discharge flow from containers and also result in residual fluid (the so called “heel”) left in the container at the end of the discharge process [
1,
2,
3,
4,
5]. The formation of the heel is undesired and important not only in industrial vessels [
1,
6] but also in consumer packaging, although the latter issue has not received much attention, as discussed elsewhere [
2,
5].
Among consumer packaging systems, dispensing bottles operating with a hand pump are highly relevant since these bottles are commonly used as containers for a variety of personal and oral care products, such as lotions, gels, shampoos, soaps, and many other complex fluids [
7]. In such systems, the fluid is discharged through a dip tube inserted in the bottle. As the hand pump head is depressed, the fluid in the pump housing is discharged. When the pump head is released, the pump starts to recover to its initial position and draws the fluid up into its housing, thus preparing the hand pump for the next pumping action. It is clearly desirable to understand the hydrodynamics in these systems in order to provide better designs of dispensing systems that can result in improving the discharge process by increasing the pump recovery rate while minimizing the amount of residual heel.
Several parameters may impact the hydrodynamics in dispensing bottles, such as bottle geometry, suction pressure, dip tube shape, diameter, and off-bottom clearance. Although critical for the functionality of the dispensing system, the effect of these geometric and operational parameters on the discharge of complex fluids from such systems has not yet been fully investigated. In fact, a literature review shows that only a few attempts have been made to investigate the effect of orifice geometry and fluid rheology on the discharge of complex fluids through the orifices of vessels and pipes [
8,
9,
10,
11,
12,
13]. Additionally, there has been a lack of insightful information for more complex systems such as dispensing bottles, from which the fluid is discharged through the dip tube under a differential suction pressure. Recently, our research group has reported results obtained both experimentally, via Particle Image Velocimetry (PIV), and computationally, via Computational Fluid Dynamics (CFD), to quantify and predict the heel volume [
5]. Accordingly, we have shown that the rheological properties of the fluids significantly affect the heel profile and volume. However, how other parameters such as the dip tube orifice geometry impact the discharge hydrodynamics and the residual heel volume remains largely uninvestigated.
Therefore, in this work, we investigate the effect of the dip tube orifice shape and clearance on the hydrodynamic characteristics of the dispensing system, and, consequently, on the formation of the heel. To do so, we used a gel consisting of a mixture of xanthan gum, glycerin, and water, which forms the basis of most commercial liquid products for consumer products [
14]. Here, Particle Image Velocimetry (PIV) was used as the primary tool to monitor the flow during the discharge process and to determine the shape of the residual heel thereafter. Additionally, a weighing method was employed to quantify the heel mass and volume. We found that larger dip tube orifice clearances resulted in larger heel volumes and, more importantly, that using a flat cut orifice significantly reduced the heel while providing the highest volumetric flow rate during the discharge, as opposed to the more commonly used angled cut orifices.
2. Experimental Apparatus, Materials, and Methods
2.1. Experimental Apparatus
Mixer: The fluid was prepared using a Whip Mix WPM2 mixer (Whip Mix Corp., Louisville, KY, USA). This mixer operates under vacuum during the mixing process, which minimizes the number of air bubbles in the fluid that may result in light reflections during the PIV experiments [
15].
Centrifuge: The test fluid studied here was centrifuged at 3000 RPM for 3 min using an Eppendorf Centrifuge 5804 (Thermo Fisher Scientific, Waltham, MA, USA) before the experiments.
Vacuum Pump: A GAST DOA-P704-AA vacuum pump (GAST, Benton Harbor, MI, USA) was used to generate the desired suction pressure to allow the fluid in the bottle to be discharged from it.
Manometer: A Traceable® digital manometer (VWR International, Radnor, Pennsylvania, USA) was used to set the suction pressure to the desired value. Pressure measurements were taken at the orifice of the dip tube with the dip tube removed from the bottle.
Test Bottle and Tubing: A commercial bottle identical to the one previously described and used in our recent studies [
5,
16] was also used in this work. The bottle had a total height,
h, of 103 mm, an inner diameter,
D, of 42 mm, and an outer diameter,
Do, of 45 mm. The lower bump (dimple) of the bottle bottom was 5 mm high, as measured from the bottle bottom base rim.
Two modifications were made to the original hand pump of the bottle: (1) the upper housing, including the piston of the pump, was replaced with a fitting connected to the vacuum pump generating a differential suction pressure of about −0.135 bar (measured at the orifice of the dip tube using the digital manometer), mimicking the suction effect of the original hand pump, and (2) the dip tube of the pump was replaced with clear polycarbonate tubing to facilitate optical investigations.
The dip tube had an inner diameter,
d, of 4 mm and an outer diameter,
do, of 6 mm. The off-bottom clearance of the tube,
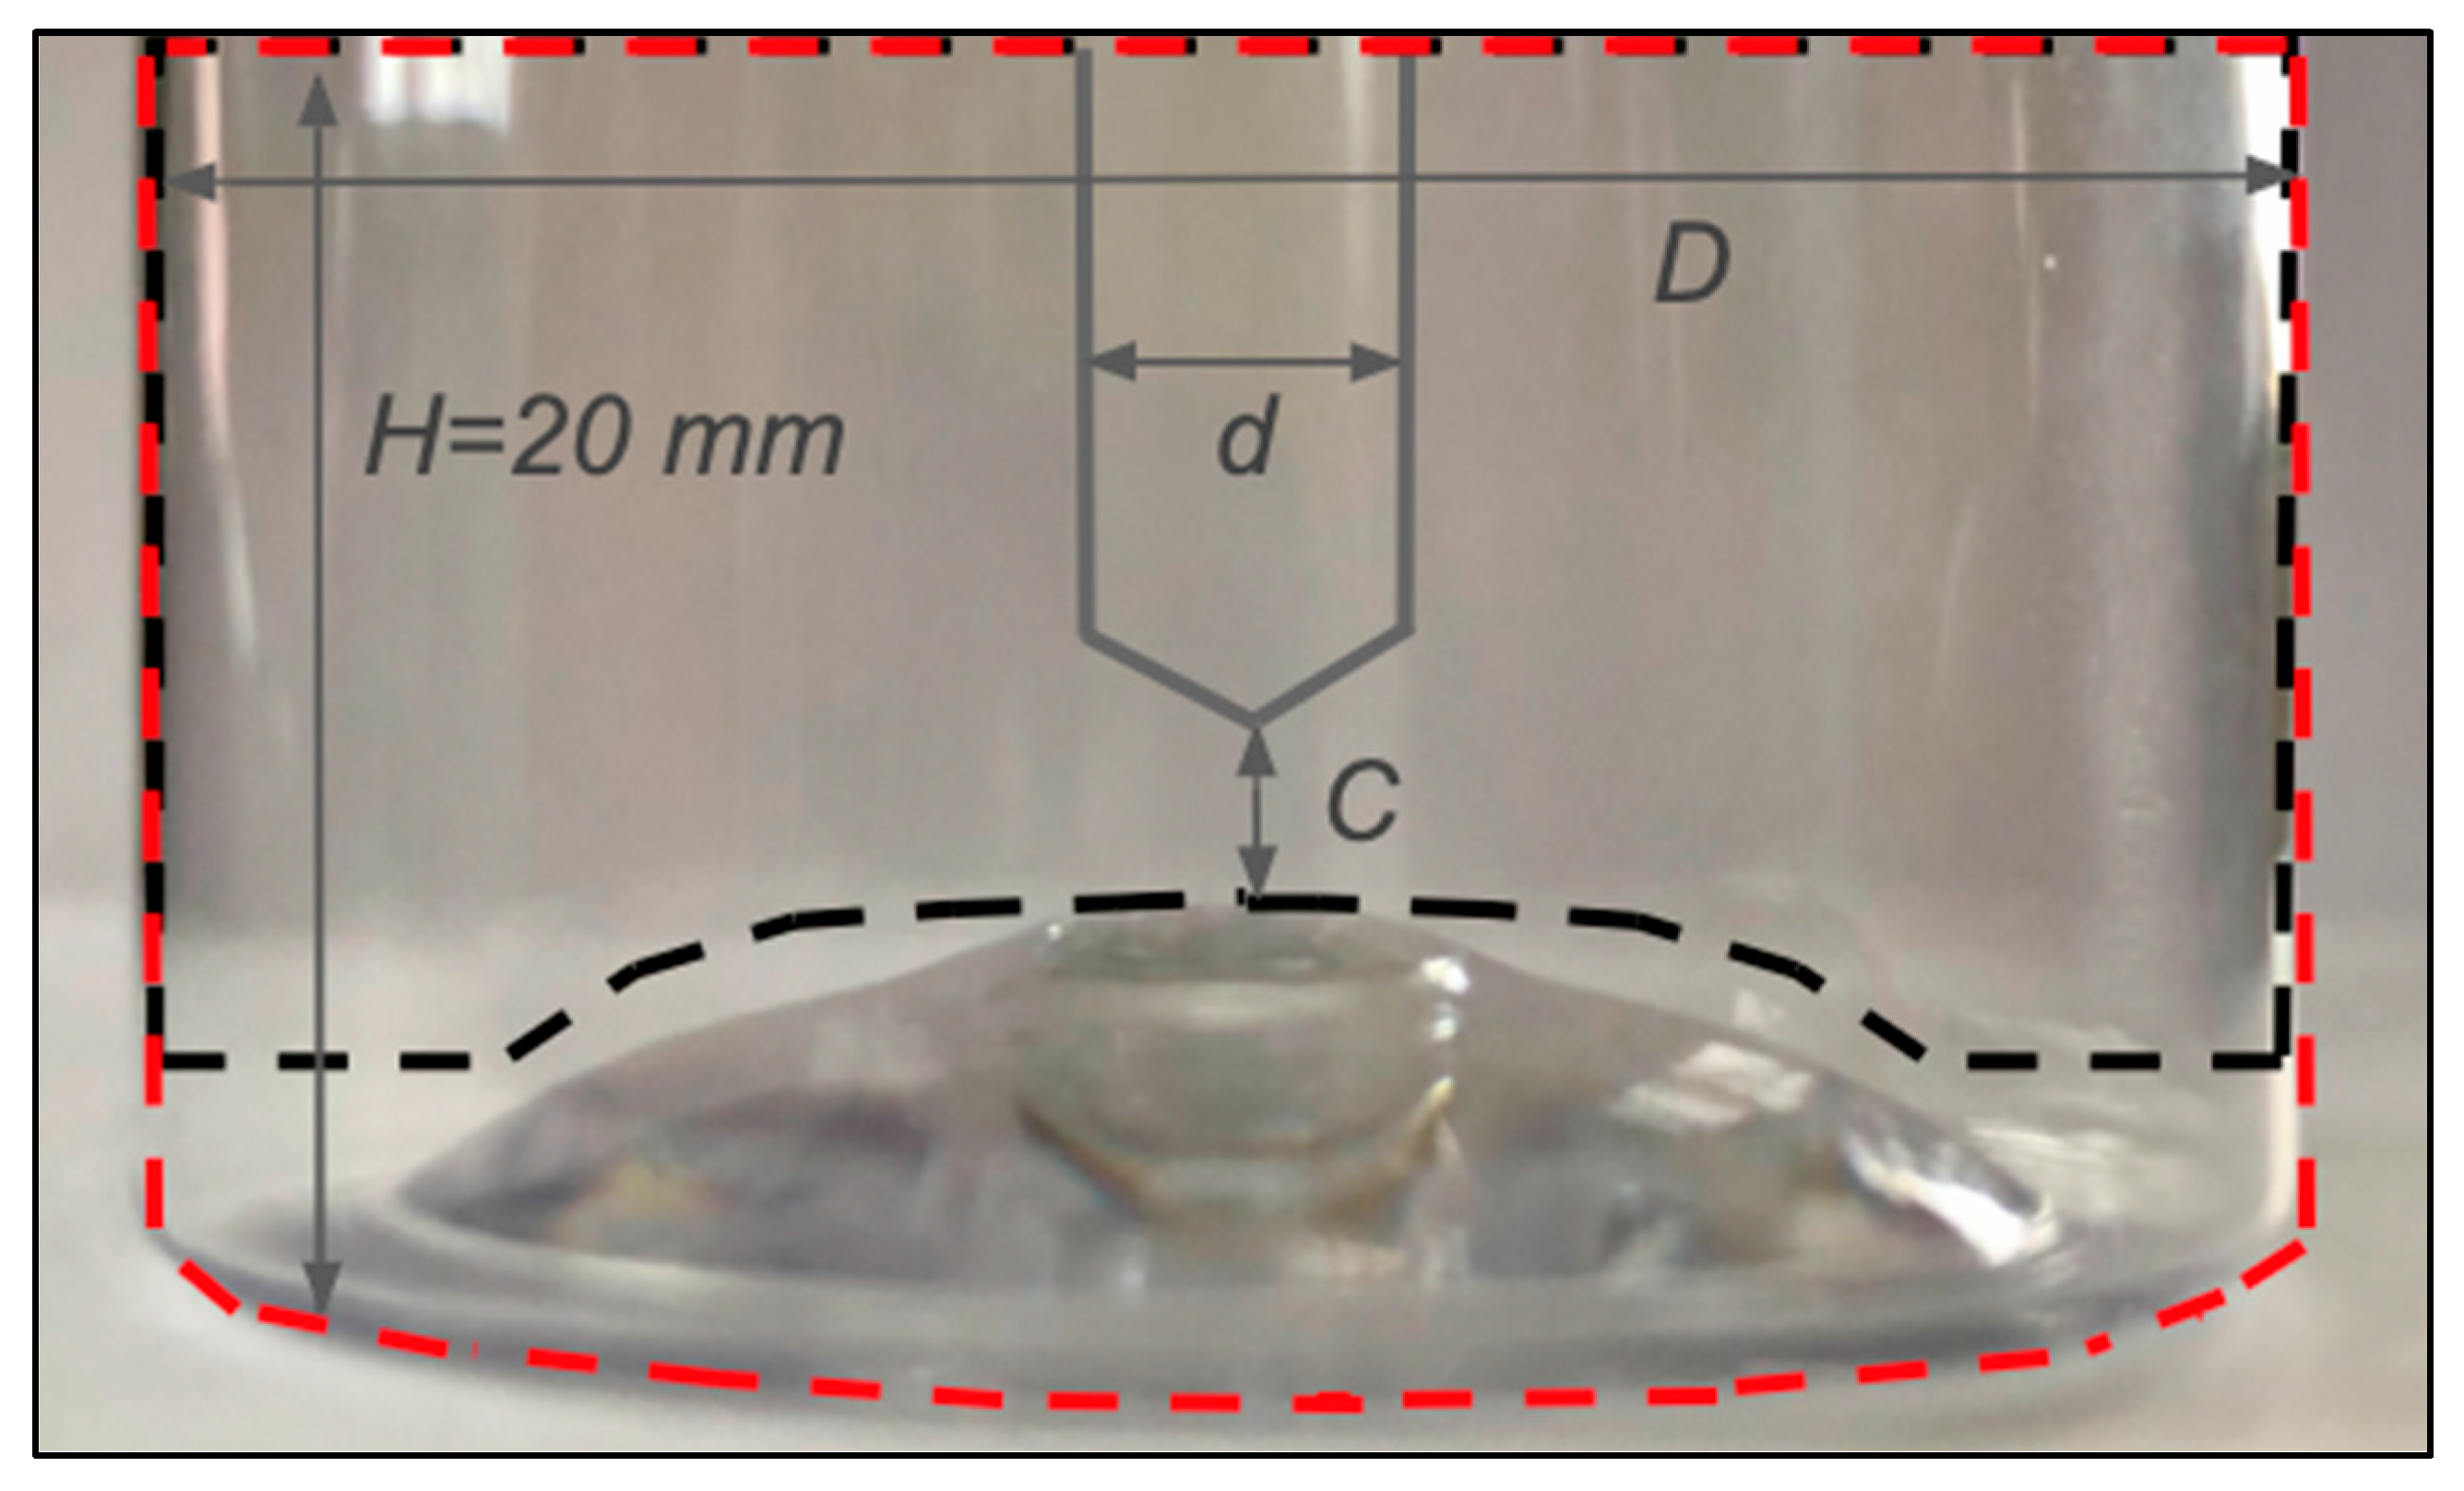
C, defined as the vertical distance from the peak of the dimple of the bottle to the lowest point of the dip tube orifice, was 0.5 mm, 1 mm, or 2 mm, depending on the experiment. In order to provide mechanical stability during the discharge, the bottle was secured on a heavy metal plate using double-sided tape. This assembly was placed into an acrylic tank that was filled with deionized water to reduce light reflections and mounted in front of the PIV system, as schematically presented in
Figure 1.
Particle Image Velocimetry System: The PIV laser unit used in this work was identical to the one used in our previous work [
5] and consisted of a New Wave Research Model Solo 120 laser (Fremont, CA, USA) operating at 15 Hz and having a green laser sheet emitted at 532 nm. The laser sheet thickness was set to 3 mm. The camera unit of the PIV system consisted of a VCXU FlowSense digital camera (Dantec Dynamics, Skovlunde, Denmark). The camera had a red color filter mounted on it, as shown in
Figure 1. The laser and the camera were placed at 90 degrees to each other.
2.2. Materials
Fluid: A 0.5 wt.% xanthan gum gel was used in this work. The procedure to prepare this gel was as follows: First, xanthan gum was dispersed in glycerin with the help of an overhead mixer. Then, the balance water, also containing an aliquot of the tracer stock solution (10 mL) described below, was added. The final exact composition of the fluid was as follows: 0.5 wt.% xanthan gum, 49.75 wt.% glycerin, and 49.75 wt.% water. This mixture was then transferred to the WhipMixer, where it was further mixed for 4 min under vacuum. Reference [
5] lists the rheological properties of the resulting fluid.
Tracer particles: Red fluorescent polyethylene particles (Cospheric, CA, USA) with a particle size of 10–45 μm and a density of 0.995 g/cm3 were used in this work to visualize the flow in the bottle using the PIV system. An extremely diluted stock suspension of tracer particles was prepared by adding 0.5 g of these particles to 100 mL water, together with 2–3 drops of Tween 80 (Sigma-Aldrich, St. Louis, Missouri, USA, 9005-65-6) to reduce the surface tension of the water and wet the particles. The resulting suspension was then agitated with the help of a magnetic stirrer to provide homogenization. Then, a 10 mL aliquot of this suspension was added to the water component of the fluid mixture described above during the fluid preparation.
2.3. Methods
Obtaining the velocity distributions during the continuous pumping consisted of three steps: (1) the bottle was completely filled with the gel; (2) the vacuum pump was turned on; and (3) the PIV system started to collect image pairs at 8 Hz as the bottle was being drained. The time interval between images for each image pair was as low as 400 µs to capture the flow by preventing the particles from escaping their interrogation windows. The size of the interrogation windows was 16 × 16 pixels. The fluid discharged from the test bottle was collected in a separate collection tank, as shown in
Figure 1, until the discharge process ended, i.e., when no more fluid was drawn up into the tube. Only the region below the 20 mm level (measured from the bottom of the bottle), i.e., the region marked in yellow in
Figure 1, corresponding to that delimited by the red dashed line in
Figure 2, was optically monitored while the discharge process was ongoing. All the image pairs collected after the liquid level dropped below the 20 mm mark height (towards the end of the discharge) were discarded.
The PIV analysis was conducted in the region of interest, marked with dashed black lines in
Figure 2. Outside this region, there was either no fluid present or significant light reflection observed because of the curvature of the bottle. Hence, this outer region was masked.
After the images were collected, the signal noise was determined using the “Image Min/Max” technique of the Dynamic Studio software (Version 6.11.0031, Dantec Dynamics, Denmark), which determined the intensity of the image by calculating the power mean pixels in all the collected image pairs. The noise was removed from the original images using the “Image Arithmetic” option, and the “Adaptive PIV” function was applied to obtain the spatial displacement of the particles and hence the velocity of the fluid at each location, as described previously in greater detail [
17]. After the PIV analysis was completed, the data were exported to the Tecplot
® software (Version 360 EX 2018 R2), where the velocity magnitude contour maps were obtained.
The volumetric flow rate was calculated using PIV for various orifice shapes at the lowest clearance studied here (
C = 0.5 mm). To do so, a procedure similar to that presented in a previous study was used [
18]. More specifically, the velocity values on the upper circular area of the dip tube, i.e., the inner radial plane at the top of the tube in the investigated region (
Figure 2), were integrated along the inner diameter of the tube using the appropriate equations (see Equation (1) in [
18] and the detailed explanation therein).
This method consisted of capturing the image of the final instantaneous heel, i.e., the heel profile in the bottle at the moment air begins to enter the dip tube, thus concluding the discharge process. Accordingly, the bottle was filled, the vacuum pump was turned on, and the PIV system started to take images. The heel profile on the image taken when the discharge ended was treated as the instantaneous heel profile, as previously reported [
5]. This raw PIV image was then processed using the ImageJ software [
19], in which the background noise was subtracted (with the “light background” option on) based on the rolling ball algorithm that estimated the background intensity of a grayscale image in the case of an uneven exposure and subtracted it from the original image [
5,
20,
21]. This method was used here to better visualize the heel profiles by creating a stronger contrast between the fluid and the remainder of the image.
Separate experiments were conducted to quantify the heel volume. The bottle with the modified hand pump dip tube inside was filled up with the fluid, and the vacuum pump was turned on. The vacuum pump was shut off once the discharge process was completed and air began to enter the dip tube. The bottle was taken off the modified hand pump and weighed. Knowing the mass of the empty bottle allowed for the calculation of the heel mass. Finally, the heel mass was transformed into its volume using the fluid density as a reference.
3. Results and Discussion
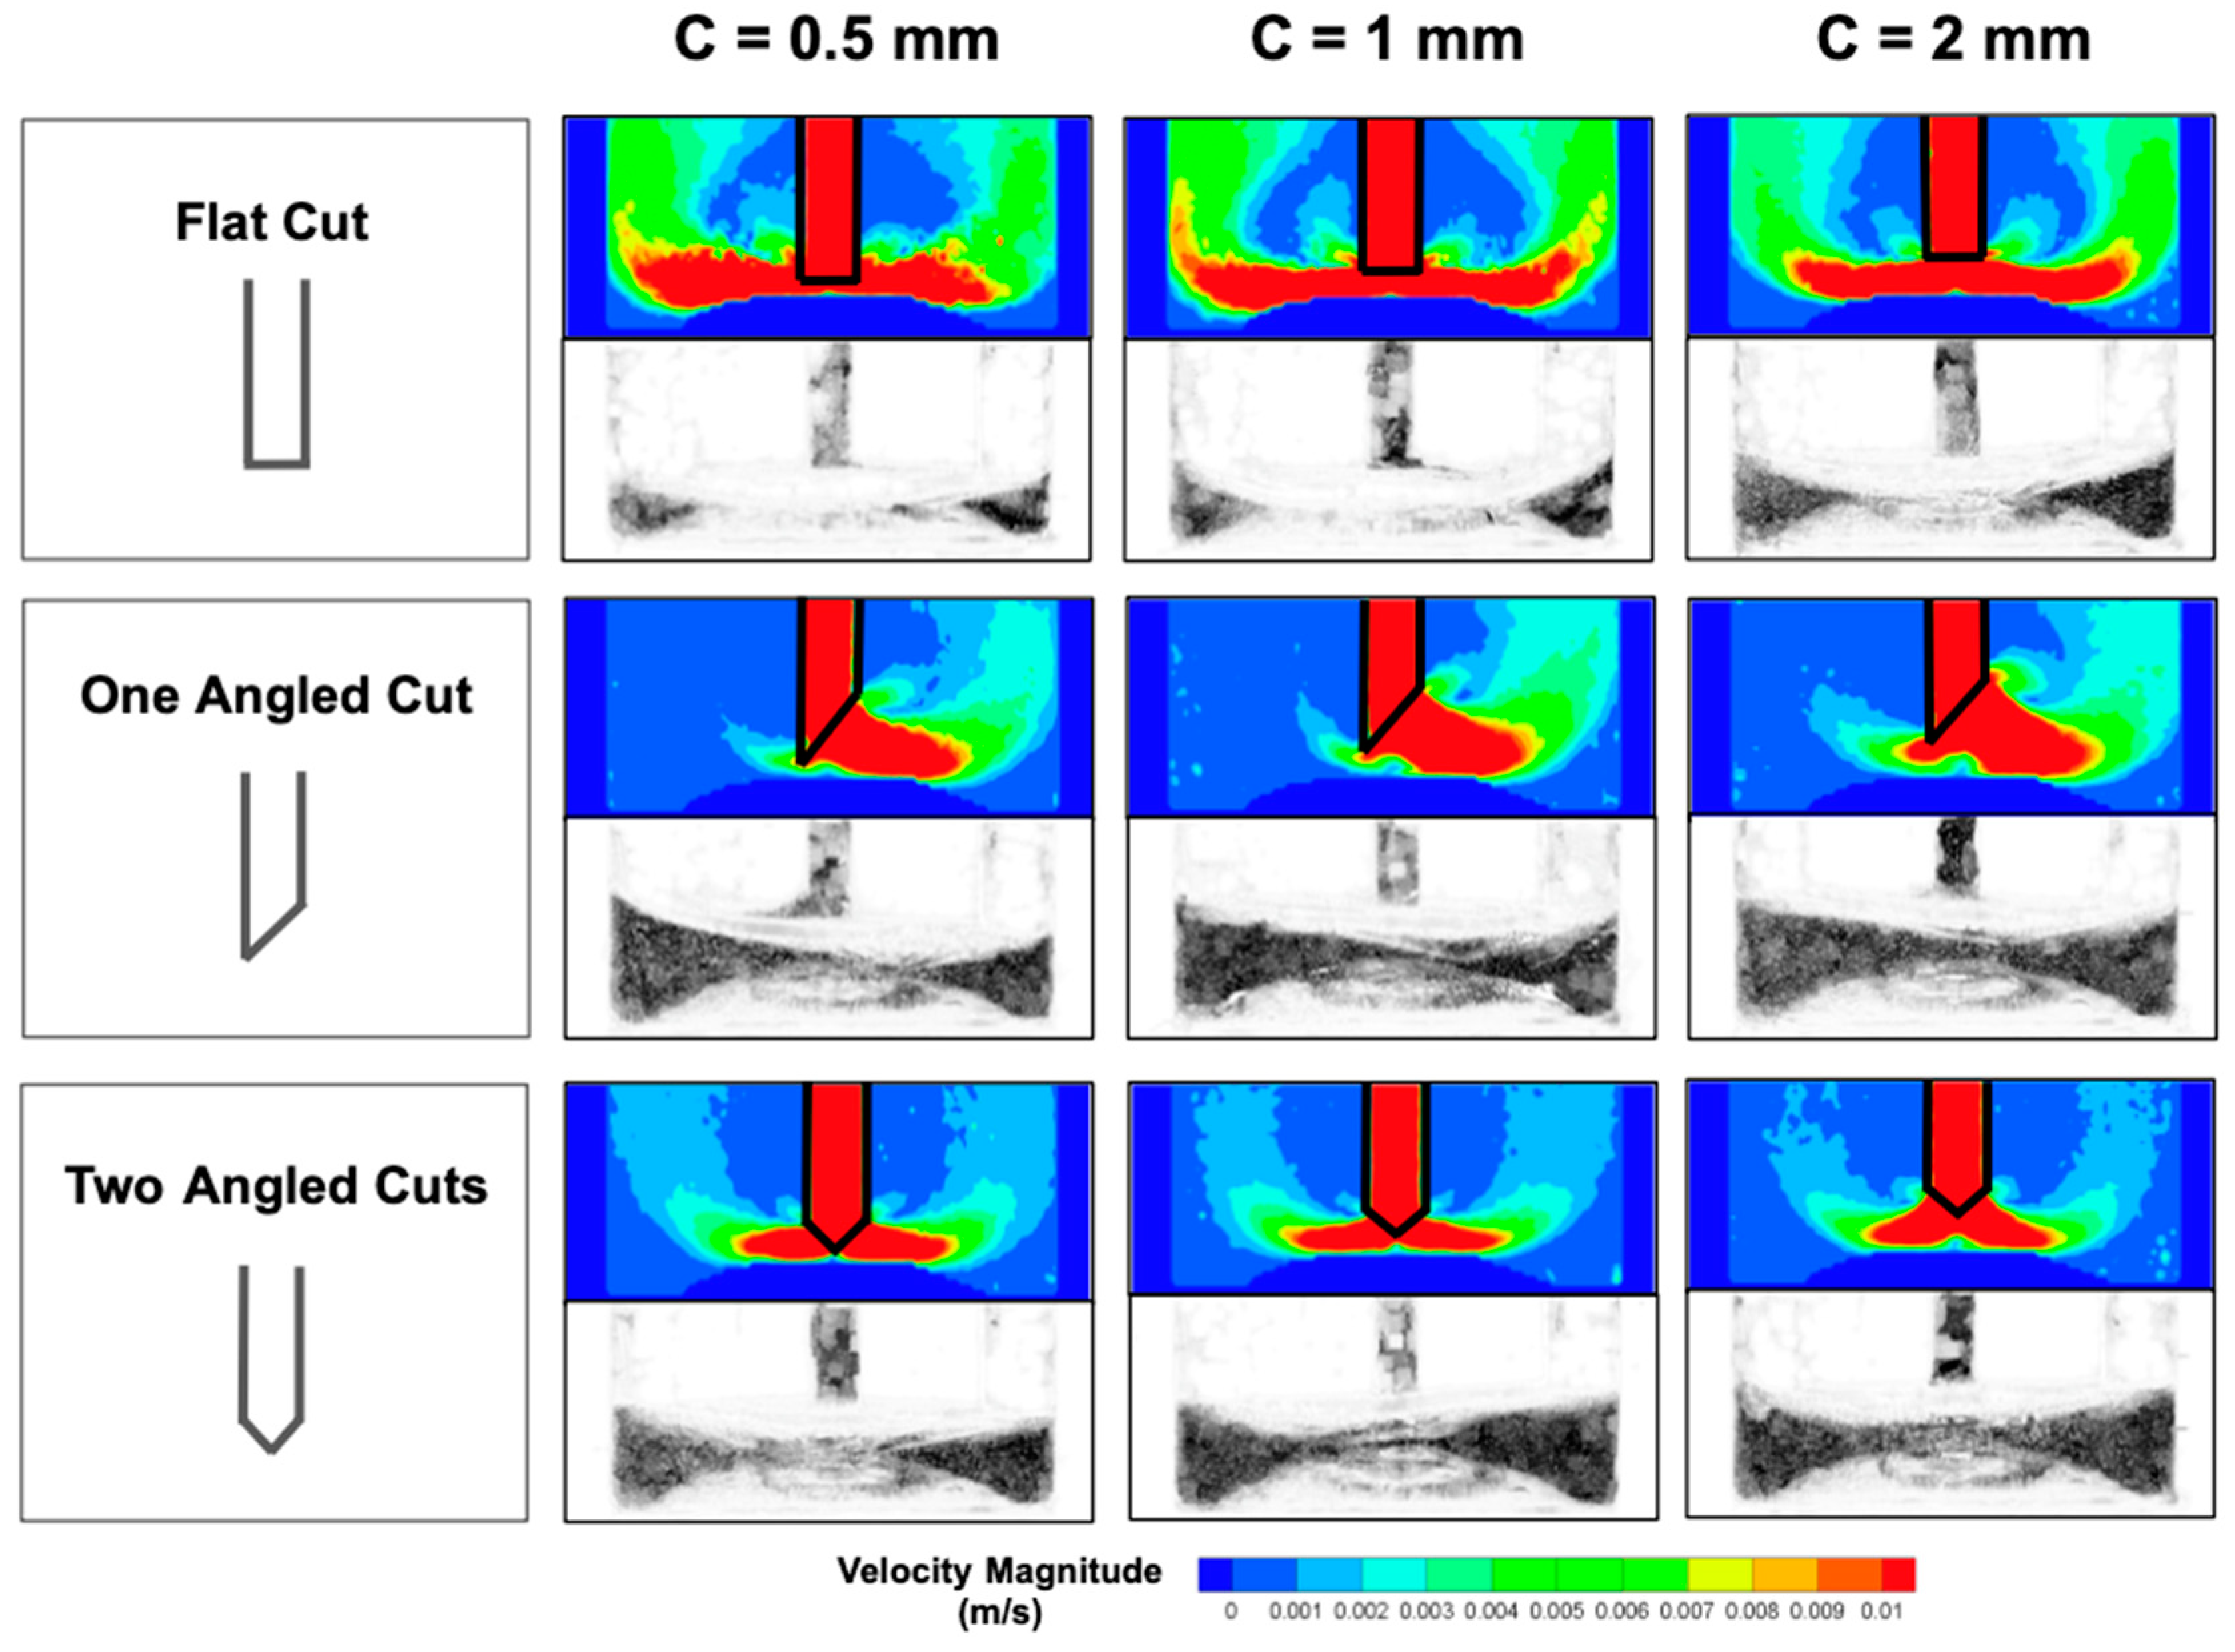
The contour maps of the velocity magnitude and the corresponding heel profiles for the three different orifices studied here are presented in
Figure 3. It is apparent that the velocity contours were quite different depending on the orifice shape. While the flow around the flat orifice was approximately symmetrical, the one-angled cut orifice generated an asymmetric flow, with the fluid being primarily drawn into the dip tube only from the side where the orifice was cut at an angle. Conversely, symmetric flow distribution around the orifice was observed for the two-angled cut orifice. These results show that the shape of the orifice strongly affects the velocity profiles.
Furthermore, one may notice that while the flow does not “spread” onto the entire bottom of the bottle for both angled orifices, a flat-cut orifice with the same clearance results in a flow distribution that fully sweeps the bottle bottom.
Figure 3 also presents the heel images obtained with the PIV imaging method. These clearly show that the heel shape profiles and therefore the heel volume are also affected by the shape of the orifice, the smallest heel being qualitatively associated with the flat cut orifice. It is also interesting to notice that the shape of the flow
during the discharge process determines the heel profile
after it. This is especially significant for the one-angled cut orifice at low clearances since the fluid flows into the dip tube primarily from one side of the bottle while the heel tends to form mainly in the region opposite to it because of the lower end of the orifice on this side, obstructing the flow into the tube.
Not only the orifice shape but also the dip tube clearance plays a role in the discharge hydrodynamics.
Figure 3 shows that as the clearance increases, the asymmetry in the velocity contour maps decreases together with the asymmetry in the heel profile. This is partially true even for the one-angled orifice since higher clearances allow at least some portion of the fluid to enter the tube also from the side opposite to the slanted cut opening of the orifice.
Increasing the clearance also results in an increase in the heel for all orifice types. This occurs not only because the higher location of the orifice results in the fluid being able to be drawn into the tube only until the (now higher) tube end is submerged (even a Newtonian fluid would result in a higher heel in this case), but also because the flow distribution during the discharge process is less capable of sweeping the bottom of the bottle (
Figure 3), thus contributing the formation of a larger heel once the air begins to be entrained in the dip tube and the discharge process stops, thus “freezing” the fluid at the bottom at that location.
Further reducing the clearance of the flat-cut orifice will eventually choke the dip tube completely when
C = 0 mm. However, one should consider the possibility that placing a flat cut orifice at a very low clearance could, possibly, result in a partial fluid blockage of the orifice especially for yield-stress and/or highly viscoelastic fluids, as the fluid may not have enough clearance to enter the tube. Studying this hypothetical phenomenon was beyond the scope of this work, but even in this study, a partial blockage could actually be detected by carefully observing the first contour map in
Figure 3 (
C = 0.5 mm, flat cut orifice), in which a less smooth velocity profile was obtained since the fluid became “choked” between the tube orifice and the bottle dimple. However, as far as the fluid studied here is concerned (0.5 Xan), this did not prevent the discharge from occurring and actually resulted in a smaller heel compared to all other cases studied here.
In order to better understand these effects and minimize the clearance to the lowest possible value, we looked at the one-angled orifice for
C = 0 mm since this orifice can operate even under this condition. The velocity results and the heel profile are shown in
Figure 4a. In this case, the flow is essentially limited to one side of the orifice, and nearly the entire right-hand portion of the bottom of the bottle is swept by it.
Figure 4b shows that the flow is particularly strong in the neighborhood of the slanted opening of the orifice. This figure additionally shows that the flow intercepts the upper corner of the orifice prior to entering the tube, generating a circulation loop that results in significant momentum loss, as the velocity map in
Figure 4b clearly indicates. As for the heel formation in this case, the high velocity on the right-hand side of the bottle effectively sweeps the bottom surface of the bottle, minimizing the heel on that side and leaving a significant heel volume on the unswept left-hand side of the bottle.
The results presented so far qualitatively indicate that, in all cases, the flat cut orifice appears to be superior to both angled orifices as far as flow maximization and heel minimization are concerned. In order to
quantitatively confirm this conclusion, the heel volume was determined using the weighing method (
Method 4) and plotted as shown in
Figure 5. The heel volume increased with increasing clearance, irrespective of which orifice shape was used, as one would expect. Interestingly, the residual heel volume obtained with the flat-cut orifice was always smaller than that obtained with either angled orifice. This can also be expected, given that even for the same clearance
C (measured from the top of the bump to the lowest point of the orifice) the actual distance from the bump at which air would start to be entrained in the tube at the end of the discharge process would be equal (at least for a Newtonian fluid) to
C for the flat orifice,
C + (
do +
d)/2 for the one-angled cut orifice, and
C +
do/2 for the two-angled cut orifice. These expressions can easily be obtained using simple geometric calculations, as shown in
Figure 6 in some detail for better visualization. In addition, since the flow profile during the discharge process was shown here to also affect the final shape of the heel, orifices such as the one-angled orifice that are not capable of generating a stronger flow near the bottom of the bottle would produce a larger heel irrespective of the level at which air starts being entrained. In summary, the flat-cut orifice always results in a minimal heel compared to angled cut orifices.
A relevant question is whether minimizing the heel by modifying the orifice shape and clearance may have a detrimental impact on the flow rate during the discharge process. Higher volumetric flow rates are often desired to rapidly fill the upper housing of the hand pump and prepare the dispensing system for the next pumping action, as mentioned earlier. To address this question, the flow rates for each case were determined using Method 2.
Figure 7 presents the volumetric flow rate for each orifice shape at
C = 0.5 mm and shows that the volumetric flow rate in the tube with a flat cut orifice was 110% higher than that for the one angled cut orifice and much higher (240%) than that for the two-angled cut orifices. In summary, despite the common use of angle-cut orifices in consumer products, the results of this work clearly show that using flat-cut dip tube orifices at low clearances not only minimizes the heel volume left in the dispensing bottle but also yields the highest volumetric flow rate during the discharge process.


