Article

Experimental Study on the Optimum Installation Depth and Dimensions of Roughening Elements on Abutment as Scour Countermeasures

by
Masih Zolghadr
1,
Seyed Mohammad Ali Zomorodian
2,*,
Abazar Fathi
3,
Ravi Prakash Tripathi
4,
Neda Jafari
5,
Darshan Mehta
6,
Parveen Sihag
7 and
Hazi Mohammad Azamathulla
8,*
1
Department of Water Sciences and Engineering, Jahrom University, Jahrom 74148-46199, Iran
2
Water Engineering Department, Shiraz University, Shiraz 71946-84334, Iran
3
Faculty of Agriculture, Shiraz University, Shiraz 71946-84334, Iran
4
Civil Engineering Department, Rajkiya Engineering College, Sonbhadra 231206, India
5
Department of Water Sciences Engineering, Shiraz University, Shiraz 71946-84334, Iran
6
Department of Civil Engineering, Dr. S. & S. S. Ghandhy Government Engineering College, Surat 395008, India
7
Department of Civil Engineering, Chandigarh University, Gharuan 140413, India
8
Professor of Civil Engineering, University of the West Indies, St. Augustine P.O. Box 331310, Trinidad and Tobago
*
Authors to whom correspondence should be addressed.
Fluids 2023, 8(6), 175; https://doi.org/10.3390/fluids8060175
Submission received: 30 March 2023 / Revised: 26 May 2023 / Accepted: 29 May 2023 / Published: 5 June 2023

Abstract

:
The causes of many bridge failures have been reported to be local scour around abutments. This study examines roughening elements as devices with which to intercept the downflow responsible for the formation of the principal vortex, which is what triggers local scour around abutments. Two vertical wall abutments with different widths were examined under four different hydraulic conditions in a clear-water regime. Elements with different thicknesses (t) and protrusions (P) with the same dimensions, (P = t = 0.05 L, 0.1 L, 0.2 L, and 0.3 L, where L is the length of the abutment) and with varying depths of installation (Z) were considered. Elements were installed in two positions: between the sediment surface and water elevation and buried within the sediment. To determine the optimum depth of installation, one element was first installed on the sediment surface, and the number of elements was increased in each subsequent test. The results show that installing elements between water surface elevation and the sediment’s initial level did not show any defined trend on scour depth reduction. However, the optimum installation depth of the elements is 0.6–0.8 L below the initial bed level. Moreover, the roughening elements with thickness and protrusion of P = t = 0.2 L resulted in the most effective protection of the foundation. The best arrangement, (P = t = 0.2 L and Z = >0.6–0.8 L) reduced the maximum scour depth by up to 30.4% and 32.8% for the abutment with smaller and larger widths, respectively.

1. Introduction

Ref. [1] have reported that, among 383 bridge failures in the U.S., 72% were due to local scour around the abutments. Vortex formation around bridge foundations imposes excessive stress on the bed, increases erosion rate, degrades the streambed, and triggers a scour hole. To establish a clear outlook toward abutment scour, it is vital to understand the flow field around it (Figure 1). Three main factors trigger scour around abutments, namely downflow, primary vortex, and wake vortices [2]. The pressure gradient at the upstream side of the abutment drives the flow toward the bed, which, in turn, returns up and develops a primary vortex. These two factors excavate the parent materials and create a hole at the abutment tip. At the downstream side of the abutment, flow separation causes upward flow, known as wake vortices, that sweep and entrain sediments particles away from the abutment, as demonstrated in Figure 1. The three-dimensional flow field around a bridge foundation is detailed by [3,4,5,6]. Recent numerical studies have also been conducted to predict flow field and scour around inline hydraulic structures. A comprehensive study by [7] can be referred to as an example.
To cope with local scour around bridge abutments, three approaches are available. One approach is to apply no scour countermeasure, and instead, the bridge foundation is constructed deeper than the equilibrium scour depth. In this approach, accurate estimation of scour depth is crucial, and long-term tests need to be conducted under desired hydraulic conditions. Ref. [8] evaluated local scour in a non-uniform gravel bed and used both laboratory and field data. They proposed new K-factors for the Melville and Coleman relation and developed a new relation to estimate maximum scour depth. Ref. [9] proposed a new equilibrium scour depth relation by estimating the total sediment transport around a bridge pier exposed to local scour. Various researchers have attempted to develop relations to estimate local scour around bridge foundation, and a list of empirical relations can be found in [10], describing the ultimate scour depth as a function of flow, sediment, foundation, and channel properties. The relations are valid under certain conditions, such as live bed or clear water. A second approach involves an increase in the resistance of the bed material by the placement of different coatings. In this method, heavy elements are installed to create a physical barrier that enhances sediment stability against approaching flow, and includes the placement of riprap, concrete blocks, gabions, etc. Various researchers have studied this approach, such as [11,12,13,14]. Most of these studies aimed to introduce relations for designing the size and placement extent of the pieces. Finally, for the third approach the flow is altered or deviated from the foundation to reduce erosive factors, followed by installation of collars, slots, submerged vanes, sacrificial piles [6,15,16,17,18,19,20,21,22,23,24]. These studies aimed to determine the geometric properties and effectiveness of the proposed methods. Some other researchers have studied the combination of both methods. Ref. [25] investigated the application of riprap alone and a combination of riprap and collar for scour countermeasures around rectangular bridge piers aligned with the flow. They developed relations for predicting stable riprap size and extent with different aspect ratios and skew angles of piers. They concluded that increasing the skew angle and aspect ratio of the piers increase the required riprap size and extent. Ref. [26] conducted similar studies (combination of riprap and collar) for cylindrical piers and tested seven riprap sizes with two different dimensions of collars. Their results show that the application of collar reduces stable riprap size and extension. Ref. [27] conducted 48 laboratory experiments to study the combination of riprap and Six Pillar Concrete (SPC) elements on scour mitigation around a vertical wall bridge abutment. They concluded that SPC elements deviate the flow and scour from the abutment tip. Moreover, they found that the installation of pebbles around pillars enhances the stability of the SPC elements, prevents edge failure, and reduces abutment scour depth.
Among flow altering devices, the use of roughening elements is a newly emerged method that has received less attention. This method requires more investigation in order to explore various aspects of the approach and to improve its performance as a scour countermeasure strategy. Roughening elements can change the flow field and weaken the downward flow, which is the main cause of the formation of horseshoe vortices [28]. The factors affecting the performance of the roughening elements are the element protrusions (P), thicknesses (t), spacing (S), and installation depth of the elements (Z). Figure 1 shows a protected abutment with roughening elements and effective geometric parameters with a flow pattern included. This method resembles that involving the use of threading cables to reduce scour around piers [29].
The primary attempt to use roughening elements as scour countermeasure was undertaken by [30]. They applied these elements as a flow altering method and reduced the maximum scour depth to 7.2% at the abutment wall, concluding that roughening elements can be used as suppressor of downflow to reduce the action of the vortex. Ref. [28] investigated the element’s spacing (S) and protrusion (P) at a given thickness (t). They claimed that smaller spacings create a barrier against downflow. In contrast, a large space between two elements enables the downflow to reattach to the abutment wall, which causes the performance of the elements to plummet. Briefly, they claimed that the least scouring occurs for S/P = 2.
Based on literature review, few studies have been conducted on the performance of roughening elements as a scour countermeasure method. Moreover, to the best of our knowledge, the optimum placement depth, thickness and protrusion of the elements have not been investigated. Therefore, this research aims to build on previous studies and answer questions about the optimum installation depth and dimensions of the elements.

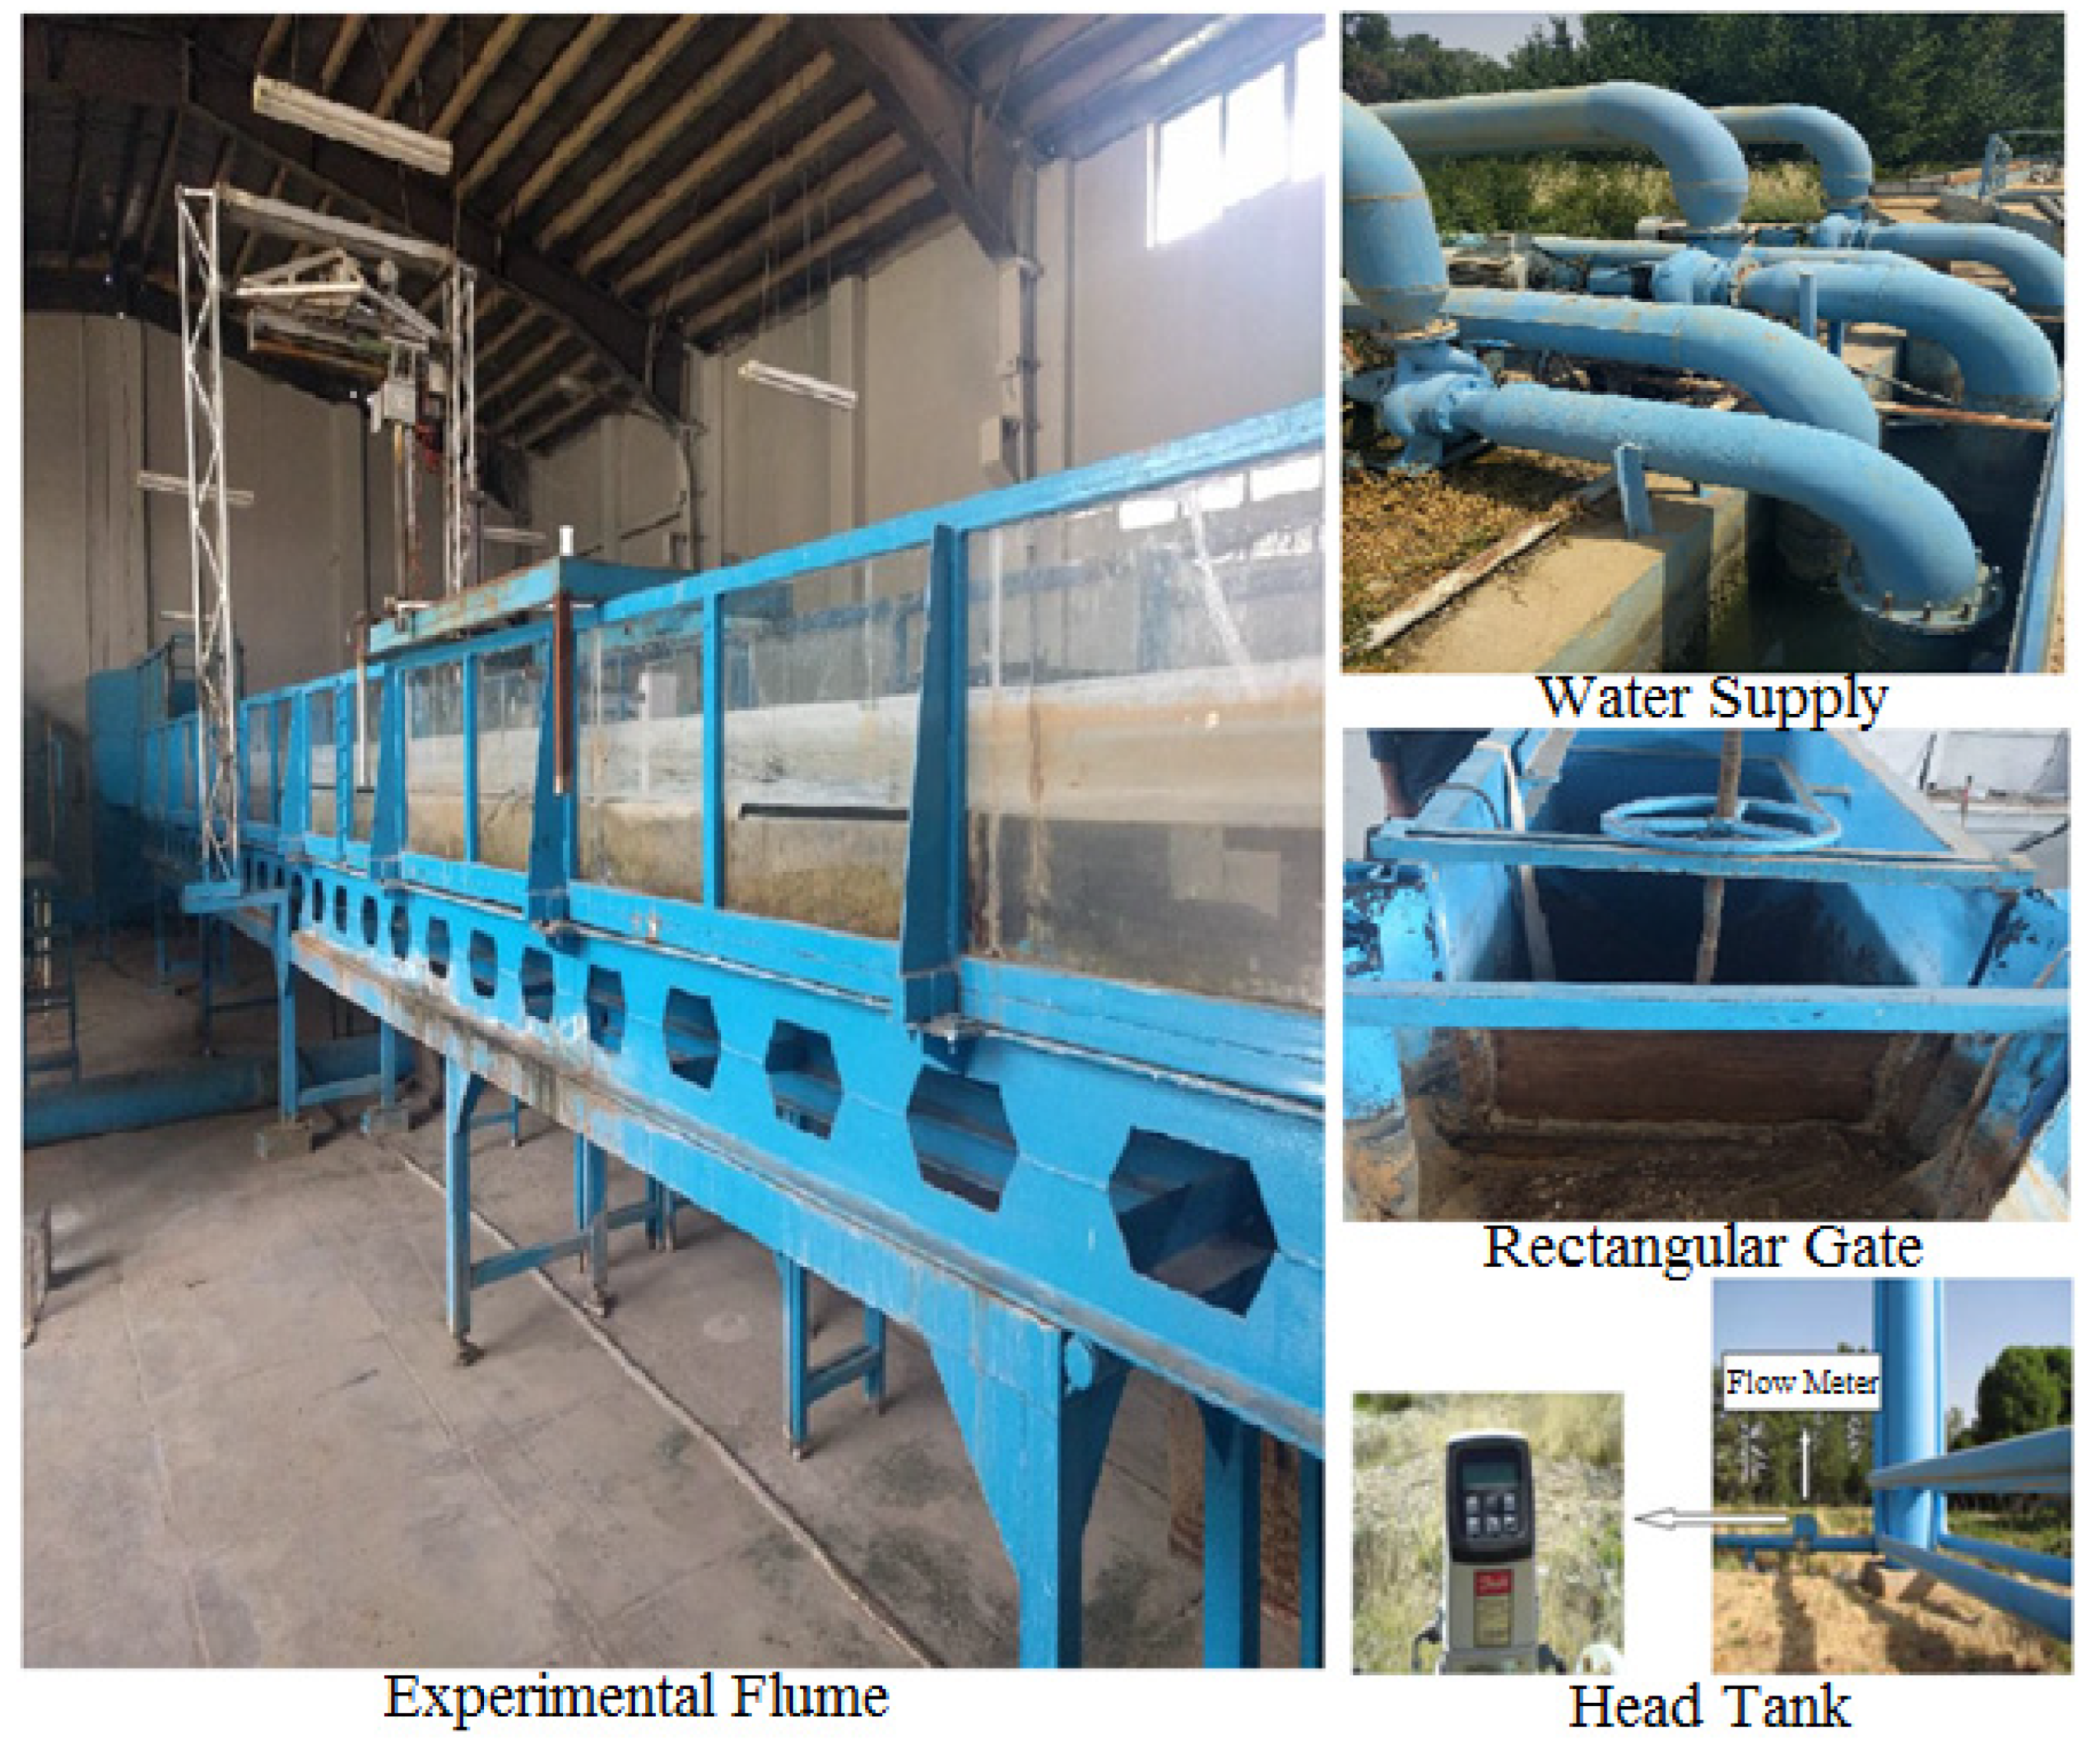
2. Materials and Methods

The scour depth (ds) is a function of different factors, including the geometry of fluid, flow, channel, abutment and roughening elements, as well as sediment properties. In order to develop dimensionless parameters sixteen variables are considered as follows:
d s = f 1 ρ , μ , g , y , U , B , L , b , t , P , S , Z , ρ s , d 50 , σ , T
where, ρ is water density, µ is water dynamic viscosity, g is gravitational acceleration, y is flow depth, U is flow average velocity, B is channel (flume) width, L is abutment length (m) (perpendicular to the flow), b is abutment width (m) (in direction of flow), t and P are roughening element thickness and protrusion, respectively (m), S is the roughening element’s spacing (m), Z is the depth of the roughening element installation below initial bed level (m), ρs is the sediment density, d50 is median sediment size, σ is geometric standard deviation, and T is the time in seconds. Using the Buckingham theory and taking ρ, U, L as repetitive variables, the general form of the equation for predicting scour around and abutment armed with roughening elements can be expressed as follows:
d s y = f 2 R e , F r , L y , L B , b L , t L , p L , S L , Z L , ρ s ρ , L d 50 , σ , T U L
where Re represents the Reynold number and Fr represents the Froude number defined in the following equations:
R e = ρ . U . y μ
F r = U g . y
The length scale “L” can be replaced by water depth “y” (or a combination of “y, L”) as suggested in other studies [2,28,31]. The graphs are presented with dimensionless parameters as variables to make it possible to expand the results to real world scale. Some parameters, such as Re, ρs/ρ, σ, L/y and L/B, are constant in each hydraulic condition. Therefore, desired parameters including P/L, t/L, Z/L, and ds/L are studied and presented in terms of tables and graphs. As a result, Equation (2) can be summarized to the following form:
d s y = P L , t L , Z L , F r
The experiments were conducted in a laboratory flume with dimensions of 16 m (length) × 0.7 m(width) × 0.6 m (depth) and a longitudinal slope of 0.0027. The walls and bottom of the flume were made of glass (see Figure 2). Water was pumped from an underground reservoir to a head-tank to maintain a constant head water and was then poured to the flume. The flow depth was adjusted by a sharp, crested, rectangular gate located at the end of the flume, and the flow discharge was measured using an electronic flow meter and adjusted with a butterfly valve. To evaluate local scour, cohesionless sediments with a median diameter of 0.71 mm and a thickness of 20 cm was used. According to [32], using sediments with an average diameter of less than 0.7 mm escalates the possibility of bed form creation. In addition, the geometric standard deviation of the sediments σ g = d 84 d 16 ) was 1.25, which satisfies the uniformity condition [33,34] and is less than 1.3.
Two vertical wall abutments with same length of 0.14 m and widths (b) of 0.07 and 0.14 m were used. The abutment dimensions were chosen to eliminate the contraction ratio, as the effect of the contraction ratio on scouring is eliminated when the ratio of the abutment length to flume width is less than 0.33 [35]. Two different widths were chosen to study the effect of the abutment width on scouring. Roughening elements with the same length as the abutment and with different protrusions and thicknesses were investigated. The thickness and the protrusion of the elements were equal to P = t = 0.05 L, 0.1 L, 0.2 L, and 0.3 L. Based on the findings of [28], the spacing between the elements was set to S/P = 2.
According to [2], an abutment is classified as short if the ratio of its length to the flow depth is less than one, and where the scouring will be independent of the flow depth. To determine hydrodynamic conditions, a flow discharge of 31 lit/s was used to establish a constant flow depth of 15 cm. The threshold velocity was measured by using a one-dimensional velocimeter at the desired flow depth, and was found to be 0.3 m/s, which is consistent with the value obtained from Melville and Sutherland’s [36] formula:
U C U C = 5.75 log 5.53 y d 50
where U C is critical velocity, U C is the critical shear velocity, y is flow depth, and d 50 is the median diameter of sediments. The critical shear velocity was calculated using Shield’s diagram. In this study, the ratio of flow velocity (U) to critical velocity was 0.94. Because this ratio is less than 1, the clear-water conditions were achieved [37]. To provide a better understanding of experimental results, other hydraulic conditions were tested in addition to U/ U C = 0.94, including U/ U C = 0.9, 0.8 and 0.7 were tested as well.
In the literature, test durations range from 2 to 96 h [38,39]. In this study, a primary test was conducted for 24 h, during which two parameters, the scour depth and time at the abutment toe, were continuously monitored in order to determine the temporal evolution of the scour depth.
It was observed that the majority of the scouring occurs at the beginning of experiments. After 5 h, negligible changes in scour depth were observed, which is consistent with the findings of [28,40]. Refs. [27,41,42] have also reported that variations in the final percentage of scour depth versus time become negligible after 4 h for different Froude numbers and abutment geometries. However, it should be mentioned that the goal of the current study was not to propose a relation in order to estimate the maximum scour depth or reach an equilibrium condition. To reach a fully developed condition, the test must be prolonged for several days [43,44]. Some researchers, such as [45], believe that such a condition is not attainable. However, a duration of 5 h was chosen for the tests in this study.
In the initial set of experiments, two unprotected abutments were tested, and it was observed that the highest scour depth occurred at the abutment toe. Therefore, the abutments toe was chosen as the reference point for comparison of the scouring in all subsequent experiments, as it was in similar studies [28,46,47]. The topography around the abutment was recorded in a 2 × 2 cm grid using a laser distance meter that could move in longitudinal and cross-sectional directions with 1 mm accuracy. To evaluate the effectiveness of the scour countermeasure in subsequent experiments, the maximum scour depth at the abutment toe was used as the reference point for comparing results. Figure 3 shows the maximum scour depth at two abutment tips in the baseline experiments.
The assessment experiments were designed to investigate the optimum installation depth and dimensions of the scour countermeasure elements. In all of the experiments, the space between two successive elements was set to S/P = 2, which was selected based on the findings of [28]. The experiments were conducted in the following order: (1) the effect of installing elements between sediment surface and water level, with the dimension of t = P = 0.05 L, was evaluated at the abutment face (b = 7 cm), In this experiment, an element was first installed, and subsequent tests were conducted by adding one element to investigate the effect on scour depth of placing this element above the sediment (Figure 4a). (2) The optimum depth of installation was determined by placing elements under the initial level of the sediment (buried in sediments, t = P = 0.05 L) (Figure 4b). (3) After determining optimum installation depth, tests were conducted with the presence of elements both under and above the bed level (Figure 4c). In these tests, four elements were installed under the bed level at a depth of Z/L = 0.6 (the optimum depth), while the number of elements installed above the bed was increased from 1 to 8 to reach the water surface. This step was undertaken in order to evaluate the installation of elements buried in sediment and between the water level and sediment surface. Steps 1–3 were repeated for elements with different dimensions (thickness and protrusion). (4) The effect of different dimensions was evaluated under the optimum depth of installation (Figure 4d). All roughening elements were tested with a square cross-section, so the values of P (protrusion) and t (thickness) were equal. Steps 1–4 were conducted under the hydraulic condition of U U C = 0.94 . (5) In the final experiments, all four steps were repeated under different hydraulic conditions, of U U C = 0.9, 0.8, and 0.7, to obtain more authentic results. It should be noted that the best results obtained from each step were applied in the subsequent step. For example, the optimum depth of installation (Z/L) determined in step 2 was used in step 4 to determine the optimum dimension.
In the assessment experiments, some of the results obtained for the small abutment (b = 7 cm) were repeated for the larger abutment. For example, the optimum depth of installation determined for the small abutment was repeated for the larger one. Therefore, the number of experiments conducted for the abutment with width of 14 cm is less than for the abutment with the width of b = 7 cm (Table 1).

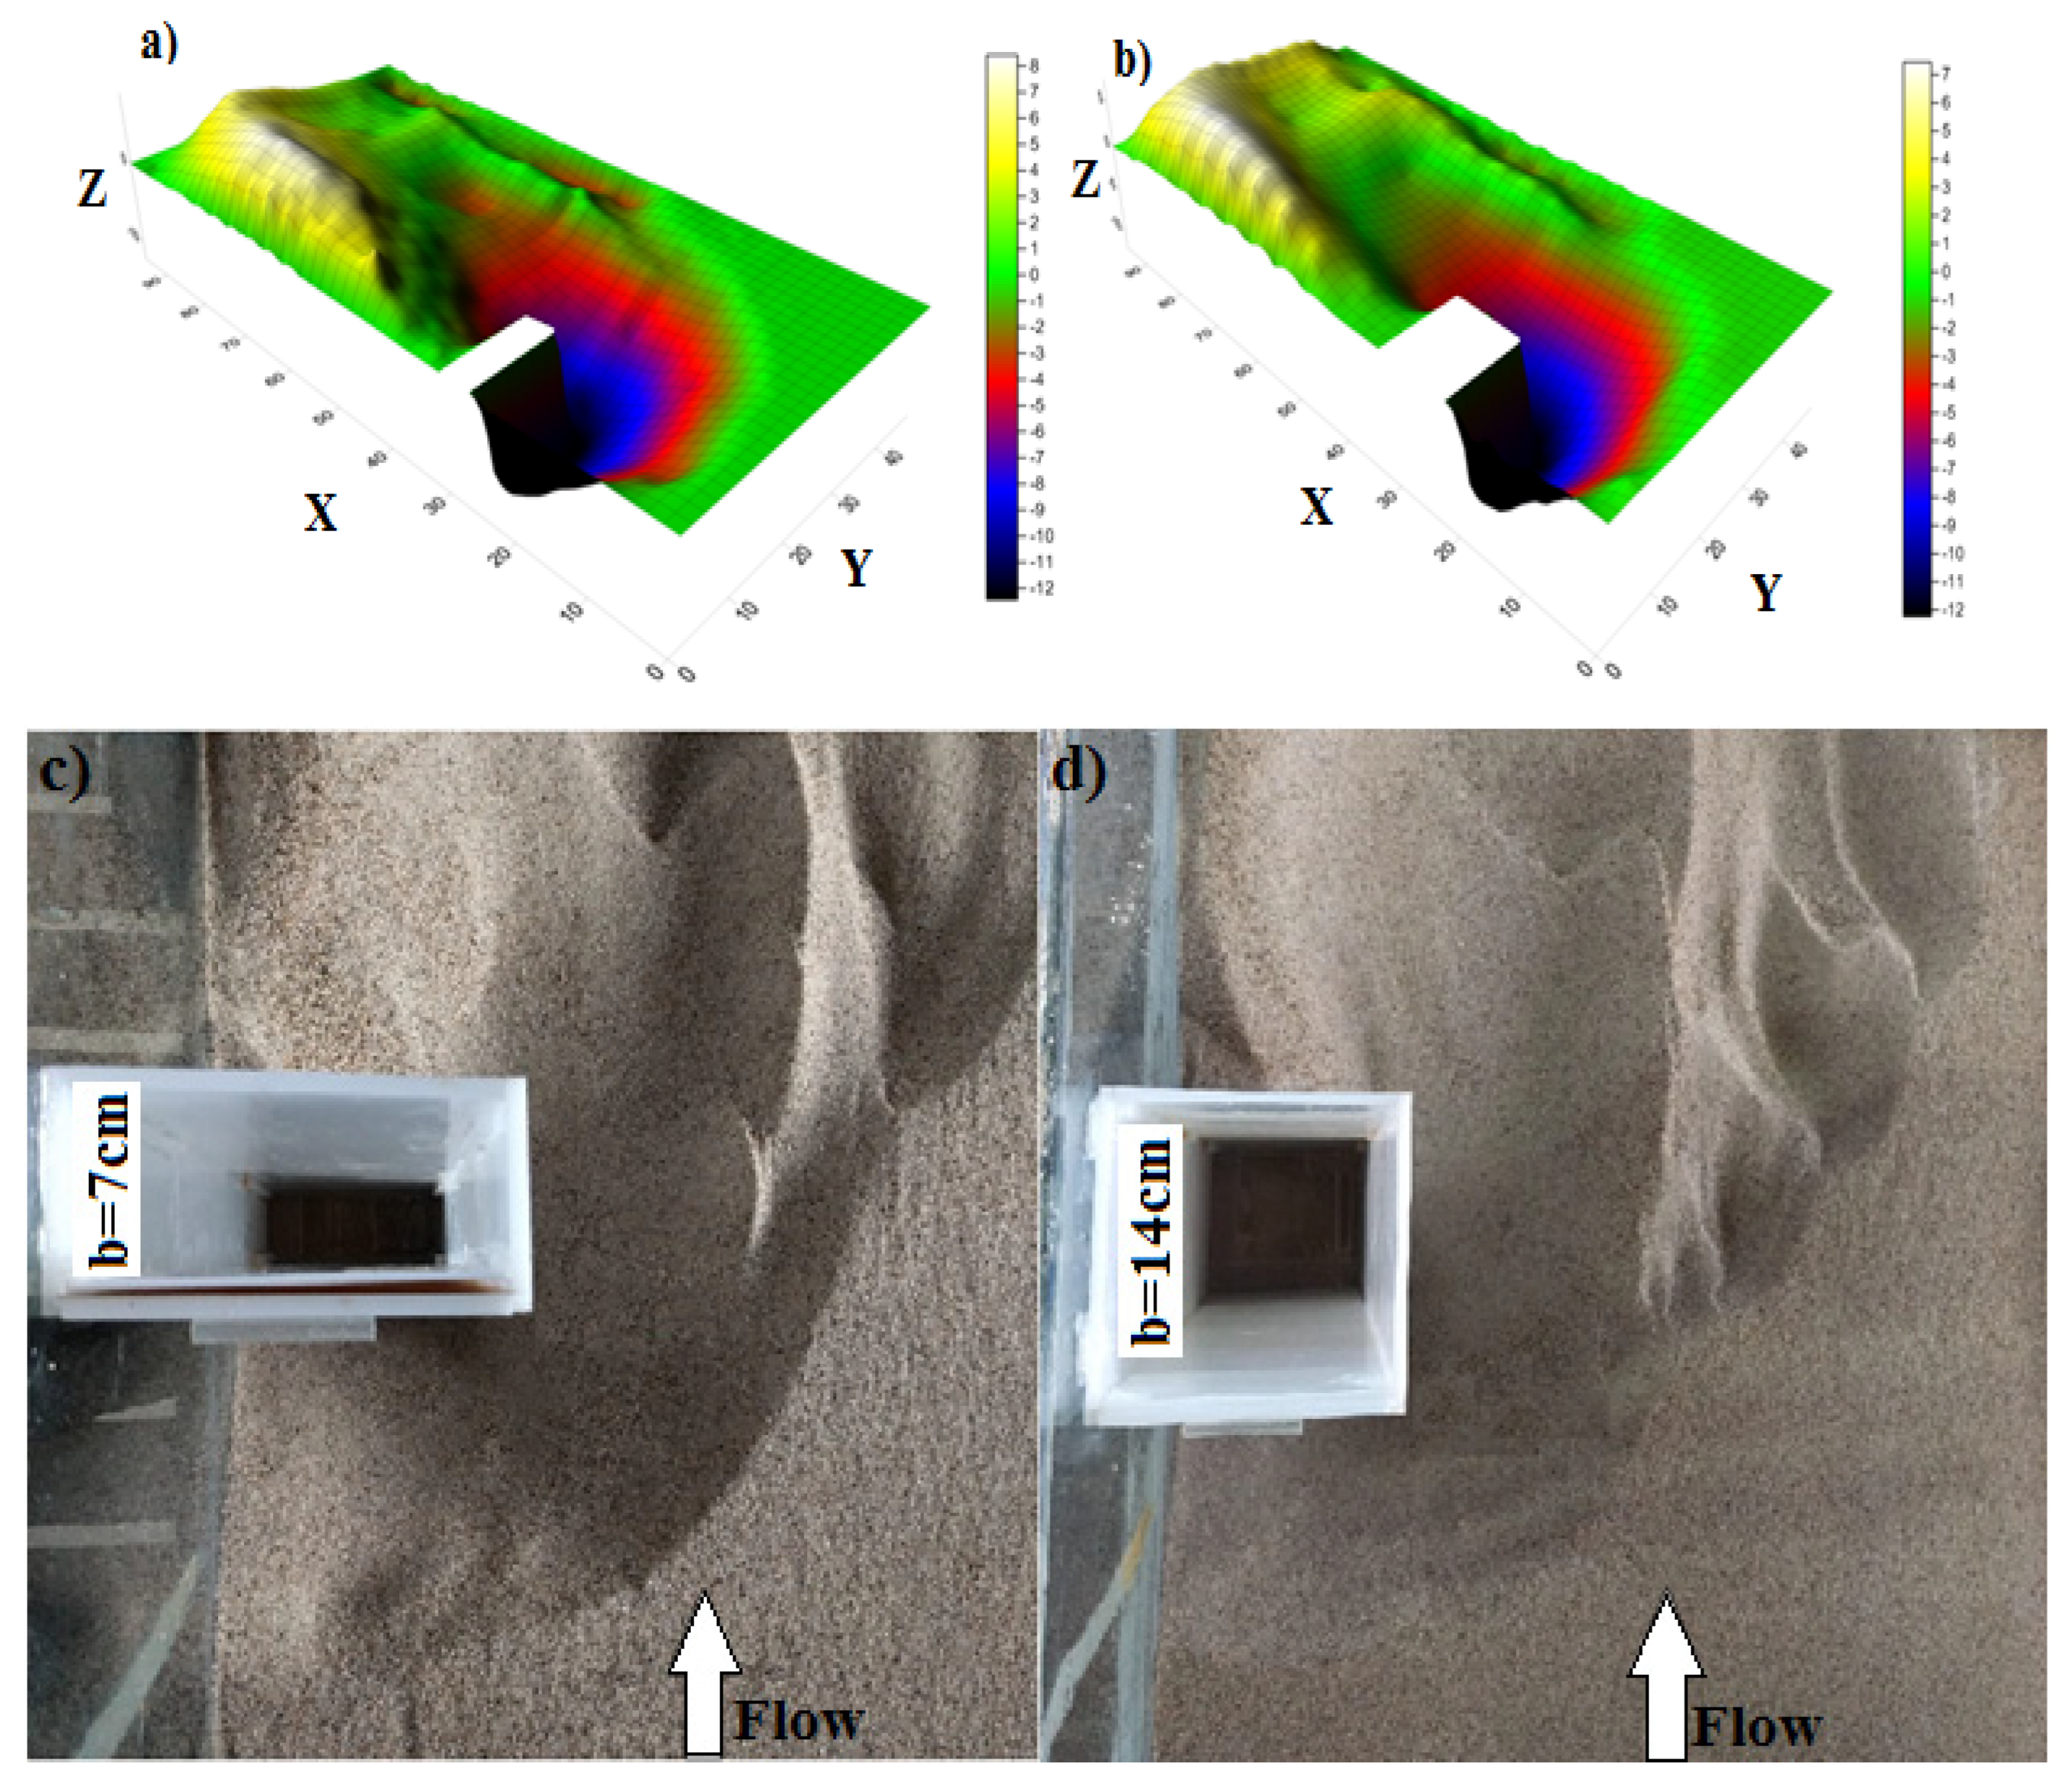
3. Results and Discussion

The results of the baseline experiments indicate that the widths of the abutment do not have significant effect on the maximum scour depth at the abutment toe, which can be attributed to the role of contraction in the scouring process. A larger abutment width leads to greater volume of scour depth, which can result in more severe changes in bed topography. This is because the longer the extension of the abutment, the further the progression of scouring downstream. Ref. [48] also found that the maximum scour depth is independent of the contraction length (abutment length) which is consistent with the current study’s findings. They observed that the variation of scour depth at the abutment toe was less than 10% for abutments with widths of 5 and 110 cm. This suggests that the abutment width does not have a significant effect on the maximum scour depth at the abutment toe. Additionally, they have reported that the velocity vectors were very similar around the abutment toe, where the maximum scour depth occurs, which indicates that the flow pattern is not significantly affected by the abutment width.

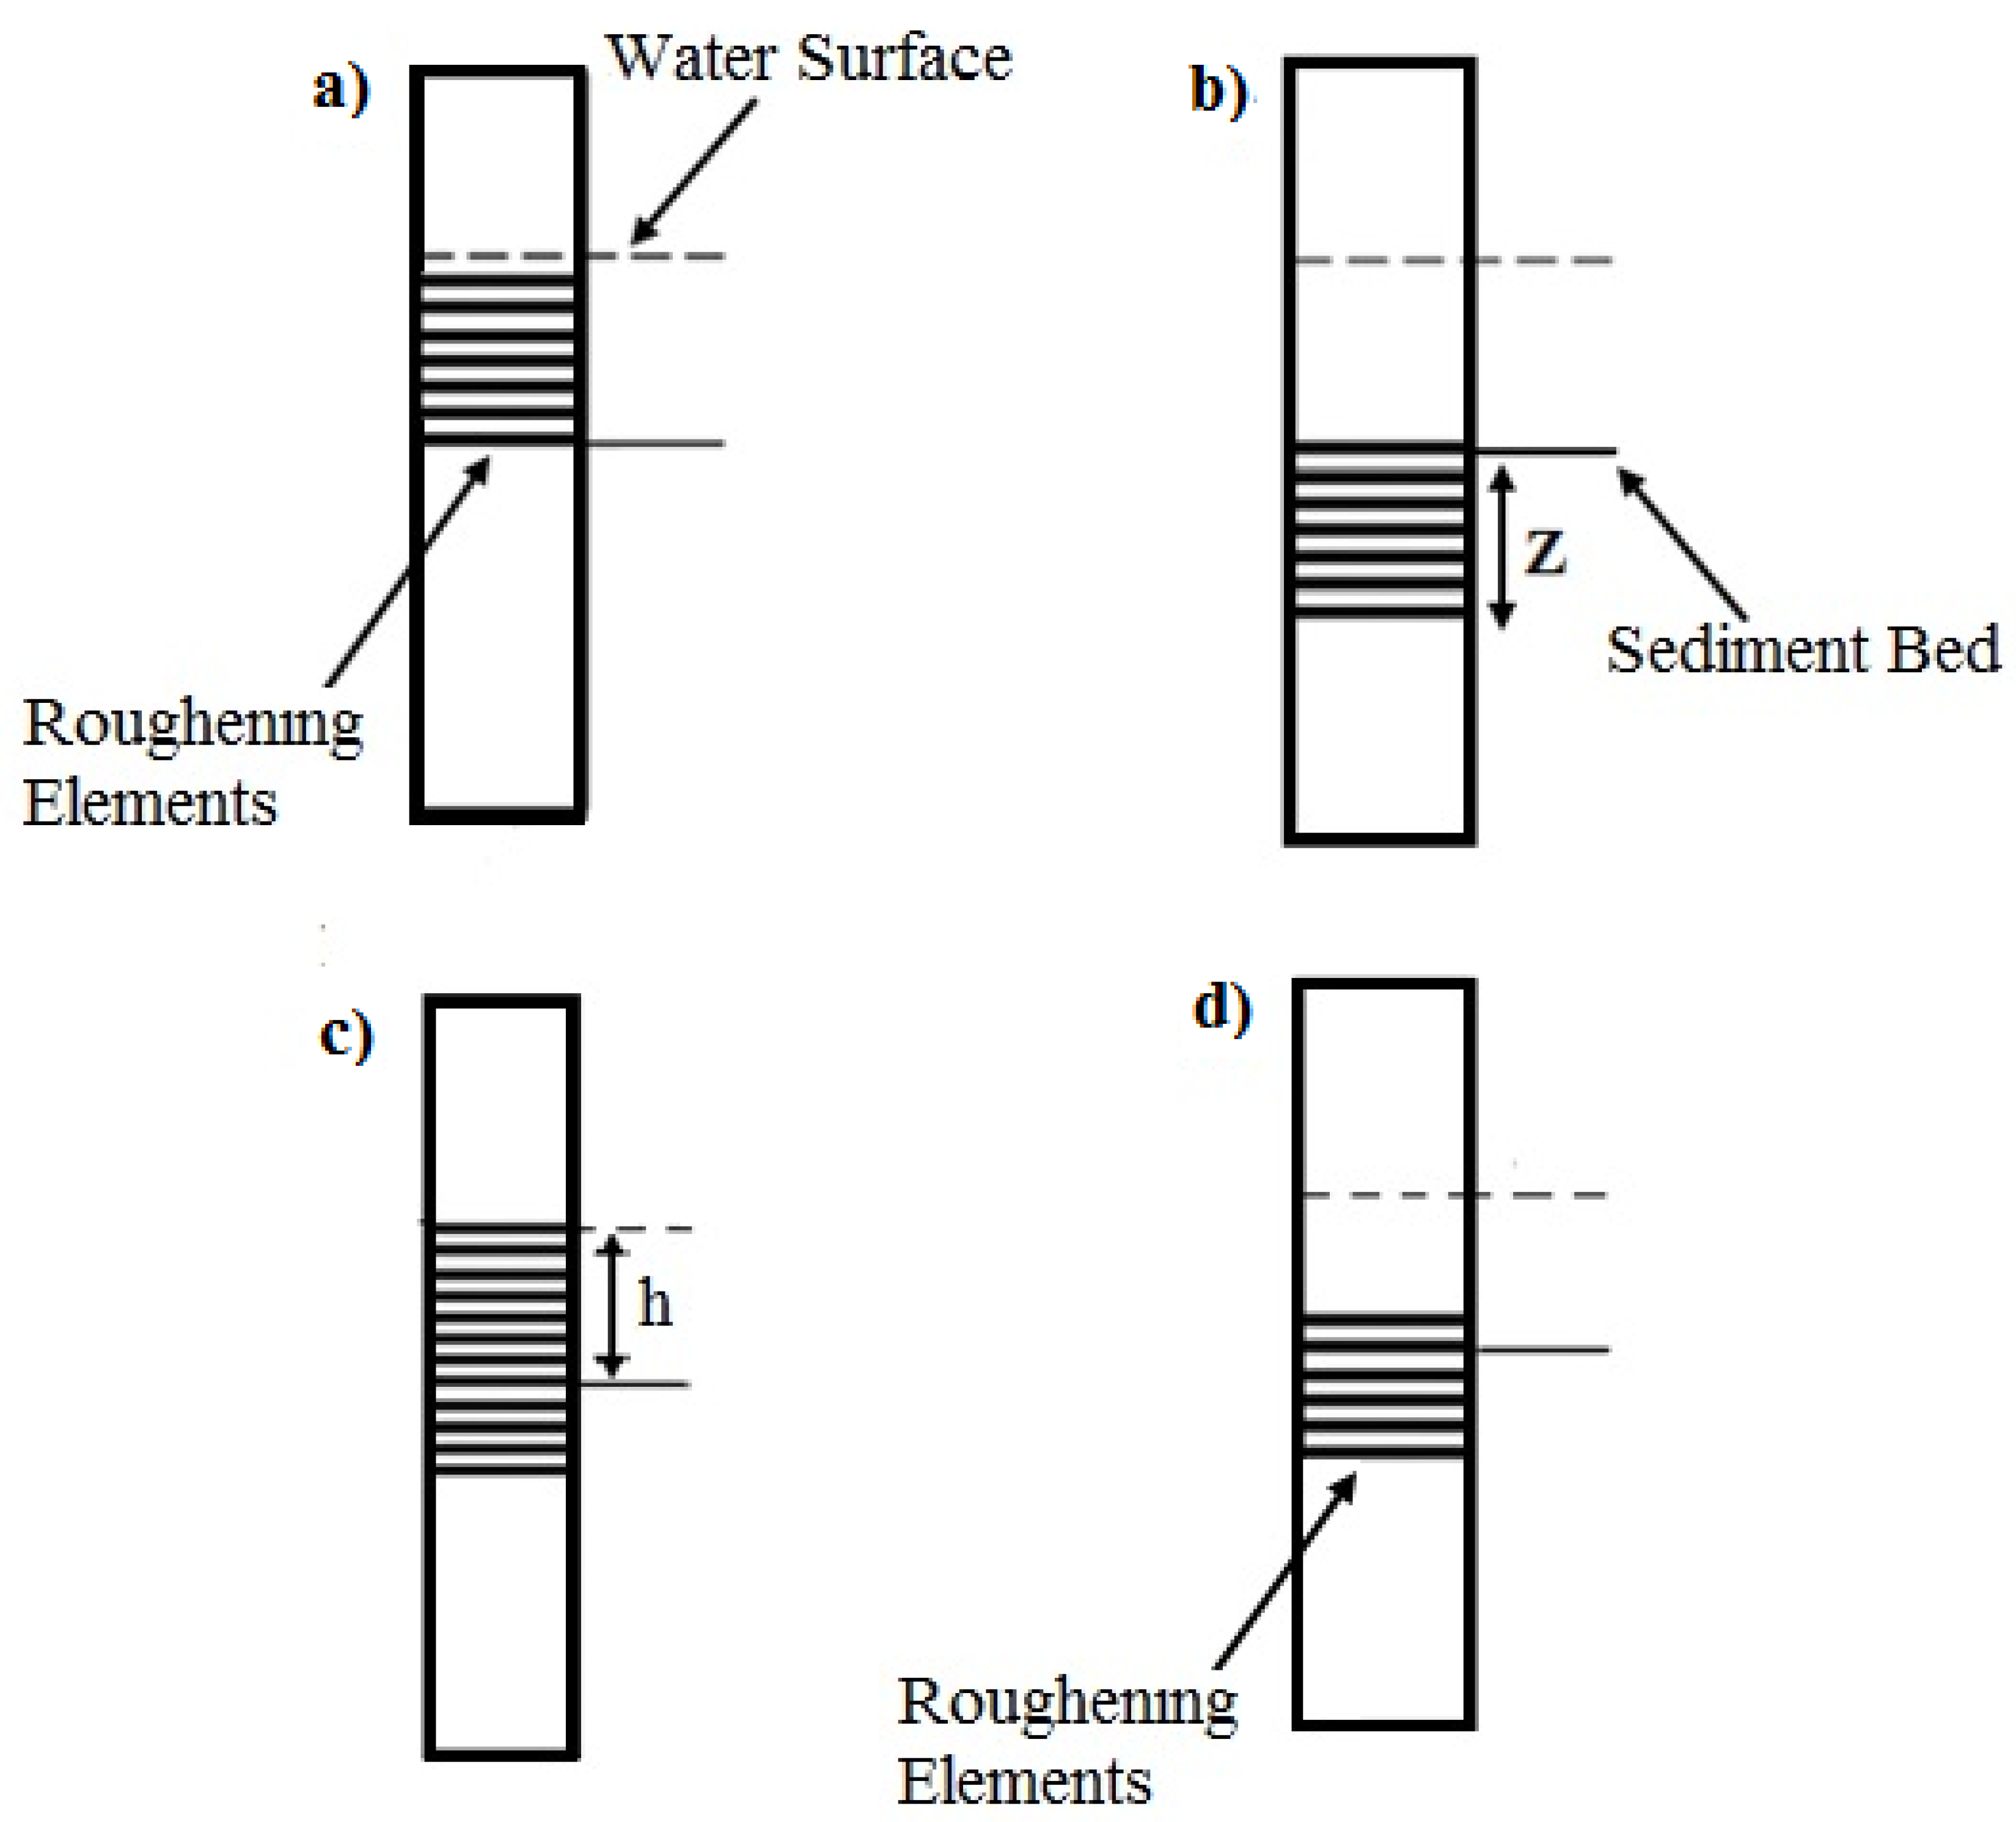
4. Installing Elements between the Bed and Water Surface (Step 1 in Assessment Experiments)

The findings indicate that installing more than one element on the sediment bed, regardless of the desired thickness and protrusion, does not reduce scour depth and in some cases, may even increase it. There is no clear trend in the results.

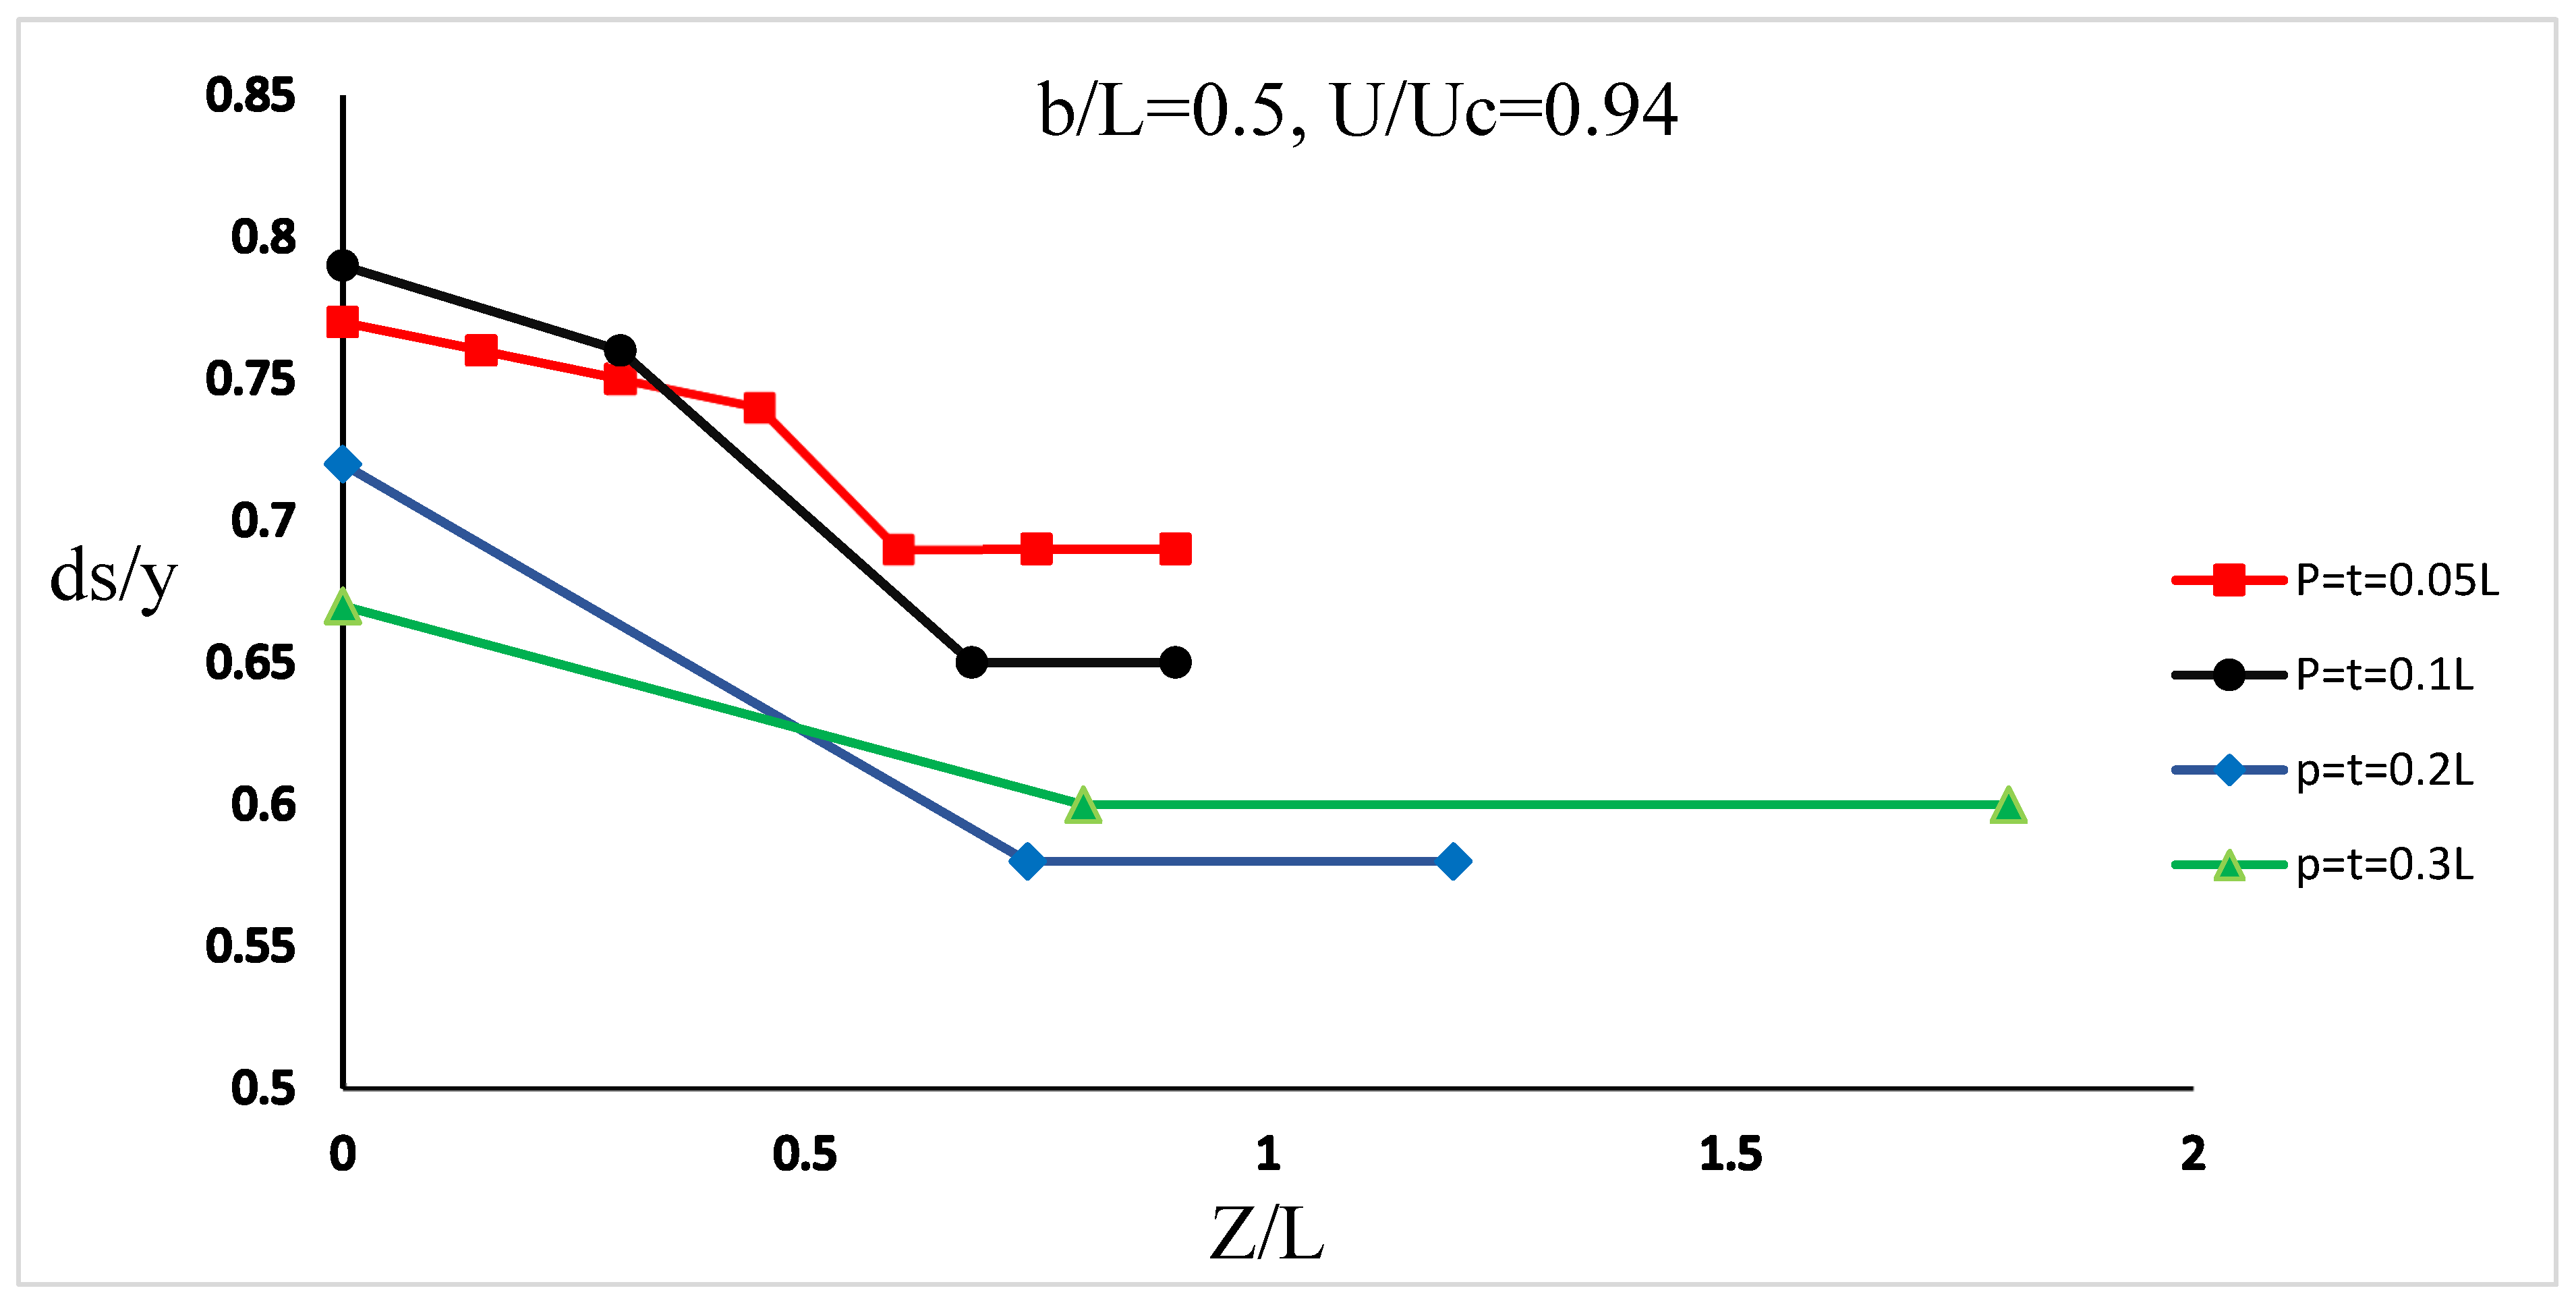
5. Determining the Optimum Installation Depth of the Elements

In the second step of the assessment experiments, (Table 2, Tests T1 to T7) (Figure 4b), it was found that installing elements at a depth of more than 8.4 cm (Z/L = 0.6) from the bed level has no effect on scour reduction. This is evident in tests T5, T6 and T7 in Table 2. The reason for this may be that, as a scour hole deepens, the strength of the primary vortex and three-dimensional flow field inside the scour hole decreases, and therefore the deeper placement of elements has no effect on scour depth. Consequently, the number of elements under the bed was set at four to satisfy the Z/L = 0.6 criterion (Test T5). Based on Table 2 (Test T8 to T14), installing elements between the sediment bed and water surface has no consistent pattern regarding scour reduction (compare T9, T10, T11 and T12).
In the previous section, the effect of installing elements between the sediment’s initial bed and water surface was investigated (in this case, no elements were installed under the bed level), and it was concluded that installing elements above the bed level did not have a specific effect on scour depth and varied randomly. In this section (Figure 4c), elements were installed both under and above the bed level, and the same results were obtained. Comparing the results with the previous section (in which elements were installed between the bed and water surface), it can be inferred that installing elements above the bed level does not impose a specific trend on scour reduction, even if some elements are installed within the sediments. Therefore, it is concluded that elements must be installed within a specific range to affect the primary vortex action that develops inside the scour hole [4]. Thus, installing elements under the sediment surface resulted in better protection of the abutment.
The results for other dimensions of roughening elements were similar. For t = P = 0.1 L, 0.2 L and 0.3 L, placing elements under the bed was found to be more effective than placing them above the sediment, and the best depth of element installation was at Z/L = >0.6–0.8. The results of the experiments, i.e., the dimensionless scour depths at the abutment toe for different installation depth of elements, are shown in Figure 5.
Based on Figure 5, it can be observed that for all element dimensions, the ratio of Z/L = >0.6–0.8 has the lowest scour depth. Therefore, the optimum installation depth of the elements under the sediments is proposed to be 0.6–0.8 times the abutment length. Similar results were obtained for the other abutment (b = 14 cm).

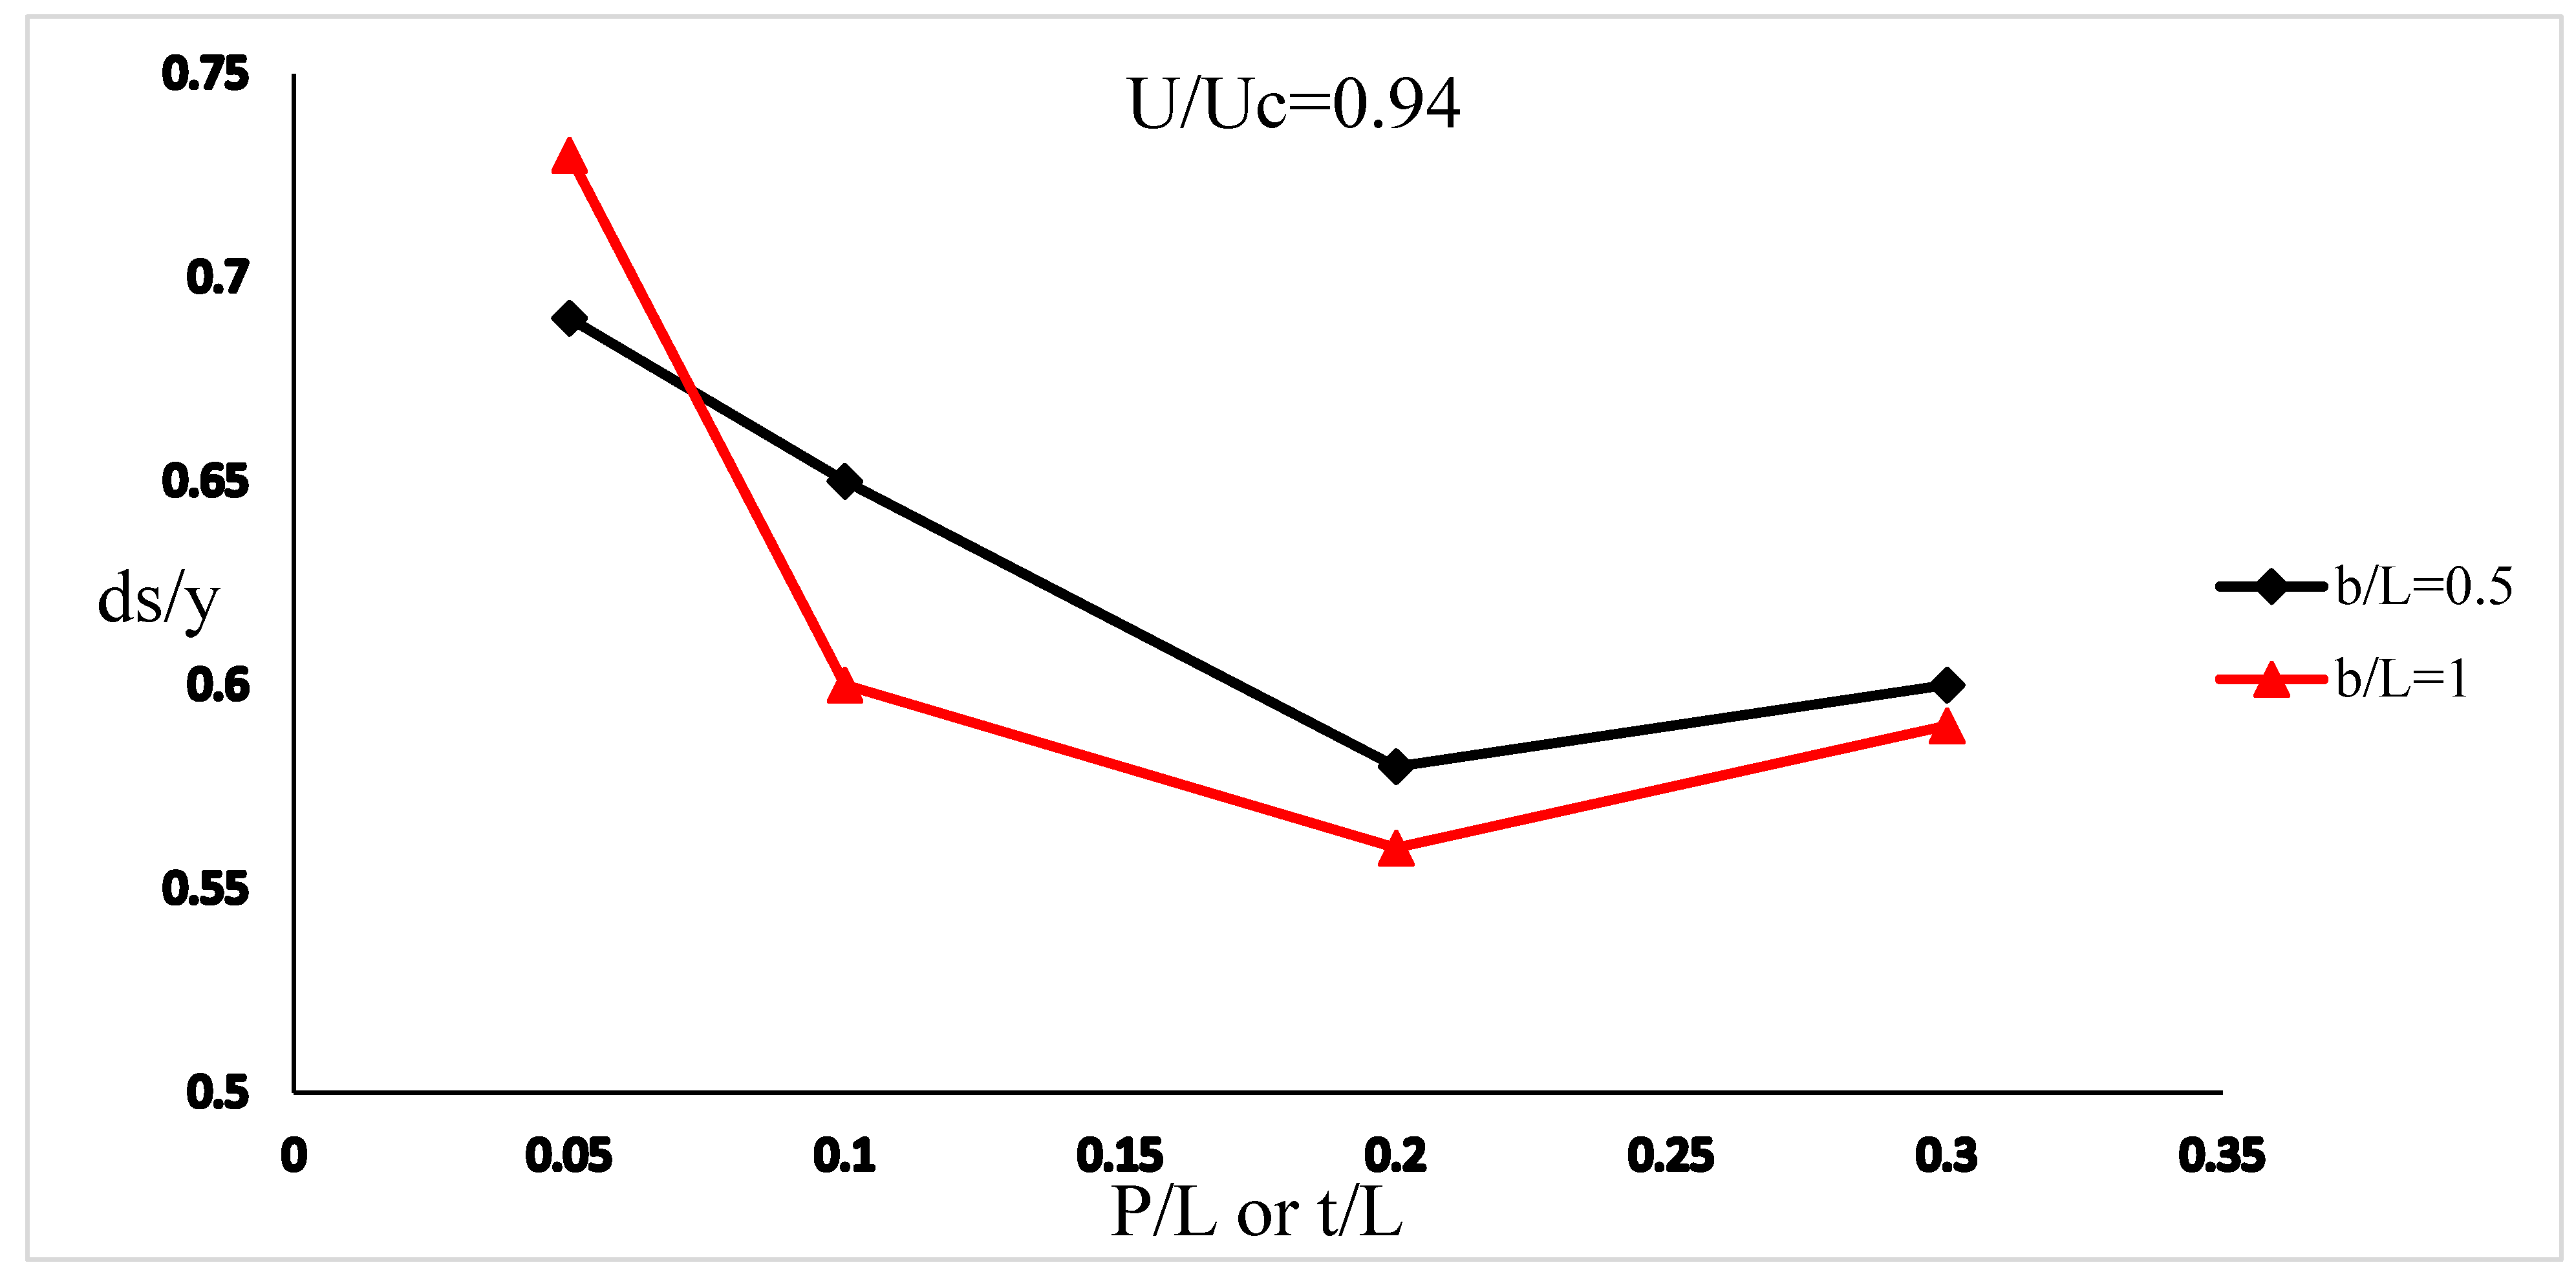
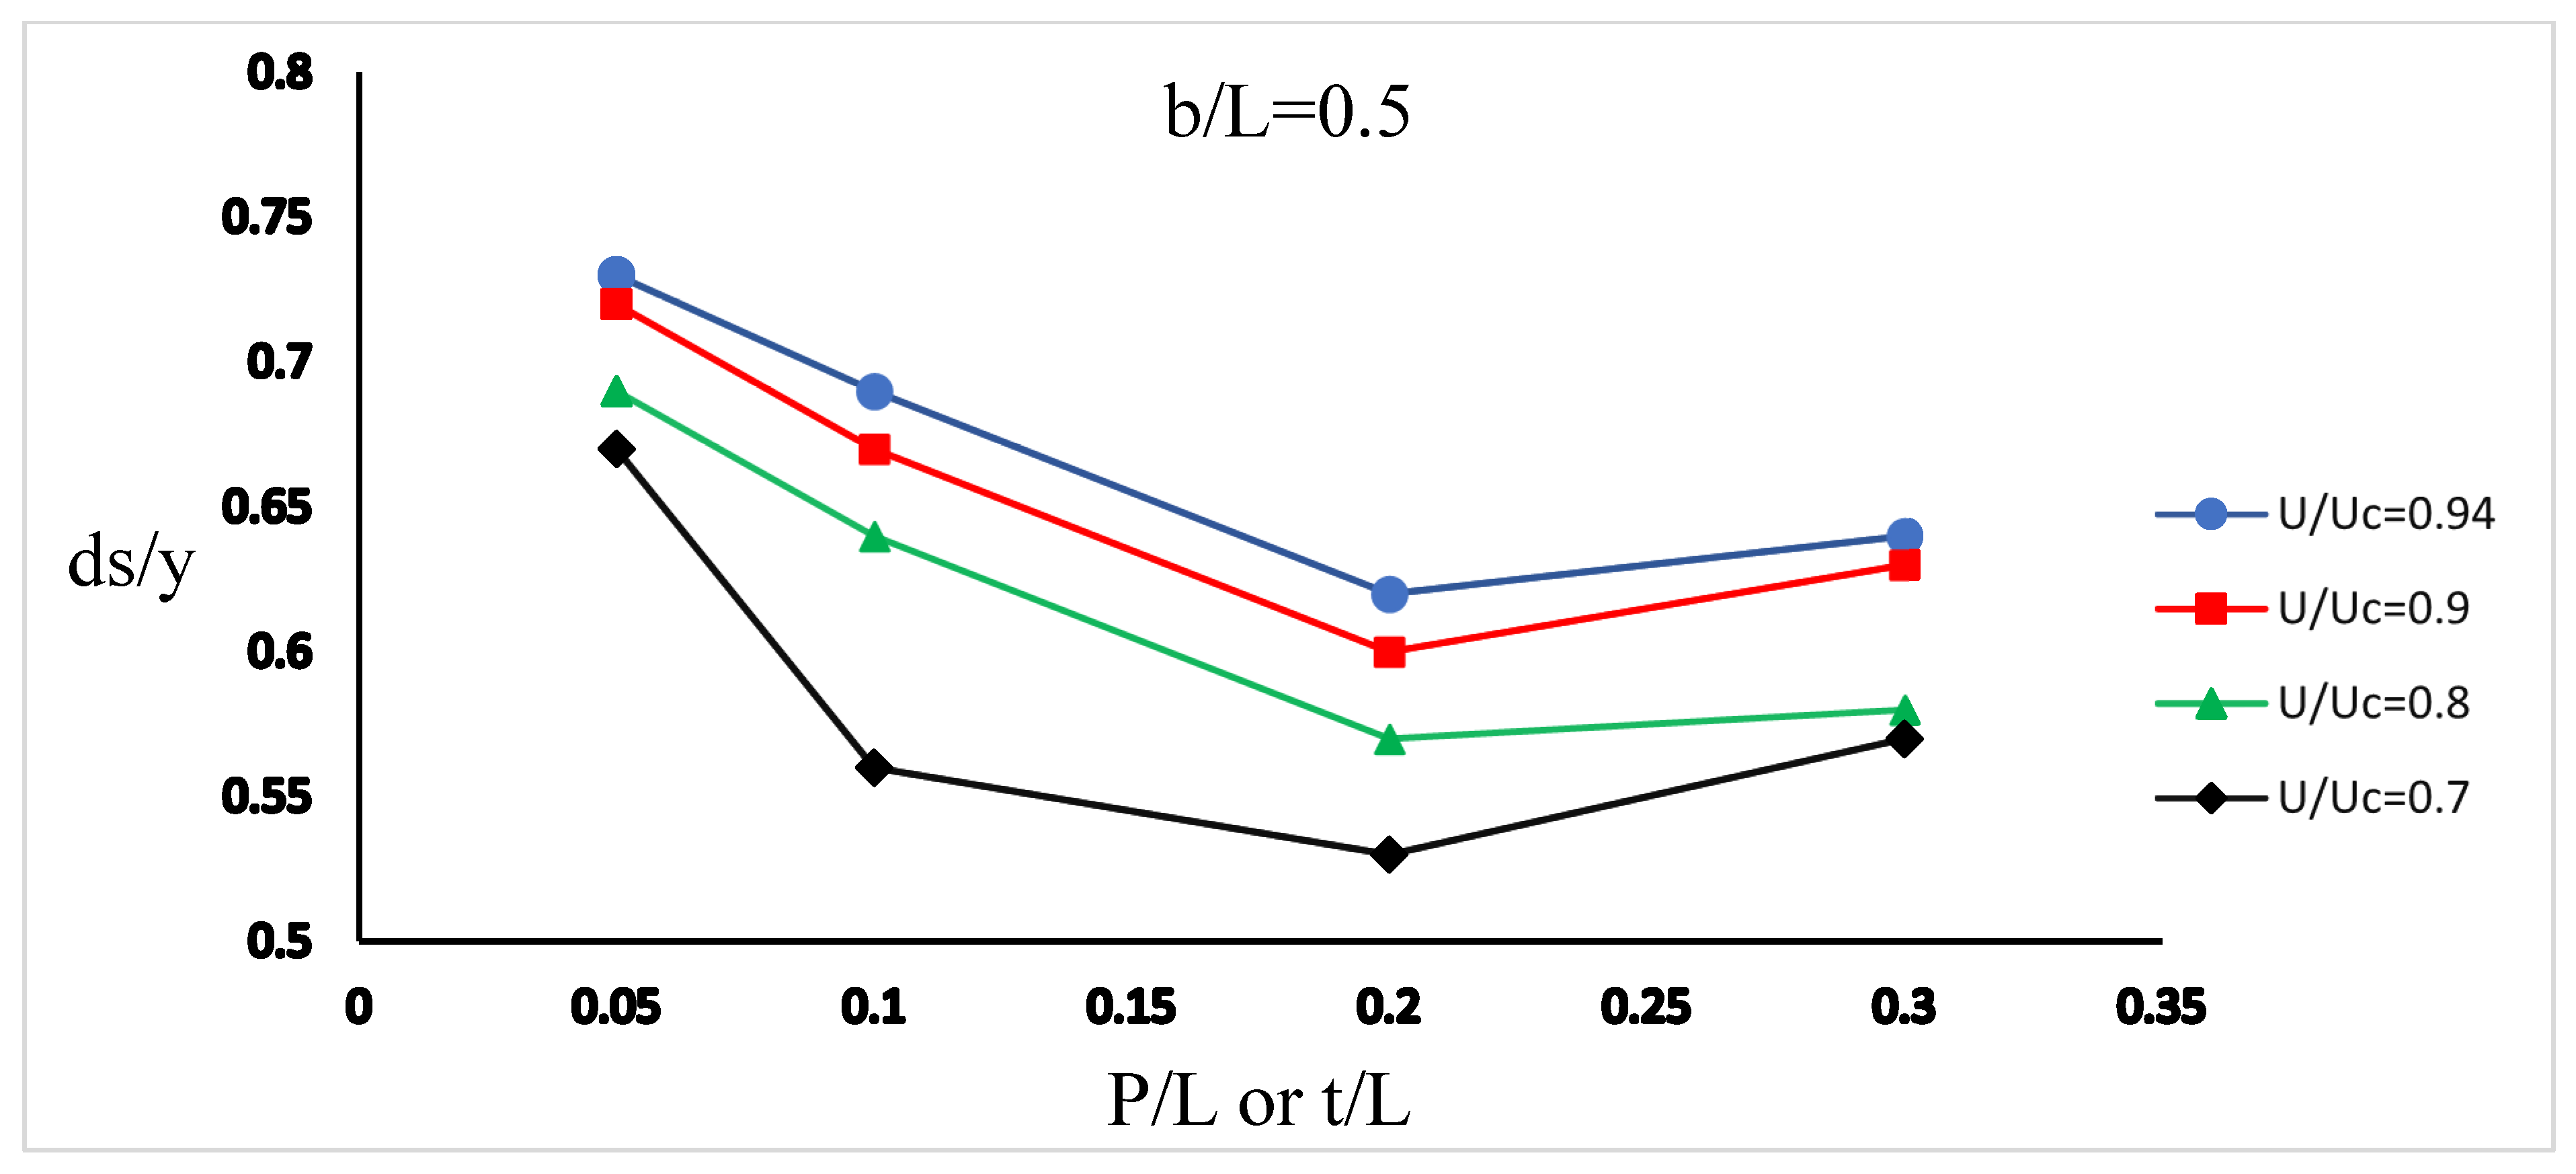
6. Determining Optimum Thickness and Protrusion of the Elements

From a hydraulic perspective, after the flow collides with the upstream abutment face, a downward flow is formed that turns into the bed and creates the principal vortex and abutment scour. The presence of roughening elements creates disturbance in the downward flow, leading to energy dissipation. As a result, the principal vortex is weakened, and less intense scouring occurs compared with baseline experiments.
The results indicate that, as the dimensions of roughening elements increase (Table 2, T15 to T17 for b = 7 cm, T19 to T21 for b = 14 cm), the scour depth decreases to a certain extent and then increases (compare T17 to T18 and T21 to T22). The results for both abutments are similar (Figure 6), indicating that abutment width does not affect the maximum scour depth. However, it can be concluded that, after increasing the protrusion of the elements beyond a certain value, they act as a new wall, reducing the effectiveness of the elements and leaving the abutment unprotected. This condition is similar to moving the abutment upstream by the same amount as the element’s protrusion, resulting in an increase in scour depth. The results suggest the best results can be obtained when the thickness and protrusion of the elements are equal to 20% of the abutment length. The scour depth at the abutment toe with the width of 7 and 14 cm was reduced by up to 30.4 and 32.8%, respectively.
Figure 7 shows the effect of different hydraulic conditions on scour depth in different element dimensions.
Figure 7 demonstrates that the best performance of roughening elements in reducing scour was achieved at t = P = 0.2 L (2.8 cm) even under different hydraulic conditions. The figure also shows that increasing the dimension of the elements to a certain degree reduces scour depth. It is clear that, under different hydraulic conditions and when increasing the dimension of the elements to a certain amount, the scour depth reduces. After P/L = t/L = 0.2, larger dimension has a reverse effect on scour depth.

7. Conclusions

This study investigated the effectiveness of roughening elements as a countermeasure for bridge abutment scour. Different arrangements and dimensions of roughening elements were tested on two rectangular abutments, and the local scour at the abutment toe was measured as the baseline point. The optimal depth of installation was found to be at Z/L = >0.6–0.8 under different hydraulic conditions. The best countermeasure performance was achieved by increasing the dimensions of the elements (protrusion (P) and thickness (t)) up to 0.2 L (abutment length), However, increasing the element dimensions beyond this point (t = p = 0.3 L), led to an increase in scour depth. Overall, the best performance was achieved at t = P = 0.2 L and Z/L = >0.6–0.8, resulting in a reduction of scour depth by up to 30.4% (b = 7 cm) and 32.8% (b = 14 cm), respectively. Further investigation is needed to investigate the effectiveness of these elements on cohesive soils and to expand their application.

Author Contributions

M.Z.: Methodology, Writing—original draft, Data curation, validation; S.M.A.Z.: validation, investigation, supervision; A.F.: Writing—review & editing, Formal analysis, Conceptualization; R.P.T.: Writing—review & editing, visualization; N.J.: Methodology, investigation; D.M.: resources, formal analysis; P.S.: Formal analysis, visualization; H.M.A.: Writing—review & editing, Formal analysis. All authors have read and agreed to the published version of the manuscript.

Funding

The costs for this research were provided from the grants of the second author, Water Engineering Department, Shiraz University (08, 05, 2016).

Data Availability Statement

Some or all data, models, or code that support the findings of this study are available from the corresponding author upon reasonable request. (List items).

Conflicts of Interest

The authors declare no conflict of interest.

Notations

Following symbols are used in this study:
B = channel (flume) width
b = Abutment width
d 50 = Median diameter of sediment
Fr = Froud number
g = gravitational acceleration,
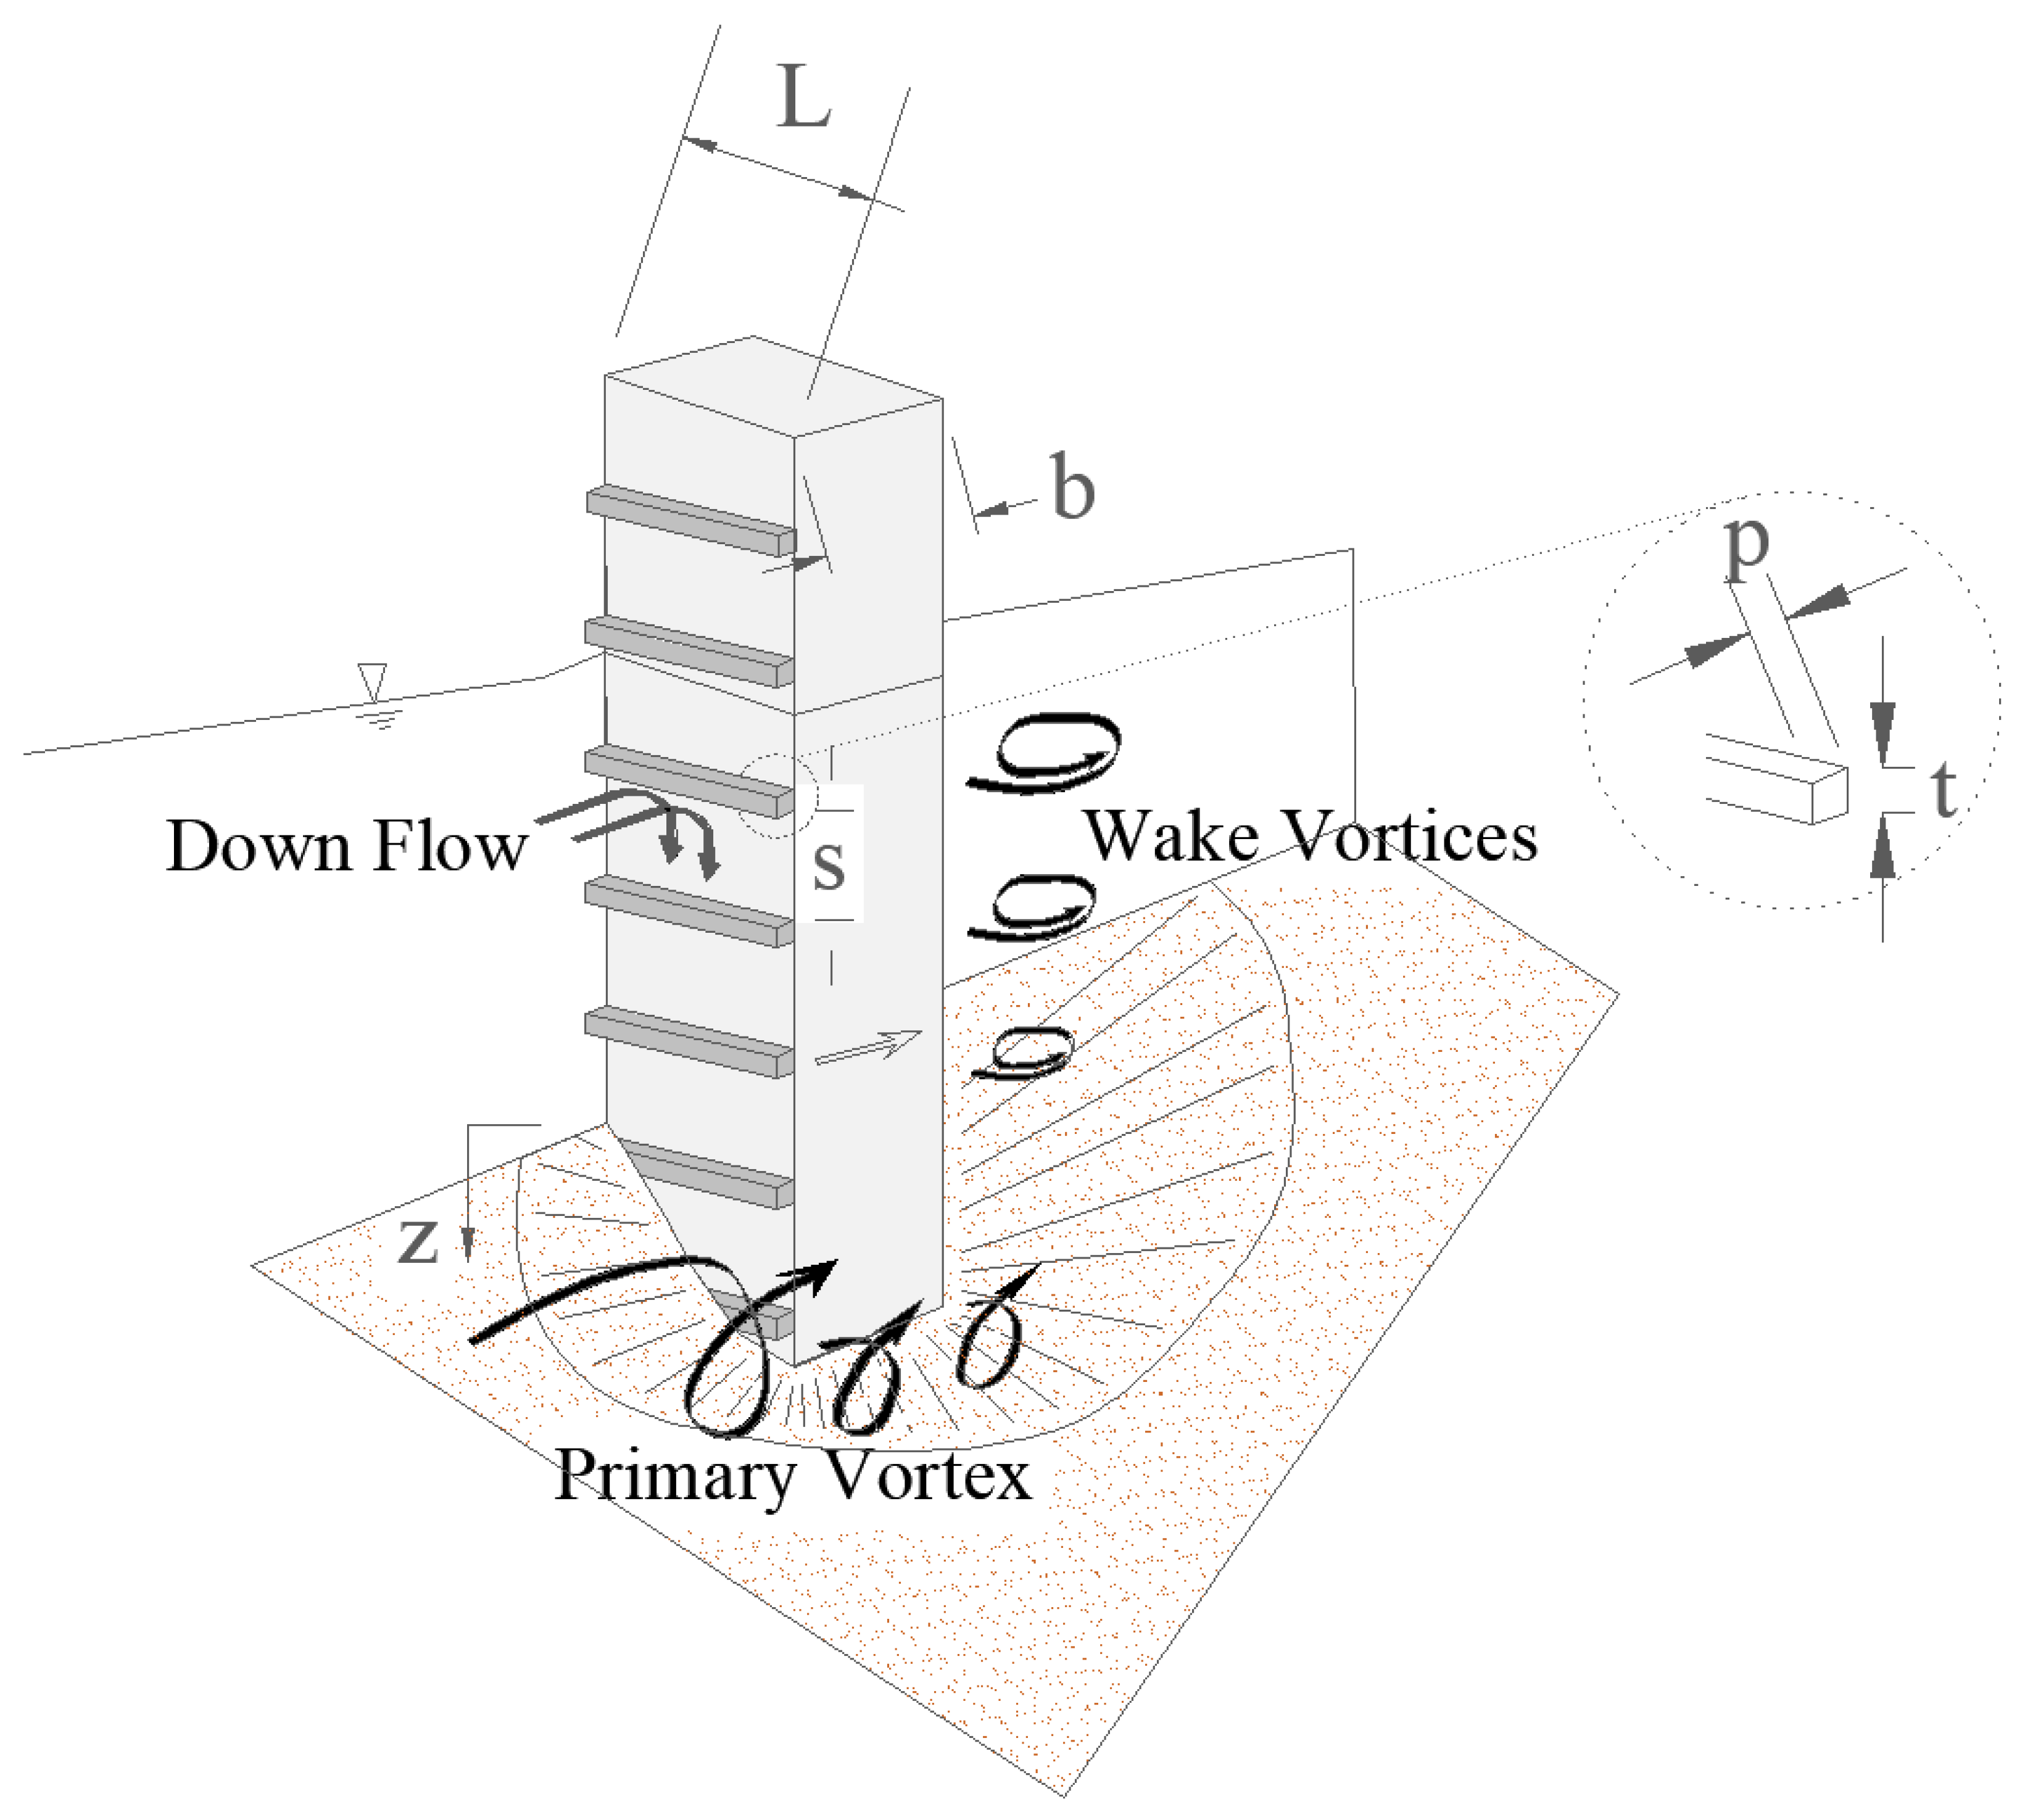
L = abutment length (m) (perpendicular to the flow),
P = Elements’ protrusion
Re = Reynold number
S = roughening element’s spacing t = Elements thickness
t = roughening element’s thickness
T = time
U = Flow velocity
U C = Critical velocity
U * C = Critical shear velocity
y = Flow depth
Z = Installation depth of elements
σ g = Geometric standard deviation
ρs = the sediment density,
ρ = water density
µ = water dynamic viscosity

References

  1. Richardson, E.V.; Harrison, L.J.; Richardson, J.R.; Davies, S.R. Evaluating Scour at Bridges; US Department of Transportation, Federal Highway Administration: Washington, DC, USA, 1993.
  2. Melville, B.W. Local scour at bridge abutments. J. Hydraul. Eng. 1992, 118, 615–631. [Google Scholar] [CrossRef]
  3. Afzalimehr, H.; Moradian, M.; Singh, V.P. Flow Field around Semielliptical Abutments. J. Hydrol. Eng. 2018, 23, 04017057. [Google Scholar] [CrossRef]
  4. Barbhuiya, A.K.; Dey, S. Vortex flow field in a scour hole around abutment. Int. J. Sed. Res. 2003, 18, 310–325. [Google Scholar] [CrossRef]
  5. Molinas, A.; Kheireldin, K.; Wu, B. Shear Stress around Vertical Wall Abutments. J. Hydraul. Eng. 1998, 124, 822–830. [Google Scholar] [CrossRef]
  6. Tripathi, R.P.; Pandey, K.K. Numerical investigation of flow field around T-shaped spur dyke in a reverse-meandering channel. Water Supply 2022, 22, 574–588. [Google Scholar] [CrossRef]
  7. Lai, Y.G.; Liu, X.; Bombardelli, F.A.; Song, Y. Three-Dimensional Numerical Modeling of Local Scour: A State-of-the-Art Review and Perspective. J. Hydraul. Eng. 2022, 148, 03122002. [Google Scholar] [CrossRef]
  8. Pandey, M.; Oliveto, G.; Pu, J.H.; Sharma, P.K.; Ojha, C.S.P. Pier Scour Prediction in Non-Uniform Gravel Beds. Water 2020, 12, 1696. [Google Scholar] [CrossRef]
  9. Gazi, A.H.; Afzal, M.S. A new mathematical model to calculate the equilibrium scour depth around a pier. Acta Geophys. 2019, 68, 181–187. [Google Scholar] [CrossRef]
  10. Melville, B.; Coleman, S. Bridge Scour; Water Resources Publications: Littleton, CO, USA, 2000; 550p. [Google Scholar]
  11. Melville, B.; Van Ballegooy, S.; Coleman, S.; Barkdoll, B. Scour Countermeasures for Wing-Wall Abutments. J. Hydraul. Eng. 2006, 132, 563–574. [Google Scholar] [CrossRef]
  12. Korkut, R.; Martinez, E.J.; Morales, R.; Ettema, R.; Barkdoll, B. Geobag Performance as Scour Countermeasure for Bridge Abutments. J. Hydraul. Eng. 2007, 133, 431–439. [Google Scholar] [CrossRef]
  13. Cardoso, A.H.; Fael, C.M. Protecting Vertical-Wall Abutments with Riprap Mattresses. J. Hydraul. Eng. 2009, 135, 457–465. [Google Scholar] [CrossRef] [Green Version]
  14. Sui, J.; Afzalimehr, H.; Samani, A.K.; Maherani, M. Clear-water scour around semi-elliptical abutments with armored beds. Int. J. Sediment Res. 2010, 25, 233–245. [Google Scholar] [CrossRef]
  15. Dargahi, B. Controlling Mechanism of Local Scouring. J. Hydraul. Eng. 1990, 116, 1197–1214. [Google Scholar] [CrossRef]
  16. Chiew, Y.M. Scour protection at bridge piers. J. Hydraul. Eng. 1992, 118, 1260–1269. [Google Scholar] [CrossRef]
  17. Kumar, V.; Raju, K.G.R.; Vittal, N. Reduction of Local Scour around Bridge Piers Using Slots and Collars. J. Hydraul. Eng. 1999, 125, 1302–1305. [Google Scholar] [CrossRef]
  18. Johnson, P.A.; Hey, R.D.; Tessier, M.; Rosgen, D. Use of Vanes for Control of Scour at Vertical Wall Abutments. J. Hydraul. Eng. 2001, 127, 772–778. [Google Scholar] [CrossRef]
  19. Zarrati, A.R.; Gholami, H.; Mashahir, M. Application of collar to control scouring around rectangular bridge piers. J. Hydraul. Res. 2004, 42, 97–103. [Google Scholar] [CrossRef]
  20. Li, H.; Barkdoll, B.D.; Kuhnle, R.; Alonso, C. Parallel Walls as an Abutment Scour Countermeasure. J. Hydraul. Eng. 2006, 132, 510–520. [Google Scholar] [CrossRef]
  21. Heidarpour, M.; Afzalimehr, H.; Izadinia, E. Reduction of local scour around bridge pier groups using collars. Int. J. Sediment Res. 2010, 25, 411–422. [Google Scholar] [CrossRef]
  22. Fathi, A.; Zomorodian, S.M.A. Effect of Submerged Vanes on Scour Around a Bridge Abutment. KSCE J. Civ. Eng. 2018, 22, 2281–2289. [Google Scholar] [CrossRef]
  23. Valela, C.; Rennie, C.D.; Nistor, I. Improved bridge pier collar for reducing scour. Int. J. Sediment Res. 2021, 37, 37–46. [Google Scholar] [CrossRef]
  24. Tripathi, R.P.; Pandey, K.K. Scour around spur dike in curved channel: A review. Acta Geophys. 2022, 70, 2469–2485. [Google Scholar] [CrossRef]
  25. Mashahir, M.B.; Zarrati, A.R.; Mokallaf, E. Application of Riprap and Collar to Prevent Scouring around Rectangular Bridge Piers. J. Hydraul. Eng. 2010, 136, 183–187. [Google Scholar] [CrossRef]
  26. Zarrati, A.R.; Chamani, M.R.; Shafaie, A.; Latifi, M. Scour countermeasures for cylindrical piers using riprap and combination of collar and riprap. Int. J. Sediment Res. 2010, 25, 313–322. [Google Scholar] [CrossRef]
  27. Zolghadr, M.; Bejestan, M.S.; Fathi, A.; Hoseinreza, A. Protecting vertical-wall bridge abutment using six-pillar concrete elements. Arab. J. Geosci. 2022, 15, 1226. [Google Scholar] [CrossRef]
  28. Radice, A.; Davari, V. Roughening Elements as Abutment Scour Countermeasures. J. Hydraul. Eng. 2014, 140, 06014014. [Google Scholar] [CrossRef]
  29. Dey, S.; Sumer, B.M.; Fredsøe, J. Control of Scour at Vertical Circular Piles under Waves and Current. J. Hydraul. Eng. 2006, 132, 270–279. [Google Scholar] [CrossRef]
  30. Radice, A.; Lauva, O. On flow-altering countermeasures for scour at vertical-wall abutment. Arch. Hydro Eng. Environ. Mech. 2012, 59, 137–153. [Google Scholar]
  31. Oliveto, G.; Hager, W.H. Temporal evolution of clear-water pier and abutment scour. ASCE J. Hydraulic. Eng. 2002, 128, 811–820. [Google Scholar] [CrossRef]
  32. Breusers, H.N.C.; Raudkivi, A.J. Scouring. Hydraulic Structures Design Manual2; IAHR: Rotterdam, The Netherlands, 1991. [Google Scholar]
  33. Raudkivi, A.J.; Ettema, R. Clear-water scour at cylindrical piers. J. Hydraul. Eng. 1983, 109, 338–350. [Google Scholar] [CrossRef]
  34. Haghnazar, H.; Sangsefidi, Y.; Mehraein, M.; Tavakol-Davani, H. Evaluation of infilling and replenishment of river sand mining pits. Environ. Earth Sci. 2020, 79, 362. [Google Scholar] [CrossRef]
  35. Ballio, F.; Teruzzi, A.; Radice, A. Constriction Effects in Clear-Water Scour at Abutments. J. Hydraul. Eng. 2009, 135, 140–145. [Google Scholar] [CrossRef]
  36. Melville, B.W.; Sutherland, A.J. Design Method for Local Scour at Bridge Piers. J. Hydraul. Eng. 1988, 114, 1210–1226. [Google Scholar] [CrossRef]
  37. Raudkivi, A.J. Loose Boundary Hydraulics, 3rd ed.; Technical Report; Pergamon Press: Oxford, UK, 1990. [Google Scholar]
  38. Bozkus, Z.; Yildiz, O. Effects of Inclination of Bridge Piers on Scouring Depth. J. Hydraul. Eng. 2004, 130, 827–832. [Google Scholar] [CrossRef]
  39. Vittal, N.; Kothyari, U.C.; Haghighat, M. Clear-water scour around bridge pier group. J. Hydraul. Eng. 1994, 120, 1309–1318. [Google Scholar] [CrossRef]
  40. Mohammadpour, R.; Ghani, A.A.; Azamathulla, H.M. Estimation of dimension and time variation of local scour at short abutment. Int. J. River Basin Manag. 2013, 11, 121–135. [Google Scholar] [CrossRef]
  41. Zolghadr, M.; Bejestan, M.S.; Rezaeianzadeh, M. Investigating the Effect of Six-Legged Element Placement Density on Local Scour at Wing-Wall Bridge Abutments. In Proceedings of the World Environmental and Water Resources Congress, West Palm Beach, FL, USA, 22–26 May 2016. [Google Scholar] [CrossRef]
  42. Zolghadr, M.; Bejestan, M.S. Six legged concrete (SLC) elements as scour countermeasures at wing wall bridge abutments. Int. J. River Basin Manag. 2020, 19, 319–325. [Google Scholar] [CrossRef]
  43. Coleman, S.E.; Lauchlan, C.S.; Melville, B. Clear-water scour development at bridge abutments. J. Hydraul. Res. 2003, 41, 521–531. [Google Scholar] [CrossRef]
  44. Cheng, N.S.; Chiew, Y.M.; Chen, X. Scaling Analysis of Pier-Scouring Processes. J. Eng. Mech. ASCE 2016, 142, 06016005. [Google Scholar] [CrossRef]
  45. Lanca, R.; Fael, C.; Cardoso, A. Assessing equilibrium clear water scour around single cylindrical piers. River Flow 2010, 2010, 1207–1213. [Google Scholar]
  46. Khazimenejad, H.; Ghomeishi, M.; Shafai Bajestan, M. Comparison of Symmetrical and Unsymmetrical Rectangular Collars on Reduction of Local Scour at Bridge Abutment. J. Irrig. Sci. Eng. 2014, 37, 1–12. [Google Scholar]
  47. Mahdi, M.; Mehdi, F.; Venkat, A. Using data mining methods to improve discharge coefficient prediction in Piano Key and Labyrinth weirs. Water Supply 2021, 22, 1964–1982. [Google Scholar] [CrossRef]
  48. Xiong, X.; Melville, B.W.; Feriedrich, H. Effect of contraction length on abutment scour. In Proceedings of the International IAHR World Congress, Athens, Greece, 5–7 September 2013. [Google Scholar]
Figure 1. Flow field around an abutment, roughening elements at abutment upstream face.
Fluids 08 00175 g001
Figure 2. Schematic illustration of flume setup.
Fluids 08 00175 g002
Figure 3. Maximum scour depth at abutment toe. (a) Width = 7 cm (b/L = 0.5), (b) width = 14 cm (b/L = 1) (Flow Direction is from right to left), and (c,d) runs of baseline experiments.
Fluids 08 00175 g003
Figure 4. Sketch of the installation of roughening elements on the upstream face of the abutment, under and above the bed (a): T1, (b) T7, (c) T8, (d) T14 (The roughening elements face the flow direction).
Fluids 08 00175 g004
Figure 5. Effect of the installation depth of elements with different dimensions at scour depth.
Fluids 08 00175 g005
Figure 6. Results of the effects of the elements protrusion size on scour depth for both abutments. All elements’ dimensions were tested under the best depth of installation (optimum value of Z/L).
Fluids 08 00175 g006
Figure 7. Evaluation of scour depth at different hydraulic conditions.
Fluids 08 00175 g007
Table 1. Overall view of experiments.
Test ConditionsBaseline ExperimentsAssessment ExperimentsTotal Experiments
Elements under Bed LevelElements above and under Bed LevelOptimum Thickness and ProtrusionDifferent Hydraulic Conditions
Number of Testsb = 7 cm17741635
b = 14 cm14441629
Table 2. Summary of results of scour depth around both abutments (b = 7 and b = 14 cm) using roughening elements with different protrusion and thickness.
Test NumberNumber of Elements under the BedNumber of Elements above the BedAbutment Widtht = PU/UCds/yScour Depth Reduction %Z (cm)Z/L
T101b/L = 0.50.05 L (0.7 cm)0.940.777.200
T211b/L = 0.50.05 L (0.7 cm)0.940.768.82.10.15
T321b/L = 0.50.05 L (0.7 cm)0.940.759.64.20.3
T431b/L = 0.50.05 L (0.7 cm)0.940.7411.26.30.45
T541b/L = 0.50.05 L (0.7 cm)0.940.6917.68.40.6
T651b/L = 0.50.05 L (0.7 cm)0.940.6917.610.50.75
T761b/L = 0.50.05 L (0.7 cm)0.940.6917.612.60.9
T842b/L = 0.50.05 L (0.7 cm)0.940.7168.40.6
T943b/L = 0.50.05 L (0.7 cm)0.940.7168.40.6
T1044b/L = 0.50.05 L (0.7 cm)0.940.6917.68.40.6
T1145b/L = 0.50.05 L (0.7 cm)0.940.73128.40.6
T1246b/L = 0.50.05 L (0.7 cm)0.940.7114.48.40.6
T1347b/L = 0.50.05 L (0.7 cm)0.940.7213.68.40.6
T1448b/L = 0.50.05 L (0.7 cm)0.940.715.28.40.6
T1541b/L = 0.50.05 L (0.7 cm)0.940.6917.68.40.6
T1621b/L = 0.50.1 L (1.4 cm)0.940.6522.49.80.7
T1711b/L = 0.50.2 L (2.8 cm)0.940.5830.410.50.75
T1811b/L = 0.50.3 L (4.2 cm)0.940.62811.20.8
T1941b/L = 10.05 L (0.7 cm)0.940.73128.40.6
T2021b/L = 10.1 L (1.4 cm)0.940.627.29.80.7
T2111b/L = 10.2 L (2.8 cm)0.940.5632.810.50.75
T2211b/L = 10.3 L (4.2 cm)0.940.5929.611.20.8
Note: the 7th column is obtained by comparing with baseline tests (ds = 12.5 cm).
Disclaimer/Publisher’s Note: The statements, opinions and data contained in all publications are solely those of the individual author(s) and contributor(s) and not of MDPI and/or the editor(s). MDPI and/or the editor(s) disclaim responsibility for any injury to people or property resulting from any ideas, methods, instructions or products referred to in the content.

