
Flow-Induced Forces for a Group of One Large and Several Small Structures in the Sheared Turbulent Flow


Abstract
:1. Introduction
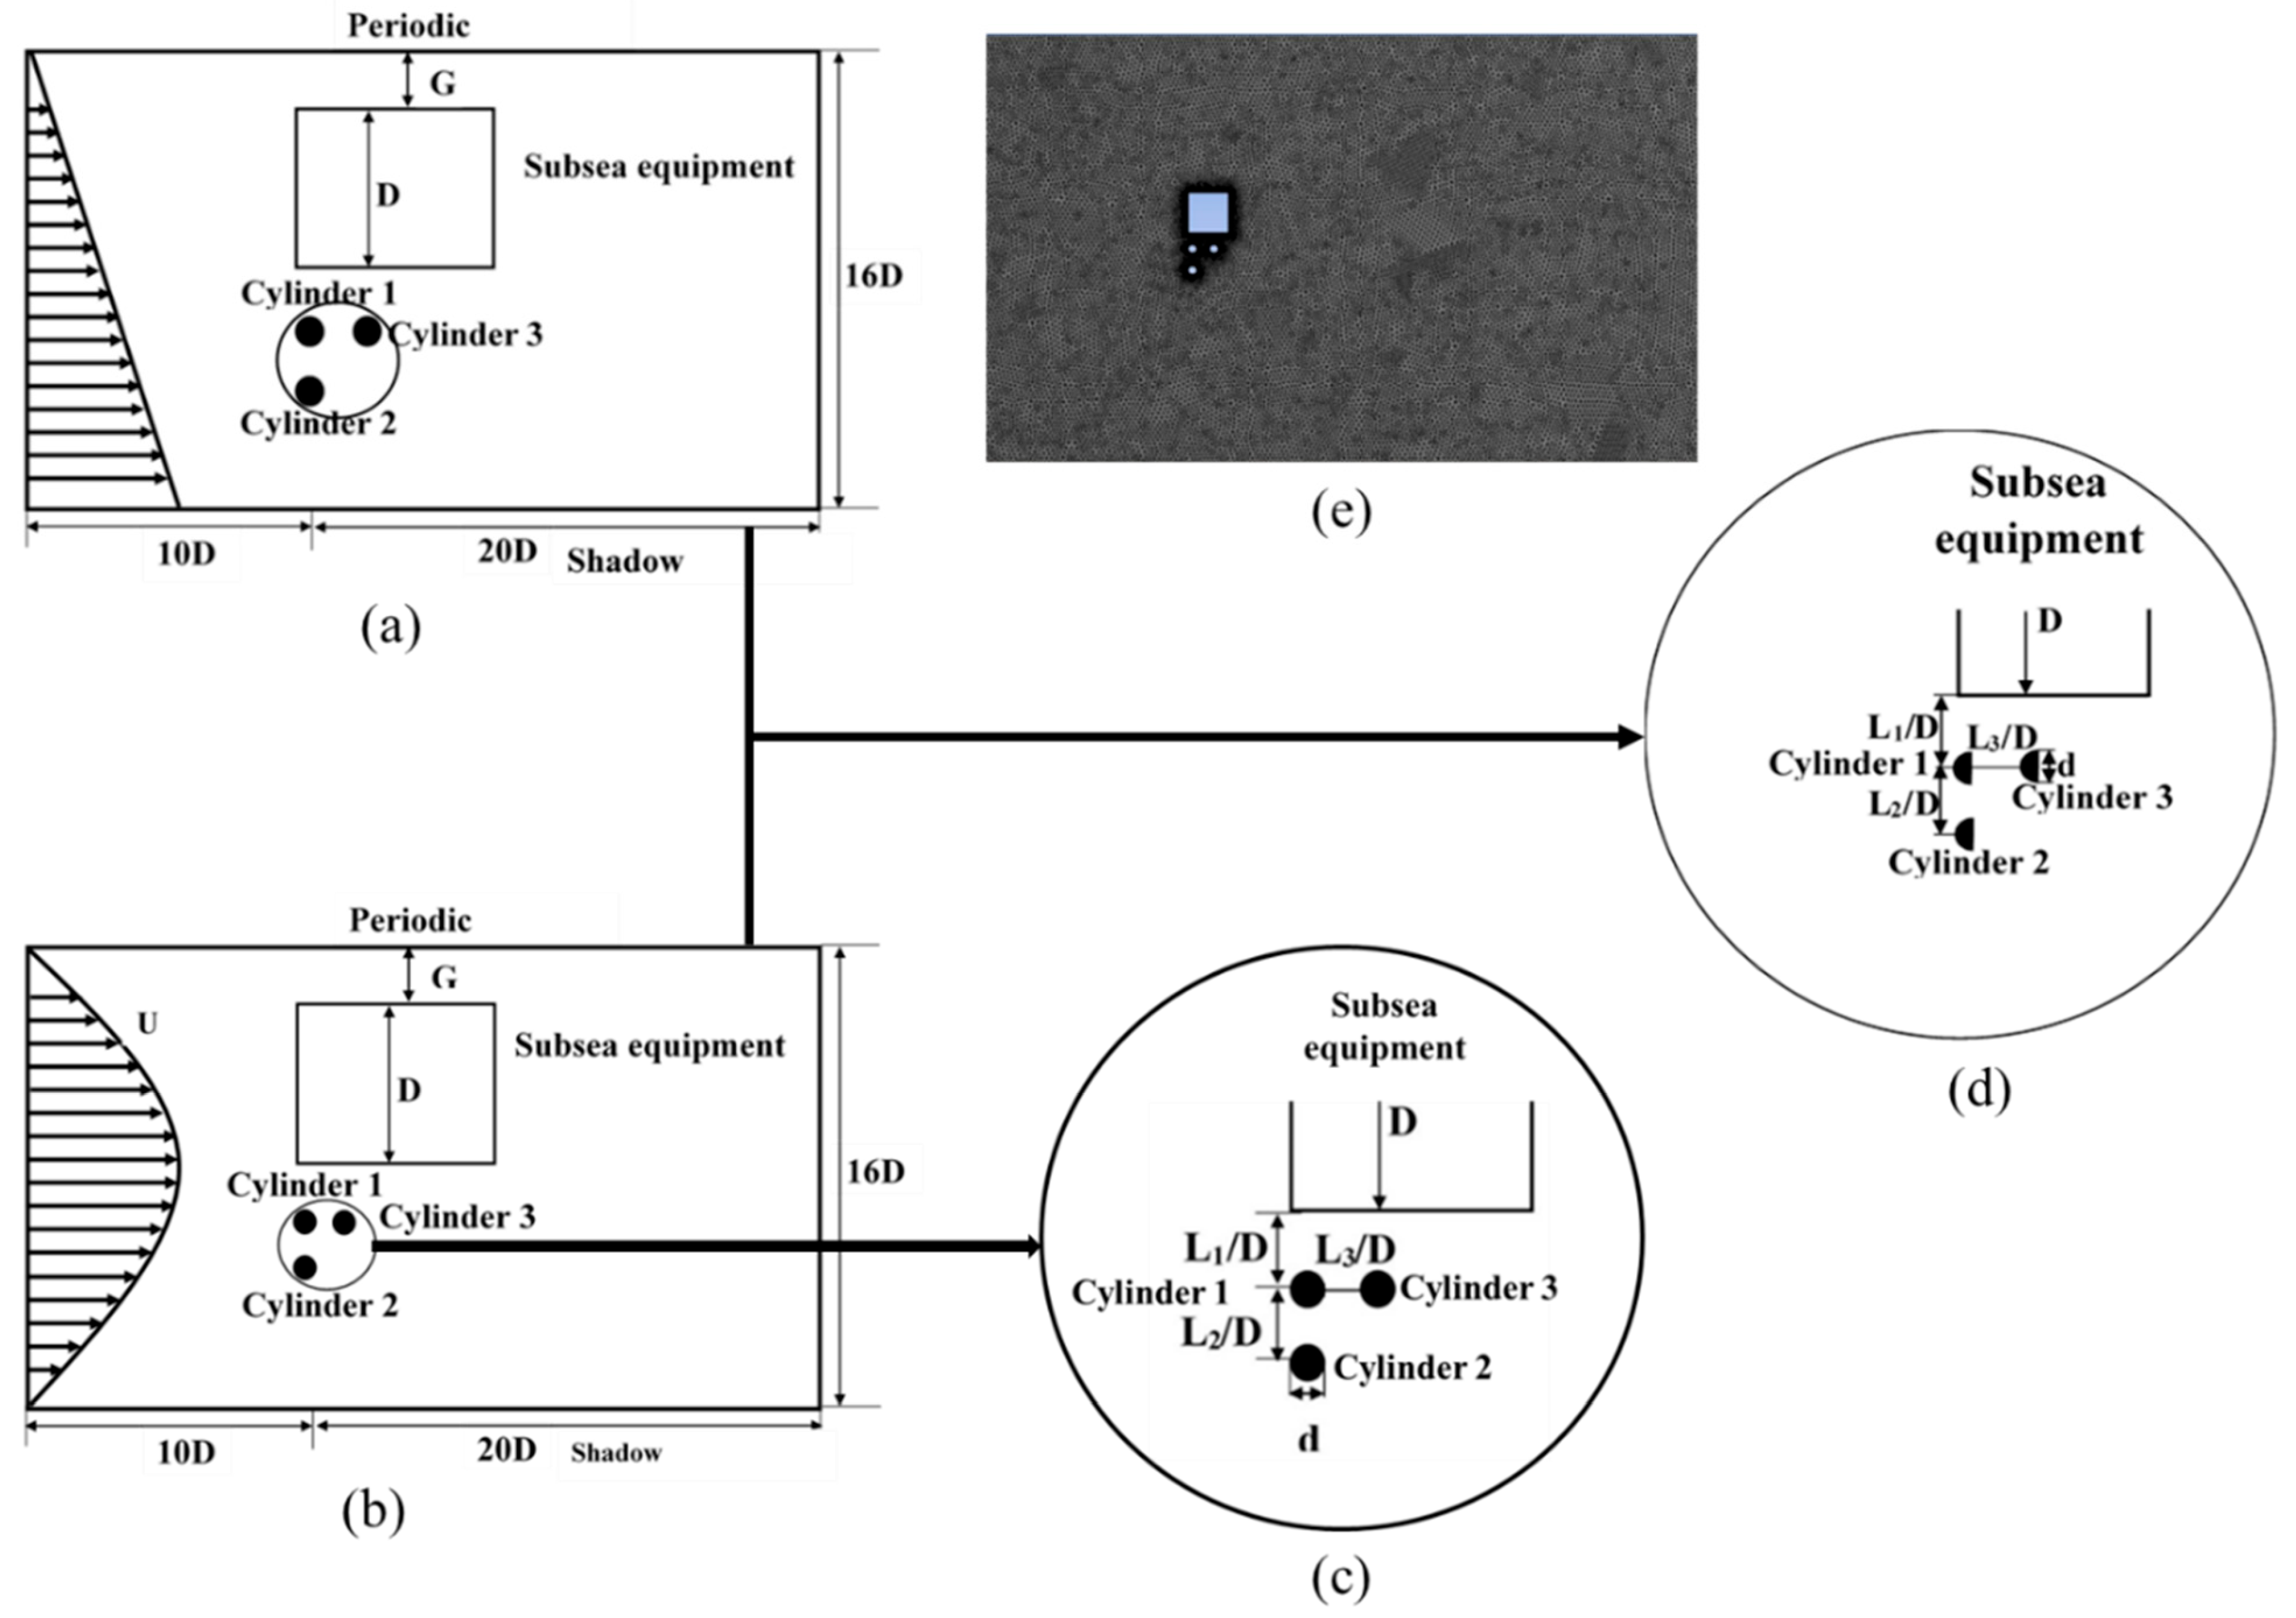
2. Numerical Model
3. Results and Discussion
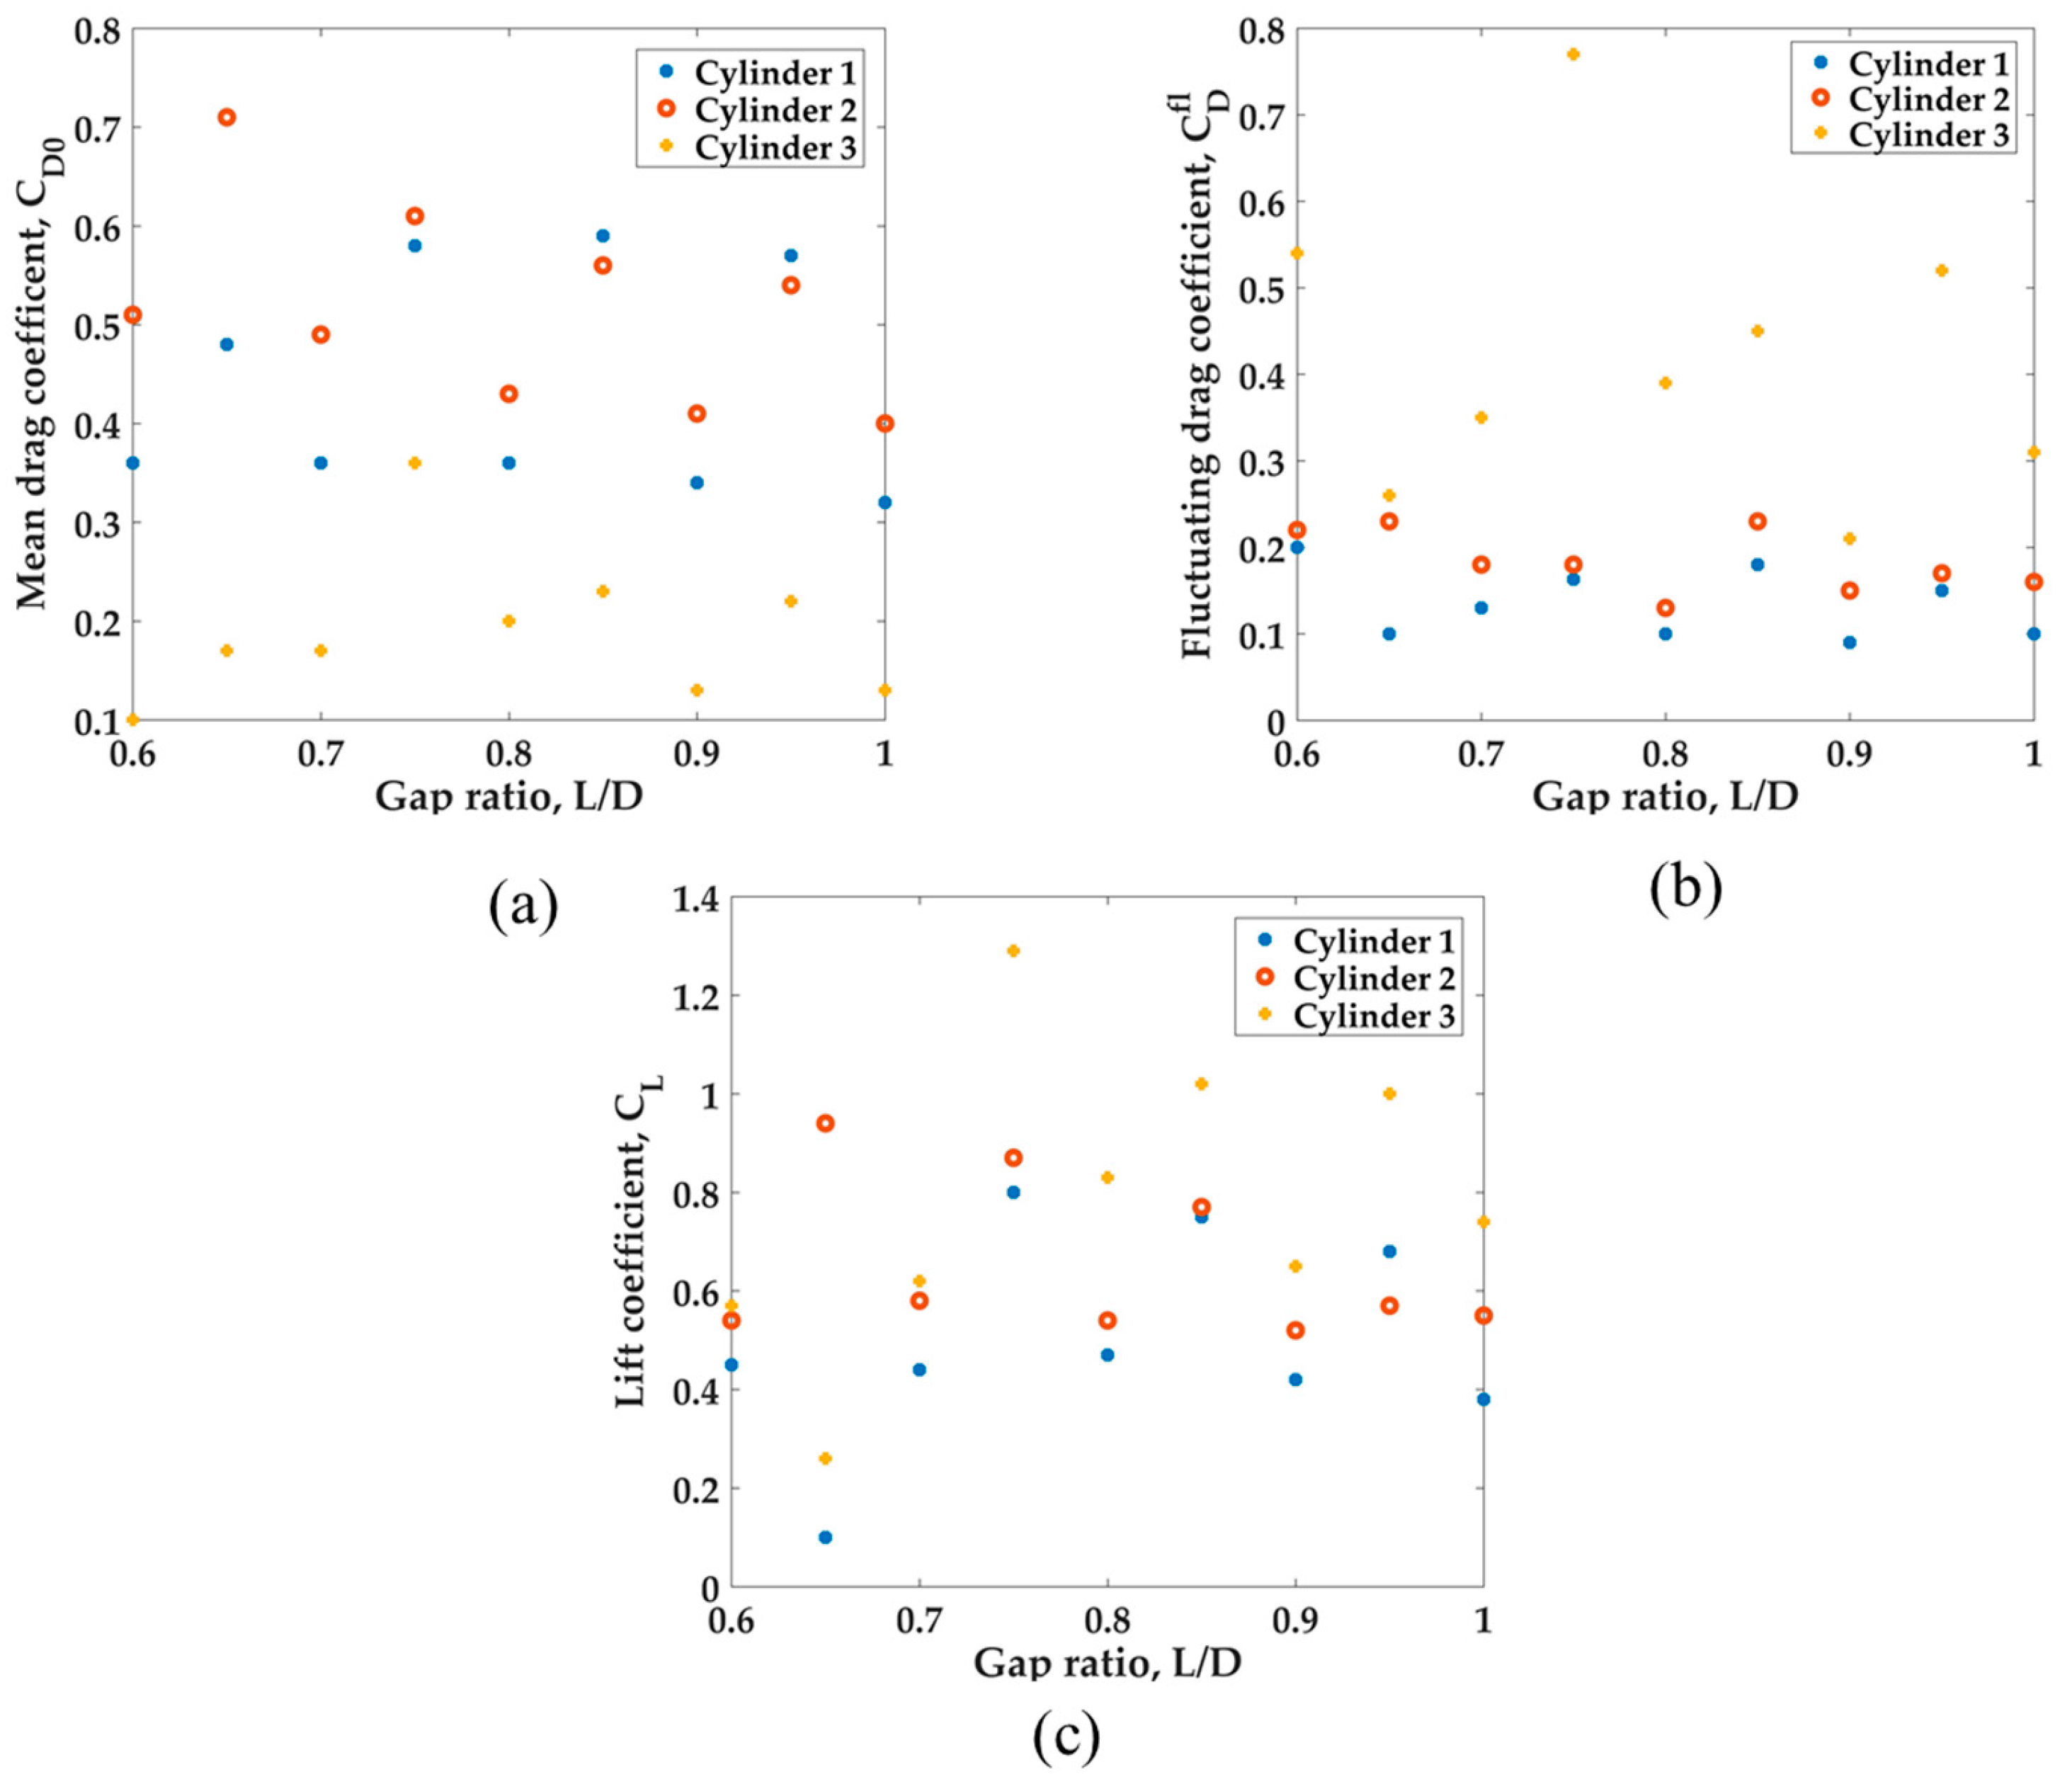
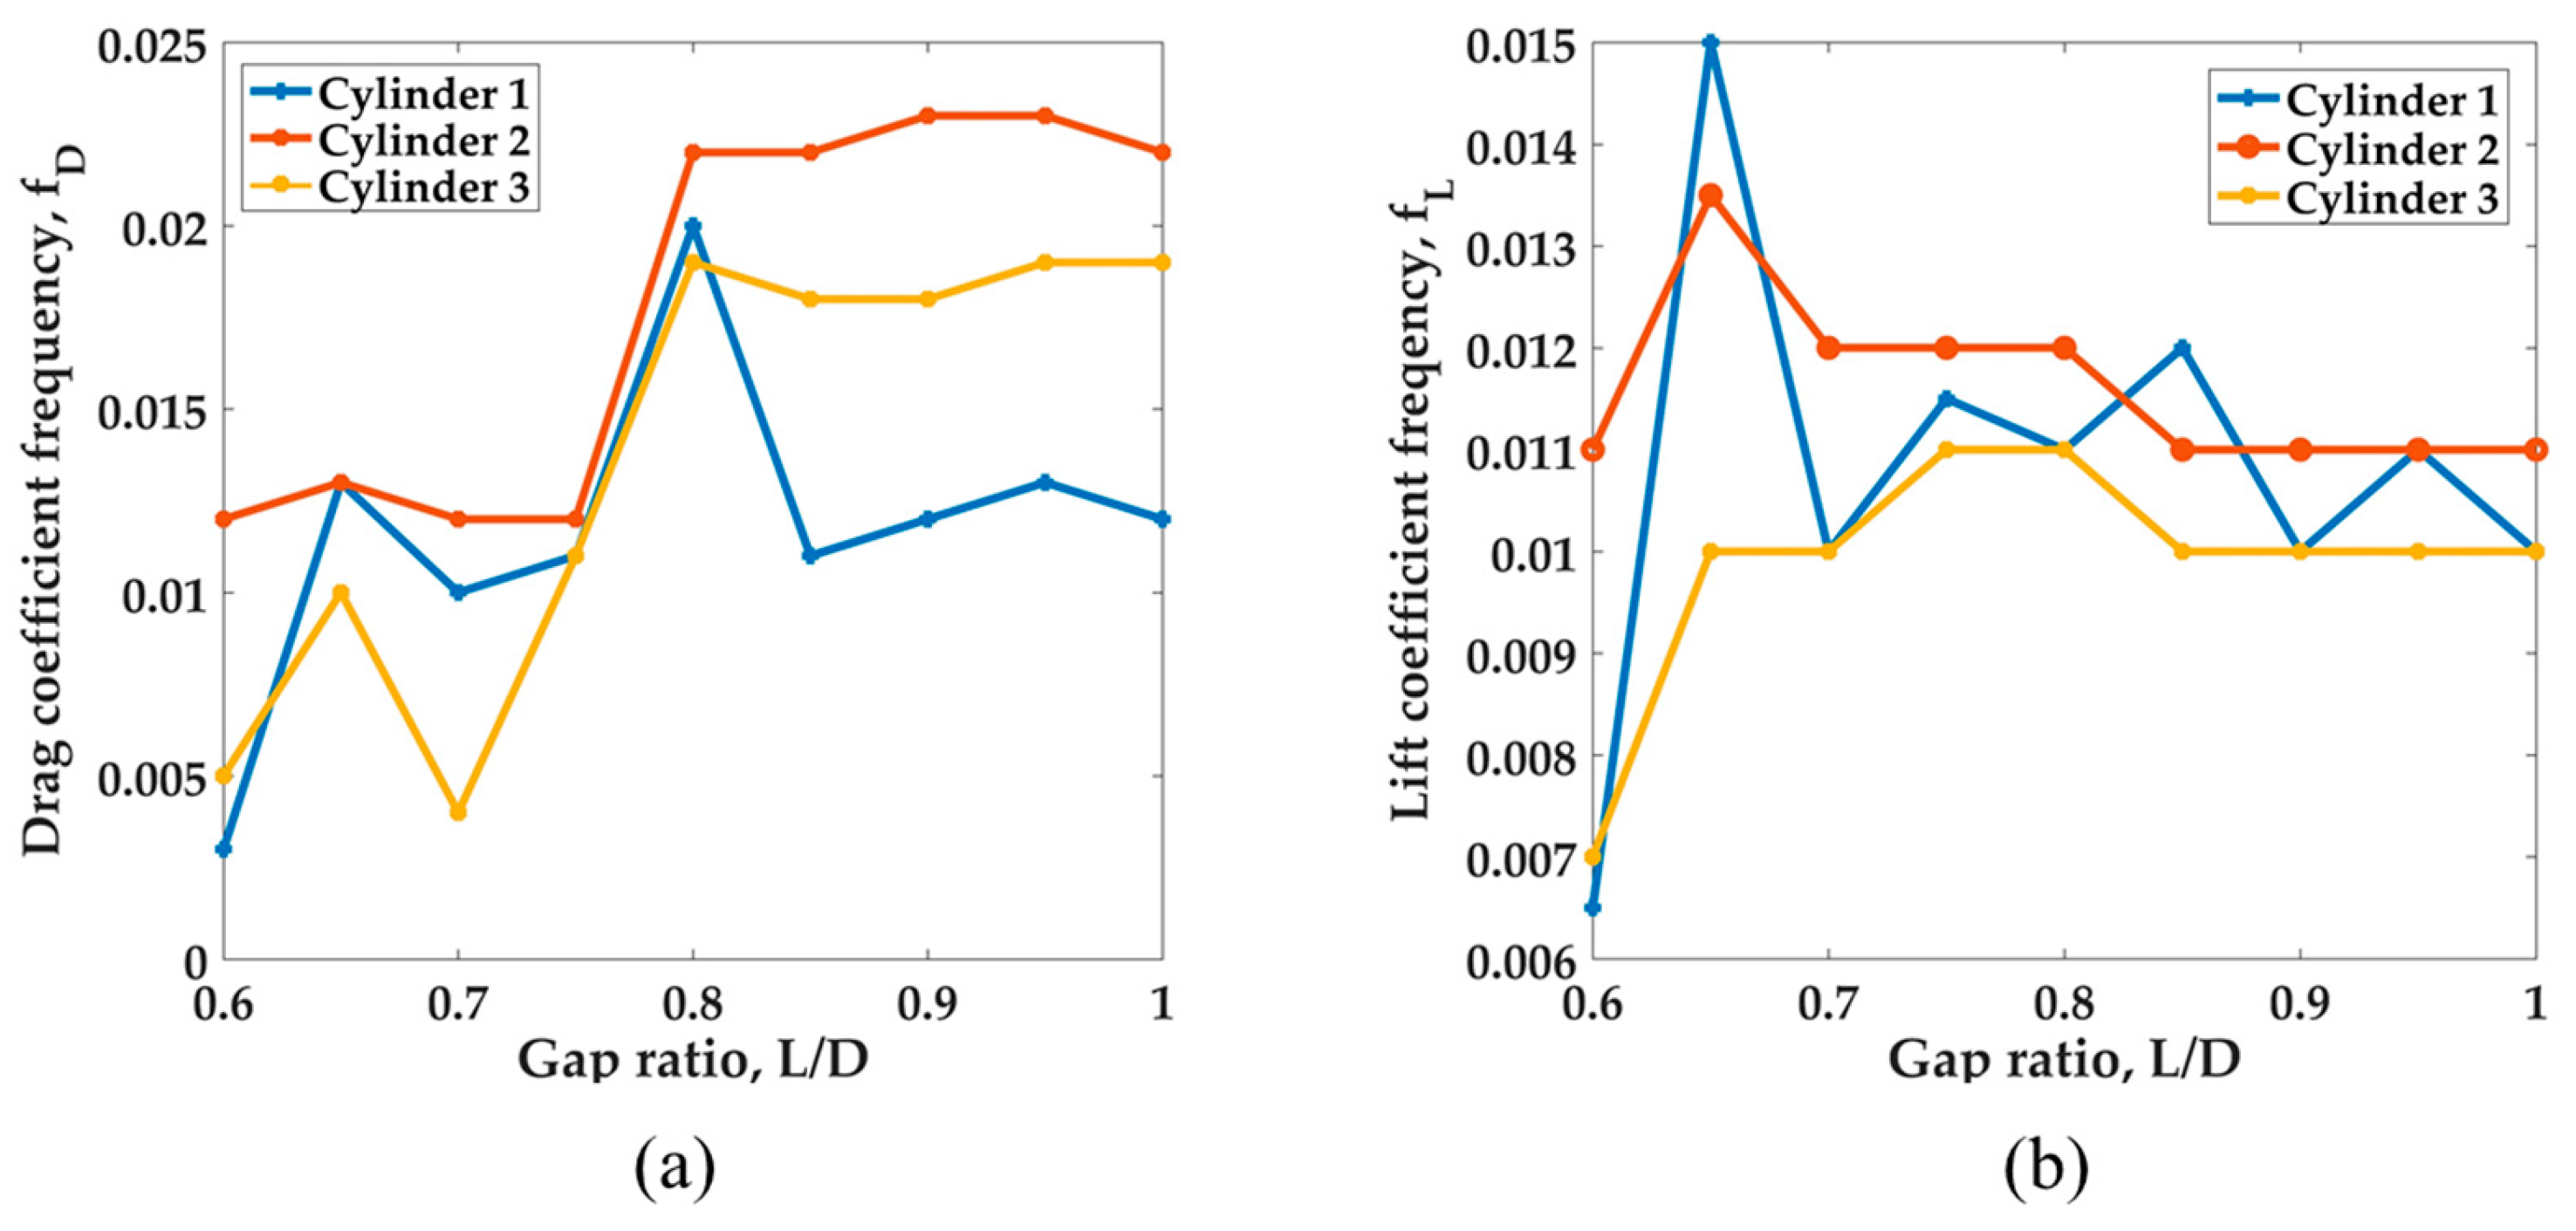
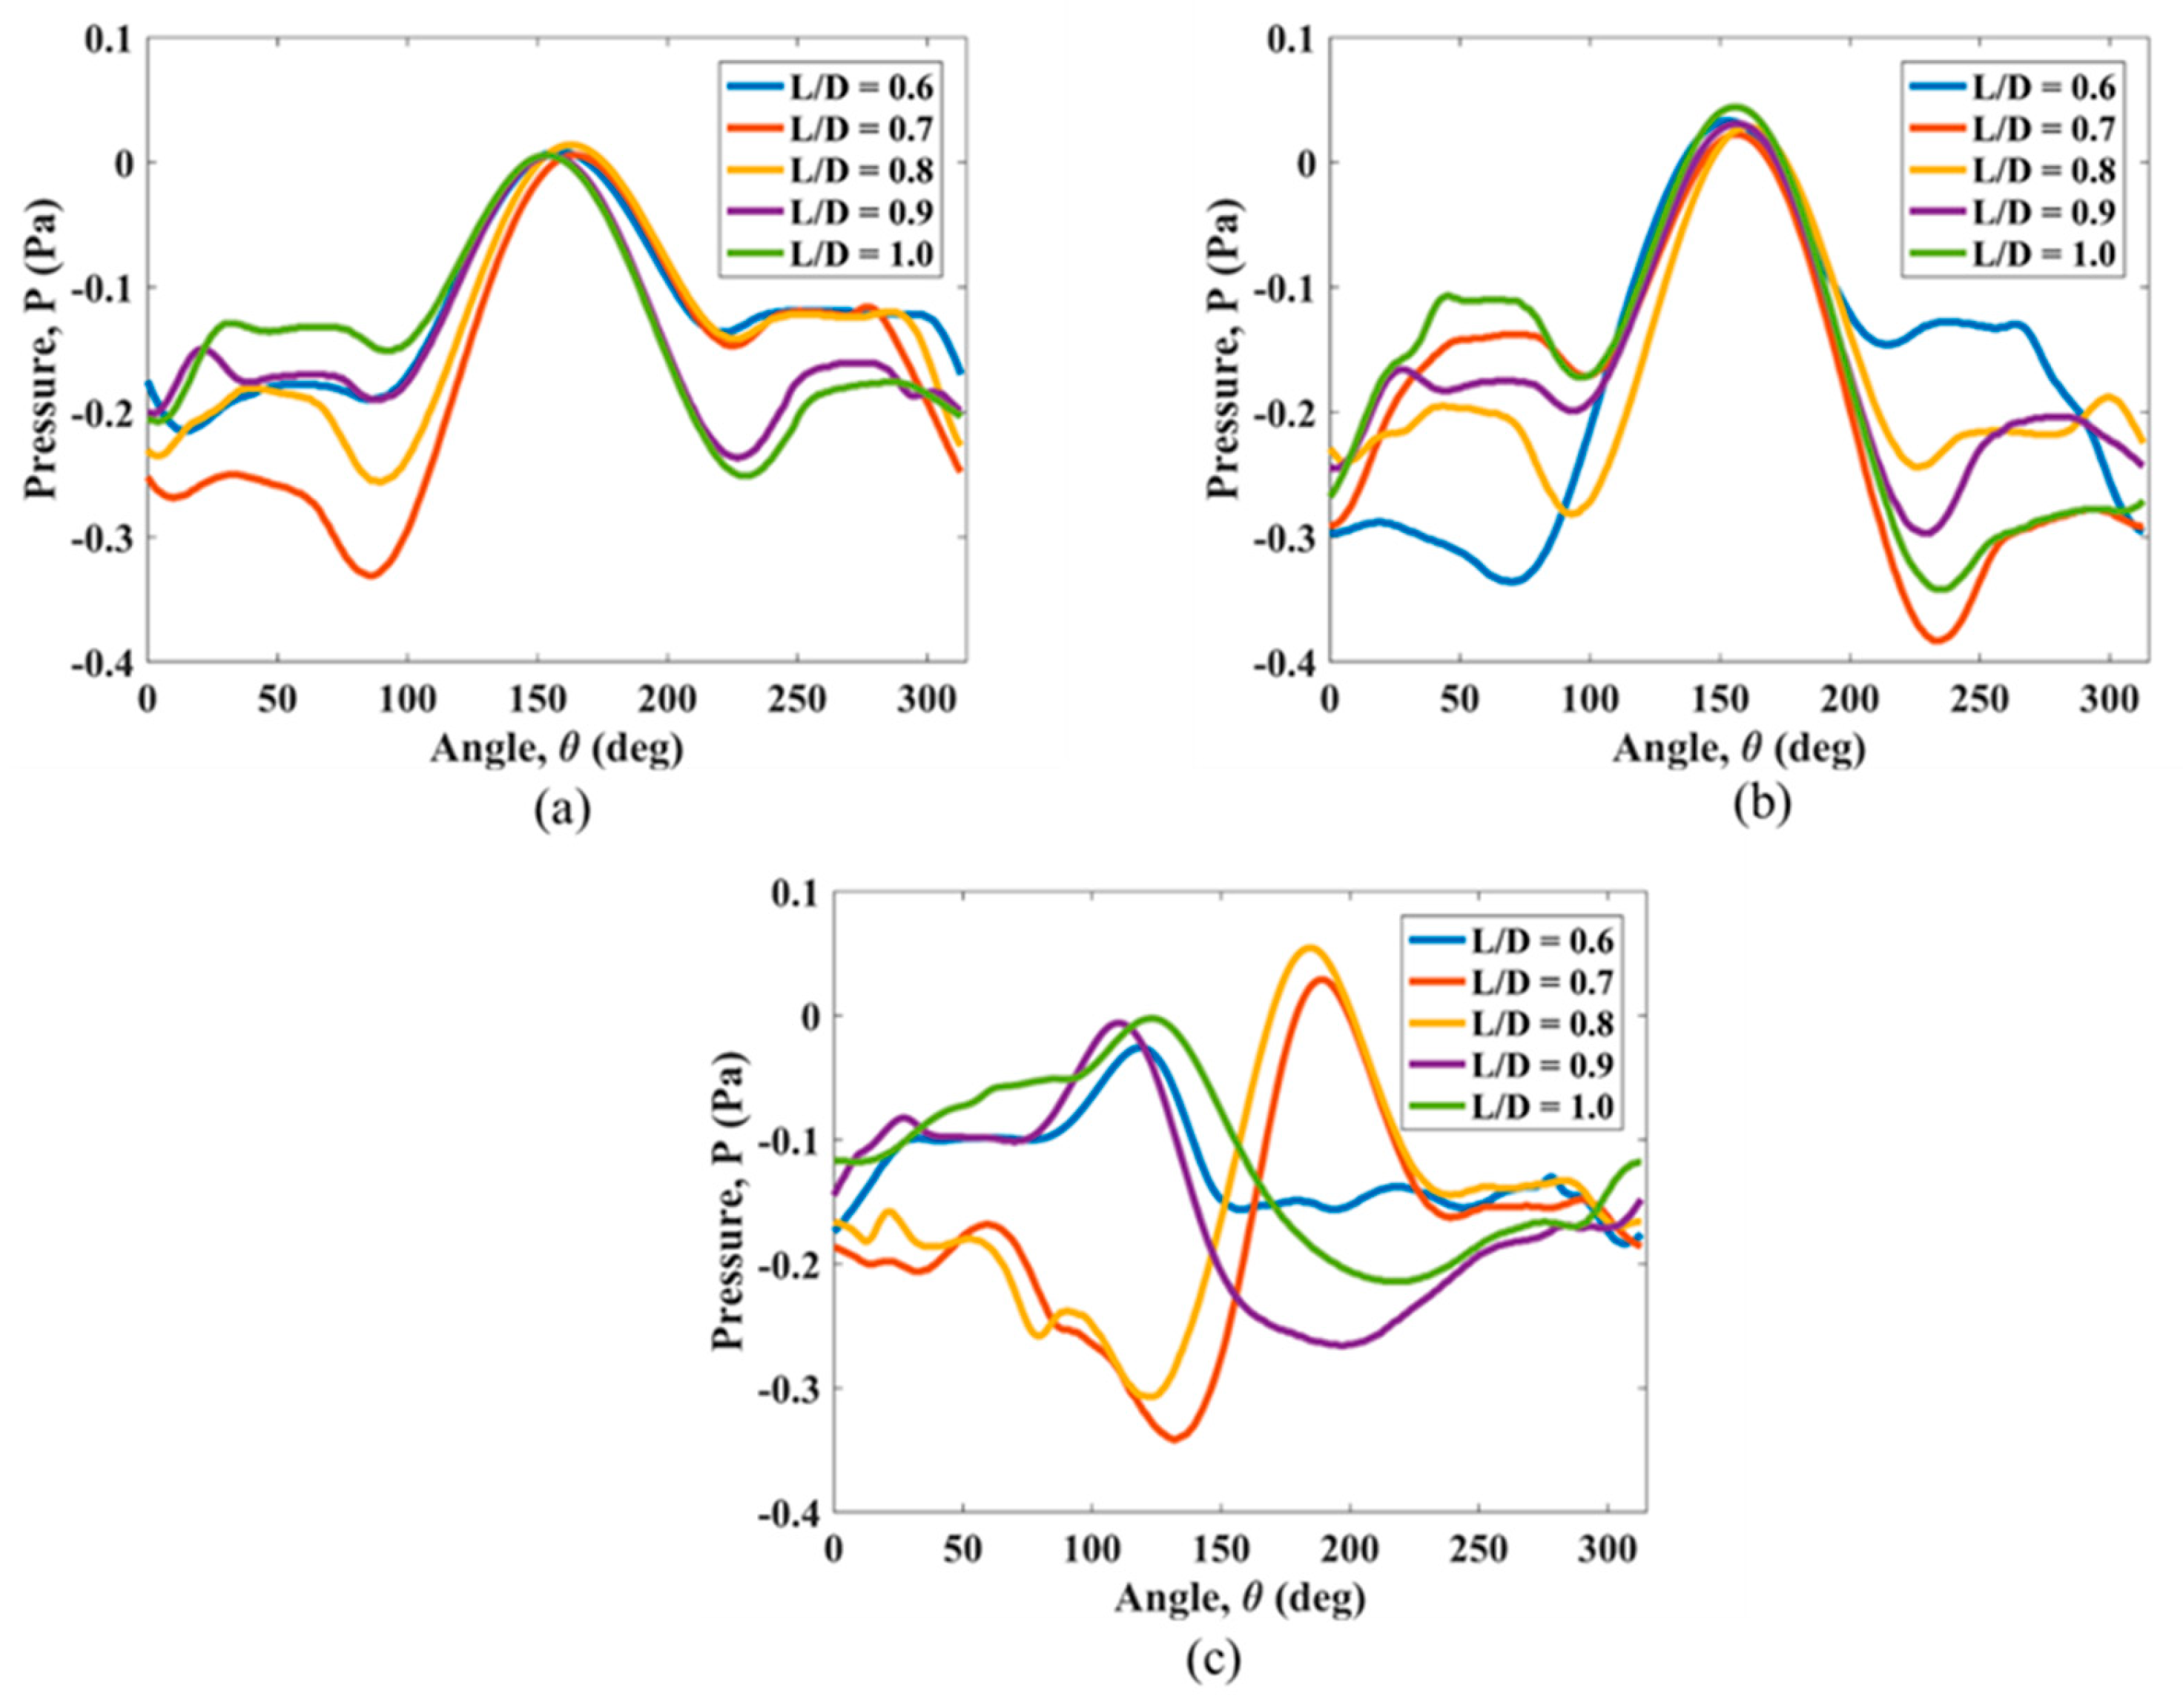
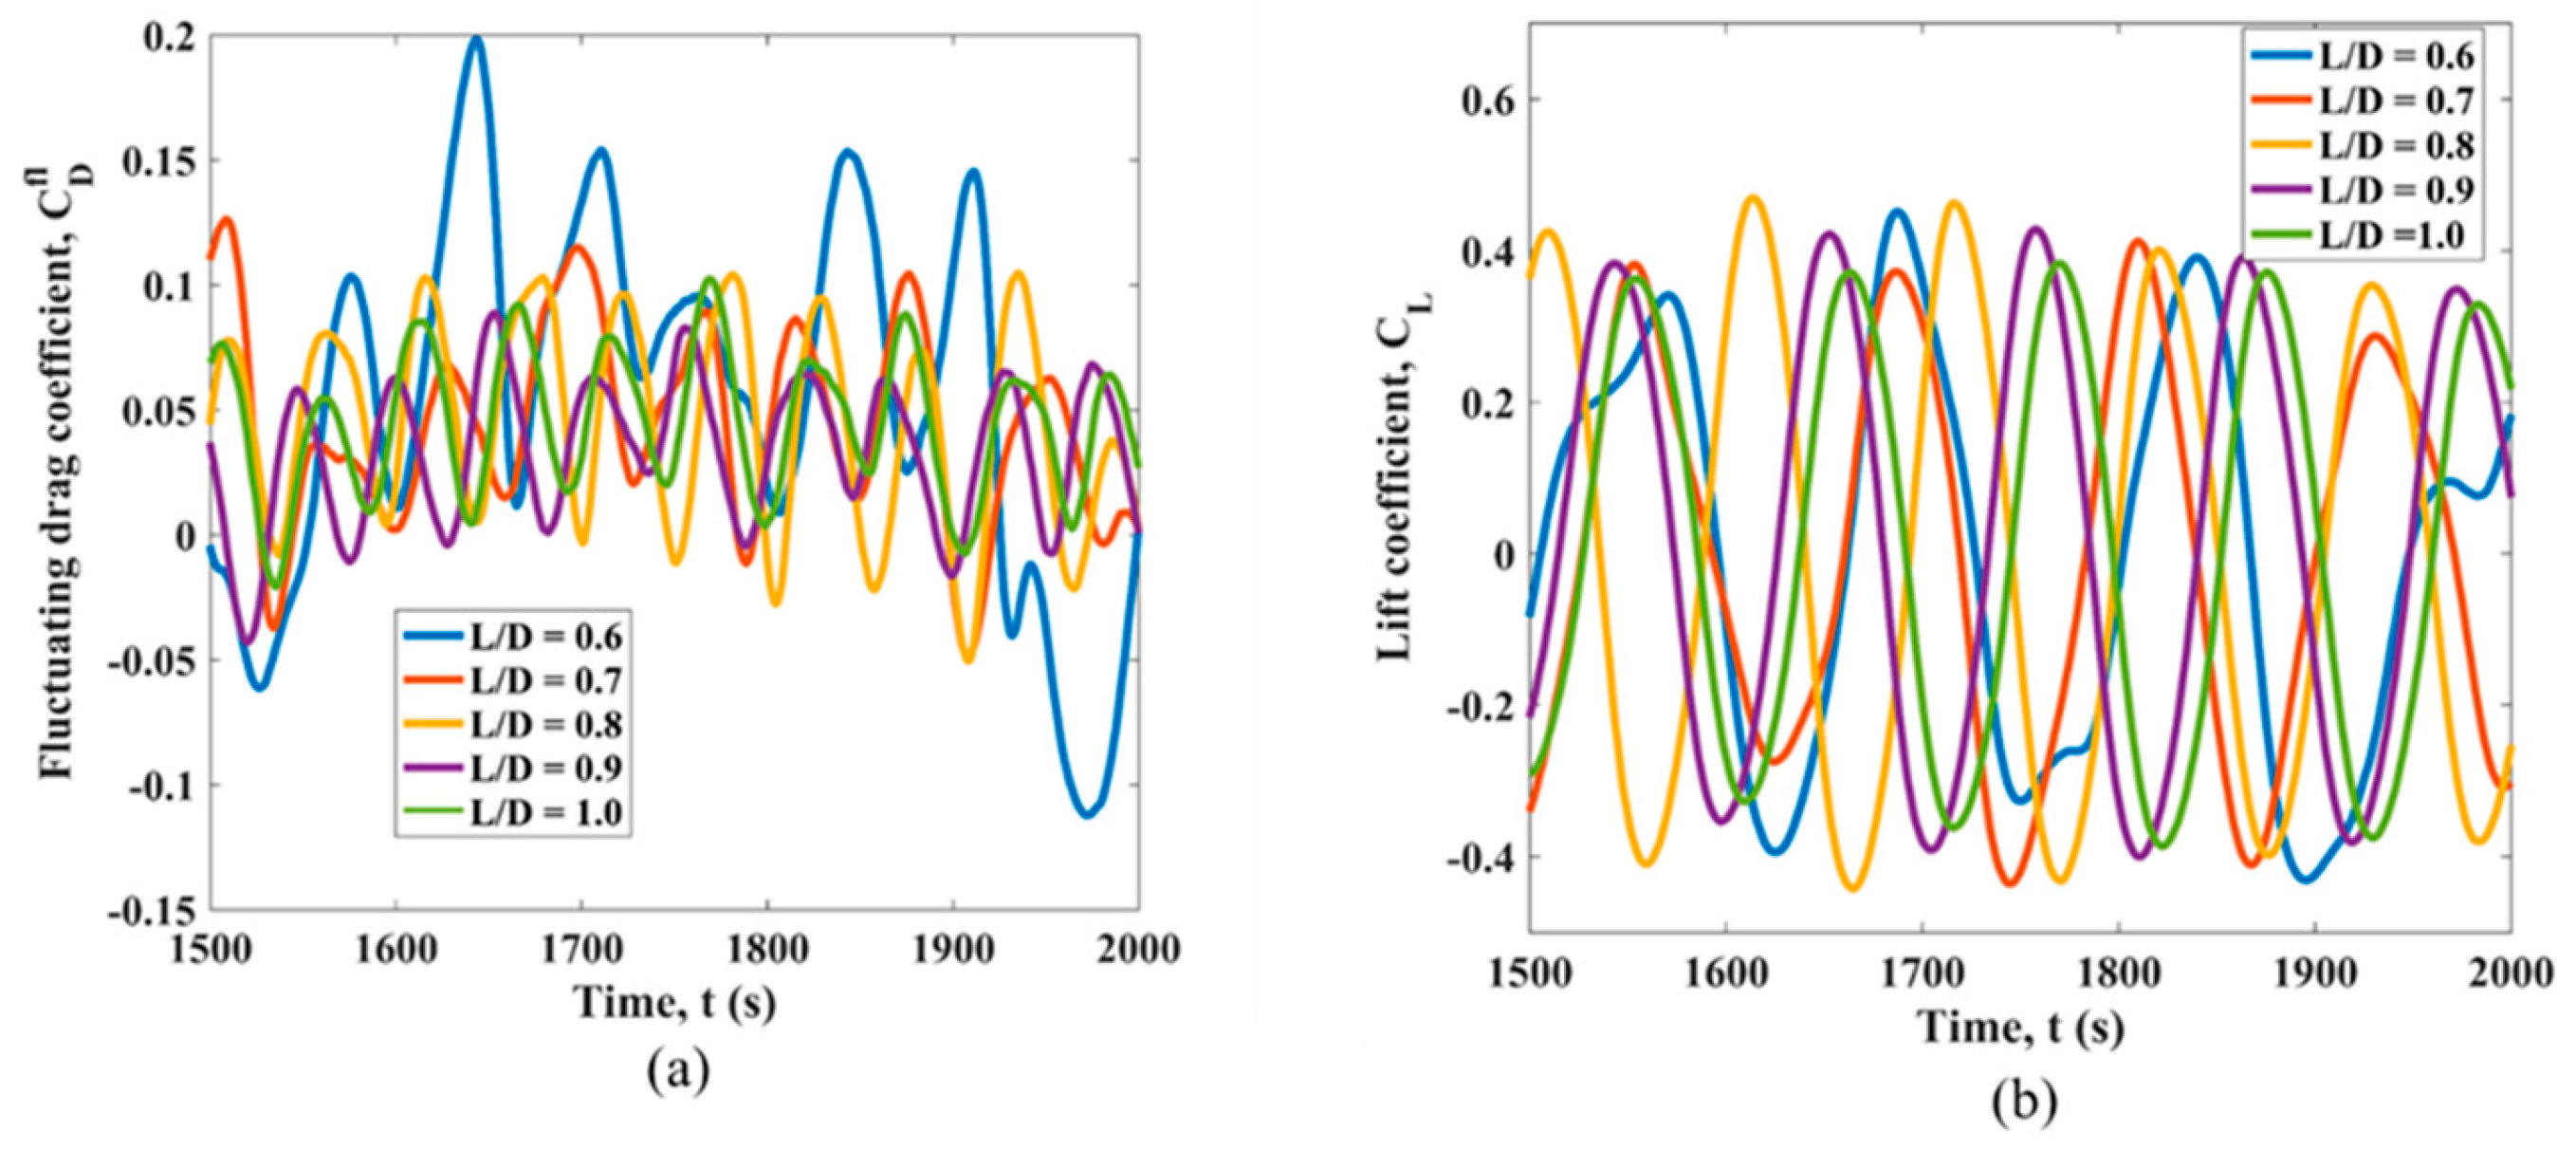
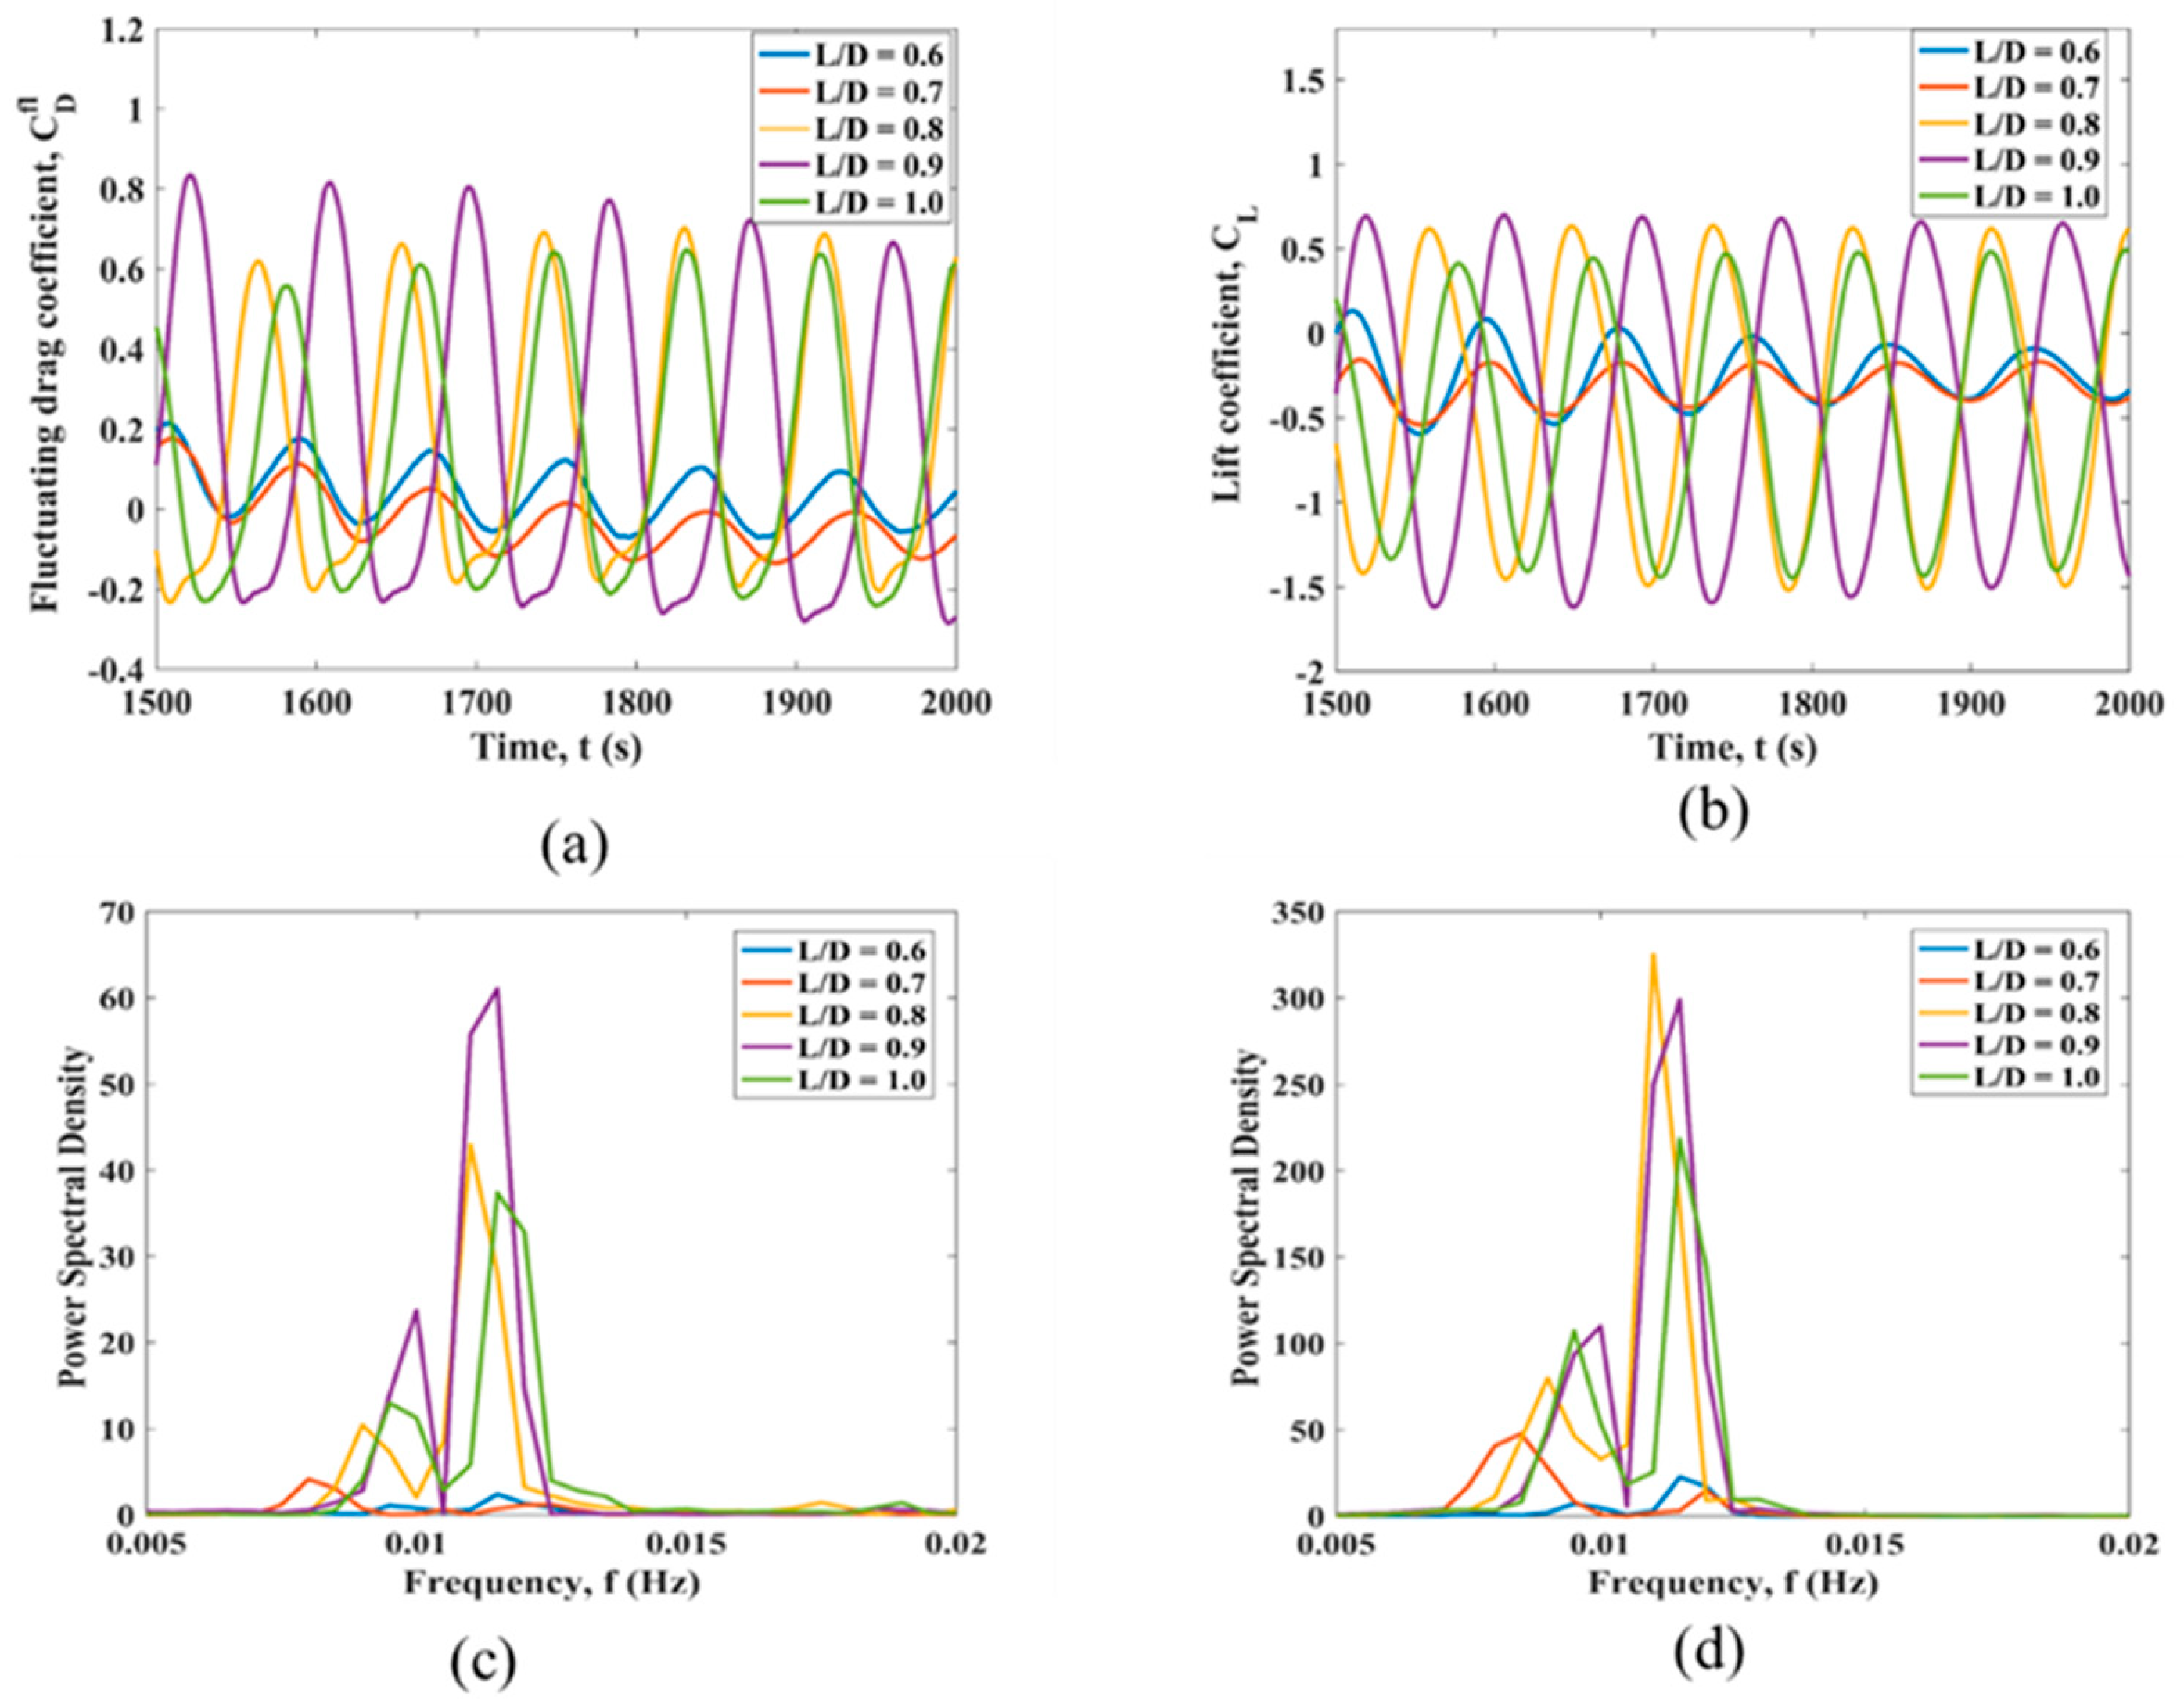
3.1. Simultaneous Variation of L1/D, L2/D and L3/D in the Linearly Sheared Flow
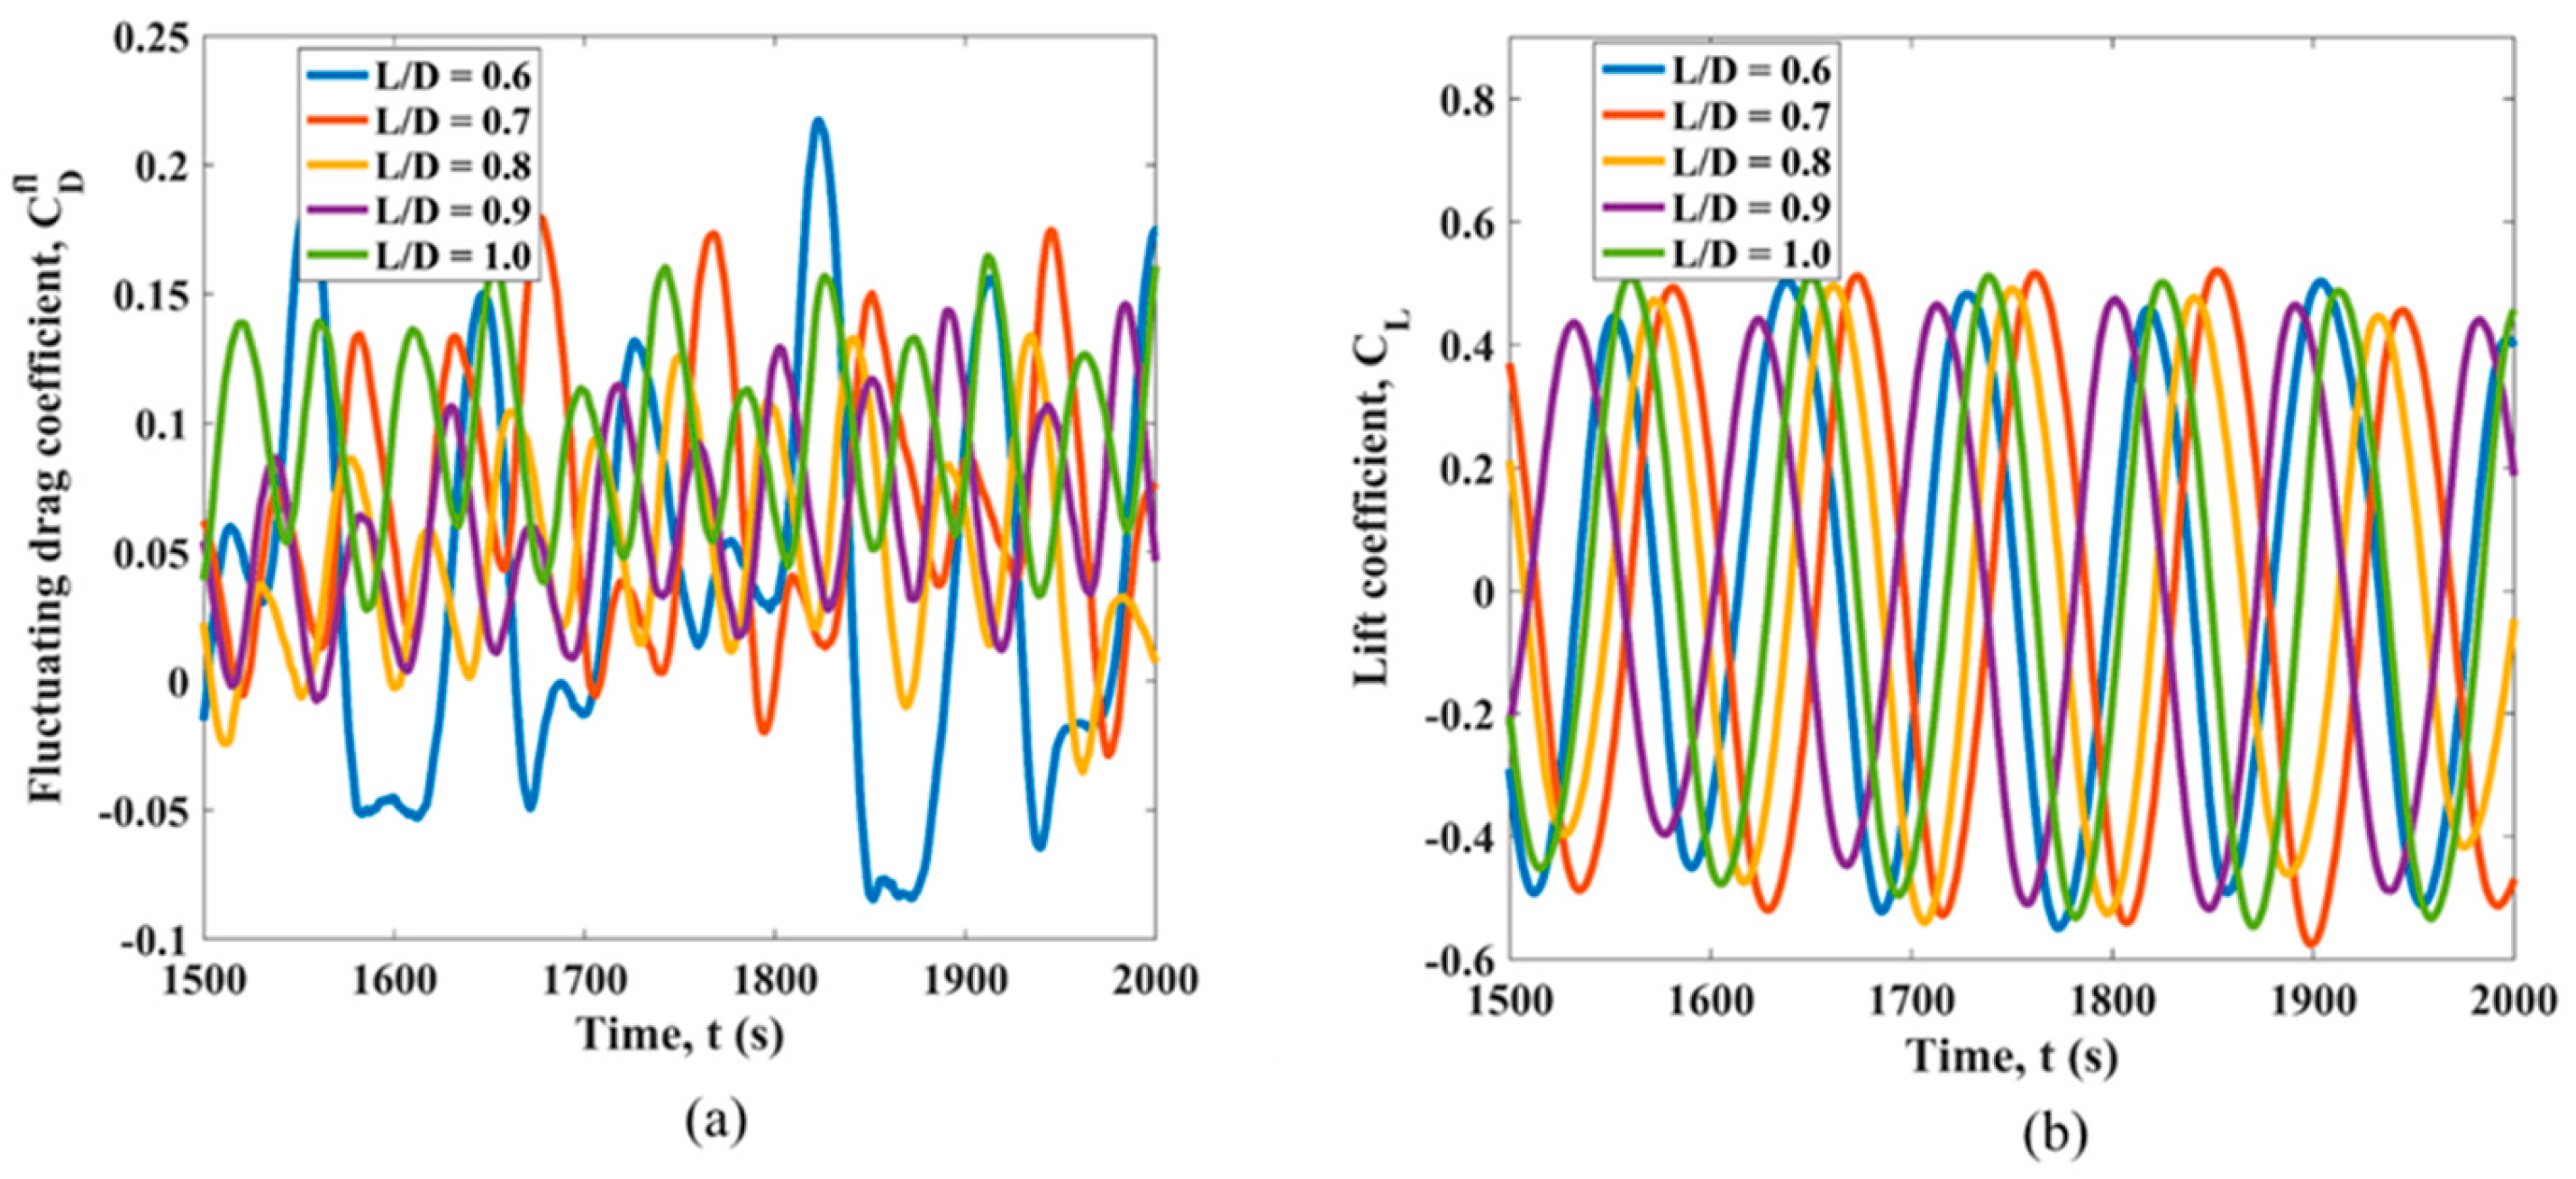
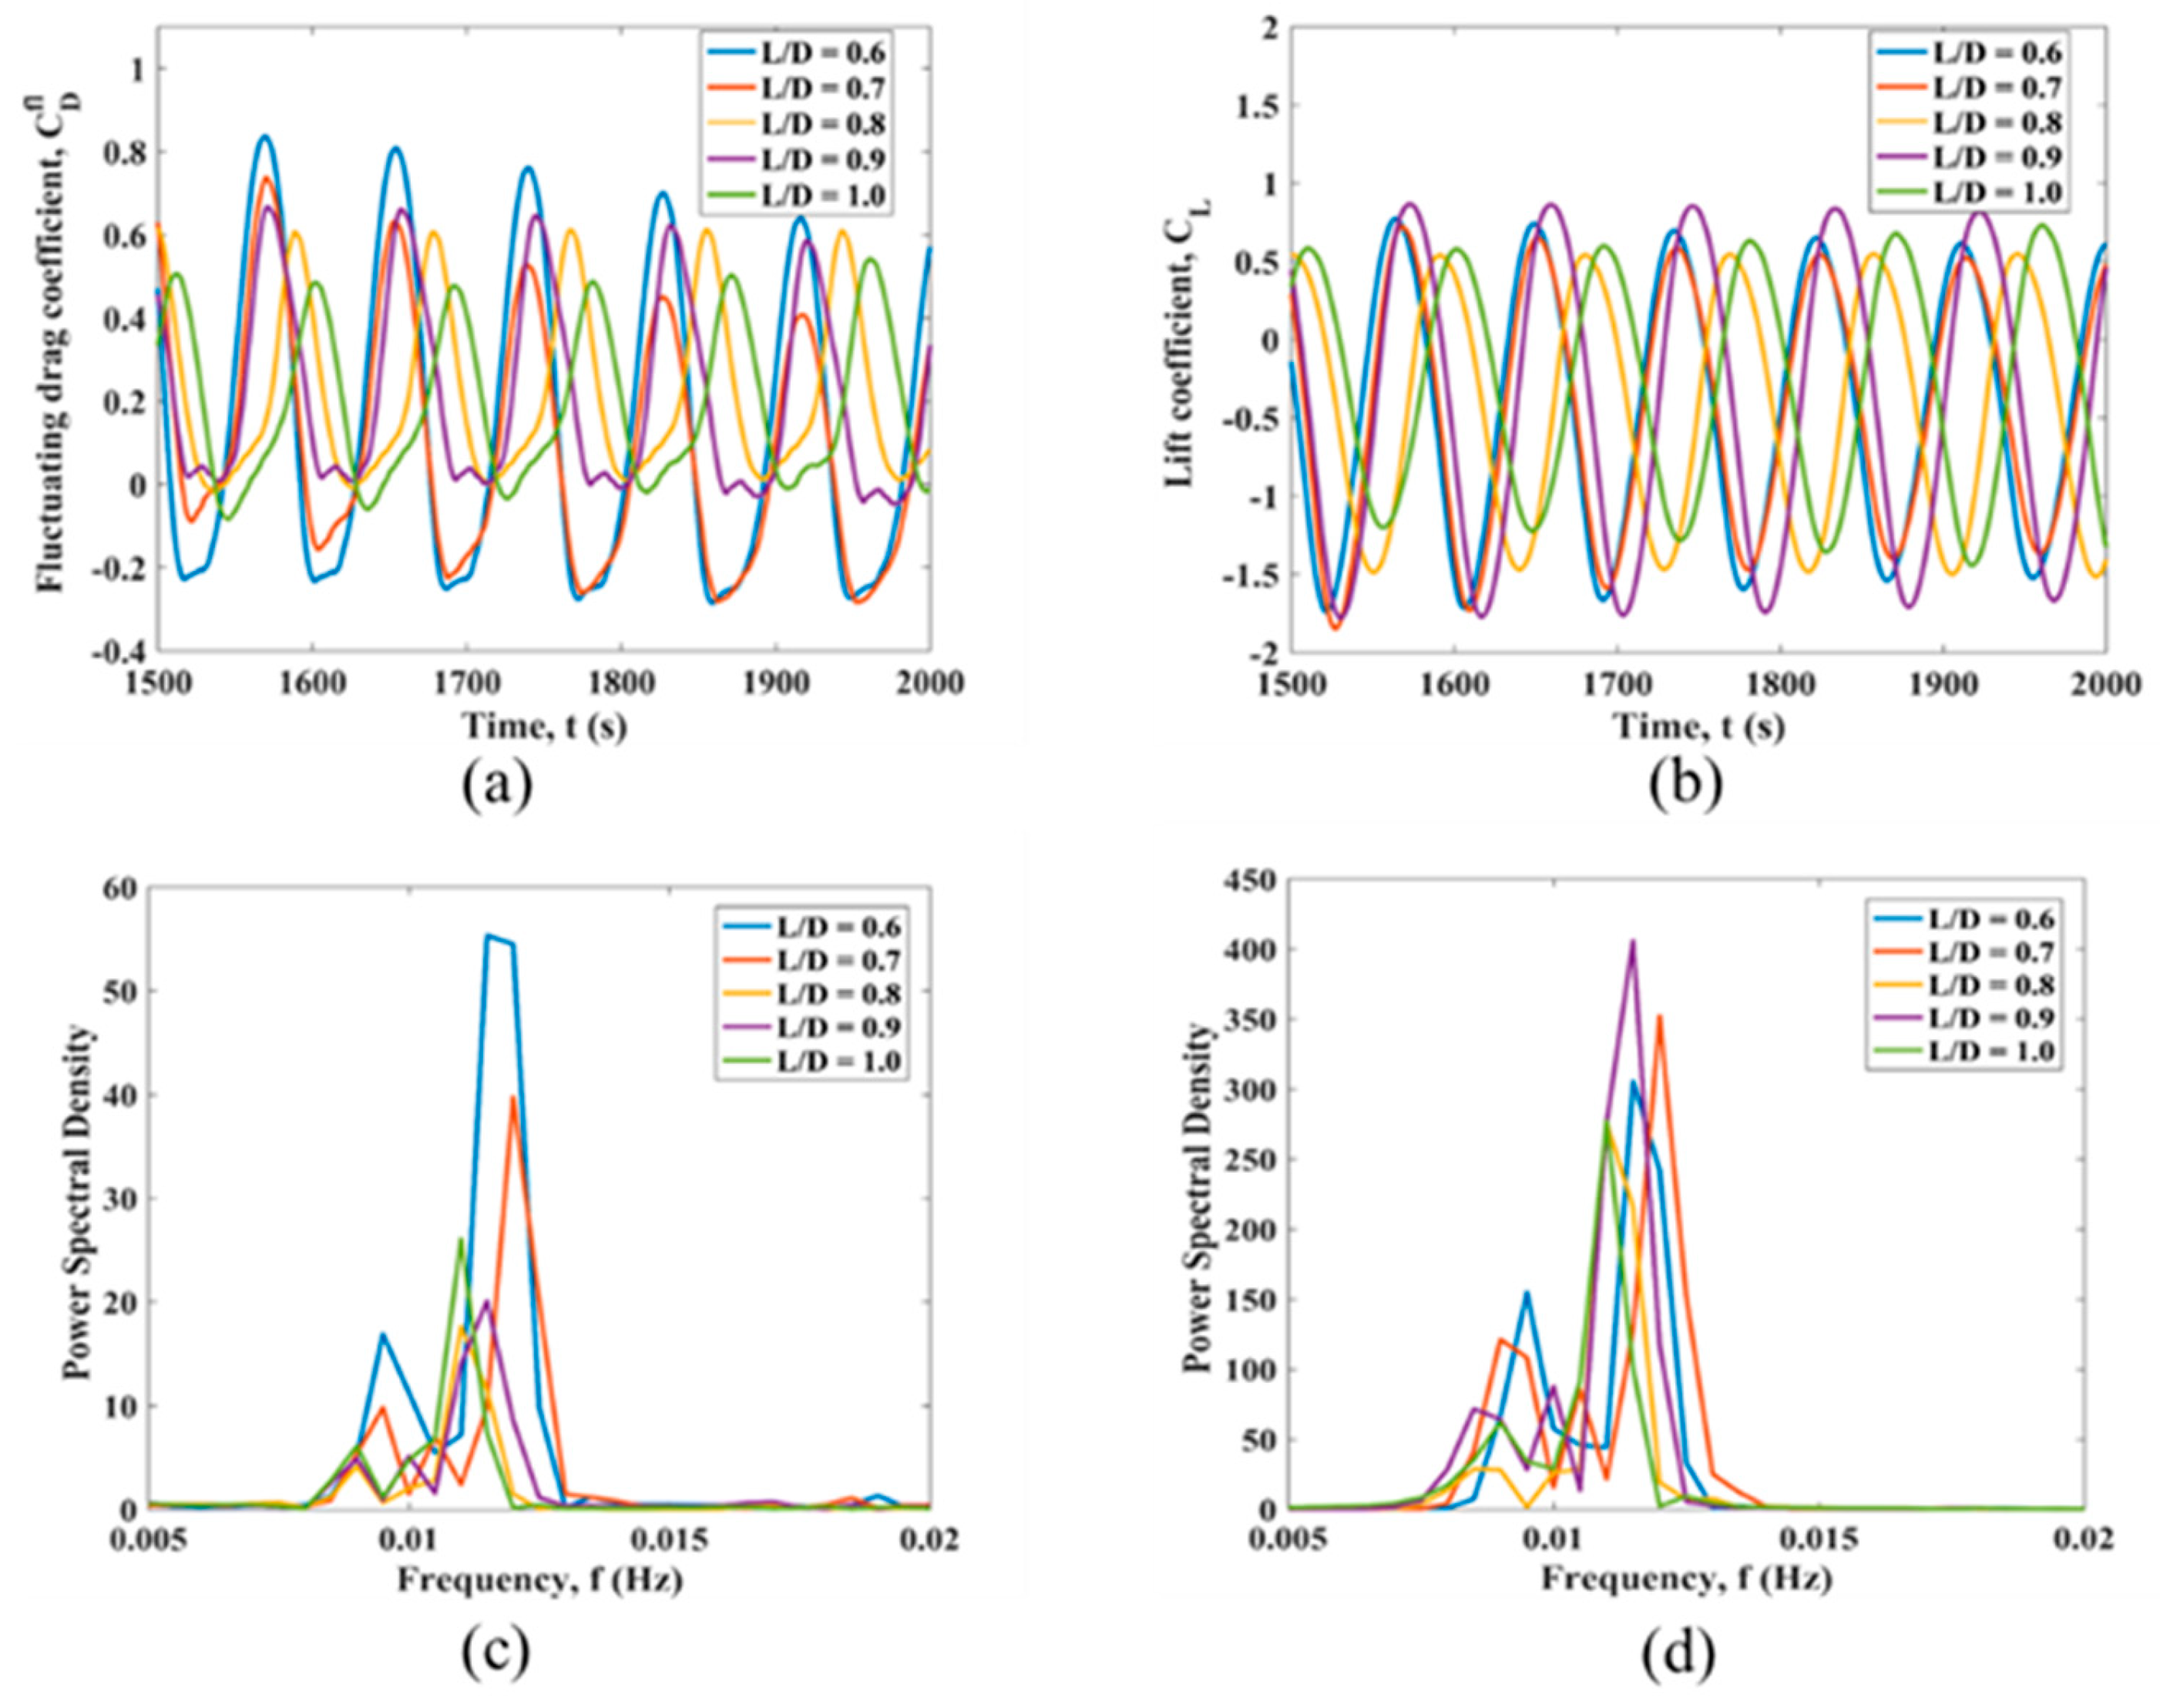
3.2. Simultaneous Variation of L2/D and L3/D in the Linearly Sheared Flow
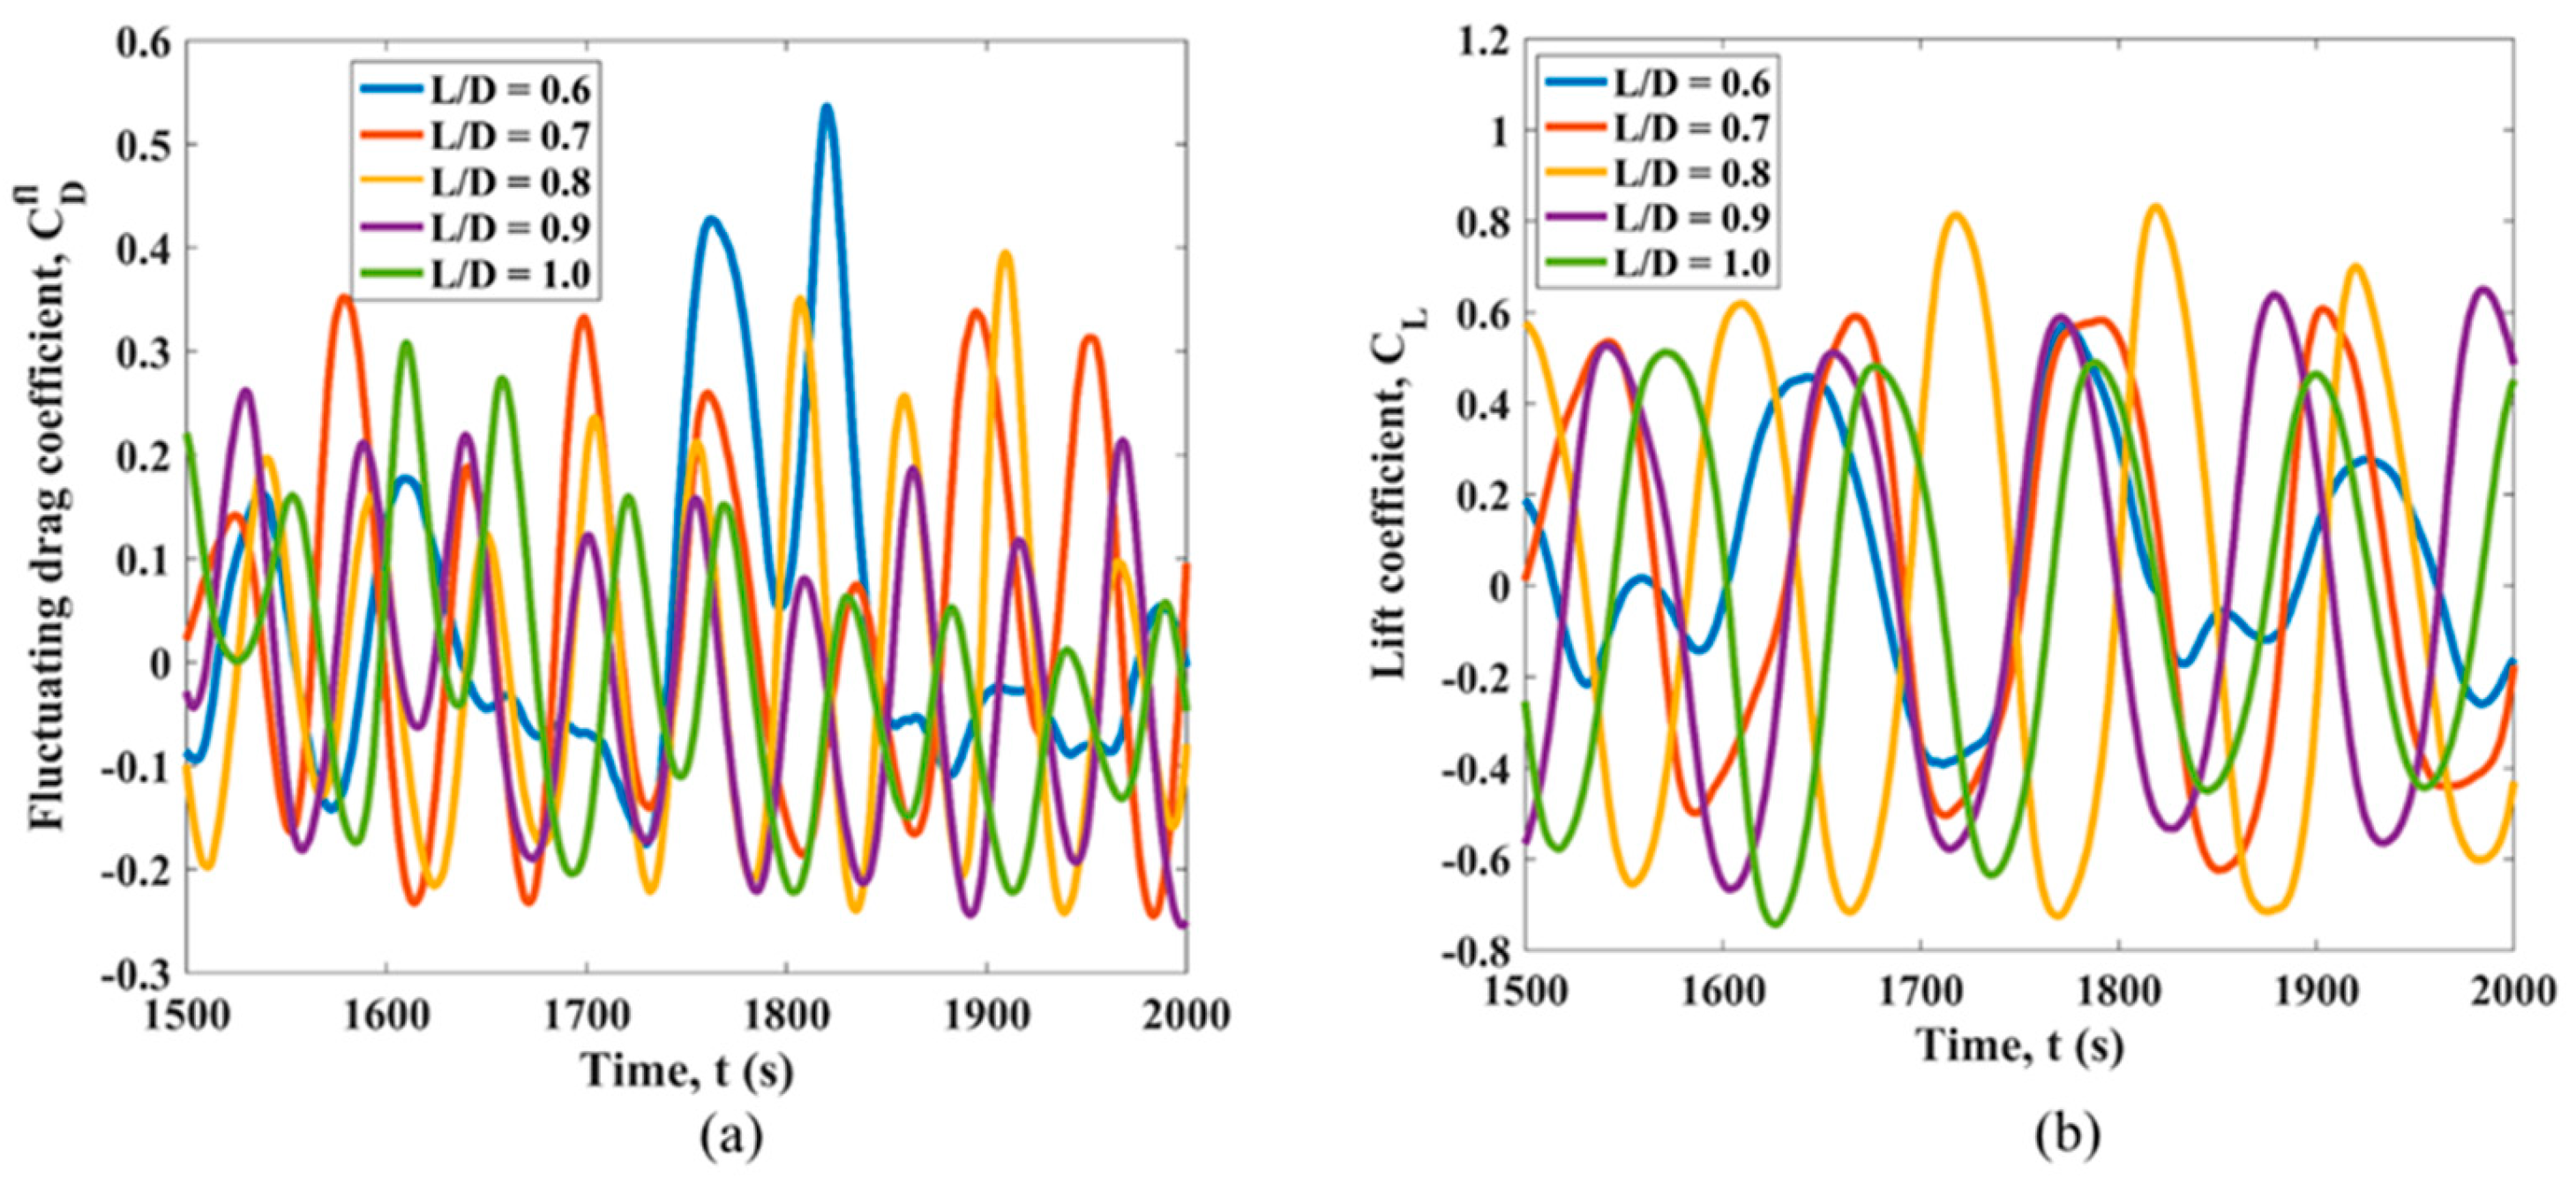
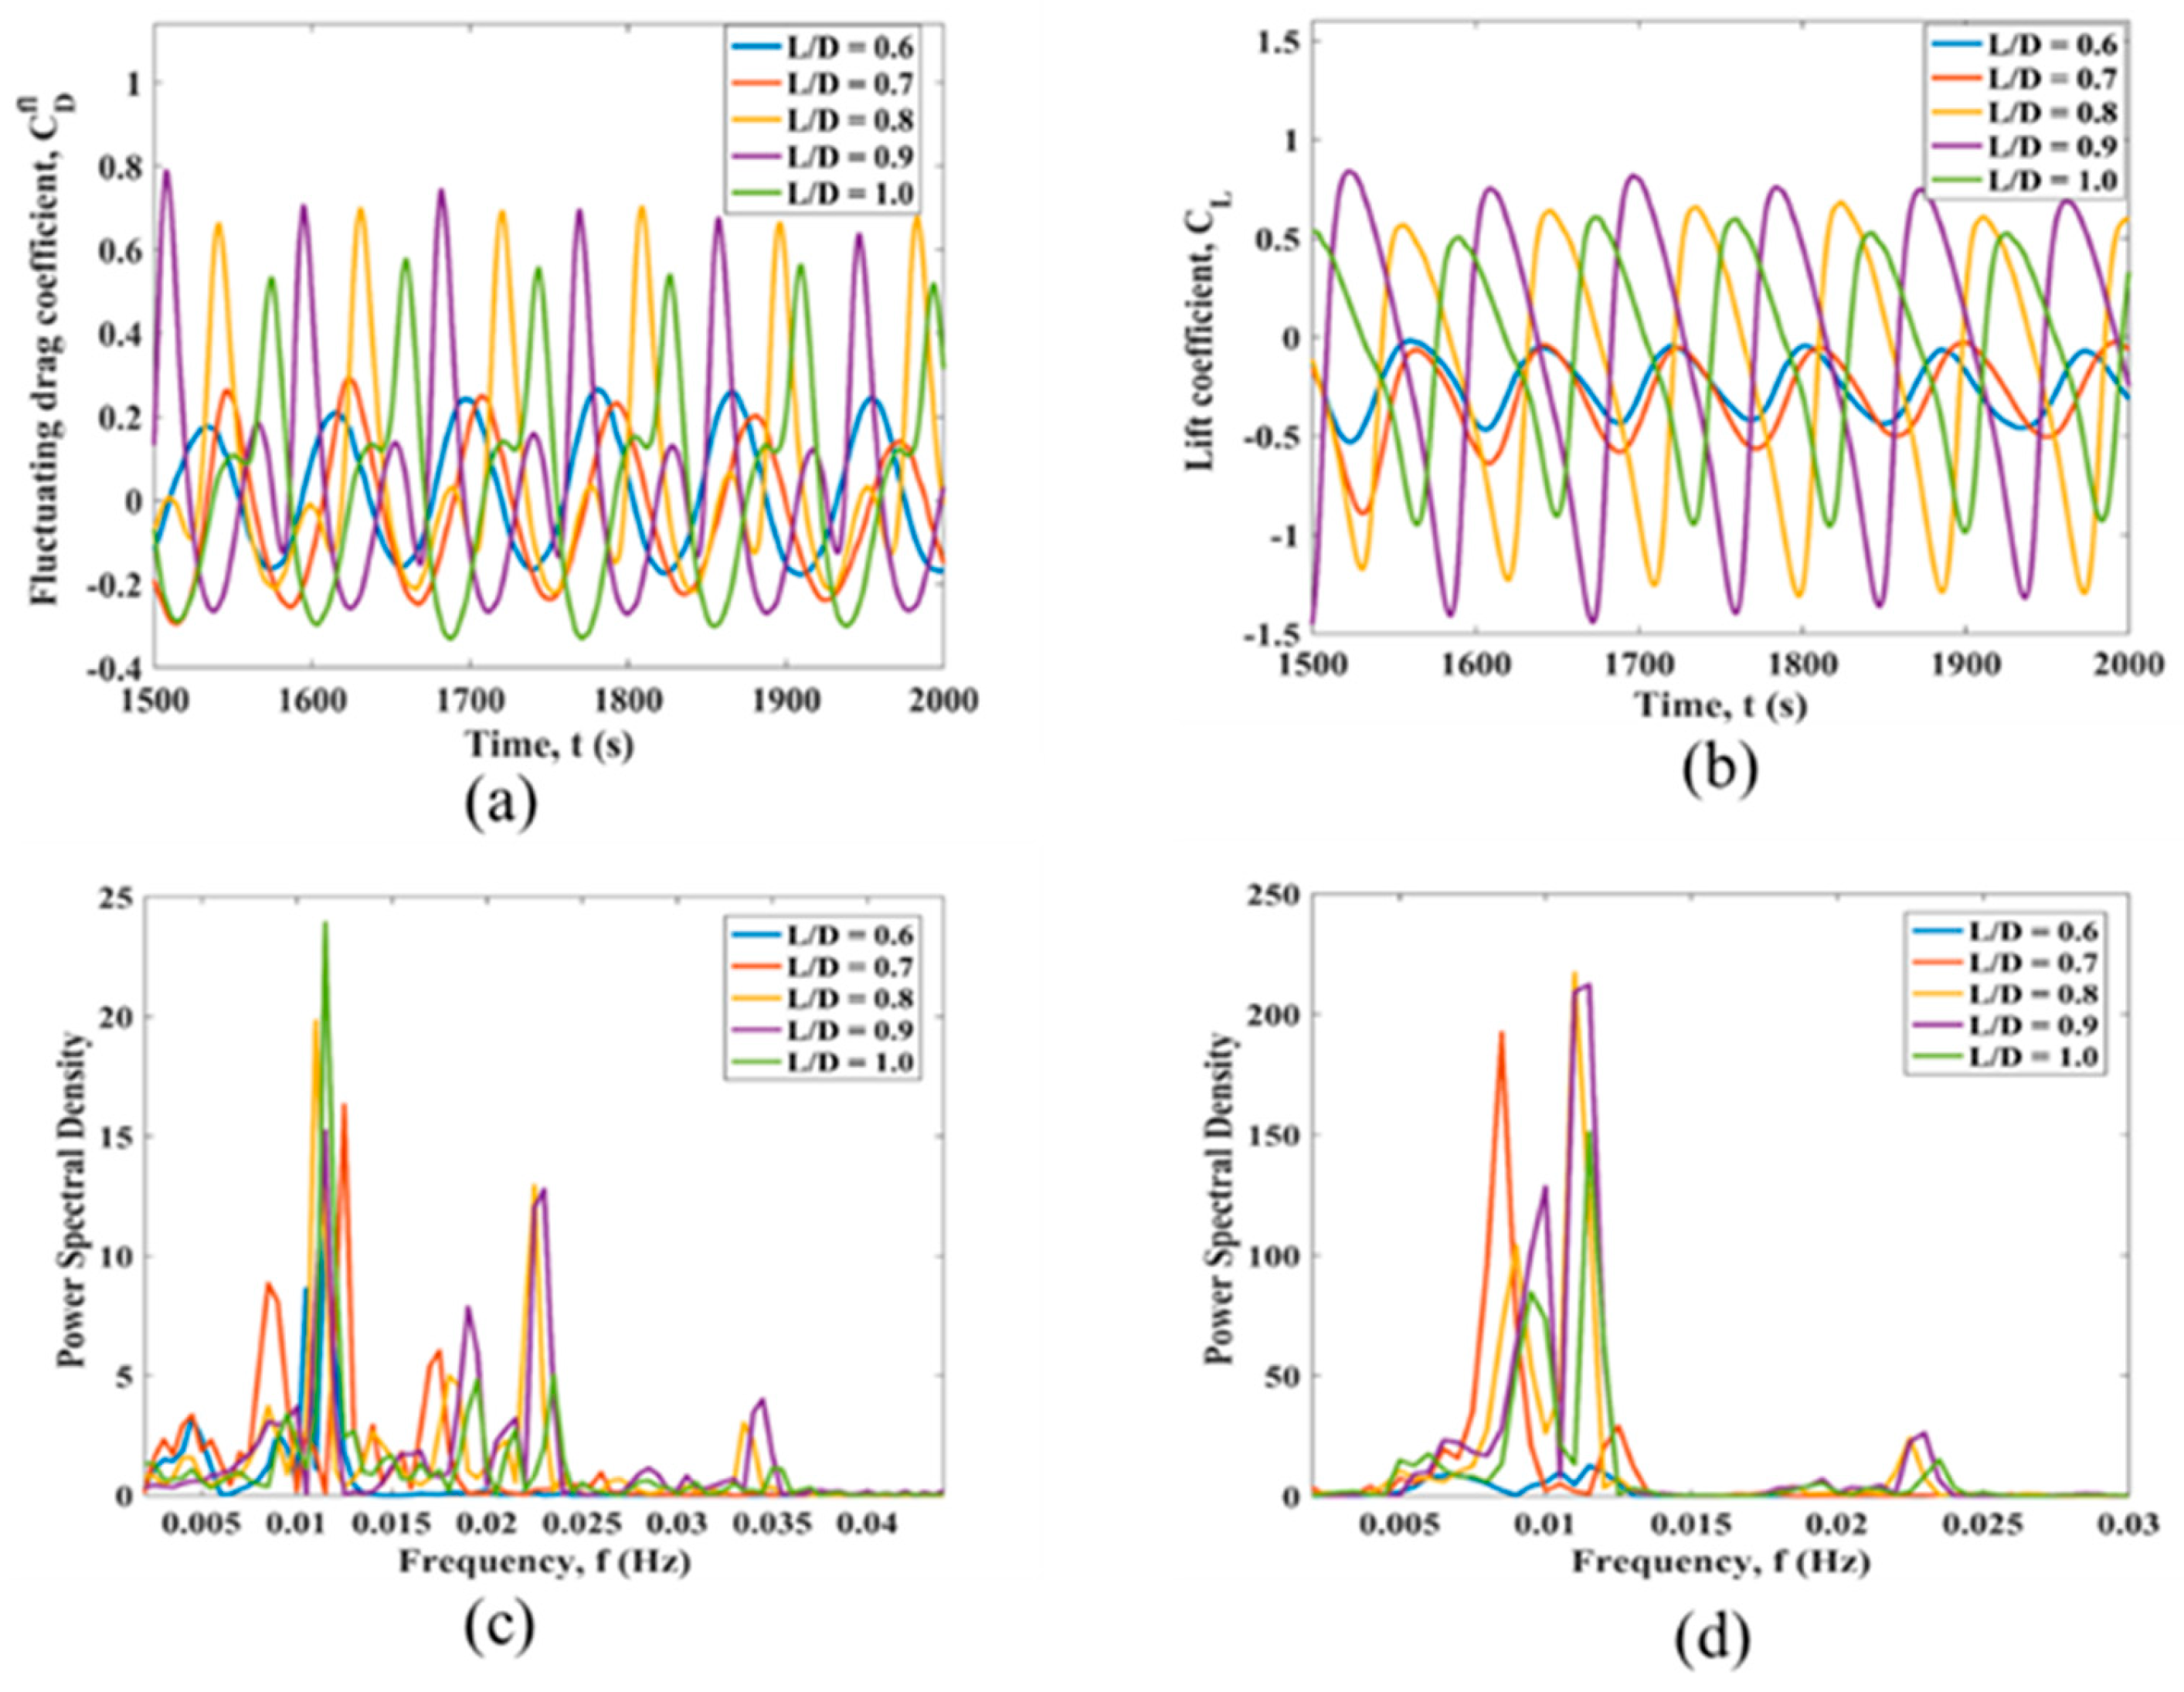
3.3. Simultaneous Variation of L2/D and L3/D in the Parabolic Sheared Flow
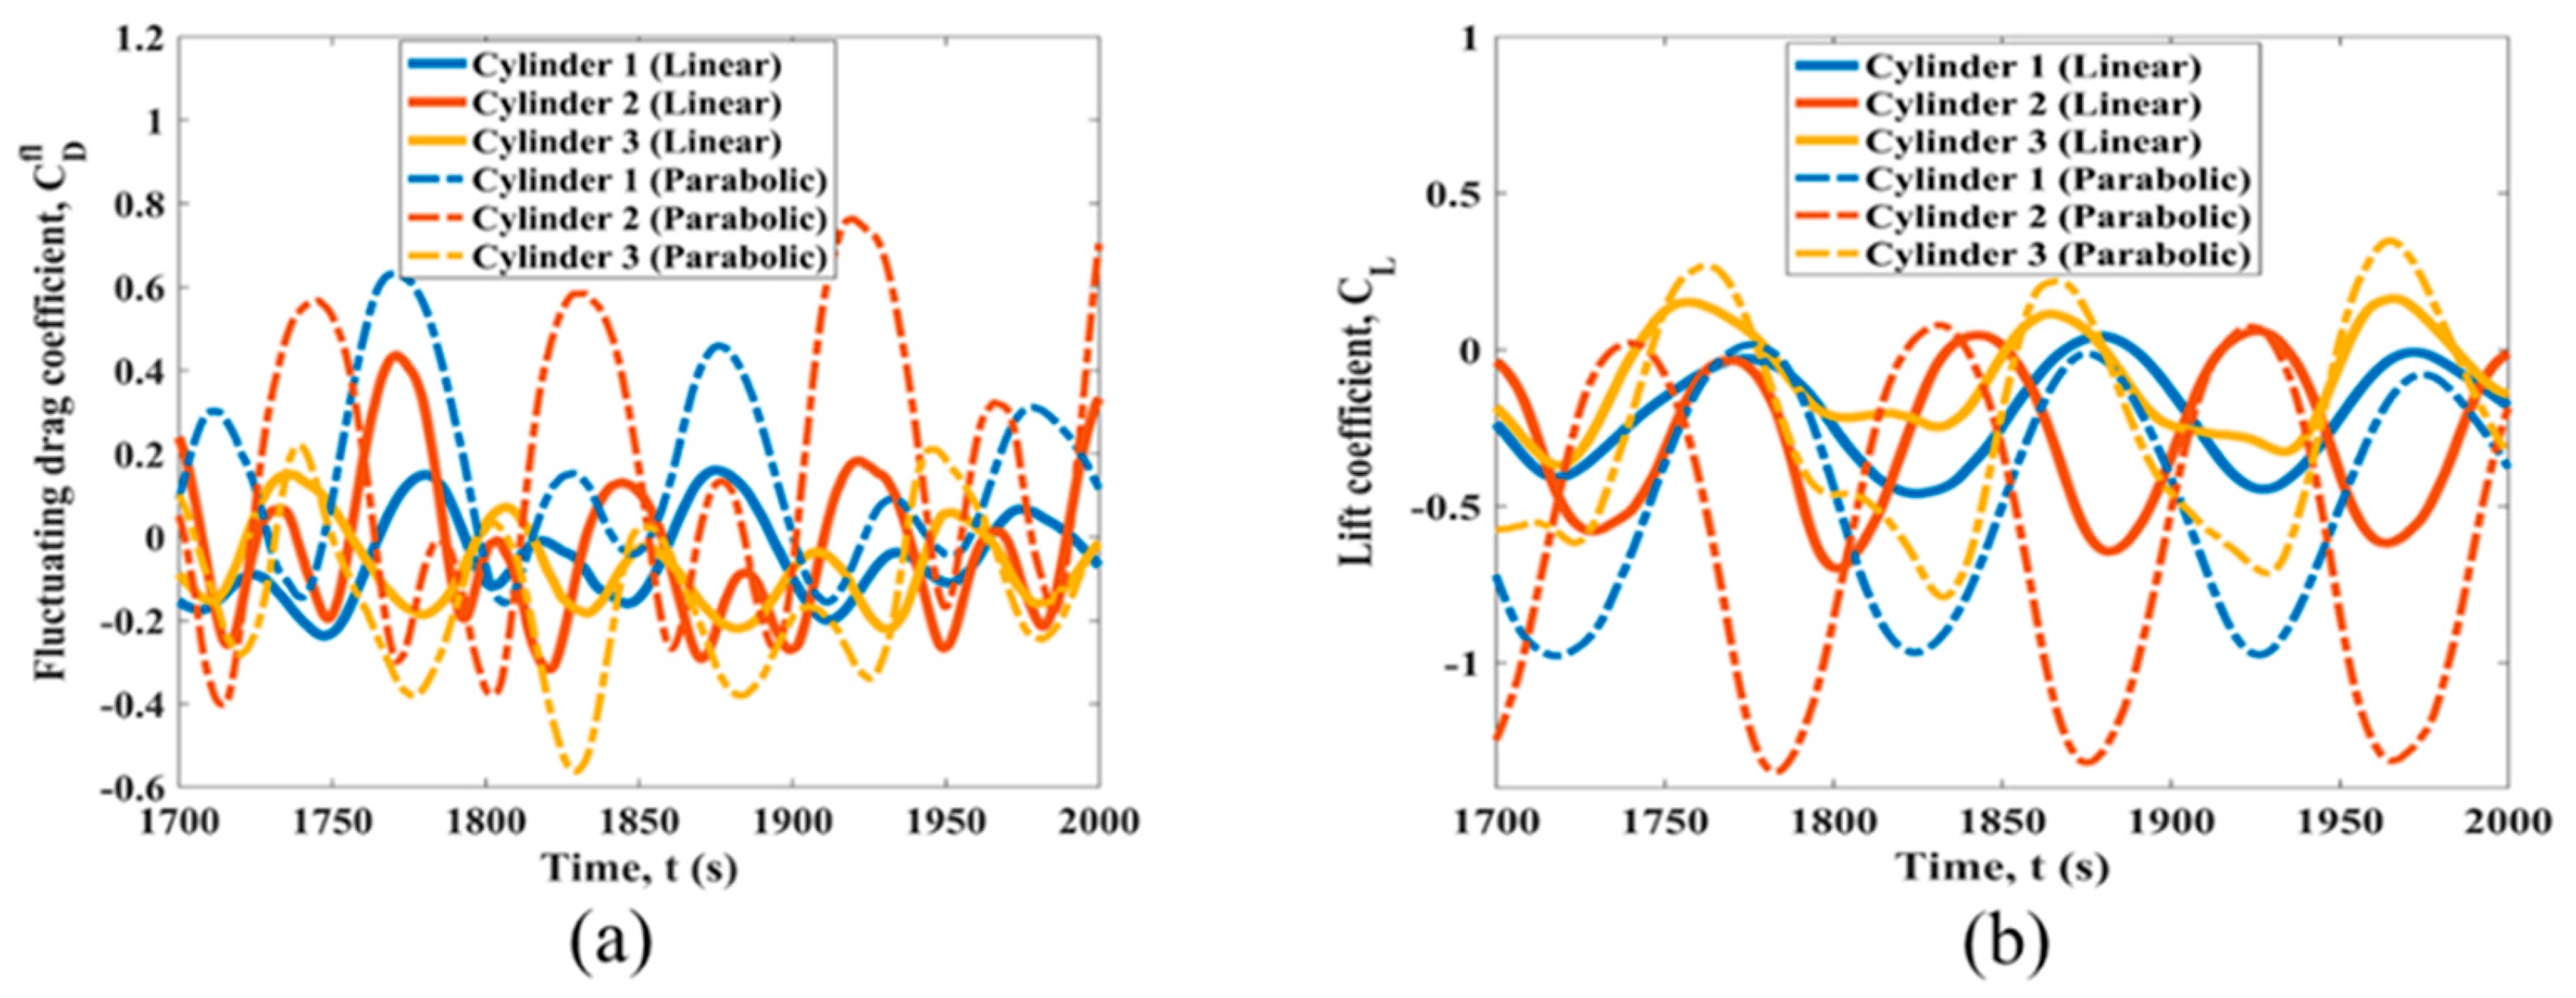
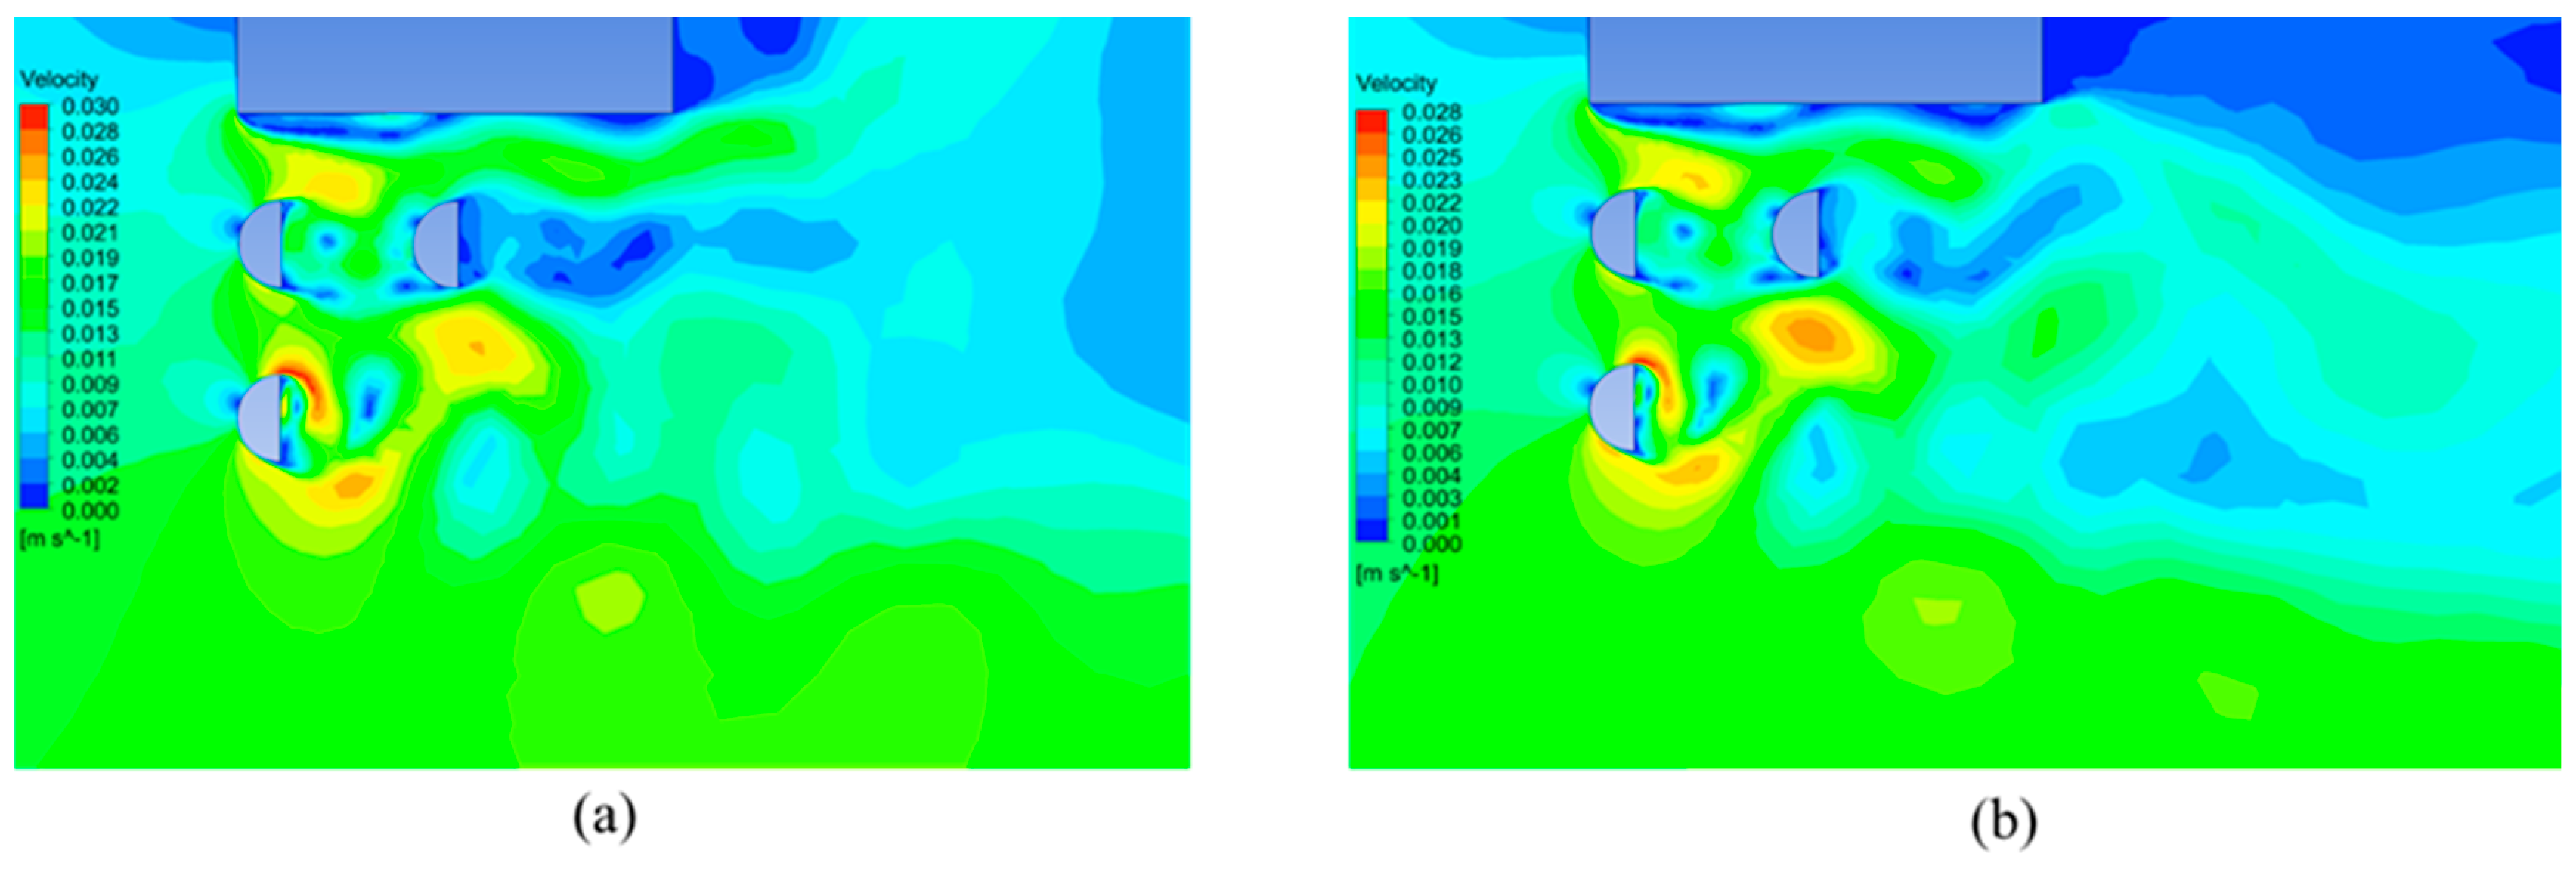
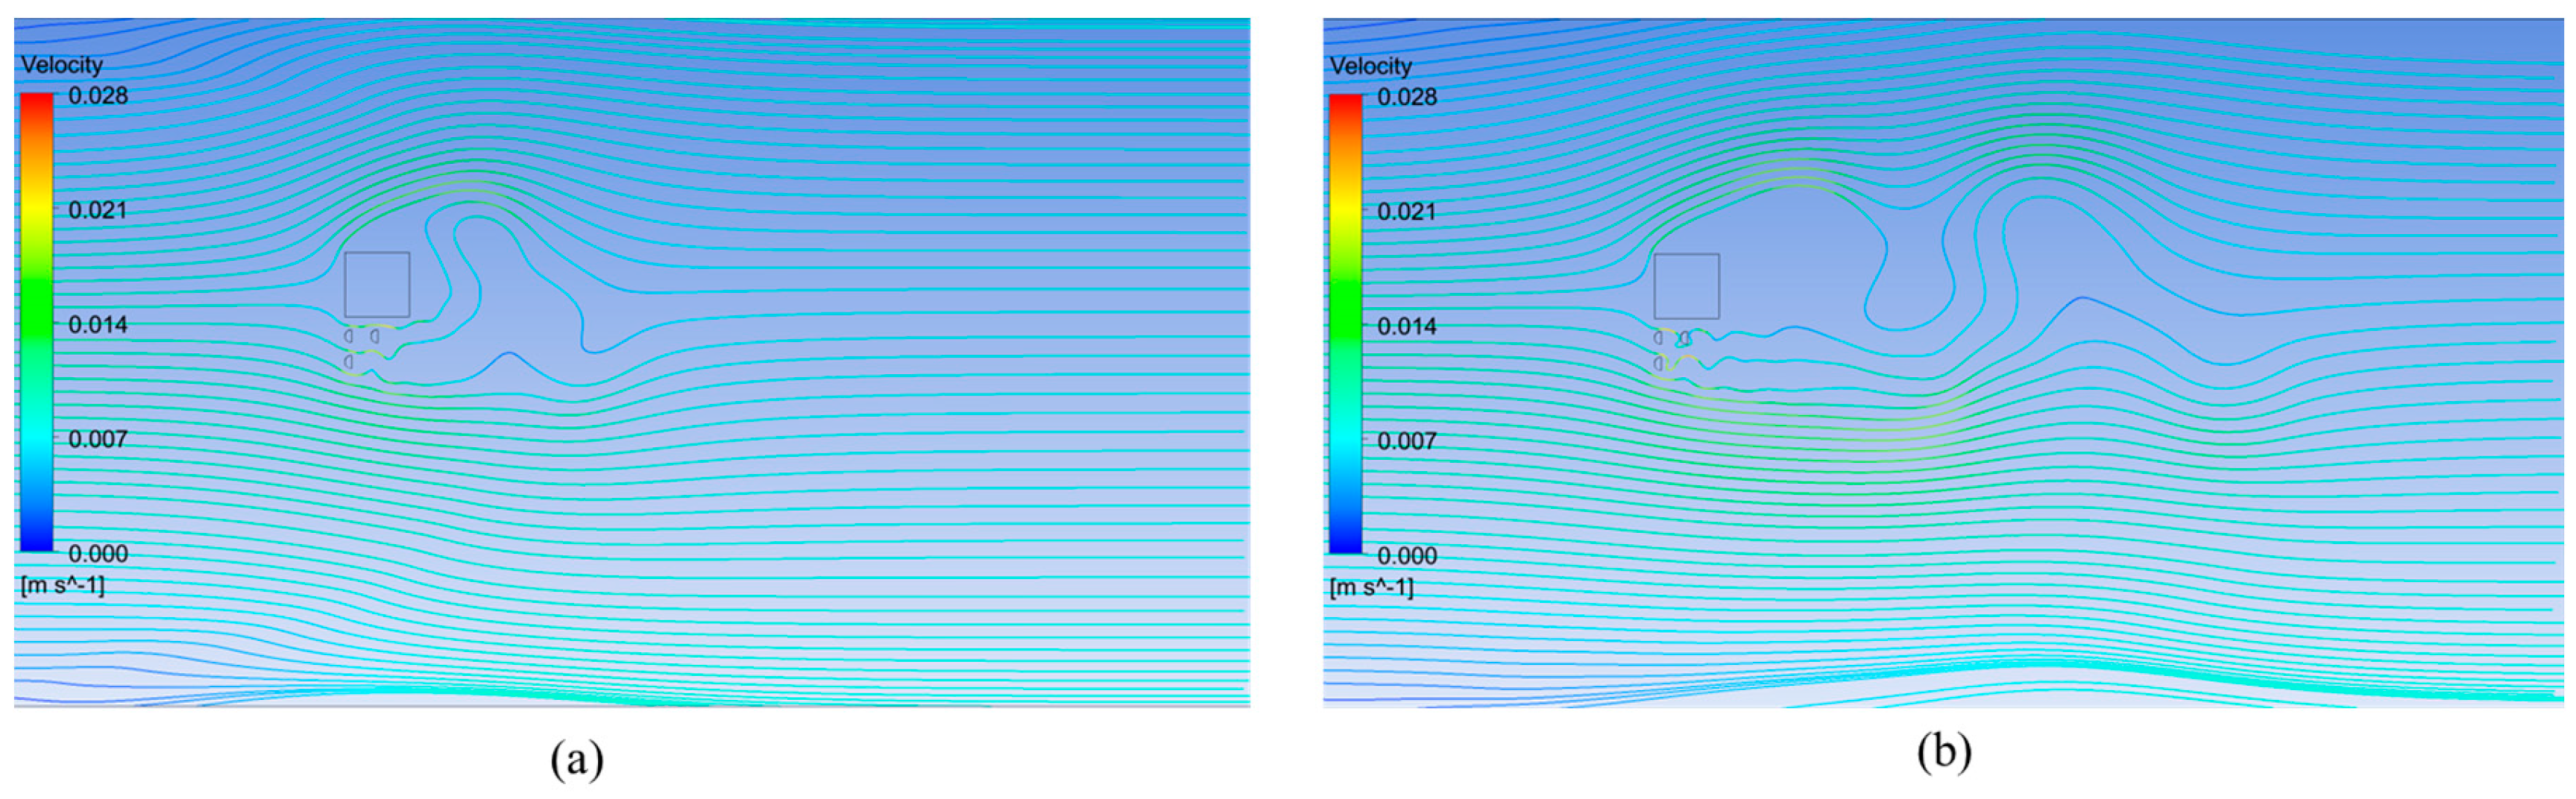
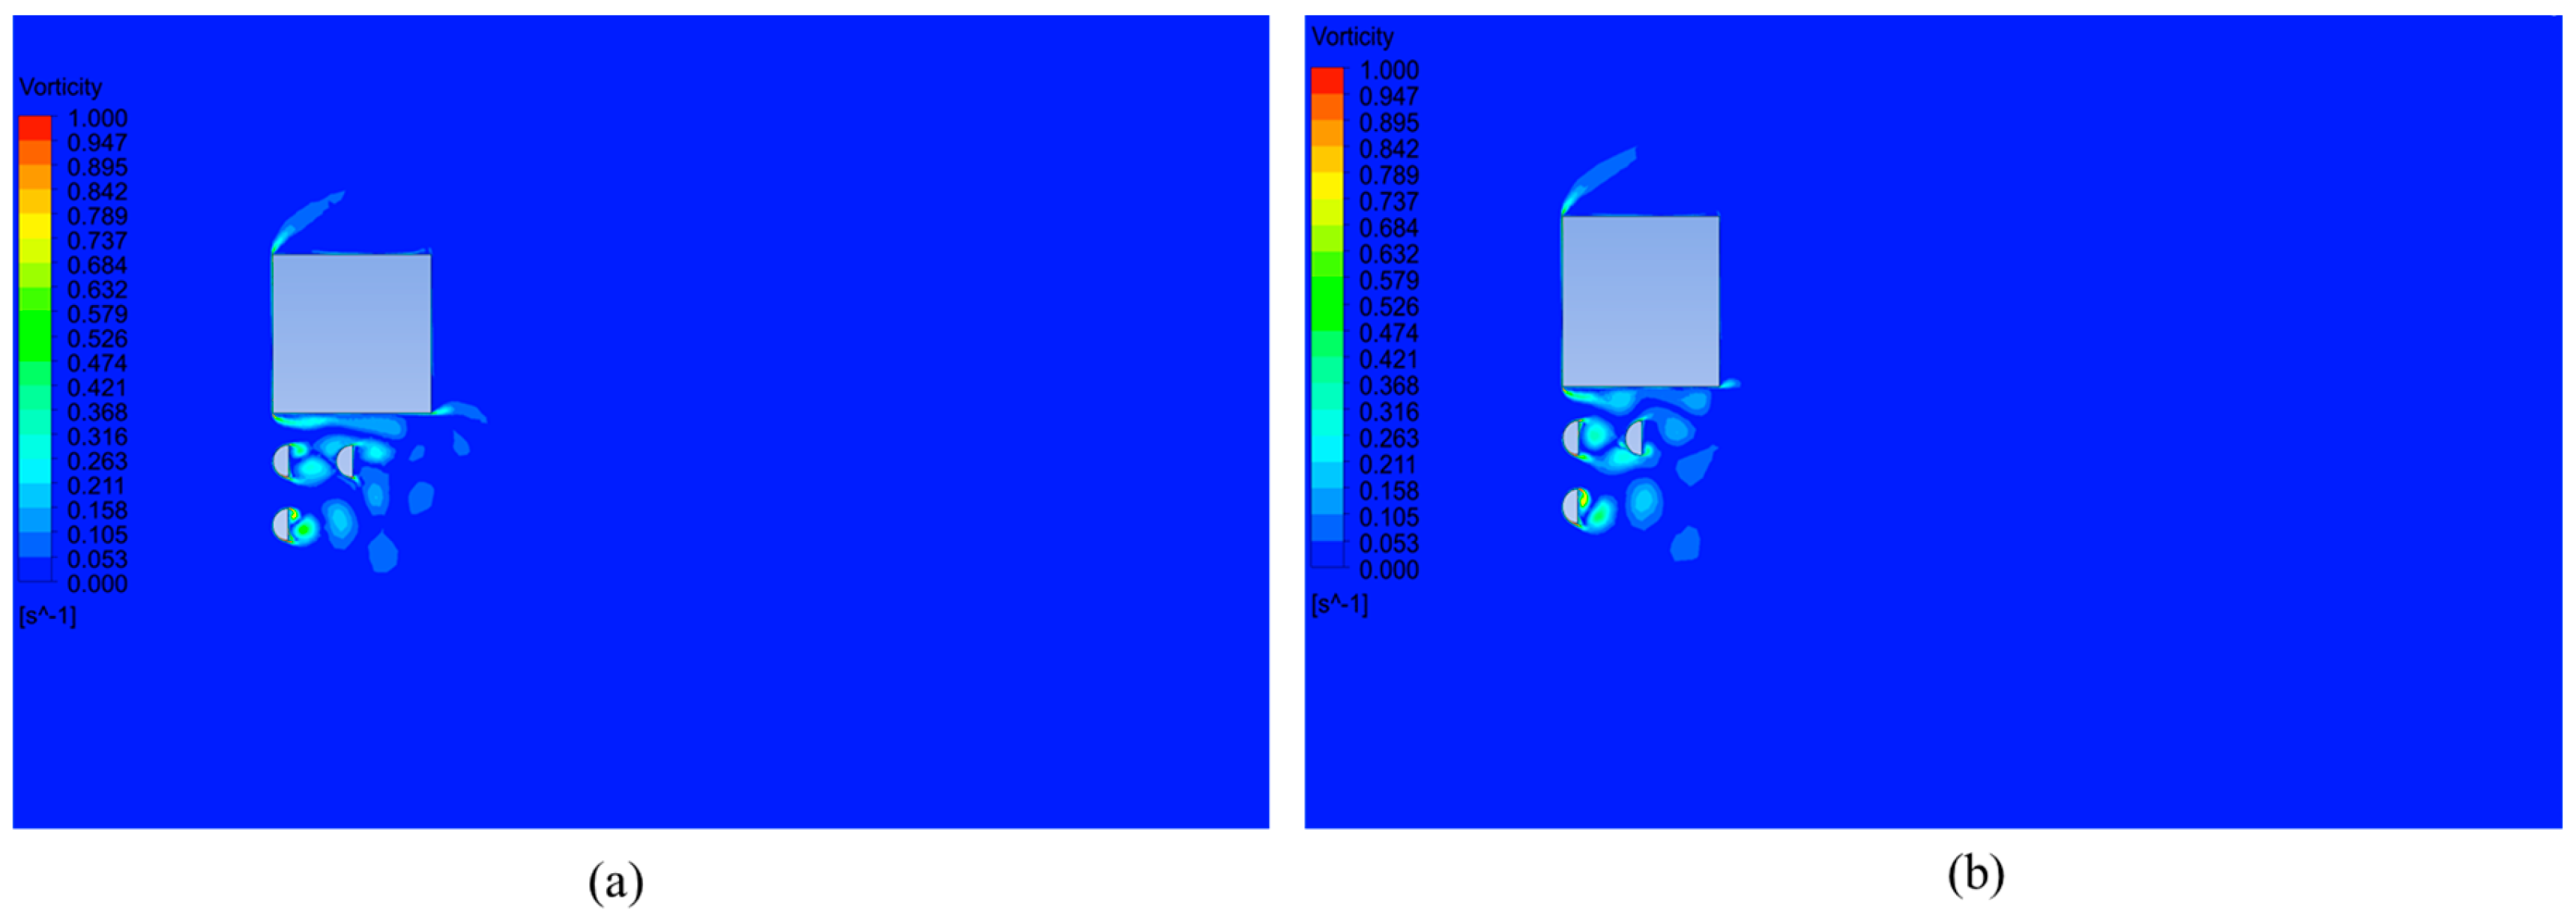
3.4. Simulations for D-Shaped Structures in Linear and Parabolic Sheared Flow
4. Conclusions
Author Contributions
Funding
Institutional Review Board Statement
Informed Consent Statement
Data Availability Statement
Conflicts of Interest
References
- Jordan, S.K.; Fromm, J.E. Laminar flow past a circle in shear flow. Phys. Fluids 1972, 15, 972–976. [Google Scholar] [CrossRef]
- Williamson, C.H.K. Vortex dynamics in the cylinder wake. Annu. Rev. Fluid Mech. 1996, 28, 477–539. [Google Scholar] [CrossRef]
- Zdravkovich, M.M. Review of flow interference between two circular cylinders in various arrangements. ASME J. Fluids Eng. 1977, 99, 618–633. [Google Scholar] [CrossRef]
- Breuer, M. A challenging test case for large eddy simulation: High Reynolds number circular cylinder flow. Int. J. Heat Fluid Flow 2000, 21, 648–654. [Google Scholar] [CrossRef]
- Lei, C.; Cheng, L.; Kavanagh, K. Spanwise length effects on three-dimensional modelling of flow over a circular cylinder. Comput. Method Appl. Mech. 2001, 190, 2909–2923. [Google Scholar] [CrossRef]
- Labbé, D.F.L.; Wilson, P.A. A numerical investigation of the effects of the spanwise length on the 3-d wake of a circular cylinder. J. Fluids Struct. 2007, 23, 1168–1188. [Google Scholar] [CrossRef]
- Xu, W.; Haokai, W.; Kun, J.; Enhao, W. Numerical investigation into the effect of spacing on the flow-induced vibrations of two tandem circular cylinders at subcritical Reynolds numbers. Ocean Eng. 2021, 236, 1–19. [Google Scholar] [CrossRef]
- Yoshino, F.; Hayashi, T. Numerical solution of flow around a rotating circular cylinder in uniform shear flow. Bull. JSME 1984, 27, 1850–1857. [Google Scholar] [CrossRef]
- Tamura, H.; Kiya, M.; Arie, M. Numerical study on viscous shear flow past a circular cylinder. Bull. JSME 1989, 23, 1952–1958. [Google Scholar] [CrossRef]
- Ayukawa, K.; Ochi, J.; Kawahara, G.; Hirao, T. Effects of shear rate on the flow around a square cylinder in a uniform shear flow. J. Wind. Eng. Ind. Aerodyn. 1993, 50, 97–106. [Google Scholar] [CrossRef]
- Lei, C.; Cheng, L.; Kavanagh, K. A finite difference solution of the shear flow over a circular cylinder. Ocean Eng. 2000, 27, 271–290. [Google Scholar] [CrossRef]
- Wu, T.; Chen, C.-F. Laminar boundary-layer separation over a circular cylinder in uniform shear flow. Acta Mech. 2000, 144, 71–82. [Google Scholar] [CrossRef]
- Sumner, D.; Akosile, O.O. On uniform planar shear flow around a circular cylinder at subcritical Reynolds number. J. Fluids Struct. 2003, 18, 441–454. [Google Scholar] [CrossRef]
- Kang, S. Uniform-shear flow over a circular cylinder at low Reynolds numbers. J. Fluids Struct. 2006, 22, 541–555. [Google Scholar] [CrossRef]
- Shuyang, C.; Shigehira, O.; Yukio, T.; Yaojun, G.; Hironori, K. Numerical simulation of Reynolds number effects on velocity shear flow around a circular cylinder. J. Fluids Struct. 2010, 26, 685–702. [Google Scholar]
- Gao, Y.; Zhang, Y.; Zhao, M.; Wang, L. Numerical investigation on two degree-of-freedom flow-induced vibration of three tandem cylinders. Ocean Eng. 2020, 201, 107059. [Google Scholar] [CrossRef]
- Zhao, M.; Cheng, L. Numerical simulation of vortex-induced vibration of four circular cylinders in a square configuration. J. Fluids Struct. 2012, 31, 125–140. [Google Scholar] [CrossRef]
- Han, Z.; Zhou, D.; He, T.; Tu, J.; Li, C.; Kwok, K.C.; Fang, C. Flow-induced vibrations of four circular cylinders with square arrangement at low Reynolds numbers. Ocean Eng. 2015, 96, 21–33. [Google Scholar] [CrossRef]
- Gao, Y.; Yang, K.; Zhang, B.; Cheng, K.; Chen, X. Numerical investigation on vortex-induced vibrations of four circular cylinders in a square configuration. Ocean Eng. 2019, 175, 223–240. [Google Scholar] [CrossRef]
- Gómez, H.A.; Narváez, G.F.; Schettini, E.B. Vortex induced vibration of four cylinders configurations at critical spacing in 0° and 45° flow incidence angle. Ocean Eng. 2022, 252, 111134. [Google Scholar] [CrossRef]
- Xu, W.; Zhang, S.; Liu, B.; Wang, E.; Bai, Y. An experimental study on flow-induced vibration of three and four side-by-side long flexible cylinders. Ocean Eng. 2018, 169, 492–510. [Google Scholar] [CrossRef]
- Wang, E.; Xu, W.; Yu, Y.; Zhou, L.; Incecik, A. Flow-induced vibrations of three and four long flexible cylinders in tandem arrangement: An experimental study. Ocean Eng. 2019, 178, 170–184. [Google Scholar] [CrossRef]
- Han, P.; Pan, G.; Zhang, B.; Wang, W.; Tian, W. Three-cylinder oscillator under flow: Flow induced vibration and energy harvesting. Ocean Eng. 2020, 211, 107619. [Google Scholar] [CrossRef]
- Xu, W.; Zhang, S.; Ma, Y.; Liu, B. Fluid forces acting on three and four long side-by-side flexible cylinders undergoing flow-induced vibration (FIV). Mar. Struct. 2021, 75, 102877. [Google Scholar] [CrossRef]
- Fan, X.; Wang, Z.; Wang, Y.; Tan, W. The effect of vortices structures on the flow-induced vibration of three flexible tandem cylinders. Int. J. Mech. Sci. 2021, 192, 106132. [Google Scholar] [CrossRef]
- Ma, Y.; Xu, W.; Liu, B. Dynamic response of three long flexible cylinders subjected to flow-induced vibration (FIV) in an equilateral-triangular configuration. Ocean Eng. 2019, 183, 187–207. [Google Scholar] [CrossRef]
- Liu, Y.; Li, P.; Wang, Y.; Chen, X.; Ren, X.; Lou, M. Dynamic response of five-riser group subjected to vortex-induced vibration in a cylindrical arrangement configuration. Ocean Eng. 2022, 254, 111271. [Google Scholar] [CrossRef]
- Silva-Ortega, M.; Assi, G.R.S. Flow-induced vibration of a circular cylinder surrounded by two, four and eight wake-control cylinders. Exp. Therm. Fluid Sci. 2017, 85, 354–362. [Google Scholar] [CrossRef]
- de Oliveira Barbosa, J.M.; Qu, Y.; Metrikine, A.V.; Lourens, E.M. Vortex-induced vibrations of a freely vibrating cylinder near a plane boundary: Experimental investigation and theoretical modelling. J. Fluids Struct. 2017, 69, 382–401. [Google Scholar] [CrossRef]
- Annapeh, H.F.; Kurushina, V. Effect of Gap and Diameter Ratio on Vortex-Induced Forces for Cylinders in Tandem at Re = 100. In Journal of Physics: Conference Series; IOP Publishing: Bristol, UK, 2022; Volume 2219, p. 012021. [Google Scholar]
- Annapeh, H.F.; Kurushina, V. Numerical Simulation of Flow-Induced Forces on Subsea Structures in a Group under Uniform and Sheared Flow. In International Conference on Wave Mechanics and Vibrations; Springer: Cham, Switzerland, 2023; pp. 512–522. [Google Scholar]
- Annapeh, H.F.; Kurushina, V. Analysis of vortex-induced forces on the group of subsea structures in proximity of equipment at Re = 3900. J. Math. Struct. Model. 2022, 4, 60–74. [Google Scholar]
- Annapeh, H.F.; Kurushina, V. Hydrodynamic Loads on a Group of Six Structures of Different Cross-Sections in Uniform and Sheared Flow. J. Mar. Sci. Eng. 2023, 11, 383. [Google Scholar] [CrossRef]
- Zhao, J.; Thompson, M.C.; Hourigan, K. Flow-Induced Vibration of a D-Shape Cylinder. In Proceedings of the European Nonlinear Dynamics Conference, Budapest, Hungary, 25–30 June 2017. [Google Scholar]
- Postnikov, A.; Pavlovskaia, E.; Wiercigroch, M. 2DOF CFD calibrated wake oscillator model to investigate vortex-induced vibrations. Int. J. Mech. Sci. 2017, 127, 176–190. [Google Scholar] [CrossRef]
- Norberg, C. Effects of Reynolds Number and Low-Intensity Free-Stream Turbulence on the Flow around a Circular Cylinder; Publ. No. 87/2; Department of Applied Thermoscience and Fluid Mechanics, Chalmers University of Technology: Göteborg, Sweden, 1987. [Google Scholar]
- Franke, J.; Frank, W. Large eddy simulation of the flow past a circular cylinder at ReD = 3900. J. Wind. Eng. Ind. Aerodyn. 2002, 90, 1191–1206. [Google Scholar] [CrossRef]
- Wornom, S.; Ouvrard, H.; Salvetti, M.V.; Koobus, B.; Dervieux, A. Variational multiscale large-eddy simulations of the flow past a circular cylinder: Reynolds number effects. Comput. Fluids 2011, 47, 44–50. [Google Scholar] [CrossRef]
- Ma, X.; Karamanos, G.-S.; Karniadakis, G.E. Dynamics and low-dimensionality of a turbulent near wake. J. Fluid Mech. 2000, 410, 29–65. [Google Scholar] [CrossRef]


| Case Number | L1/D | L2/D | L3/D |
|---|---|---|---|
| Case 1 | 0.6 | 0.6 | 0.6 |
| Case 2 | 0.7 | 0.7 | 0.7 |
| Case 3 | 0.8 | 0.8 | 0.8 |
| Case 4 | 0.9 | 0.9 | 0.9 |
| Case 5 | 1.0 | 1.0 | 1.0 |
| Case 6 | 0.6 | 0.7 | 0.7 |
| Case 7 | 0.6 | 0.8 | 0.8 |
| Case 8 | 0.6 | 0.9 | 0.9 |
| Case 9 | 0.6 | 1.0 | 1.0 |
| Cases | CD0 | Number of Cells | y+ |
|---|---|---|---|
| Current study at Re = 3900 | |||
| Mesh 1 | 0.87 | 31,297 | 0.0133 |
| Mesh 2 | 0.91 | 53,951 | 0.0132 |
| Mesh 3 | 0.93 | 86,637 | 0.0131 |
| Mesh 4 | 0.93 | 153,227 | 0.0131 |
| Published data at Re = 3900 | |||
| Norberg (1987), Experiment [36] | 0.98 | - | - |
| Franke and Frank (2002), LES [37] | 0.99 | - | - |
| Wornom et al. (2011), VMS-LES [38] | 0.99 | - | - |
| Ma et al. (2000), DNS [39] | 0.96 | - | - |
| L/D | Cylinder 1 | Cylinder 2 | Cylinder 3 | ||||||||||||
|---|---|---|---|---|---|---|---|---|---|---|---|---|---|---|---|
| 0.6 | 0.36 | 0.2 | 0.45 | 0.003 | 0.007 | 0.51 | 0.22 | 0.55 | 0.012 | 0.011 | 0.10 | 0.54 | 0.57 | 0.005 | 0.010 |
| 0.7 | 0.36 | 0.16 | 0.51 | 0.011 | 0.008 | 0.44 | 0.19 | 0.58 | 0.012 | 0.012 | 0.20 | 0.38 | 0.76 | 0.022 | 0.009 |
| 0.8 | 0.39 | 0.23 | 0.54 | 0.0125 | 0.012 | 0.41 | 0.20 | 0.58 | 0.014 | 0.012 | 0.16 | 0.46 | 0.78 | 0.023 | 0.010 |
| 0.9 | 0.40 | 0.20 | 0.49 | 0.013 | 0.010 | 0.45 | 0.19 | 0.54 | 0.012 | 0.010 | 0.19 | 0.46 | 0.88 | 0.021 | 0.012 |
| 1.0 | 0.40 | 0.13 | 0.45 | 0.014 | 0.011 | 0.43 | 0.17 | 0.49 | 0.023 | 0.011 | 0.18 | 0.32 | 0.79 | 0.021 | 0.010 |
| L/D | Cylinder 1 | Cylinder 2 | Cylinder 3 | ||||||
|---|---|---|---|---|---|---|---|---|---|
| 0.6 | 0.68 | 0.29 | 0.62 | 1.01 | 0.84 | 1.72 | 0.14 | 0.27 | 0.58 |
| 0.7 | 0.75 | 0.29 | 0.63 | 1.02 | 0.84 | 1.91 | 0.29 | 0.40 | 1.30 |
| 0.8 | 0.94 | 0.70 | 1.52 | 0.87 | 0.65 | 1.66 | 0.34 | 0.70 | 1.34 |
| 0.9 | 1.0 | 0.87 | 1.65 | 0.95 | 0.67 | 1.74 | 0.38 | 0.80 | 1.57 |
| 1.0 | 0.93 | 0.67 | 1.43 | 0.88 | 0.60 | 1.41 | 0.37 | 0.56 | 1.23 |
| Constant L/D | Cylinder 1 | Cylinder 2 | Cylinder 3 | ||||||
|---|---|---|---|---|---|---|---|---|---|
| Linearly sheared flow | |||||||||
| 0.6 | 0.63 | 0.32 | 0.51 | 0.92 | 0.50 | 0.80 | 0.10 | 0.25 | 0.46 |
| Parabolic sheared flow | |||||||||
| 0.6 | 1.01 | 0.79 | 1.03 | 1.43 | 1.08 | 1.42 | 0.25 | 0.85 | 1.03 |
Disclaimer/Publisher’s Note: The statements, opinions and data contained in all publications are solely those of the individual author(s) and contributor(s) and not of MDPI and/or the editor(s). MDPI and/or the editor(s) disclaim responsibility for any injury to people or property resulting from any ideas, methods, instructions or products referred to in the content. |
© 2023 by the authors. Licensee MDPI, Basel, Switzerland. This article is an open access article distributed under the terms and conditions of the Creative Commons Attribution (CC BY) license (https://creativecommons.org/licenses/by/4.0/).
Share and Cite
Annapeh, H.F.; Kurushina, V. Flow-Induced Forces for a Group of One Large and Several Small Structures in the Sheared Turbulent Flow. Fluids 2023, 8, 158. https://doi.org/10.3390/fluids8050158
Annapeh HF, Kurushina V. Flow-Induced Forces for a Group of One Large and Several Small Structures in the Sheared Turbulent Flow. Fluids. 2023; 8(5):158. https://doi.org/10.3390/fluids8050158
Chicago/Turabian StyleAnnapeh, Henry Francis, and Victoria Kurushina. 2023. "Flow-Induced Forces for a Group of One Large and Several Small Structures in the Sheared Turbulent Flow" Fluids 8, no. 5: 158. https://doi.org/10.3390/fluids8050158