Article

Detection and Recognition of the Underwater Object with Designated Features Using the Technical Stereo Vision System

Department of Informatics and Control in Technical Systems, Sevastopol State University, 299053 Sevastopol, Russia
*
Author to whom correspondence should be addressed.
Fluids 2023, 8(3), 92; https://doi.org/10.3390/fluids8030092
Submission received: 24 January 2023 / Revised: 27 February 2023 / Accepted: 28 February 2023 / Published: 7 March 2023

Abstract

:
The article discusses approaches to solving the problems of detecting, recognizing, and localizing an object with given distinctive features in an aquatic environment using a technical stereo vision system, taking into account restrictions. The stereo vision system is being developed as part of the task in which the AUV, for the purpose of conducting a monitoring mission, follows from the starting point of its route along a given trajectory in order to detect and classify an object with known characteristics and determine its coordinates using a technical stereo vision system at a distance up to 5 m from it with appropriate water clarity. The developed program for the system of the technical stereo vision should provide the AUV with the following information: video sequence; a frame with an image of the detected object; previously unknown characteristics of the object if it is possible to detect them (color, size or shape); distance to the object from the technical stereo vision system; and linear coordinates relative to the technical stereo vision system. Testing of the developed software was carried out on the operating module of the stereo vision installed on the AUV in the underbody compartment. The study was carried out in the pool and in open water. The experiments performed have shown the effectiveness of the developed system when used in conjunction with an underwater robot.

1. Introduction

At the present time, unmanned remotely operated vehicles (ROVs) and autonomous unmanned underwater vehicles (UUVs) are being developed and used to solve an object’s detection and localization problems in an aquatic environment [1,2,3,4]. The ROVs and UUVs may be equipped with an encoder, magnetometer, gyroscope, temperature and depth sensors, GPS navigator, round- or side-scan sonar, video cameras, and other technical means. These devices make it possible to obtain information about the vehicle and its surroundings. Such information may include: position of the submersible relative to the mission starts points or in the global satellite navigation system, orientation and speed of the submersible, distance to the bottom, and the scene image in front of the installed video camera (which is part of the 3D vision system). Using an ROV, most of the tasks described above are handled by the operator, who monitors the information transmitted to him and reacts according to the situation. The UUV control unit requires algorithms for processing the received data, which can solve the tasks set for the UUV and replace most of the operator’s functions. The most frequent requirements for the algorithms are the speed of their operation, the object’s distinctive features identifying accuracy, and the stability of operation.
To solve the object detection problem, it is enough to identify its distinctive features, such as geometric shape and size. If it is necessary to recognize the object’s type or class, detect defects, and perform a number of operations with it, it may also be necessary to determine its color and high accuracy determining of dimensions. The most obvious and interpretable information obtained by the device is the image taken by the video camera, which allows it to determine the color and geometric shape of the object [5,6]. Using a stereo camera, it is possible to determine the dimensions of the detected object with high precision [7,8,9]. However, the underwater video camera application has a number of limitations: the size of the observed space is limited by the viewing angle of video cameras; the degree of water transparency and brightness of the underwater lights; uneven lighting; glare caused by light reflection from suspended water; and rapid attenuation of the low-frequency red spectrum.
There are approaches based on image preprocessing algorithms such as calculation of global contrast values, which allow us to separate the explicit object of interest from the uncomplicated background. In the case of a complex background with a large number of objects or the contrasting spots presence related to the water turbidity, this approach requires additional processing. To compensate these drawbacks, a neural network is used in [10]. The neural network is also used in other works. For example, in [11] for the detection and recognition of marine species, a deep neural network is trained to restore the natural color of the underwater scene in order to remove the negative effects of suspended matter and non-uniform lighting. However, the neural network application is fraught with difficulties in collecting a training dataset under different conditions, such as uneven color and lighting, water turbidity, time underwater, and, especially, in the case of artificial objects whose underwater images are not taken.
To separate the object of interest from the background in different images, a method was developed in [12]. This method assumes that the artificial light is often directed towards the object, so by detecting the area of its scattering, it is possible to narrow the search for the object of interest. At the beginning, the optical image features are highlighted, starting with the calculation of global contrast values in each point. Then the calculation of the channel intensity relative to the gray image intensity is performed. Then the intensity concentration region is searched for. The last step of optical feature extraction is the calculation of the red channel contrast, which is calculated in the same way as the global contrast values only with respect to the red channel. After the optical features selection, a number of steps are performed to select pixels in the image that have fixed the scattering area of artificial light under water. These steps involve searching for dependencies between the results of the algorithms applied in the previous step: the inverse relationship between global contrast values and the intensity concentration area (in the artificial light area, the points with higher contrast are closer to the point with the highest intensity); the direct relationship between global contrast and red channel contrast values (in the area of artificial light an increase in global contrast corresponds to an increase in red channel contrast); the inverse relationship between global contrast values and channel intensity (points with a large value of global contrast have a smaller variability in different channels in the artificial light area); and the direct relationship between the intensity concentration area and the channel intensity (in the artificial light area, the points with a smaller variation in the different channels of the color space should be located closer to the maximum intensity point). The next step is to use the Otsu’s method (an algorithm for calculating the binarization threshold for a grayscale image) [13] to select an area with an object of interest and refine the boundaries of its contour using the fixing level method. The disadvantages are that this approach assumes the object of interest presence in a specific area illuminated by an artificial light source in the image with the absence of glare, and that the object detected by this method may not be the target one.
A color-correction algorithm was proposed in [14], which allows the restoration of the underwater scene colors in accordance with their perception by a human in an air environment. To solve the specially designed objects (in the form of geometric primitives) detection problem, a number of algorithms for pattern-based object detection were considered and it was concluded that the detection using the SURF feature search proved to be insufficiently effective for simple monotone figures with a smooth texture [14]. The detected special points on different objects had similar features and their number was insignificant. It was also determined that the extraction based on the use of normalized mutual correlation showed good results for images with small geometric changes, but in the case of a perspective change, the results are insufficient.
The problem with the underwater cable search from video camera images is considered in [15]. In this paper, an algorithm is used to solve the problem by detecting a clearly visible underwater cable in an image with an almost monotone background without a complex relief.
The article considers approaches to solving problems of object detection, recognition, and localization with certain distinctive features in an aquatic environment by means of the technical stereo vision system (TSS), taking into account the limitations. The detection difficulties underwater are associated with such limitations as different levels of attenuation for different wavelengths of light (low color rendering), refraction of light at the two boundaries of air-water media, and the turbidity of the water. Moreover, questions such as the operation speed of the developed algorithms on a single board computer without a video card, the stability of operation, the type and frequency of the result provided on the ROVs’ board, and the data transfer via the network protocol are also all considered.
The article is structured as follows. Section 1 analyzes the existing approaches to solving the problem of object detection by color features using TSS. In Section 2, the problem statement is considered with the brief ROV’s characteristic on which TSS is supposed to be installed. It also describes the equipment, which implements TSS itself, and gives a de-scription of the stereo module camera settings. In Section 3, a description of the proposed solution to the problem of detecting an object in an aquatic environment is given. Section 4 discusses the problem of organizing the work of the proposed algorithms.

2. Methods Problem Statement

The following task is considered. Within the monitoring mission, the ROV should detect and classify an object with known characteristics and determine its coordinates using the underwater TSS at a distance up to 5 m from the object with appropriate water transparency while following a specified trajectory at a depth of up to 50 m. The TSS program is required to provide ROV with the following information: video image; frame with detected object; unknown beforehand object characteristics in case of their possible detection (color, size, or shape); distance to the object from TSS; and linear coordinates relative to TSS.

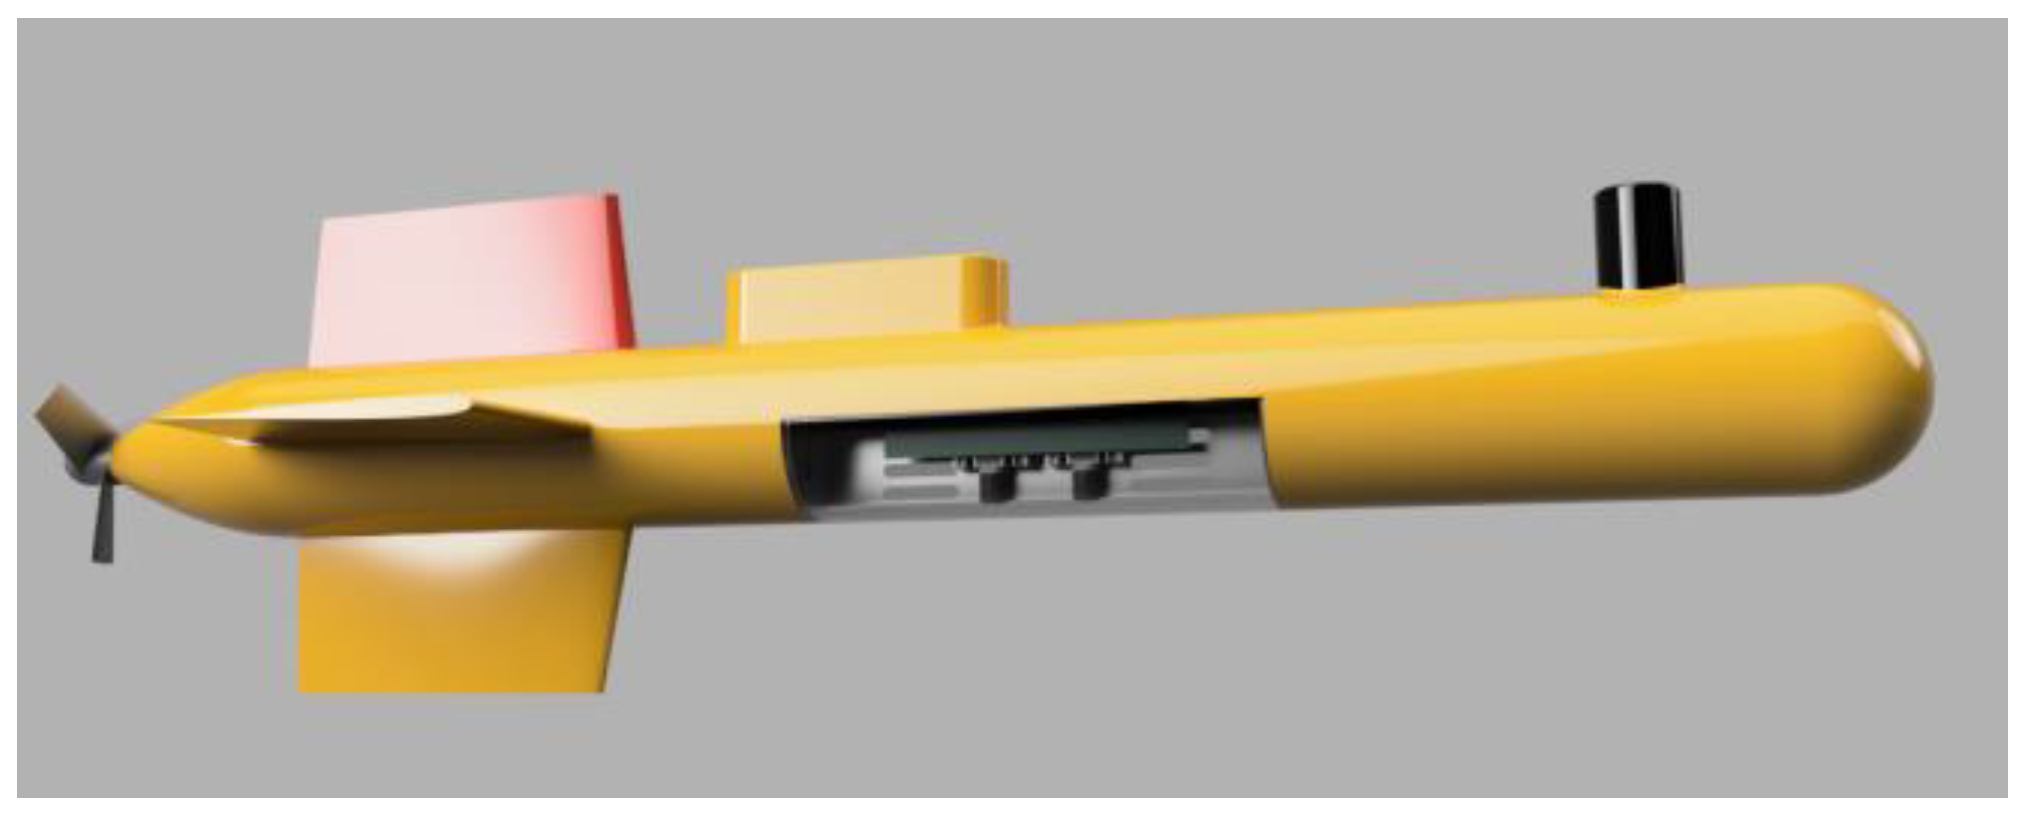
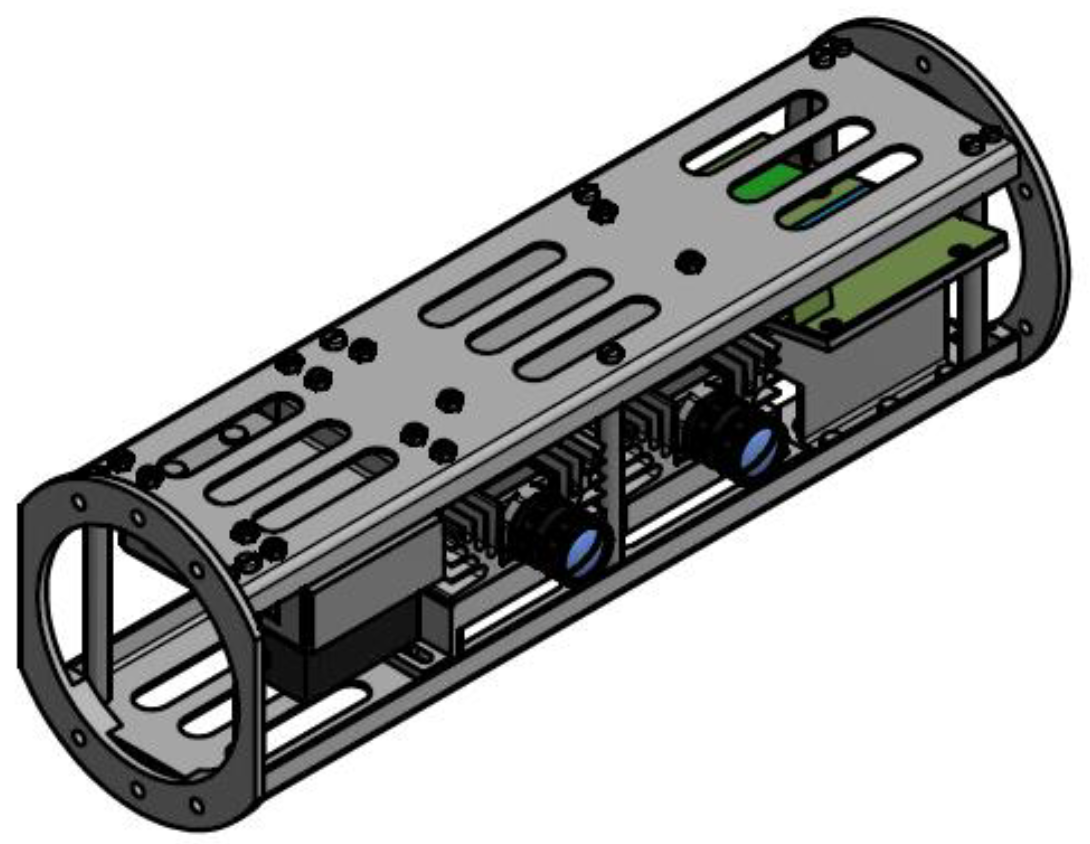
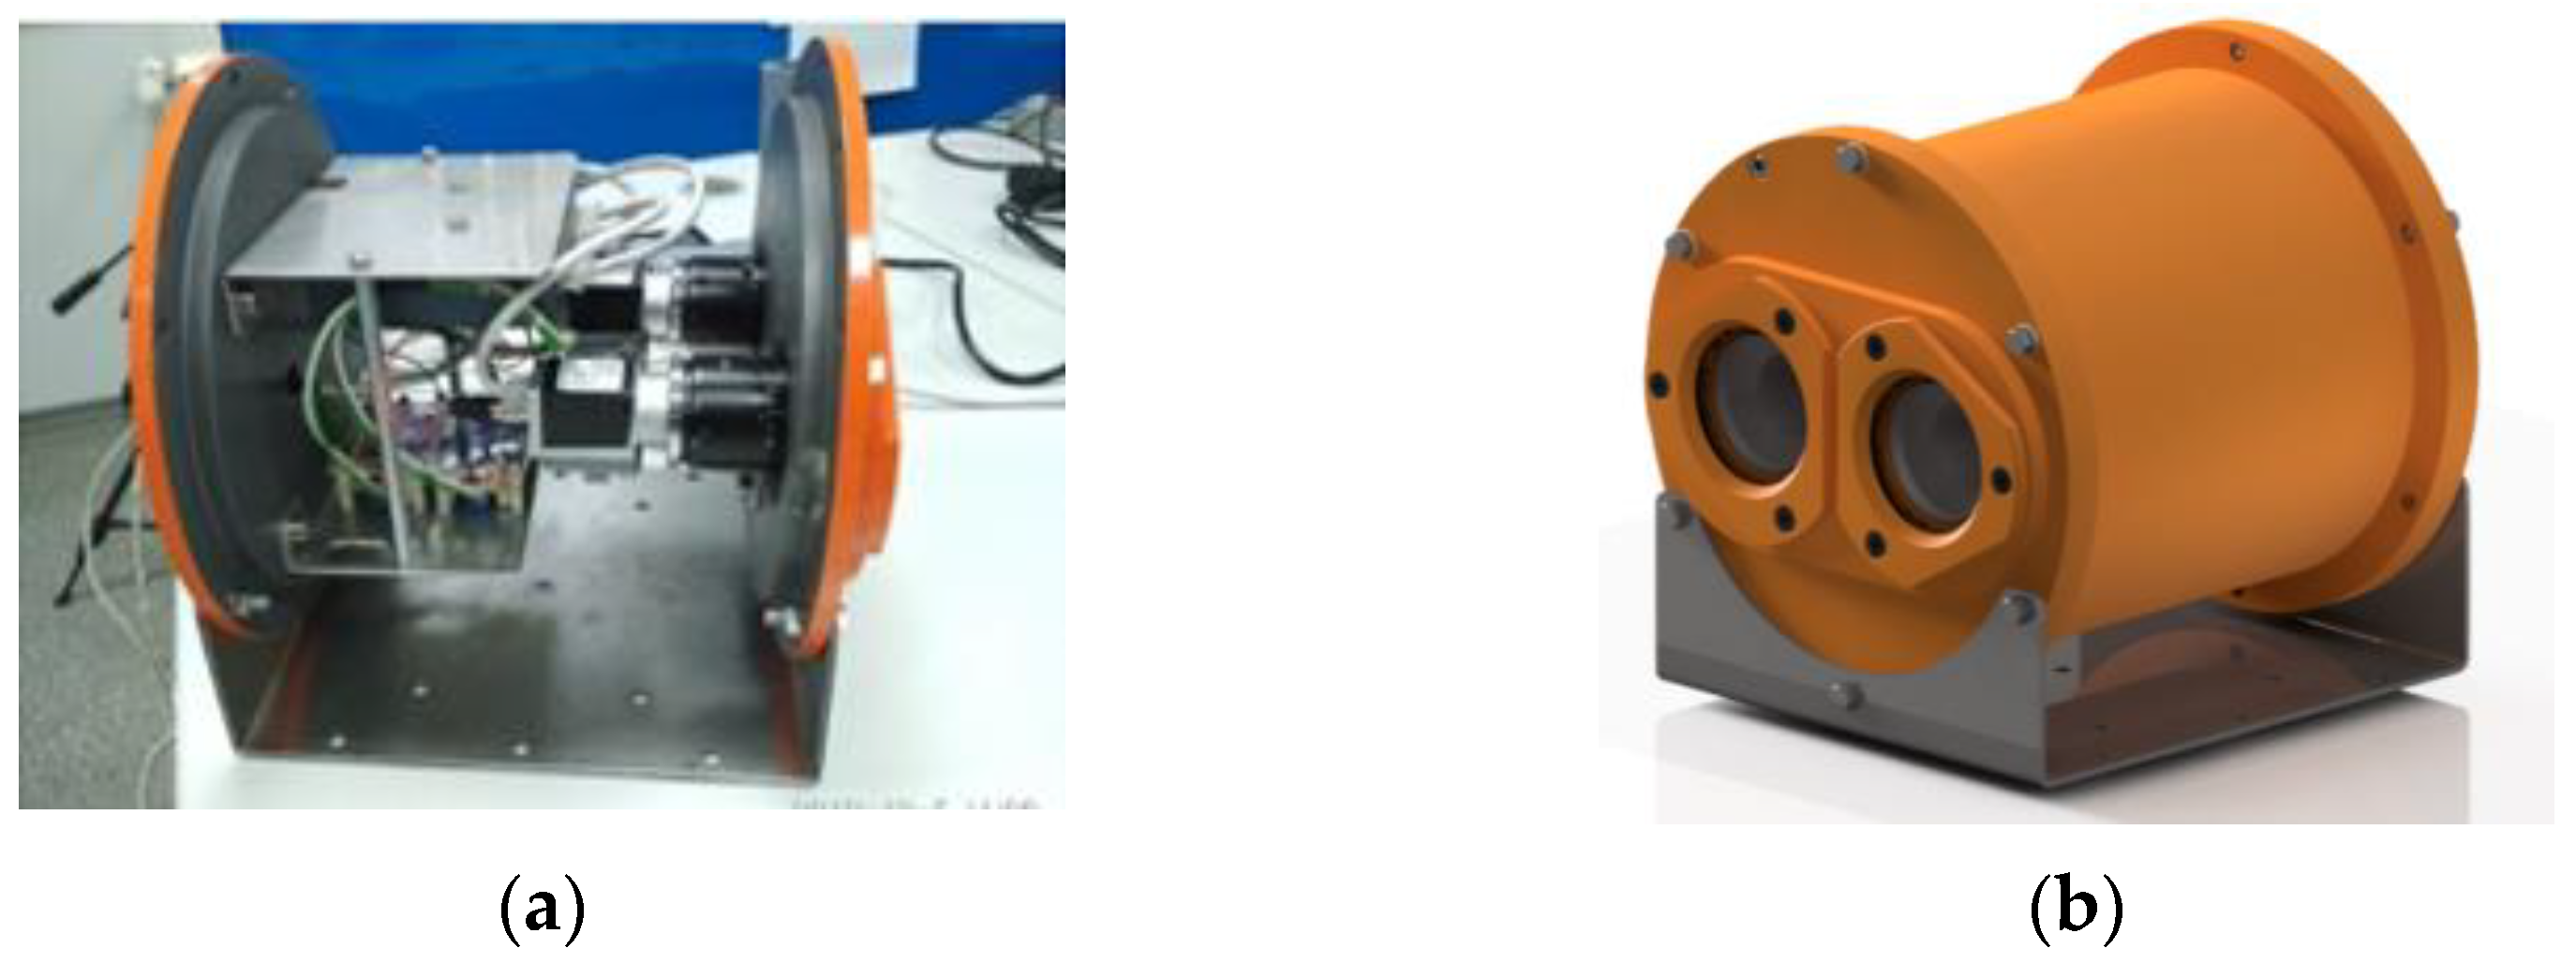
2.1. Equipment Description for the TSS System Deployment

Program operation must be implemented inside a separate AUV compartment, which, apart from video cameras itself, has a computing unit (Figure 1, Figure 2 and Figure 3).
Interventionary studies involving animals or humans, and other studies that require ethical approval, must list the authority that provided approval and the corresponding ethical approval code.
The tested underkeel TSS consists of two industrial Basler acA1920-50gc cameras, (CMOS-matrix Sony IMX174, 50 frames per second at a resolution of 2.3 Mpix, Full HD with a resolution of 1920 × 1200 pixels); Lens TS0814-MP F1.4 f8 mm 1′ with manual focal length adjustment of 8 mm and aperture from F1.4-F16 and viewing angles; PoE 1000 Mbps switch; and sealed housing (Figure 3). Used cameras have CMOS-sensor Sony IMX174 with global shutter (all lines of pixels are exposed simultaneously, with a momentary fixation of image but not line-by-line reading) with a wide dynamic range (ratio between brightness of lightest and darkest objects), and low noise level. The information captured by video cameras is processed on a single board computer QBiP-1165G7A with a processor Intel Core i7-1165G7, 2.8–4.7 GHz, 4-Core and 16 GB of RAM.
High temperatures are observed on the single-board computer’s CPU and on the selected industrial video cameras’ housing during the TSS programs operation. To solve this problem, the heat is removed by using heat sinks on the external housing of the compartment in order to lower the temperature at the expense of the surrounding water environment temperature. In addition, an air cooling system is used to create air circulation inside the compartment so that its temperature is evenly distributed and also lowered by the temperature of the compartment case (Figure 4).

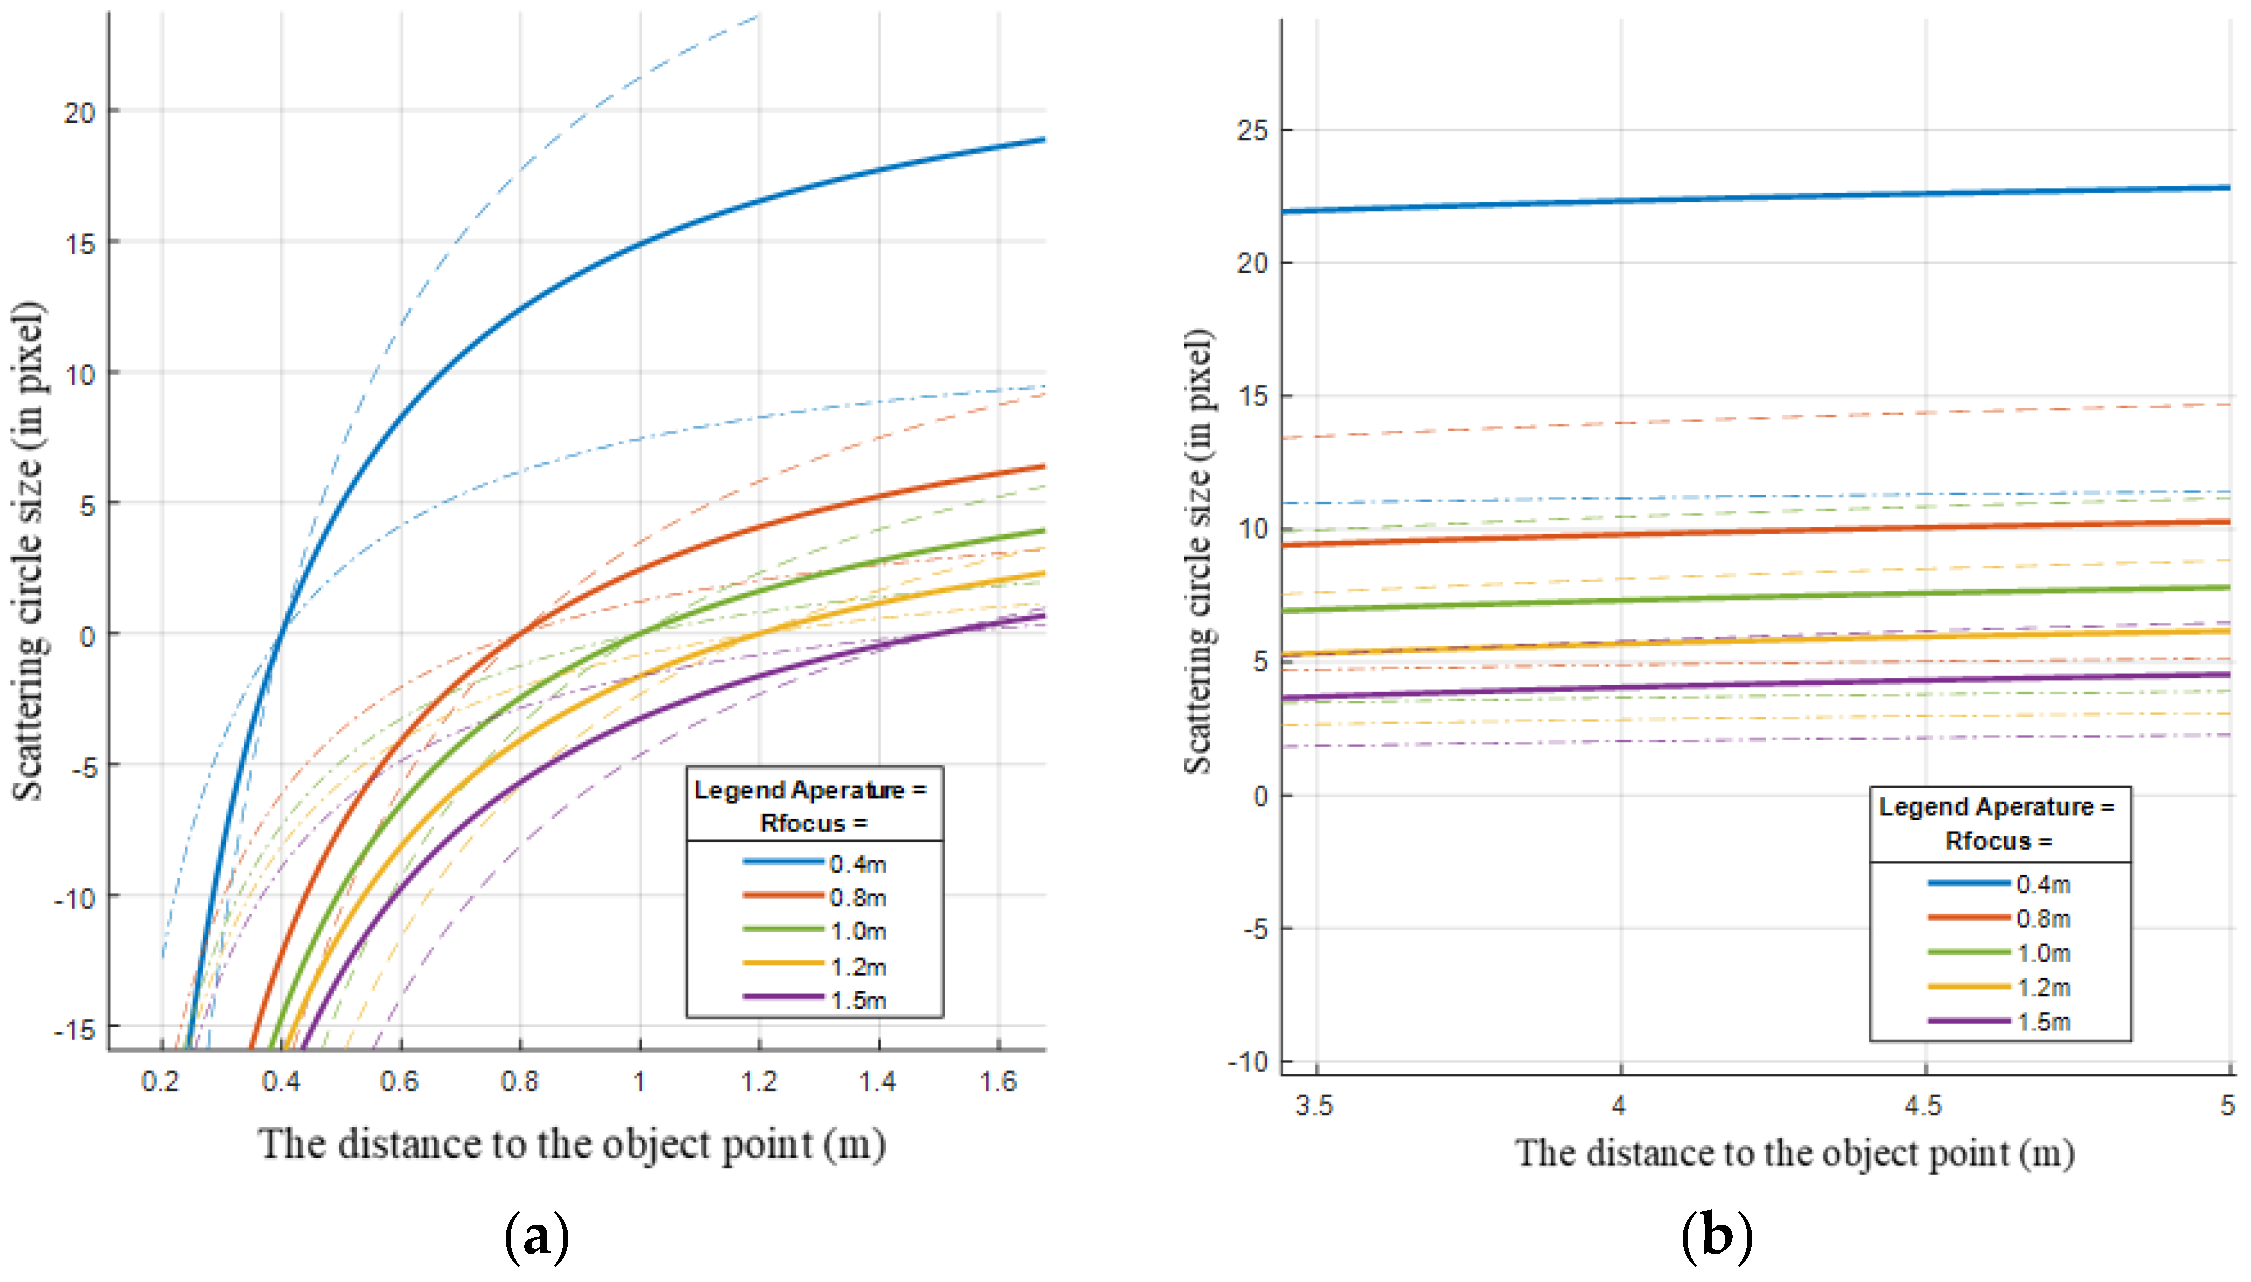
2.2. Camera Lens Issues
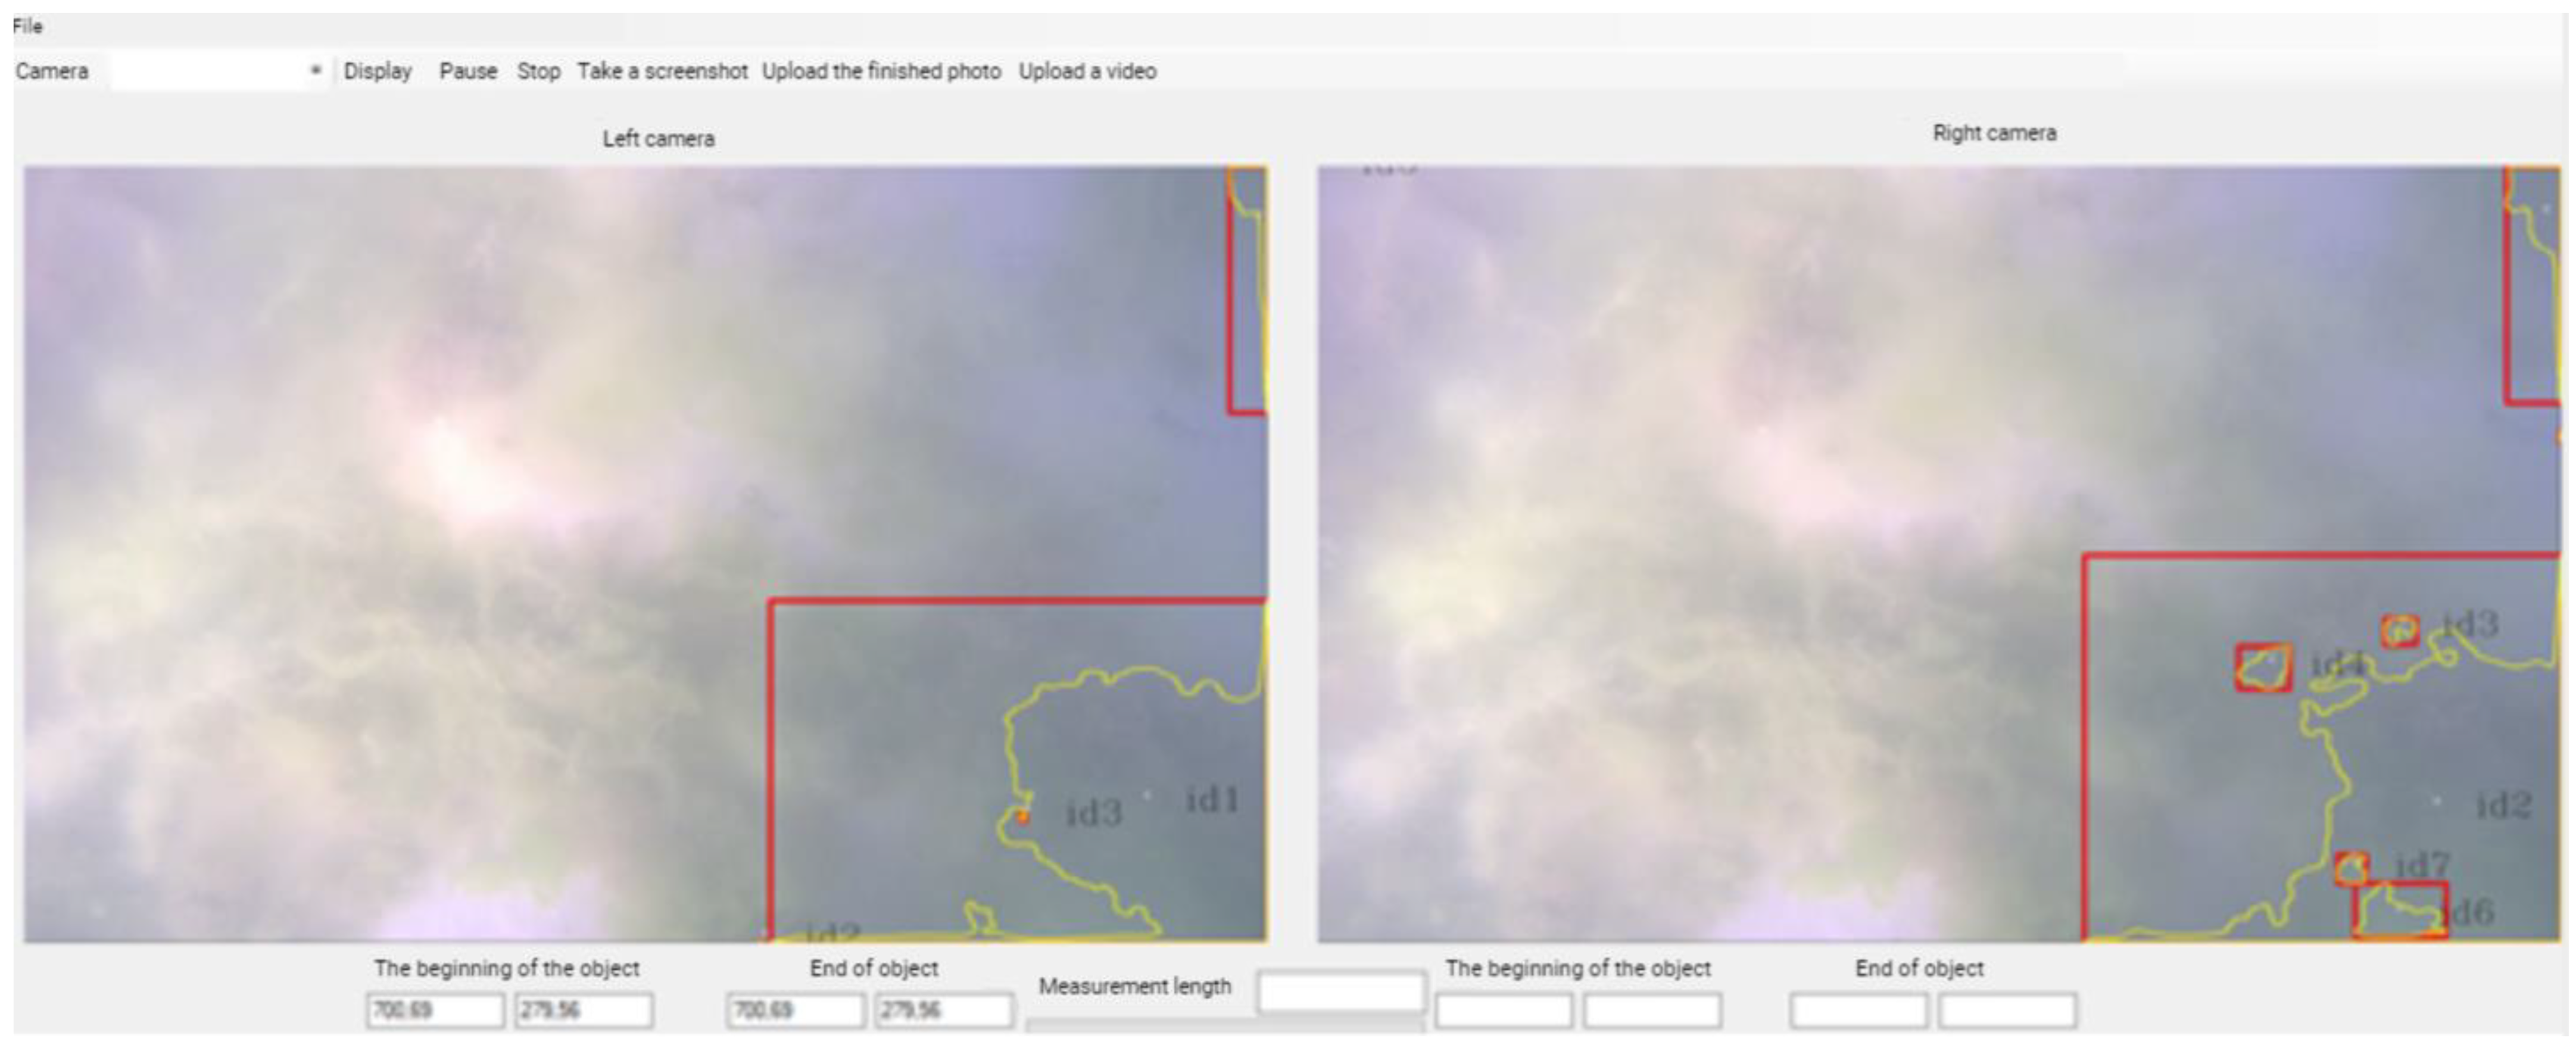
Since the stereo camera is inside a sealed case, the obtained image from cameras is strongly distorted, and it is therefore necessary to adjust the lens parameters beforehand. It is also necessary to recalibrate the stereo camera after changing the parameters of the lens [16]. It is necessary to configure: (a) camera lens parameters (fix aperture size, select focus distance), and (b) camera parameters (shutter speed, light sensitivity). The camera and its lenses must meet the following criteria: a sharp image in the working area; low noise in the image; and acceptable shutter speed for capturing non-fast-moving objects.
The required focusing distance according to the given depth of sharpness is determined by the formula
R = 2 L 1 L 2 L 1 + L 2   ,
where L 1 —selected front (near) depth of field (DOF); L 2 —selected rear (far) DOF.
The working area of the stereo camera lies in the range from 0.5 m to 5 m. Thus, the required focusing distance according to the set limits of the depth of sharpness is equal to R = 0.91   m .
The smallest lens aperture size is required to get the maximum DOF. However, the smallest aperture size allows less light flux due to the lack of light, resulting in noise. As a result, a compromise solution is needed.
The aperture size was chosen on the assumption that the TSS will be used in artificial light conditions. Therefore, for sufficient light passage through the lenses, it is necessary to increase the aperture opening.
Figure 5 shows image blur calculations at different focus distances of 0.4, 0.8, 1.0, 1.2, and 1.5 m, and different aperture sizes of F1.4 (dotted line), F2 (continuous line), and F4 (dashed line).
For the SLAM (Simultaneous Localization and Mapping) and SFM (Structure from Motion) algorithms, the same blur has a greater effect on more distant objects than on closer objects due to the fact that an object of the same size in physical units at long distances has a size in the image in pixels of an order of magnitude smaller than at close distances. That is why it is important to keep a small blur for distant objects.
The graphs show that at a distance of 5 m, an acceptable blur of 5 pixels is achieved at a 1.2 m focus distance with a sufficient aperture area of F2.
The stereo pair camera settings and their lens parameters determined during the research for acceptable operation of the TSS algorithms are given in Table 1.
The aperture and focus distance of the used Lens TS0814-MP F1.4 f8 mm 1′ lenses are manually adjustable. The aperture can be changed from F1.4 to F16, and the focus distance from 0.5 m to ∞. Horizontal and vertical camera viewing angles in the air α u a , α v a , respectively, are determined by the expressions
α u a = 2 a r c t g ( h 2 f ) = 70.23 o , α v a = 2 a r c t g ( v 2 f ) = 47.45 o ,
where u = 11.3 mm, v = 7.1 mm are the horizontal and vertical sensor dimensions, respectively, and f = 8 mm is the focal length for the used camera type.
Ignoring the glass thickness and using Snell’s law we obtain the light refraction at the two media boundary
s i n θ 1 s i n θ 2 = n 1 n 2 = 1.33 ,
where θ 1 is the incidence angle of the light on the glass camera hood interface, θ 2 is the refraction angle of light in the camera hood air environment, n 1 , n 2 is water and air refractive indices, respectively. Expressions for camera viewing angles in water are defined as
α u w = 51.13 o , α v w = 35.14 o ,

2.3. Software

The QBiP-1165G7A single-board computer used in TSS is compatible with Windows 10 (×64) and Linux operating systems. It is assumed that the AUV will perform tasks autonomously and should work without interruption under the CPU load for several dozen hours. Therefore, there is no need to use an operating system aimed at customercentricity. On the contrary, an operating system capable of working without operator intervention and capable of long-term operation without failures is needed.
As mentioned above, Basler matrix cameras are used. Since the Basler Pylon camera software package for Linux ×86 (64-bit) is offered in installation package format for Debian and similar Linux distributions (e.g., Ubuntu) and in tar.gz package for all other Linux distributions, Debian 11 with its low CPU and RAM requirements is chosen as the operating system. Debian consists of an up-to-date Linux kernel with long term support and “free” software components. Together, this makes it possible to use Debian 11 on a PC as the operating platform for the task at hand. The implementation of the algorithm of the developed method for image reconstruction is made in C++ and is intended to be run under the Linux operating system. The program supports an interactive user interface with the ability to visually display the processed video stream from the cameras with the ability to visually demonstrate the detected objects (Figure 6). Processing is carried out for each frame coming from the cameras. In order to unload computing power, the object is first searched by the contour method in 2D, and then the 3D coordinates are searched in the found area.
Video frames and object search criteria are passed as input data for the main module. The output data is an array of data, the coordinates of the contour of the found object, the distance to the object, and its geometric shape. Auxiliary functions are used to detect an object:
  • Mat preprocessing (Mat frame, Scalar LowScalar, Scalar HScalar)—the input parameter of the function is the image obtained from the cameras and the search criteria for the desired object by color. As output parameters, the function returns the processed image, which will be used for further object searches.
  • void FindContrur (Mat frame, Mat src, Mat& drawing, Point2f[]& rect_points)—the input parameter of the function is the processed image obtained from the preprocessing function. The output parameter of the function is an array that contains the coordinates of the rectangle in which the found object is inscribed. In addition, the function returns an image with a contour applied to the found object.
  • void FindPointADS (int limit_points, int metod_Disparity, vector <bool> metod_ImagePerProcessing)—the following function was written to build a depth map, where limit_points are restrictions on the number of points, metod_Disparity is a method for constructing a depth map, and metod_ImagePerProcessing is a method for preprocessing images.
The following libraries were used:
-
Pylon (pylon SDK) is a library for Basler cameras, which contains a set of tools for working with any Basler camera for programming languages C, C++ on a PC with Windows operating system, Linux.
-
OpenCV (Open Source Computer Vision Library) is an open source library of computer vision algorithms, image processing, and general purpose numerical algorithms. It is implemented in C/C++.
-
Armadillo is a linear algebra library for the C++ programming language, which aims to provide efficient and optimized basic computing while at the same time having a simple and user-friendly interface.
The application is distributed with a set of necessary libraries, so no additional configuration of the environment is required for the correct operation of the application.

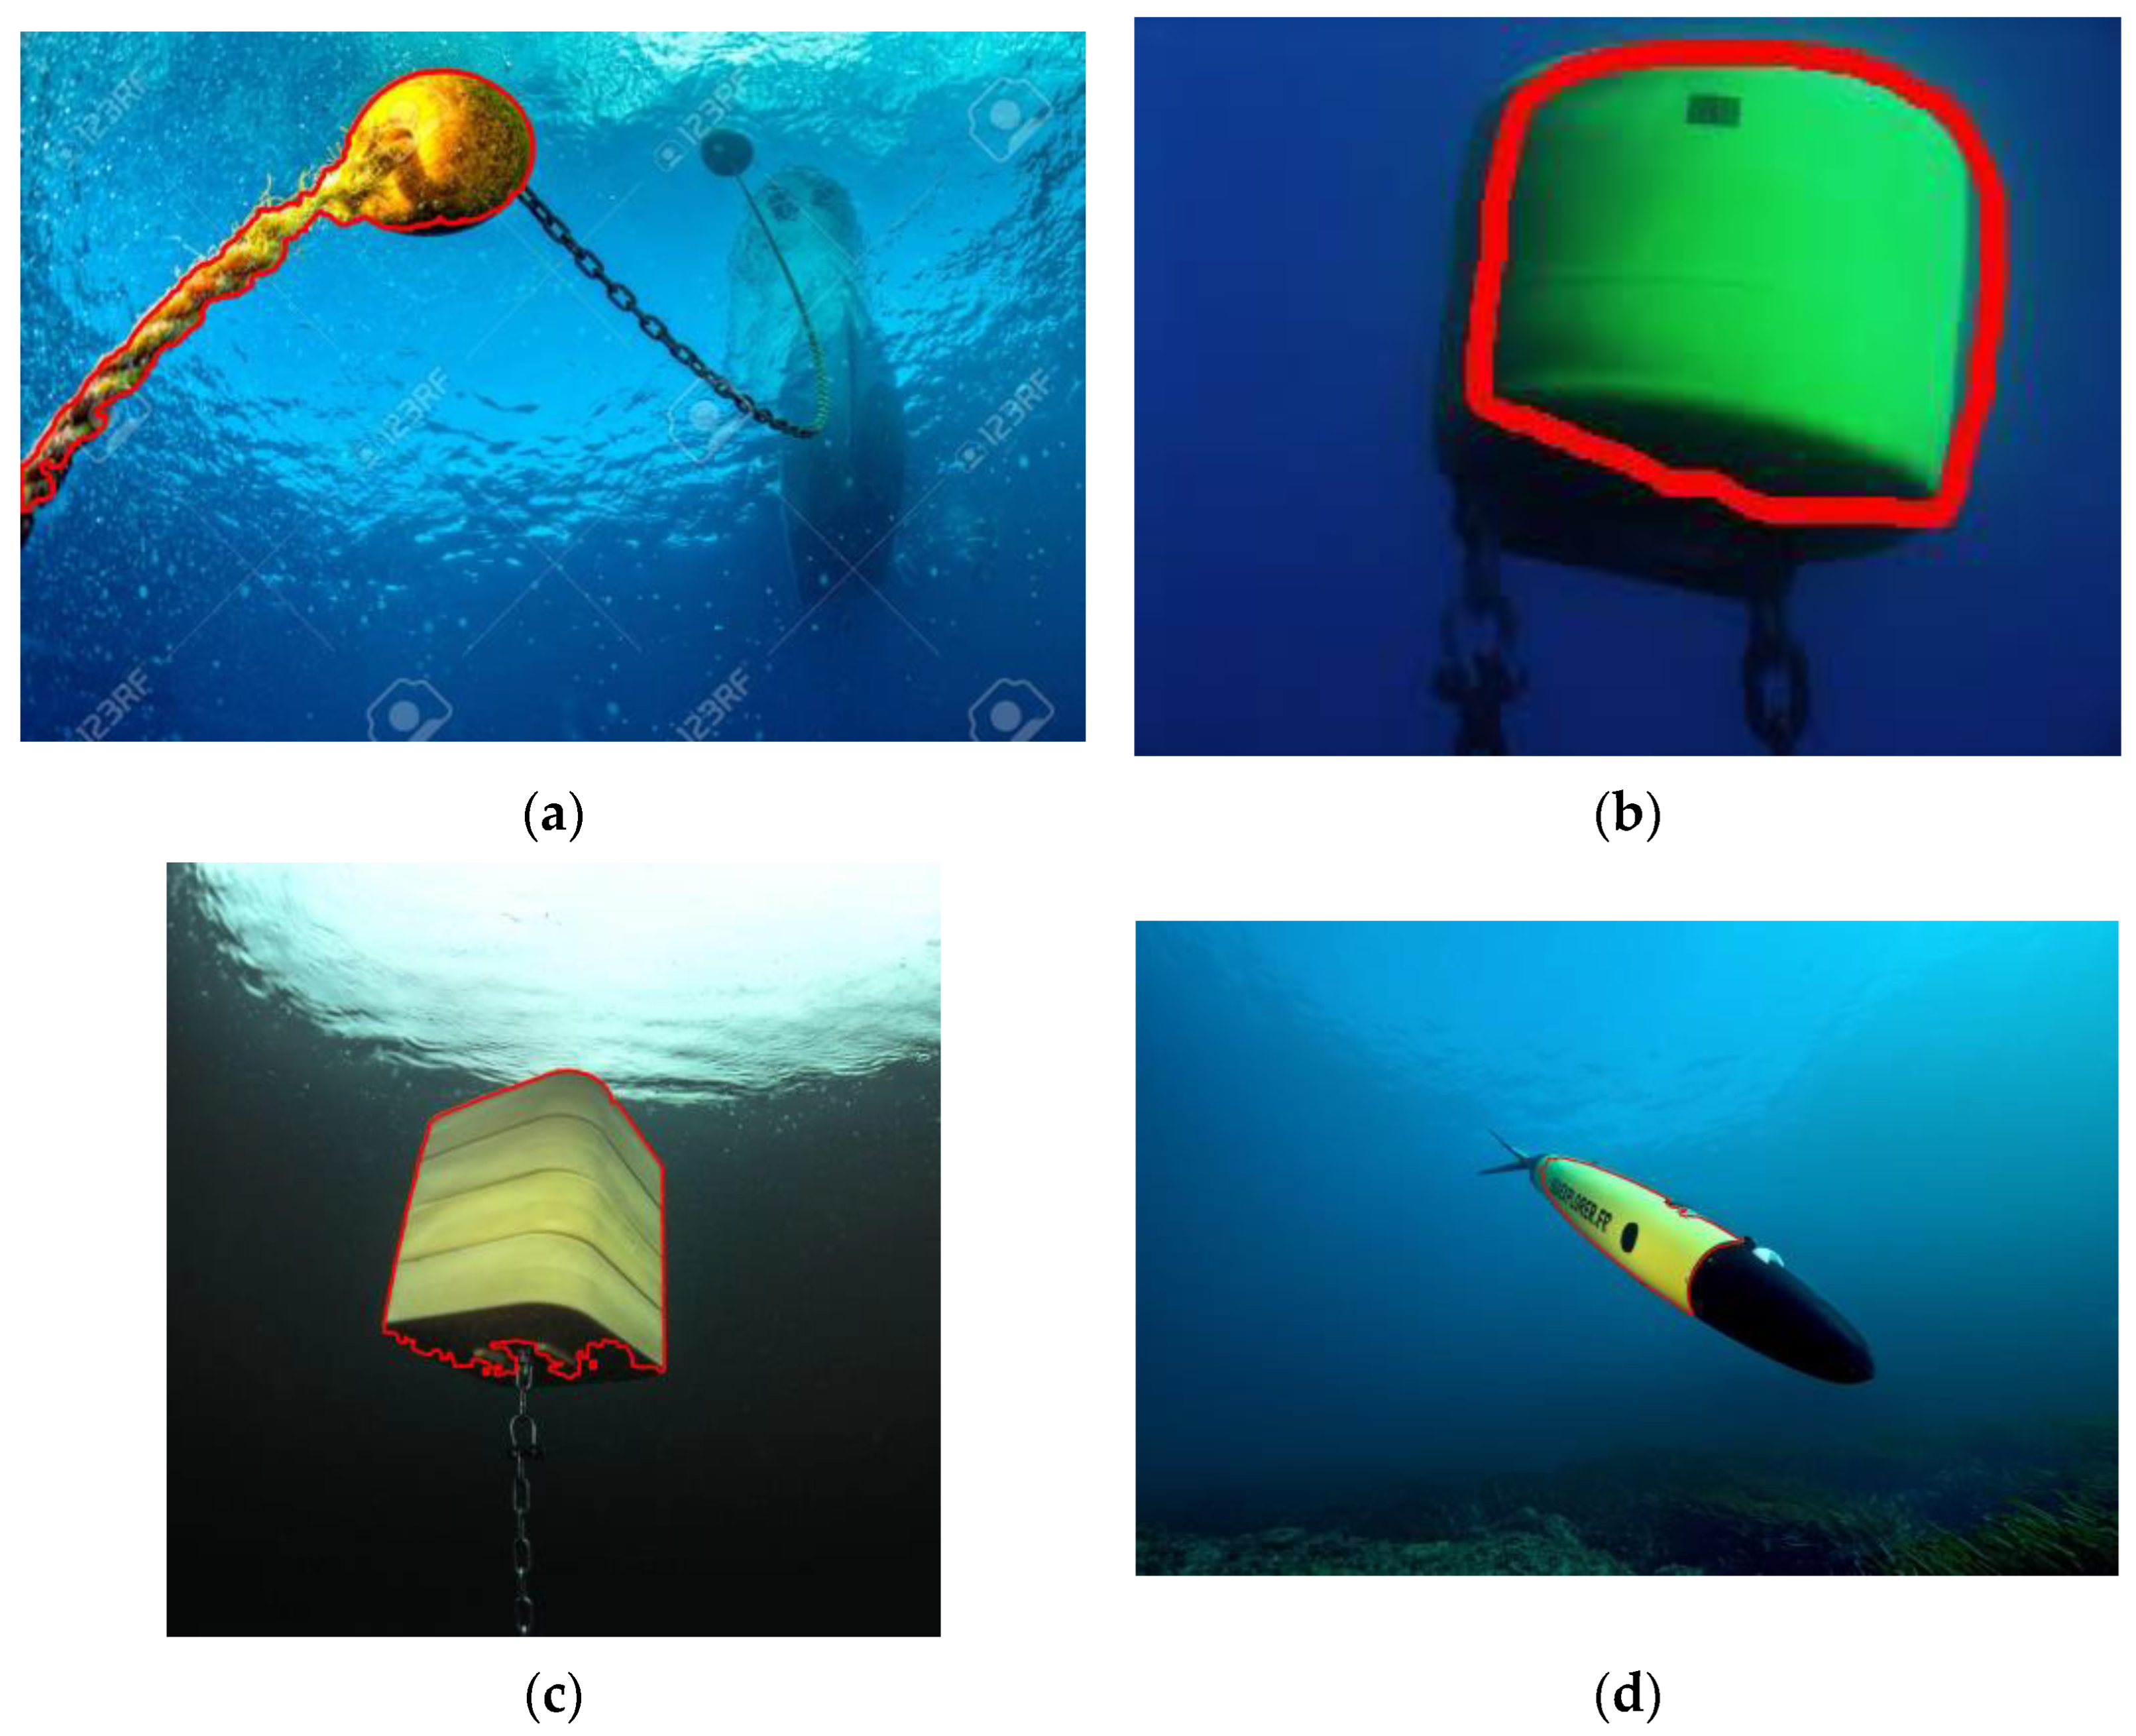
3. Detecting an Object in the Aquatic Environment

Briefly, the program algorithm for detecting an object in the aquatic environment can be described as follows. Two synchronous frames with a frequency of 15 Hz, defining a stereo image, are sent to the program input. A three-dimensional model of the working space is constructed. The image is processed in such a way as to remove noise and irregularity of lighting in order to make the object and its boundaries more obvious. Then the object is detected. Its characteristics are determined, and a frame with the selected object on the image is recorded. In the algorithm steps described above, the need to perform stereo camera calibration in an aquatic environment and to search for appropriate key points on a stereo pair in limited visibility conditions as well as uneven color reproduction, unnatural colors, background with complex texture and a lot of details, and the presence of various non-target objects that fit the distinguishing features may all cause difficulties. The main program quality indicators are operation stability, operation speed (15 Hz), and the detection of all object characteristics with an acceptable accuracy.

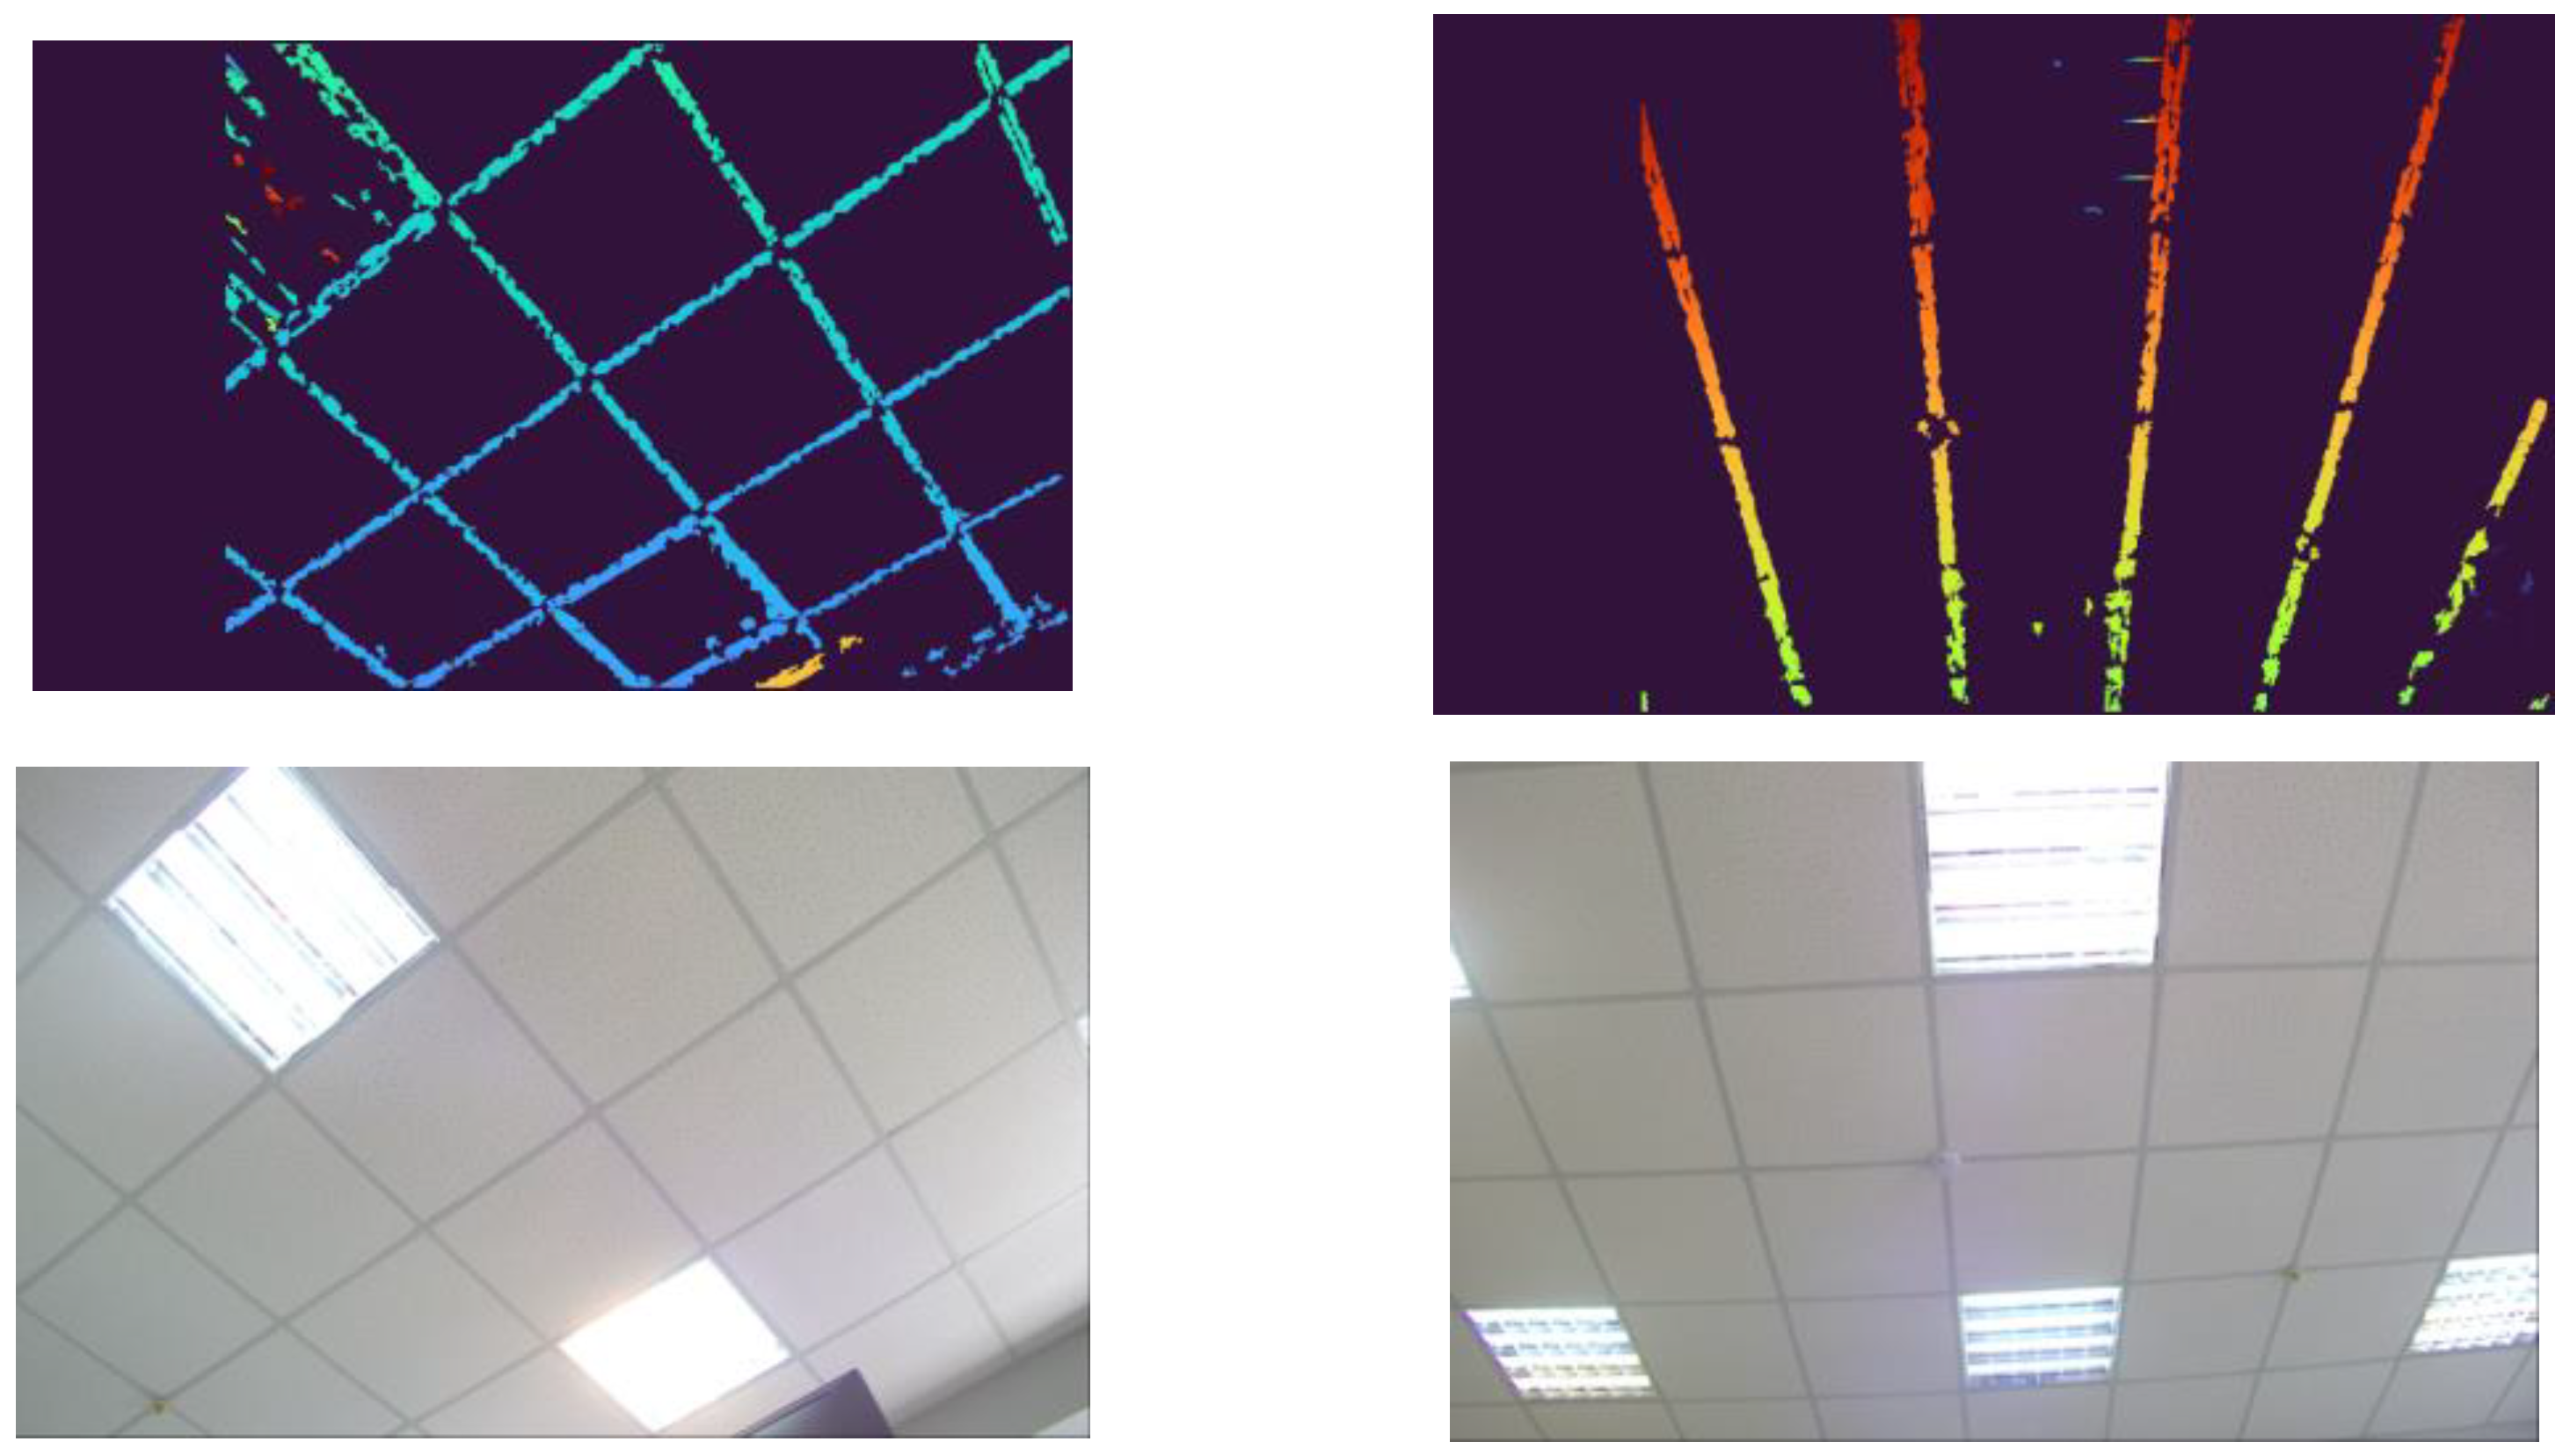
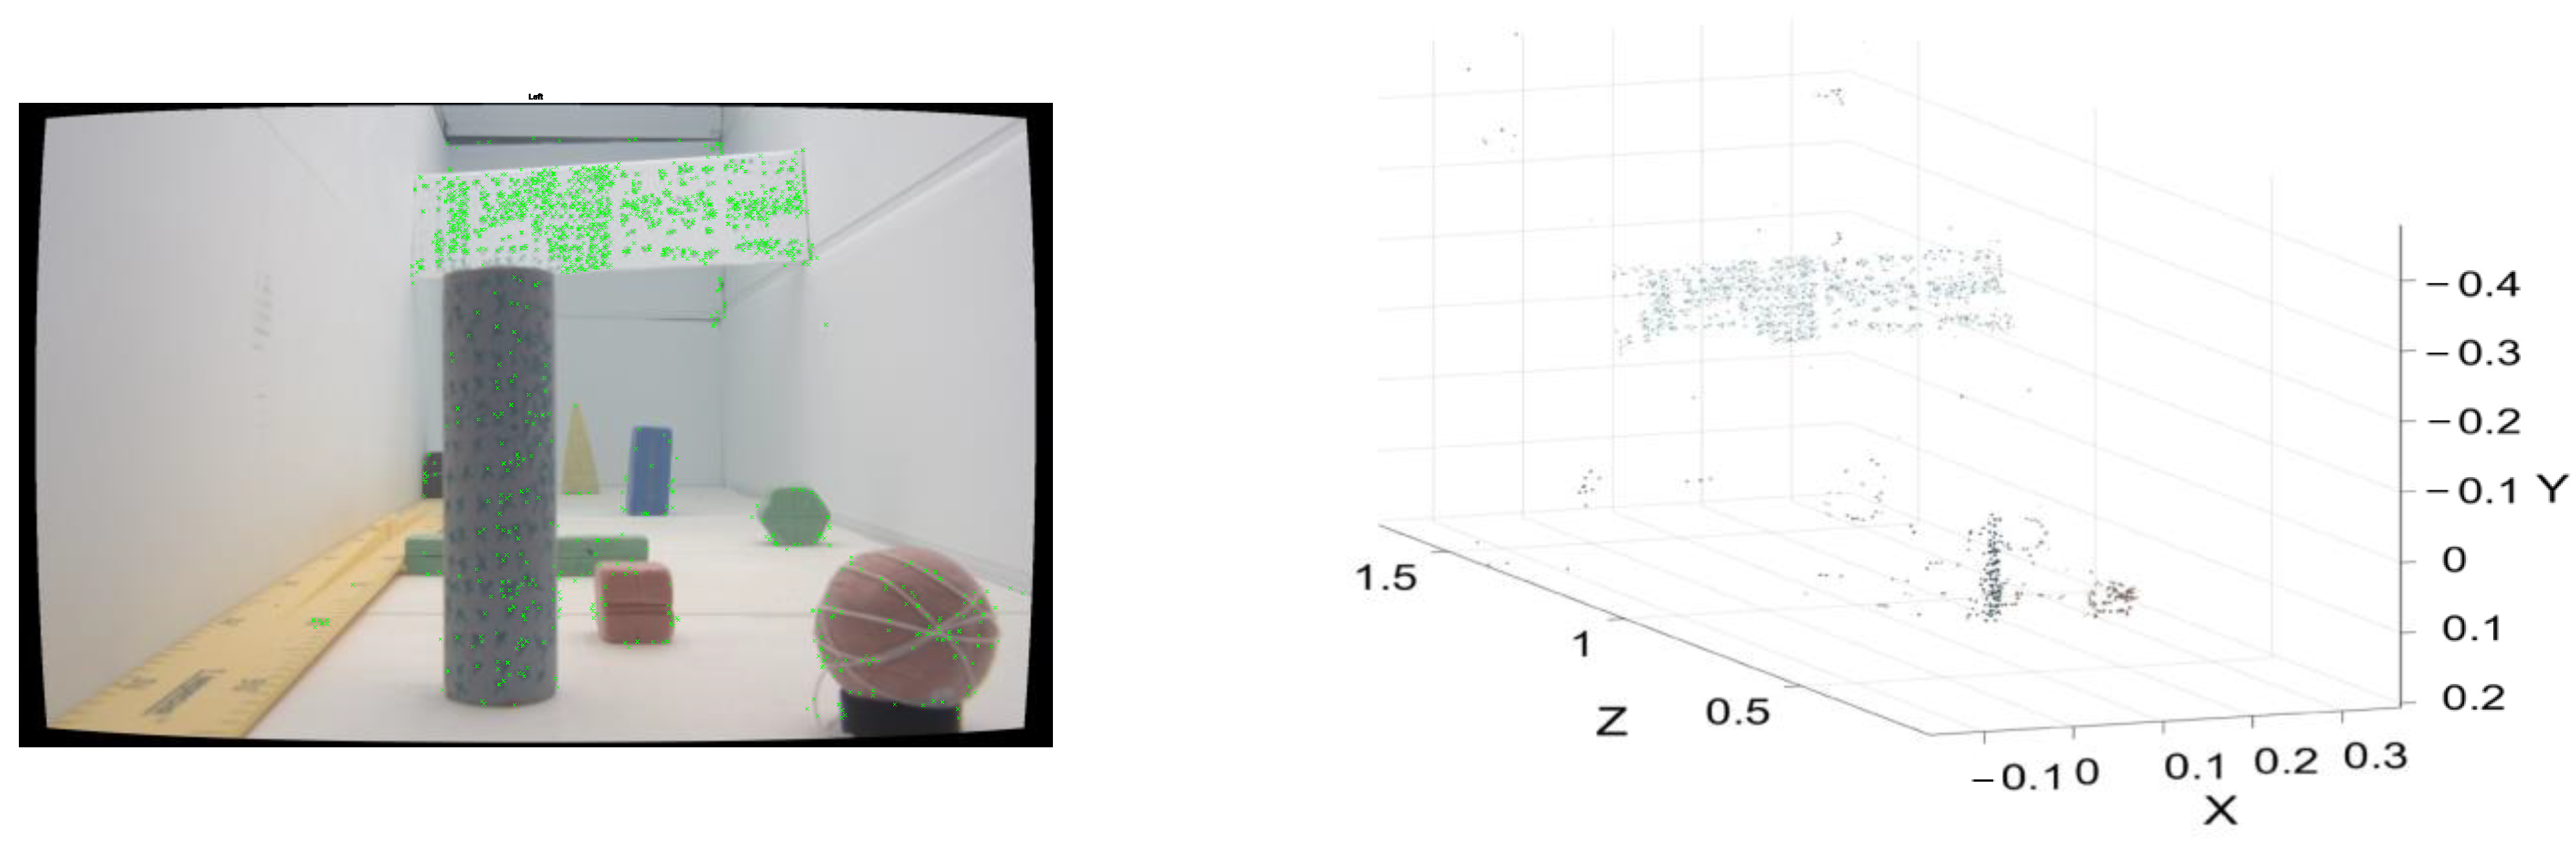
3.1. The 3D Point Cloud Method for Object Extraction

3.1.1. The 3D Search Algorithm for Stereo Images

The stereo pair (left and right stereo camera images) is used as input data in the developed 3D points search algorithm. The output data will be spatial coordinates of detected points belonging to 3D objects.
The 3D point search algorithm has the following sequence of operations: (1) preprocessing [17], removing distortion and rectifying the stereo pair; (2) constructing the disparity map; (3) reconstructing the 3D scene from the disparity map; and (4) selecting the workspace area in the reconstructed area based on the position and dimensions of the workspace (screening out the points that go beyond the workspace area).
The basic idea of the 3D point search algorithm [17] is that for each 2D point in one image, a pair of 2D points in another image is searched. The matched pair of 2D points in the images corresponds to a 3D point in space. Knowing the coordinates of the 2D point pair in the image, the coordinates of the corresponding 3D point in three-dimensional space are determined using the triangulation method.
For the 2D point in the first camera image, the paired 2D point in the second camera image lies on the epipolar line. To simplify the search, the images are aligned by rectification so that all epipolar lines are parallel to the image sides in the horizontal direction. Thus, for each 2D point, its corresponding paired 2D point should be searched in the same line on the image from the second camera.
After image rectification, the corresponding point pairs are searched for. As a result, a disparity map is obtained, which contains information in the form of a matrix with the size corresponding to the left camera image rectification, containing in each matrix element the offset between the corresponding pixels of the left and right stereo camera images. The disparity map is used to obtain a depth map—an image that stores the corresponding 3D point coordinates for each first camera image pixel, instead of color.
The disadvantage of the 3D point search algorithm is that the disparity value is reliably determined only in places of rapid brightness change, which entails the errors in dealing with complex scenes. For example, during work with homogeneous objects, when large areas in the object image have approximately equal brightness value for all pixels included in them and areas with almost infinite range. In such a case, brightness-based methods for finding the response function minimum may consider extremely small differences and determine arbitrary range values. The depth map turns out to be largely noisy and sparse. This is the case when processing scenes with, for example, a flat wall, an object shadow, an object with uniform coloring and few characteristic details, and horizontal brightness difference lines that are parallel to the epipolar lines.
Figure 7 shows an example of the used 3D point search algorithm disadvantage. The algorithm does not detect points belonging to horizontal brightness difference lines, which are parallel to the epipolar lines.

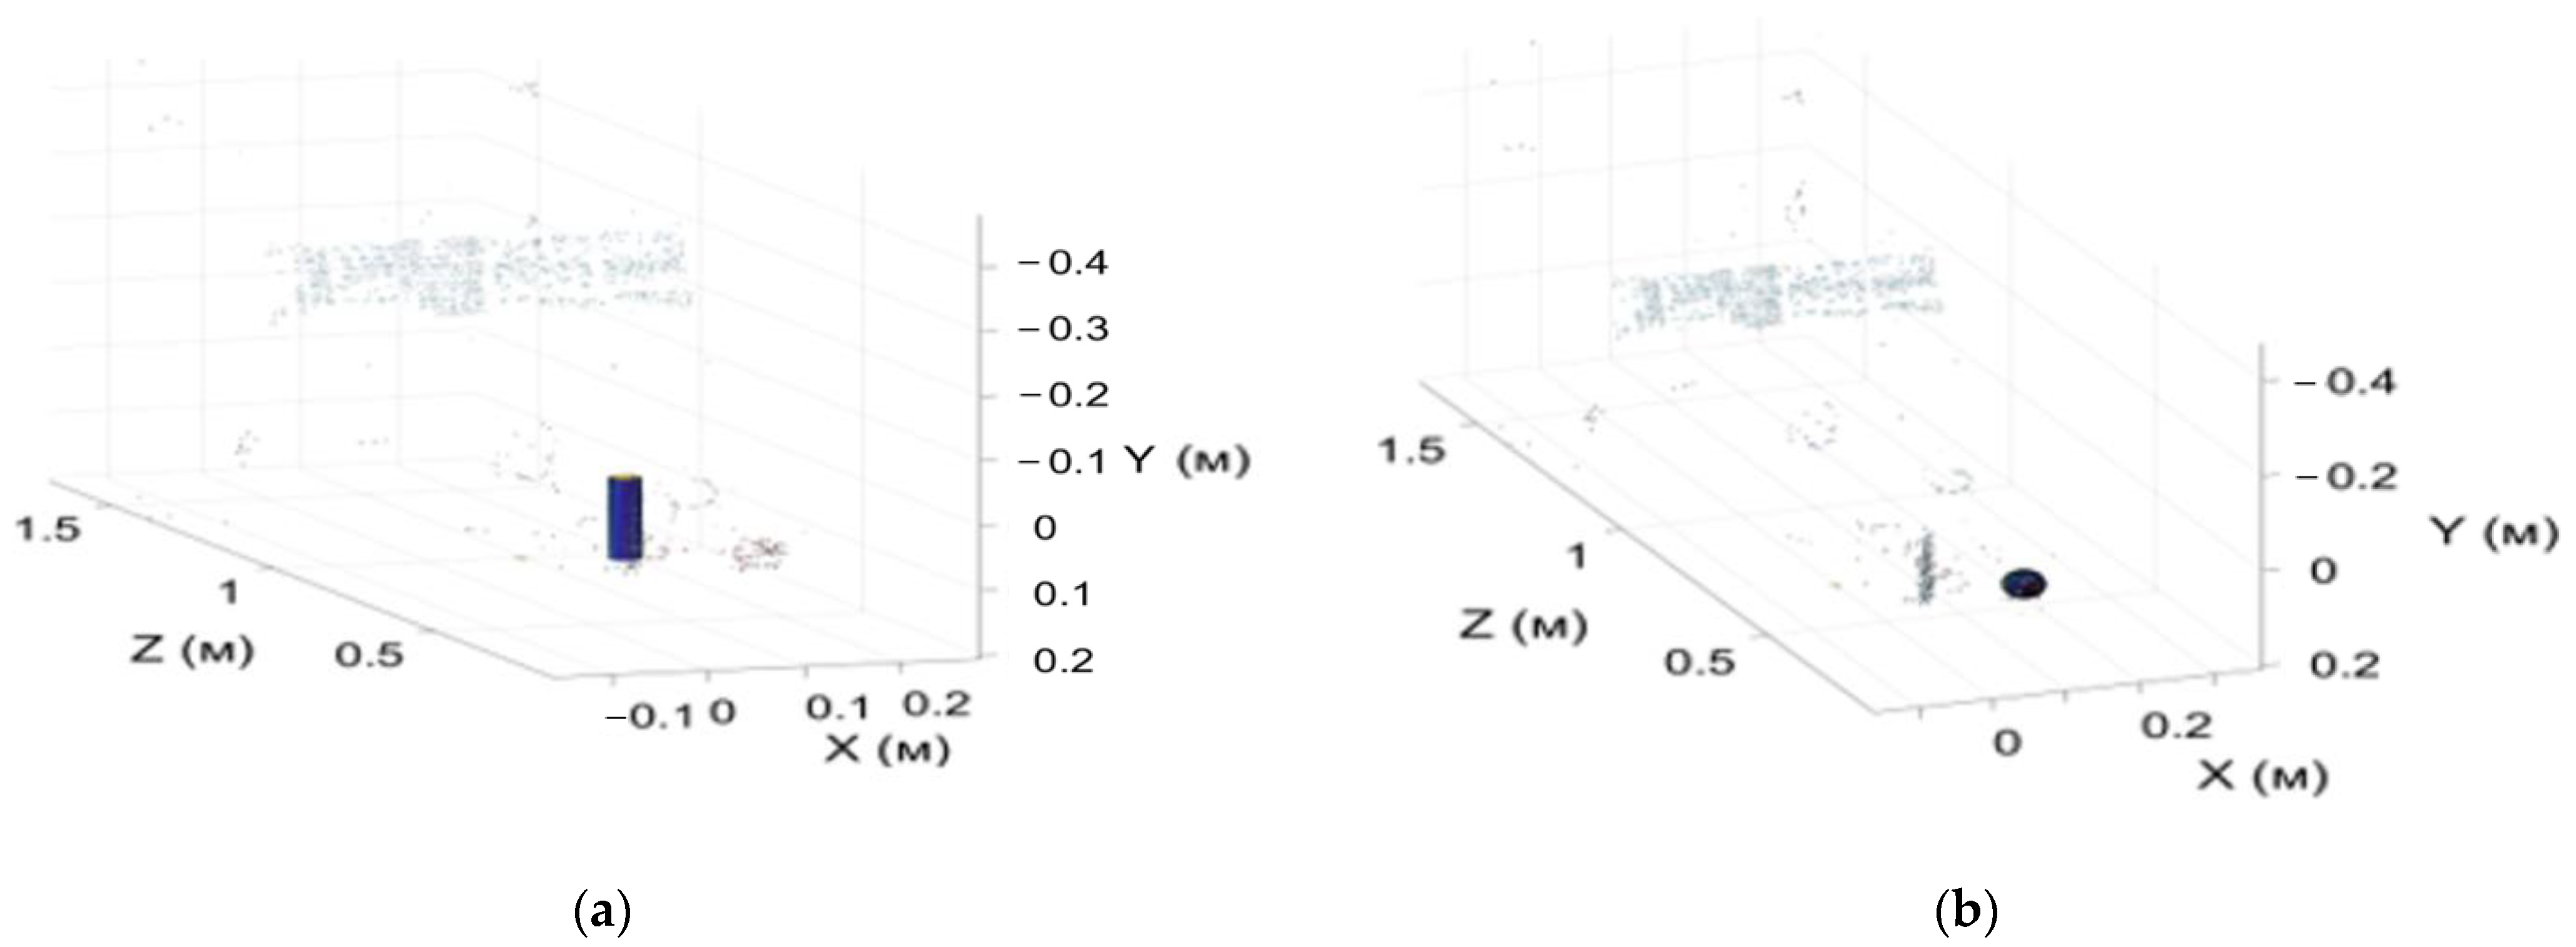
3.1.2. D Point Cloud Clustering Algorithms
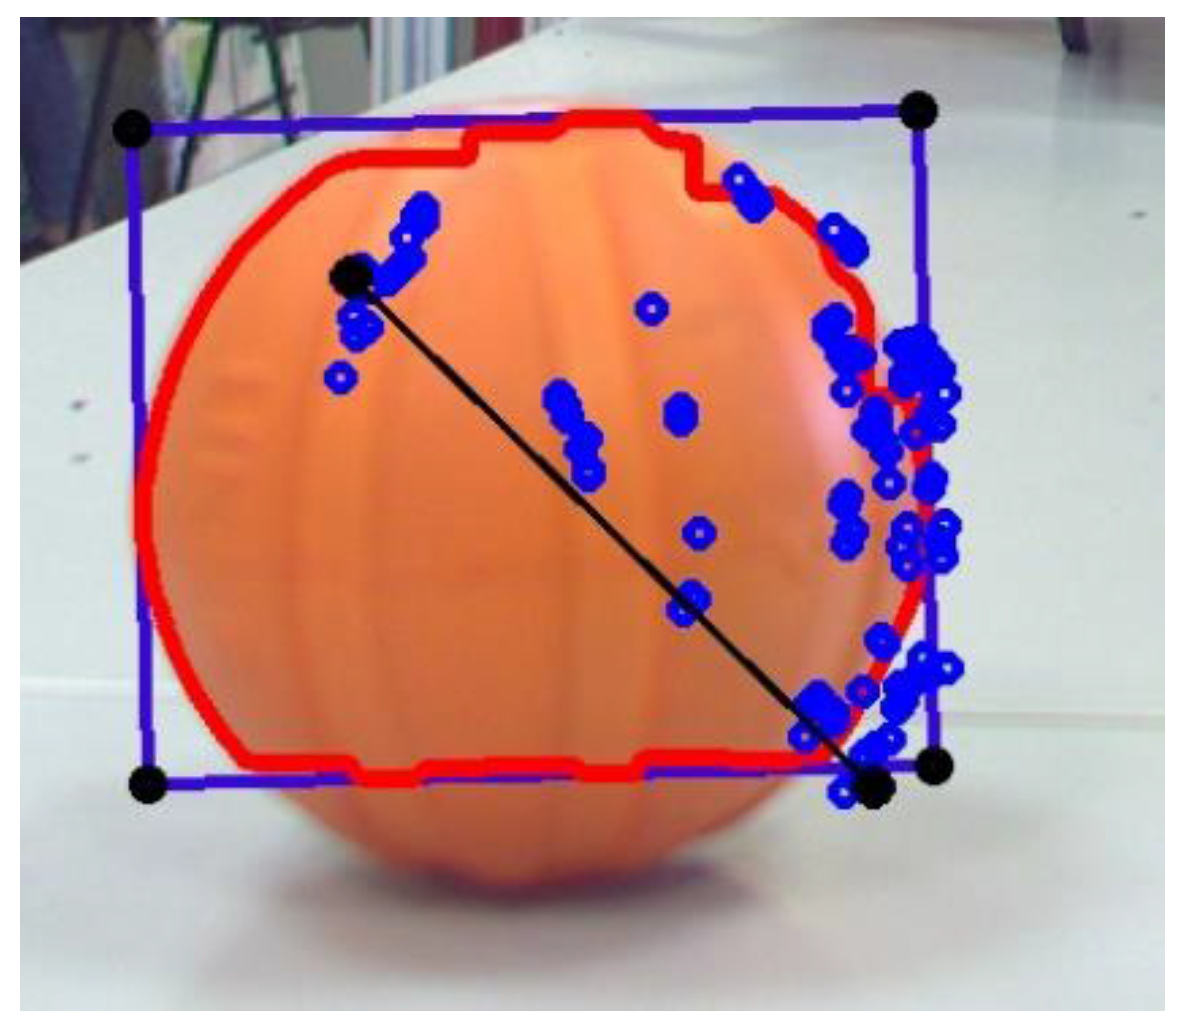
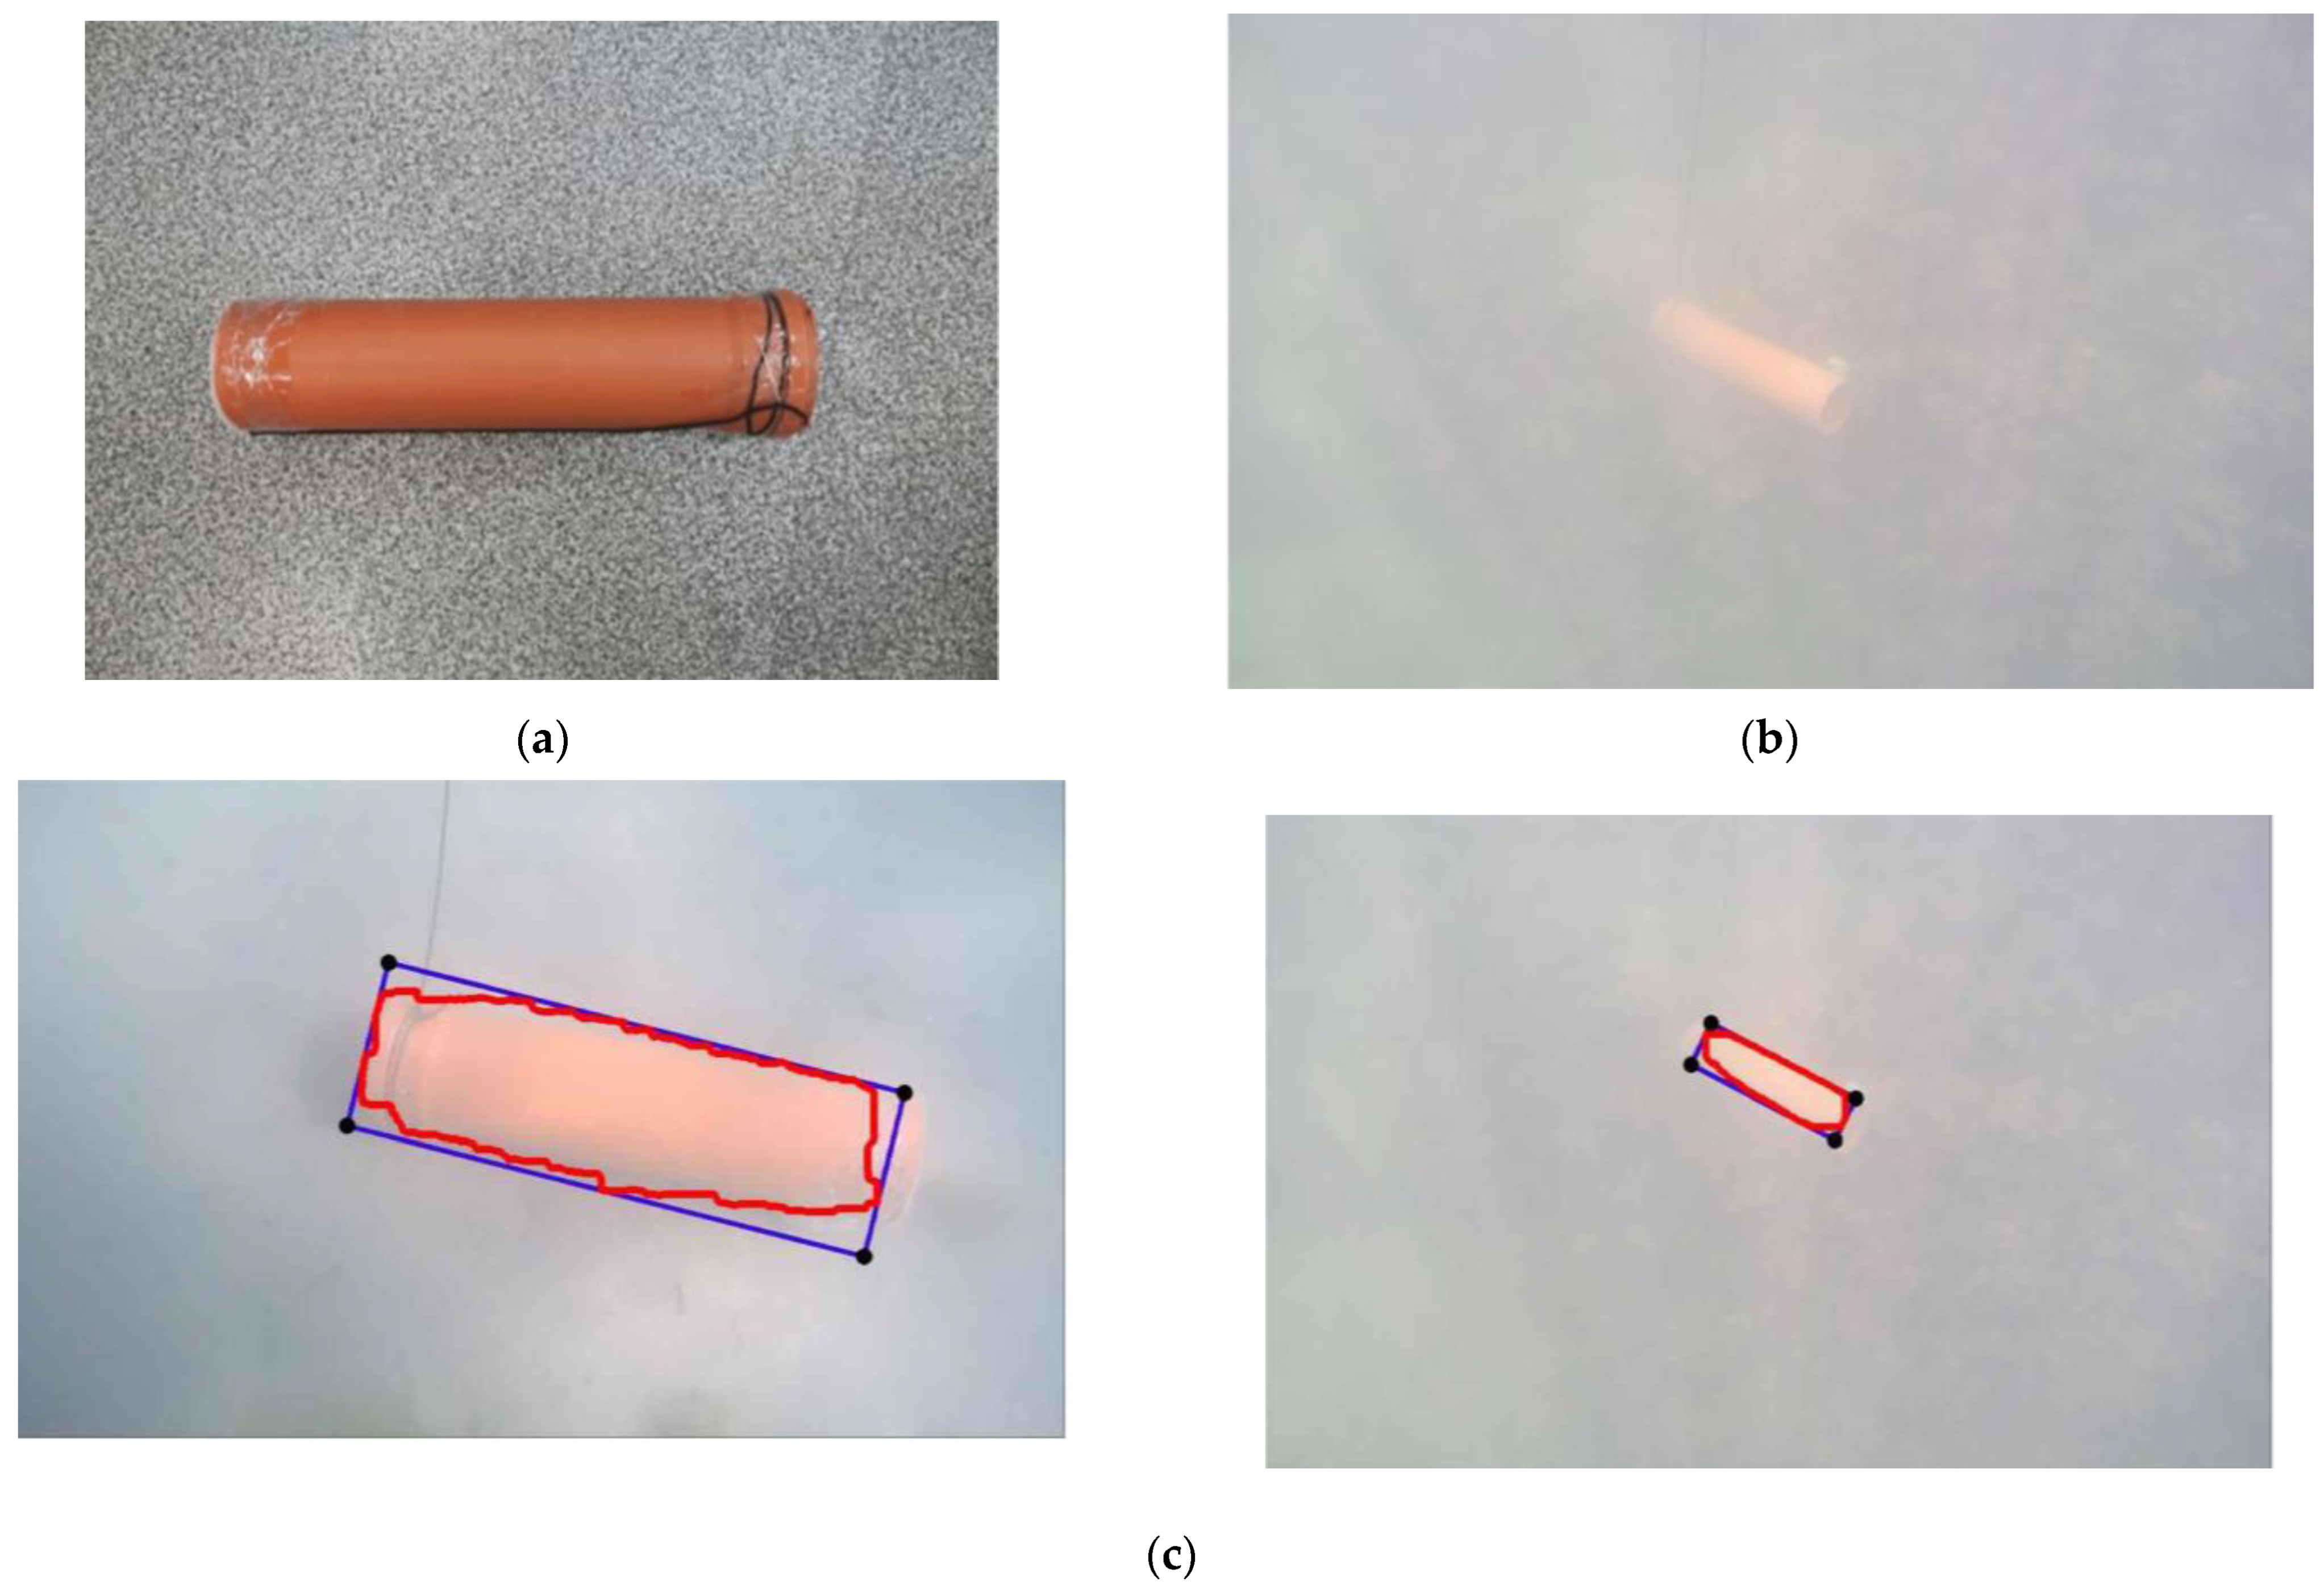
After finding the 3D point cloud, the 3D point search algorithm uses the clustering algorithm to select individual objects. The clustering algorithm allows the operator to divide the single array of points into separate clusters. It is assumed that cluster points belong to a particular object or its part. Working with point clusters (groups) allows the operator to select only objects of interest in the image.
The software implementation uses the DBSCAN (Density Based Spatial Clustering of Applications with Noise) clustering algorithm [18]. The inputs are X p o i n t s —spatial coordinates of detected points belonging to three-dimensional objects. The output is C p o i n t s —a structure consisting of vectors whose number is equal to the number of clusters found. Each vector contains point numbers belonging to the corresponding cluster: spatial cluster center coordinates and rectangular image area coordinates, highlighting the object on the left stereo pair image.

3.2. Contour Method

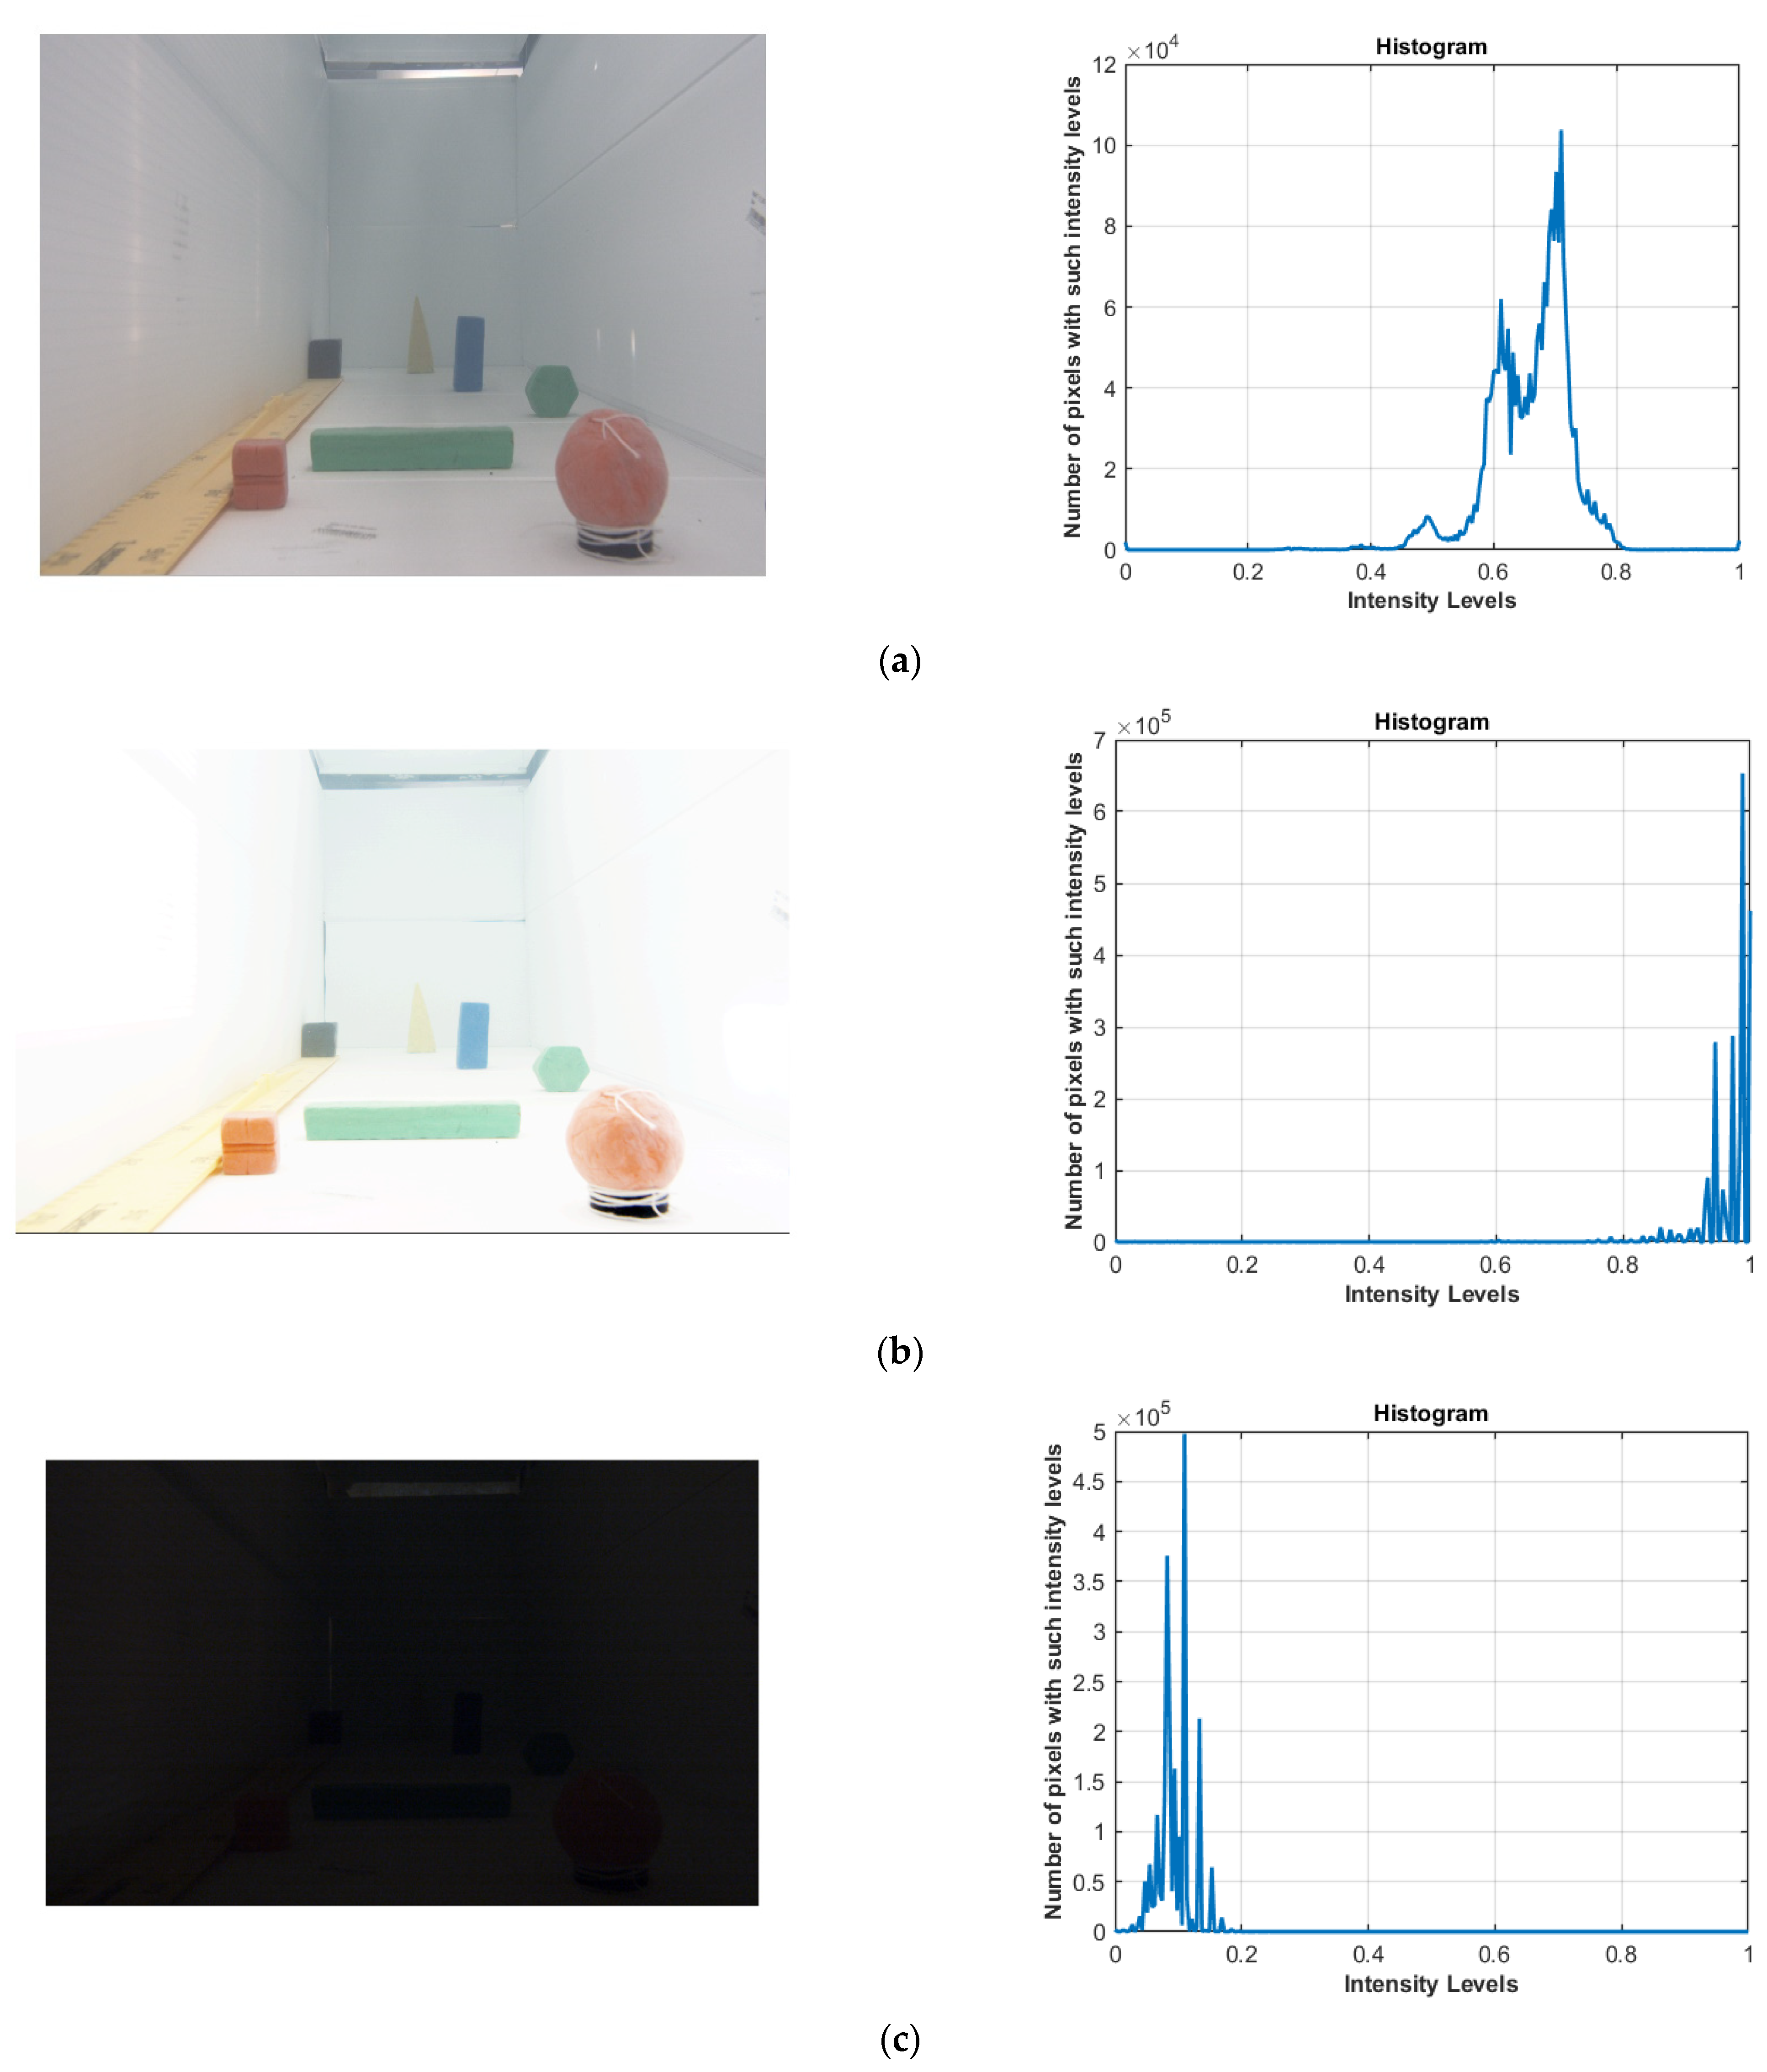
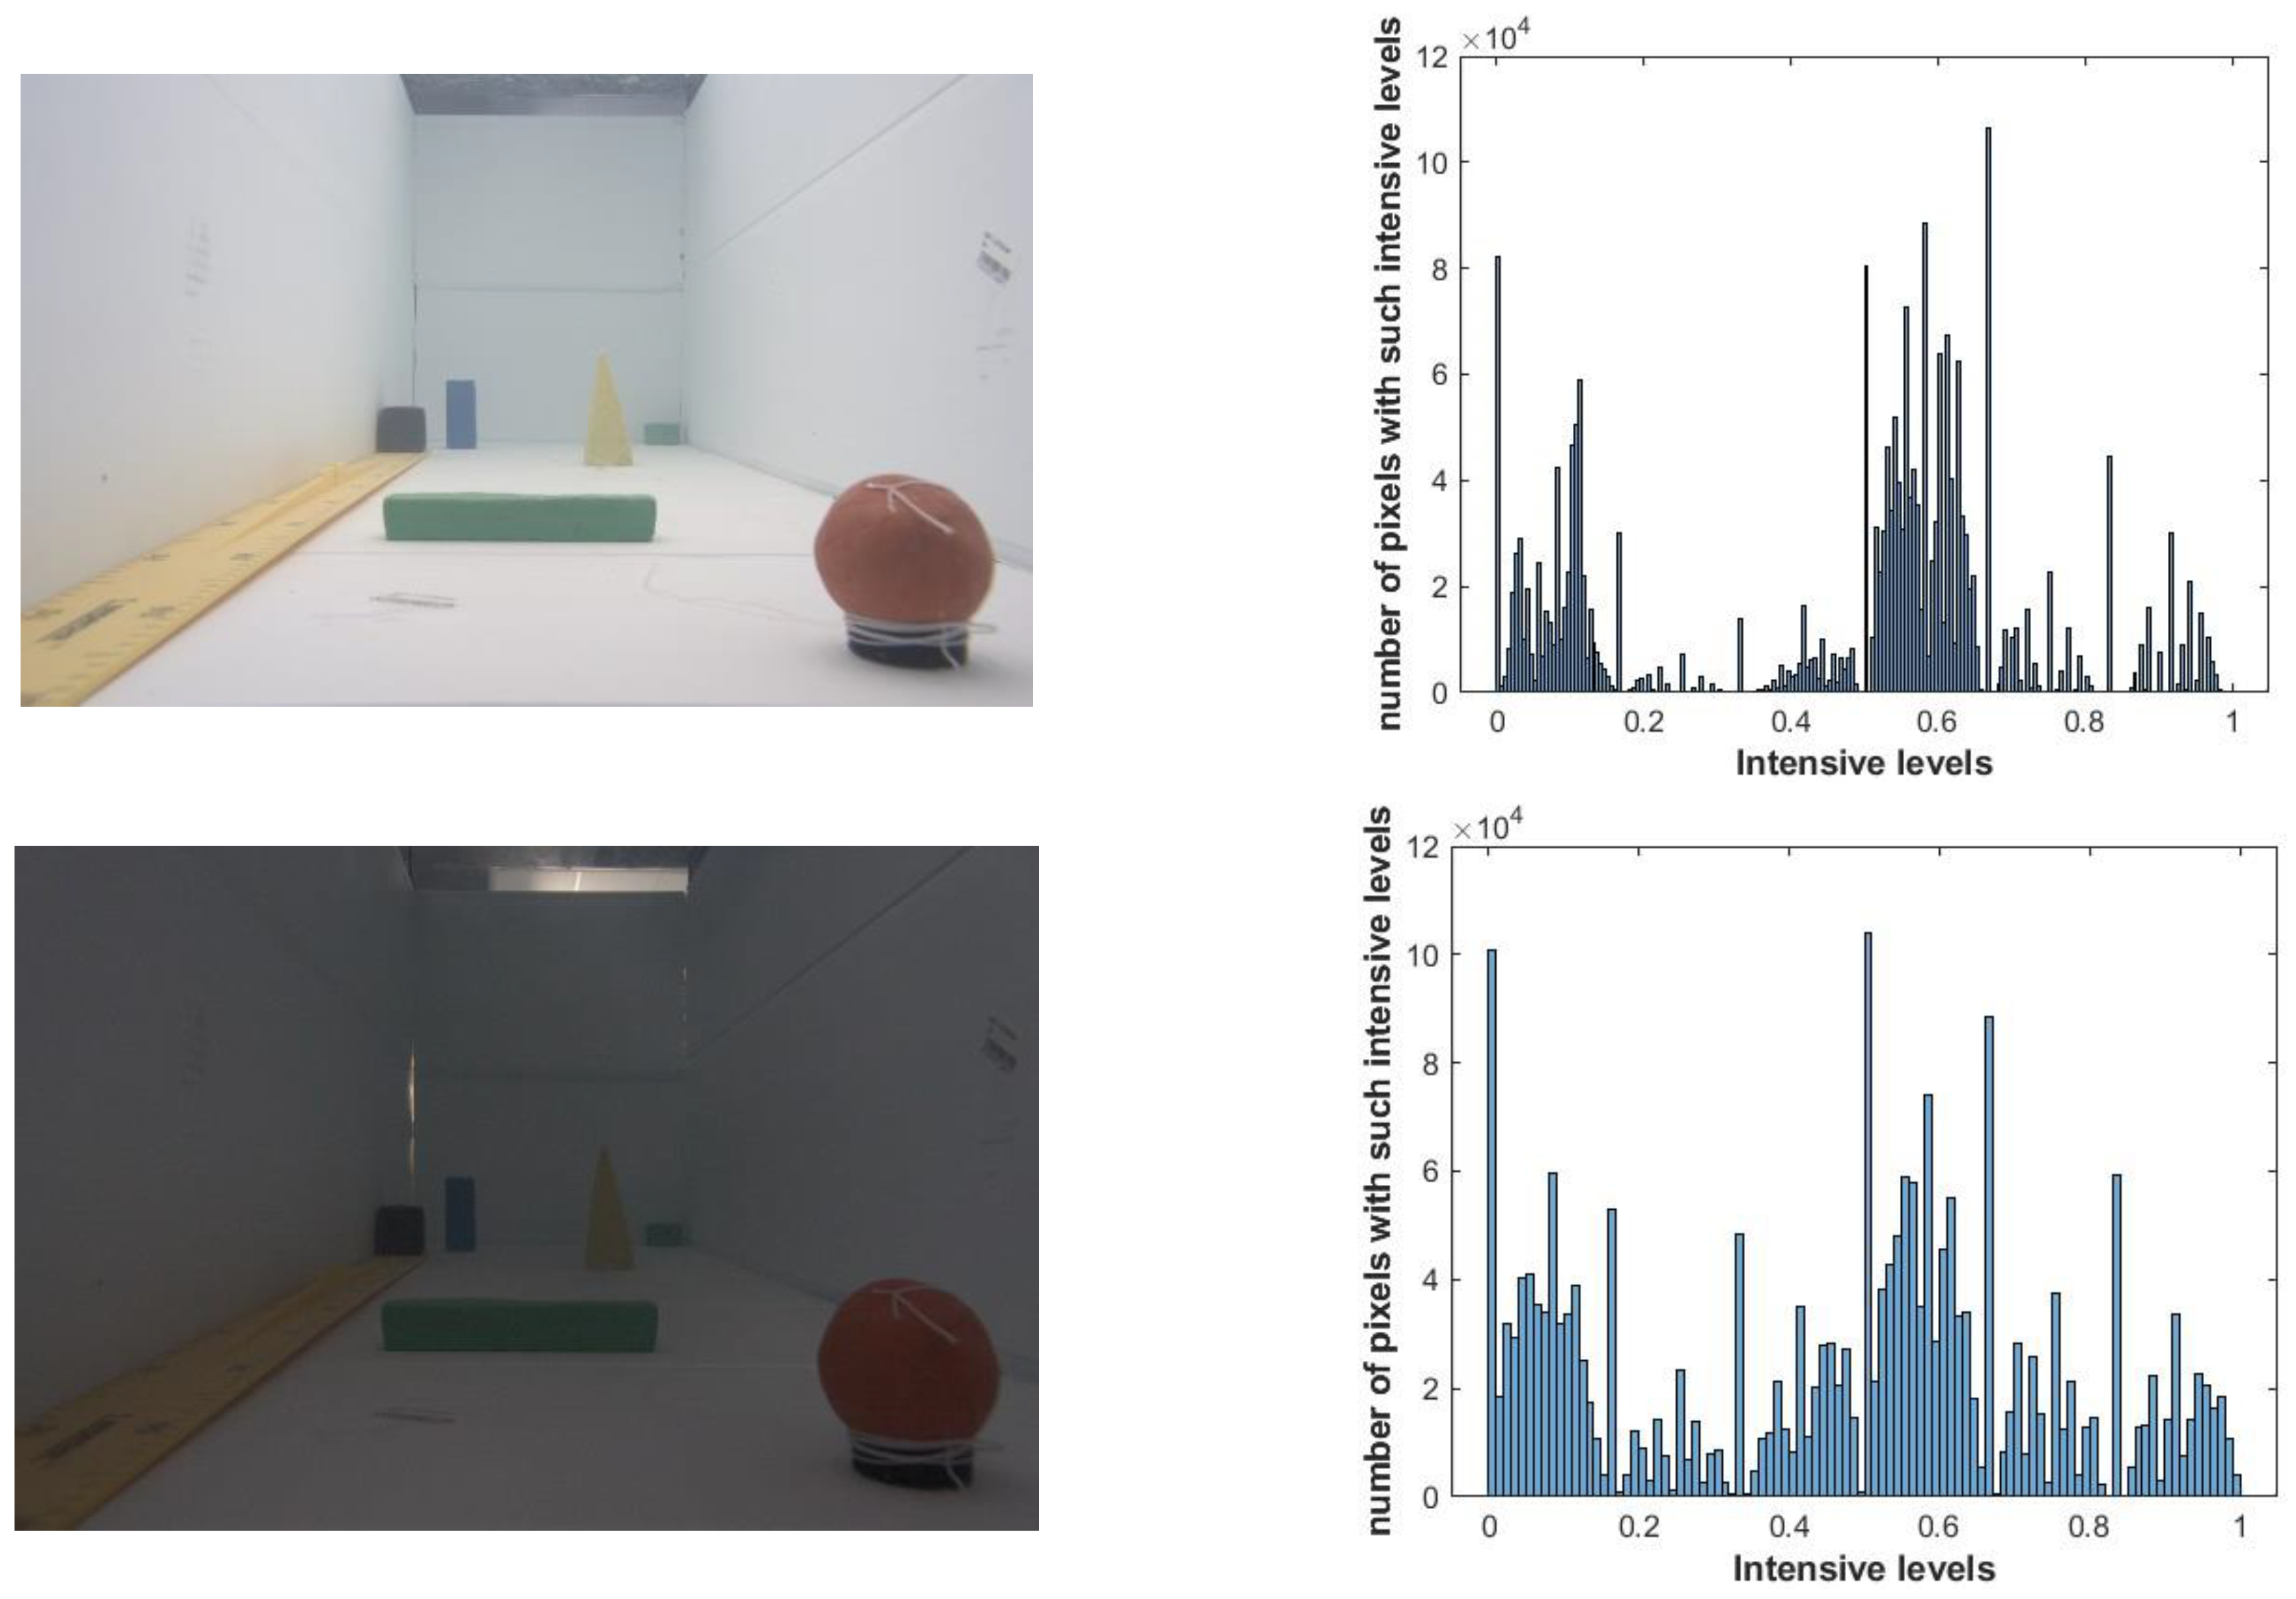
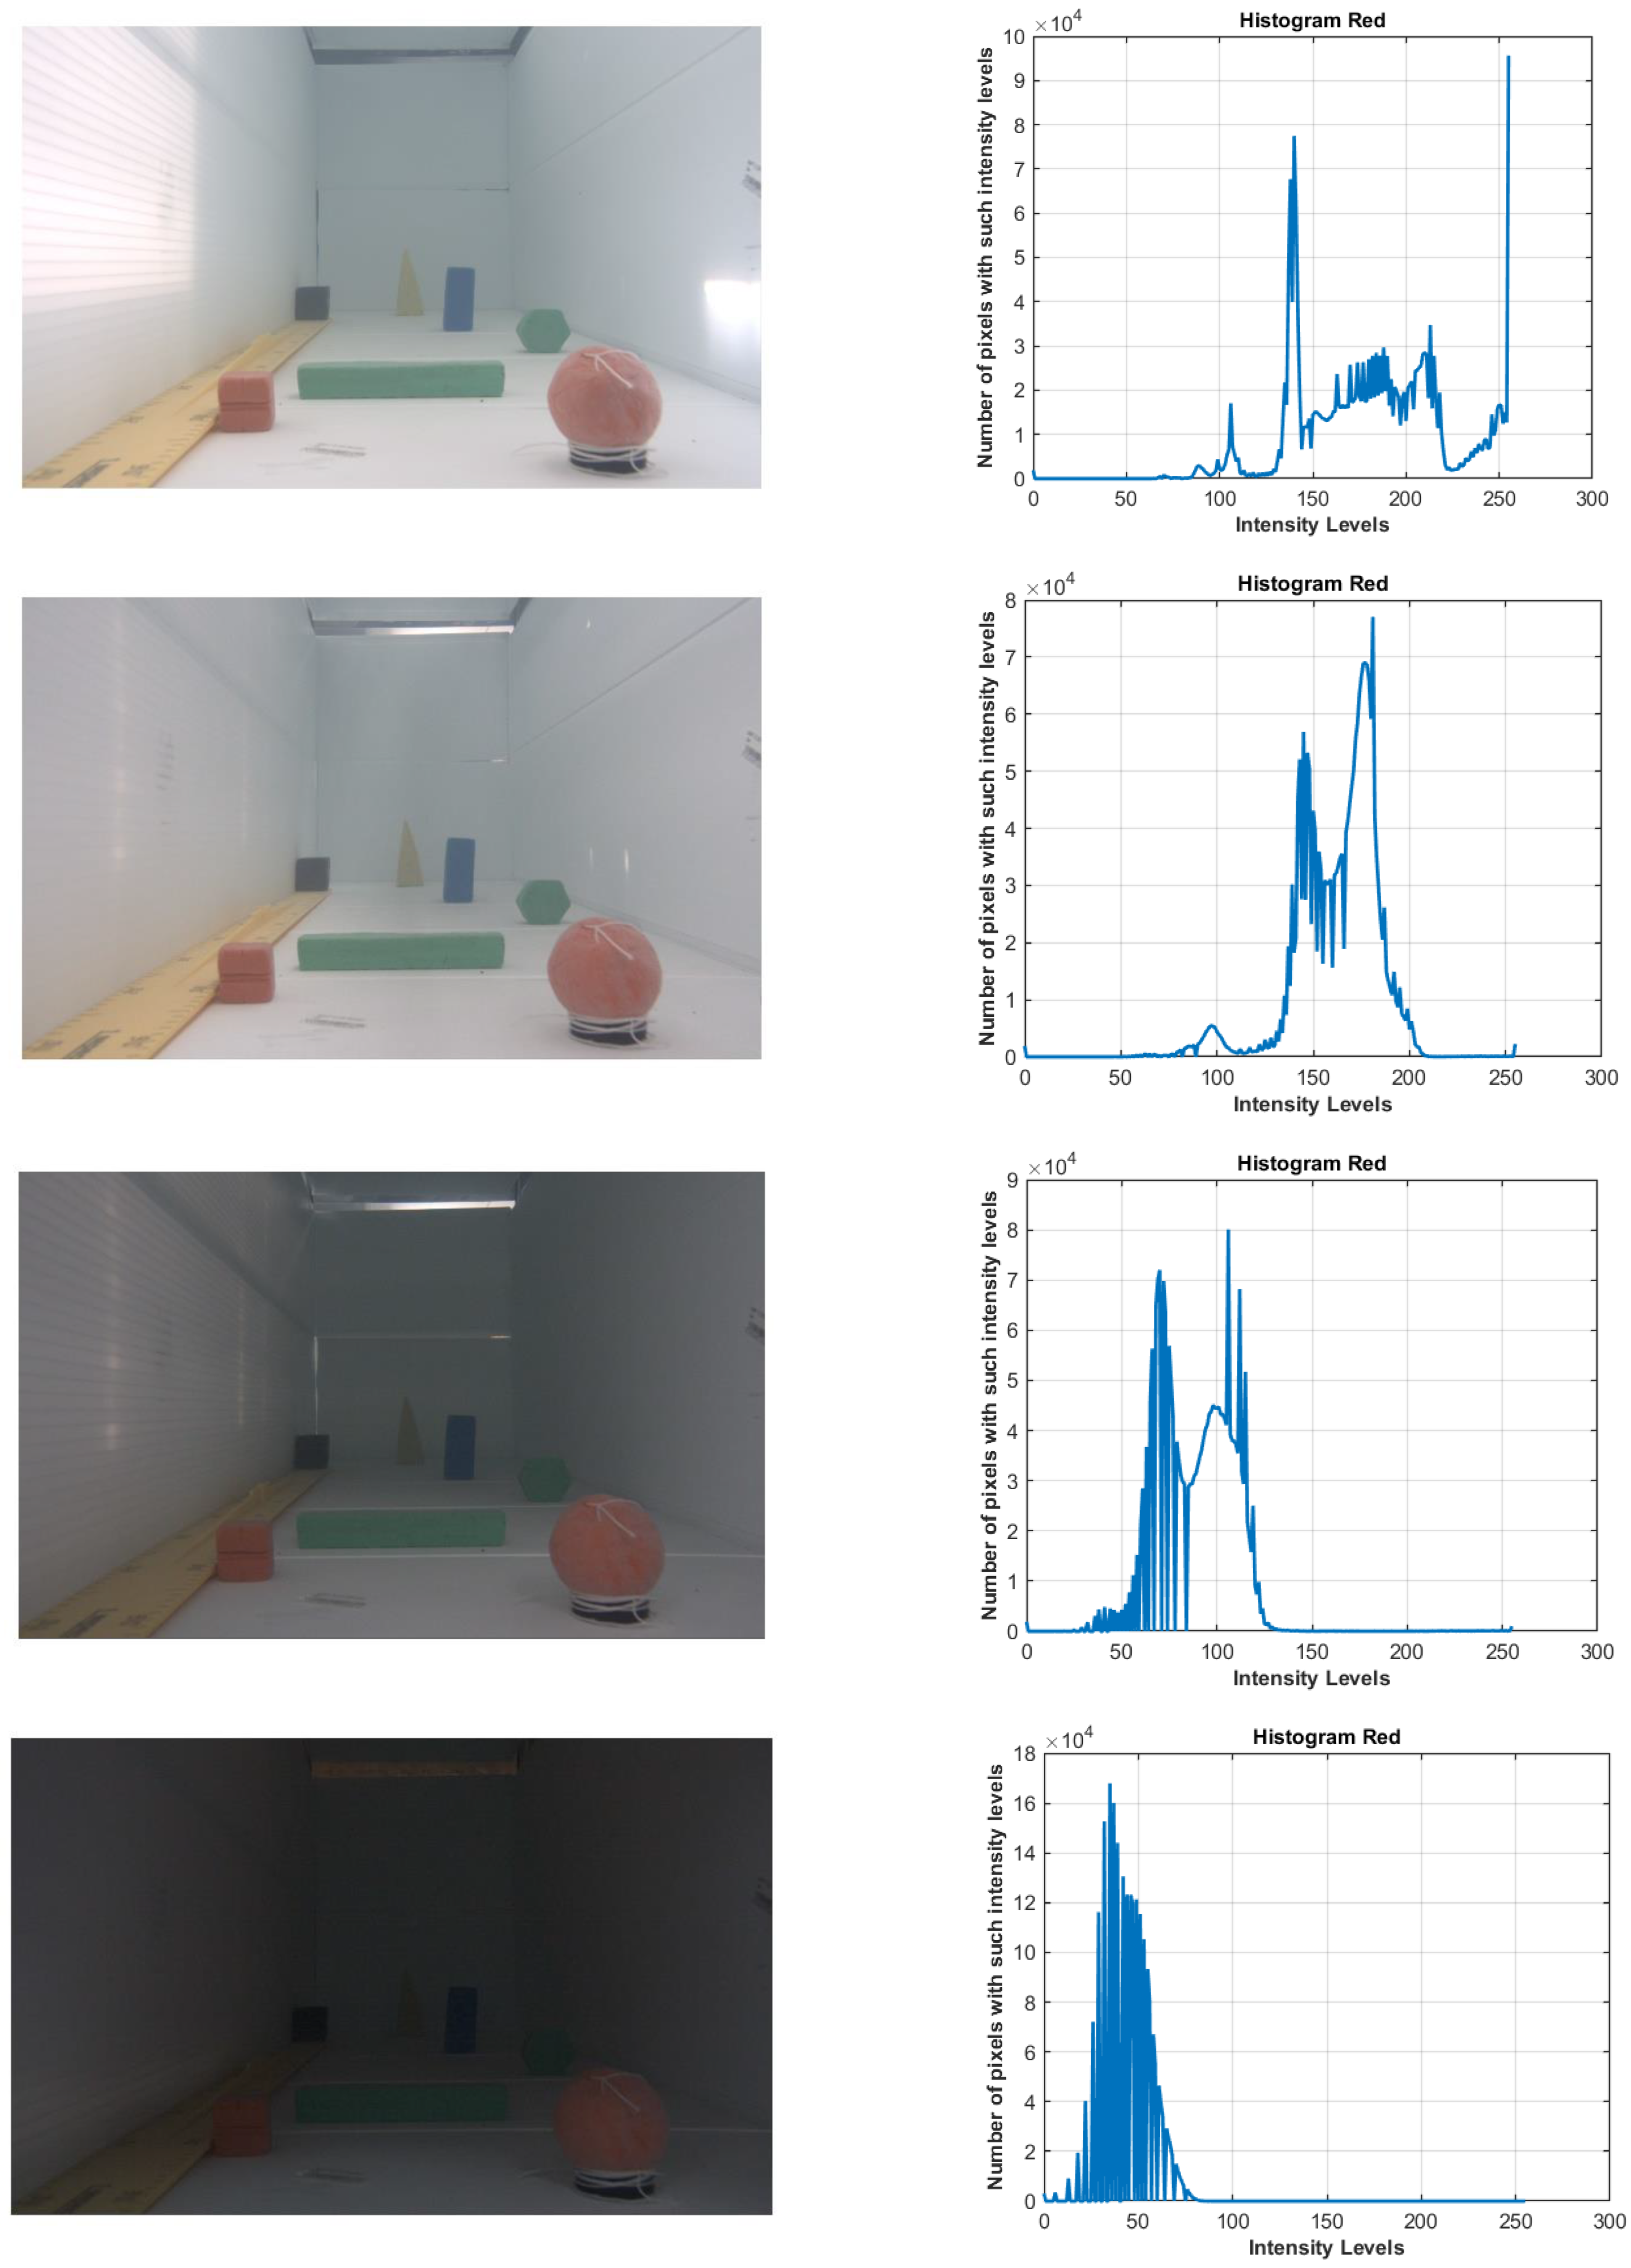
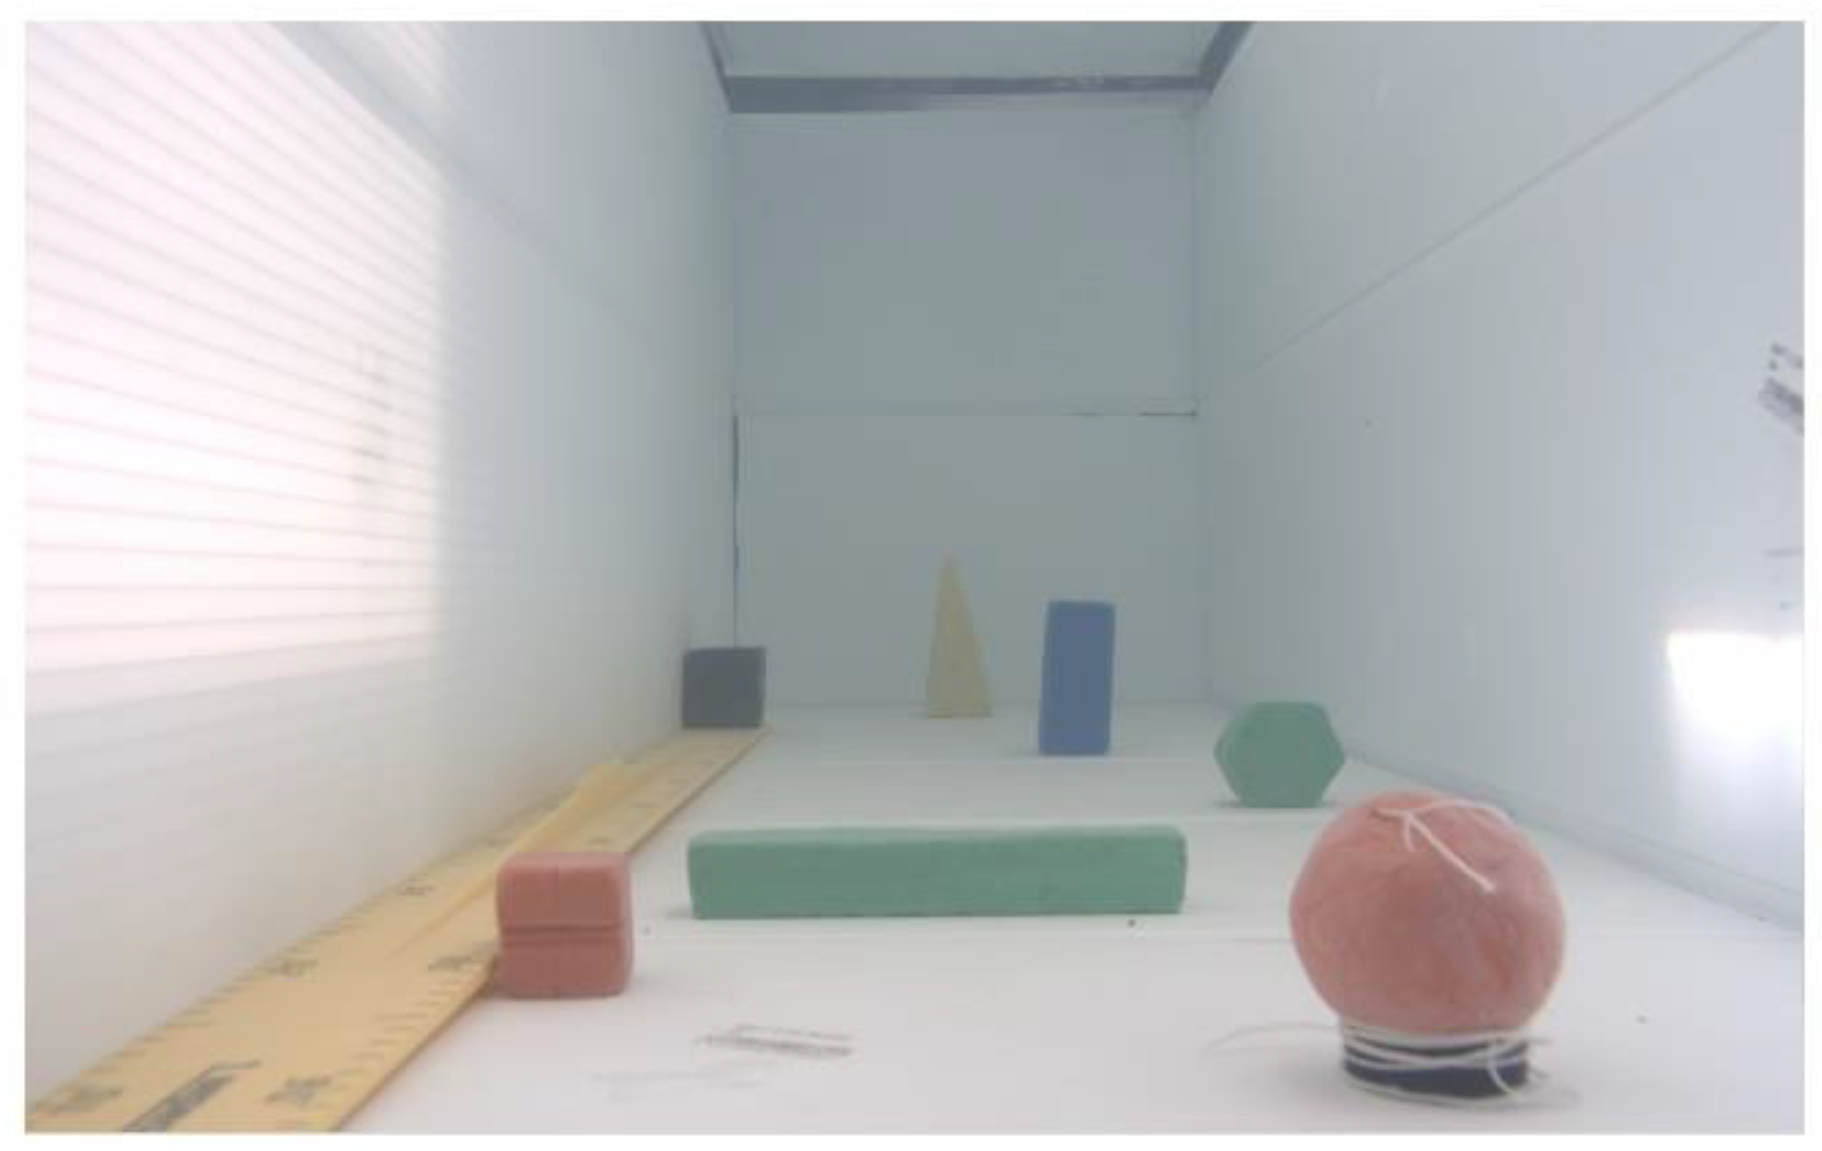
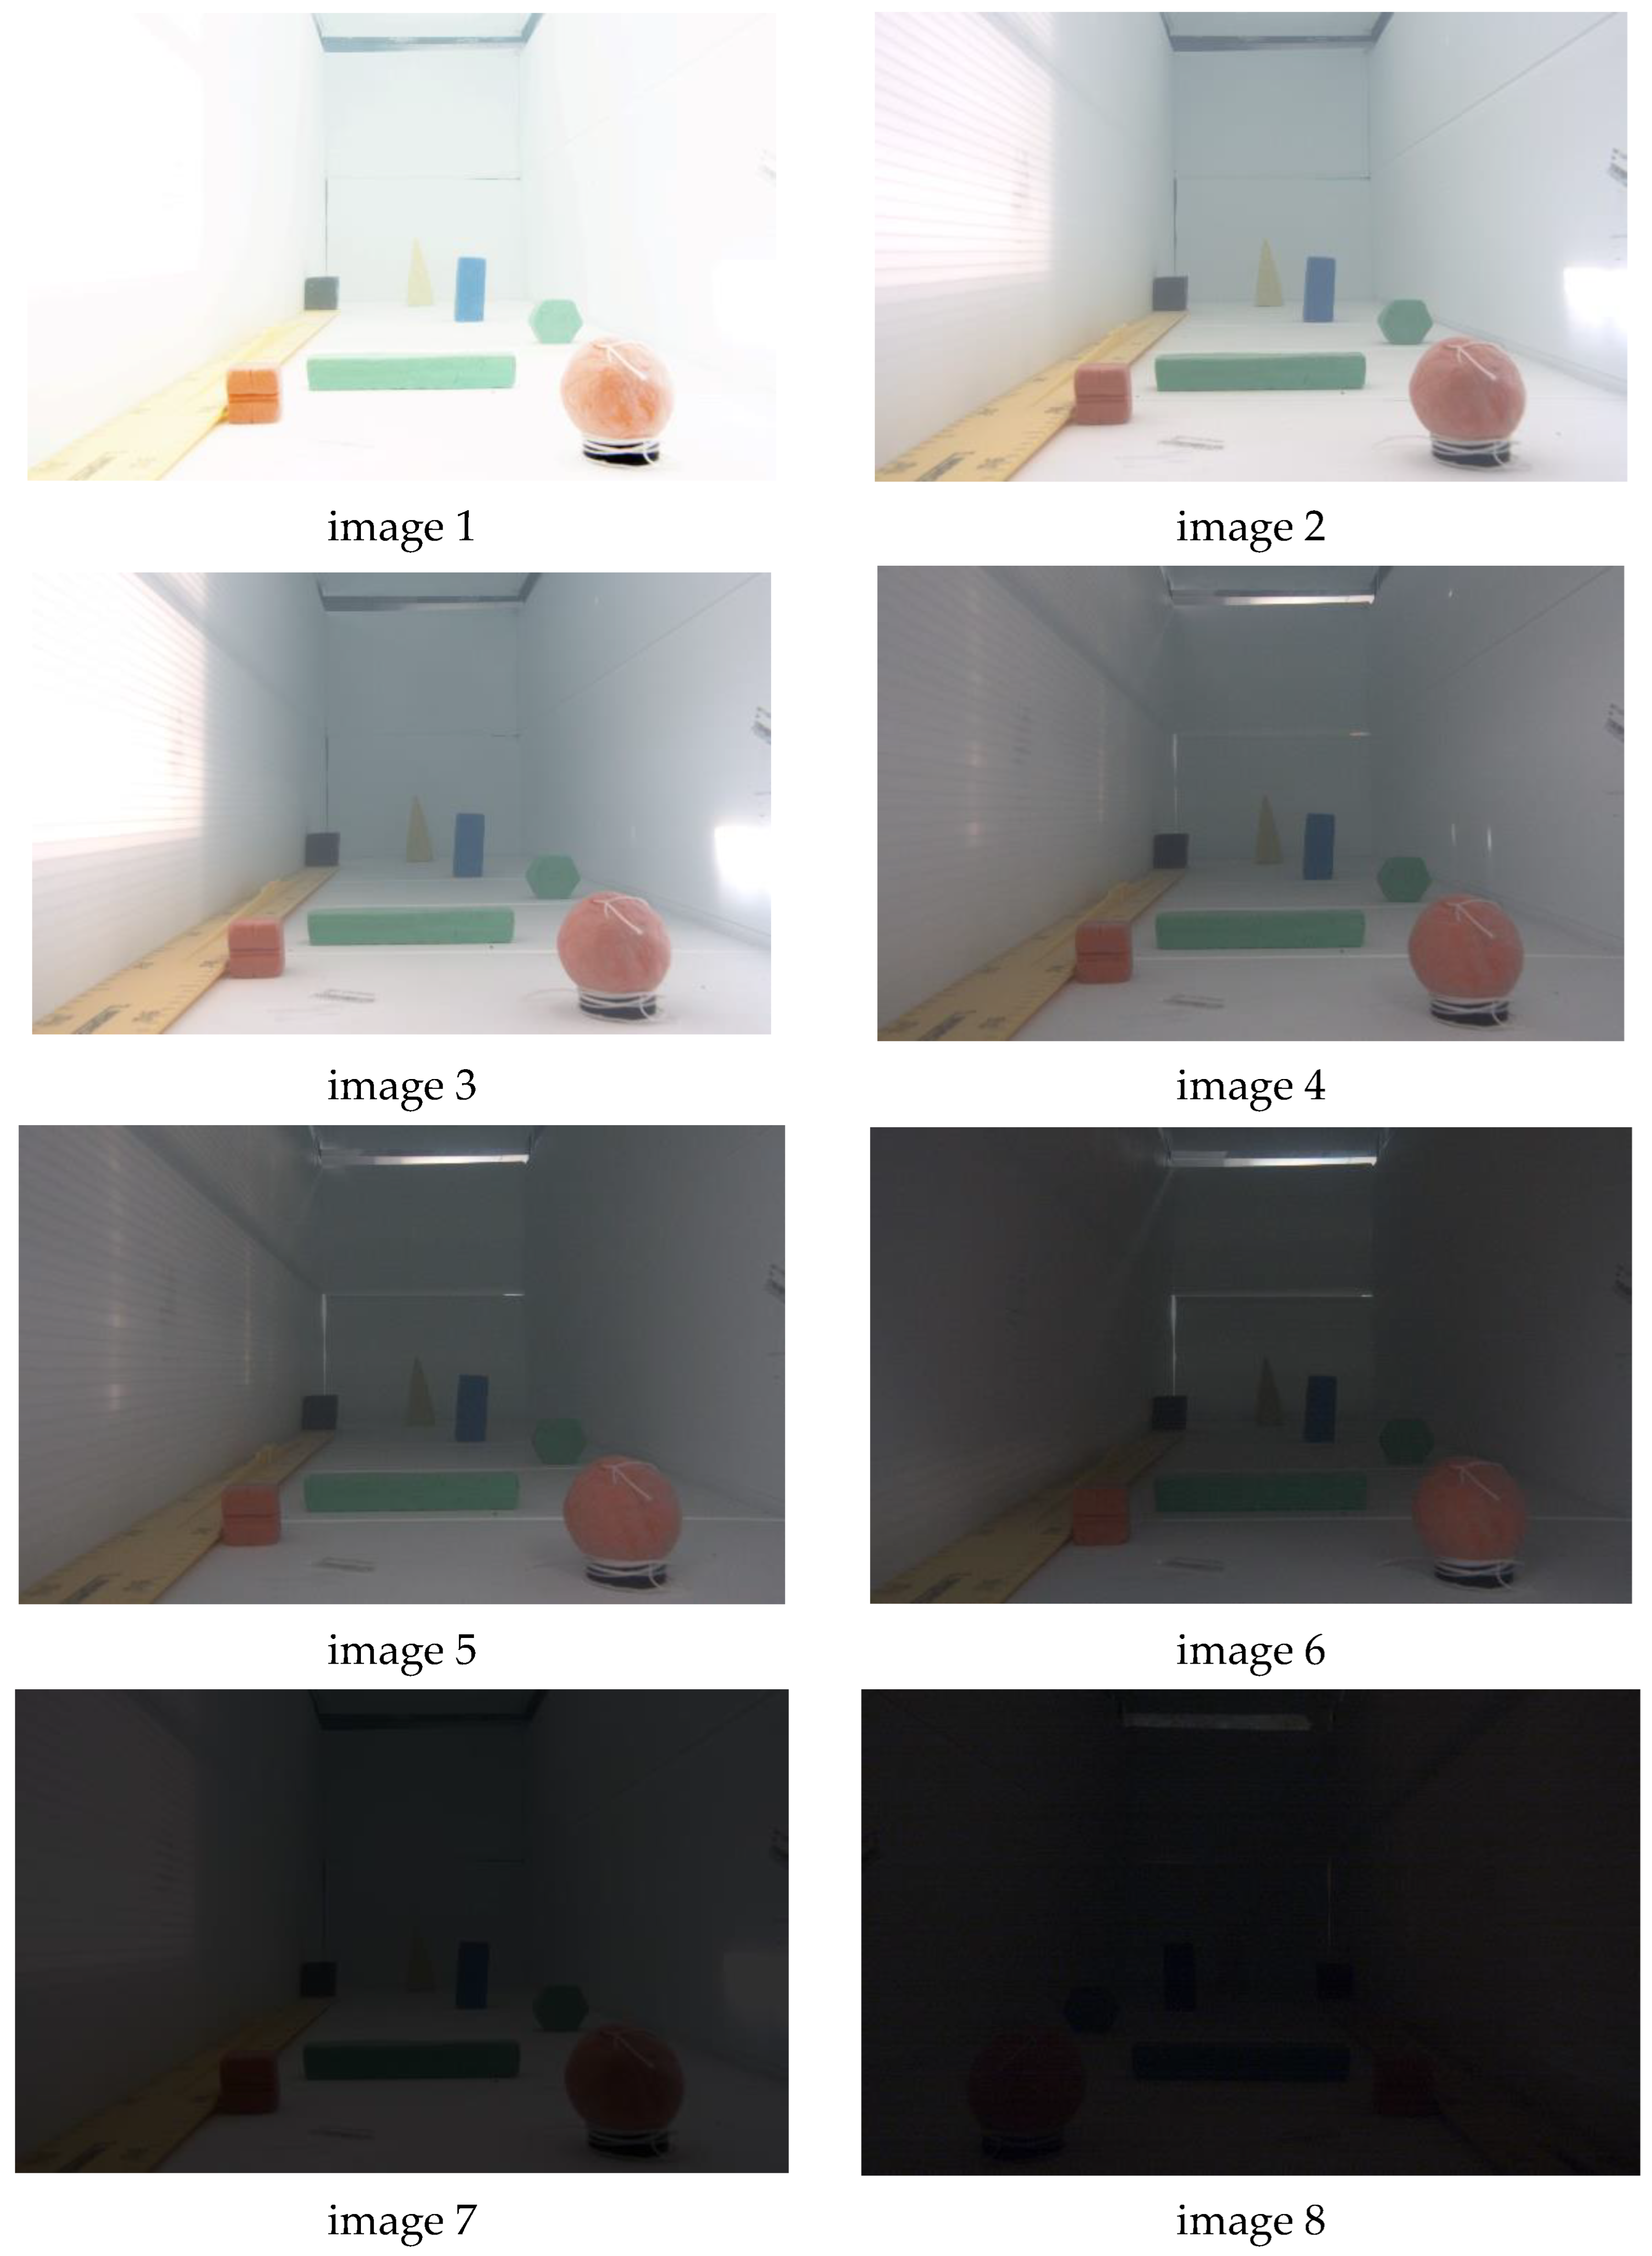
3.2.1. Image Quality Analysis

Since data acquisition from cameras and finding objects in the image is automatic, it is important to control the information content of the received images. It is also necessary to determine how qualitative the received images are. At great depth, there will be no natural light and possible situations in which, as a consequence of poor lighting, the image will be strongly darkened or, on the contrary, at a strong illumination by a flashlight strongly illuminated, and in such conditions the algorithm cannot detect any objects on the images, although it will continue to work in the normal mode. It is necessary to detect such situations and to signal that the images are coming in corrupted, and that it is therefore necessary to correct the lighting. For this purpose, the image histogram will be checked for the number of light spots on the image that are too dark or too light. If there is an overwhelming majority of these, the image will be considered spoiled.
To find strongly dark or light images, the image can be converted from RGB color space to HSV and can use the Value channel (another name for the Brightness channel), which reflects the brightness from the color model. The criterion for determining the photo quality will be brightness. Brightness on the image in HSV format is calculated as a percentage, where 0 is the absence of brightness (black color) and 100% is the maximum brightness (white color).
Regarding the algorithm’s operation, to estimate the dimness, a two-dimensional matrix reflecting the brightness value of each pixel in the image can be considered, the elements of which can take values from 0 to 1. In this matrix, an element (pixel) value equal to 1 indicates maximum brightness and a value equal to 0 indicates minimum brightness. If the number of elements in the matrix whose value is less than 0.2 is 80% of the total number of elements, then the image is heavily darkened and considered spoiled. The ratio determining the non-darkened image has the following form
i = 1 n j = 1 m a i j n m > 0.8 .
In Equation (5) n and m are the dimensions of the brightness matrix, a i j —is the considered matrix element. Figure 8 shows the pixel brightness distributions for the brightness levels of different test pictures. When the illumination changes, the histogram is completely distorted. In Figure 8c, it can be seen that for the darkened image, the brightness index on the graph is strongly shifted towards the minimum brightness values. In this way, the algorithm allows us to determine how good the images obtained are.
The following is the implementation of the Algorithm 1:
Algorithm 1: The image quality estimation algorithm.
Mat src = imread(“picture.jpg”);
cvtColor(src, frame_HSV, COLOR_BGR2HSV);
split(frame_HSV, splitedHsv);
int VRez = 0;
for (int i = 0; i < frame_HSV.rows; i++)
{
for (int j = 0; j < frame_HSV.cols; j++)
{
int V = static_cast<int>(splitedHsv [2].at<uchar>(i, j));
VRez = VRez + V;
}
}
cout << VRez/(frame_HSV2.rows*frame_HSV2.cols) << endl;
It is when using the mechanism of converting the resulting image into HSV format that the algorithm’s ability to detect color under various light conditions is preserved. When the illumination changes, the histogram of the color gamut of the images practically does not change, which gives us the opportunity to detect objects in various conditions. An example is given Figure 9.
To implement the contour search algorithm, a program was developed that detects, recognizes, and localizes an object in C++. There is a software implementation of the incoming image quality check function.
During the experiments, the assumptions and calculations were confirmed. The edge detection method has made it possible to achieve a stable detection of objects under various lighting conditions. This allows the detection of the object without distorting the shape of the object due to color distortion. Trying to detect objects without image processing by the contour method (Figure 10 on the right) when the lighting changes the color of the object is distorted does not allow you to correctly determine the shape of the object: with a strongly illuminated image, the object could not be found; and with strong darkening, the object lost its outlines and broke up into three independent parts, thereby not allowing you to correctly determine the shape of the object. When detecting objects using contour methods at any illumination, the object was detected without distortion (Figure 10 on the left).
Figure 11 shows other examples of how algorithm works.

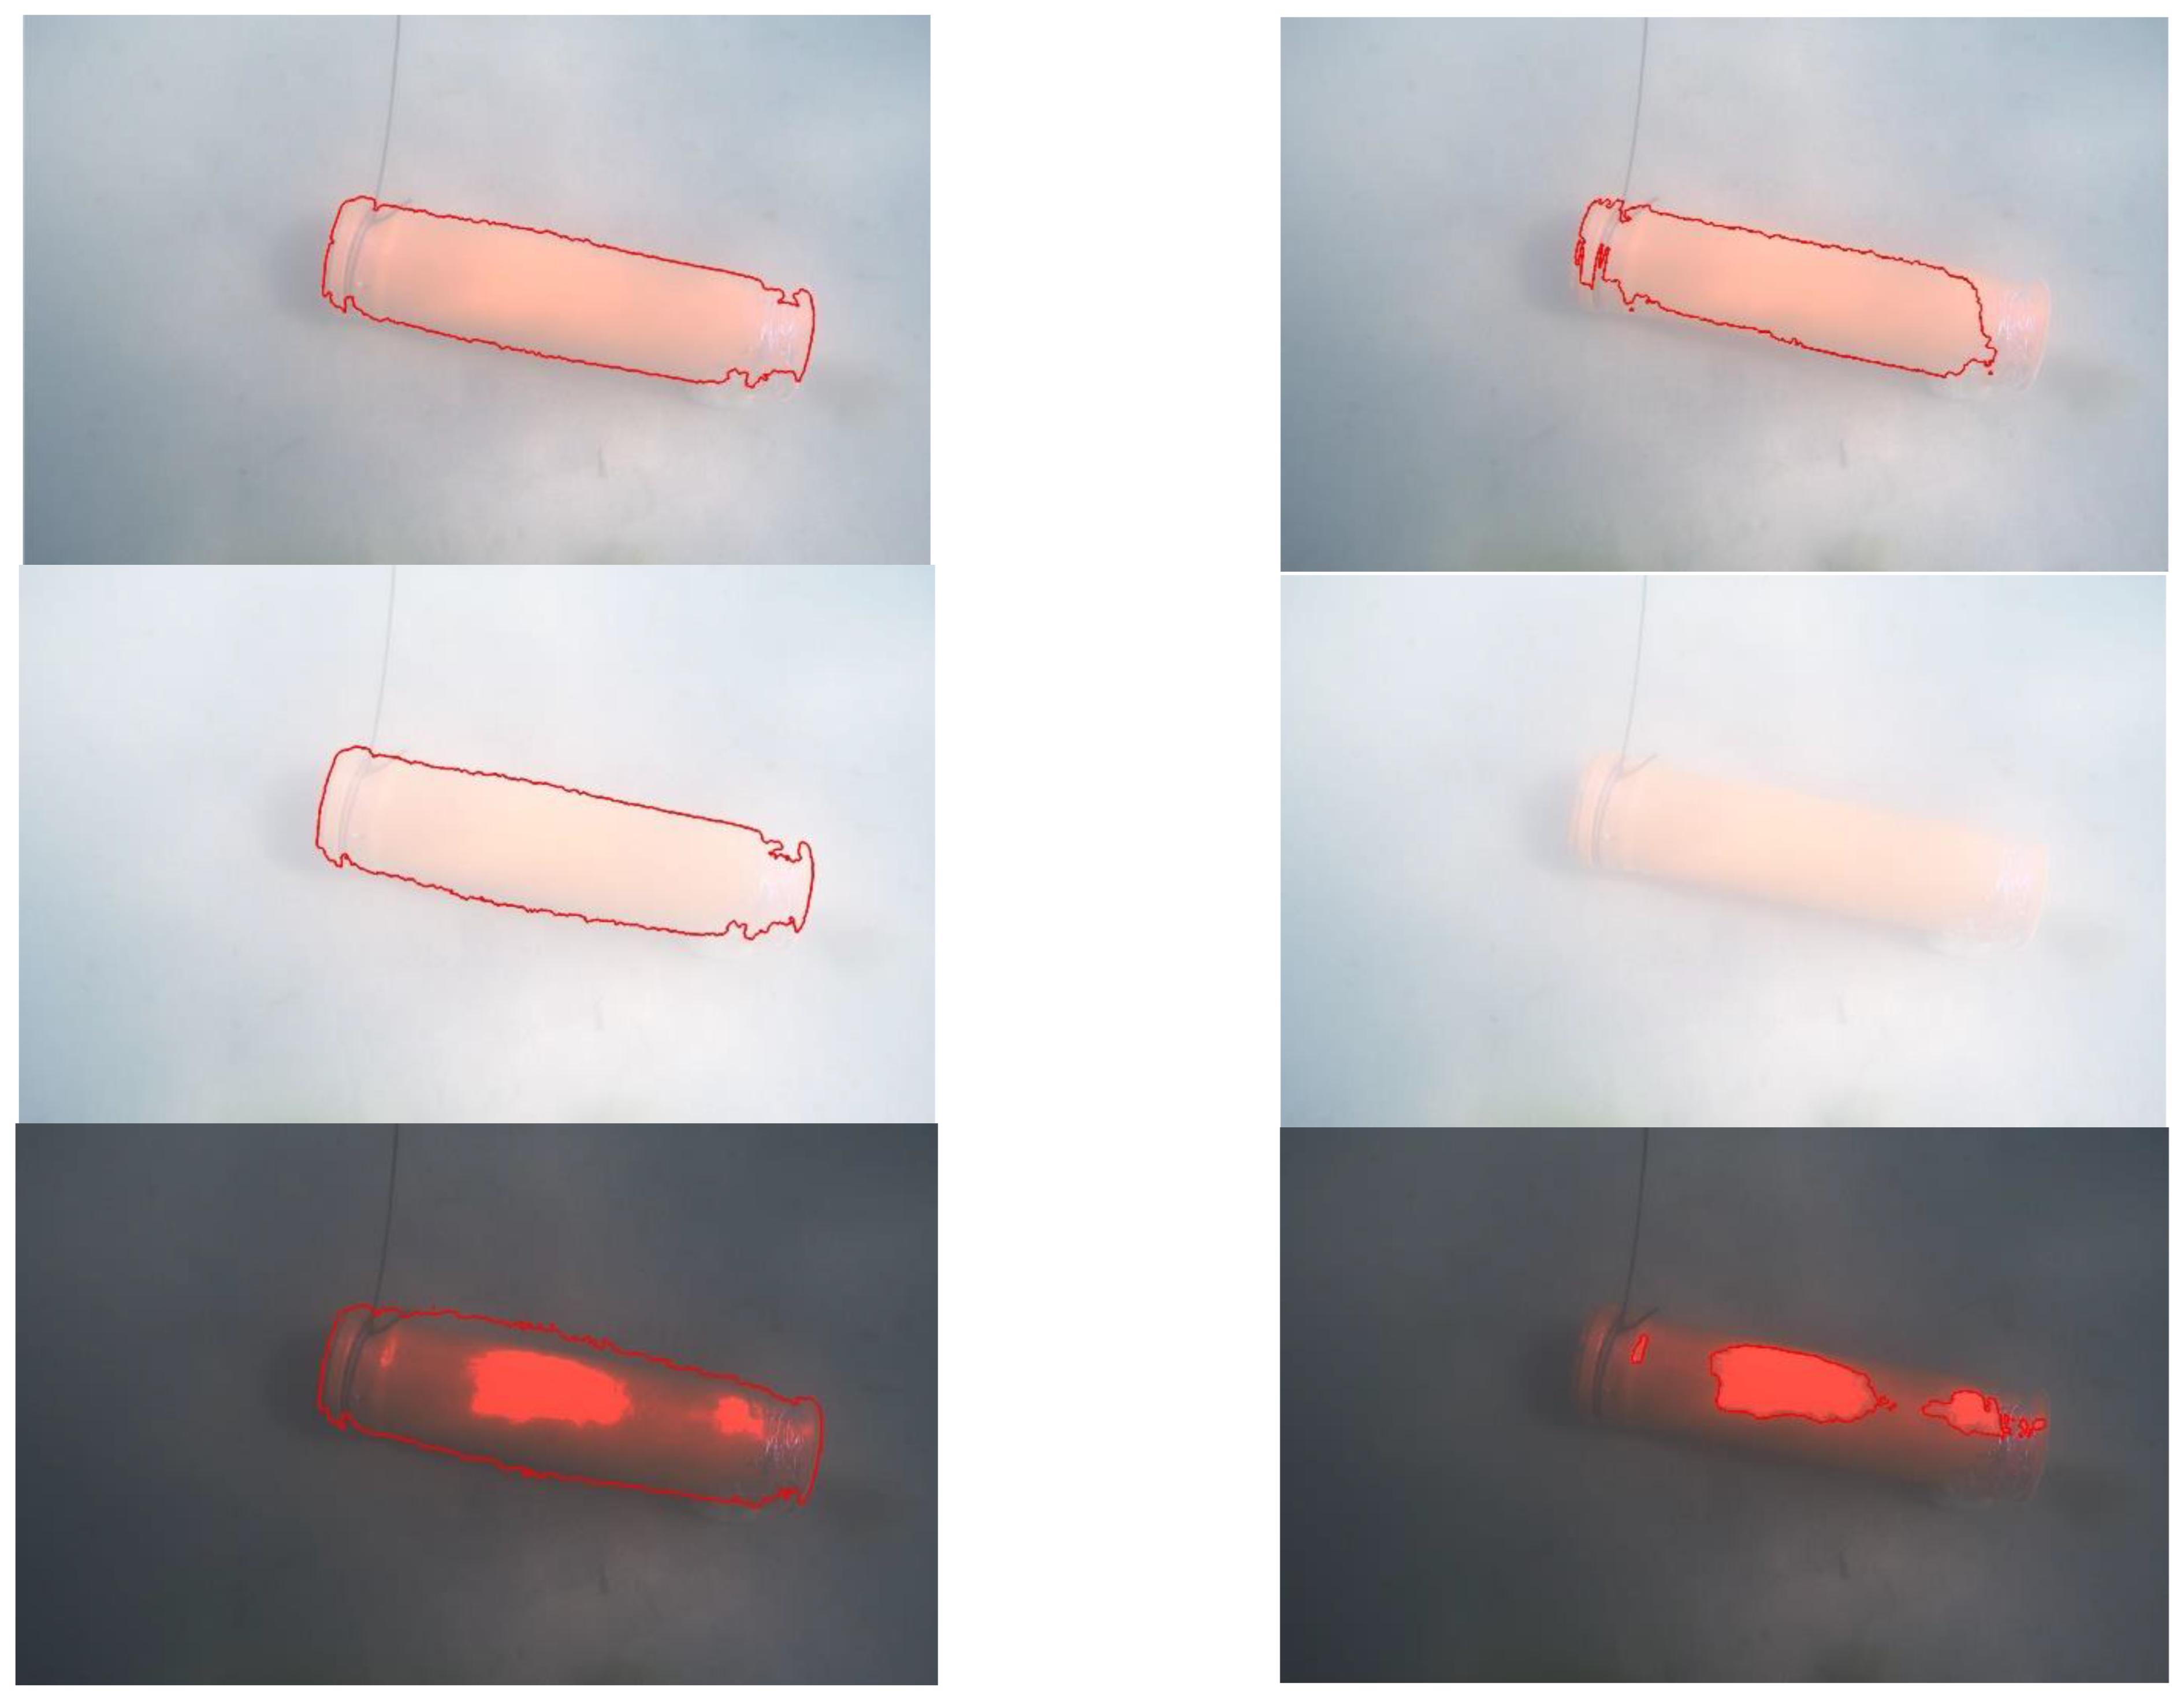
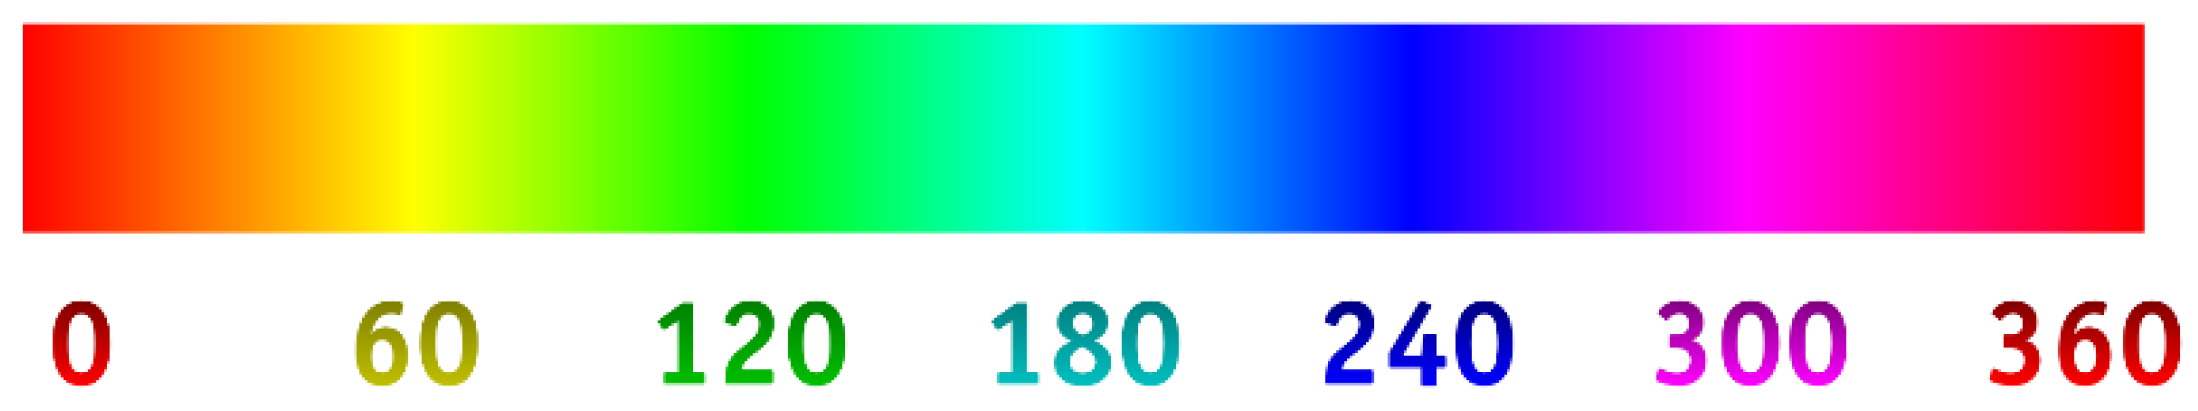
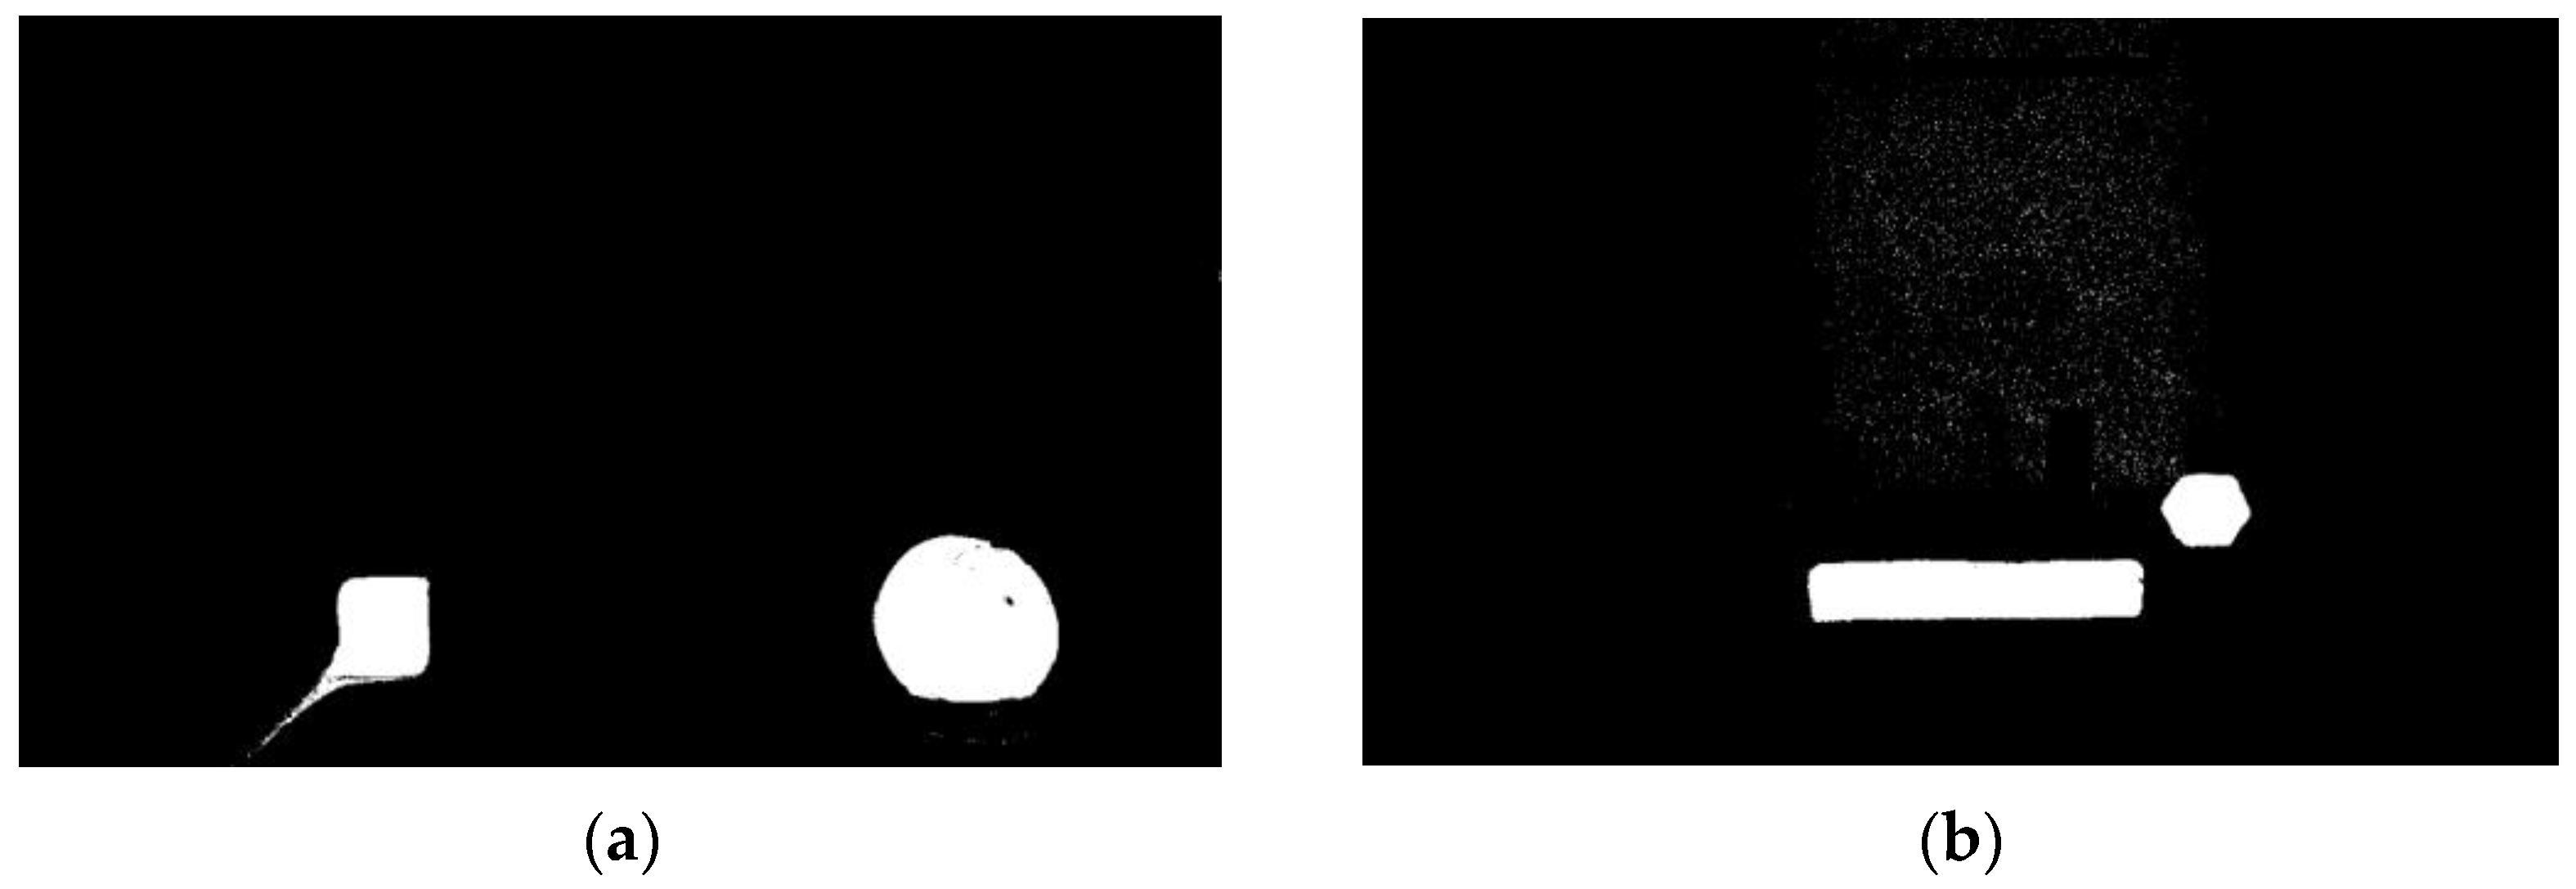
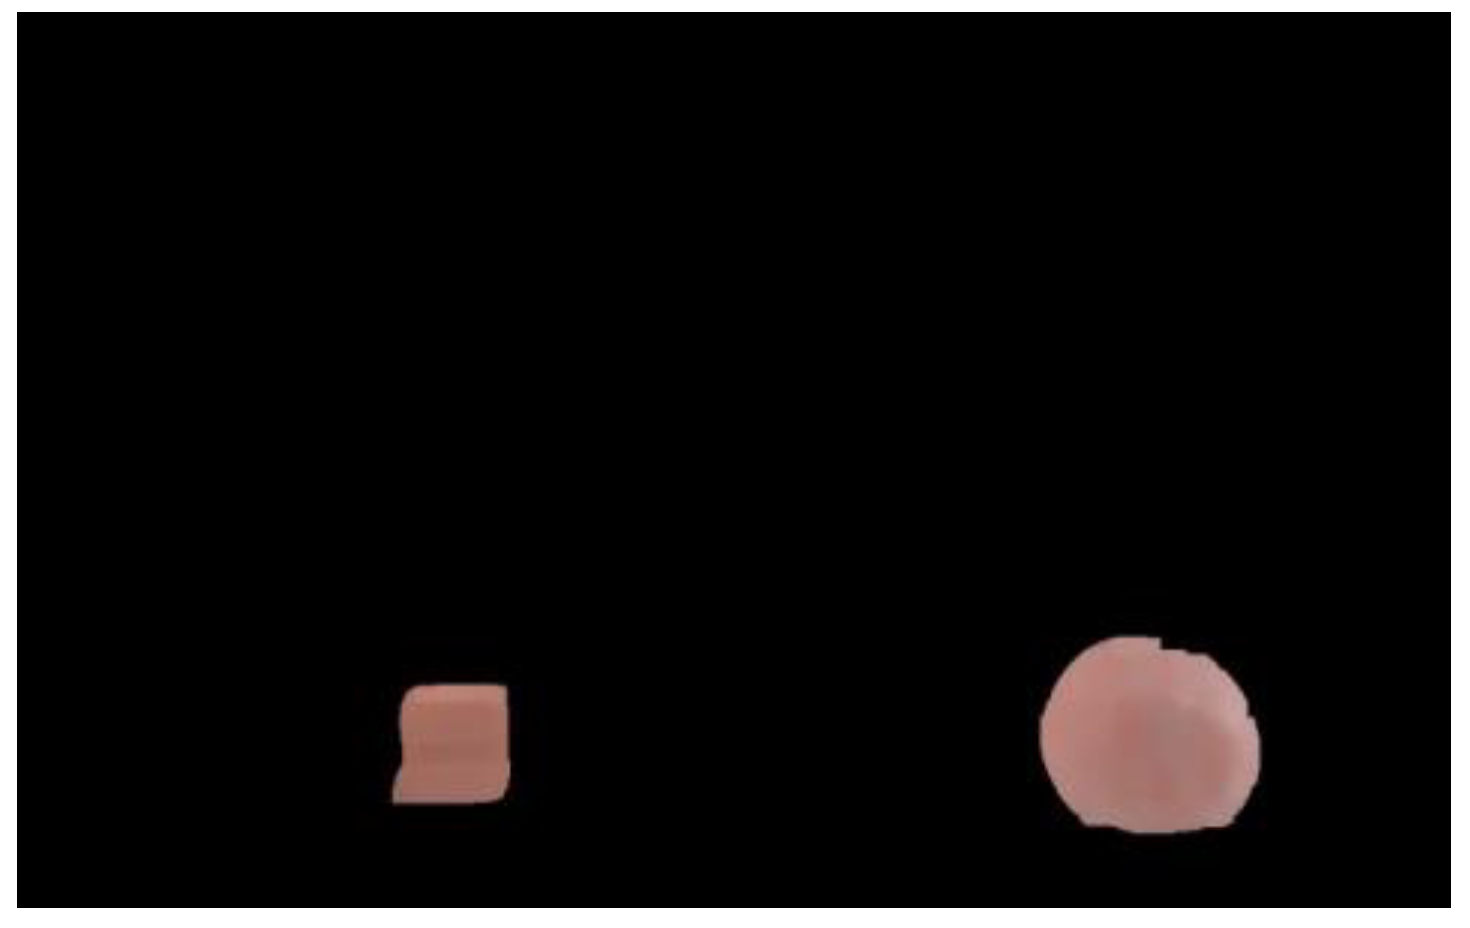
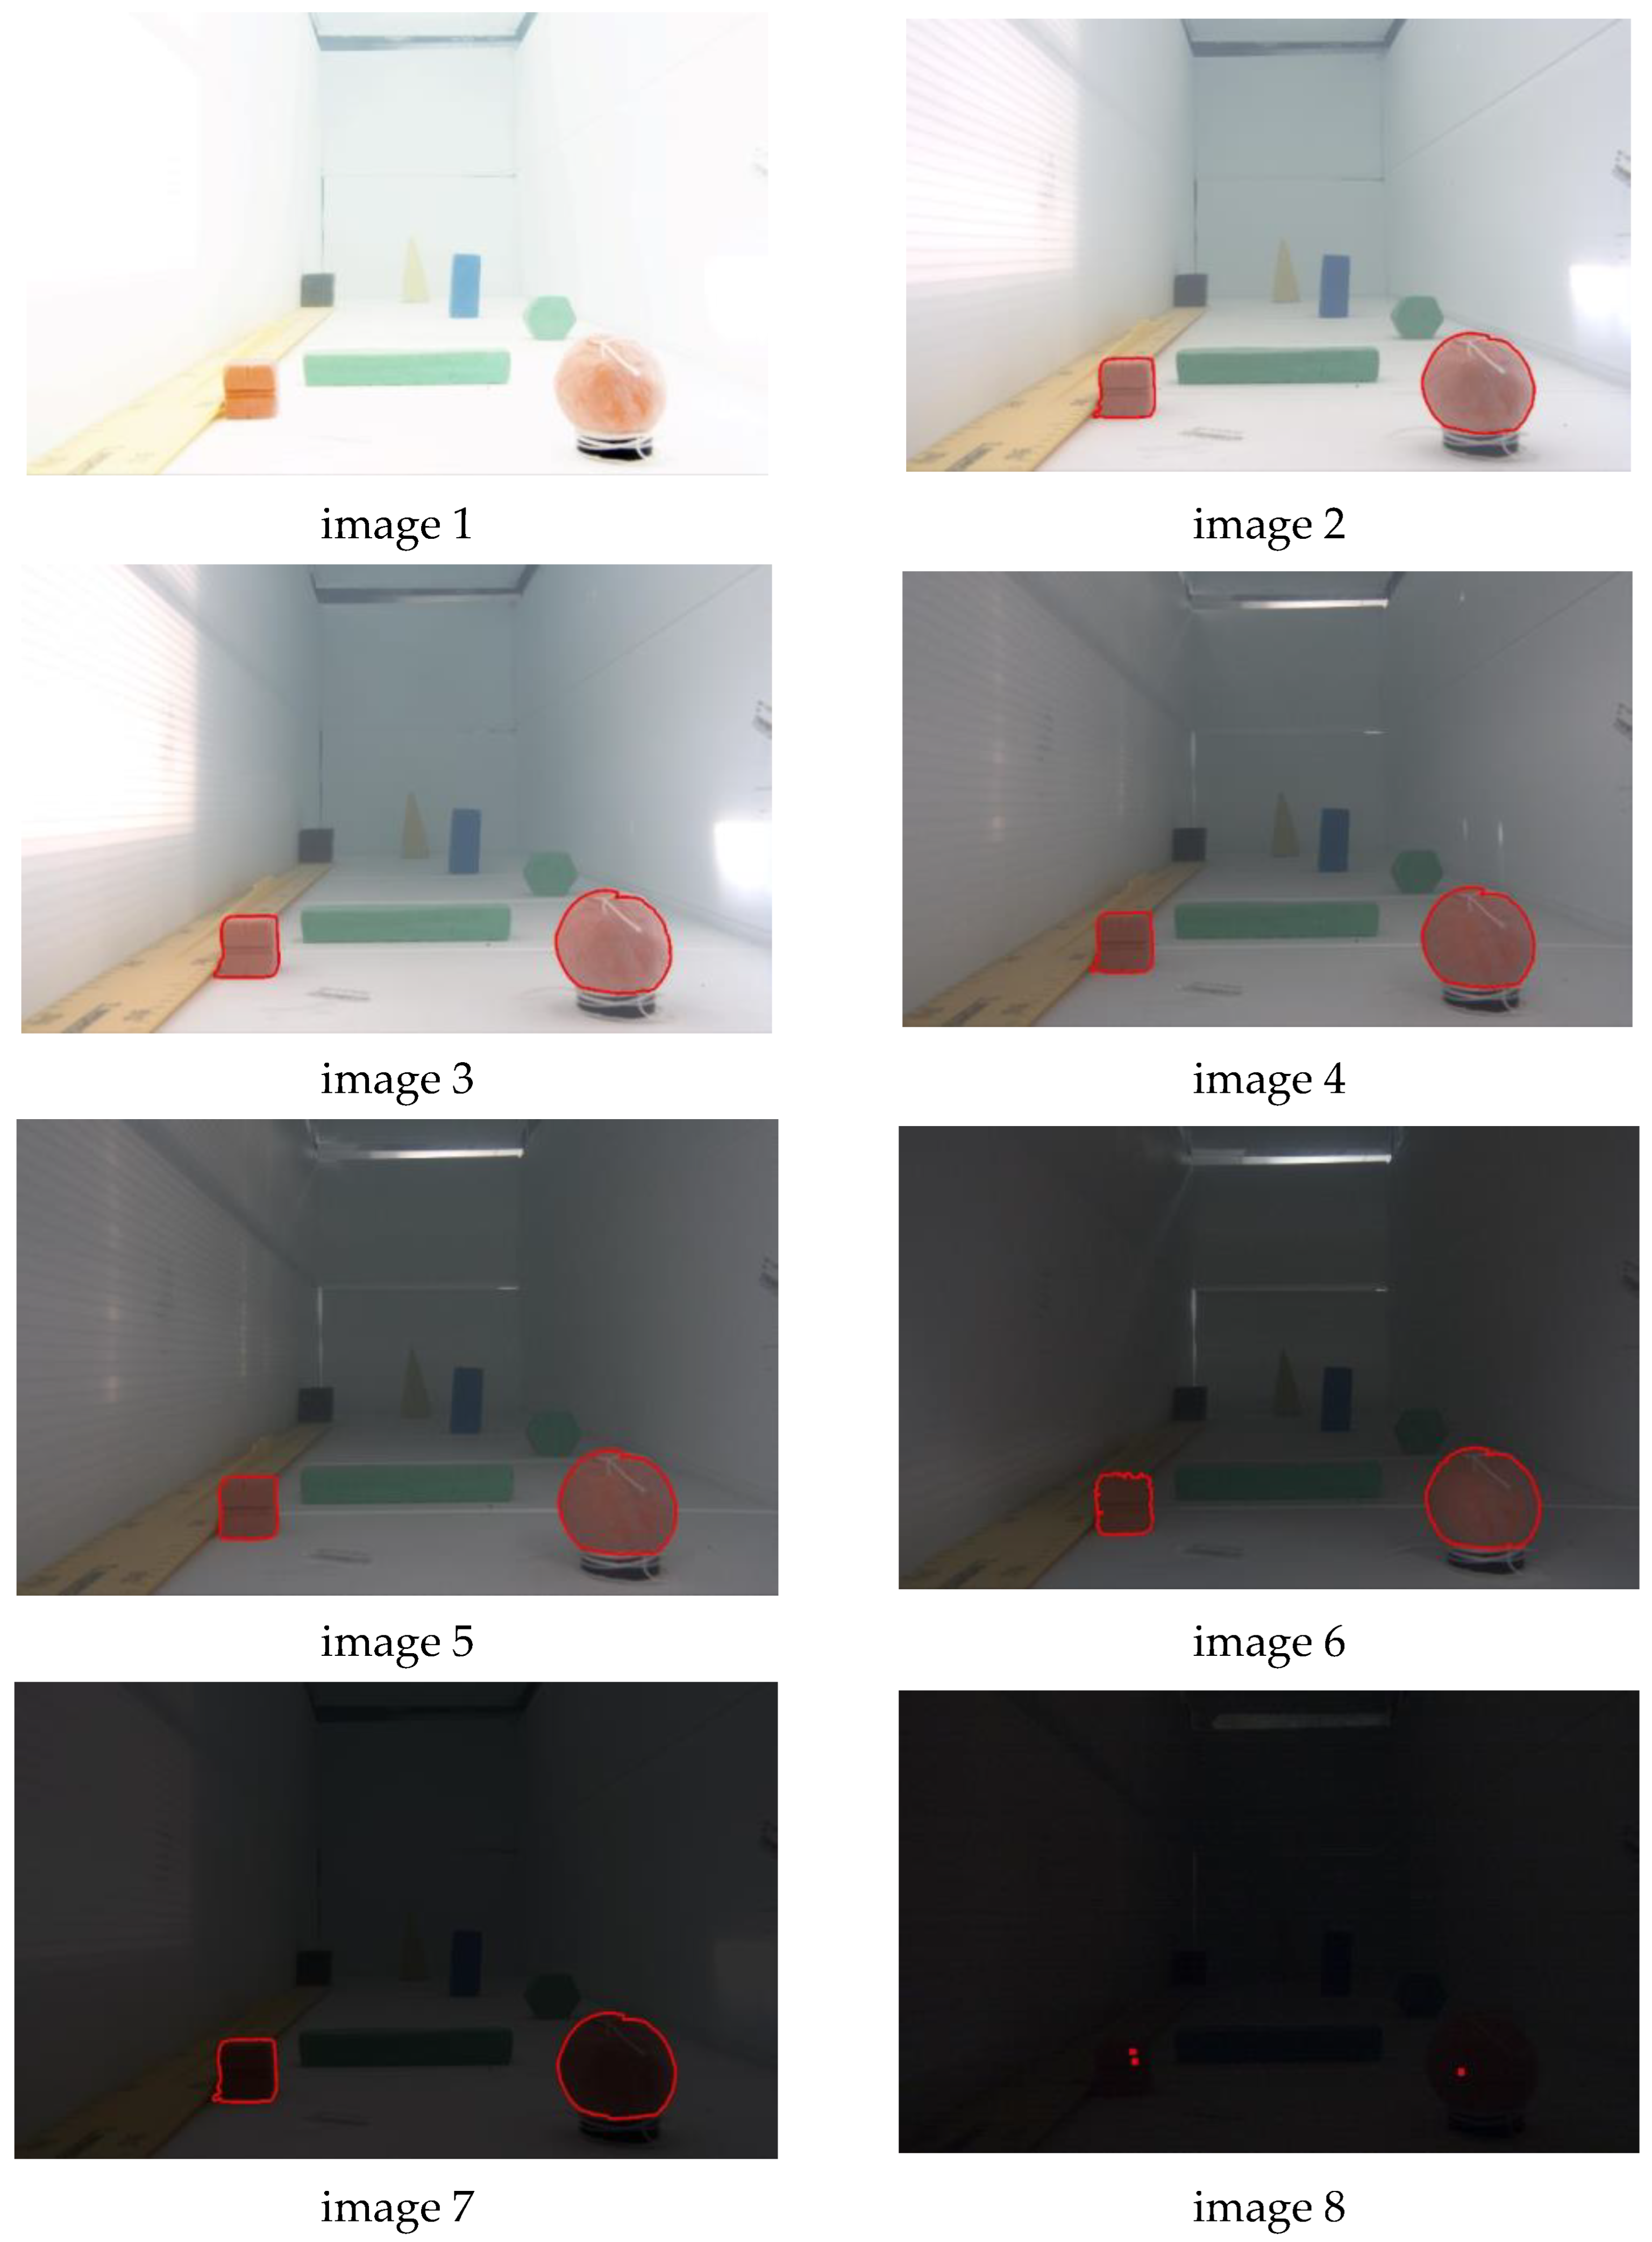
3.2.2. Detecting a Specific Colored Object

According to the received images, it is necessary to detect objects that have a certain color. The image from the cameras is obtained in RGB format. The image space in RGB format represents an array of three-dimensional vectors, by which the coordinates of each element in the array are set.
With constantly changing lighting conditions, distance to the object, water transparency, and also in the general visibility to the object, the object’s colors are constantly distorted. Under different light conditions, too, the same object will have different shades. Figure 12 shows examples of RGB distribution histograms, constructed for the color red. From the Figure, it can be seen that the distribution changes with the shooting conditions, even though the scene in the image does not change.
To select the required color, it is necessary to define the color range that satisfies provided conditions. Assuming that the object’s illumination and distance in turbid water will constantly change, the range of colors must be recalculated each time the external environment changes. Recalculating relative to the lighting color range will give additional load on computing power and give extremely poor accuracy, and by setting a very wide color range, there is a risk of getting noise and artifacts in images that will cause obstacles to find the object, and also affect the other colors that are not necessary.
To develop an algorithm to recognize the desired color in different environmental conditions and in different lighting, without changing the initial parameters, the following approaches will be used.
The first approach is to switch to a different color space. If preserving color under different lighting conditions is important for the task, the HSV color solution can be switched. This color system provides direct control over tone, saturation, and brightness. Using the HSV model allows us to control the color range under different lighting conditions.
The transition from RGB to HSV is determined by the following rule. Let H [ 0 , 360 ] —tonal value, S, V—saturation and brightness, R, G, B—red, green, blue colors, respectively, in RGB format, with S , V , R , G , B [ 0 , 1 ] . Let MAX be the maximum value of R, G, B, and MIN be the minimum of them. To convert from RGB format to HSV format, the following ratios will then be used:
H = { 60 G B M A X M I N + 0 ,   i f     M A X = R ,       G B 60 G B M A X M I N + 360 ,   i f     M A X = R ,     G < B 60 B R M A X M I N + 120 ,   i f     M A X = G 60 R G M A X M I N + 240 ,   i f     M A X = B ,   S = { 0 ,   i f     M A X = 0 1 M I N M A X , ,   V = M A X .
To find objects with a particular color, it is necessary to define a color range that will satisfy provided conditions.
Let us investigate with the image obtained in the pool (Figure 13) to find red and green color objects:
Measuring the subjects of interest color gamma in HSV format, it was determined that the color tone (Hue) (Figure 14) for red objects is 0 to 20, and for green it is from 60 to 180 degrees.
Let us take Saturation and Value (brightness) with a maximum range to be able to detect colors under different light changes. The lower and upper color boundary will therefore have values for red LowScalar (0, 30, 0) and HScalar (20, 255, 255). And for green—LowScalar (60, 30, 0) and HScalar (180, 255, 255). Where LowScalar is a three-dimensional vector describing the lower boundary of the desired color represented in HSV format, HScalar is a three-dimensional vector describing the upper boundary of the desired color represented in HSV format.
Using the inRange function from the OpenCV package, which checks if the array elements lie between the elements of two other arrays, the image mask is formed according to the rule
x i , j = { 255 ,   i f ( L o w S c a l a r x i , j < H S c a l a r ) = t r u e 0 .
x i , j is an element of the original image pixel value matrix, and  x i , j —is an image mask storing value 0 or 255. As a result, an image mask is formed in which the objects of interest will be highlighted in white, and the rest of the space will be marked in black (Figure 15).
When the mask is applied to the main photo, only the objects of interest remain. At the same time, noise and unnecessary objects remain on the image (Figure 16).
To remove noise and unnecessary details as well as to fill empty areas inside the retrieved figure, binary image morphological processing methods will be applied. The main morphological operations that will be used are erosion and dilation.
The erosion method consists in transforming pixel values according to the following rule: a pixel in the original image (either 1 or 0) will be considered 1 only if all pixels under the core are equal to 1, otherwise it is blurred (zeroed). The dilation method is the exact opposite of erosion. Here the pixel element equals 1 if at least one pixel under the core equals 1. Thus, the white area in the image is enlarged or the size of the foreground object is increased.
Combining these methods will remove noise and small objects. To realize this goal, it is necessary to apply successively the methods of erosion and expansion. The combination of these methods in exactly this sequence is defined by the set-opening operation. The set opening A by primitive B is defined by the expression
A ◦ B = (A ⊝ B) ⊕ B,
where the set A is an image, and the primitive B is a 10 × 10 pixel template.
In practice, the opening operation smooths the contours of the object, cuts off isthmuses, eliminates small-width protrusions, and removes noise and freestanding small objects.
To fill the resulting voids inside the object, which were formed due to the color background irregularity, a dilation and erosion sequence will be used. The closing of set A by primitive B is defined by the expression
A • B = (A ⊕ B) ⊝ B,
where, as before, the set A is an image, and the primitive B is a 10 × 10 pixel template.
In practice, the closing operation smooths the object’s contours, generally “fills” narrow gaps and long recesses of small width, and also eliminates small holes and fills the contour gaps. The transformation results in an image with only the objects of interest left.
As a result, the necessary objects in the image are highlighted. Now, it is necessary to select the objects, define the outline, and find the relative sizes.

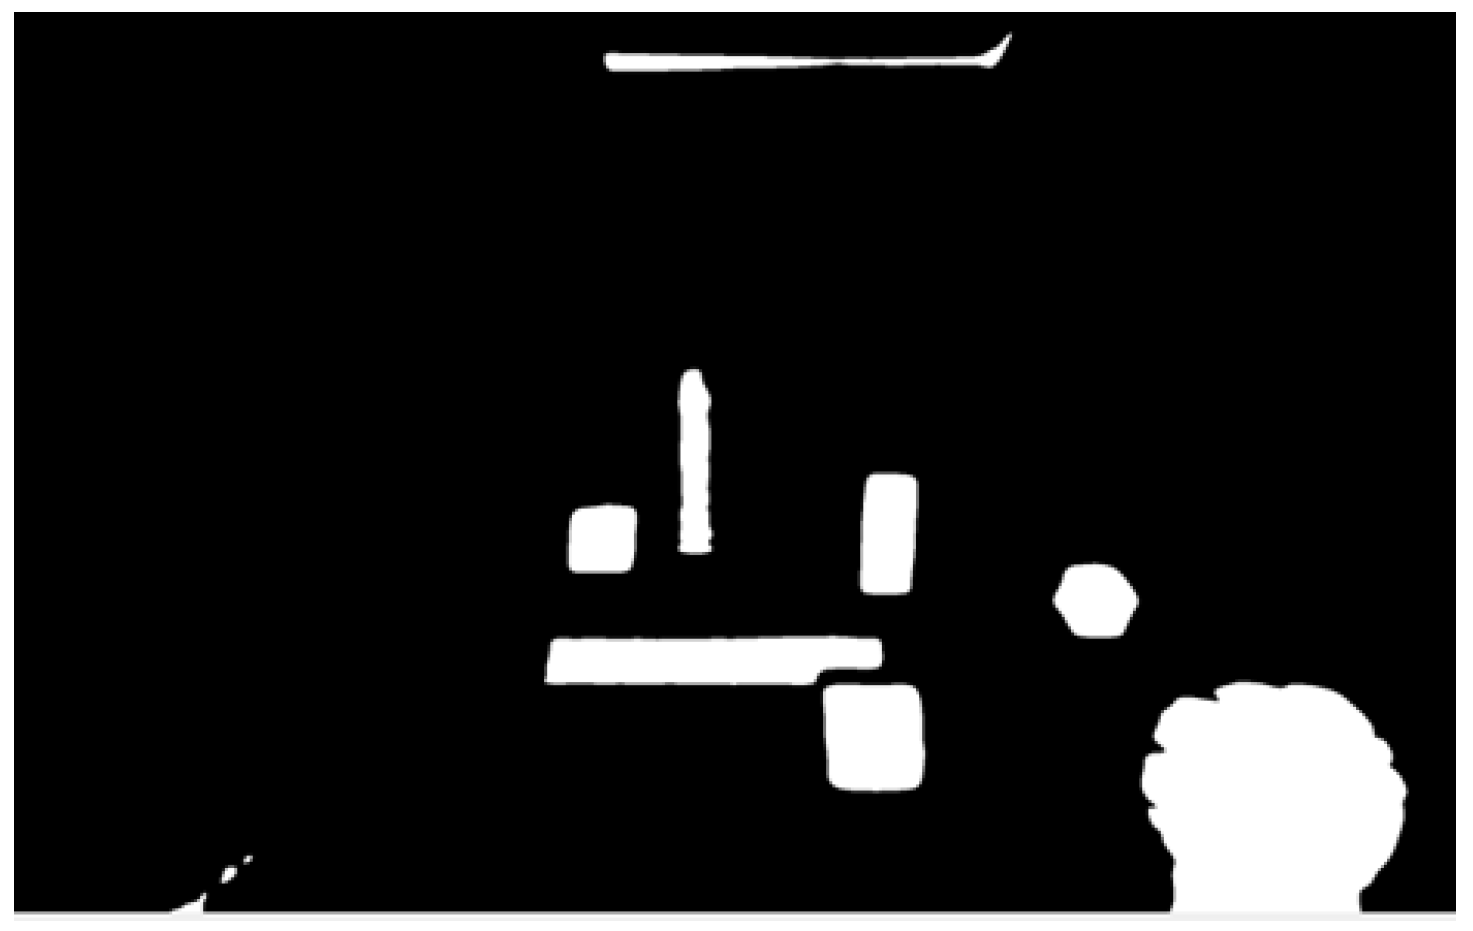
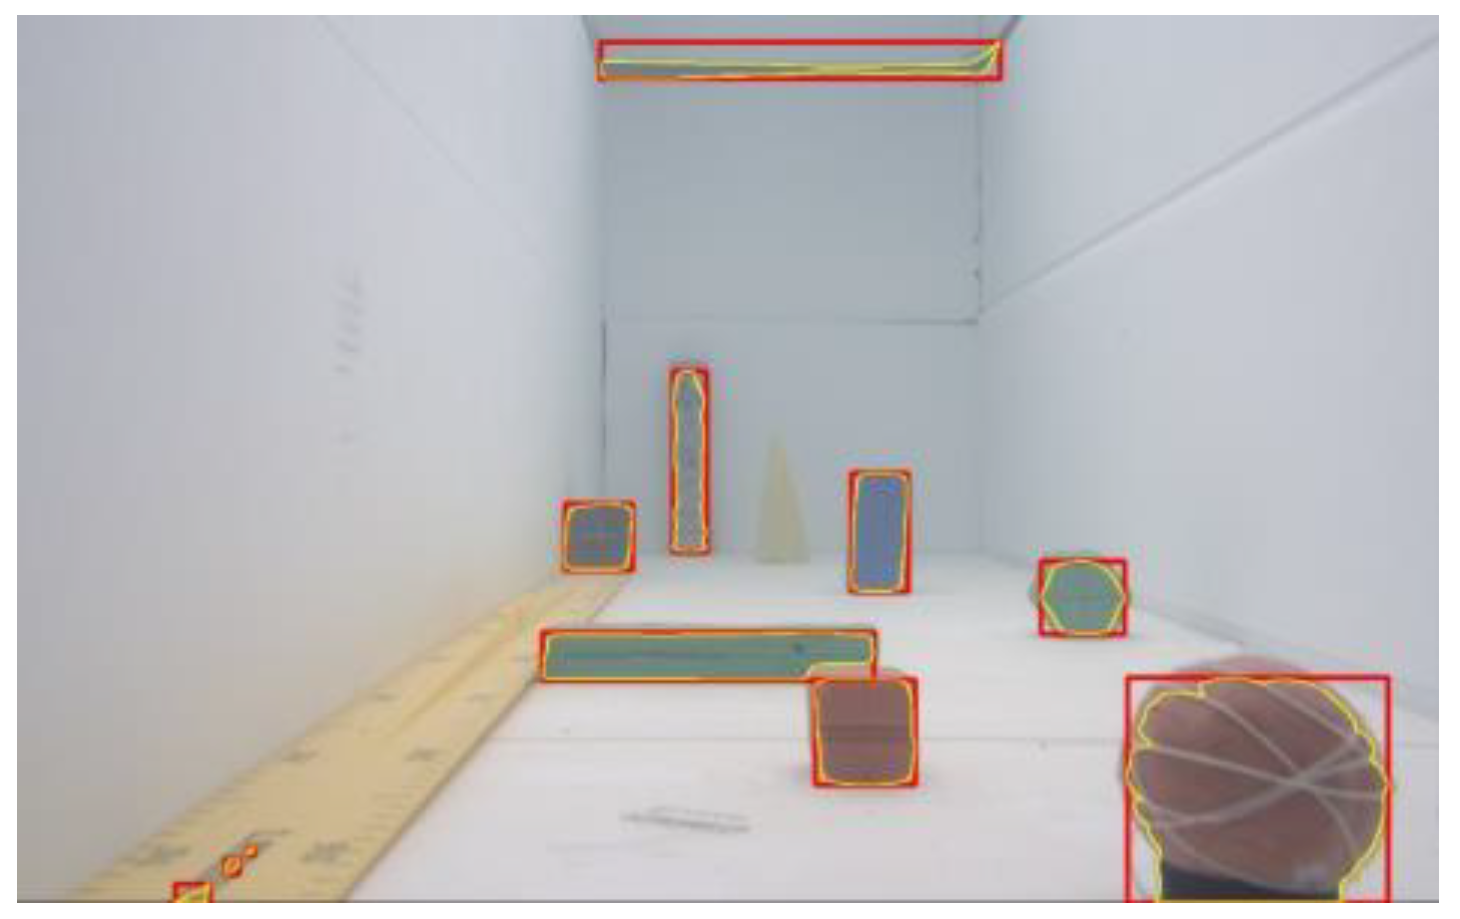
3.2.3. Defining the Image Outline

As noted above, one approach to developing a 3D vision system algorithm is based on contour image analysis. Direct contour analysis application may lead to a number of problems. Grouping and overlapping of objects with each other can lead to incorrect outline extraction or the incorrect number of an object’s determination. A shadow thrown by an object can distort the outline, making it impossible to correctly estimate the object’s boundaries. The strong noisiness and coincident image background will not allow the object outline to be properly highlighted. To eliminate these problems, a new method for detecting the necessary object has been developed that combines several ways of detecting the object, and thus achieves the possibility of detecting the necessary objects in real time without using complex computing systems.
The method consists of the initial 2D image processing algorithms that do not require complex mathematical calculations and search for the outer contours of the object to narrow the search area and reduce the amount of processed information for 3D algorithms. The problem is solved by clustering the objects in the image by processing the image with 2D algorithms. Clustering is performed by searching for all contours in the image, using the image segmentation method with thresholding
d s t ( x , y ) = { m a x V a l ,   i f   s r c ( x , y ) > t r e s h 0 ,
where thresh is the value used to classify the pixel value, the threshold denoting the pixel intensity below which the values in the source image will be ignored; maxVal: represents the pixel intensity value that will be passed to the output array if the threshold value is exceeded; src is the source image array as a two-dimensional array of size (x,y); and dst is the output image array as a two-dimensional array of size (x,y).
By comparing the pixel intensity (x,y) in the original image src with the thresh threshold, the decision is made to keep the pixel value or not.
To determine the objects’ contours, it is necessary to go through the image preprocessing stage, which uses several algorithms: blurring, thresholding, and morphological transformation:
  • Grayscale the image. It is necessary to simplify the image as much as possible. Color increases the signal-to-noise ratio, so there is no need to save colors to find contours.
  • Gaussian blur algorithm. It is used to remove noise. The algorithm removes high-frequency content (e.g., noise, edges) from the image.
  • Using a fixed-level threshold function. The threshold function is used to obtain a binary image from a grayscale image.
After processing the image, the contour mask is obtained on the image (Figure 17).
By applying the mask to the main image, we find the objects in the scene (Figure 18).
The resulting contours are filtered by a certain color, in which the desired object is colored (Figure 19). If the found areas lack a certain color typical of the object, such areas are ignored and are not used in further processing.
Let us note a distinctive feature of the proposed algorithm and present the quantitative results. As a calculation system, we choose the value of brightness, which determines the boundaries of the correct operation of the algorithm. We then apply the formula for calculating the overall brightness of the resulting image from Recommendation ITU-R BT.601-7 [19].
Y = R·0.299 + G·0.587 + B·0.114,
where Y is the resulting brightness of the image, the values of which are represented as one byte and denoted for convenience by integers from 0 to 255 inclusive, where 0 is the minimum and 255 is the maximum intensity, and where R, G, B are the channels of the RGB color model. At present, the formula for calculating the overall brightness of the resulting image has received a more accurate representation, but in order not to increase the computational load, it is sufficient to use the form (11). To illustrate, let us take eight identical scenes made in a laboratory aquarium, but with different lighting, and calculate the brightness of each scene (Figure 20).
Let us get the brightness: photo 1—242.80; photo 2—198.24; photo 3—180.35; photo 4—112.46; photo 5—90.50; photo 6—54.21; photo 7—33.05; photo 8—18.04.
Figure 21 shows the result of image processing by the algorithm.
Objects were found on all images except 1 and 8. Based on the experiments, it can be concluded that if the image brightness decreases below 20 or increases more than 200 bytes, then the algorithm cannot determine the objects in the image, and such an image is considered corrupted.
In the obtained area, it is possible to find the object’s 3D point maximum number, using the algorithm for finding 3D points in stereo images (Figure 22). An example of detecting key points in an image and displaying their coordinates on a three-dimensional scene is shown in Figure 23.
For the resulting region, the model that has the minimum error between the approximating model and the point cloud is determined. The object recognition is performed stepwise. At the first step, all clusters are approximated by the plane model using the least squares method. The following equation is used as a plane model:
z = a · x + b · y + c
In the second step, all clusters are approximated by the desired model using the least squares method. In the third step, for all clusters the desired model is determined.
For example, for the cylinder model, the plane model is used to determine the inclination angles of the point cloud; the point cloud is rotated so that the approximating plane becomes perpendicular to the Z axis; the point cloud is rotated around the Z axis by 180 degrees in increments of 0.5 degrees, and at each step the projection on the XZ plane is approximated by a circle; the error between the radius and the Euclidean distance from the circle center to the point is calculated; the circle model for which the average error is minimal is selected, and the circle radius is taken as the radius of the cylinder; as the coordinates (X, Z) of the cylinder base centers, the resulting circle center coordinates are used, and the minimum and maximum point cloud coordinates on the Y axis are taken as the Y coordinate; and the base centers, by a reverse transition of the coordinate system, are reduced to the initial point cloud coordinate system.
As a result, the surface is determined by the obtained 3D points. If the surface is close to the desired figure, the conclusion is made about finding the desired object (Figure 24).
Figure 25 shows an example of detecting an orange tube under water using the developed system.
The proposed algorithms also apply to the search for more complex objects under water, including artifacts. An example of such objects is shown in Figure 26. The application of the contour method for localization of the object allowed using the algorithm for searching 3D points only in the area of interest of the image, which, in turn, accelerated the execution of the algorithm several times by reducing the area of definition of 3D points.

4. Discussion

A new method for detecting the necessary object has been developed, which combines several methods for detecting the object, and thereby achieves the ability to detect the necessary objects in real time without the use of complex computing systems. The essence of the method is the initial 2D image processing algorithms that do not require complex mathematical calculations and the search for external contours of the object to narrow the search area and reduce the amount of processed information for 3D algorithms. The solution to the problem is achieved by clustering objects in the image by processing the image with 2D algorithms. Clustering is performed by searching for all contours in the image using the image segmentation method using a threshold value. The resulting contours are then filtered by a certain color in which the desired object is painted. If the found areas lack a certain color that is characteristic of the object, such areas are ignored and not used in further processing. The maximum possible number of 3D points on the object is found in the obtained area using the 3D point search algorithm for stereo images. For the resulting area, a model is determined that has the minimum error between the approximating model and the point cloud. This method allows us to find the desired objects using professional high-resolution video cameras in conjunction with a low-power single-board computer.
The parallel algorithms organization is applied in the program development [20]. Usually, the software part of the TSS consists of several separate algorithms, which in most cases are executed sequentially. In this case, the total one frame processing time is the sum of all algorithm’s operation time included in the software part. However, if one of the algorithms runs slowly, then the overall implementation of the whole software part will run slowly. In real time, it will look like a freezing of the picture on the operator’s screen.
There are two basic approaches for paralleling computations: paralleling by data and paralleling by tasks (instructions). The approach of task paralleling is chosen for the solution of the given problem, since the underwater TSS used has a sufficient algorithms number, each of which performs its own tasks. Data parallelization was not applied because for most of the algorithms used, it is impossible to split the data into parts, and where it can be achieved, there is no significant need due to the fact that these algorithms run fast enough.
To solve the problems described earlier in the introduction the following methods were chosen (according to the problems numbering in the introduction): (1) when accessing shared data, a mutex (from mutual exclusion) is used as a single-place semaphore to manage competitive flows; (2) data synchronization (organization of parallel algorithms operation in such a way that the output data refer to the same frame); (3) thread time synchronization through time management of each one; (4) using graphics card (GPU) resources to accelerate the execution of some algorithms that cannot be divided into separate parts (tasks).
As a result of multithreaded algorithms execution, it was possible to increase the performance of the underwater technical stereovision system. The program operation increased almost twofold (threefold, if some of the algorithms were implemented on the GPU). It was also possible to increase the frame refresh rate on the operator’s screen by five times—that is, to play the video almost without delay. This enabled the increase in the speed of receiving information from the TSS.

Author Contributions

Conceptualization, V.K. (Vadim Kramar) and A.K.; methodology, V.K. (Vadim Kramar); software, O.K. and S.F.; validation, V.K. (Vadim Kramar), A.K. and V.K. (Valerii Karapetian); formal analysis, A.K.; investigation, O.K. and S.F.; resources, A.K.; writing—original draft preparation, V.K. (Vadim Kramar); writing—review and editing, V.K. (Vadim Kramar); visualization, O.K., S.F. and V.K. (Valerii Karapetian); supervision, V.K. (Vadim Kramar); project ad-ministration, A.K.; funding acquisition, A.K. All authors have read and agreed to the published version of the manuscript.

Funding

The study was supported by the Russian Science Foundation grant No. 22-19-00392, https://rscf.ru/project/22-19-00392 (accessed on 27 February 2023).

Institutional Review Board Statement

Not applicable.

Informed Consent Statement

Not applicable.

Data Availability Statement

The data presented in this study are available upon request from the corresponding author.

Conflicts of Interest

The authors declare no conflict of interest.

References

  1. Pedro, J.S.; Pere, R.; Gabriel, O.; Giuseppe, C.; Yvan, P.; Carlos, S.; Claudio, M. Alessio Turetta TRIDENT: An European Project Targeted to Increase the Autonomy Levels for Underwater Intervention Missions. In Proceedings of the 2013 OCEANS, San Diego, CA, USA, 23–27 September 2013. [Google Scholar]
  2. Drap, P.; Seinturier, J.; Scaradozzi, D. Photogrammetry for virtual exploration of underwater archeological sites. In Proceedings of the 21st International Symposium, CIPA 2007: AntiCIPAting the Future of the Cultural Past, Athens, Greece, 1–6 October 2007. [Google Scholar]
  3. Casalino, G.; Caccia, M.; Caiti, A.; Antonelli, G.; Indiveri, G.; Melchiorri, C.; Caselli, S. MARIS: A National Project on Marine Robotics for Interventions. In Proceedings of the 2014 22nd Mediterranean Conference on Control and Automation University of Palermo, Palermo, Italy, 16–19 June 2014; pp. 864–869. [Google Scholar] [CrossRef]
  4. Kabanov, A.; Kramar, V.; Ermakov, I. Design and modeling of an experimental rov with six degrees of freedom. Drones 2021, 5, 113. [Google Scholar] [CrossRef]
  5. Bazeille, S.; Quidu, I.; Jaulin, L.; Malkasse, J.P. Automatic underwater image pre-processing. In Proceedings of the CMM’06, Brest, France, 16–19 October 2006. [Google Scholar]
  6. Rizzini, D.L. Integration of a stereo vision system into an autonomous underwater vehicle for pipe manipulation tasks. Com-Puter. Electr. Eng. 2017, 58, 560–571. [Google Scholar] [CrossRef]
  7. Brandou, V.; Allais, A.-G.; Perrier, M.; Malis, E.; Rives, P.; Sarrazin, J.; Sarradin, P.-M. 3D reconstruction of natural underwater scenes using the stereovision system IRIS. In Proceedings of the OCEANS 2007-Europe, Aberdeen, UK, 18–21 June 2007; pp. 1–6. [Google Scholar] [CrossRef] [Green Version]
  8. Skorohod, B.A.; Statsenko, A.V.; Fateev, S.I.; Zhilyakov, P.V. Accuracy analysis of 3D points reconstructed from workspace of underwater robot. J. Phys. Conf. Ser. 2020, 1661, 012124. [Google Scholar] [CrossRef]
  9. Prabhakar, C.J.; Praveen, K.P.U. 3D Surface Reconstruction of Underwater Objects. J. Comput. Eng. Inf. Technol. 2015, 5, 31–37. [Google Scholar] [CrossRef]
  10. Chen, Z.; Zhang, Z.; Dai, F.; Bu, Y.; Wang, H. Monocular Vision-Based Underwater Object Detection. Sensors 2017, 17, 1784. [Google Scholar] [CrossRef] [PubMed]
  11. Li, Y.; Lu, H.; Li, J.; Li, X.; Li, Y.; Serikawa, S. Underwater image de-scattering and classification by deep neural network. Comput. Electr. Eng. 2016, 54, 68–77. [Google Scholar] [CrossRef]
  12. Chen, Z.; Zhang, Z.; Bu, Y.; Dai, F.; Fan, T.; Wang, H. Underwater Object Segmentation Based on Optical Features. Sensors 2018, 18, 196. [Google Scholar] [CrossRef] [PubMed] [Green Version]
  13. Otsu, N. A threshold selection method from gray-level histograms. IEEE Trans. Sys. Man. Cyber. 1979, 9, 62–66. [Google Scholar] [CrossRef] [Green Version]
  14. Lee, D.; Kim, G.; Kim, D.; Myung, H.; Choi, H. Vision-based object detection and tracking for autonomous navigation of underwater robots. Ocean Eng. 2012, 48, 59–68. [Google Scholar] [CrossRef]
  15. Chen, B.; Li, R.; Bai, W.; Zhang, X.; Li, J.; Guo, R. Research on Recognition Method of Optical Detection Image of Underwater Robot for Submarine Cable. In Proceedings of the 2019 IEEE 3rd Advanced Information Management, Communicates, Electronic and Automation Control Conference (IMCEC), Chongqing, China, 11–13 October 2019; pp. 1973–1976. [Google Scholar] [CrossRef]
  16. Jordt, A.; Koch, R. Refractive calibration of underwater cameras. Computer Vision—ECCV 2012. ECCV 2012. In Proceedings of the 12th European Conference on Computer Vision, Florence, Italy, 7–13 October 2012; Springer: Berlin/Heidelberg, 2012. [Google Scholar] [CrossRef]
  17. Skorohod, B.A.; Zhiljakov, P.V.; Stacenko, A.V.; Fateev, S.I. Analysis of the accuracy of constructing 3D coordinates of the working space of an underwater robot. Environ. Control. Syst. 2020, 3, 163–170. (In Russian) [Google Scholar] [CrossRef]
  18. Ester, M.; Kriegel, H.-P.; Sander, J.; Xu, X. A Density-Based Algorithm for Discovering Clusters in Large Spatial Databases with Noise. In Proceedings of the Second International Conference on Knowledge Discovery and Data Mining, Portland, OR, USA, 2–4 August 1996; pp. 226–231. [Google Scholar]
  19. Recommendation ITU-R BT.601-7. Available online: https://www.itu.int/dms_pubrec/itu-r/rec/bt/R-REC-BT.601-7-201103-I!!PDF-E.pdf (accessed on 27 February 2023).
  20. Zhilyakov, P.V.; Fateev, S.I. Acceleration of the underwater system of technical stereo vision with the help of multithreaded organization of algorithms. Mar. Intellect. Technol. 2021, 4, 252–257. [Google Scholar] [CrossRef]
Figure 1. Appearance of the AUV.
Fluids 08 00092 g001
Figure 2. AUV compartment module for underwater video processing.
Fluids 08 00092 g002
Figure 3. Underwater TSS: (a) Inner module part; (b) Underwater technical stereo vision system.
Fluids 08 00092 g003
Figure 4. Camera cooling system.
Fluids 08 00092 g004
Figure 5. Underwater TSS: (a) Inner module part; (b) Underwater technical stereo-vision system.
Fluids 08 00092 g005
Figure 6. Graphical interface of the program.
Fluids 08 00092 g006
Figure 7. Illustration of the used 3D point searching algorithm disadvantage while searching for horizontal line points.
Fluids 08 00092 g007
Figure 8. The pixel brightness distribution examples for the brightness of different test figures in RGB format. (a) normal image; (b) illuminated image; and (c) darkened image.
Fluids 08 00092 g008
Figure 9. The pixel brightness distribution examples for the brightness of different test figures in HSV format.
Fluids 08 00092 g009
Figure 10. Object detection using the contour search algorithm and by color in HSV and RGB format.
Fluids 08 00092 g010
Figure 11. Object detection using the contour search algorithm and by color in HSV format: (a) image from the site https://fr.123rf.com/photo_48457131_cha%C3%AEne-de-bateau-et-l-ancre-de-la-bou%C3%A9e-jaune-sous-l-eau.html (accessed on 27 February 2023); (b) image from the site https://encrypted-tbn0.gstatic.com/images?q=tbn:ANd9GcQ-6KVaq_pgSxjzppRWaBGW9uACDkvuppdFWzckjhjVfhUdfqo4YbJe2MbdlsobcLJHZ3Q&usqp=CAU (accessed on 27 February 2023); (c) image from the site https://img.nauticexpo.fr/images_ne/photo-g/33919-13141410.jpg (accessed on 27 February 2023); and (d) image from the site https://www.techinsider.ru/technologies/264462-natsionalnyy-nauchnyy-fond-postroil-krupneyshuyu-v-mire-okeanicheskuyu-observatoriyu/ (accessed on 27 February 2023).
Fluids 08 00092 g011
Figure 12. The red color distribution histogram in RGB format, plotted for the image.
Fluids 08 00092 g012
Figure 13. Objects in the pool.
Fluids 08 00092 g013
Figure 14. Hue in HSV format.
Fluids 08 00092 g014
Figure 15. The resulting mask from the inRange method: (a) for the red color; (b) for the green color.
Fluids 08 00092 g015
Figure 16. Applying a mask on the main photo.
Fluids 08 00092 g016
Figure 17. The object’s mask with the threshold value.
Fluids 08 00092 g017
Figure 18. Found objects.
Fluids 08 00092 g018
Figure 19. Selecting only objects of interest.
Fluids 08 00092 g019
Figure 20. The experimental images.
Fluids 08 00092 g020
Figure 21. The result of the algorithm.
Fluids 08 00092 g021
Figure 22. Example of finding key points.
Fluids 08 00092 g022
Figure 23. Key points.
Fluids 08 00092 g023
Figure 24. Object clustering results: (a) Selected cylinder; (b) Selected ball.
Fluids 08 00092 g024
Figure 25. Orange tube detection under water: (a) the searched object in the air environment; (b) the searched object in the water environment; (c) program operation.
Fluids 08 00092 g025
Figure 26. Underwater objects example.
Fluids 08 00092 g026
Table 1. TSS camera parameters determined during the research.
EnvironmentCamera SettingsLens Parameters
PhotosensitivityExposure Time, sAperture, Aperture NumberFocus Distance, m
WaterAutoAuto (1⁄200)F20.91
Disclaimer/Publisher’s Note: The statements, opinions and data contained in all publications are solely those of the individual author(s) and contributor(s) and not of MDPI and/or the editor(s). MDPI and/or the editor(s) disclaim responsibility for any injury to people or property resulting from any ideas, methods, instructions or products referred to in the content.

