

Universal Behavior of Fractal Water Structures Observed in Various Gelation Mechanisms of Polymer Gels, Supramolecular Gels, and Cement Gels
 , , and
Abstract
:1. Introduction
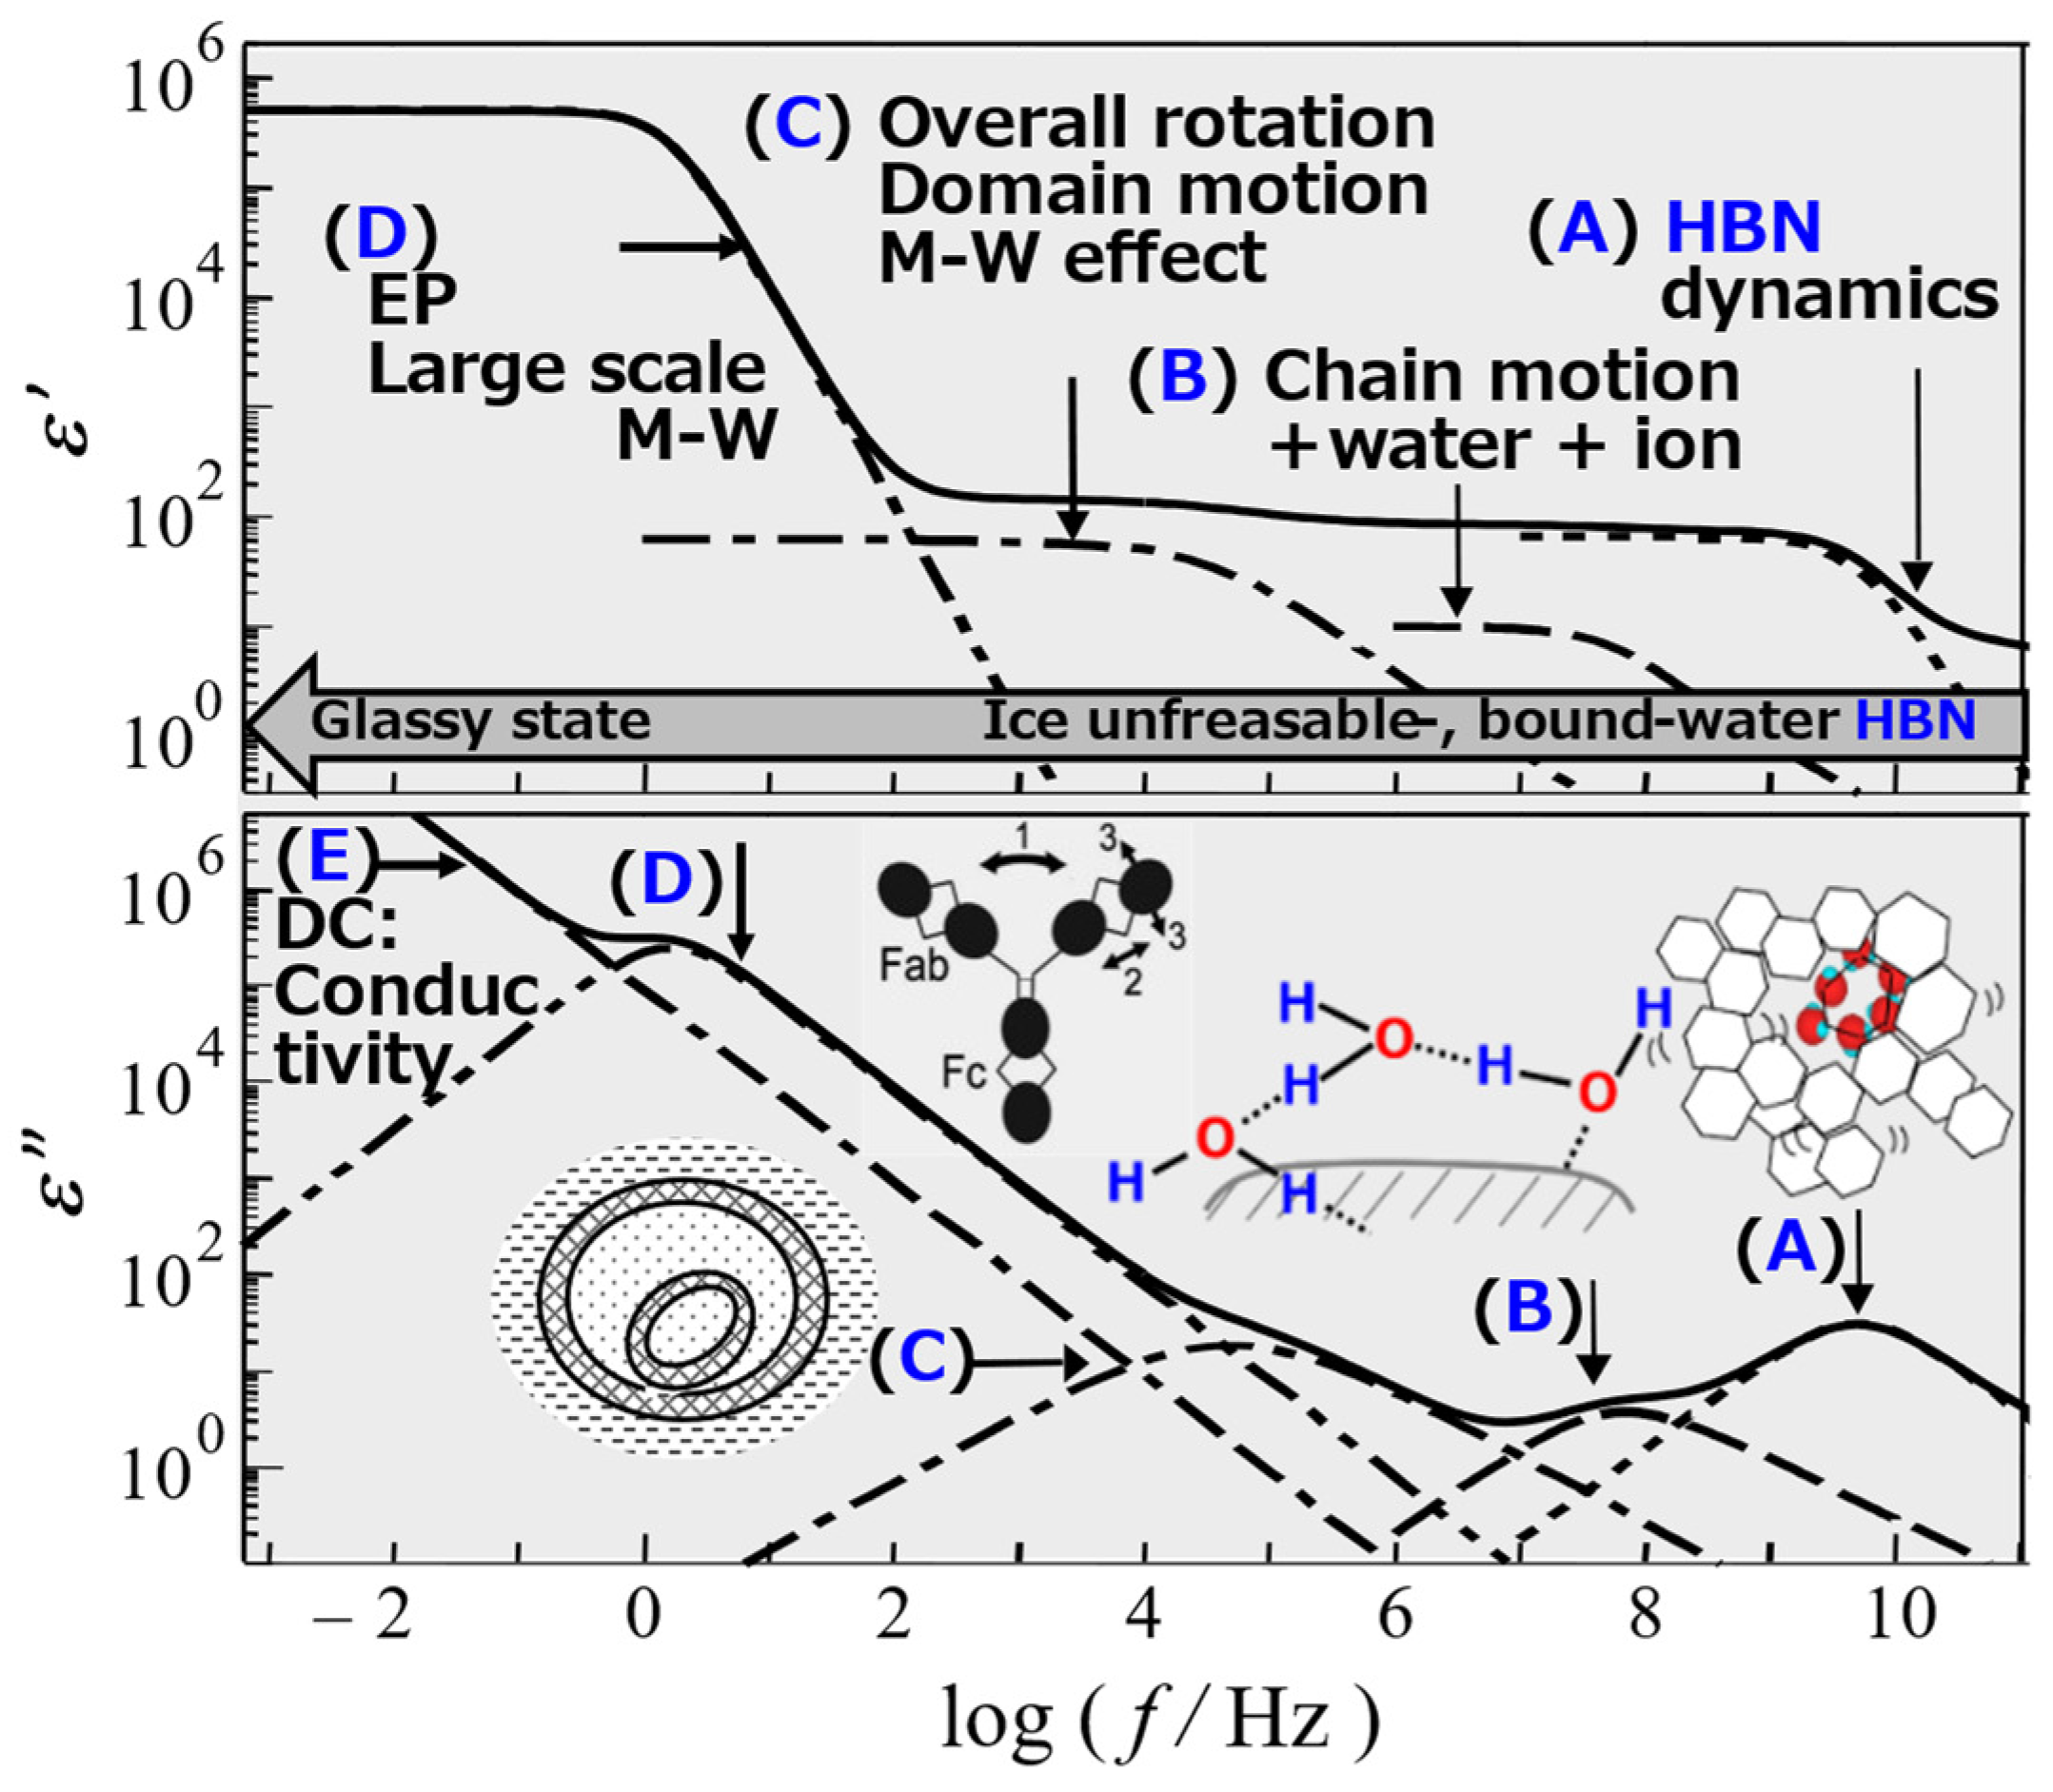
2. HBN Fragmentation Model
- Ion migration in large-scale heterogeneous structures reflected by the Maxwell–Wagner effect of interfacial polarization [39].
- Stability and variability of complex materials to assess states such as stability of states of matter and tissue homeostasis [40].
3. Results and Discussion
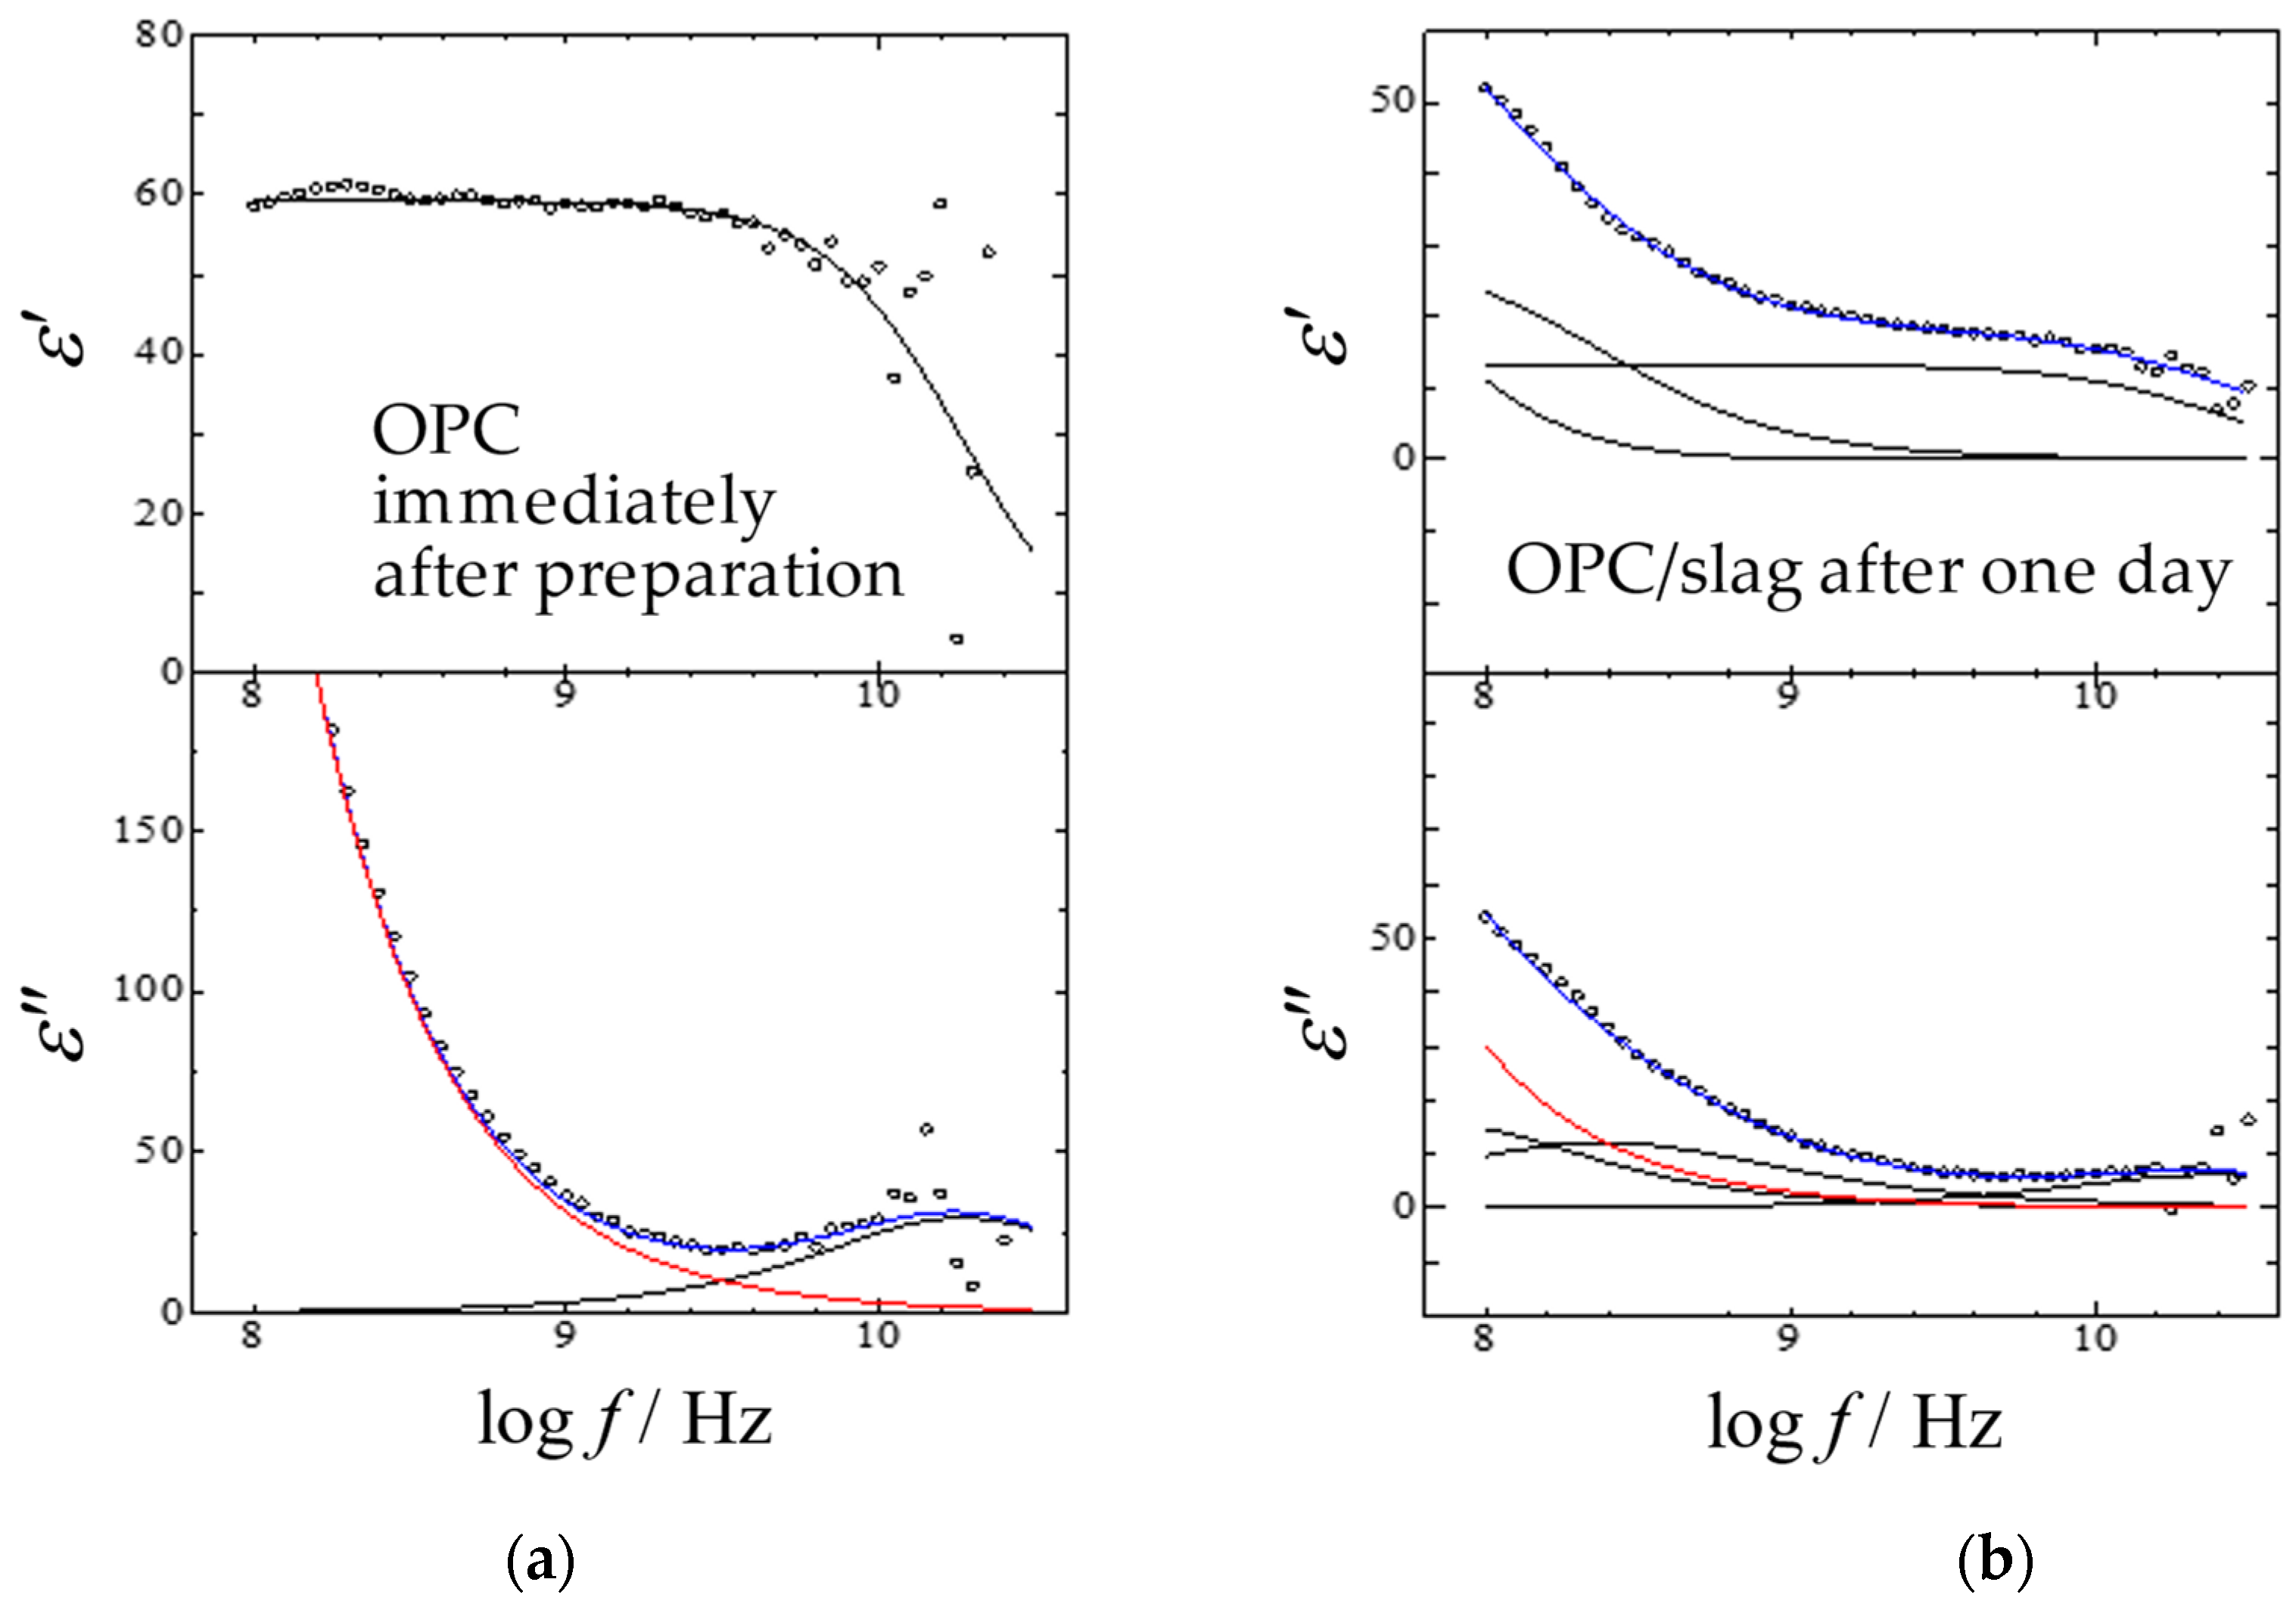
3.1. GHz Relaxation Process Observed for Cement Gels
3.2. Diagrams of the Relaxation Time vs. Its Distribution Parameter
3.2.1. Polymer Gels
3.2.2. Supramolecular Gels
3.2.3. Cement Gels
4. Conclusions
5. Materials and Methods
5.1. Sample Preparations
5.2. Dielectric Measurements
Author Contributions
Funding
Institutional Review Board Statement
Informed Consent Statement
Data Availability Statement
Acknowledgments
Conflicts of Interest
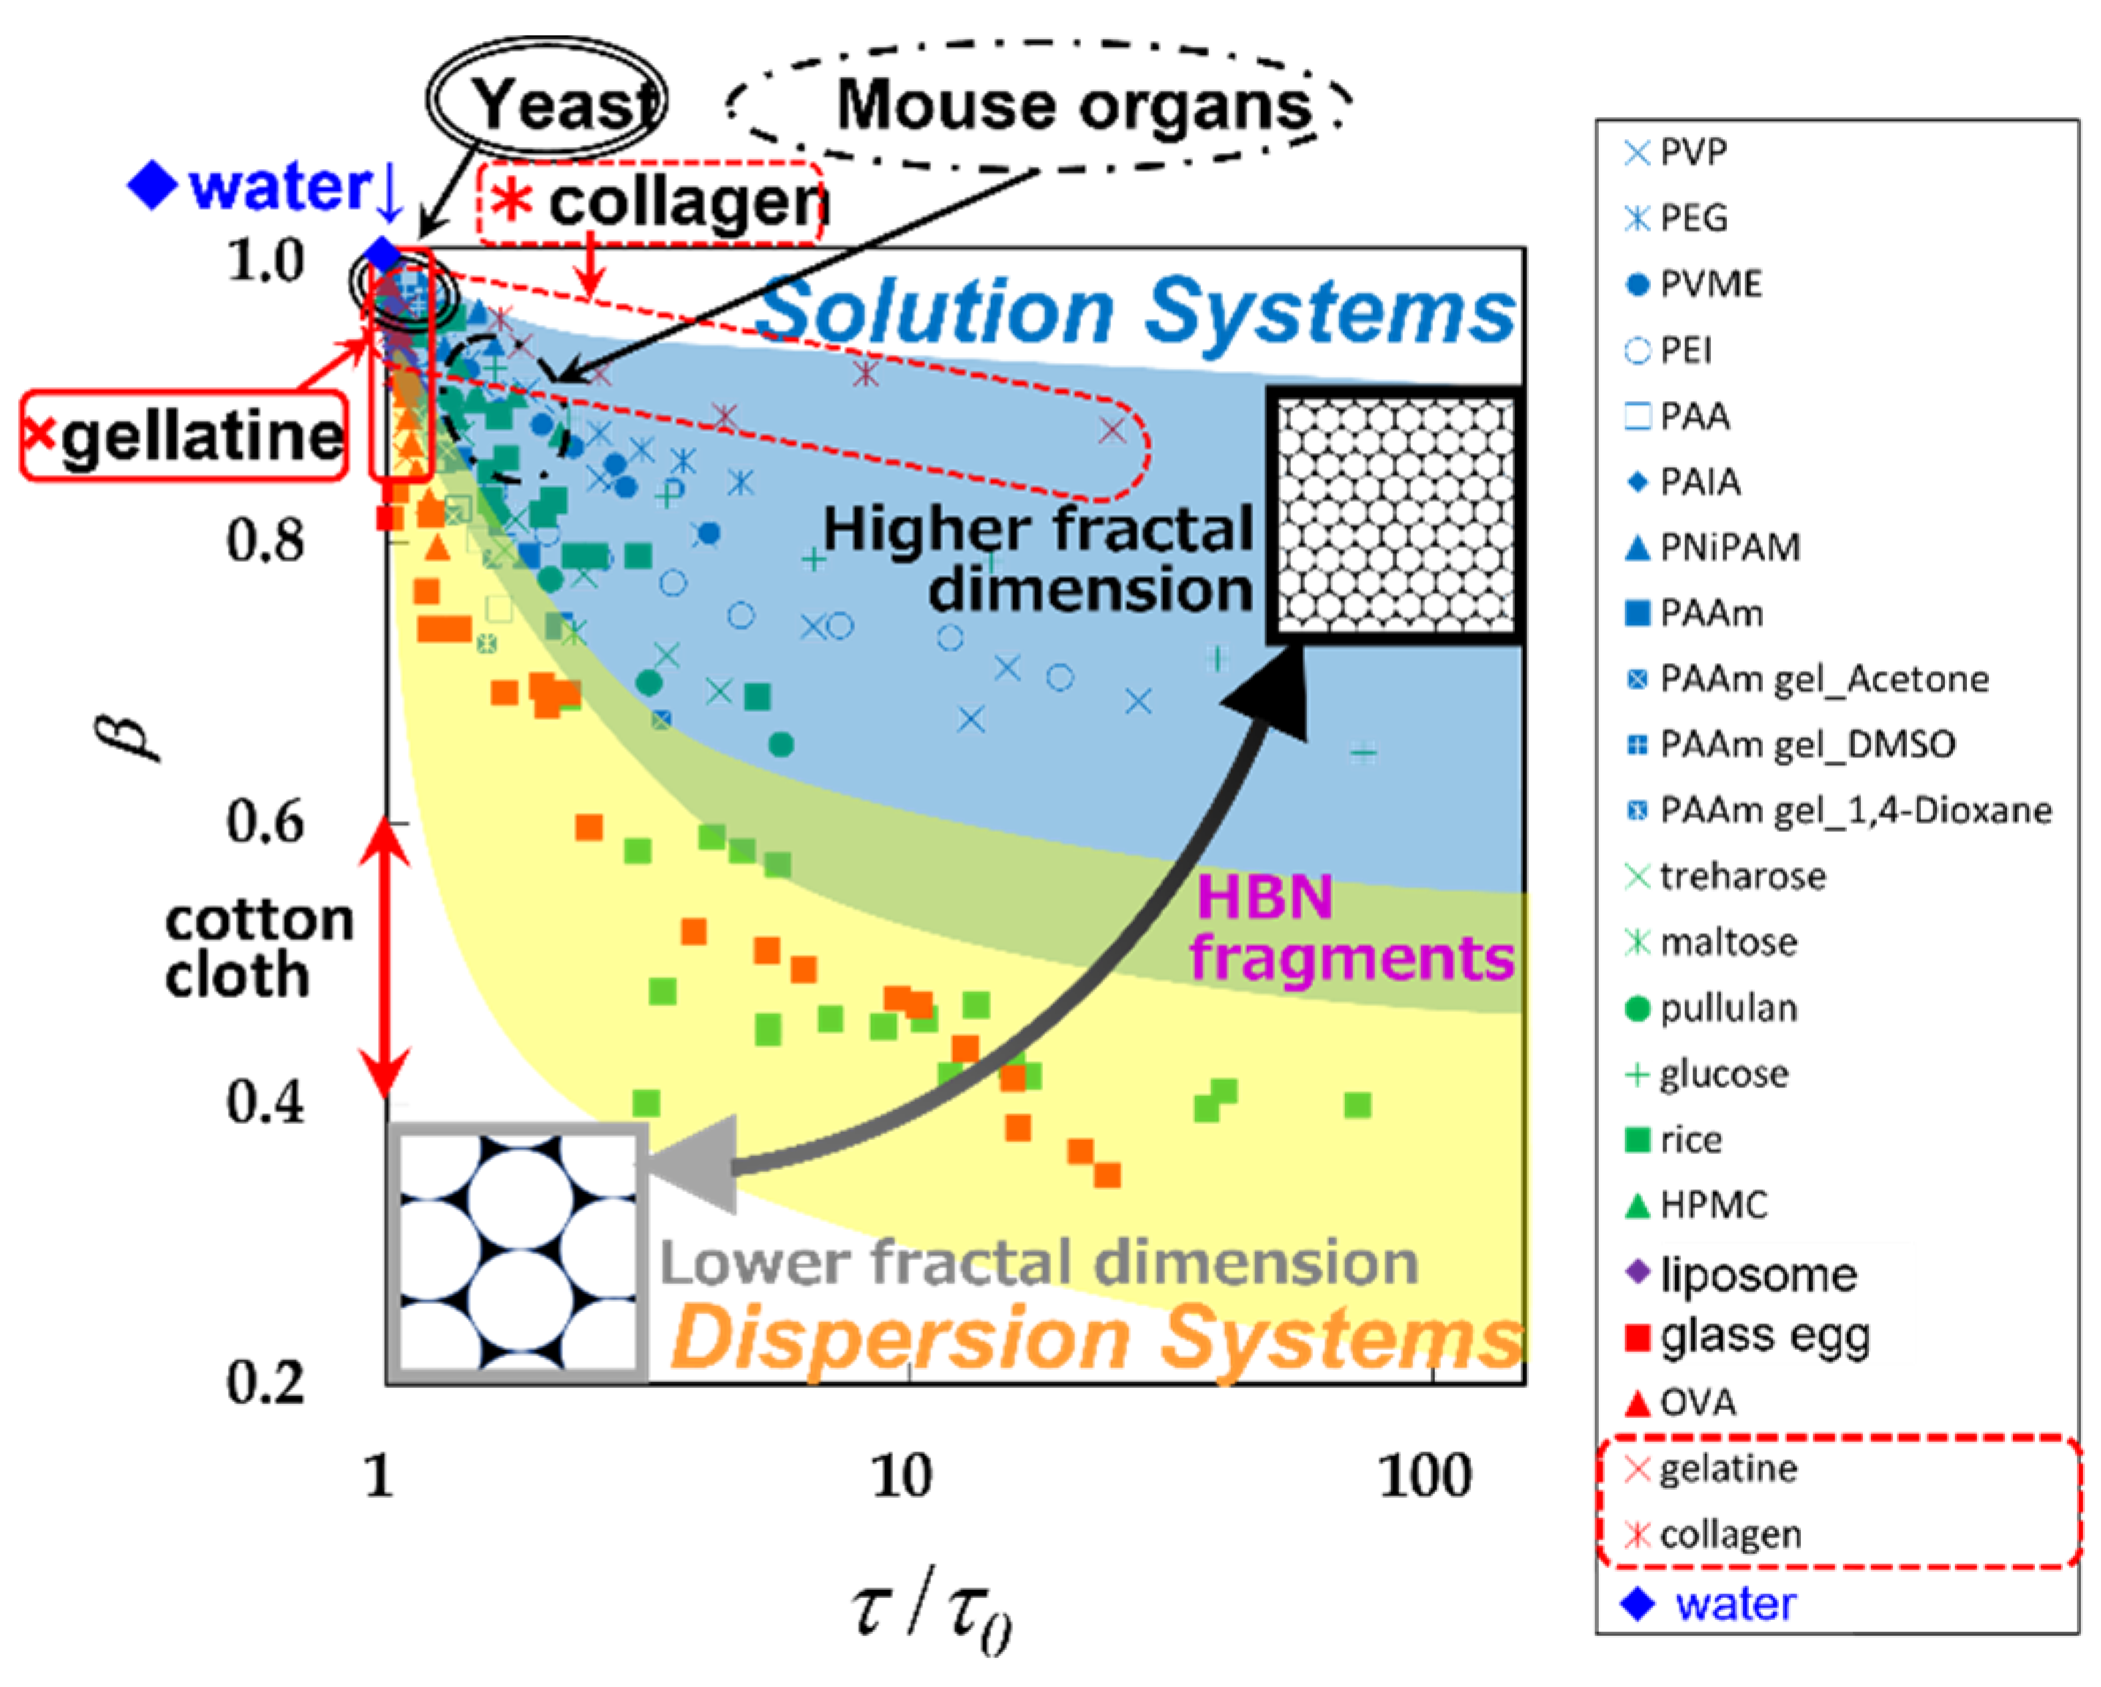
Appendix A. τ–β Diagram
References
- Tanaka, T. Gels. Sci. Am. 1981, 244, 124–138. [Google Scholar] [CrossRef]
- Tokita, M. Transport phenomena in gel. Gels 2016, 2, 17. [Google Scholar] [CrossRef] [PubMed] [Green Version]
- Weiss, R.G. (Ed.) Molecular Gels—Structure and Dynamics; Royal Society of Chemistry: Cambridge, UK, 2018. [Google Scholar]
- Debye, P. Zur theorie der anomalen dispersion im gebiete der langwelligen elektrischen strahlung. Verh. Dtsch. Phys. Ges. 1913, 15, 777–793. [Google Scholar]
- Fröhlich, H. Theory of Dielectrics: Dielectric Constant and Dielectric Loss (Monographs on the Physics and Chemistry of Materials), 2nd ed.; Clarendon Press: Oxford, UK, 1986. [Google Scholar]
- Kremer, F.; Schoenhals, A. (Eds.) Broadband Dielectric Spectroscopy; Springer: Berlin/Heidelberg, Germany, 2002. [Google Scholar]
- Yagihara, S. Chapter 8: Dynamics of water, biomaterials, and skin investigated by means of dielectric relaxation spectroscopy. In Nano/Micro Science and Technology in Biorheology; Kita, R., Dobashi, T., Eds.; Springer: Tokyo, Japan, 2015; pp. 183–213. [Google Scholar] [CrossRef]
- Yagihara, S.; Kita, R.; Shinyashiki, N.; Saito, H.; Maruyama, Y.; Kawaguchi, T.; Shoji, K.; Saito, T.; Aoyama, T.; Shimazaki, K.; et al. Physical Meanings of Fractal Behaviors of Water in Aqueous and Biological Systems with Open-Ended Coaxial Electrodes. Sensors 2019, 19, 2606. [Google Scholar] [CrossRef] [Green Version]
- Tokita, M.; Tanaka, T. Reversible decrease of gel-solvent friction. Science 1991, 253, 1121–1123. [Google Scholar] [CrossRef] [Green Version]
- Tokita, M. Friction between polymer network of gels and solvent. Adv. Polym. Sci. 1993, 110, 27–47. [Google Scholar] [CrossRef]
- Tokita, M.; Miyoshi, T.; Takegoshi, K.; Hikichi, K. Probe diffusion in gels. Phys. Rev. E 1996, 53, 1823. [Google Scholar] [CrossRef]
- Matsukawa, S.; Ando, I. A study of self-diffusion of molecules in polymer gel by pulsed-gradient spin—Echo 1H NMR. Macromolecules 1996, 29, 7136–7140. [Google Scholar] [CrossRef]
- Matsukawa, S.; Sagae, D.; Mogi, A. Molecular diffusion in polysaccharide gel systems as observed by NMR. Progr. Colloid Polym. Sci. 2009, 136, 171–176. [Google Scholar] [CrossRef]
- Ryabov, Y.E.; Feldman, Y. Novel approach to the analysis of the non-Debye dielectric spectrum broadening. Physica A 2002, 314, 370–378. [Google Scholar] [CrossRef]
- Ryabov, Y.E.; Feldman, Y.; Shinyashiki, N.; Yagihara, S. The symmetric broadening of the water relaxation peak in polymer–water mixtures and its relationship to the hydrophilic and hydrophobic properties of polymers. J. Chem. Phys. 2002, 116, 8610–8615. [Google Scholar] [CrossRef]
- Feldman, Y.; Puzenko, A.; Ryabov, Y.E. Non-Debye dielectric relaxation in complex materials. Chem. Phys. 2002, 284, 139–168. [Google Scholar] [CrossRef]
- Puzenko, A.; Ishai, P.B.; Feldman, Y. Cole-Cole Broadening in Dielectric Relaxation and Strange Kinetics. Phys. Rev. Lett. 2010, 105, 037601. [Google Scholar] [CrossRef] [PubMed]
- Levy, E.; Puzenko, A.; Kaatze, U.; Ishai, P.B.; Feldman, Y. Dielectric spectra broadening as the signature of dipolematrix interaction. I. Water in nonionic solutions. J. Chem. Phys. 2012, 136, 114502. [Google Scholar] [CrossRef]
- Levy, E.; Puzenko, A.; Kaatze, U.; Ishai, P.B.; Feldman, Y. Dielectric spectra broadening as the signature of dipolematrix interaction. II. Water in ionic solutions. J. Chem. Phys. 2012, 136, 114503. [Google Scholar] [CrossRef]
- Kaatze, U.; Behrends, R.; Pottel, R. Hydrogen network fluctuations and dielectric spectrometry of liquids. J. Non-Cryst. Solids 2002, 305, 19–28. [Google Scholar] [CrossRef]
- Shinyashiki, N.; Imoto, D.; Yagihara, S. Broadband dielectric study of dynamics of polymer and solvent in poly (vinyl pyrrolidone)/normal alcohol mixtures. J. Phys. Chem. B 2007, 111, 2181–2187. [Google Scholar] [CrossRef]
- Maruyama, Y.; Numamoto, Y.; Saito, H.; Kita, R.; Shinyashiki, N.; Yagihara, S.; Fukuzaki, M. Complementary analyses of fractal and dynamic water structures in protein–water mixtures and cheeses. Coll. Surf. A Physicochem. Eng. Asp. 2014, 440, 42–48. [Google Scholar] [CrossRef] [Green Version]
- Yamada, G.; Hashimoto, T.; Morita, T.; Shinyashiki, N.; Yagihara, S.; Tokita, M. Dielectric study on dynamics for volume phase transition of PAAm gel in acetone-water system. Trans. Mater. Res. Soc. Japan 2001, 26, 701–704. [Google Scholar]
- Yagihara, S.; Miura, N.; Hayashi, Y.; Miyairi, H.; Asano, M.; Yamada, G.; Shinyashiki, N.; Mashimo, S.; Umehara, T.; Tokita, M.; et al. Microwave dielectric study on water structure and physical properties of aqueous systems using time domain reflectometry with flat-end cells. Subsurf. Sens. Technol. Appl. 2001, 2, 15–30. [Google Scholar] [CrossRef]
- Miki, H.; Yagihara, S.; Mukai, S.A.; Tokita, M. Swelling equilibrium of a gel in binary mixed solvents. Prog. Colloid Polym. Sci. 2009, 136, 101–106. [Google Scholar] [CrossRef]
- Kawaguchi, T.; Kita, R.; Shinyashiki, N.; Yagihara, S.; Fukuzaki, M. Physical Properties of Tofu Gel Probed by Water Translational/Rotational Dynamics. Food Hydrocoll. 2017, 77, 474–481. [Google Scholar] [CrossRef]
- Saito, H.; Kato, S.; Matsumoto, K.; Umino, Y.; Kita, R.; Shinyashiki, N.; Yagihara, S.; Fukuzaki, M.; Tokita, M. Dynamic behaviors of solvent molecules restricted in poly (acryl amide) gels analyzed by dielectric and difusion NMR spectroscopy. Gels 2018, 4, 56. [Google Scholar] [CrossRef] [Green Version]
- Kundu, S.K.; Matsunaga, T.; Yoshida, M.; Shibayama, M. Rheological Study on Rapid Recovery of Hydrogel Based on Oligomeric Electrolyte. J. Phys. Chem. B 2008, 112, 11537–11541. [Google Scholar] [CrossRef]
- Kundu, S.K.; Yagihara, S.; Yoshida, M.; Shibayama, M. Microwave Dielectric Study of an Oligomeric Electrolyte Gelator by Time Domain Reflectometry. J. Phys. Chem. B 2009, 113, 10112–10116. [Google Scholar] [CrossRef]
- Shimizu, K.; Abe, F.; Kishi, Y.; Kita, R.; Shinyashiki, N.; Yagihara, S. Dielectric study on supramolecular gels by fiber structure formation from low molecular weight gelator/water mixtures. Gels 2023, 9, 408. [Google Scholar] [CrossRef]
- Miura, N.; Shinyashiki, N.; Yagihara, S.; Shiotsubo, M. Microwave Dielectric Study of Water Structure in the Hydration Process of Cement Paste. J. Am. Ceram. Soc. 1998, 81, 213–216. [Google Scholar] [CrossRef]
- Yagihara, S.; Shinyashiki, N.; Hayashi, Y.; Asano, M.; Shiotsubo, M.; Kato, Y.; Uomoto, T.; Arino, M.; Tokunaga, T.; Noto, K.; et al. Application of the Dielectric Measurement for Non-Destructive Test of Mortar. In Non-Destructive Testing in Civil Engineering; Uomoto, T., Ed.; Elsevier: Tokyo, Japan, 2000; pp. 79–86. [Google Scholar]
- Yagihara, S.; Asano, M.; Shinyashiki, N. Broadband Dielectric Spectroscopy Study on Hydration of Cement and Some Aqueous Solution and Dispersion Systems. In Proceedings of the International Society of Electromagnetic Aquametry (ISEMA2007), Hamamatsu, Japan, 15–18 April 2007; Volume 7, pp. 11–18. [Google Scholar]
- Abe, Y.; Asano, M.; Kita, R.; Shinyashiki, N.; Yagihara, S. Dielectric study on molecular dynamics in cement hydration. Trans. Mater. Res. Soc. Jpn. 2008, 33, 447–450. [Google Scholar] [CrossRef]
- Abe, F.; Nishi, A.; Saito, H.; Asano, M.; Watanabe, S.; Kita, R.; Shinyashiki, N.; Yagihara, S.; Fukuzaki, M.; Sudo, S.; et al. Dielectric study on hierarchical water structures restricted in cement and wood materials. Meas. Sci. Technol. 2017, 28, 044008-1–044008-9. [Google Scholar] [CrossRef]
- Cole, K.S.; Cole, R.H. Dispersion and Absorption in Dielectrics I. Alternating Current Characteristics. J. Chem. Phys. 1941, 9, 341. [Google Scholar] [CrossRef] [Green Version]
- Yagihara, S.; Saito, H.; Sugimoto, H.; Kawaguchi, T.; Fukuzaki, M.; Igarashi, T.; Hoshi, N.; Nakamura, K. Evaluation of water structures in cotton cloth by fractal analysis with broadband dielectric spectroscopy. J. Mater. Sci. 2021, 56, 17844–17859. [Google Scholar] [CrossRef]
- Yagihara, S.; Saito, H.; Sugimoto, H.; Kawaguchi, T.; Fukuzaki, M.; Igarashi, T.; Hoshi, N.; Nakamura, K. Fractal water structures affected by softener agent in cotton cloths. J. Mater. Sci. 2022, 57, 13060–13077. [Google Scholar] [CrossRef]
- Shoji, K.; Saito, T.; Kita, R.; Shinyashiki, N.; Yagihara, S.; Fukuzaki, M.; Ohzono, T.; Nishimura, S.; Hayashi, M.; Tanaka, H. Dynamics and Aggregate Structuring of Water Molecules in Edible Oil Analyzed by Dielectric Spectroscopy. Trans. Mater. Res. Soc. Jpn. 2018, 43, 201–204. [Google Scholar] [CrossRef] [Green Version]
- Yagihara, S.; Saito, T.; Asano, H.; Furuhata, K.; Maruyama, Y.; Saito, H.; Masuda, H.; Kita, R.; Shinyashiki, N. Analytical approach to spatial distribution of water molecules by dielectric measurements. In Proceedings of the 2021 13th International Conference on Electromagnetic Wave Interaction with Water and Moist Substances (ISEMA), Kiel, Germany, 26–30 July 2021; pp. 6–9. [Google Scholar] [CrossRef]
- Liu, Y.; Li, Y.; Jin, C.; Mu, J. Effect of water-cement ratio on the electromagnetic shielding performance of C3S paste cured long-term. Archiv. Civ. Mech. Eng. 2023, 23, 83. [Google Scholar] [CrossRef]
- Hamadouche, S.A.; Honorio, T.; Bore, T.; Benboudjema, F.; Daout, F.; Vourc’h, E. Dielectric permittivity of C-S-H. Cem. Concr. Res. 2023, 169, 107178. [Google Scholar] [CrossRef]
- Meng, M.; Chen, Z.; Wang, F. Comprehensive dielectric model of cement concrete including frequency and temperature. Adv. Cem. Res. 2023, 35, 167–179. [Google Scholar] [CrossRef]
- Taylor, H.F.W. Cement Chemistry, 2nd ed.; Thomas Telford Publishing: London, UK, 1997. [Google Scholar]
- Bye, G.C. Portland Cement: Composition, Production and Properties, 2nd ed.; ICE publishing: London, UK, 1999. [Google Scholar]
- Hager, N.E., III; Domszy, R.C. Monitoring of cement hydration by broadband time-domain-reflectometry dielectric spectroscopy. J. Appl. Phys. 2004, 96, 5117–5128. [Google Scholar] [CrossRef]
- Bhatty, J.I. A review of the application of thermal analysis to cement-admixture systems. Thermochim. Acta 1991, 189, 313–350. [Google Scholar] [CrossRef]
- Shi, C.; Day, R.L. A calorimetric study of early hydration of alkali-slag cements. Cem. Concr. Res. 1995, 25, 1333–1346. [Google Scholar] [CrossRef]
- Langan, B.W.; Weng, K.; Ward, M.A. Effect of silica fume and fly ash on heat of hydration of Portland cement. Cem. Concr. Res. 2002, 32, 1045–1051. [Google Scholar] [CrossRef]
- Tanaka, T. Collapse of gels and the critical endpoint. Phys. Rev. Lett. 1978, 40, 820–823. [Google Scholar] [CrossRef]
- Tanaka, T.; Fillmore, D.; Sun, S.T.; Nishio, I.; Swislow, G.; Shah, A. Phase transitions in ionic gels. Phys. Rev. Lett. 1980, 45, 1636–1639. [Google Scholar] [CrossRef]
- Tanaka, T.; Sun, S.T.; Hirokawa, Y.; Katayama, S.; Kucera, J.; Hirose, Y.; Amiya, T. Mechanical instability of gels at the phase transition. Nature 1987, 325, 796–798. [Google Scholar] [CrossRef]
- Sato, M.E.; Tanaka, T. Kinetics of discontinuous volume—Phase transition of gels. J. Chem. Phys. 1988, 89, 1695–1703. [Google Scholar] [CrossRef]
- Friesen, S.; Hannappel, Y.; Kakorin, S.; Hellweg, T. Comparison of different approaches to describe the thermotropic volume phase transition of smart microgels. Colloid Polym. Sci. 2022, 300, 1235–1245. [Google Scholar] [CrossRef]
- Matsumoto, S.; Hamachi, I. The Supramolecular Hydrogel toward “The Smart Biomaterials”. Dojin News 2006, 118, 1–16. [Google Scholar]
- Wang, G.; Hamilton, A.D. Low molecular weight organogelators for water. Chem. Commun. 2003, 3, 310–311. [Google Scholar] [CrossRef]
- Ono, F.; Ichimaru, K.; Hirata, O.; Shinkai, S.; Watanabe, H. Universal Glucose-based Low-molecular-weight Gelators for Both Organic and Aqueous Solvents. Chem. Lett. 2020, 49, 156–159. [Google Scholar] [CrossRef]
- Chen, X.M.; Feng, W.J.; Bisoyi, H.K.; Zhang, S.; Chen, X.; Yang, H.; Li, Q.L. Light-activated photodeformable supramolecular dissipative self-assemblies. Nat. Commun. 2022, 13, 3216. [Google Scholar] [CrossRef]
- He, Y.; Tang, Y.; Zhang, Y.; MacFarlane, L.; Shang, J.; Shi, H.; Xie, O.; Zhao, H.; Manners, I.; Guo, J. Driving forces and molecular interactions in the self-assembly of block copolymers to form fiber-like micelles. Appl. Phys. Rev. 2022, 9, 021301. [Google Scholar] [CrossRef]
- Adams, D.J. Personal Perspective on Understanding Low Molecular Weight Gels. J. Am. Chem. Soc. 2022, 144, 11047–11053. [Google Scholar] [CrossRef]
- Kohler, K.; Forster, G.; Hauser, A.; Dobner, B.; Heiser, U.F.; Ziethe, F.; Richter, W.; Steiniger, F.; Drechsler, M.; Stettin, H.; et al. Temperature-Dependent Behavior of a Symmetric Long-Chain Bolaamphiphile with Phosphocholine Headgroups in Water: From Hydrogel to Nanoparticles. J. Am. Chem. Soc. 2004, 126, 16804–16813. [Google Scholar] [CrossRef]
- Hosoi, Y.; Kita, R.; Shinyashiki, N.; Yagihara, S. Dielectric study of liposome dispersion using statistical analysis of jitter. Trans. Mater. Res. Soc. Jpn. 2010, 35, 861–864. [Google Scholar] [CrossRef] [Green Version]
- Kundu, S.K.; Choe, S.; Sasaki, K.; Kita, R.; Shinyashiki, N.; Yagihara, S. Relaxation dynamics of liposome in an aqueous solution. Phys. Chem. Chem. Phys. 2015, 17, 18449–18455. [Google Scholar] [CrossRef]
- Zhang, R.; Ding, F.; Zhang, Y.; Zhou, C.; Zhang, W.; Shi, J.; Zou, X.; Xiao, J. Freezing characteristics and relative permittivity of rice flour gel in pulsed electric field assisted freezing. Food Chem. 2022, 373A, 131449. [Google Scholar] [CrossRef]
- Shu, J.; McClements, D.J.; Luo, S.; Ye, J.; Liu, C. Effect of internal and external gelation on the physical properties, water distribution, and lycopene encapsulation properties of alginate-based emulsion gels. Food Hydrocoll. 2023, 139, 108499. [Google Scholar] [CrossRef]
- Maruyama, Y.; Kamata, H.; Watanabe, S.; Kita, R.; Shinyashiki, N.; Yagihara, S. Electric-field penetration depth and dielectric spectroscopy observations of human skin. Ski. Res. Technol. 2019, 26, 255–262. [Google Scholar] [CrossRef]
- Mehta, P.K. History and status of performance tests for evaluation of soundness of cements. In Cement Standards—Evolution and Trends; Mehta, P.K., Ed.; ASTM International: West Conshohocken, PA, USA, 1978; pp. 35–60. [Google Scholar]
- Kabir, H.; Hooton, R.D.; Popoff, N.J. Evaluation of cement soundness using the ASTM C151 autoclave expansion test. Cem. Concr. Res. 2020, 136, 106159. [Google Scholar] [CrossRef]
- Cole, R.H. Evaluation of dielectric behavior by time domain spectroscopy. I. Dielectric response by real time analysis. J. Phys. Chem. 1975, 79, 1459–1469. [Google Scholar] [CrossRef]
- Cole, R.H. Evaluation of dielectric behavior by time domain spectroscopy. II. Complex permittivity. J. Phys. Chem. 1975, 79, 1469–1474. [Google Scholar] [CrossRef]
- Cole, R.H.; Mashimo, S.; Winsor, P., IV. Evaluation of dielectric behavior by time domain spectroscopy. 3. Precision difference methods. J. Phys. Chem. 1980, 84, 786–793. [Google Scholar] [CrossRef]
- Cole, R.H.; Berberian, J.G.; Mashimo, S.; Chryssikos, G.; Burns, A.; Tombari, E. Time domain reflection methods for dielectric measurements to 10 GHz. J. Appl. Phys. 1989, 66, 793. [Google Scholar] [CrossRef]
- Nozaki, R.; Bose, T.K. Broadband Complex Permittivity Measurements by Time-Domain Spectroscopy. IEEE Trans. Inst. Meas. 1990, 39, 945–951. [Google Scholar] [CrossRef]


 ), before (
 ) and after (
 ) decreasing relaxation curve, and after one day (
 ). The solid lines were obtained from the fitting procedures.
), before () and after () decreasing relaxation curve, and after one day (). The solid lines were obtained from the fitting procedures.
). The solid lines were obtained from the fitting procedures.
), before () and after () decreasing relaxation curve, and after one day (). The solid lines were obtained from the fitting procedures.

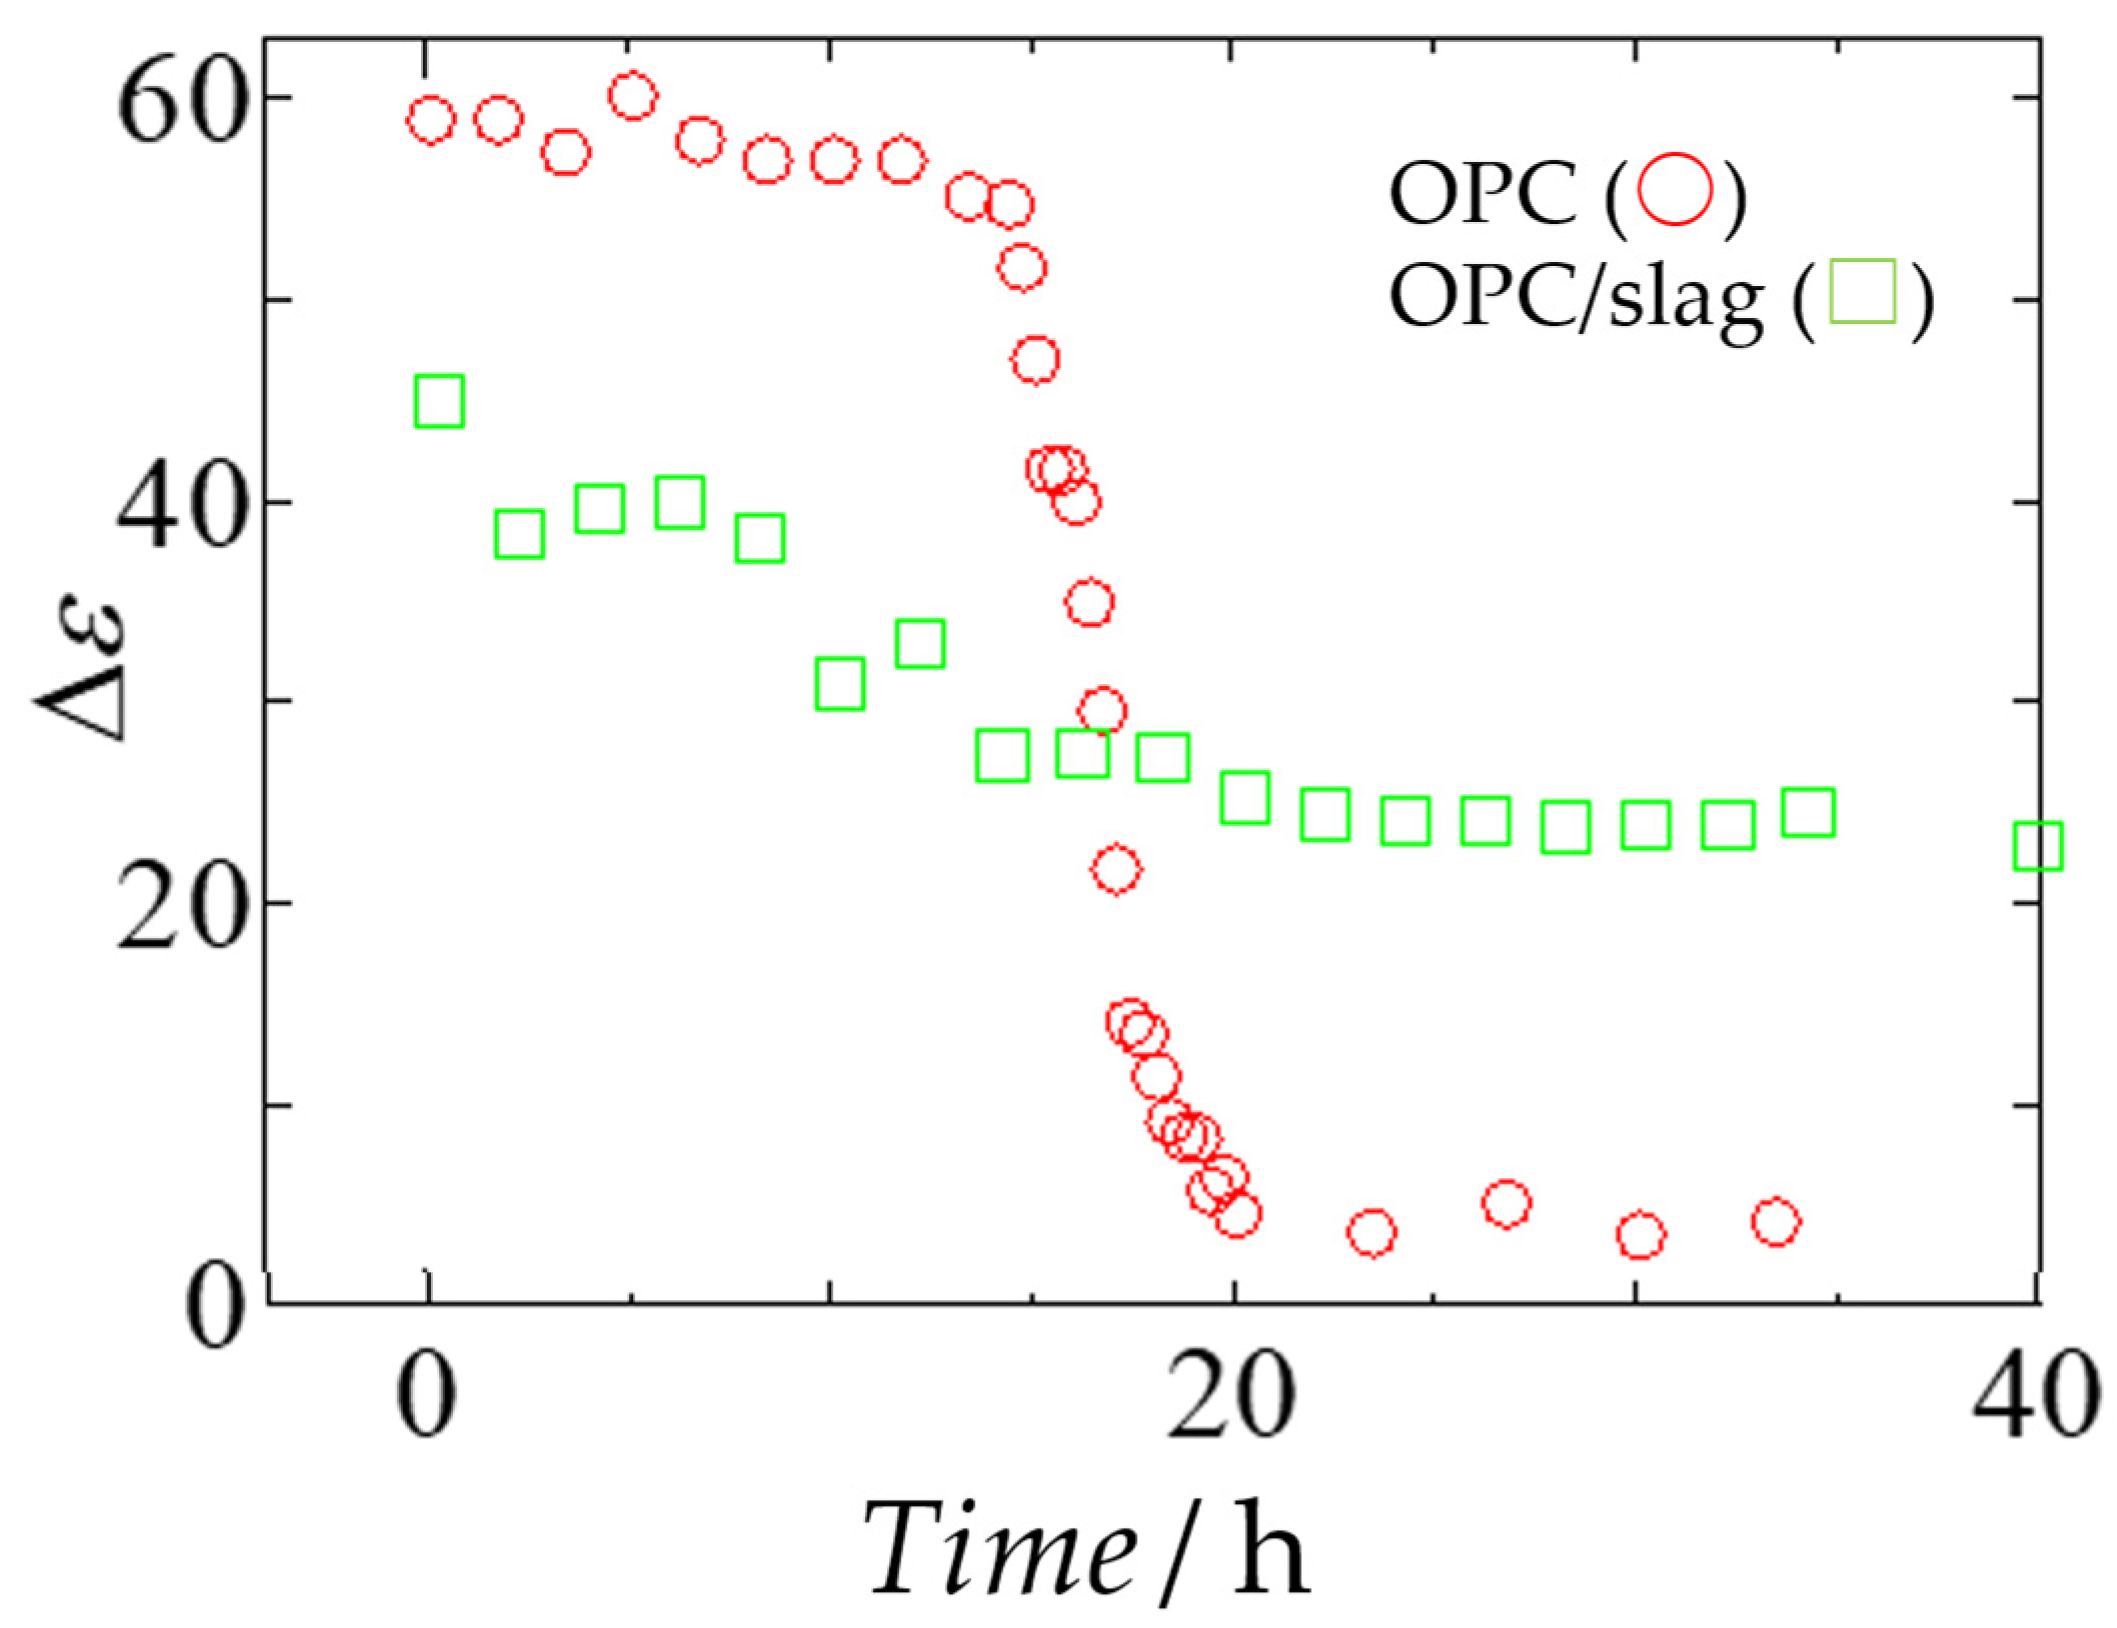
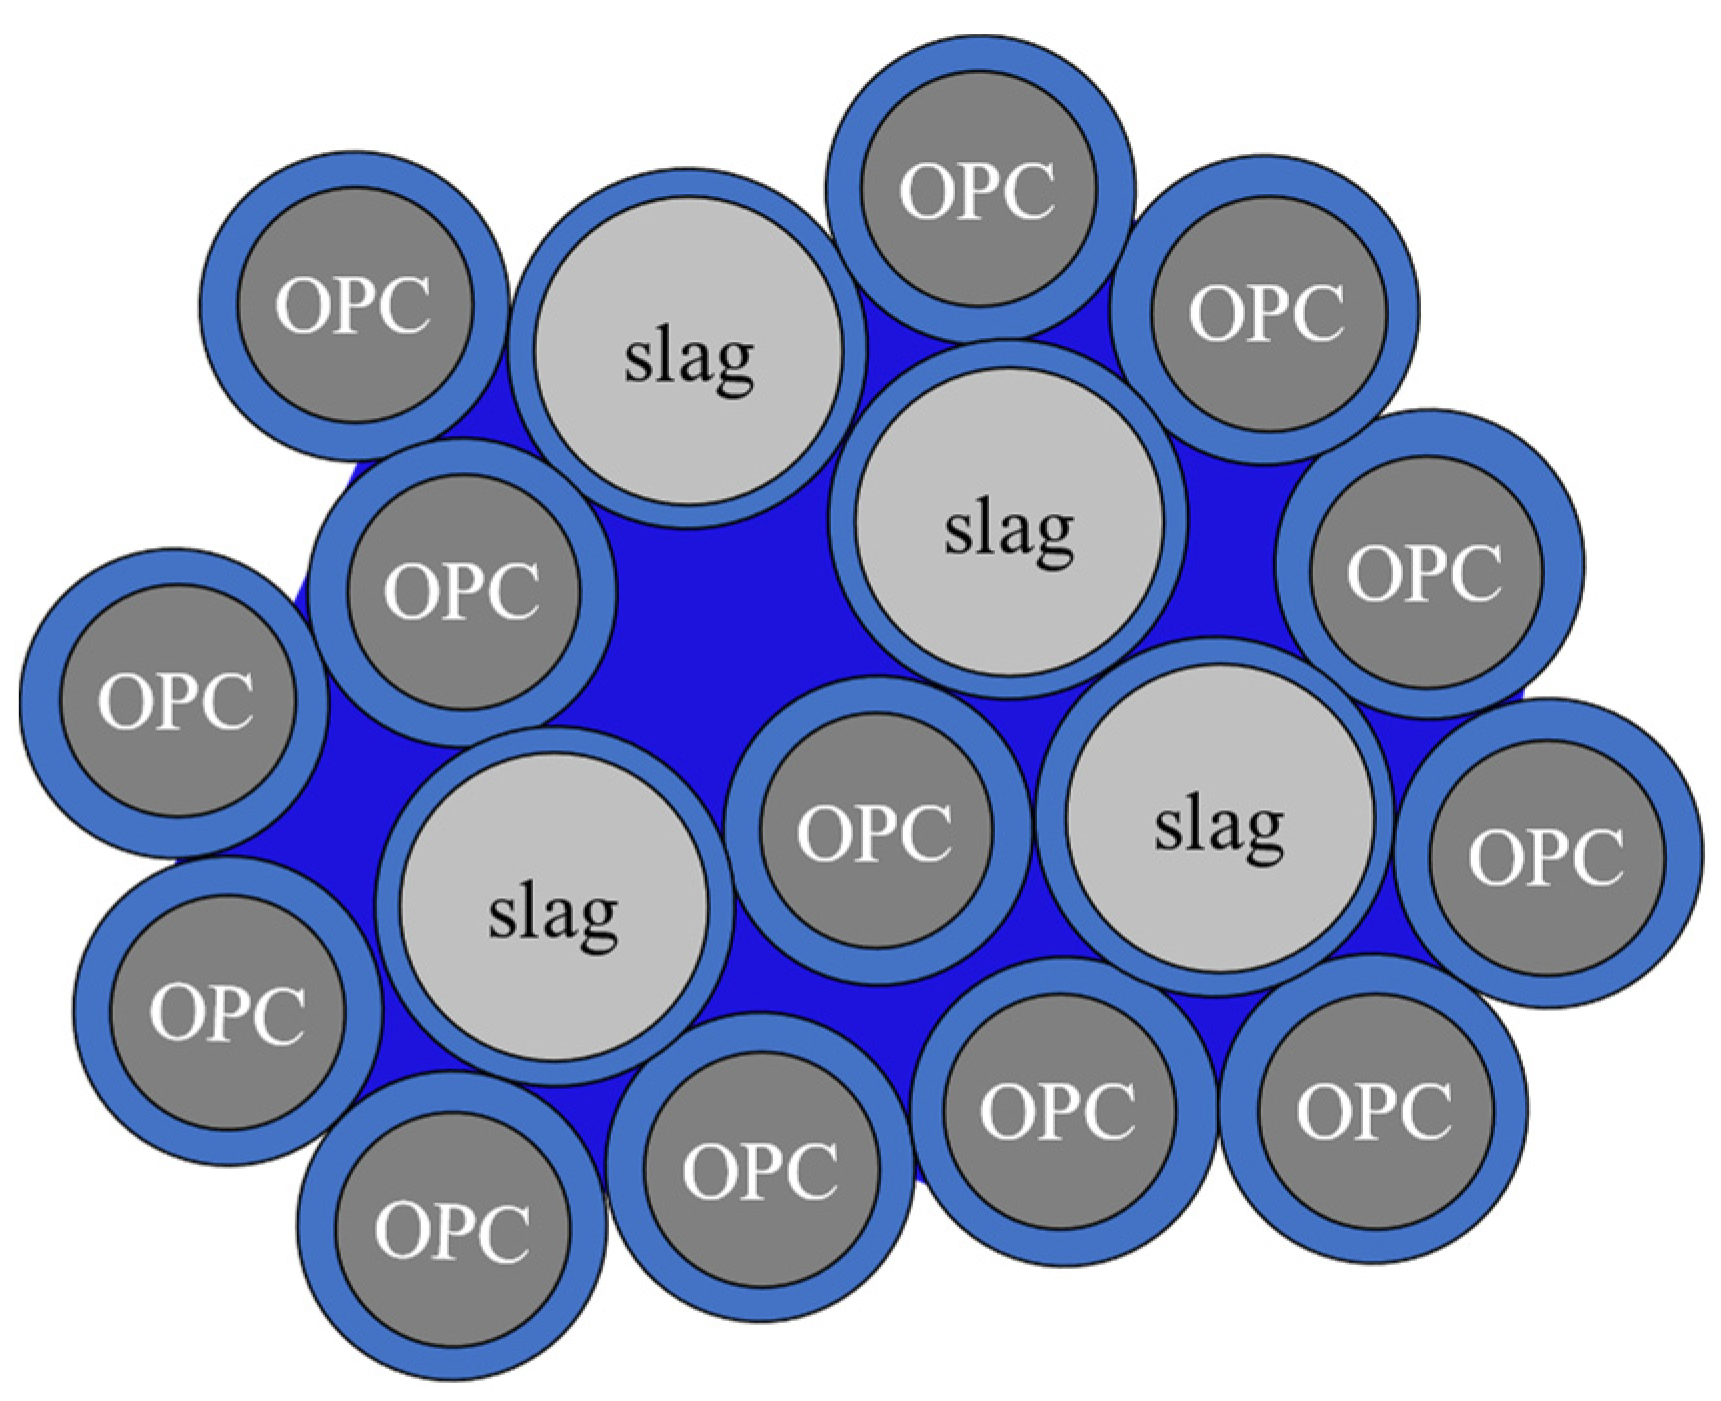
 ) and OPC/slag (
 ) paste preparation, respectively.
) and OPC/slag () paste preparation, respectively.
) paste preparation, respectively.
) and OPC/slag () paste preparation, respectively.

 ) and distributable interparticle storage water (
 ).
) and distributable interparticle storage water ().
).
) and distributable interparticle storage water ().
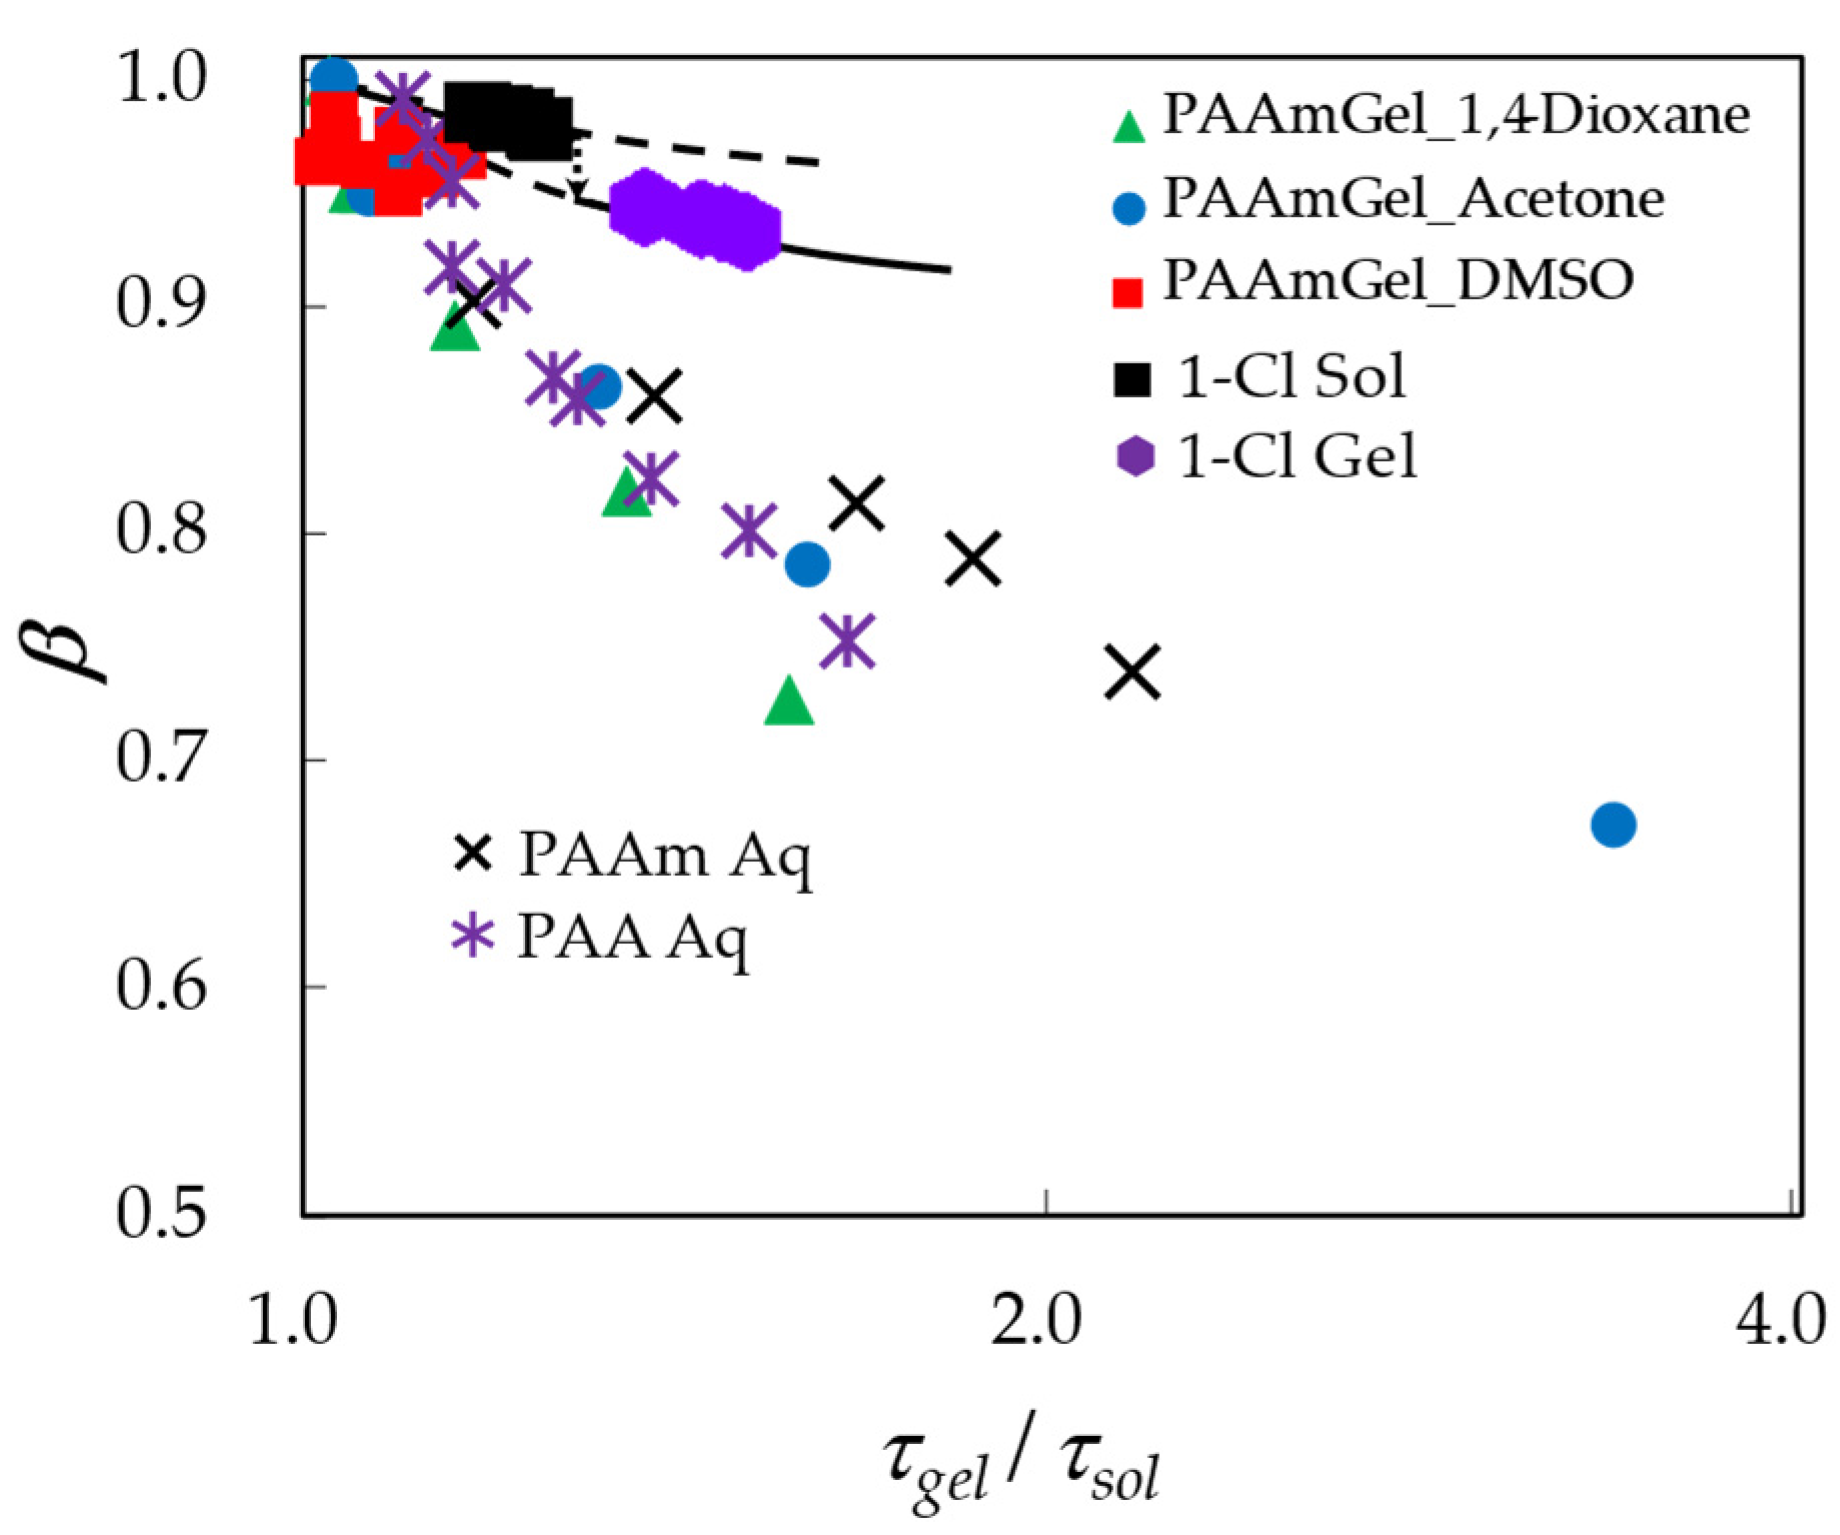
 ), acetone (
 ), and DMSO (
 ). The results obtained for 1-Cl in sol (
 ) and gel (
 ) states are also shown. (Adapted from Saito et al. [27] and Kundu et al. [29]).
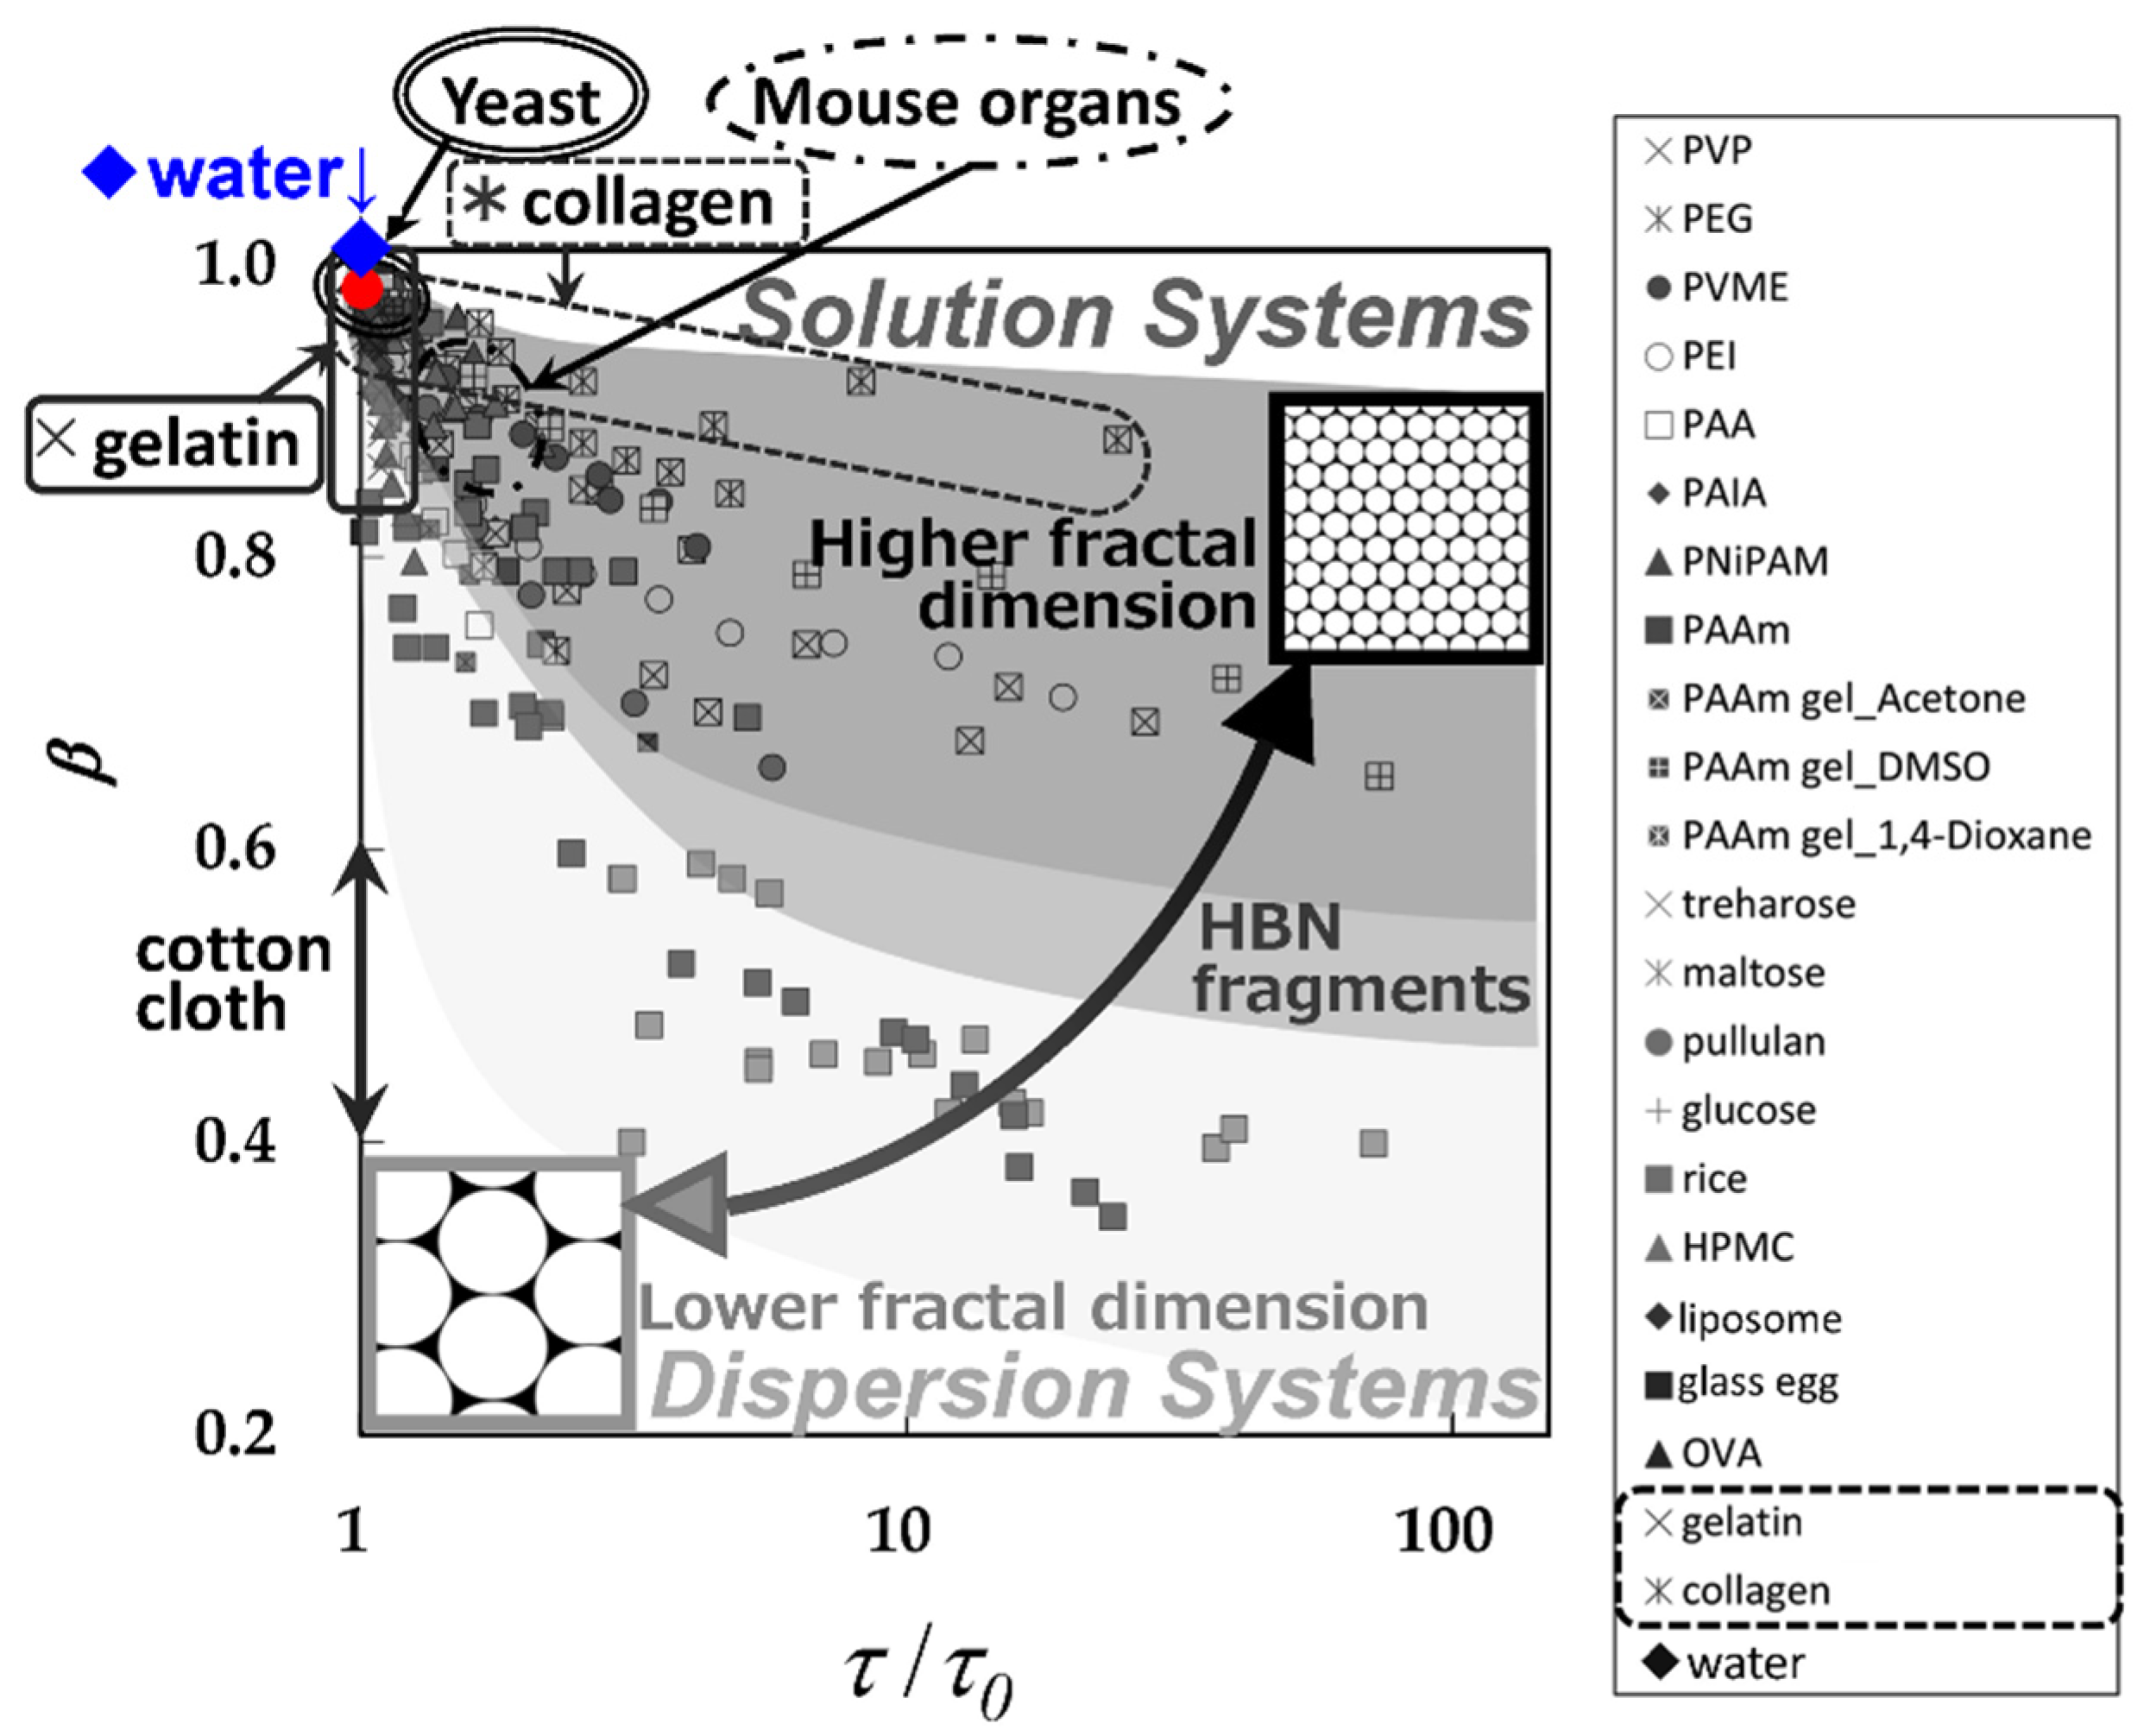
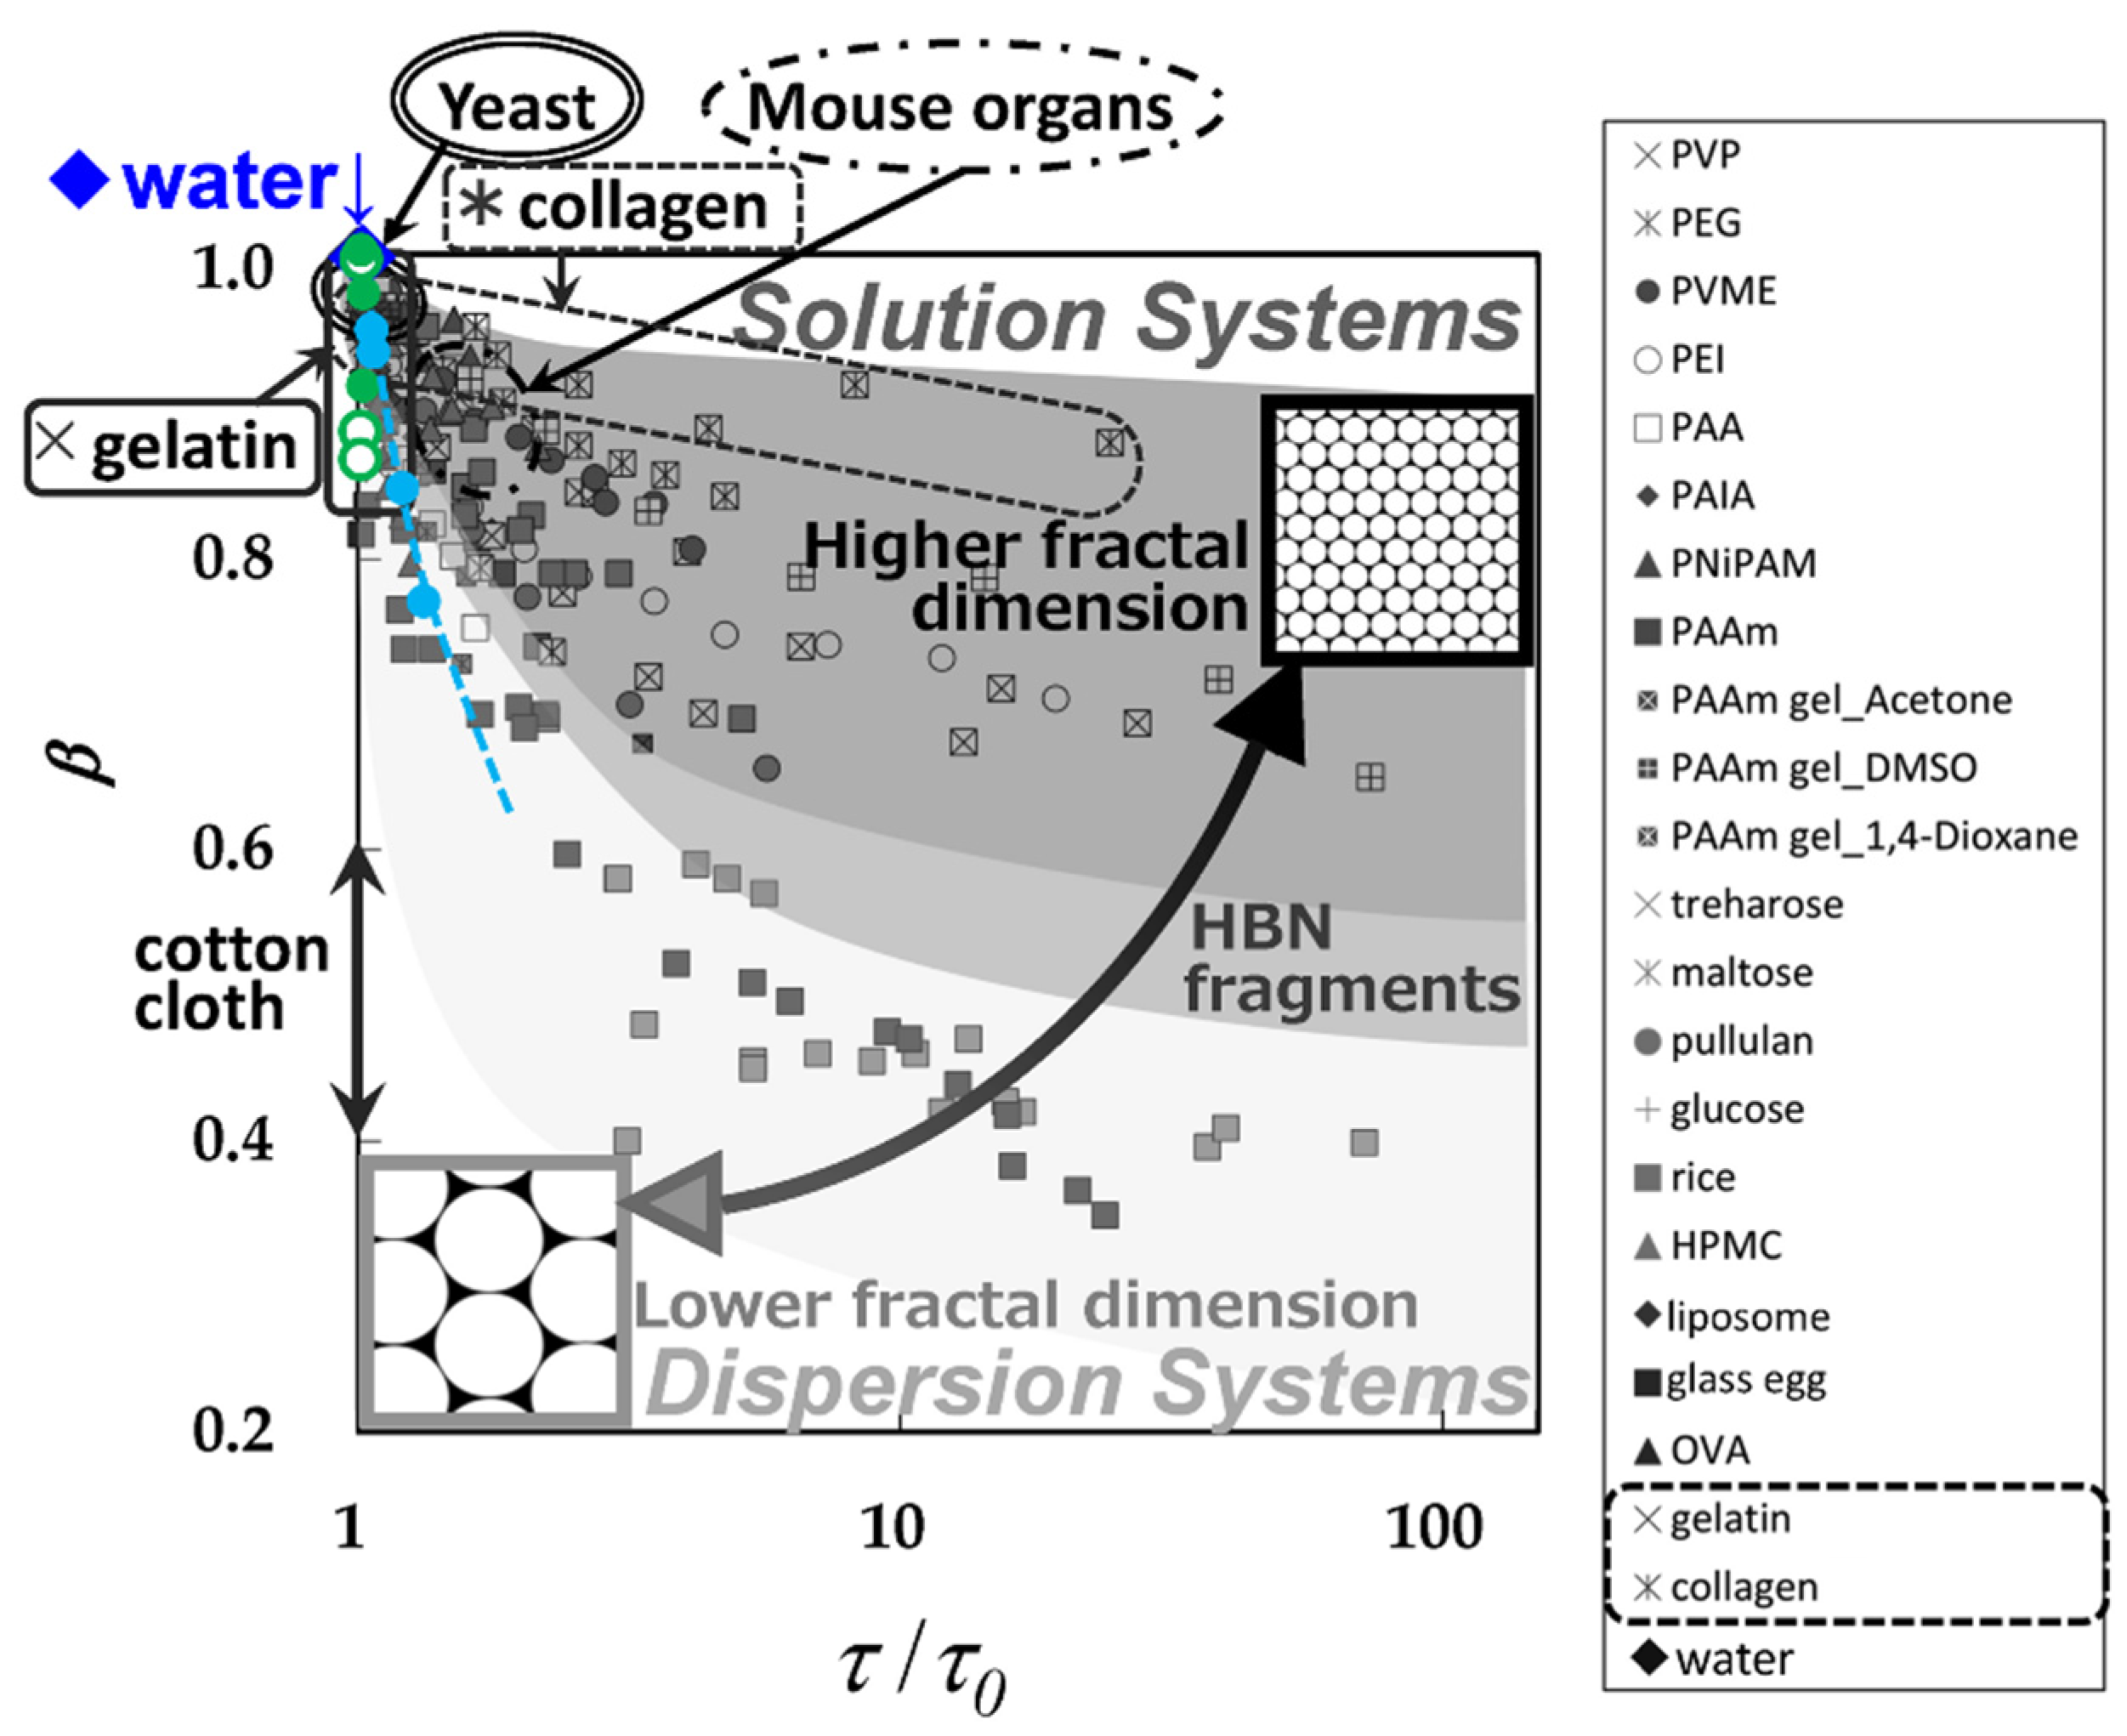
 ) [30] and pure water (
 ) are shown in our database of τ–β diagrams. (Adapted from Yagihara et al. [38]).


Disclaimer/Publisher’s Note: The statements, opinions and data contained in all publications are solely those of the individual author(s) and contributor(s) and not of MDPI and/or the editor(s). MDPI and/or the editor(s) disclaim responsibility for any injury to people or property resulting from any ideas, methods, instructions or products referred to in the content. |
© 2023 by the authors. Licensee MDPI, Basel, Switzerland. This article is an open access article distributed under the terms and conditions of the Creative Commons Attribution (CC BY) license (https://creativecommons.org/licenses/by/4.0/).
Share and Cite
Yagihara, S.; Watanabe, S.; Abe, Y.; Asano, M.; Shimizu, K.; Saito, H.; Maruyama, Y.; Kita, R.; Shinyashiki, N.; Kundu, S.K. Universal Behavior of Fractal Water Structures Observed in Various Gelation Mechanisms of Polymer Gels, Supramolecular Gels, and Cement Gels. Gels 2023, 9, 506. https://doi.org/10.3390/gels9070506
Yagihara S, Watanabe S, Abe Y, Asano M, Shimizu K, Saito H, Maruyama Y, Kita R, Shinyashiki N, Kundu SK. Universal Behavior of Fractal Water Structures Observed in Various Gelation Mechanisms of Polymer Gels, Supramolecular Gels, and Cement Gels. Gels. 2023; 9(7):506. https://doi.org/10.3390/gels9070506
Chicago/Turabian StyleYagihara, Shin, Seiei Watanabe, Yuta Abe, Megumi Asano, Kenta Shimizu, Hironobu Saito, Yuko Maruyama, Rio Kita, Naoki Shinyashiki, and Shyamal Kumar Kundu. 2023. "Universal Behavior of Fractal Water Structures Observed in Various Gelation Mechanisms of Polymer Gels, Supramolecular Gels, and Cement Gels" Gels 9, no. 7: 506. https://doi.org/10.3390/gels9070506