
Additive-Free Method for Enhancing the Volume Phase Transition Rate in Light-Responsive Hydrogels: A Study of Micro-Nano Bubble Water on PNIPAM-co-AAc Hydrogels

Abstract
:
1. Introduction
2. Results and Discussion
2.1. Properties of Bubble Water and the Effect of Standing Time on Its Properties
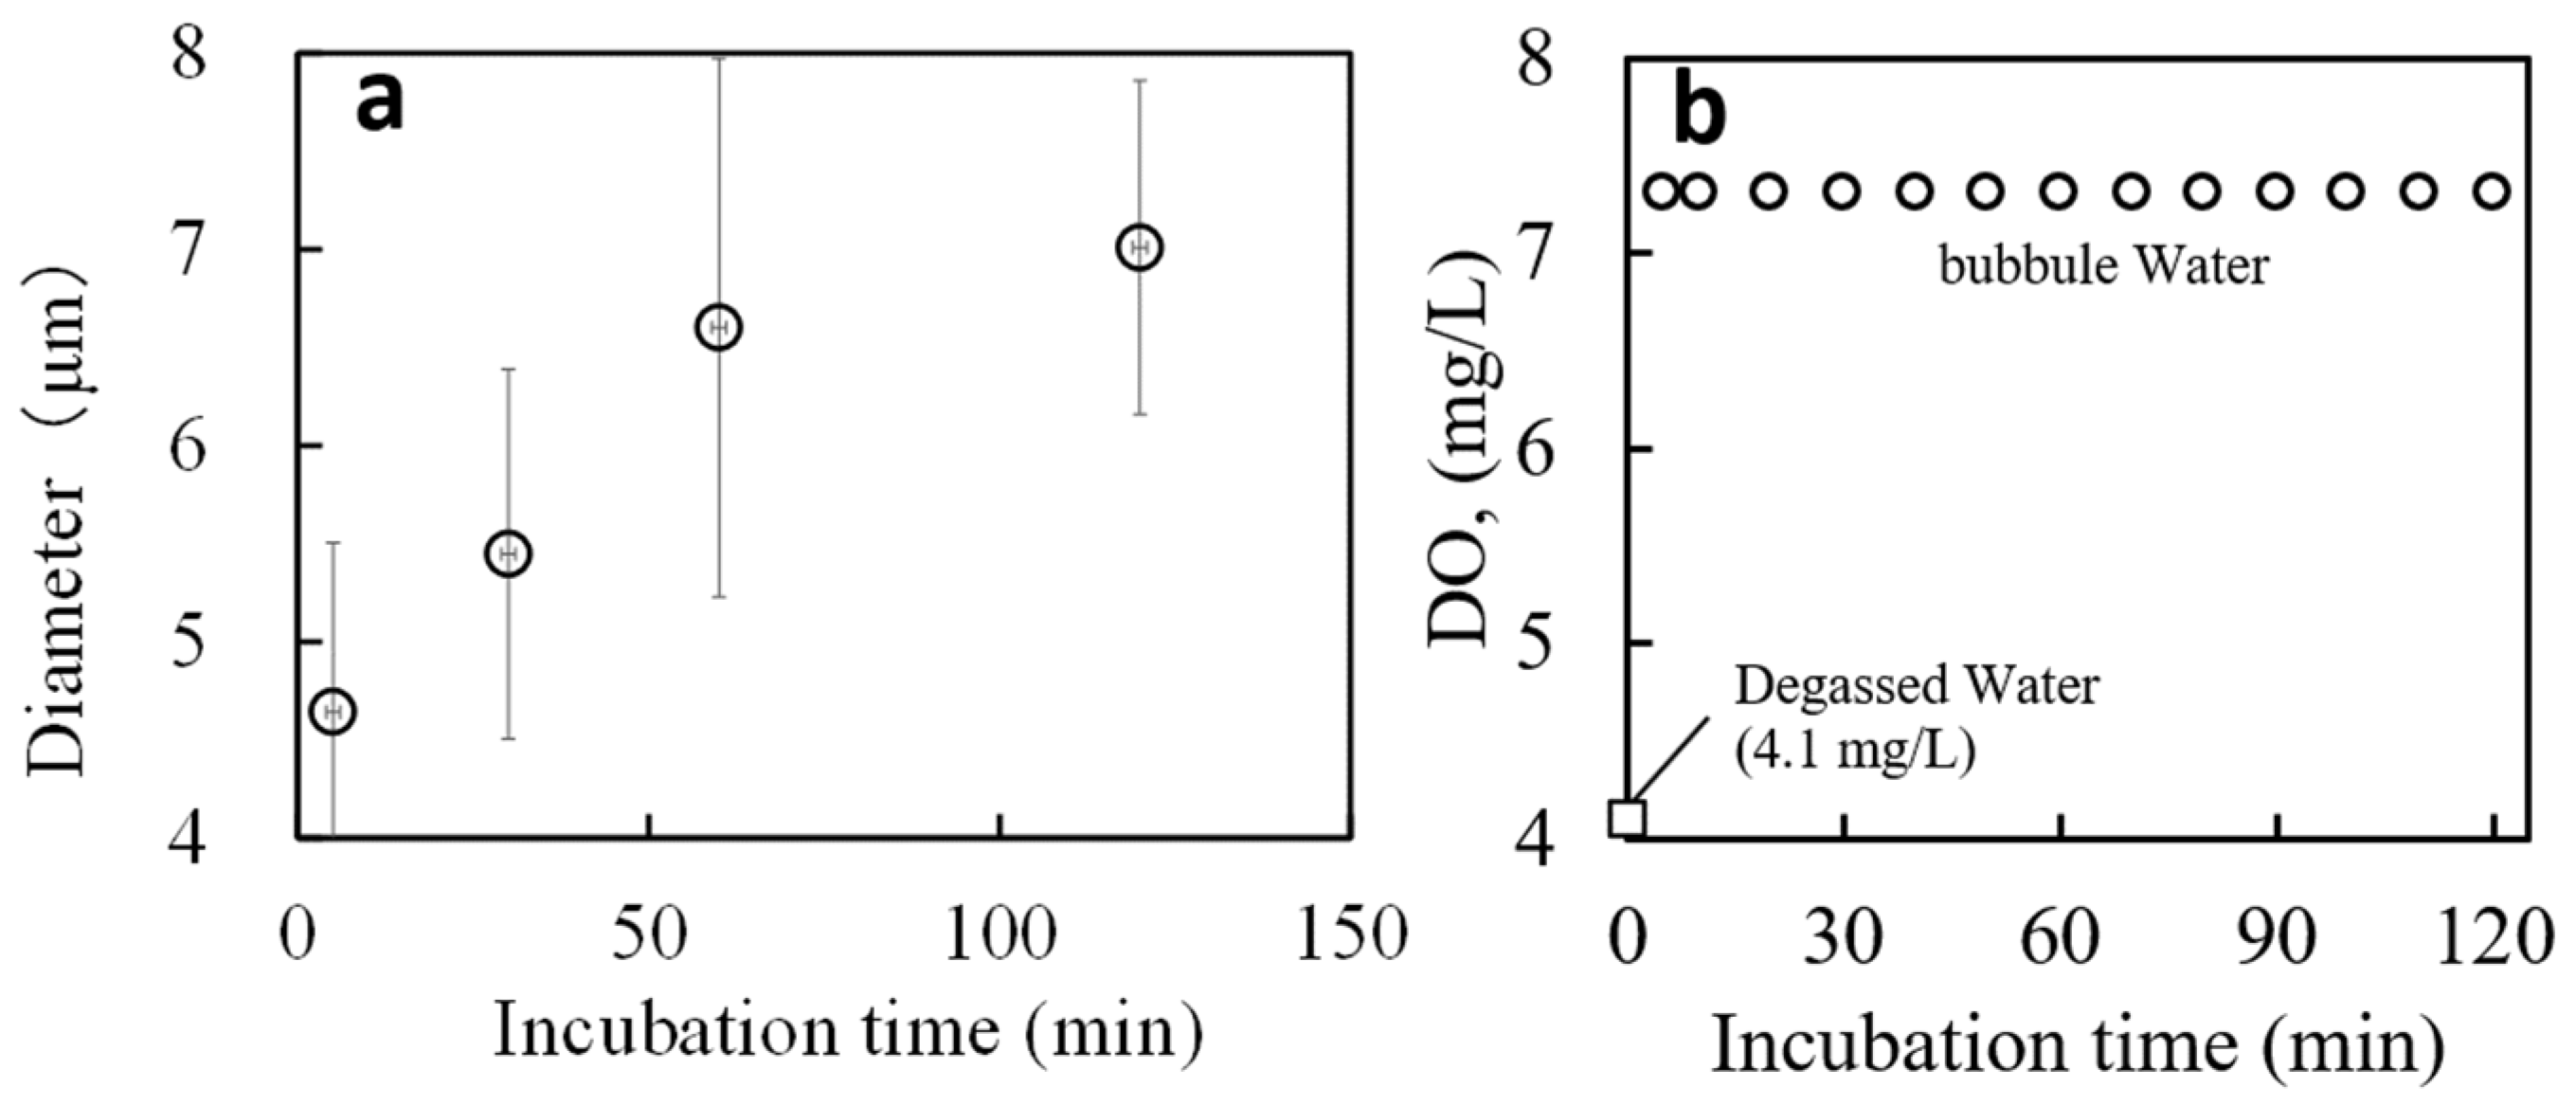
2.1.1. DLS Measurements
2.1.2. DO Concentration
2.2. Effect of Bubble Water Used in the Preparation on the Static Properties of the Gel
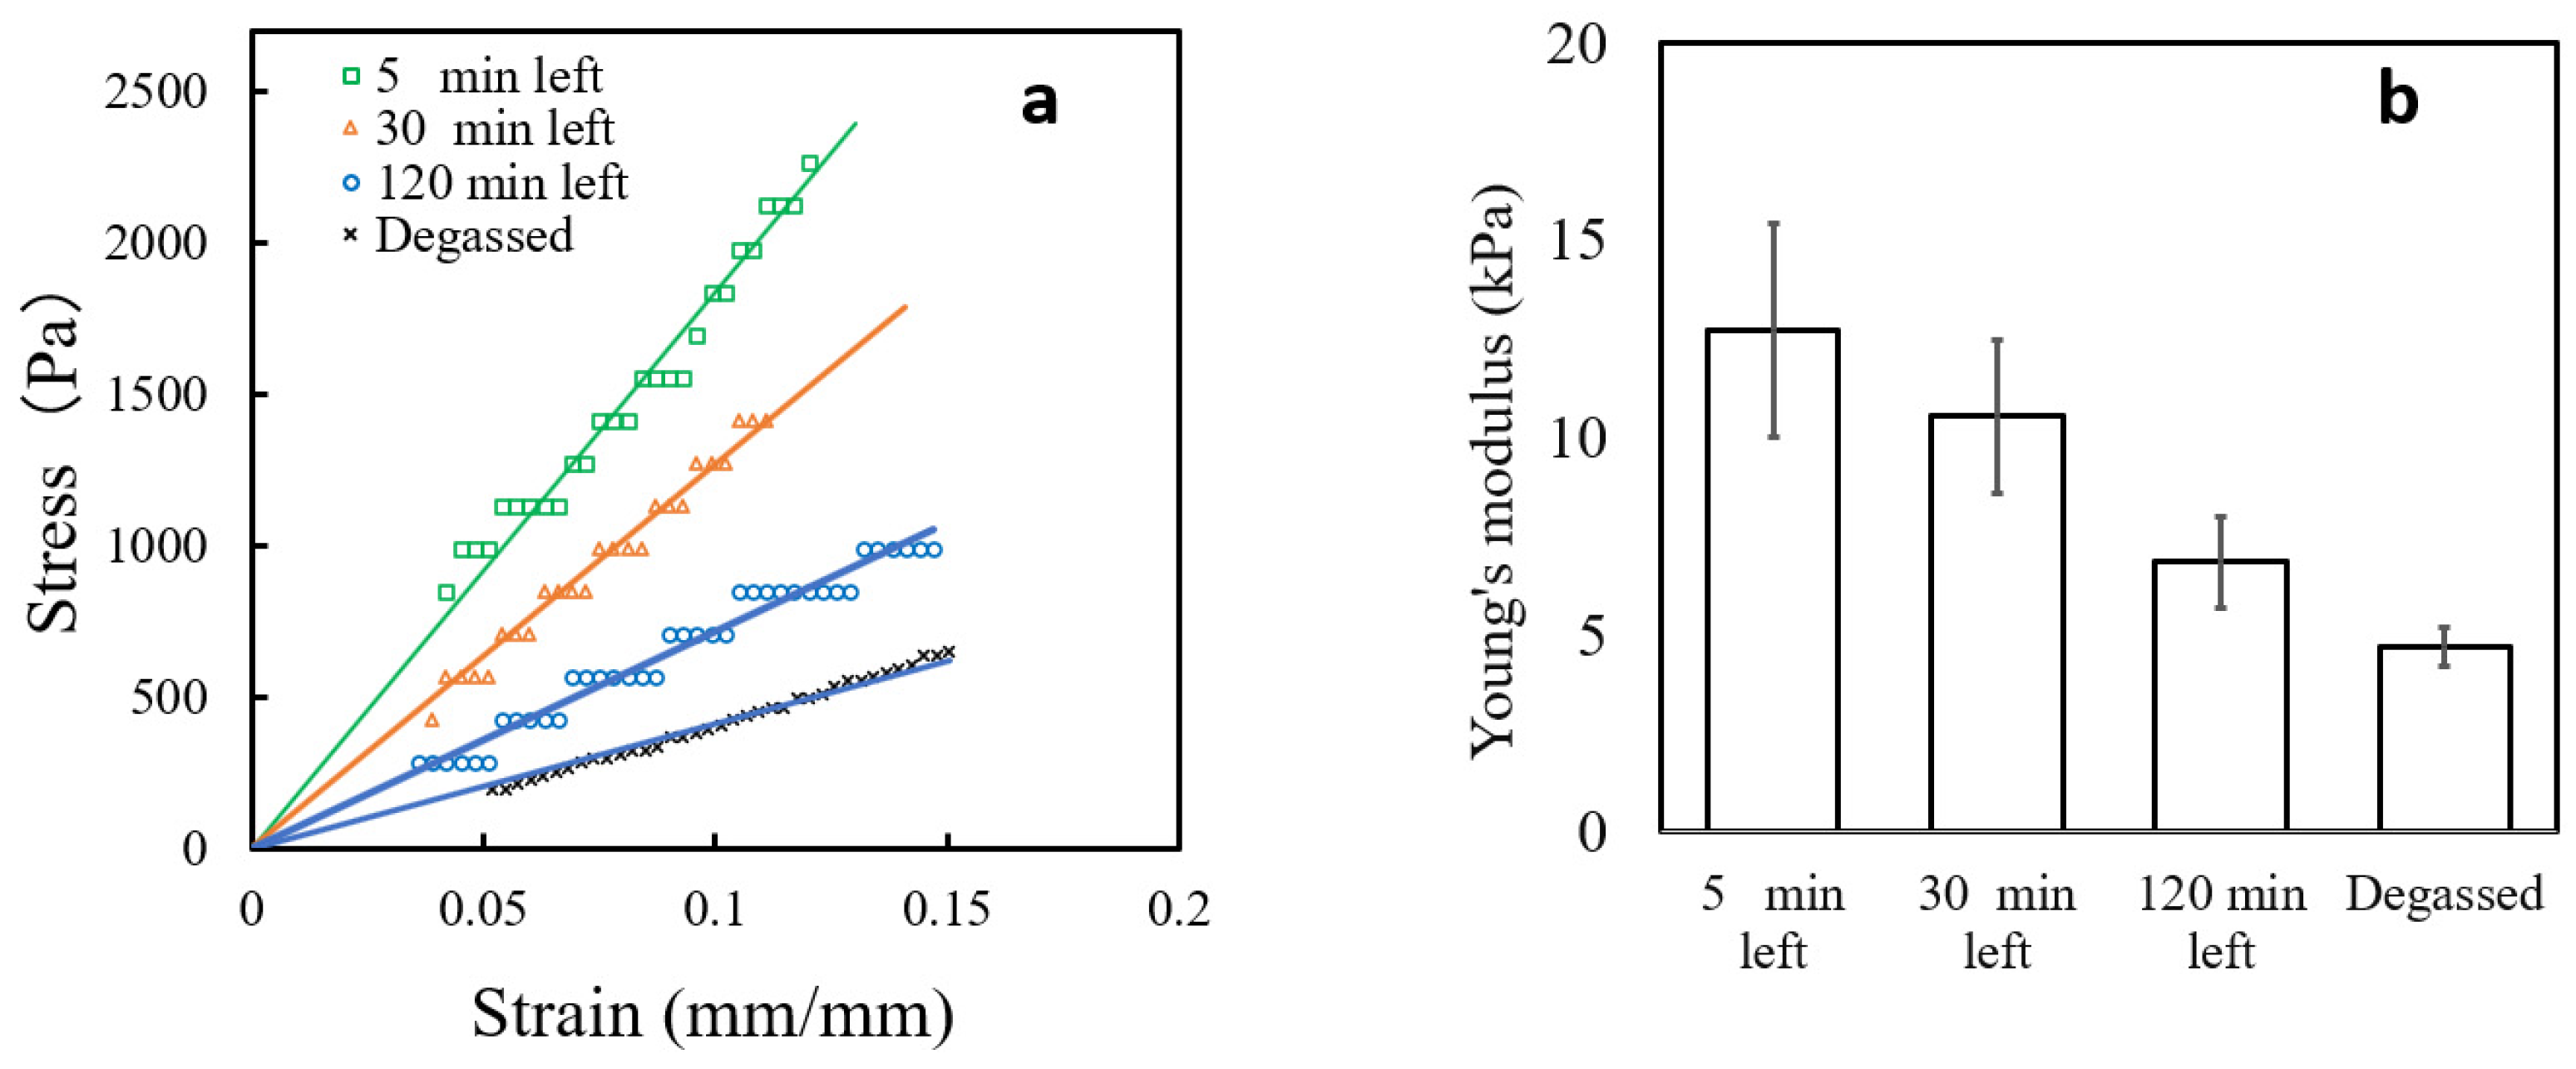
2.2.1. Mechanical Strength Measurement
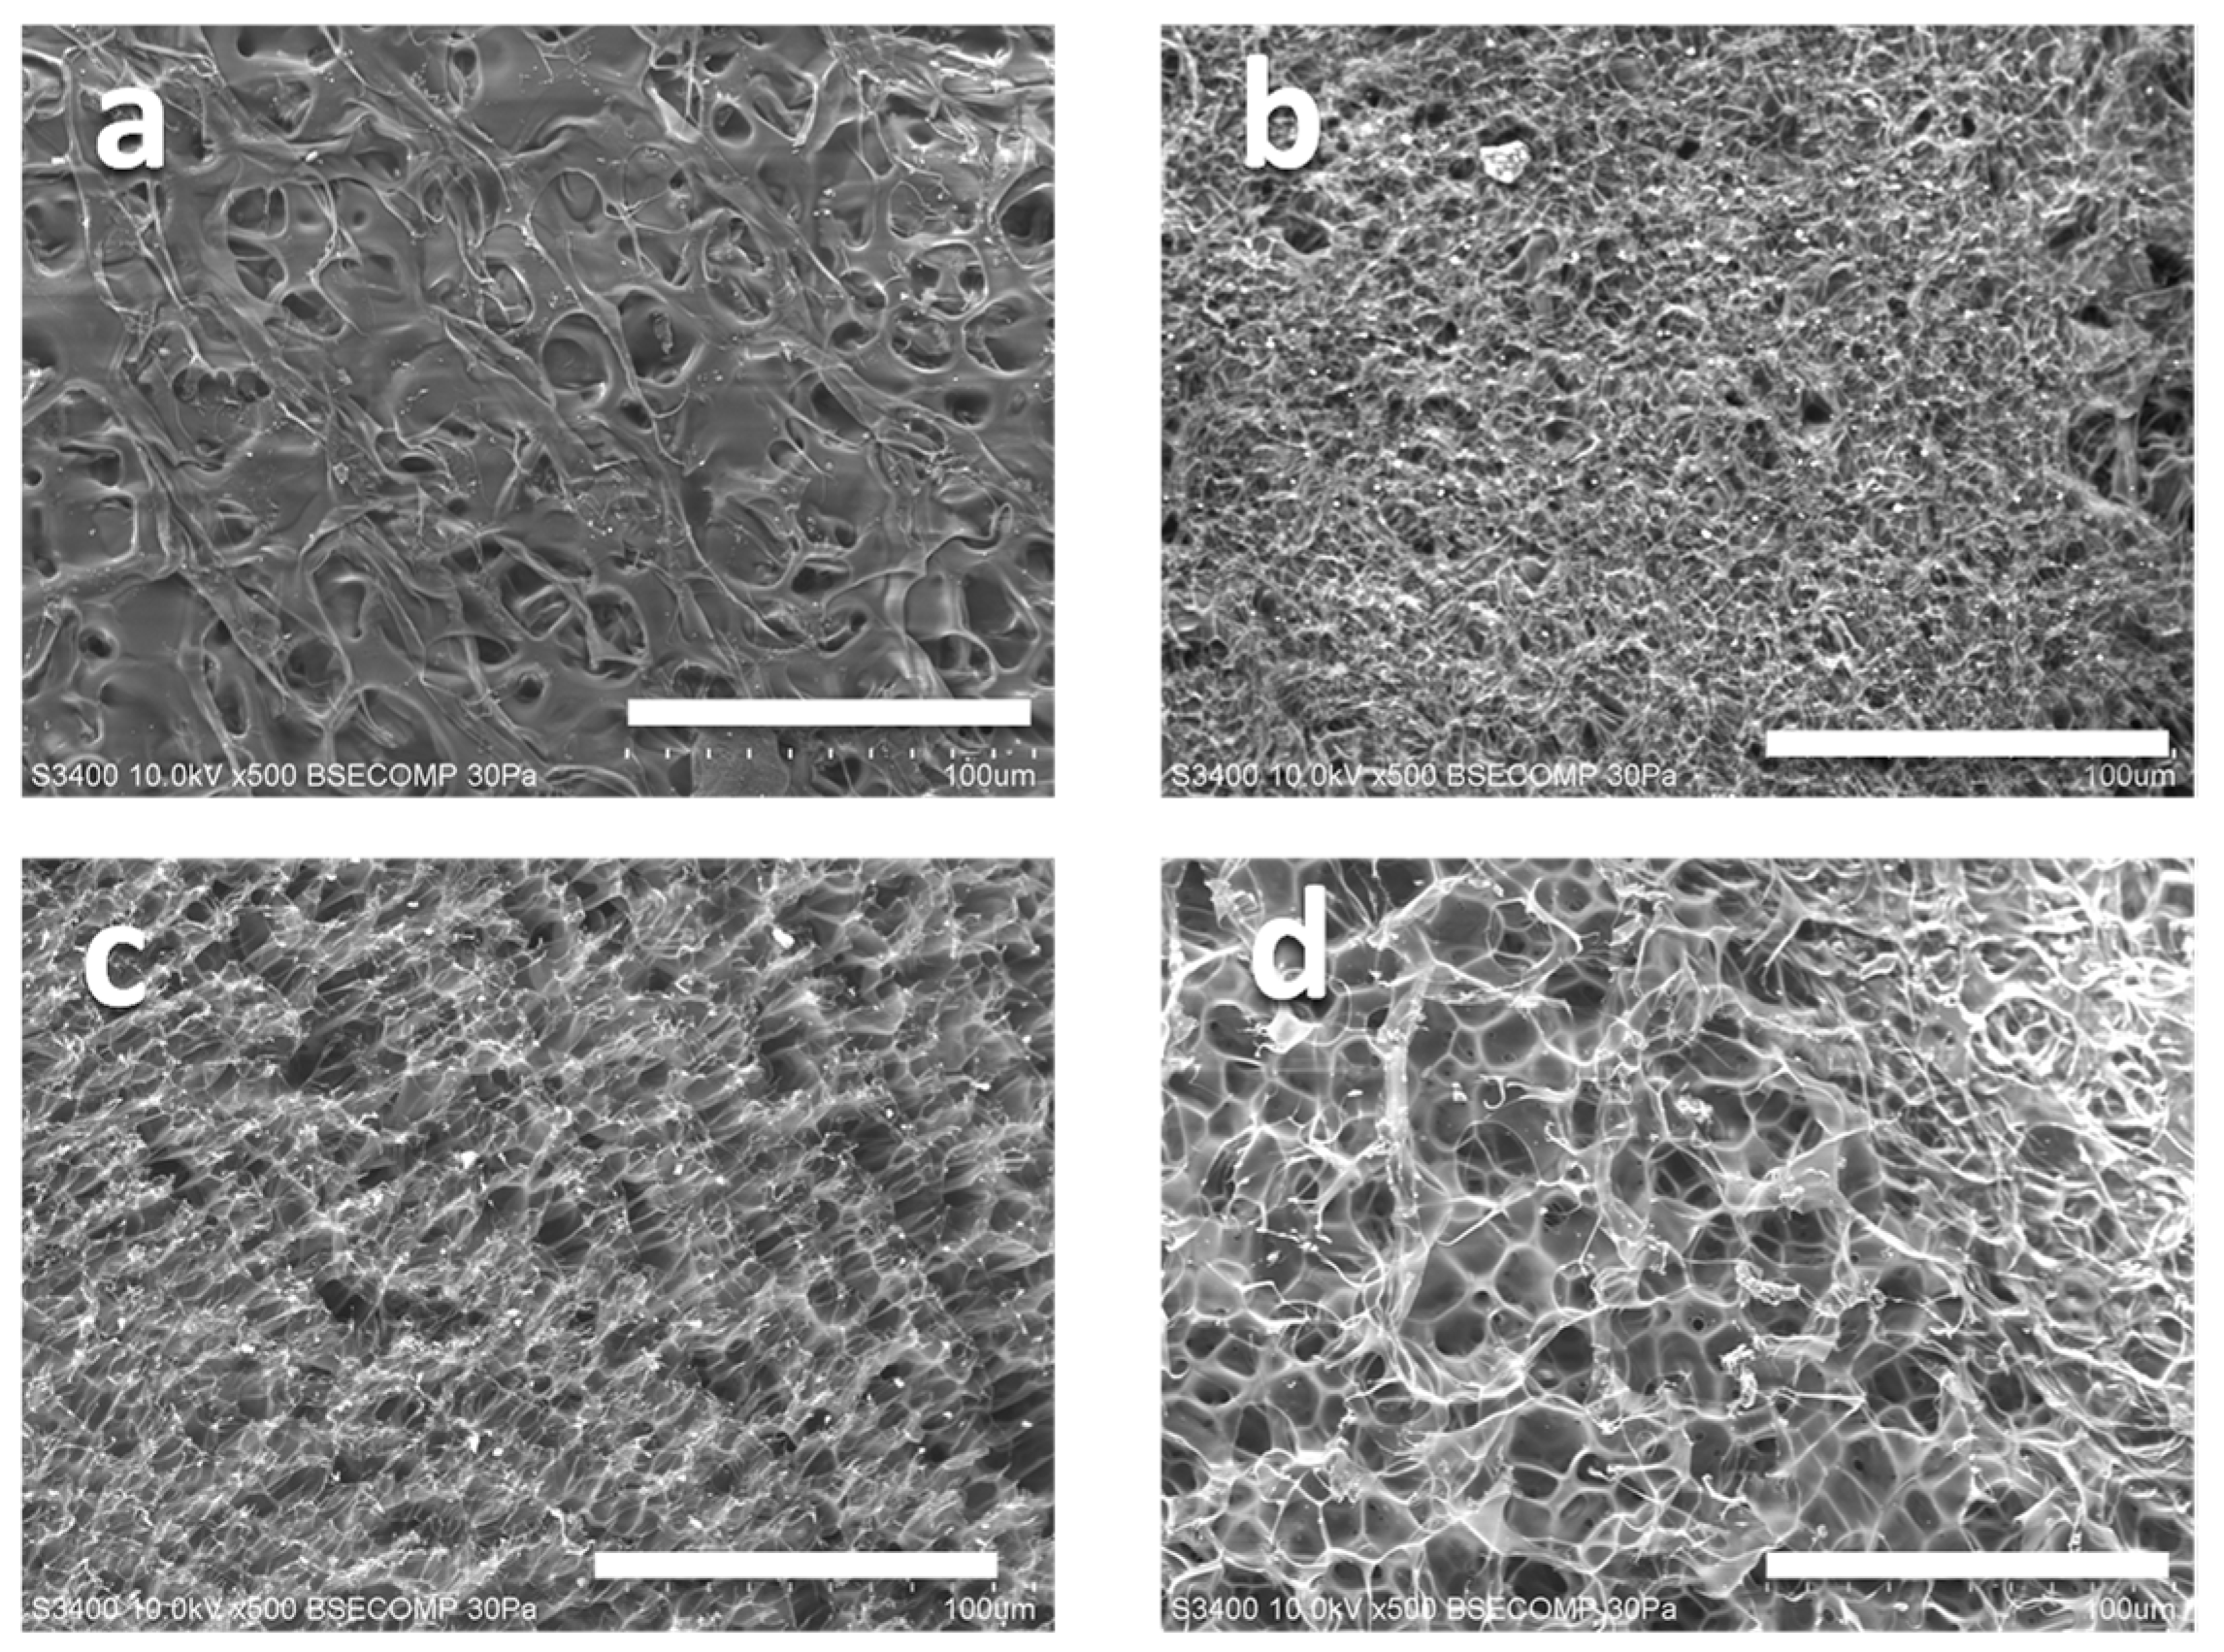
2.2.2. SEM Analysis
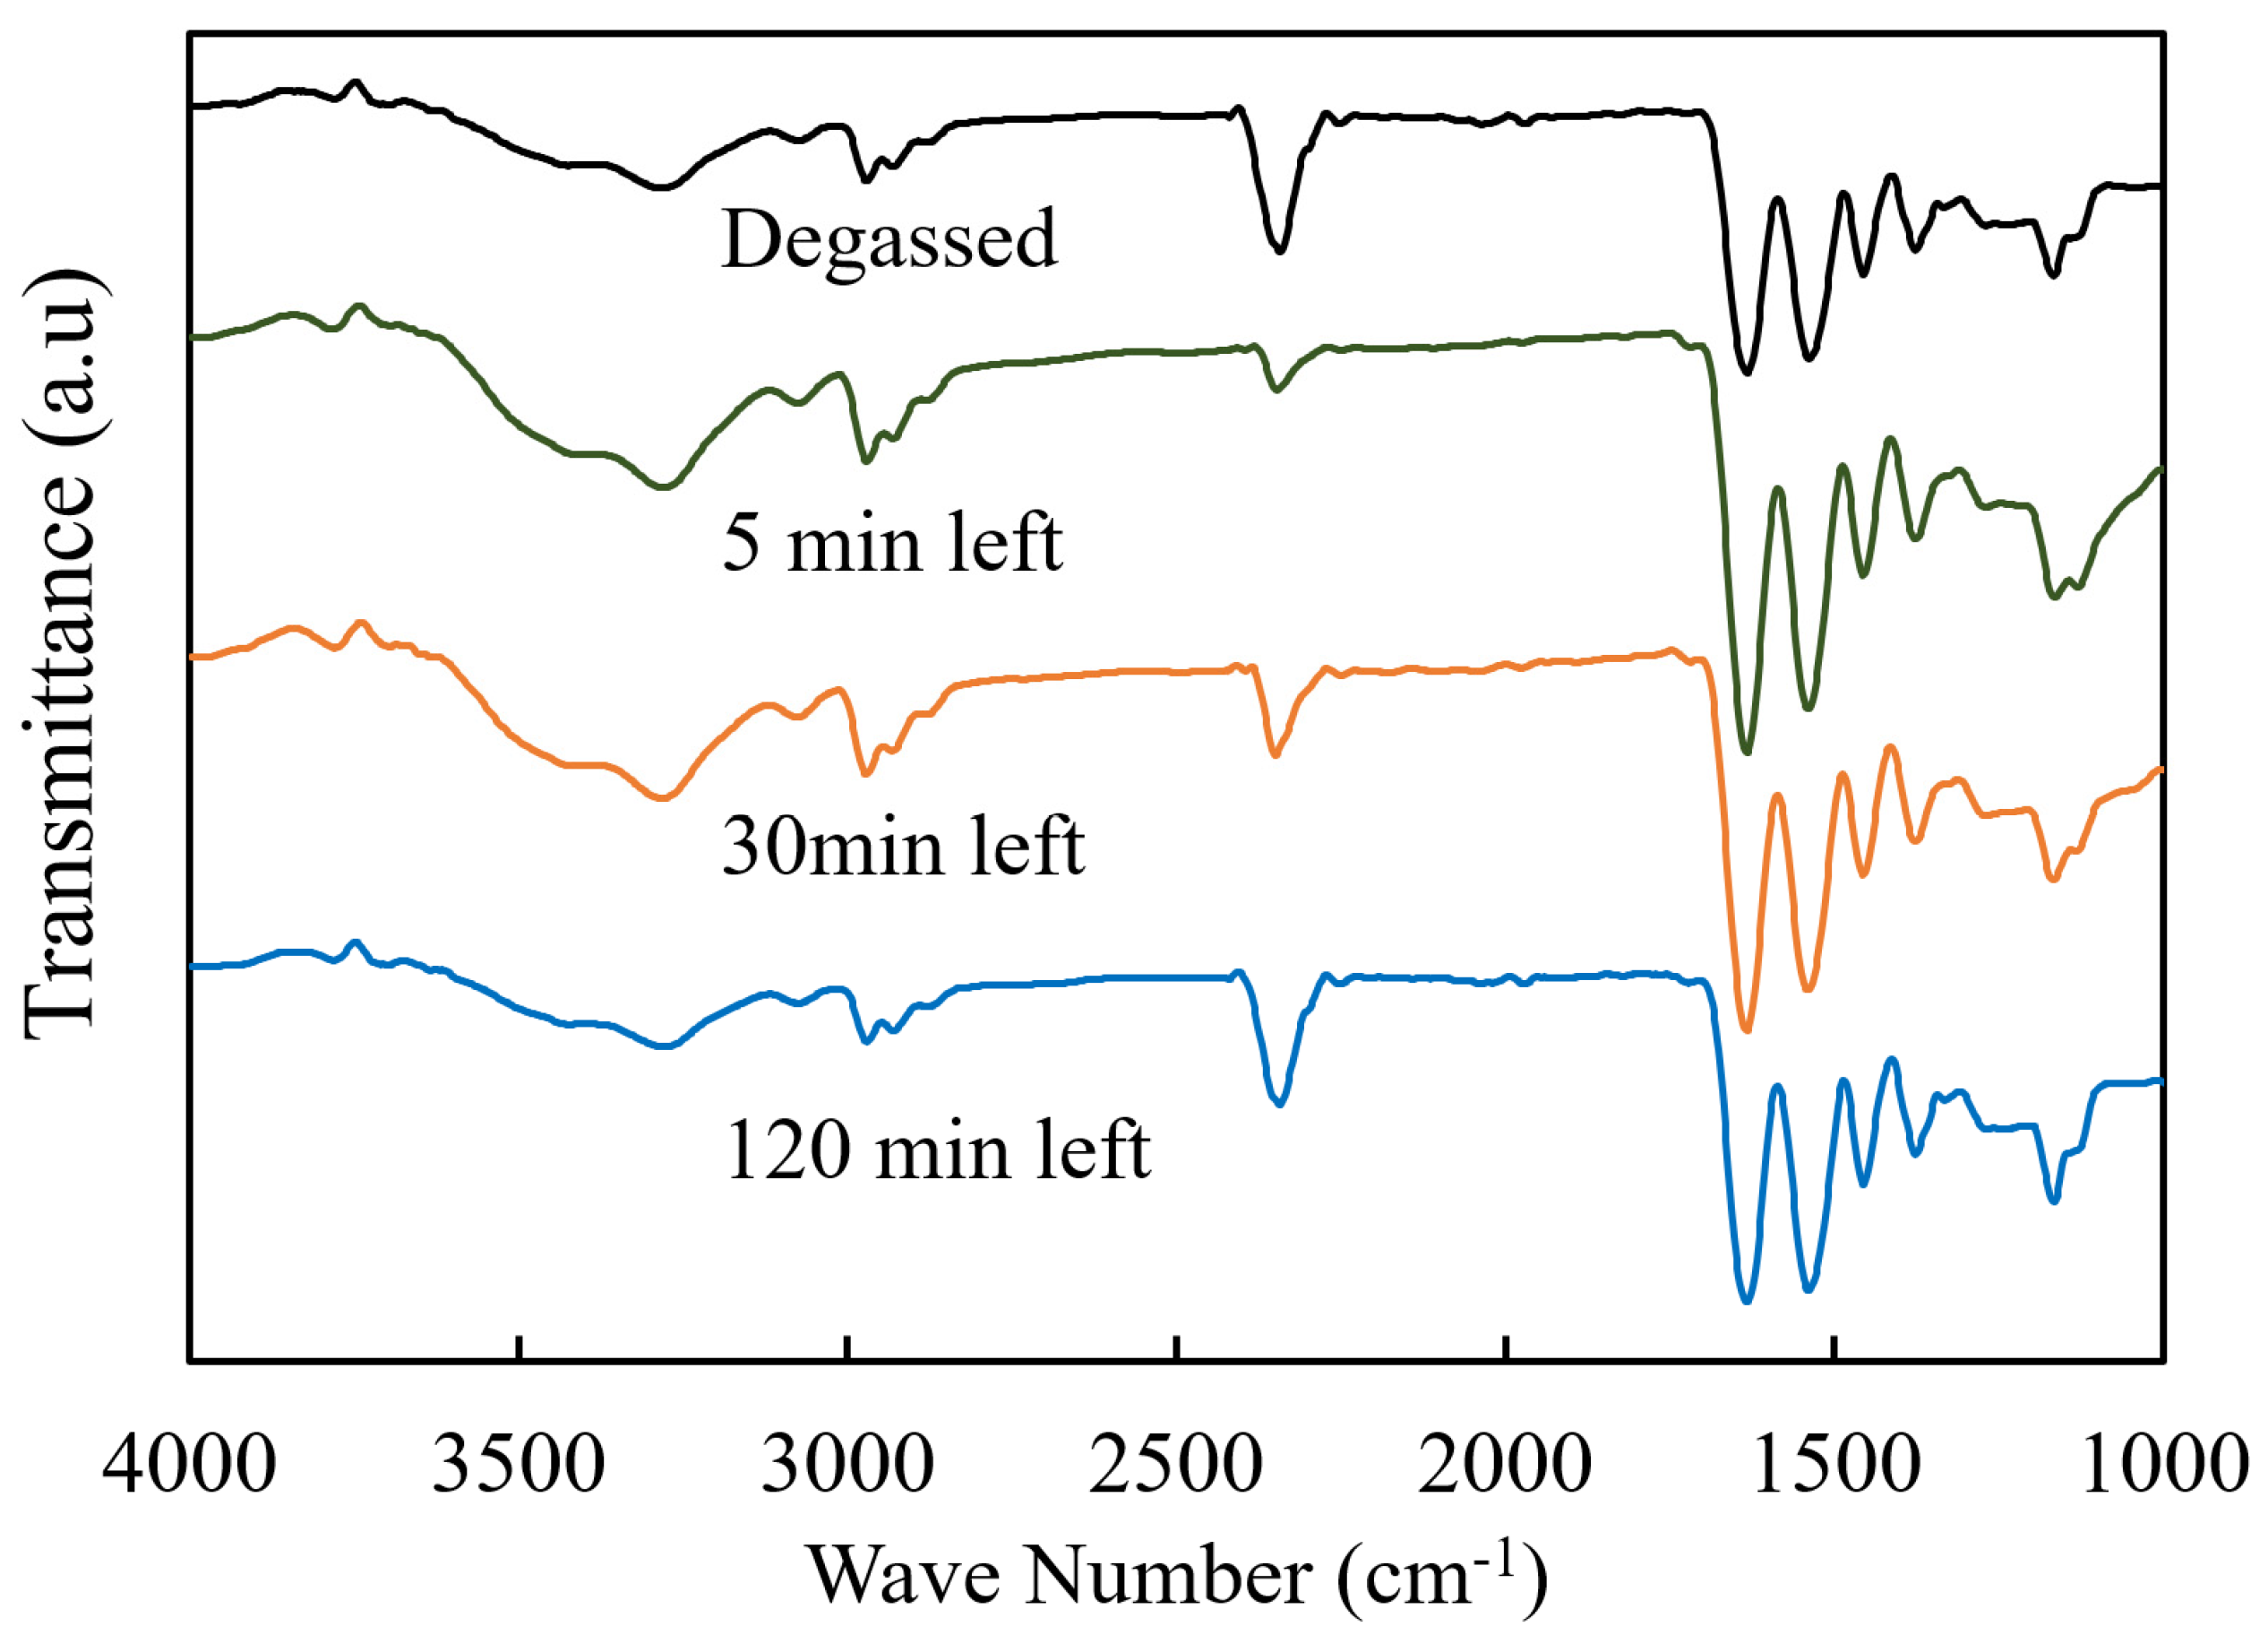
2.2.3. FT-IR Spectra
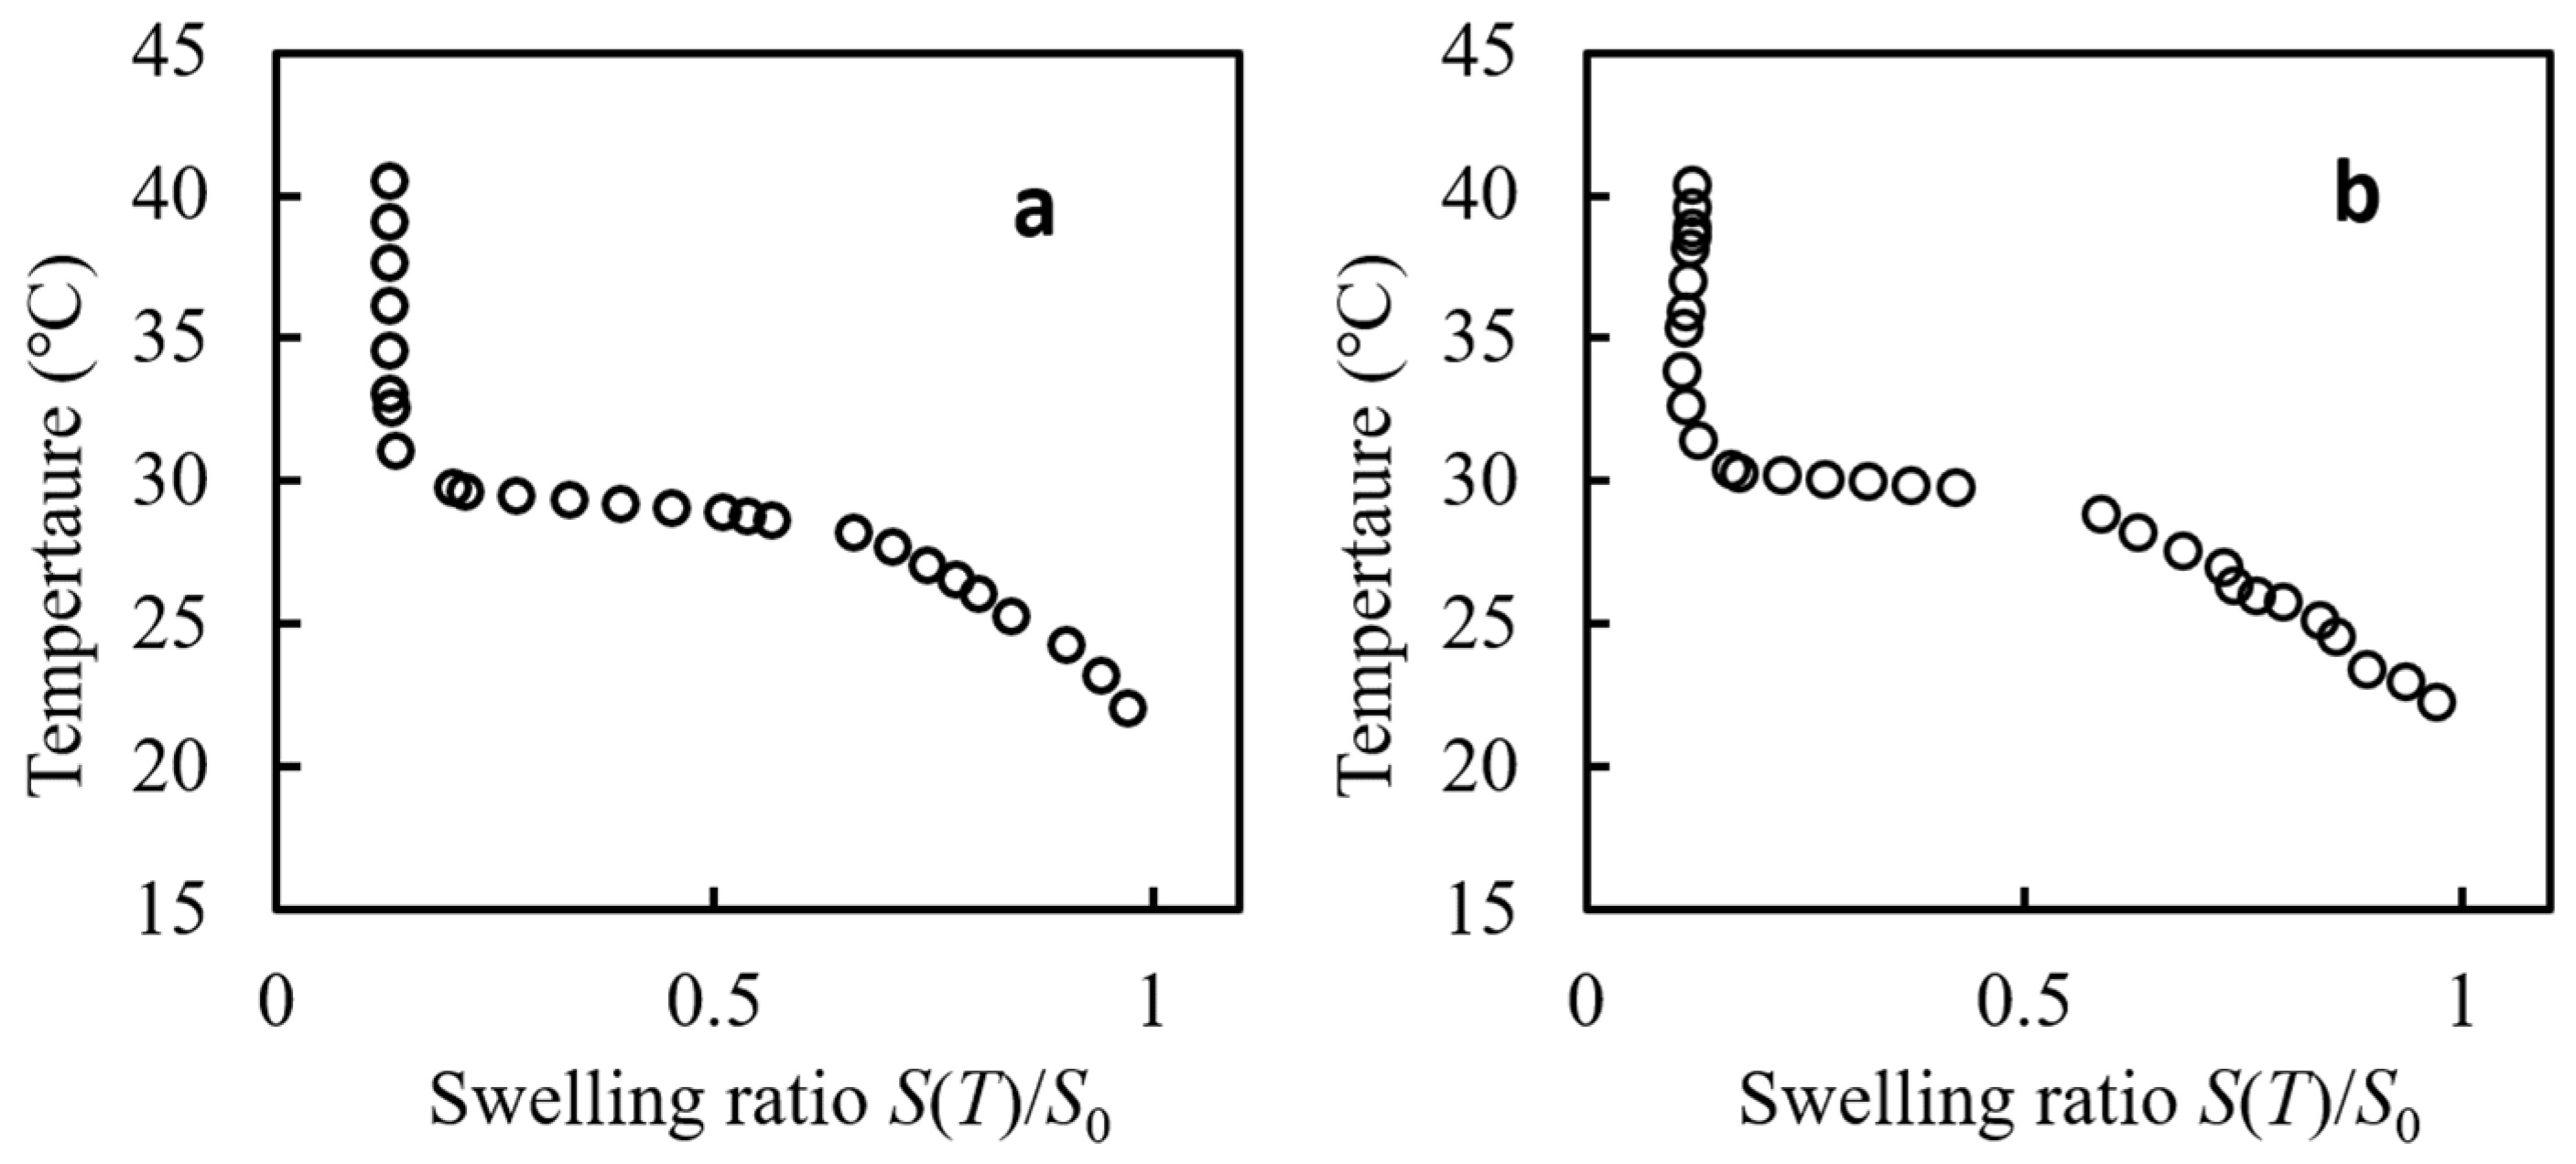
2.2.4. Temperature-Swelling Ratio Phase Diagram
2.3. Effect of Bubble Water Used in the Preparation on the Dynamic Properties of the Gel
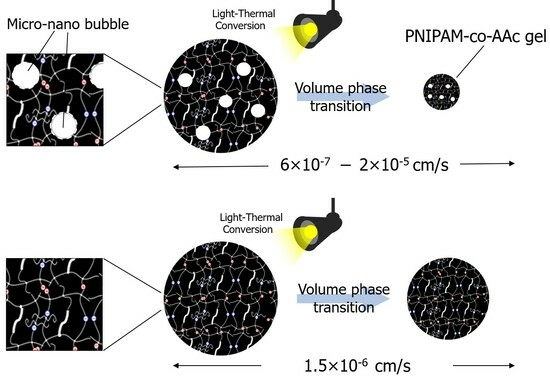
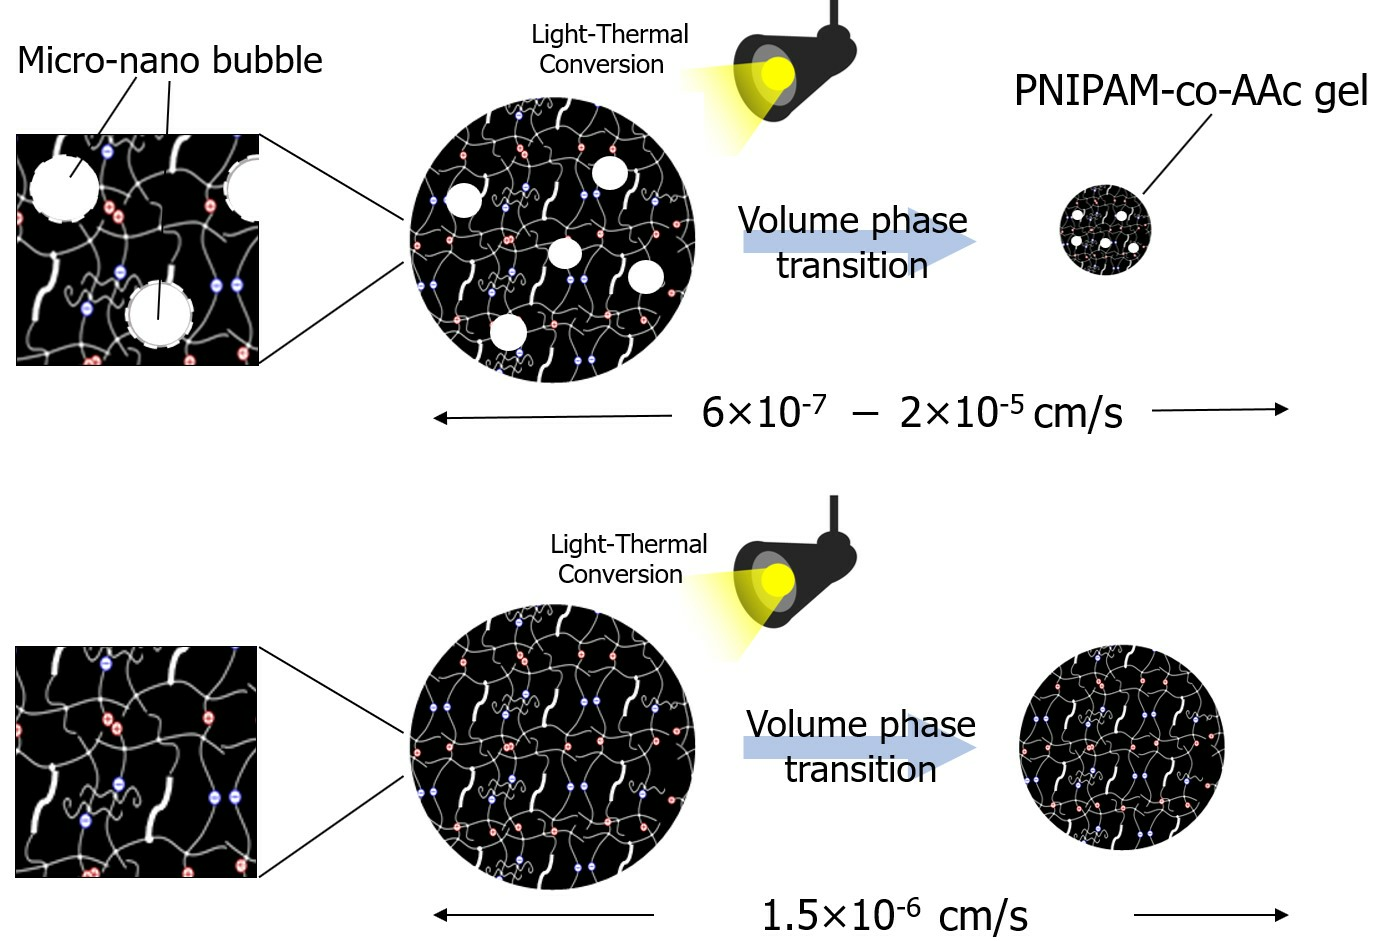
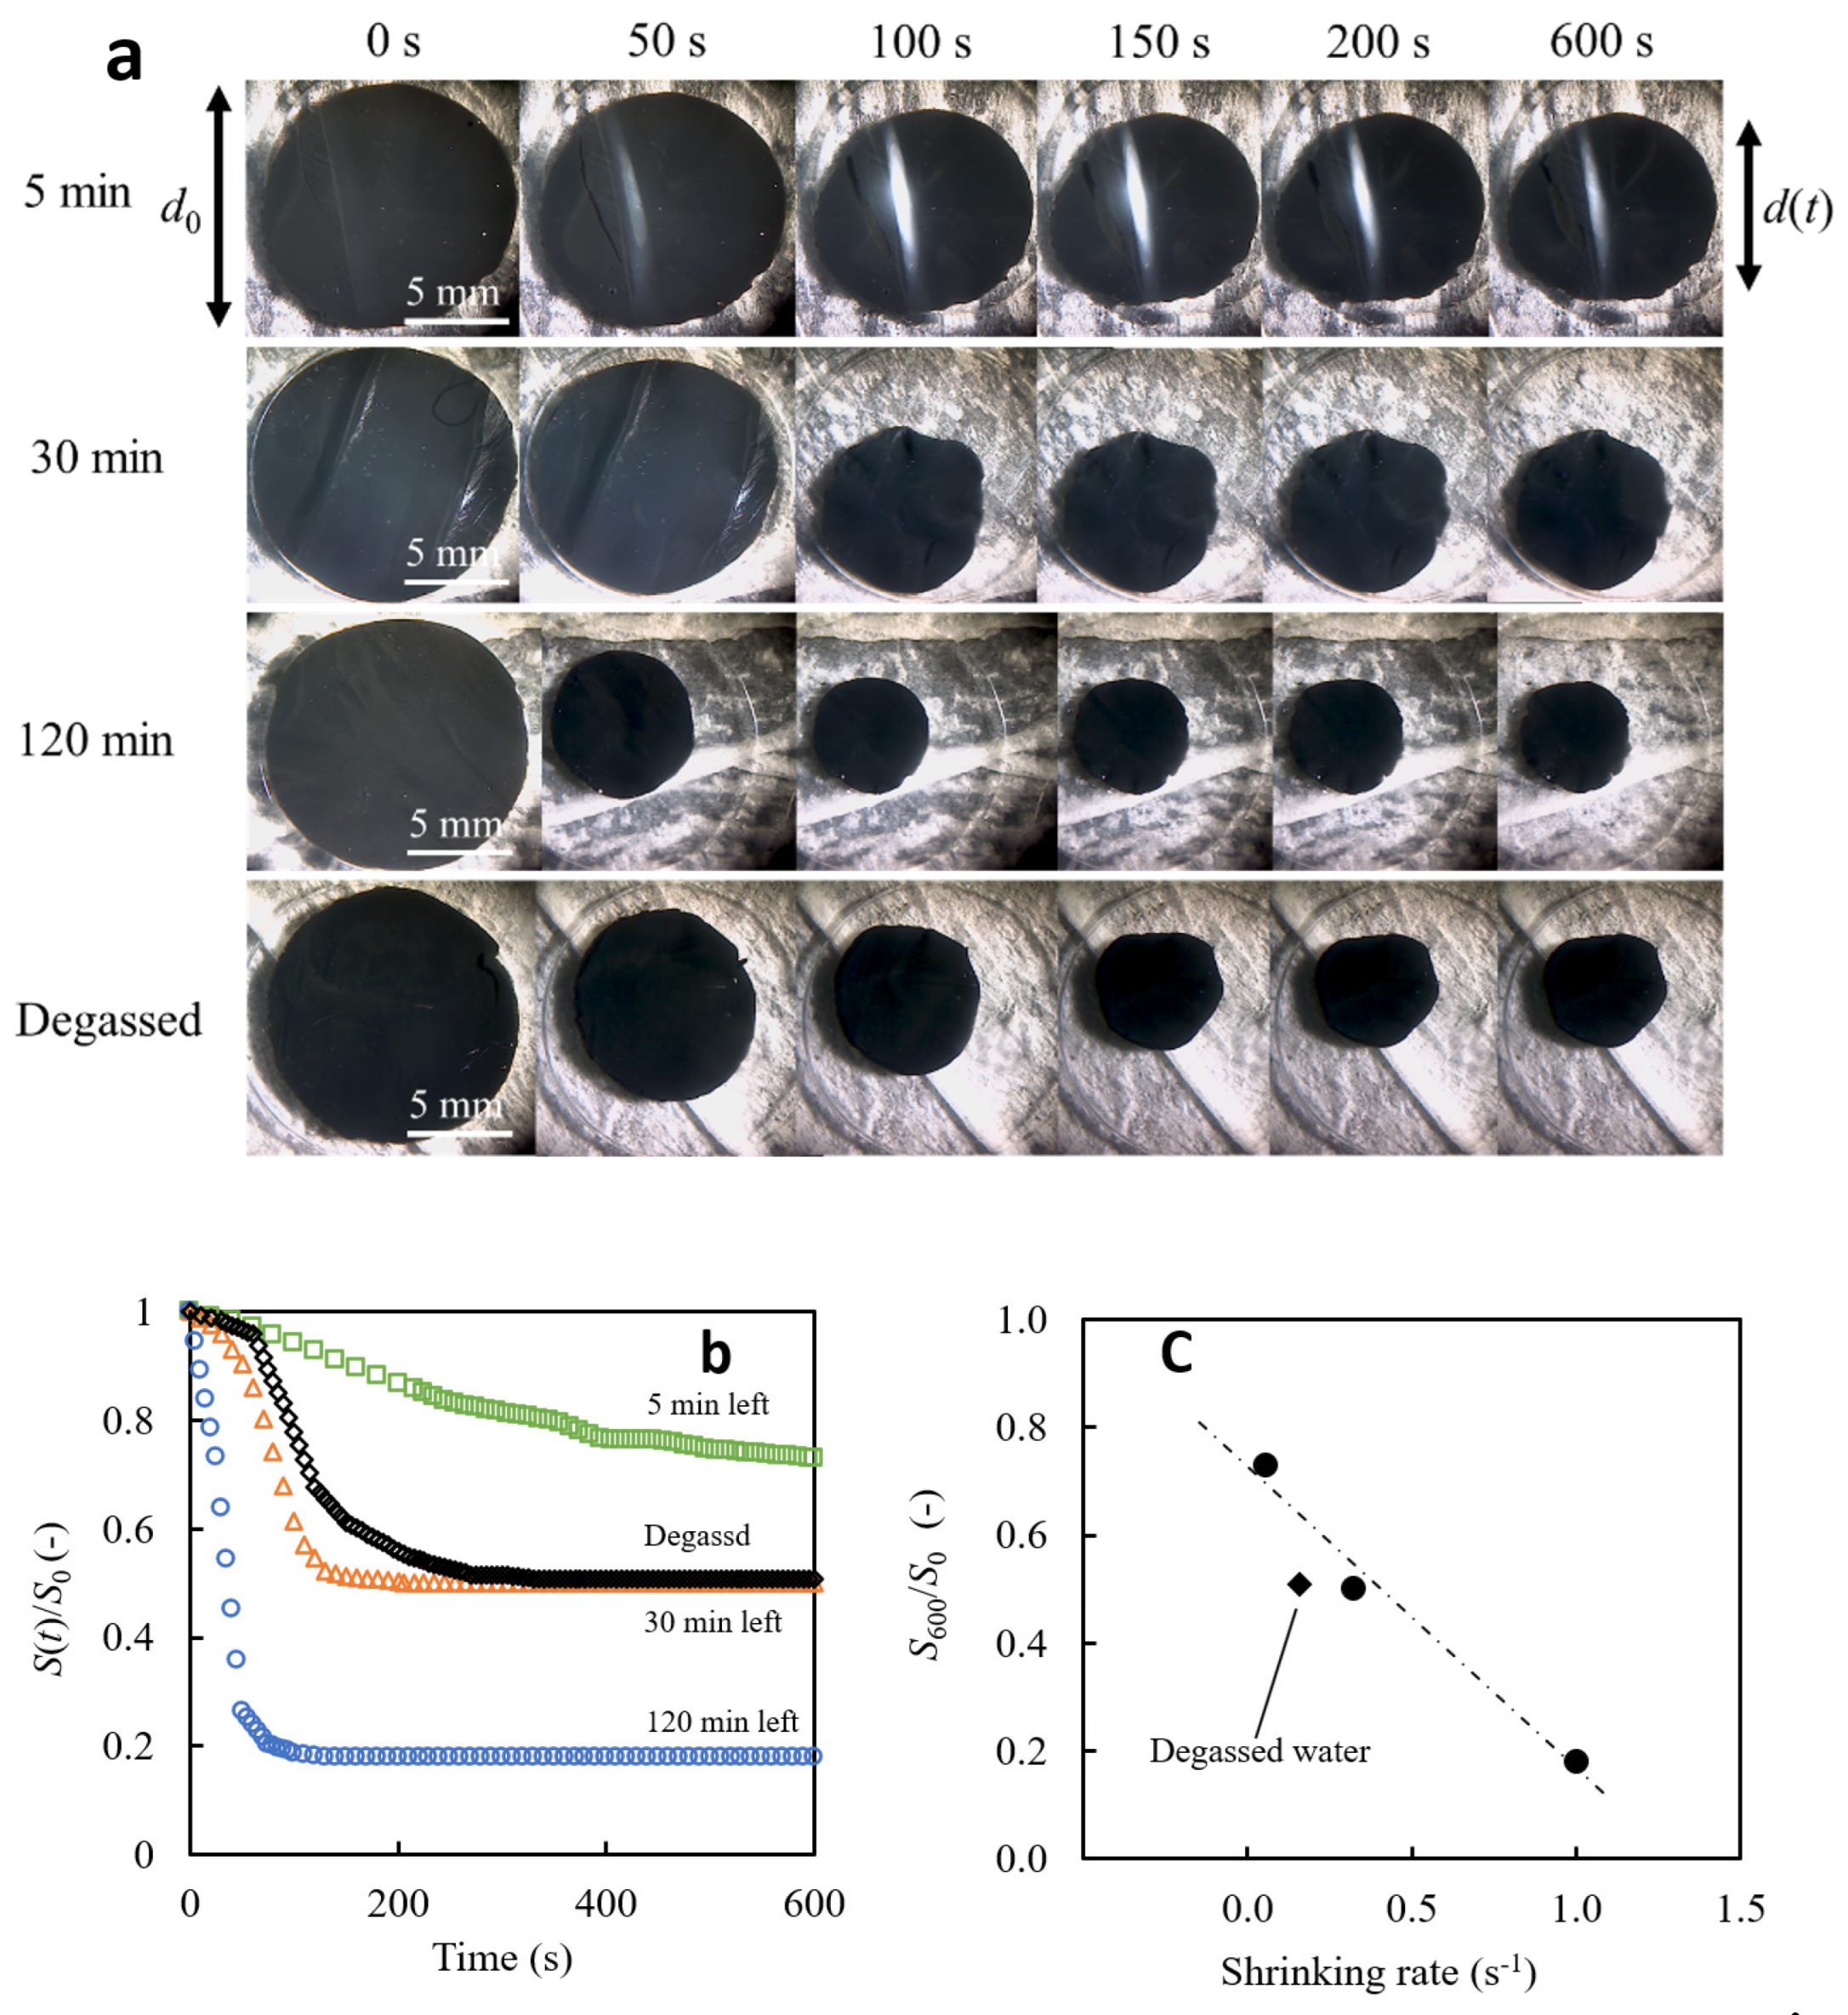
Light-Induced Volume Phase Transition Behavior
3. Conclusions
4. Materials and Methods
4.1. Materials
4.2. Preparation of Bubble Water and Degassed Water
4.3. Preparation of PNIPAM-co-AAc Hydrogel Discs
4.4. Characterization of Bubble Water
4.4.1. DLS
4.4.2. DO Measurement in Degassed and Bubble Waters
4.5. Characterization of PNIPAM-co-AAc Hydrogels
4.5.1. Mechanical Strength Measurement
4.5.2. SEM Analysis
4.5.3. FT-IR
4.5.4. Temperature-Swelling Ratio Phase Diagram
4.6. Observation and Analysis of Light-Induced Volume Phase Transition Behavior
Supplementary Materials
Author Contributions
Funding
Institutional Review Board Statement
Informed Consent Statement
Data Availability Statement
Acknowledgments
Conflicts of Interest
References
- Suzuki, A.; Tanaka, T. Phase transition in polymer gels induced by visible light. Nature 1990, 346, 345–347. [Google Scholar] [CrossRef]
- Wang, E.; Desai, M.S.; Lee, S.-W. Light-controlled graphene-elastin composite hydrogel actuators. Nano Lett. 2013, 13, 2826–2830. [Google Scholar] [CrossRef]
- Lendlein, A.; Jiang, H.; Jünger, O.; Langer, R. Light-induced shape-memory polymers. Nature 2005, 434, 879–882. [Google Scholar] [CrossRef] [PubMed]
- Meng, H.; Hu, J. A brief review of stimulus-active polymers responsive to thermal, light, magnetic, electric, and water/solvent stimuli. J. Intell. Mater. Syst. Struct. 2010, 21, 859–885. [Google Scholar] [CrossRef]
- Budhlall, B.M.; Marquez, M.; Velev, O.D. Microwave, photo-and thermally responsive PNIPAm− gold nanoparticle microgels. Langmuir 2008, 24, 11959–11966. [Google Scholar] [CrossRef] [PubMed]
- Bikram, M.; Gobin, A.M.; Whitmire, R.E.; West, J.L. Temperature-sensitive hydrogels with SiO2–Au nanoshells for controlled drug delivery. J. Control. Release 2007, 123, 219–227. [Google Scholar] [CrossRef]
- Xu, Y.; Ghag, O.; Reimann, M.; Sitterle, P.; Chatterjee, P.; Nofen, E.; Yu, H.; Jiang, H.; Dai, L.L. Development of visible-light responsive and mechanically enhanced “smart” UCST interpenetrating network hydrogels. Soft Matter 2018, 14, 151–160. [Google Scholar] [CrossRef]
- Zhao, Y.; Ikeda, T. Smart Light-Responsive Materials: Azobenzene-Containing Polymers and Liquid Crystals; John Wiley & Sons: Hoboken, NJ, USA, 2009. [Google Scholar]
- Lee, H.P.; Gaharwar, A.K. Light-responsive inorganic biomaterials for biomedical applications. Adv. Sci. 2020, 7, 2000863. [Google Scholar] [CrossRef]
- Kobatake, S.; Takami, S.; Muto, H.; Ishikawa, T.; Irie, M. Rapid and reversible shape changes of molecular crystals on photoirradiation. Nature 2007, 446, 778–781. [Google Scholar] [CrossRef]
- Ren, H.; Lin, Y.-H.; Fan, Y.-H.; Wu, S.-T. In-plane switching liquid crystal gel for polarization-independent light switch. J. Appl. Phys. 2004, 96, 3609–3611. [Google Scholar] [CrossRef]
- Shi, K.; Liu, Z.; Wei, Y.-Y.; Wang, W.; Ju, X.-J.; Xie, R.; Chu, L.-Y. Near-infrared light-responsive poly (N-isopropylacrylamide)/graphene oxide nanocomposite hydrogels with ultrahigh tensibility. ACS Appl. Mater. Interfaces 2015, 7, 27289–27298. [Google Scholar] [CrossRef] [PubMed]
- Diehl, F.; Hageneder, S.; Fossati, S.; Auer, S.K.; Dostalek, J.; Jonas, U. Plasmonic nanomaterials with responsive polymer hydrogels for sensing and actuation. Chem. Soc. Rev. 2022, 51, 3926–3963. [Google Scholar] [CrossRef] [PubMed]
- Sun, Z.; Song, C.; Wang, C.; Hu, Y.; Wu, J. Hydrogel-based controlled drug delivery for cancer treatment: A review. Mol. Pharm. 2019, 17, 373–391. [Google Scholar] [CrossRef] [PubMed]
- Amoli-Diva, M.; Sadighi-Bonabi, R.; Pourghazi, K. Switchable on/off drug release from gold nanoparticles-grafted dual light-and temperature-responsive hydrogel for controlled drug delivery. Mater. Sci. Eng. C 2017, 76, 242–248. [Google Scholar] [CrossRef]
- Yang, L.; Zhang, T.; Sun, W. Construction of biocompatible bilayered light-driven actuator composed of rGO/PNIPAM and PEGDA hydrogel. J. Appl. Polym. Sci. 2020, 137, 49375. [Google Scholar] [CrossRef]
- Ilgin, P.; Ozay, H.; Ozay, O. A new dual stimuli responsive hydrogel: Modeling approaches for the prediction of drug loading and release profile. Eur. Polym. J. 2019, 113, 244–253. [Google Scholar] [CrossRef]
- Wong, R.S.H.; Dodou, K. Effect of drug loading method and drug physicochemical properties on the material and drug release properties of poly (ethylene oxide) hydrogels for transdermal delivery. Polymers 2017, 9, 286. [Google Scholar] [CrossRef]
- Zhu, Y.; Zeng, Q.; Zhang, Q.; Li, K.; Shi, X.; Liang, F.; Han, D. Temperature/near-infrared light-responsive conductive hydrogels for controlled drug release and real-time monitoring. Nanoscale 2020, 12, 8679–8686. [Google Scholar] [CrossRef]
- Webber, M.J.; Pashuck, E.T. (Macro) molecular self-assembly for hydrogel drug delivery. Adv. Drug Deliv. Rev. 2021, 172, 275–295. [Google Scholar] [CrossRef]
- Arora, H.; Malik, R.; Yeghiazarian, L.; Cohen, C.; Wiesner, U. Earthworm inspired locomotive motion from fast swelling hybrid hydrogels. J. Polym. Sci. Part A Polym. Chem. 2009, 47, 5027–5033. [Google Scholar] [CrossRef]
- Cheng, H.; Zhang, G. Thermally sensitive microgels: From basic science to applications. In Hydrogel Micro Nanoparticles; Willey-VCH: Hoboken, NJ, USA, 2012; pp. 1–32. [Google Scholar]
- Bae, Y.H.; Okano, T.; Hsu, R.; Kim, S.W. Thermo-sensitive polymers as on-off switches for drug release. Die Makromol. Chem. Rapid Commun. 1987, 8, 481–485. [Google Scholar] [CrossRef]
- Yoshida, R.; Sakai, K.; Okano, T.; Sakurai, Y.; Bae, Y.H.; Kim, S.W. Surface-modulated skin layers of thermal responsive hydrogels as on-off switches: I. Drug release. J. Biomater. Sci. Polym. Ed. 1992, 3, 155–162. [Google Scholar] [CrossRef] [PubMed]
- Hirose, H.; Shibayama, M. Kinetics of volume phase transition in poly (N-isopropylacrylamide-co-acrylic acid) gels. Macromolecules 1998, 31, 5336–5342. [Google Scholar] [CrossRef]
- Imran, A.B.; Seki, T.; Takeoka, Y. Recent advances in hydrogels in terms of fast stimuli responsiveness and superior mechanical performance. Polym. J. 2010, 42, 839–851. [Google Scholar] [CrossRef]
- Zhang, X.; Zhuo, R. Synthesis of temperature-sensitive poly (N-isopropylacrylamide) hydrogel with improved surface property. J. Colloid Interface Sci. 2000, 223, 311–313. [Google Scholar] [CrossRef]
- Okeyoshi, K.; Abe, T.; Noguchi, Y.; Furukawa, H.; Yoshida, R. Shrinking Behavior of Surfactant-Grafted Thermosensitive Gels and the Mechanism of Rapid Shrinking. Macromol. Rapid Commun. 2008, 29, 897–903. [Google Scholar] [CrossRef]
- Liu, Q.; Zhang, P.; Qing, A.; Lan, Y.; Lu, M. Poly (N-isopropylacrylamide) hydrogels with improved shrinking kinetics by RAFT polymerization. Polymer 2006, 47, 2330–2336. [Google Scholar] [CrossRef]
- Kaneko, Y.; Sakai, K.; Kikuchi, A.; Yoshida, R.; Sakurai, Y.; Okano, T. Influence of freely mobile grafted chain length on dynamic properties of comb-type grafted poly (N-isopropylacrylamide) hydrogels. Macromolecules 1995, 28, 7717–7723. [Google Scholar] [CrossRef]
- Wu, X.S.; Hoffman, A.S.; Yager, P. Synthesis and characterization of thermally reversible macroporous poly (N-isopropylacrylamide) hydrogels. J. Polym. Sci. Part A Polym. Chem. 1992, 30, 2121–2129. [Google Scholar] [CrossRef]
- Serizawa, T.; Wakita, K.; Akashi, M. Rapid deswelling of porous poly (N-isopropylacrylamide) hydrogels prepared by incorporation of silica particles. Macromolecules 2002, 35, 10–12. [Google Scholar] [CrossRef]
- Kato, N.; Sakai, Y.; Shibata, S. Wide-range control of deswelling time for thermosensitive poly (N-isopropylacrylamide) gel treated by freeze-drying. Macromolecules 2003, 36, 961–963. [Google Scholar] [CrossRef]
- Zhang, X.-Z.; Xu, X.-D.; Cheng, S.-X.; Zhuo, R.-X. Strategies to improve the response rate of thermosensitive PNIPAAm hydrogels. Soft Matter 2008, 4, 385–391. [Google Scholar] [CrossRef] [PubMed]
- Ushikubo, F.Y.; Furukawa, T.; Nakagawa, R.; Enari, M.; Makino, Y.; Kawagoe, Y.; Shiina, T.; Oshita, S. Evidence of the existence and the stability of nano-bubbles in water. Colloids Surf. A Physicochem. Eng. Asp. 2010, 361, 31–37. [Google Scholar] [CrossRef]
- Alheshibri, M.; Qian, J.; Jehannin, M.; Craig, V.S.J. A history of nanobubbles. Langmuir 2016, 32, 11086–11100. [Google Scholar] [CrossRef]
- Epstein, P.S.; Plesset, M.S. On the stability of gas bubbles in liquid-gas solutions. J. Chem. Phys. 1950, 18, 1505–1509. [Google Scholar] [CrossRef]
- Brennen, C.E. Cavitation and Bubble Dynamics; Cambridge University Press: Cambridge, UK, 2014. [Google Scholar]
- Zhou, L.; Wang, S.; Zhang, L.; Hu, J. Generation and stability of bulk nano-bubbles: A review and perspective. Curr. Opin. Colloid Interface Sci. 2021, 53, 101439. [Google Scholar] [CrossRef]
- Wang, Y.; Zhai, W.; Cheng, S.; Li, J.; Zhang, H. Surface-functionalized design of blood-contacting biomaterials for preventing coagulation and promoting hemostasis. Friction 2023, 11, 1371–1394. [Google Scholar] [CrossRef]
- Sahoo, S.R.; Mothilal, M.; Priyadharshini, B.; Damodharan, N. Thermosensitive hydrogels—A potential carrier for the delivery of drugs and macromolecules. Int. J. Appl. Pharm 2021, 3, 102–109. [Google Scholar] [CrossRef]
- Xia, L.-W.; Xie, R.; Ju, X.-J.; Wang, W.; Chen, Q.; Chu, L.-Y. Nano-structured smart hydrogels with rapid response and high elasticity. Nat. Commun. 2013, 4, 2226. [Google Scholar] [CrossRef]
- Li, H.; Hu, L.; Song, D.; Lin, F. Characteristics of micro-nano bubbles and potential application in groundwater bioremediation. Water Environ. Res. 2014, 86, 844–851. [Google Scholar] [CrossRef]
- Uchida, T.; Liu, S.; Enari, M.; Oshita, S.; Yamazaki, K.; Gohara, K. Effect of NaCl on the lifetime of micro-and nano-bubbles. Nanomaterials 2016, 6, 31. [Google Scholar] [CrossRef] [PubMed]
- Jia, J.; Zhu, Z.; Chen, H.; Pan, H.; Jiang, L.; Su, W.-H.; Chen, Q.; Tang, Y.; Pan, J.; Yu, K. Full life circle of micro-nano bubbles: Generation, characterization and applications. Chem. Eng. J. 2023, 471, 144621. [Google Scholar] [CrossRef]
- Wang, Y.; Zhou, L.; Hu, J.; Zhang, L. Theoretical analysis on the stability of single bulk nano-bubble. Front. Mater. 2022, 9, 824283. [Google Scholar] [CrossRef]
- Zhang, X.; Liu, X.; Zhong, Y.; Zhou, Z.; Huang, Y.; Sun, C.Q. Nanobubble skin supersolidity. Langmuir 2016, 32, 11321–11327. [Google Scholar] [CrossRef]
- Luo, Y.; Schork, F.J. Emulsion and miniemulsion polymerizations with an oil-soluble initiator in the presence and absence of an aqueous-phase radical scavenger. J. Polym. Sci. Part A Polym. Chem. 2002, 40, 3200–3211. [Google Scholar] [CrossRef]
- Zavada, S.R.; Furgal, J.C.; Wood, N.D.; Scott, T.F. Oxygen-mediated polymerization initiated by oltipraz-derived thiones. J. Polym. Sci. Part A Polym. Chem. 2017, 55, 1373–1382. [Google Scholar] [CrossRef]
- Bhanu, V.A.; Kishore, K. Role of oxygen in polymerization reactions. Chem. Rev. 1991, 91, 99–117. [Google Scholar] [CrossRef]
- Liu, S.; Chua, L.; Shamsabadi, A.A.; Corcoran, P.; Patra, A.; Grady, M.C.; Soroush, M.; Rappe, A.M. Oxygen-Initiated Free-Radical Polymerization of Alkyl Acrylates at High Temperatures. Macromolecules 2021, 54, 7925–7930. [Google Scholar] [CrossRef]
- Höfer, M.; Moszner, N.; Liska, R. Oxygen scavengers and sensitizers for reduced oxygen inhibition in radical photopolymerization. J. Polym. Sci. Part A Polym. Chem. 2008, 46, 6916–6927. [Google Scholar] [CrossRef]
- Croutxé-Barghorn, C.; Soppera, O.; Simonin, L.; Lougnot, D.J. On the unexpected role of oxygen in the generation of microlens arrays with self-developing photopolymers. Adv. Mater. Opt. Electron. 2000, 10, 25–38. [Google Scholar] [CrossRef]
- Tsuji, Y.; Nakagawa, S.; Gupit, C.I.; Ohira, M.; Shibayama, M.; Li, X. Selective doping of positive and negative spatial defects into polymer gels by tuning the pregel packing conditions of star polymers. Macromolecules 2020, 53, 7537–7545. [Google Scholar] [CrossRef]
- Zheng, R.; Hu, J.; Lin, Z.; Wu, G.; Lin, Y. Anisotropic Polyimide/Cellulose Nanofibril Composite Aerogels for Thermal Insulation and Flame Retardancy. ACS Appl. Polym. Mater. 2023, 6, 4180–4189. [Google Scholar] [CrossRef]
- Niu, J.; Zhao, B.; Guo, X.; Yin, T. Effects of vacuum freeze-drying and vacuum spray-drying on biochemical properties and functionalities of myofibrillar proteins from silver carp. J. Food Qual. 2019, 2019, 9457835. [Google Scholar] [CrossRef]
- Nakamura, S.; Onimaru, S.; Oishi, Y.; Narita, T. Volume and temperature change behaviors of photothermal convertible hydrogels. Polymer 2017, 116, 534–539. [Google Scholar] [CrossRef]
- Shibayama, M.; Fujikawa, Y.; Nomura, S. Dynamic light scattering study of poly (N-isopropylacrylamide-co-acrylic acid) gels. Macromolecules 1996, 29, 6535–6540. [Google Scholar] [CrossRef]
- Tokita, M. Transport phenomena in gel. Gels 2016, 2, 17. [Google Scholar] [CrossRef]
- Anseth, K.S.; Bowman, C.N.; Brannon-Peppas, L. Mechanical properties of hydrogels and their experimental determination. Biomaterials 1996, 17, 1647–1657. [Google Scholar] [CrossRef]
- Kaneko, Y.; Nakamura, S.; Sakai, K.; Aoyagi, T.; Kikuchi, A.; Sakurai, Y.; Okano, T. Rapid deswelling response of poly (N-isopropylacrylamide) hydrogels by the formation of water release channels using poly (ethylene oxide) graft chains. Macromolecules 1998, 31, 6099–6105. [Google Scholar] [CrossRef]
- Matsukawa, K.; Masuda, T.; Akimoto, A.M.; Yoshida, R. A surface-grafted thermoresponsive hydrogel in which the surface structure dominates the bulk properties. Chem. Commun. 2016, 52, 11064–11067. [Google Scholar] [CrossRef]
- Tanaka, T.; Fillmore, D.J. Kinetics of swelling of gels. J. Chem. Phys. 1979, 70, 1214–1218. [Google Scholar] [CrossRef]
- Doi, M. Gel dynamics. J. Phys. Soc. Jpn. 2009, 78, 052001. [Google Scholar] [CrossRef]
- Li, Y.; Tanaka, T. Kinetics of swelling and shrinking of gels. J. Chem. Phys. 1990, 92, 1365–1371. [Google Scholar] [CrossRef]
- Komori, T.; Sakamoto, R. On Tanaka-Fillmore’s kinetics swelling of gels. Colloid Polym. Sci. 1989, 267, 179–183. [Google Scholar] [CrossRef]
- Maeda, S.; Kato, T.; Kogure, H.; Hosoya, N. Rapid response of thermo-sensitive hydrogels with porous structures. Appl. Phys. Lett. 2015, 106, 171909. [Google Scholar] [CrossRef]
- Zrinyi, M.; Rosta, J.; Horkay, F. Studies on the swelling and shrinking kinetics of chemically cross-linked disk-shaped poly (vinyl acetate) gels. Macromolecules 1993, 26, 3097–3102. [Google Scholar] [CrossRef]


Disclaimer/Publisher’s Note: The statements, opinions and data contained in all publications are solely those of the individual author(s) and contributor(s) and not of MDPI and/or the editor(s). MDPI and/or the editor(s) disclaim responsibility for any injury to people or property resulting from any ideas, methods, instructions or products referred to in the content. |
© 2023 by the authors. Licensee MDPI, Basel, Switzerland. This article is an open access article distributed under the terms and conditions of the Creative Commons Attribution (CC BY) license (https://creativecommons.org/licenses/by/4.0/).
Share and Cite
Kuroki, S.; Kubota, M.; Haraguchi, R.; Oishi, Y.; Narita, T. Additive-Free Method for Enhancing the Volume Phase Transition Rate in Light-Responsive Hydrogels: A Study of Micro-Nano Bubble Water on PNIPAM-co-AAc Hydrogels. Gels 2023, 9, 880. https://doi.org/10.3390/gels9110880
Kuroki S, Kubota M, Haraguchi R, Oishi Y, Narita T. Additive-Free Method for Enhancing the Volume Phase Transition Rate in Light-Responsive Hydrogels: A Study of Micro-Nano Bubble Water on PNIPAM-co-AAc Hydrogels. Gels. 2023; 9(11):880. https://doi.org/10.3390/gels9110880
Chicago/Turabian StyleKuroki, Saho, Masaya Kubota, Ryota Haraguchi, Yushi Oishi, and Takayuki Narita. 2023. "Additive-Free Method for Enhancing the Volume Phase Transition Rate in Light-Responsive Hydrogels: A Study of Micro-Nano Bubble Water on PNIPAM-co-AAc Hydrogels" Gels 9, no. 11: 880. https://doi.org/10.3390/gels9110880