
The Mycorrizal Status in Vineyards Affected by Esca


Abstract
:1. Introduction
2. Materials and Methods
2.1. Experimental Trials
2.2. Collected Samples
2.3. Total Native AMF Assessment Using Non-Vital Staining and Light Microscopy
2.4. Molecular AMF Native Detection and Quantification
2.4.1. DNA Extraction
2.4.2. Overall Quantification of Glomeromycota with High-Coverage ITS Primers
2.4.3. DNA Sequencing and Bioinformatics Analysis
2.5. Rhizophagus Irregularis and Funneliformis Mosseae Absolute Quantification
2.5.1. Primer Selections and Validation
2.5.2. qPCR Assay
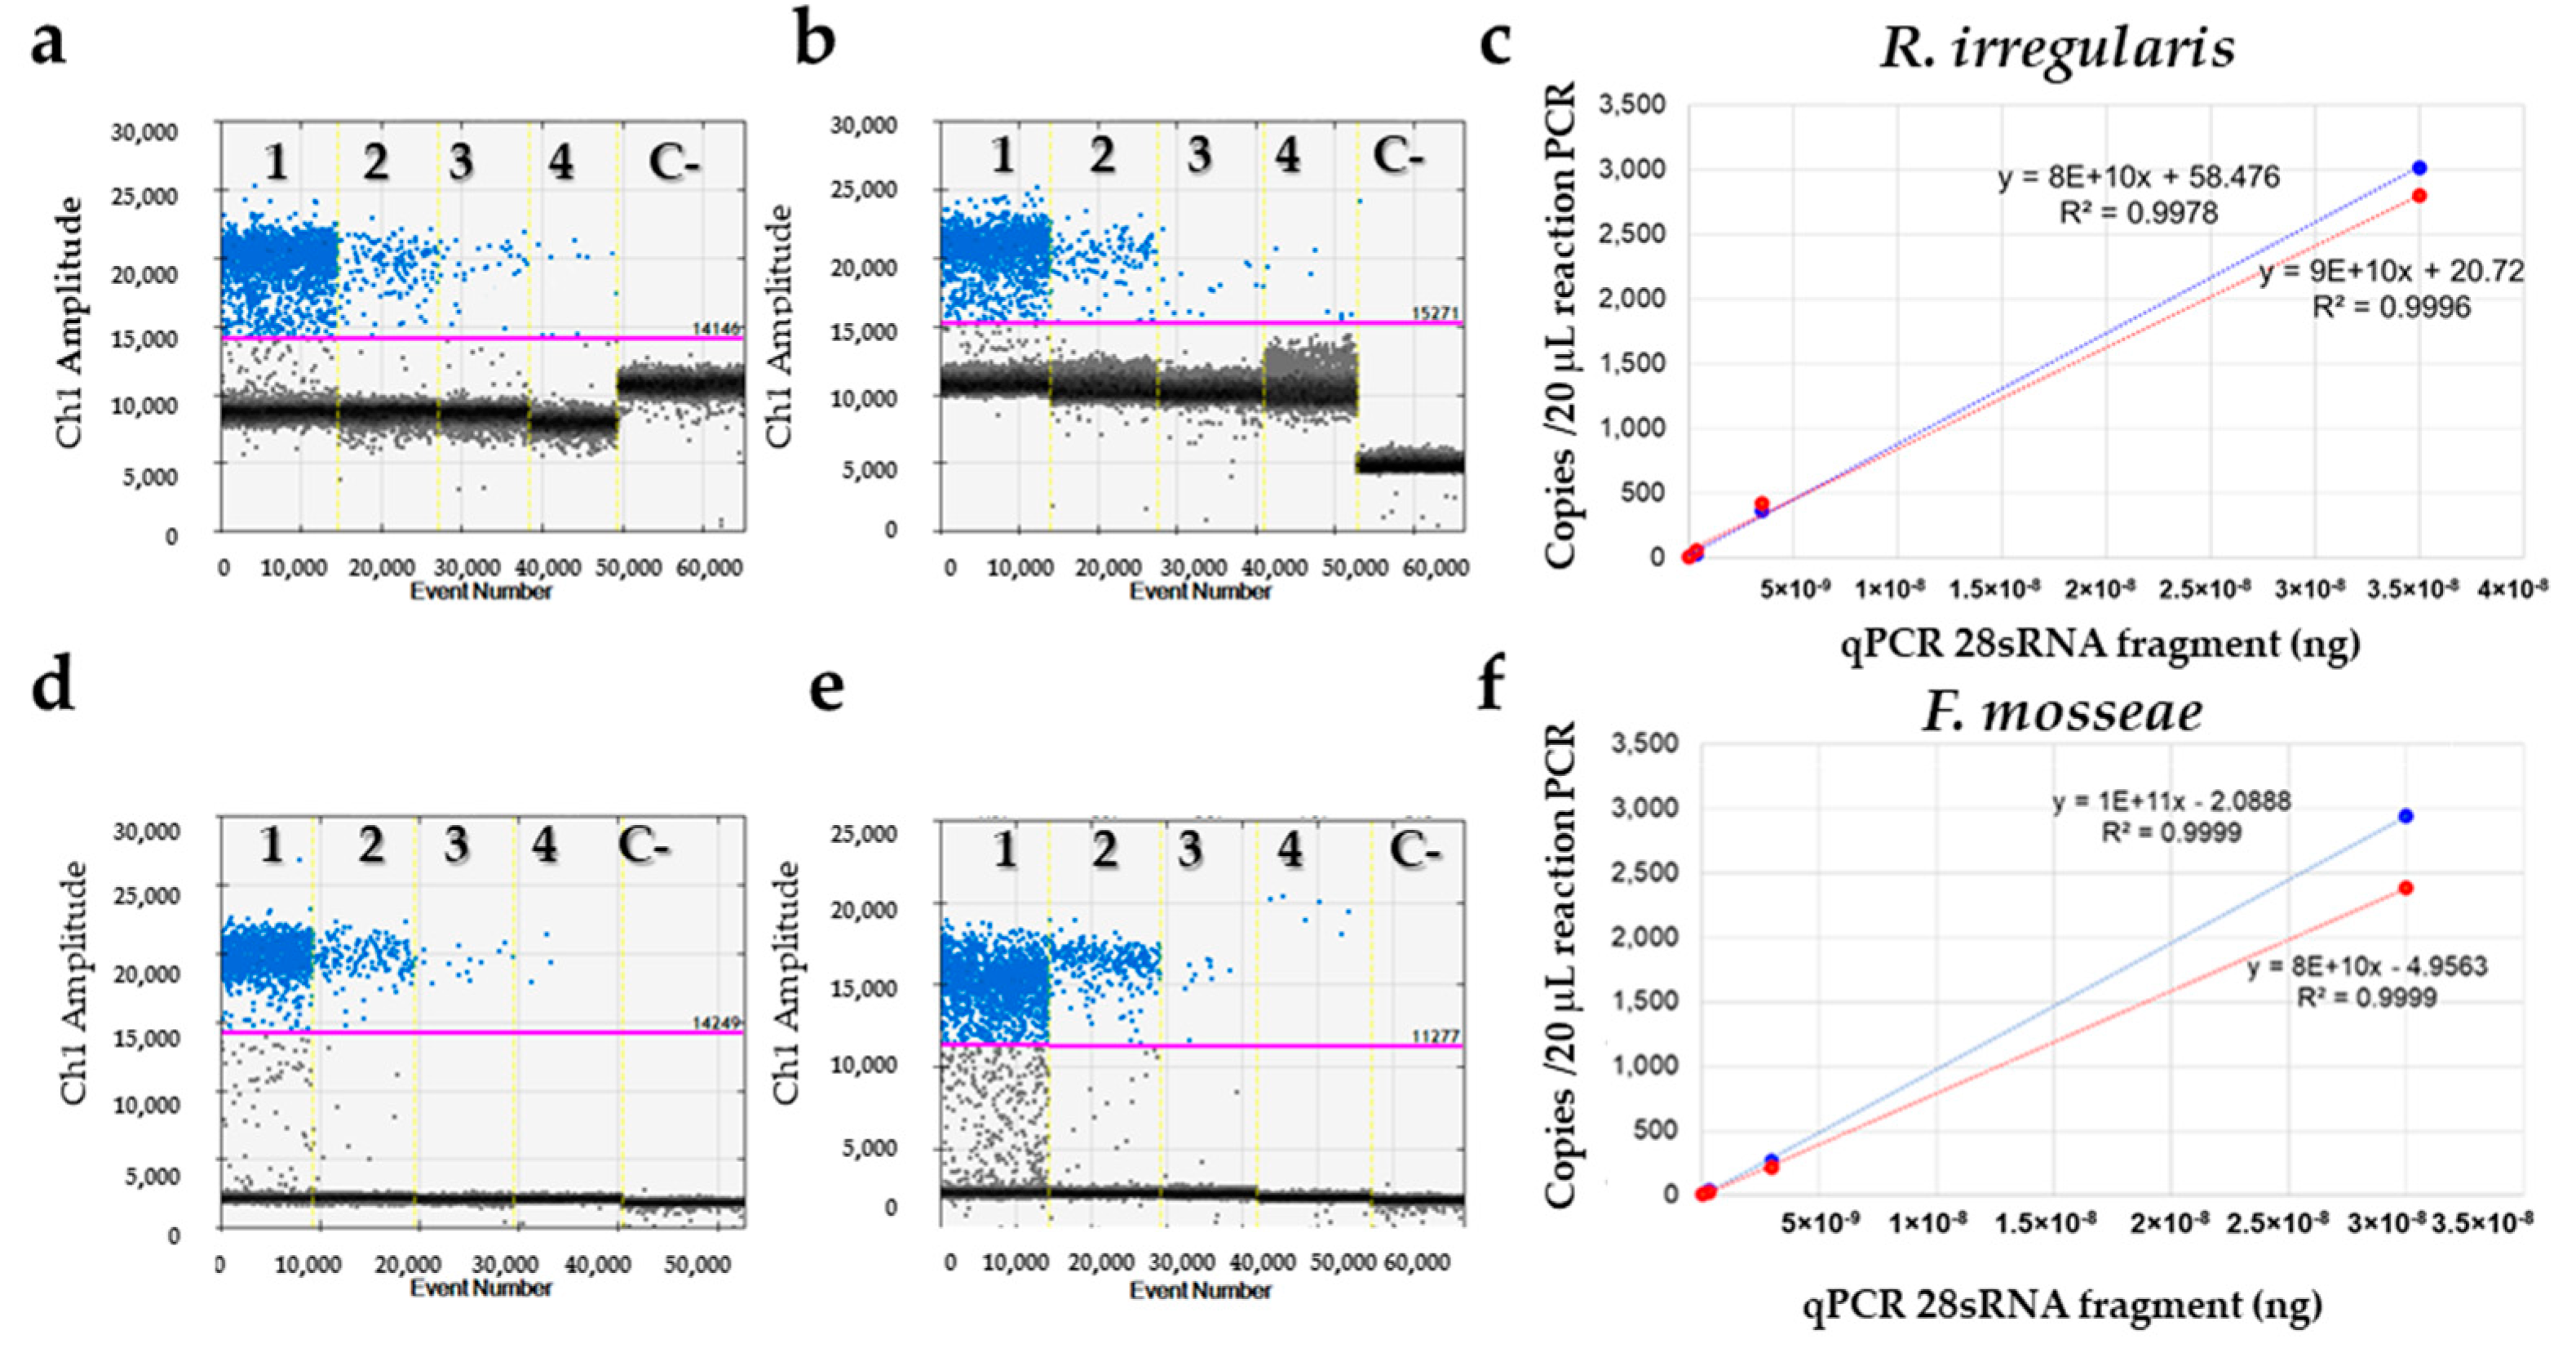
2.5.3. ddPCR Assay
2.6. Statistical Analysis
3. Results
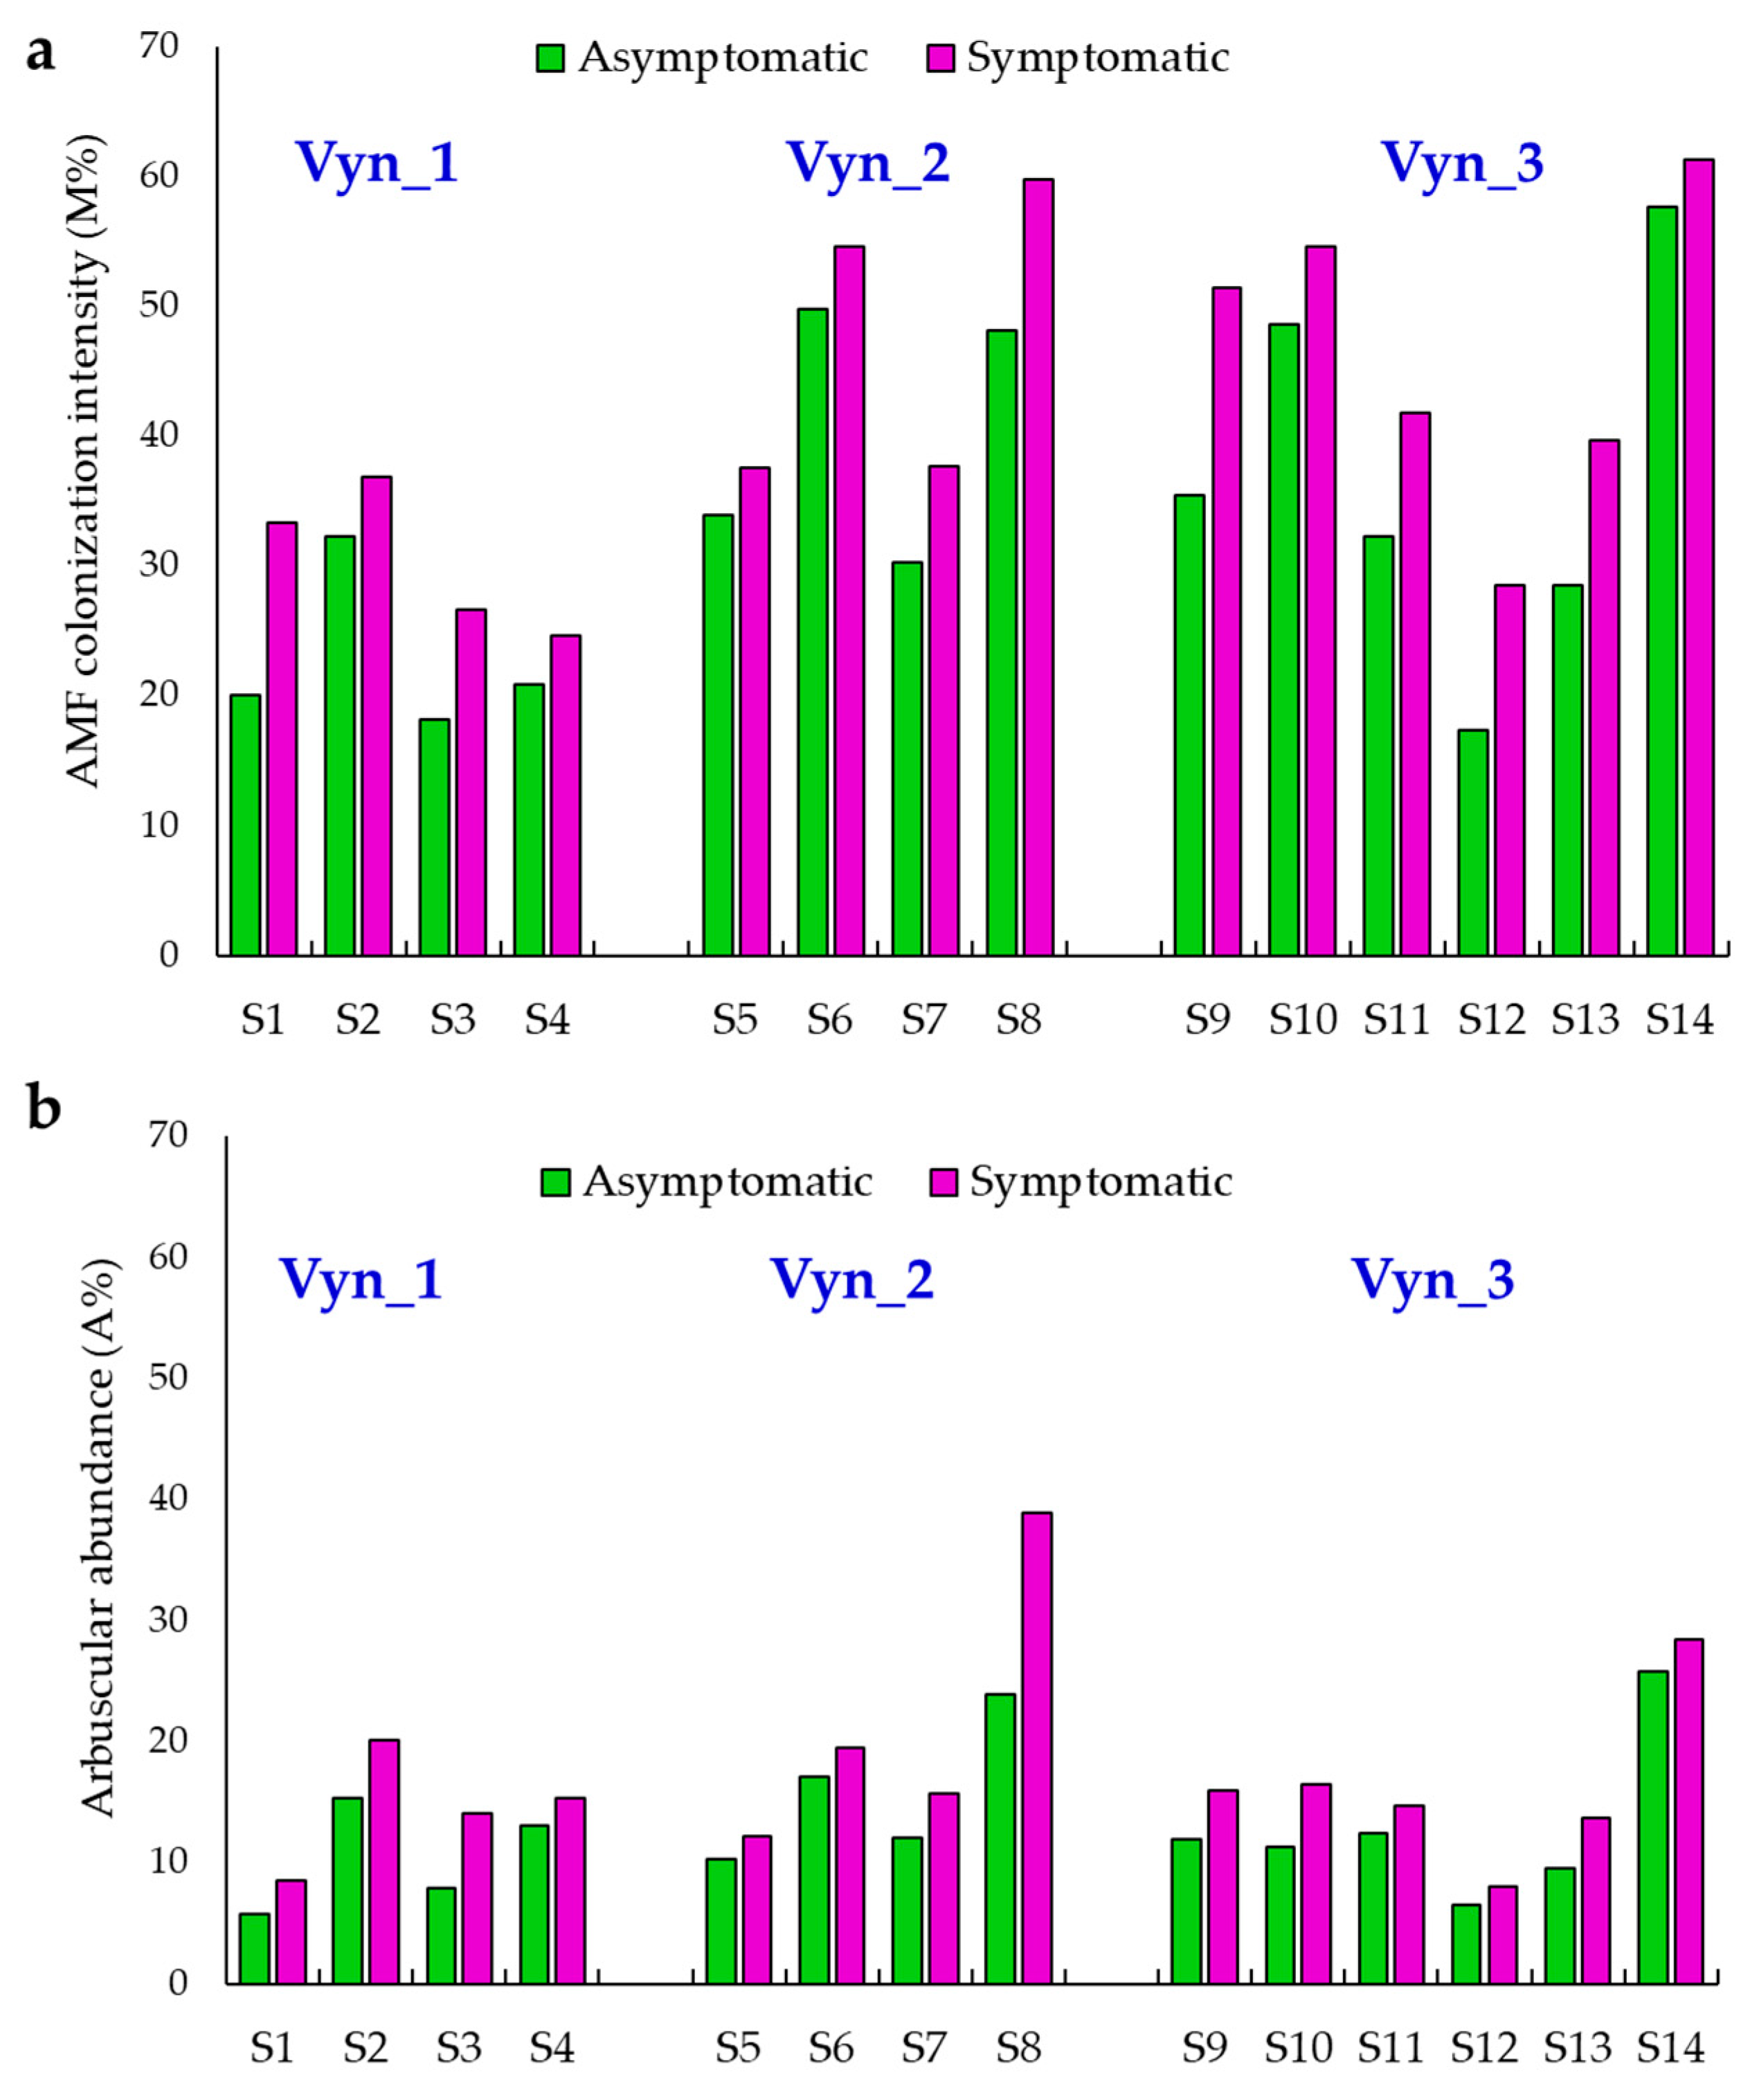
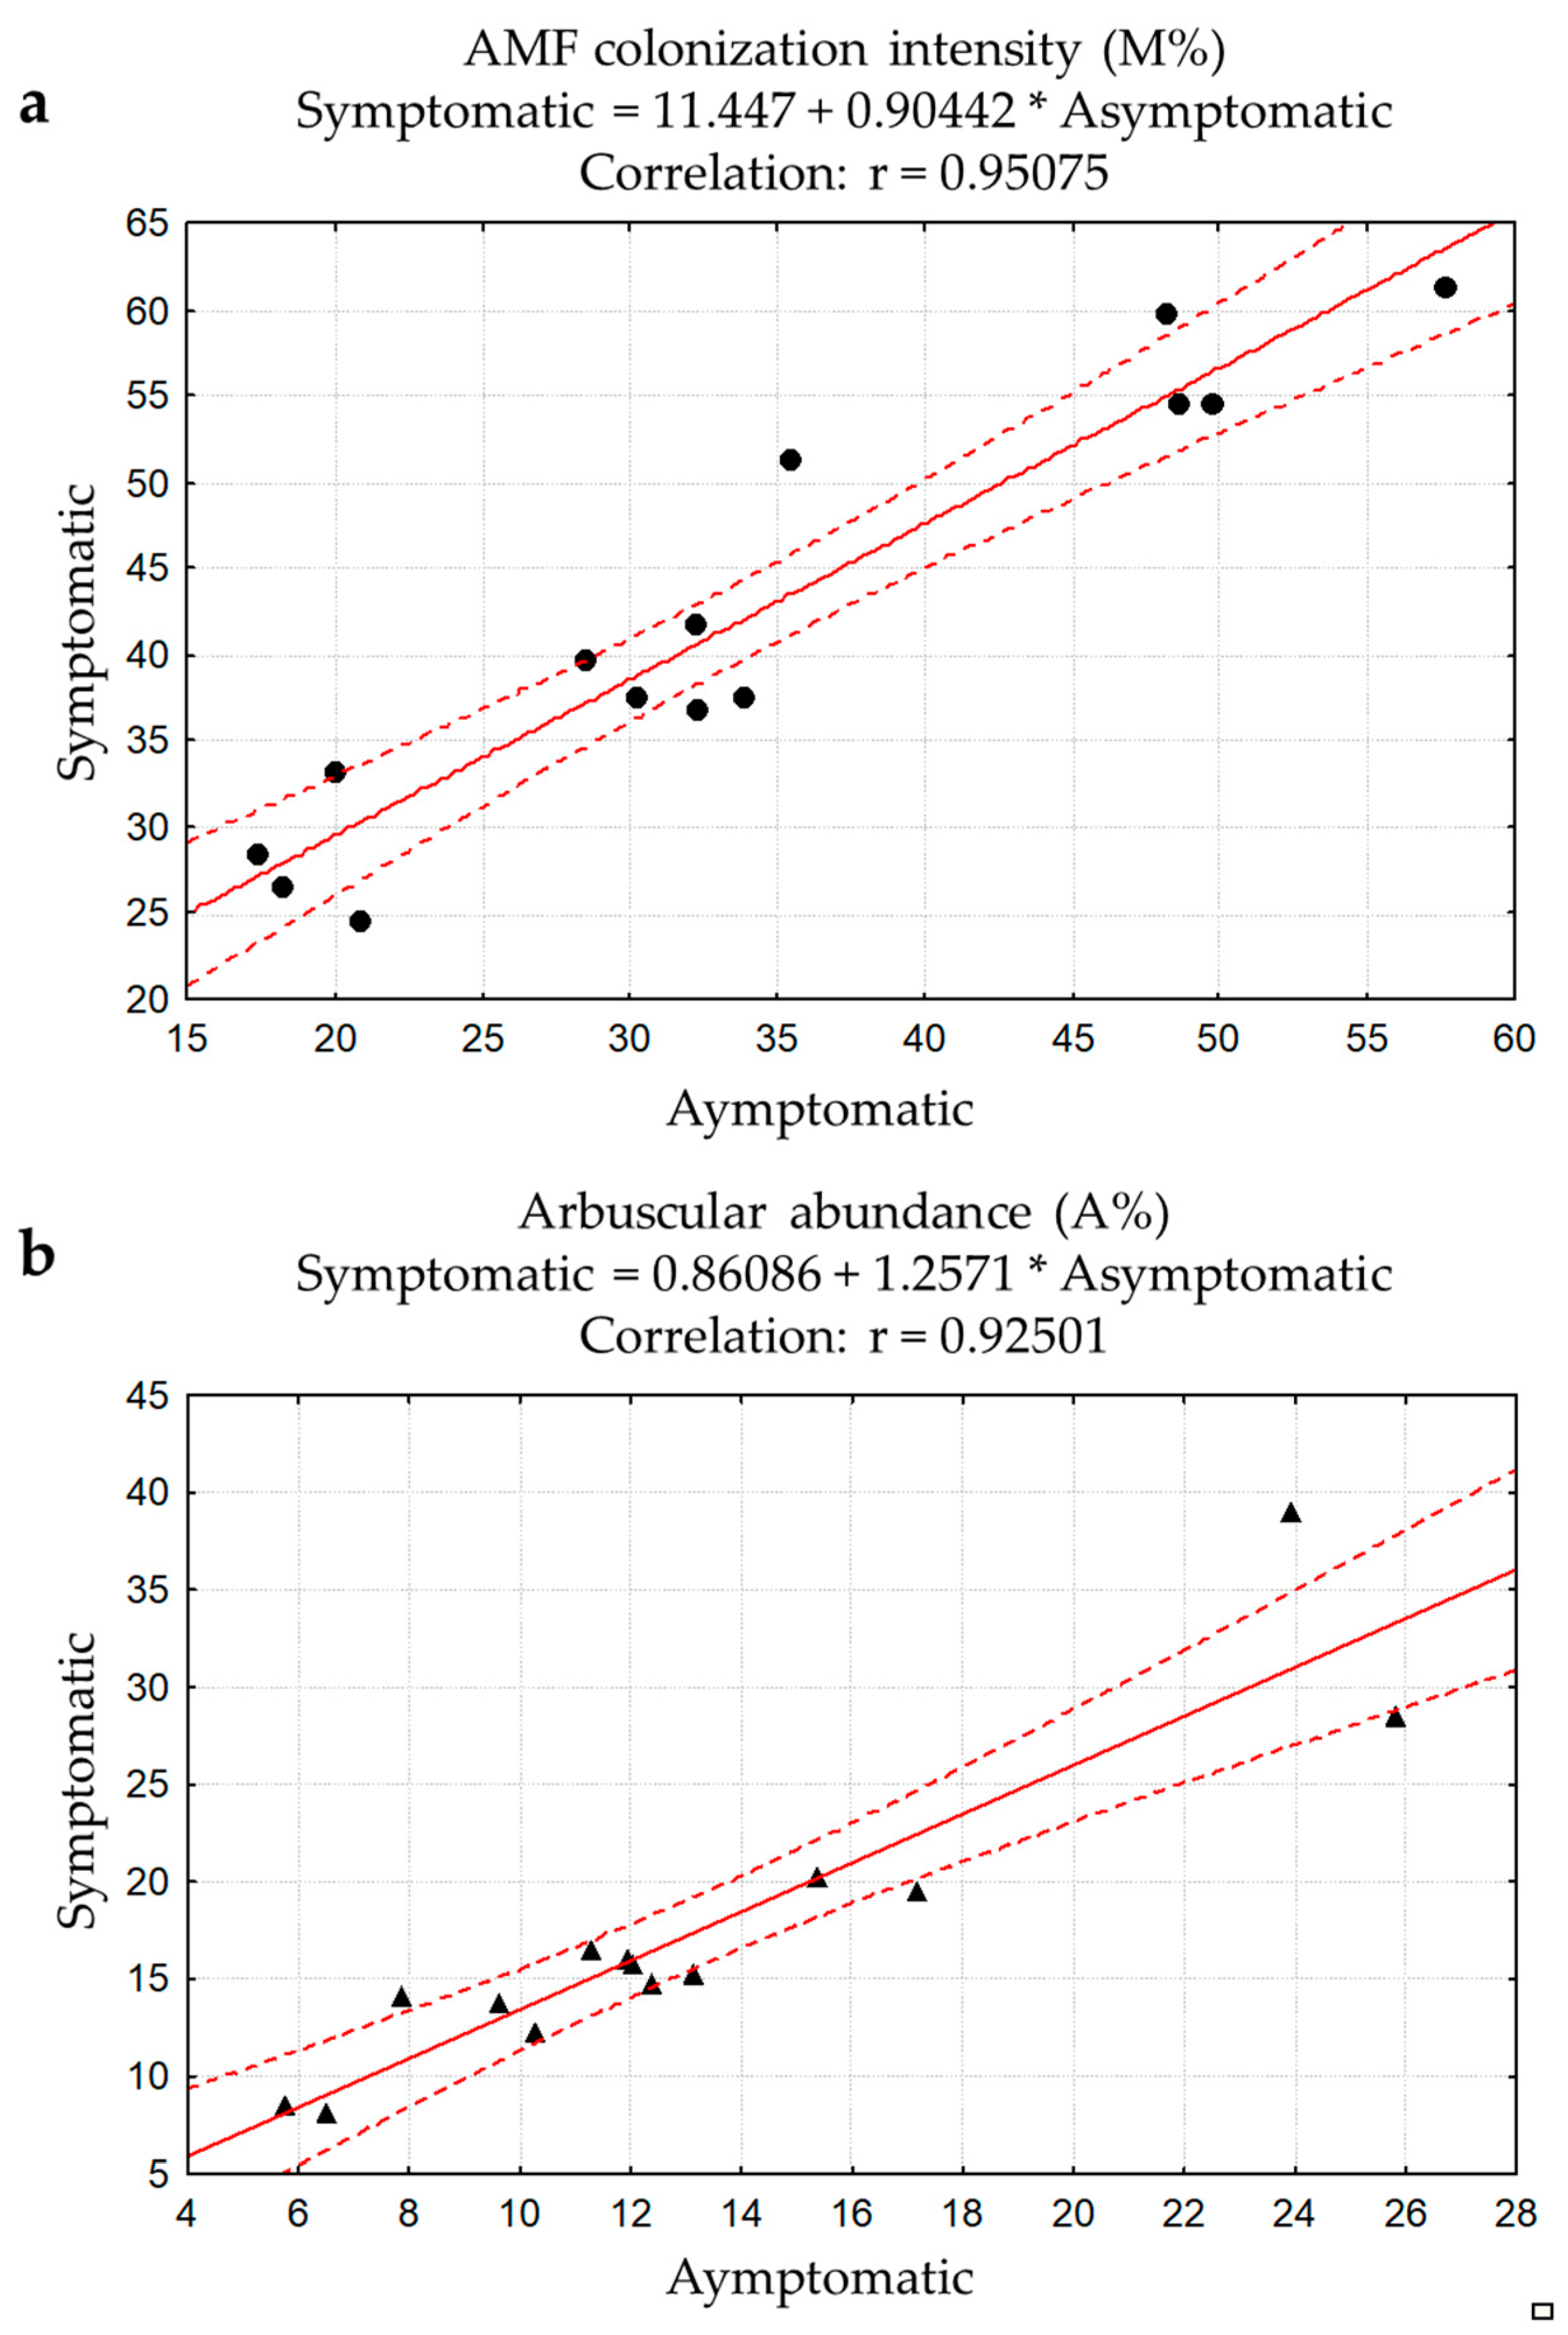
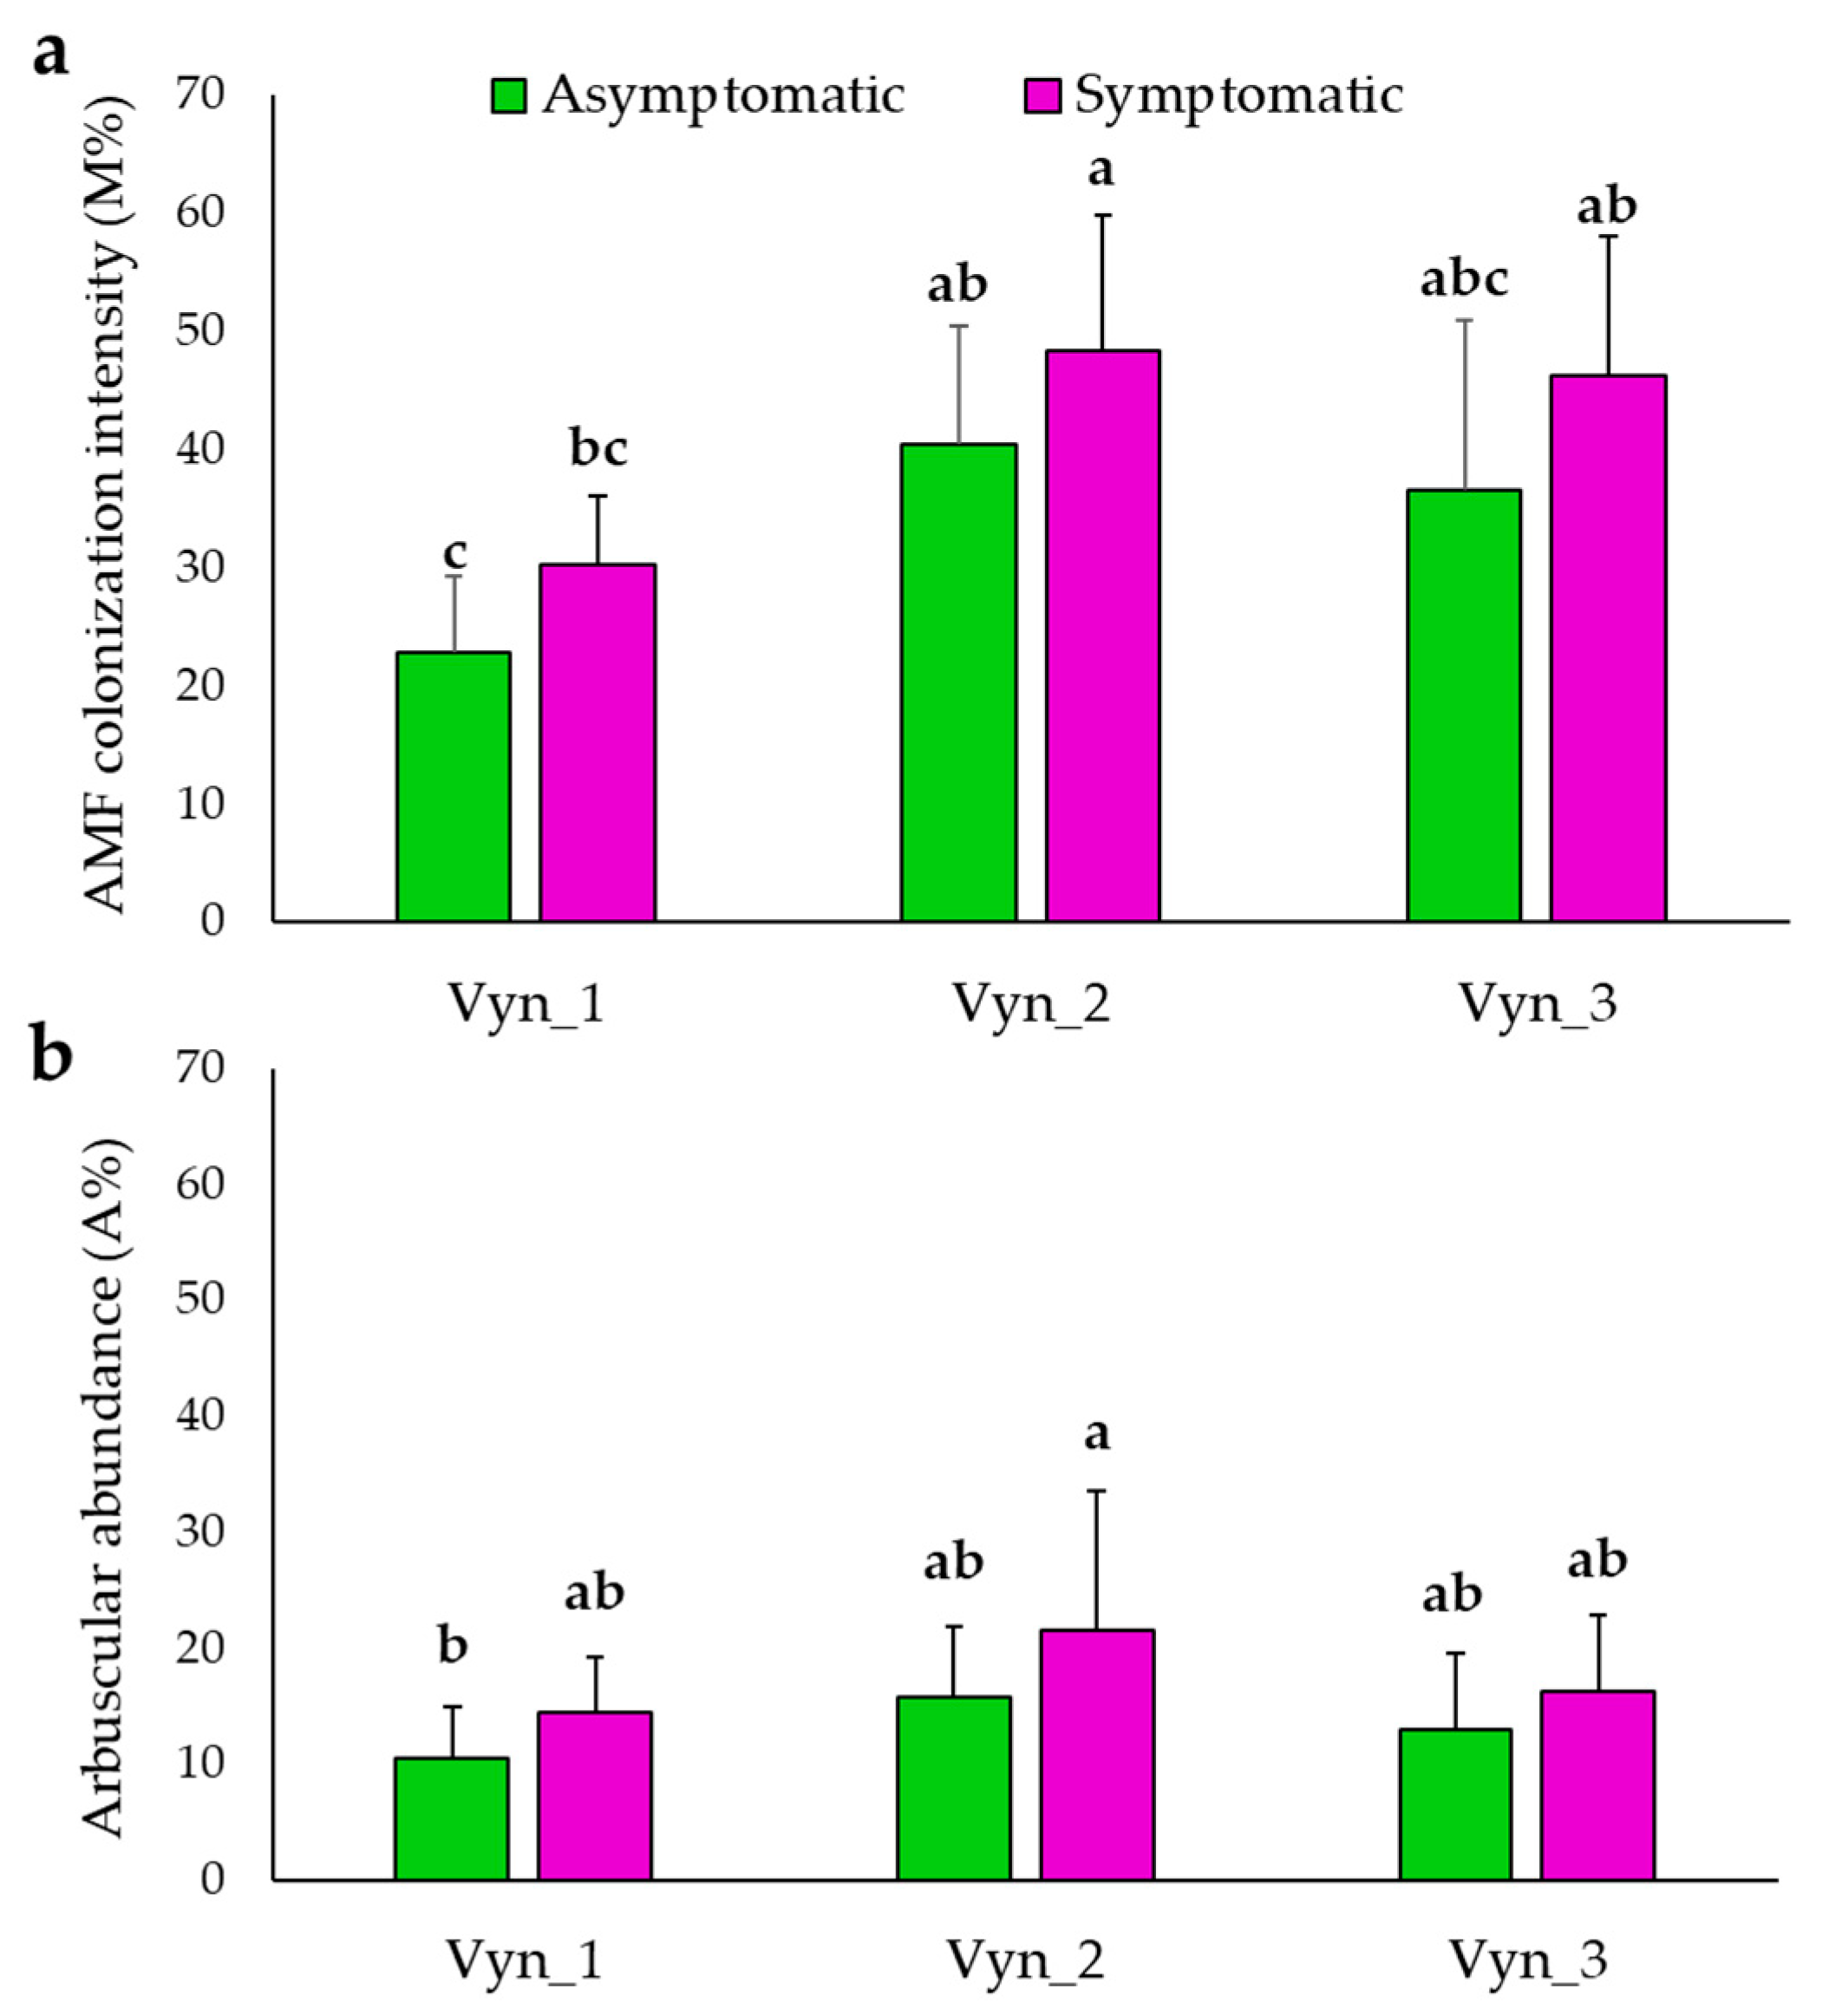
3.1. Total Native AMF Assessment Using Non-Vital Staining and Light Microscopy
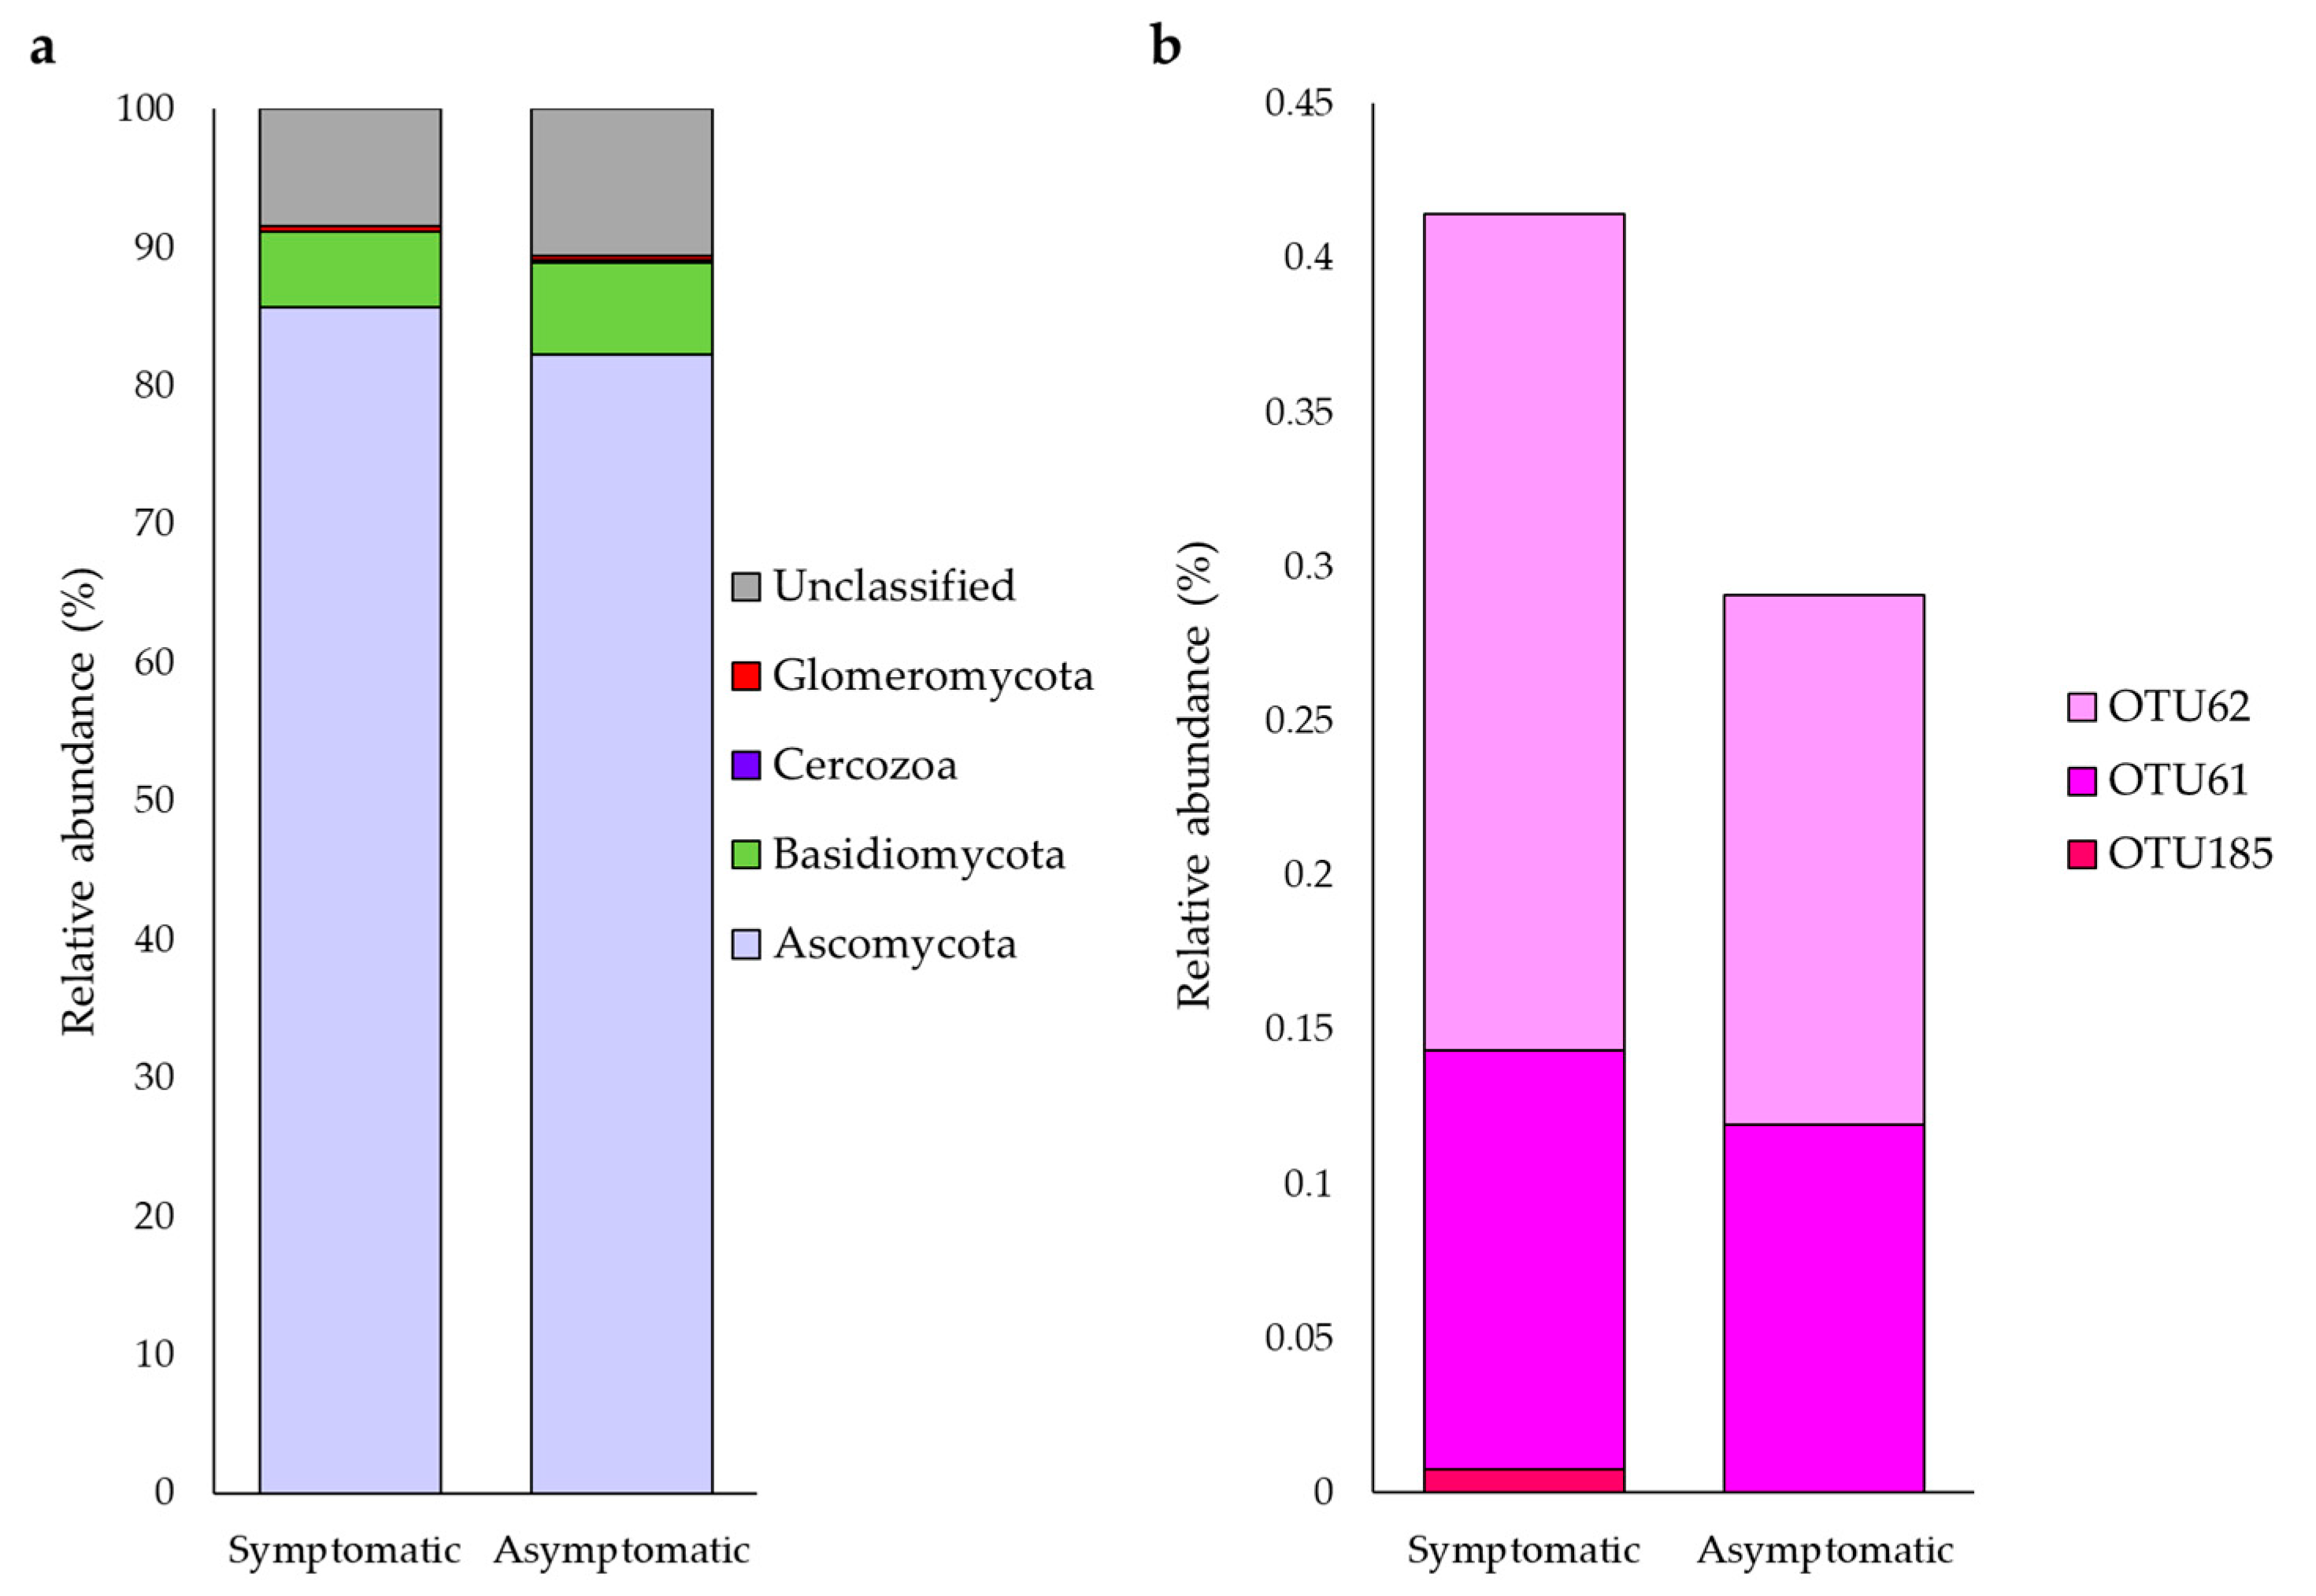
3.2. Overall Quantification of Glomeromycota with High-Coverage ITS Primers
3.3. Rhizophagus Irregularis and Funneliformis Mosseae Absolute Quantification
3.3.1. Primer Selection and Validation
3.3.2. qPCR Assay
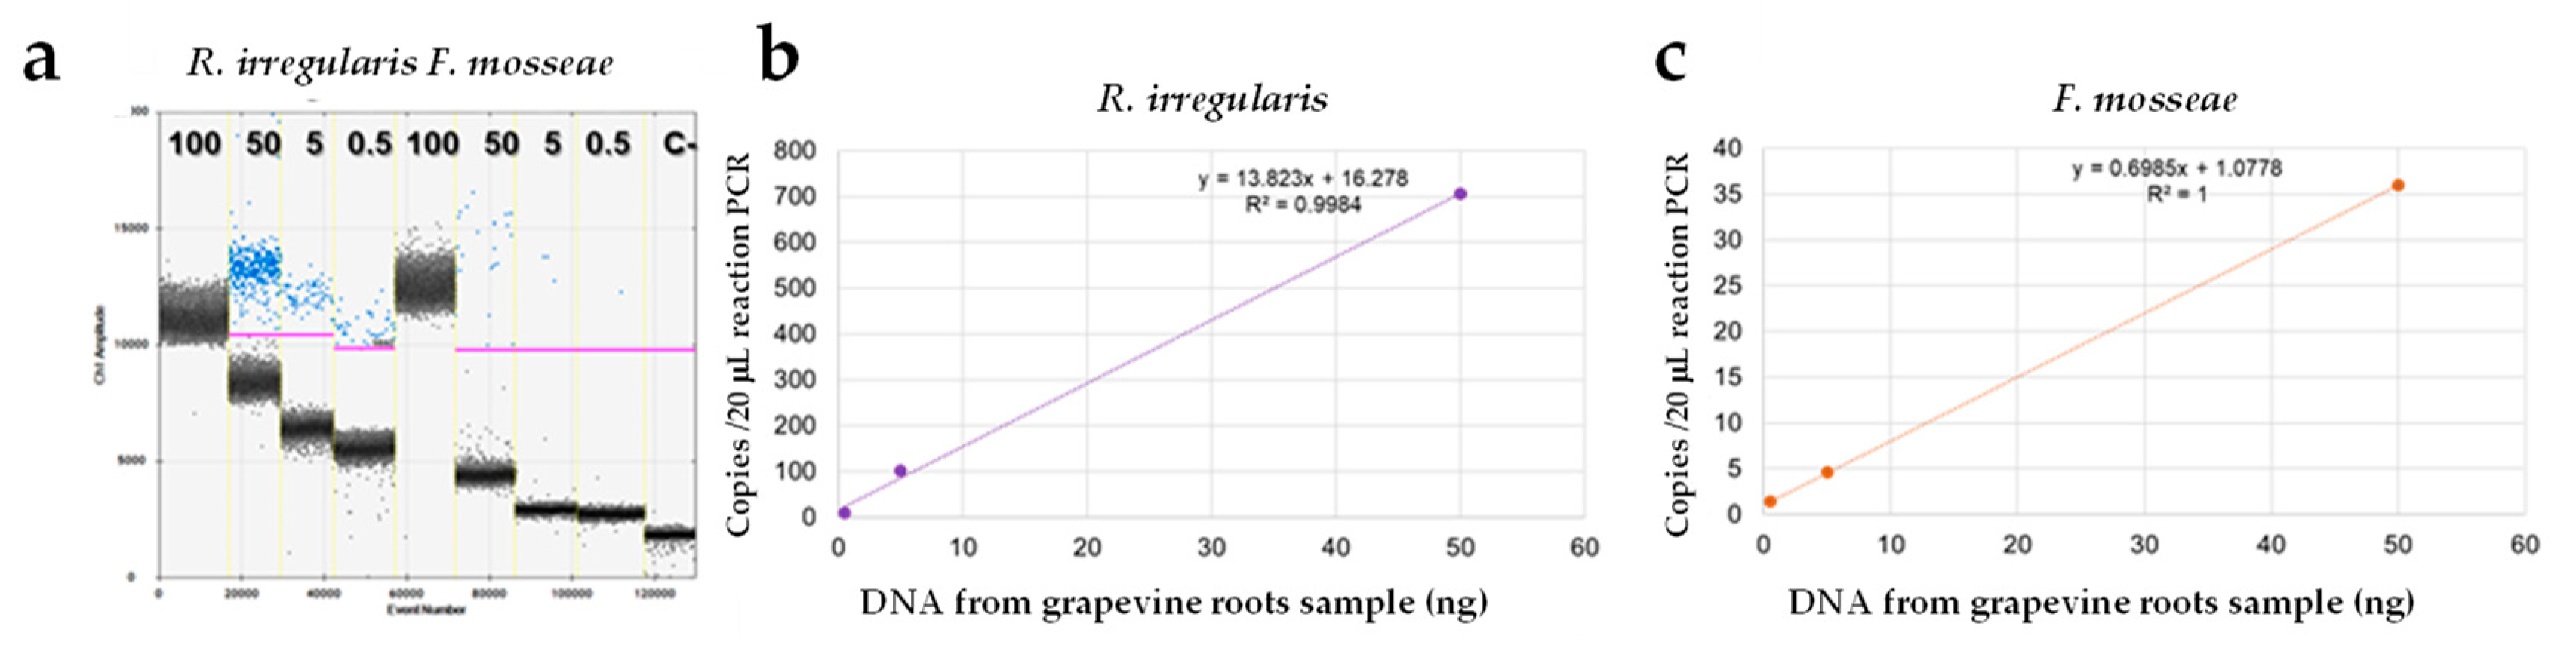
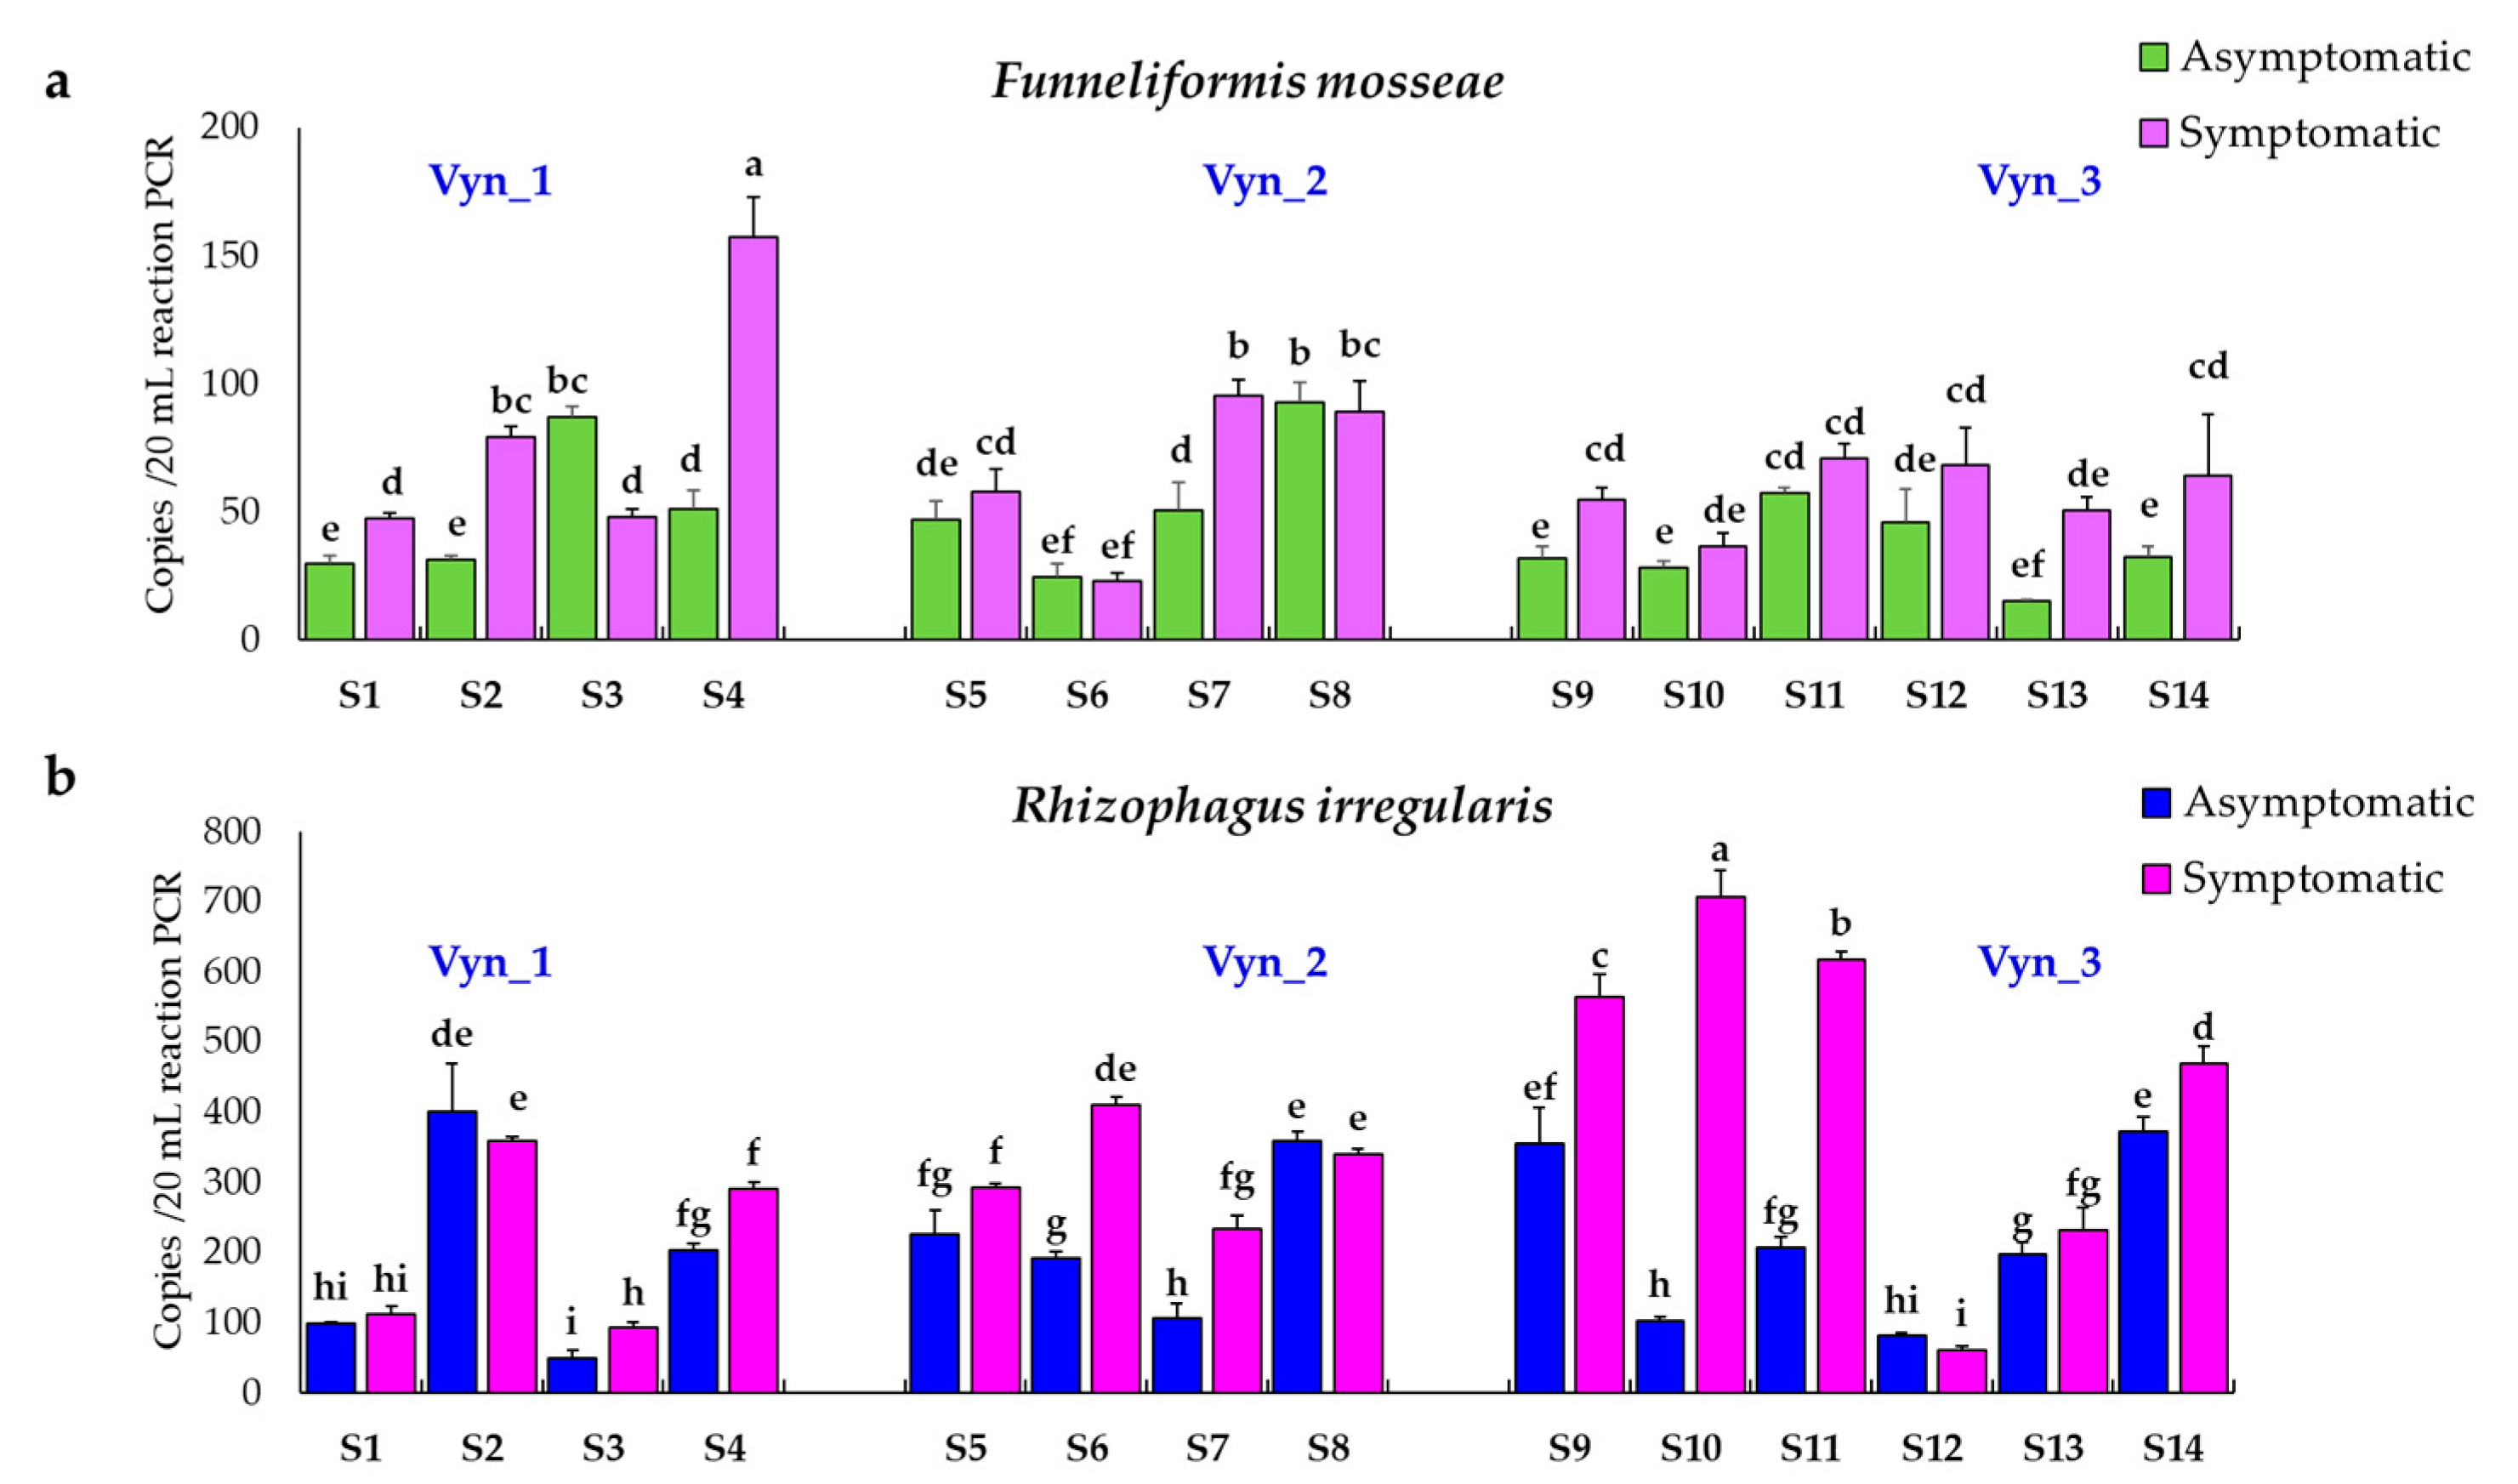
3.3.3. ddPCR Assay
4. Discussion
5. Conclusions
Supplementary Materials
Author Contributions
Funding
Institutional Review Board Statement
Informed Consent Statement
Data Availability Statement
Acknowledgments
Conflicts of Interest
References
- Gramaje, D.; Urbez-Torres, J.R.; Sosnowski, M.R. Managing grapevine trunk diseases with respect to etiology and epidemiology: Current strategies and future prospects. Plant Dis. 2018, 102, 12–39. [Google Scholar] [CrossRef] [Green Version]
- Urbez-Torres, J.R. The status of Botryosphaeriaceae species infecting grapevines. Phytopathol. Mediterr. 2011, 50, S5–S45. [Google Scholar]
- Landi, L.; Murolo, S.; Romanazzi, G. Colonization of Vitis spp. wood by sGFP-transformed Phaeomoniella chlamydospora, a tracheomycotic fungus involved in esca disease. Phytopathology 2012, 102, 290–297. [Google Scholar] [CrossRef] [Green Version]
- Travadon, R.; Rolshausen, P.E.; Gubler, W.D.; Cadle-Davidson, L.; Baumgartner, K. Susceptibility of cultivated and wild Vitis spp. to wood infection by fungal trunk pathogens. Plant Dis. 2013, 97, 1529–1536. [Google Scholar] [CrossRef] [PubMed] [Green Version]
- Bertsch, C.; Ramirez-Suero, M.; Magnin-Robert, M.; Larignon, P.; Chong, J.; Abou-Mansour, E.; Spagnolo, A.; Clément, C.; Fontaine, F. Grapevine trunk diseases: Complex and still poorly understood. Plant Pathol. 2013, 62, 243–265. [Google Scholar] [CrossRef] [Green Version]
- Gramaje, D.; Mostert, L.; Groenewald, J.Z.; Crous, P.W. Phaeoacremonium: From esca disease to Phaeohyphomycosis. Fungal Biol. 2015, 119, 759–783. [Google Scholar] [CrossRef]
- González-Domínguez, E.; Berlanas, C.; Gramaje, D.; Armengol, J.; Rossi, V.; Berbegal, M. Temporal dispersal patterns of Phaeomoniella chlamydospora, causal agent of petri disease and esca, in vineyards. Phytopathology 2020, 110, 1216–1225. [Google Scholar] [CrossRef] [PubMed]
- Mugnai, L.; Graniti, A.; Surico, G. Esca (Black measles) and brown wood-streaking: Two old and elusive diseases of grapevines. Plant Dis. 1999, 83, 404–418. [Google Scholar] [CrossRef] [Green Version]
- Rego, C.; Oliveira, H.; Carvalho, A.; Phillips, A. Involvement of Phaeoacremonium spp. and Cylindrocarpon destructans with grapevine decline in Portugal. Phytopathol. Mediterr. 2000, 39, 76–79. [Google Scholar] [CrossRef]
- Berlanas, C.; Lopez-Manzanares, B.; Gramaje, D. Estimation of viable propagules of black-foot disease pathogens in grapevine cultivated soils and their relation to production systems and soil properties. Plant Soil. 2017, 417, 467–479. [Google Scholar] [CrossRef]
- Spatafora, J.W.; Chang, Y.; Benny, G.L.; Lazarus, K.; Smith, M.E.; Berbee, M.L.; Bonito, G.; Corradi, N.; Grigoriev, I.; Gryganskyi, A.; et al. A phylum-level phylogenetic classification of zygomycete fungi based on genome-scale data. Mycologia 2016, 108, 1028–1046. [Google Scholar] [CrossRef] [PubMed] [Green Version]
- Smith, S.E.; Read, D.J. Mycorrhizal Symbiosis; Academic Press: London, UK, 2008; ISBN 9780080559346. [Google Scholar]
- Ivanov, S.; Austin, J.; Berg, R.H.; Harrison, M.J. Extensive membrane systems at the host–arbuscular mycorrhizal fungus interface. Nat. Plants 2019, 5, 194–203. [Google Scholar] [CrossRef]
- Shi, S.; Luo, X.; Dong, X.; Qiu, Y.; Xu, C.; He, X. Arbuscular mycorrhization enhances nitrogen, phosphorus and potassium accumulation in Vicia faba by modulating soil nutrient balance under elevated CO2. J. Fungi 2021, 7, 361. [Google Scholar] [CrossRef]
- Begum, N.; Qin, C.; Ahanger, M.A.; Raza, S.; Khan, M.I.; Ashraf, M.; Ahmed, N.; Zhang, L. Role of Arbuscular Mycorrhizal Fungi in Plant Growth Regulation: Implications in Abiotic Stress Tolerance. Front. Plant Sci. 2019, 10, 1068. [Google Scholar] [CrossRef] [Green Version]
- Pozo, M.J.; Azcón-Aguilar, C. Unravelling mycorrhiza-induced resistance. Curr. Opin. Plant Biol. 2007, 10, 1–6. [Google Scholar] [CrossRef]
- Fiorilli, V.; Vannini, C.; Ortolani, F.; Garcia-Seco, D.; Chiapello, M.; Novero, M.; Domingo, G.; Terzi, V.; Morcia, C.; Bagnaresi, P.; et al. Omics approaches revealed how arbuscular mycorrhizal symbiosis enhances yield and resistance to leaf pathogen in wheat. Sci. Rep. 2018, 8, 9625. [Google Scholar] [CrossRef]
- Kaur, S.; Suseela, V. Unraveling arbuscular mycorrhiza-induced changes in plant primary and secondary metabolome. Metabolites 2020, 10, 335. [Google Scholar] [CrossRef] [PubMed]
- Carretero, C.L.; Cantos, M.; Garcia, J.L.; Azcon, R.; Troncoso, A. Growth response of micropropagated cassava clones as affected by Glomus intraradices colonization. J. Plant Nutr. 2009, 32, 261–273. [Google Scholar] [CrossRef]
- Affokpon, A.; Coyne, D.L.; Lawouin, L.; Tossou, C.; Agbèdè, R.D.; Coosemans, J. Effectiveness of native West African arbuscular mycorrhizal fungi in protecting vegetable crops against root-knot nematodes. Biol. Fertil. Soils 2011, 47, 207–217. [Google Scholar] [CrossRef]
- Wehner, J.; Antunes, P.M.; Powell, J.R.; Caruso, T.; Rillig, M.C. Native arbuscular mycorrhizal fungal assemblages protect grassland host plants from pathogens. PLoS ONE 2011, 6, e27381. [Google Scholar] [CrossRef] [PubMed] [Green Version]
- Berruti, A.; Lumini, E.; Balestrini, R.; Bianciotto, V. Arbuscular mycorrhizal fungi as natural biofertilizers: Let’s benefit from past successes. Front. Microbiol. 2016, 6, 1559. [Google Scholar] [CrossRef] [Green Version]
- Ceustermans, A.; Van Hemelrijck, W.; Van Campenhout, J.; Bylemans, D. Effect of Arbuscular Mycorrhizal Fungi on Pratylenchus penetrans infestation in apple seedlings under greenhouse conditions. Pathogens 2019, 7, 76. [Google Scholar] [CrossRef] [Green Version]
- Verbruggen, E.; van der Heijden, M.G.A.; Weedon, J.T.; Kowalchuk, G.A.; Röling, W.F.M. Community assembly, species richness and nestedness of arbuscular mycorrhizal fungi in agricultural soils. Mol. Ecol. 2012, 21, 2341–2353. [Google Scholar] [CrossRef] [PubMed]
- Taisuke, T.; Kobae, Y. Investigation of indigenous arbuscular mycorrhizal performance using a Lotus japonicus mycorrhizal mutant. Plants 2020, 9, 658. [Google Scholar] [CrossRef]
- Trouvelot, S.; Bonneau, L.; Redecker, D.; van Tuinen, D.; Adrian, M.; Wipf, D. Arbuscular mycorrhiza symbiosis in viticulture: A review. Agron. Sustain. Dev. 2015, 35, 1449–1467. [Google Scholar] [CrossRef] [Green Version]
- Massa, N.; Bona, E.; Novello, G.; Todeschini, V.; Boatti, L.; Mignone, F.; Gamalero, E.; Lingua, G.; Berta, G.; Cesaro, P. AMF communities associated to Vitis vinifera in an Italian vineyard subjected to integrated pest management at two different phenological stages. Sci Rep. 2020, 10, 9197. [Google Scholar] [CrossRef]
- Schreiner, R.P.; Mihara, K. The diversity of arbuscular mycorrhizal fungi amplified from grapevine roots (Vitis vinifera L.) in Oregon vineyards is seasonally stable and influenced by soil and vine age. Mycologia 2009, 101, 599–611. [Google Scholar] [CrossRef] [Green Version]
- Balestrini, R.; Magurno, F.; Walker, C.; Lumini, E.; Bianciotto, V. Cohorts of arbuscular mycorrhizal fungi (AMF) in Vitis vinifera, a typical Mediterranean fruit crop. Environ. Microbiol. Rep. 2010, 2, 594–604. [Google Scholar] [CrossRef] [PubMed]
- López-García, Á.; Jurado-Rivera, J.A.; Bota, J.; Cifre, J.; Baraza, E. Space and Vine Cultivar Interact to Determine the Arbuscular Mycorrhizal Fungal Community Composition. J. Fungi 2020, 6, 317. [Google Scholar] [CrossRef]
- Jones, E.E.; Hammond, S.; Blond, C.; Brown, D.S.; Ridgway, H.J. Interaction between arbuscular mycorrhizal fungi and rootstock cultivar on the susceptibility to infection by Ilyonectria species. Phytopathol. Mediterr. 2014, 53, 582–583. [Google Scholar]
- Holland, T.; Bowen, P.; Kokkoris, V.; Urbez-Torres, J.R.; Hart, M. Does Inoculation with Arbuscular Mycorrhizal Fungi Reduce Trunk Disease in Grapevine Rootstocks? Horticulturae 2019, 5, 61. [Google Scholar] [CrossRef] [Green Version]
- Gianinazzi, S.; Gollotte, A.; Binet, M.N.; van Tuinen, D.; Redecker, D.; Wipf, D. Agroecology: The key role of arbuscular mycorrhizas in ecosystem services. Mycorrhiza 2010, 20, 519–530. [Google Scholar] [CrossRef] [PubMed]
- Turrini, A.; Bedini, A.; Loor, M.B.; Santini, G.; Sbrana, C.; Giovannetti, M.; Avio, L. Local diversity of native arbuscular mycorrhizal symbionts differentially affects growth and nutrition of three crop plant species. Biol. Fertil. Soils 2018, 54, 203–217. [Google Scholar] [CrossRef]
- Hao, Z.; Xie, W.; Chen, B. Arbuscular mycorrhizal symbiosis affects plant immunity to viral infection and accumulation. Viruses 2019, 11, 534. [Google Scholar] [CrossRef] [PubMed] [Green Version]
- Kumar, T.; Majumdar, A.; Das, P.; Sarafis, V.; Ghose, M. Trypan blue as a fluorochrome for confocal laser scanning microscopy of arbuscular mycorrhizae in three mangroves. Biotech. Histochem. 2008, 83, 153–159. [Google Scholar] [CrossRef]
- Binet, M.N.; Marchal, C.; Lipuma, J.; Geremia, R.A.; Bagarri, O.; Candaele, B.; Fraty, D.; David, B.; Perigon, S.; Barbreau, V.; et al. Plant health status effects on arbuscular mycorrhizal fungi associatedwith Lavandulaangustifolia and Lavandula intermedia infected by Phytoplasma in France. Sci. Rep. 2020, 10, 20305. [Google Scholar] [CrossRef]
- Carbone, M.J.; Alaniz, S.; Mondino, P.; Gelabert, M.; Eichmeier, A.; Tekielska, D.; Bujanda, R.; Gramaje, D. Drought Influences Fungal Community Dynamics in the Grapevine Rhizosphere and Root Microbiome. J. Fungi 2021, 7, 686. [Google Scholar] [CrossRef] [PubMed]
- Hart, M.M.; Aleklett, K.; Chagnon, P.; Egan, C.; Ghignone, S.; Helgason, T.; Lekberg, Y.; Öpik, M.; Pickles, B.J.; Waller, L. Navigating the labyrinth: A guide to sequence-based, community ecology of arbuscular mycorrhizal fungi. New Phytol. 2015, 207, 235–247. [Google Scholar] [CrossRef]
- Lekberg, Y.; Vasar, M.; Bullington, L.S.; Sepp, S.K.; Antunes, P.M.; Bunn, R.; Larkin, B.G.; Öpik, M. More bang for the buck? Can arbuscular mycorrhizal fungal communities be characterized adequately alongside other fungi using general fungal primers? New Phytol. 2018, 220, 971–976. [Google Scholar] [CrossRef] [Green Version]
- Pinheiro, L.B.; Coleman, V.A.; Hindson, C.M.; Herrmann, J.; Hindson, B.J.; Bhat, S.; Emslie, K.R. Evaluation of a droplet digital polymerase chain reaction format for DNA copy number quantification. Anal. Chem. 2012, 84, 1003–1011. [Google Scholar] [CrossRef]
- Whale, A.S.; Huggett, J.F.; Cowen, S.; Speirs, V.; Shaw, J.; Ellison, S.; Foy, C.A.; Scott, D.J. Comparison of microfluidic digital PCR and conventional quantitative PCR for measuring copy number variation. Nucleic Acids Res. 2012, 40, e82. [Google Scholar] [CrossRef] [PubMed]
- Hayden, R.T.; Gu, Z.; Ingersoll, J.; Abdul-Ali, D.; Shi, L.; Pounds, S.; Caliendo, A.M. Comparison of droplet digital PCR to real-time PCR for quantitative detection of cytomegalovirus. J. Clin. Microbiol. 2013, 51, 540–546. [Google Scholar] [CrossRef] [PubMed] [Green Version]
- Phillips, J.M.; Hayman, D.A. Improved procedures for clearing roots and staining parasitic and vesicular-arbuscular mycorrhizal fungi for rapid assessment of infection. Trans. Br. Mycol. Soc. 1970, 55, 158–161. [Google Scholar] [CrossRef]
- Trouvelot, A.; Kough, J.L.; Gianinazzi-Pearson, V. Mesure du taux de mycorhization VA d’un système radiculaire. Recherche de méthodes d’estimation ayant une signification fonctionnelle. In Physiological and Genetical Aspects of Mycorrhizae; Gianinazzi-Pearson, V., Gianinazzi, S., Eds.; INRA Press: Paris, France, 1986; pp. 217–221. [Google Scholar] [CrossRef] [Green Version]
- Doyle, J.J.; Doyle, J.L. Isolation of plant DNA from fresh tissue. Focus 1990, 12, 13–15. [Google Scholar] [CrossRef] [Green Version]
- Landi, L.; Murolo, S.; Romanazzi, G. Detection of ‘Candidatus Phytoplasma solani’ in roots from Bois noir symptomatic and recovered grapevines. Sci. Rep. 2019, 9, 2013. [Google Scholar] [CrossRef]
- Romanazzi, G.; Murolo, S.; Pizzichini, L.; Nardi, S. Esca in young and mature vineyards, and molecular diagnosis of the associated fungi. Eur. J. Plant Pathol. 2009, 125, 277–290. [Google Scholar] [CrossRef]
- Toju, H.; Tanabe, A.S.; Yamamoto, S.; Sato, H. High-Coverage ITS Primers for the DNA-based identification of Ascomycetes and Basidiomycetes in environmental samples. PLoS ONE 2012, 7, e40863. [Google Scholar] [CrossRef] [Green Version]
- Bustin, S.; Benes, V.; Garson, J.A.; Hellemans, J.; Huggett, J.; Kubista, M.; Mueller, R.; Nolan, T.; Pfaffl, M.W.; Shipley, G.L.; et al. The MIQE guidelines: Minimum information for publication of quantitative real time PCR experiments. Clin. Chem. 2009, 55, 611–622. [Google Scholar] [CrossRef] [Green Version]
- Huggett, J.F.; Foy, C.A.; Benes, V.; Emslie, K.; Garson, J.A.; Haynes, R. The digital MIQE guidelines: Minimum information for publication of quantitative digital PCR experiments. Clin. Chem. 2013, 59, 892–902. [Google Scholar] [CrossRef]
- Vierheilig, H.; Schweiger, P.; Brundrett, M. An overview of methods for the detection and observation of arbuscular mycorrhizal fungi in roots. Physiol. Plant 2005, 125, 393–404. [Google Scholar] [CrossRef]
- Goh, C.H.; Veliz Vallejos, D.F.; Nicotra, A.B.; Mathesius, U. The impact of beneficial plant-associated microbes on plant phenotypic plasticity. J. Chem. Ecol. 2013, 39, 826–839. [Google Scholar] [CrossRef] [Green Version]
- Nogales, A.; Santos, E.S.; Abreu, M.M.; Arán, D.; Victorino, G.; Pereira, H.S.; Lopes, C.M.; Viegas, V. Mycorrhizal inoculation differentially affects grapevine’s performance in copper contaminated and non-contaminated soils. Front. Plant Sci. 2019, 9, 1906. [Google Scholar] [CrossRef] [Green Version]
- Mathimaran, N.; Ruh, R.; Vullioud, P.; Frossard, E.; Jansa, J. Glomus intraradices dominates arbuscular mycorrhizal communities in a heavy textured agricultural soil. Mycorrhiza 2005, 16, 61–66. [Google Scholar] [CrossRef] [Green Version]
- Racki, N.; Dreo, T.; Gutierrez-Aguirre, I.; Blejec, A.; Ravnikar, M. Reverse transcriptase droplet digital PCR shows high resilience to PCR inhibitors from plant, soil and water samples. Plant Methods 2014, 10, 42. [Google Scholar] [CrossRef]
- Cameron, D.D.; Neal, A.L.; van Wees, S.C.; Ton, J. Mycorrhiza-induced resistance: More than the sum of its parts? Trends Plant Sci. 2013, 18, 539–545. [Google Scholar] [CrossRef] [Green Version]
- De Souza, E.M.; Granada, C.E.; Sperotto, R.A. Plant pathogens affecting the establishment of plant-symbiont interaction. Front. Plant Sci. 2016, 7, 15. [Google Scholar] [CrossRef]
- Berdeni, D.; Cotton, T.E.A.; Daniell, T.J.; Bidartondo, M.I.; Cameron, D.D.; Evans, K.L. The effects of arbuscular mycorrhizal fungal colonisation on nutrient status, growth, productivity, and canker resistance of apple (Malus pumila). Front. Microbiol. 2018, 9, 1461. [Google Scholar] [CrossRef]
- Kobra, N.; Jalil, K.; Youbert, G. Effects of three Glomus species as biocontrol agents against Verticillium-induced wilt in cotton. J. Plant Prot. Res. 2009, 49, 185–189. [Google Scholar] [CrossRef]
- Utkhede, R. Increased growth and yield of hydroponically grown greenhouse tomato plants inoculated with arbuscular mycorrhizal fungi and Fusarium oxysporum f. sp. radicis-lycopersici. Biocontrol 2006, 51, 393–400. [Google Scholar] [CrossRef]
- Ozgonen, H.; Erkilic, A. Growth enhancement and Phytophthora blight (Phytophthora capsici Leonian) control by arbuscular mycorrhizal fungal inoculation in pepper. Crop Prot. 2007, 26, 1682–1688. [Google Scholar] [CrossRef]
- Sipahioglu, M.H.; Demir, S.; Usta, M.; Akkopru, A. Biological relationship of potato virus Y and arbuscular mycorrhizal fangus Glomus intraradices in potato. Pest Technol. 2009, 3, 63–66. [Google Scholar]
- Liu, Y.; Feng, X.; Gao, P.; Li, Y.; Christensen, M.J.; Duan, T. Arbuscular mycorrhiza fungi increased the susceptibility of Astragalus adsugens to powdery mildew caused by Erysiphe pisi. Mycology 2018, 9, 223–232. [Google Scholar] [CrossRef] [PubMed]
- Petit, E.; Gubler, W.D. Influence of Glomus intraradices on black foot disease caused by Cylindrocarpon macrodidymum on Vitis rupestris under controlled conditions. Plant Dis. 2006, 90, 1481–1484. [Google Scholar] [CrossRef] [PubMed] [Green Version]
- Claverie, M.; Notaro, M.; Fontaine, F.; Wery, J. Current knowledge on grapevine trunk diseases with complex etiology: A systemic approach. Phytopathol. Mediterr. 2020, 59, 29–53. [Google Scholar] [CrossRef]
- Morales-Cruz, A.; Allenbeck, G.; Figueroa-Balderas, R.; Ashworth, V.E.; Lawrence, D.P.; Travadon, R.; Smith, R.J.; Baumgartner, K.; Rolshausen, P.E.; Cantu, D. Closed-reference metatranscriptomics enables in planta profiling of putative virulence activities in the grapevine trunk disease complex. Mol. Plant Pathol. 2017, 19, 490–503. [Google Scholar] [CrossRef] [Green Version]
- Alaimo, S.; Marceca, G.P.; Giugno, R.; Ferro, A.; Pulvirenti, A. Current knowledge and computational techniques for grapevine meta-omics analysis. Front. Plant Sci. 2018, 8, 2241. [Google Scholar] [CrossRef] [PubMed] [Green Version]
- Almeida, A.B.; Concas, J.; Campos, M.D.; Materatski, P.; Varanda, C.; Patanita, M.; Murolo, S.; Romanazzi, G.; Félix, M.D.R. Endophytic fungi as potential biological control agents against grapevine trunk diseases in Alentejo Region. Biology 2020, 9, 420. [Google Scholar] [CrossRef]
- Bennett, J.A.; Maherali, H.; Reinhart, K.O.; Lekberg, Y.; Hart, M.M.; Klironomos, J. Plant-soil feedbacks and mycorrhizal type influence temperate forest population dynamics. Science 2017, 355, 181–184. [Google Scholar] [CrossRef]
- Wehner, J.; Antunes, P.M.; Powell, J.R.; Mazukatow, J.; Rillg, M.C. Plant pathogen protection by arbuscular mycorrhizas: A role of fungal diversity? Pedobiologia 2010, 53, 197–201. [Google Scholar] [CrossRef]
- Corradi, N.; Bonfante, P. The arbuscular mycorrhizal symbiosis: Origin and evolution of a beneficial plant infection. PLoS Pathog. 2012, 8, e1002600. [Google Scholar] [CrossRef]
- Zamioudis, C.; Pieterse, C.M. Modulation of host immunity by beneficial microbes. Mol. Plant-Microbe Interact. 2012, 25, 139–150. [Google Scholar] [CrossRef] [Green Version]
- Zhang, Y.-C.; Zou, Y.-N.; Liu, L.-P.; Wu, Q.-S. Common mycorrhizal networks activate salicylic acid defense responses of trifoliate orange (Poncirus trifoliata). J. Integr. Plant Biol. 2019, 61, 1099–1111. [Google Scholar] [CrossRef] [PubMed]
- Badri, D.V.; Vivanco, J.M. Regulation and function of root exudates. Plant Cell Environ. 2009, 32, 666–681. [Google Scholar] [CrossRef] [PubMed]
- Andolfi, A.; Mugnai, L.; Luque, J.; Surico, G.; Cimmino, A.; Evidente, A. Phytotoxins produced by fungi associated with grapevine trunk diseases. Toxins 2011, 3, 1569–1605. [Google Scholar] [CrossRef] [PubMed] [Green Version]
- Norman, J.R.; Hooker, J.E. Sporulation of Phytophthora fragariae shows greater stimulation by exudates of non-mycorrhizal than by mycorrhizal strawberry roots. Mycol. Res. 2000, 104, 1069–1073. [Google Scholar] [CrossRef]
- Ryan, A.; Jones, P. The effect of mycorrhization of potato roots on the hatching chemicals active towards the potato cyst nematodes, Globodera pallida and G. rostochiensis. Nematology 2004, 6, 335–342. [Google Scholar] [CrossRef]
- Singh, P.K.; Mishra, M.; Vyas, D. Effect of root exudates of mycorrhizal tomato plants on microconidia germination of Fusarium oxysporum f. sp. lycopersici. Arch. Phytopathol. Plant Prot. 2010, 43, 1495–1503. [Google Scholar] [CrossRef]
- Rey, T.; Schornack, S. Interactions of beneficial and detrimental root-colonizing filamentous microbes with plant hosts. Genome Biol. 2013, 14, 121. [Google Scholar] [CrossRef]
- Lamichhane, J.R.; Venturi, V. Synergisms between microbial pathogens in disease complexes: A growing trend. Front. Plant Sci. 2015, 6, 385. [Google Scholar] [CrossRef] [Green Version]
- Staddon, P.L.; Fitter, A.H.; Robinson, D. Effects of mycorrhizal colonization and elevate atmospheric carbon dioxide on carbon fixation and below-ground carbon partitioning in Plantago lanceolata. J. Exp. Bot. 1999, 50, 853–860. [Google Scholar] [CrossRef]


| qPCR | ||||
|---|---|---|---|---|
| DNA from Oak Nonhost Plant | ||||
| AMF qPCR Fragments from Grapevine Roots (ng/reaction) + | 0 ng | 5 ng | 50 ng | |
| Cq mean ± SD | ||||
| R. irregularis | 3.5 × 10⁻⁸ | 22.3 ± 0.12 | 22.9 ± 0.2 | na |
| 3.5 × 10⁻⁹ | 25.7 ± 0.16 | 25.9 ± 0.2 | na | |
| 3.5 × 10⁻¹⁰ | 29.4 ± 0.3 | 30.6 ± 0.3 | na | |
| 3.5 × 10⁻¹¹ | 31.6 ± 1.1 * | 32.1 ± 1.7 * | na | |
| F. mosseae | 2.8 × 10⁻⁸ | 23.8 ± 0.12 | 23.8 ± 0.12 | na |
| 2.8 × 10⁻⁹ | 27.4 ± 0.19 | 27.2 ± 0.19 | na | |
| 2.8 × 10⁻¹⁰ | 31.5 ± 0.9 | 32.8 ± 1.3 | na | |
| 2.8 × 10⁻¹¹ | 32.8 ± 1.7 * | 33.6 ± 2.1 * | na | |
| Statistics of standard curve performance, mean ± SD | ||||
| R. irregularis | Slope | 3.155 ± 0.02 | 3.162 ± 0.03 | na |
| Efficiency | 107.1 ± 0.74 | 109.7 ± 0.99 | na | |
| Y-intercept | 1.078 ± 0.04 | 3.97 ± 0.02 | na | |
| Value of fit (R2) | 0.99 ± 0.001 | 0.98 ± 0.002 | na | |
| F. mosseae | Slope | 3.117 ± 0.02 | 3.092 ± 0.02 | na |
| Efficiency | 109.3 ± 0.87 | 111.7 ± 1.01 | na | |
| Y-intercept | 2.723 ± 0.12 | 2.495 ± 0.31 | na | |
| Value of fit (R2) | 0.98 ± 0.001 | 0.99 ± 0.002 | na | |
Publisher’s Note: MDPI stays neutral with regard to jurisdictional claims in published maps and institutional affiliations. |
© 2021 by the authors. Licensee MDPI, Basel, Switzerland. This article is an open access article distributed under the terms and conditions of the Creative Commons Attribution (CC BY) license (https://creativecommons.org/licenses/by/4.0/).
Share and Cite
Landi, L.; Foglia, R.; Murolo, S.; Romanazzi, G. The Mycorrizal Status in Vineyards Affected by Esca. J. Fungi 2021, 7, 869. https://doi.org/10.3390/jof7100869
Landi L, Foglia R, Murolo S, Romanazzi G. The Mycorrizal Status in Vineyards Affected by Esca. Journal of Fungi. 2021; 7(10):869. https://doi.org/10.3390/jof7100869
Chicago/Turabian StyleLandi, Lucia, Renzo Foglia, Sergio Murolo, and Gianfranco Romanazzi. 2021. "The Mycorrizal Status in Vineyards Affected by Esca" Journal of Fungi 7, no. 10: 869. https://doi.org/10.3390/jof7100869