
Machine Learning Methods for Cancer Classification Using Gene Expression Data: A Review

Abstract
:1. Introduction
2. Gene Expression Data
2.1. Microarray Data
2.2. RNA-Seq Data
2.3. RNA-Seq Data Collection
2.4. Gene Expression Datasets
3. Feature Engineering
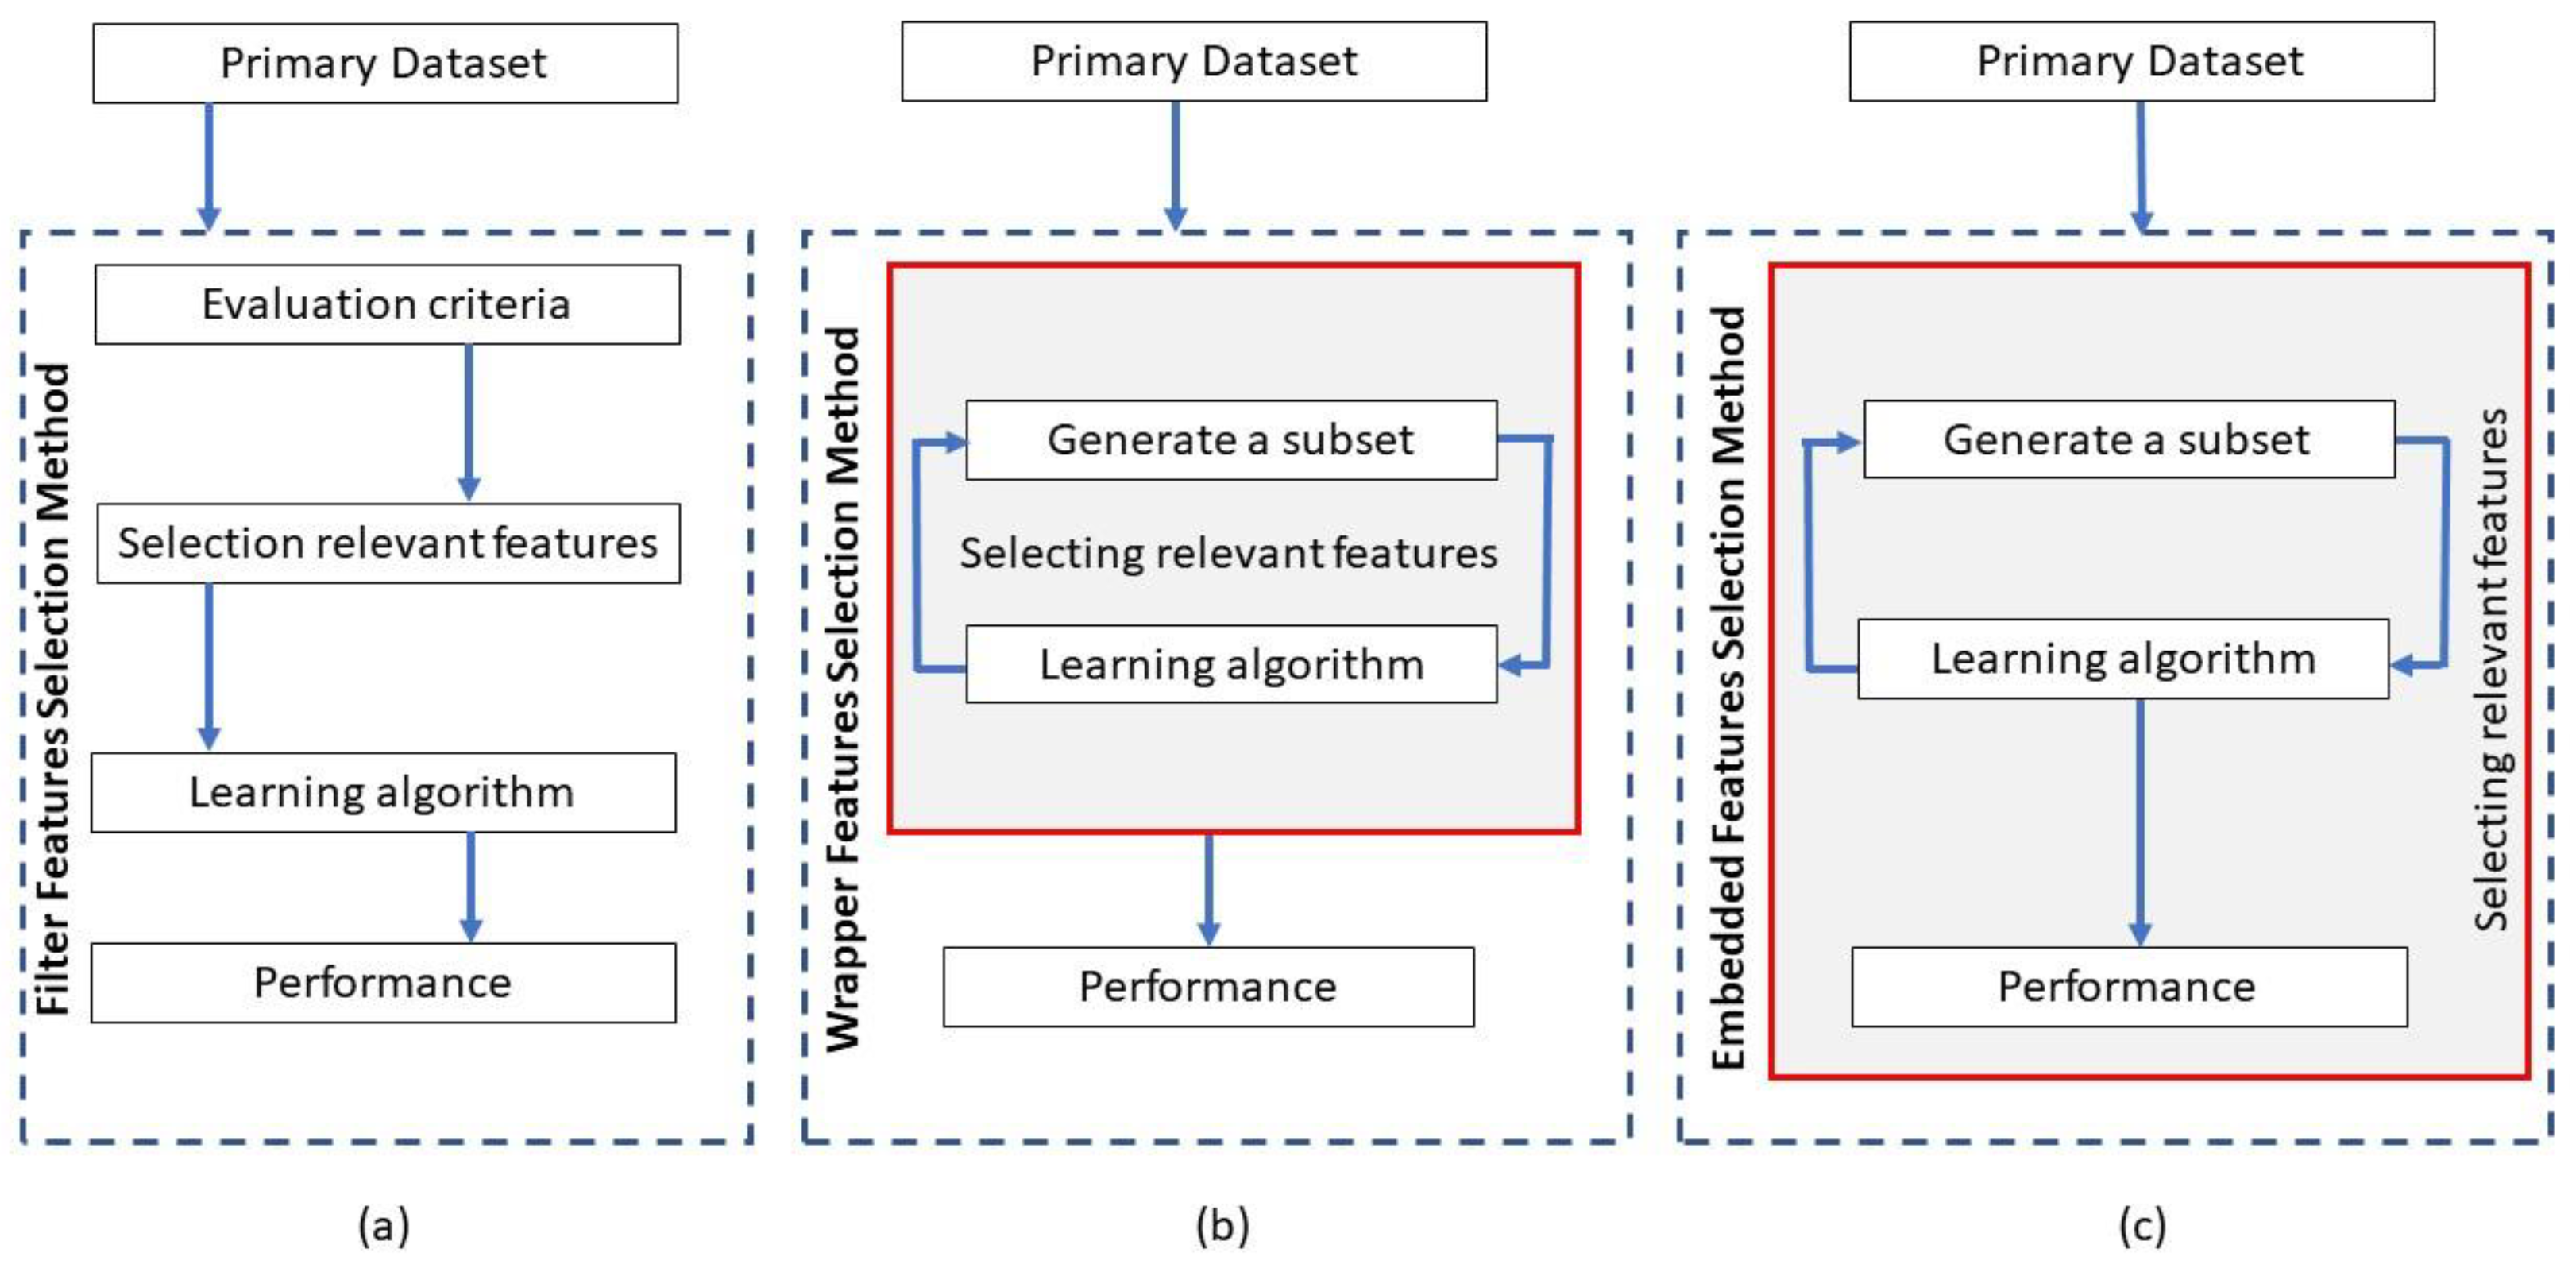
3.1. Filter Methods
3.2. Wrapper Methods
3.3. Embedded Methods
3.4. Hybrid Methods
3.5. Advantages and Disadvantages of Feature Engineering Methods
4. Methods for Gene Expression Analysis
4.1. Traditional Machine Learning Methods
4.2. Deep Learning Methods
4.2.1. Multi-Layer Perceptron (MLP) Neural Networks
4.2.2. Recurrent Neural Networks (RNN)
4.2.3. Convolutional Neural Networks (CNN)
4.2.4. Graph Neural Networks (GNN)
4.2.5. Transformer Neural Networks (TNN)
4.3. Transfer Learning
4.4. Pathway Analysis
5. Future Directions
- One avenue of future research is to consider additional types of input features with existing learning algorithms because the full impact of gene expression cannot be represented by the genetic sequence alone. Specifically, DNA methylations and mutations are possible types of features that can be utilized in cancer classification. DNA methylations can occur at CpG dinucleotides as well as in non-CpG sites. The CpG is used to differentiate between the CG base-pairing of cytosine and guanine from the single-stranded linear sequence. DNA methylation is linked to the normal developmental process and the observable change during the pathological processes. The pathological processes include DNA repair genes and the gene-silencing of tumor suppressors. Therefore, integrating methylations and mutations with RNA-Seq data can produce features that positively impact tumor classification.
- Along with selecting the feature type that can contribute significantly to enhancing the performance of ML methods, the design of the computational algorithm is also essential. In this regard, researchers can focus on innovative techniques that can perform efficiently on gold-standard datasets, such as the unique molecular identifier (UMI), which has experimentally proven reference genes. Such studies can allow researchers to conduct an experimental comparison of single-cell methods. Also, research studies can validate the performance of algorithms on single-cell sequencing protocols such as SMART-Seq, Cel-Seqs, and droplets.
- Identifying cancer-related biomarkers can be an important future direction where researchers can investigate methodologies for identifying biomarkers related to each cancer type. For instance, the methods listed for IntPath [149] and others [150] can help in conducting functional pathway analysis of related genes for the cancer types. Given a 2D image, DL methods can be used to extract promising features from images, which can assist in identifying cancer-specific biomarkers.
- GNN can also be designed to support the integration of single-cell multi-omics data by implementing heterogeneous graphs. Such data can include Droplet scRNA-Seq [151] and the intra-modality of Smart-Seq2. Cell-type-specific gene regulatory mechanisms can be elucidated using scGNN, especially when integrating scATAC-Seq and scRNA-Seq data. Additionally, T cell ancestries can be identified uniquely by the T cell receptor repertoires. The unique identification of T cells is important because it can improve the performance of prediction methods regarding cell–cell interactions. scGNN can facilitate building connections between diverse experiments, sequencing technologies, and data modalities.
- It is also essential to place emphasis on the design of interpretable ML models that help to understand the decision-making process by the employed computational methods, and provide explanations about the cases where the models might fail. Interpretable and explainable models that highlight the local and global properties of ML models based on counterfactuals or feature attribution should receive increased attention in this area.
- Recently, more studies have considered the analogous genomic probing of pre-malignant lesions in the genomic analysis of various cancers, undertaken as part of The Cancer Genome Atlas (TCGA) project. In addition to genomics, cancer prevention strategies in the future will incorporate a variety of new modalities, including imaging, proteomic, metabolomic, glycemic, and epigenetic, to identify and validate surrogate biomarkers for cancer gene prevention trials. In conjunction with preclinical and clinical studies, these modalities can help establish new biomarkers to improve cancer patients’ treatment. Toxicologists, pathologists, and clinicians involved in early-phase clinical studies may be able to use these novel validated biomarkers for diagnosis, treatment, and cancer patient monitoring.
- Multidomain genomic data analysis is another important avenue to study feature selection and extraction, and for downstream analysis. Multimodal and multitask ML methods based on early and late fusion may provide improved performance compared to existing methods.
- Differentiating clinically similar cancers can be challenging, and focusing on genomic and transcriptomic variations may prove beneficial. The omics data describe details on various methods available for ovarian and different types of cancers and renal cell carcinoma for identifying key genes and pathways that might assist in proposing diagnostic and prognostic predictions. Optical genome mapping and structural variant analysis (at a region of DNA, also known as copy number variants, which can contain inversions, balanced translocations, or genomic imbalances) may be applied to various cancer datasets for improved prognosis and treatment [152].
- Further understanding of circRNA localization, transportation, and degradation in live cells, a completed circRNA interactome, and single-cell profiling are important topics in this field that may prove helpful for cancer gene prediction [153].
6. Conclusions
Author Contributions
Funding
Institutional Review Board Statement
Informed Consent Statement
Data Availability Statement
Conflicts of Interest
References
- Miller, K.D.; Ortiz, A.P.; Pinheiro, P.S.; Bandi, P.; Minihan, A.; Fuchs, H.E.; Martinez Tyson, D.; Tortolero-Luna, G.; Fedewa, S.A.; Jemal, A.M.; et al. Cancer Statistics for the US Hispanic/Latino Population, 2021. CA A Cancer J. Clin. 2021, 71, 466–487. [Google Scholar] [CrossRef]
- Munkácsy, G.; Santarpia, L.; Győrffy, B. Gene Expression Profiling in Early Breast Cancer—Patient Stratification Based on Molecular and Tumor Microenvironment Features. Biomedicines 2022, 10, 248. [Google Scholar] [CrossRef]
- Brewczyński, A.; Jabłońska, B.; Mazurek, A.M.; Mrochem-Kwarciak, J.; Mrowiec, S.; Śnietura, M.; Kentnowski, M.; Kołosza, Z.; Składowski, K.; Rutkowski, T. Comparison of Selected Immune and Hematological Parameters and Their Impact on Survival in Patients with HPV-Related and HPV-Unrelated Oropharyngeal Cancer. Cancers 2021, 13, 3256. [Google Scholar] [CrossRef] [PubMed]
- Ahmed, Z.; Mohamed, K.; Zeeshan, S.; Dong, X. Artificial Intelligence with Multi-Functional Machine Learning Platform Development for Better Healthcare and Precision Medicine. Database 2020, 2020, baaa010. [Google Scholar] [CrossRef]
- Anna, A.; Monika, G. Splicing Mutations in Human Genetic Disorders: Examples, Detection, and Confirmation. J. Appl. Genet. 2018, 59, 253–268. [Google Scholar] [CrossRef] [PubMed] [Green Version]
- Slatko, B.E.; Gardner, A.F.; Ausubel, F.M. Overview of Next-Generation Sequencing Technologies. Curr. Protoc. Mol. Biol. 2018, 122, cpmb.59. [Google Scholar] [CrossRef]
- Briglia, N.; Petrozza, A.; Hoeberichts, F.A.; Verhoef, N.; Povero, G. Investigating the Impact of Biostimulants on the Row Crops Corn and Soybean Using High-Efficiency Phenotyping and Next Generation Sequencing. Agronomy 2019, 9, 761. [Google Scholar] [CrossRef] [Green Version]
- Phan, T.; Fay, E.J.; Lee, Z.; Aron, S.; Hu, W.-S.; Langlois, R.A. Segment-Specific Kinetics of MRNA, CRNA, and VRNA Accumulation during Influenza Virus Infection. J. Virol. 2021, 95, e02102-20. [Google Scholar] [CrossRef]
- Monaco, G.; Lee, B.; Xu, W.; Mustafah, S.; Hwang, Y.Y.; Carré, C.; Burdin, N.; Visan, L.; Ceccarelli, M.; Poidinger, M.; et al. RNA-Seq Signatures Normalized by MRNA Abundance Allow Absolute Deconvolution of Human Immune Cell Types. Cell Rep. 2019, 26, 1627–1640.e7. [Google Scholar] [CrossRef] [PubMed] [Green Version]
- Lunshof, J.E.; Bobe, J.; Aach, J.; Angrist, M.; Thakuria, J.V.; Vorhaus, D.B.; Hoehe, M.R.; Church, G.M. Personal Genomes in Progress: From the Human Genome Project to the Personal Genome Project. Dialogues Clin. Neurosci. 2010, 12, 47–60. [Google Scholar] [CrossRef] [PubMed]
- Khan, M.F.; Ghazal, T.M.; Said, R.A.; Fatima, A.; Abbas, S.; Khan, M.A.; Issa, G.F.; Ahmad, M.; Khan, M.A. An IoMT-Enabled Smart Healthcare Model to Monitor Elderly People Using Machine Learning Technique. Comput. Intell. Neurosci. 2021, 2021, 2487759. [Google Scholar] [CrossRef]
- Bhonde, S.B.; Prasad, J.R. Deep Learning Techniques in Cancer Prediction Using Genomic Profiles. In Proceedings of the 2021 6th International Conference for Convergence in Technology (I2CT), Maharashtra, India, 2–4 April 2021; pp. 1–9. [Google Scholar]
- Celesti, F.; Celesti, A.; Wan, J.; Villari, M. Why Deep Learning Is Changing the Way to Approach NGS Data Processing: A Review. IEEE Rev. Biomed. Eng. 2018, 11, 68–76. [Google Scholar] [CrossRef] [PubMed]
- Alomari, O.A.; Khader, A.T.; Al-Betar, M.A.; Alkareem Alyasseri, Z.A. A Hybrid Filter-Wrapper Gene Selection Method for Cancer Classification. In Proceedings of the 2018 2nd International Conference on BioSignal Analysis, Processing and Systems (ICBAPS), Kuching, Malaysia, 24–26 July 2018; pp. 113–118. [Google Scholar]
- Del Amor, R.; Colomer, A.; Monteagudo, C.; Naranjo, V. A Deep Embedded Refined Clustering Approach for Breast Cancer Distinction Based on DNA Methylation. Neural Comput. Applic. 2022, 34, 10243–10255. [Google Scholar] [CrossRef]
- Zhou, J.-R.; You, Z.-H.; Cheng, L.; Ji, B.-Y. Prediction of LncRNA-Disease Associations via an Embedding Learning HOPE in Heterogeneous Information Networks. Mol. Ther. Nucleic Acids 2021, 23, 277–285. [Google Scholar] [CrossRef] [PubMed]
- Ravindran, U.; Gunavathi, C. A Survey on Gene Expression Data Analysis Using Deep Learning Methods for Cancer Diagnosis. Prog. Biophys. Mol. Biol. 2022, S0079610722000803. [Google Scholar] [CrossRef] [PubMed]
- Elbashir, M.K.; Ezz, M.; Mohammed, M.; Saloum, S.S. Lightweight Convolutional Neural Network for Breast Cancer Classification Using RNA-Seq Gene Expression Data. IEEE Access 2019, 7, 185338–185348. [Google Scholar] [CrossRef]
- Monti, M.; Fiorentino, J.; Milanetti, E.; Gosti, G.; Tartaglia, G.G. Prediction of Time Series Gene Expression and Structural Analysis of Gene Regulatory Networks Using Recurrent Neural Networks. Entropy 2022, 24, 141. [Google Scholar] [CrossRef]
- Bar-Joseph, Z.; Gitter, A.; Simon, I. Studying and Modelling Dynamic Biological Processes Using Time-Series Gene Expression Data. Nat. Rev. Genet. 2012, 13, 552–564. [Google Scholar] [CrossRef] [PubMed]
- Lee, H.-J.; Chung, Y.; Chung, K.Y.; Kim, Y.-K.; Lee, J.H.; Koh, Y.J.; Lee, S.H. Use of a Graph Neural Network to the Weighted Gene Co-Expression Network Analysis of Korean Native Cattle. Sci. Rep. 2022, 12, 9854. [Google Scholar] [CrossRef] [PubMed]
- Lee, D.; Yang, J.; Kim, S. Learning the Histone Codes with Large Genomic Windows and Three-Dimensional Chromatin Interactions Using Transformer. Nat. Commun. 2022, 13, 6678. [Google Scholar] [CrossRef]
- Kim, H.E.; Cosa-Linan, A.; Santhanam, N.; Jannesari, M.; Maros, M.E.; Ganslandt, T. Transfer Learning for Medical Image Classification: A Literature Review. BMC Med. Imaging 2022, 22, 69. [Google Scholar] [CrossRef] [PubMed]
- Das, B.; Toraman, S. Deep Transfer Learning for Automated Liver Cancer Gene Recognition Using Spectrogram Images of Digitized DNA Sequences. Biomed. Signal Process. Control 2022, 72, 103317. [Google Scholar] [CrossRef]
- Chereda, H.; Bleckmann, A.; Menck, K.; Perera-Bel, J.; Stegmaier, P.; Auer, F.; Kramer, F.; Leha, A.; Beißbarth, T. Explaining Decisions of Graph Convolutional Neural Networks: Patient-Specific Molecular Subnetworks Responsible for Metastasis Prediction in Breast Cancer. Genome Med. 2021, 13, 42. [Google Scholar] [CrossRef] [PubMed]
- Qiu, L.; Li, H.; Wang, M.; Wang, X. Gated Graph Attention Network for Cancer Prediction. Sensors 2021, 21, 1938. [Google Scholar] [CrossRef] [PubMed]
- Zhang, T.-H.; Hasib, M.M.; Chiu, Y.-C.; Han, Z.-F.; Jin, Y.-F.; Flores, M.; Chen, Y.; Huang, Y. Transformer for Gene Expression Modeling (T-GEM): An Interpretable Deep Learning Model for Gene Expression-Based Phenotype Predictions. Cancers 2022, 14, 4763. [Google Scholar] [CrossRef] [PubMed]
- Osseni, M.A.; Tossou, P.; Laviolette, F.; Corbeil, J. MOT: A Multi-Omics Transformer for Multiclass Classification Tumour Types Predictions. BioRxiv 2022. [Google Scholar] [CrossRef]
- Sathe, S.; Aggarwal, S.; Tang, J. Gene Expression and Protein Function: A Survey of Deep Learning Methods. SIGKDD Explor. Newsl. 2019, 21, 23–38. [Google Scholar] [CrossRef]
- Koumakis, L. Deep Learning Models in Genomics; Are We There Yet? Comput. Struct. Biotechnol. J. 2020, 18, 1466–1473. [Google Scholar] [CrossRef]
- Zhu, W.; Xie, L.; Han, J.; Guo, X. The Application of Deep Learning in Cancer Prognosis Prediction. Cancers 2020, 12, 603. [Google Scholar] [CrossRef] [PubMed] [Green Version]
- Gunavathi, C.; Sivasubramanian, K.; Keerthika, P.; Paramasivam, C. A Review on Convolutional Neural Network Based Deep Learning Methods in Gene Expression Data for Disease Diagnosis. Mater. Today Proc. 2021, 45, 2282–2285. [Google Scholar] [CrossRef]
- Tabares-Soto, R.; Orozco-Arias, S.; Romero-Cano, V.; Segovia Bucheli, V.; Rodríguez-Sotelo, J.L.; Jiménez-Varón, C.F. A Comparative Study of Machine Learning and Deep Learning Algorithms to Classify Cancer Types Based on Microarray Gene Expression Data. PeerJ Comput. Sci. 2020, 6, e270. [Google Scholar] [CrossRef] [PubMed] [Green Version]
- Mazlan, A.U.; Sahabudin, N.A.; Remli, M.A.; Ismail, N.S.N.; Mohamad, M.S.; Nies, H.W.; Abd Warif, N.B. A Review on Recent Progress in Machine Learning and Deep Learning Methods for Cancer Classification on Gene Expression Data. Processes 2021, 9, 1466. [Google Scholar] [CrossRef]
- Karim, M.R.; Beyan, O.; Zappa, A.; Costa, I.G.; Rebholz-Schuhmann, D.; Cochez, M.; Decker, S. Deep Learning-Based Clustering Approaches for Bioinformatics. Brief. Bioinform. 2021, 22, 393–415. [Google Scholar] [CrossRef] [PubMed] [Green Version]
- Thakur, T.; Batra, I.; Luthra, M.; Vimal, S.; Dhiman, G.; Malik, A.; Shabaz, M. Gene Expression-Assisted Cancer Prediction Techniques. J. Healthc. Eng. 2021, 2021, 643–648. [Google Scholar] [CrossRef] [PubMed]
- Montesinos-López, O.A.; Montesinos-López, A.; Pérez-Rodríguez, P.; Barrón-López, J.A.; Martini, J.W.R.; Fajardo-Flores, S.B.; Gaytan-Lugo, L.S.; Santana-Mancilla, P.C.; Crossa, J. A Review of Deep Learning Applications for Genomic Selection. BMC Genom. 2021, 22, 19. [Google Scholar] [CrossRef] [PubMed]
- Bhandari, N.; Walambe, R.; Kotecha, K.; Khare, S.P. A Comprehensive Survey on Computational Learning Methods for Analysis of Gene Expression Data. Front. Mol. Biosci. 2022, 9, 907150. [Google Scholar] [CrossRef] [PubMed]
- Khalsan, M.; Machado, L.R.; Al-Shamery, E.S.; Ajit, S.; Anthony, K.; Mu, M.; Agyeman, M.O. A Survey of Machine Learning Approaches Applied to Gene Expression Analysis for Cancer Prediction. IEEE Access 2022, 10, 27522–27534. [Google Scholar] [CrossRef]
- Alhenawi, E.; Al-Sayyed, R.; Hudaib, A.; Mirjalili, S. Feature Selection Methods on Gene Expression Microarray Data for Cancer Classification: A Systematic Review. Comput. Biol. Med. 2022, 140, 105051. [Google Scholar] [CrossRef] [PubMed]
- Hu, T.; Chitnis, N.; Monos, D.; Dinh, A. Next-Generation Sequencing Technologies: An Overview. Hum. Immunol. 2021, 82, 801–811. [Google Scholar] [CrossRef] [PubMed]
- Jungjit, S.; Michaelis, M.; Freitas, A.A.; Cinatl, J. Extending Multi-Label Feature Selection with KEGG Pathway Information for Microarray Data Analysis. In Proceedings of the 2014 IEEE Conference on Computational Intelligence in Bioinformatics and Computational Biology, Honolulu, HI, USA, 21–24 May 2014; pp. 1–8. [Google Scholar]
- Wang, Y.; Mashock, M.; Tong, Z.; Mu, X.; Chen, H.; Zhou, X.; Zhang, H.; Zhao, G.; Liu, B.; Li, X. Changing Technologies of RNA Sequencing and Their Applications in Clinical Oncology. Front. Oncol. 2020, 10, 447. [Google Scholar] [CrossRef]
- Das, S.; Rai, A.; Merchant, M.L.; Cave, M.C.; Rai, S.N. A Comprehensive Survey of Statistical Approaches for Differential Expression Analysis in Single-Cell RNA Sequencing Studies. Genes 2021, 12, 1947. [Google Scholar] [CrossRef]
- Mohammed, M.; Mwambi, H.; Mboya, I.B.; Elbashir, M.K.; Omolo, B. A Stacking Ensemble Deep Learning Approach to Cancer Type Classification Based on TCGA Data. Sci. Rep. 2021, 11, 15626. [Google Scholar] [CrossRef]
- Li, S.; Xu, X.; Zhang, R.; Huang, Y. Identification of Co-Expression Hub Genes for Ferroptosis in Kidney Renal Clear Cell Carcinoma Based on Weighted Gene Co-Expression Network Analysis and The Cancer Genome Atlas Clinical Data. Sci. Rep. 2022, 12, 4821. [Google Scholar] [CrossRef] [PubMed]
- Zhang, G.; Peng, Z.; Yan, C.; Wang, J.; Luo, J.; Luo, H. A Novel Liver Cancer Diagnosis Method Based on Patient Similarity Network and DenseGCN. Sci. Rep. 2022, 12, 6797. [Google Scholar] [CrossRef]
- Coleto-Alcudia, V.; Vega-Rodríguez, M.A. A Multi-Objective Optimization Approach for the Identification of Cancer Biomarkers from RNA-Seq Data. Expert Syst. Appl. 2022, 193, 116480. [Google Scholar] [CrossRef]
- Abdelwahab, O.; Awad, N.; Elserafy, M.; Badr, E. A Feature Selection-Based Framework to Identify Biomarkers for Cancer Diagnosis: A Focus on Lung Adenocarcinoma. PLoS ONE 2022, 17, e0269126. [Google Scholar] [CrossRef] [PubMed]
- Ke, X.; Wu, H.; Chen, Y.-X.; Guo, Y.; Yao, S.; Guo, M.-R.; Duan, Y.-Y.; Wang, N.-N.; Shi, W.; Wang, C.; et al. Individualized Pathway Activity Algorithm Identifies Oncogenic Pathways in Pan-Cancer Analysis. eBioMedicine 2022, 79, 104014. [Google Scholar] [CrossRef]
- Divate, M.; Tyagi, A.; Richard, D.J.; Prasad, P.A.; Gowda, H.; Nagaraj, S.H. Deep Learning-Based Pan-Cancer Classification Model Reveals Tissue-of-Origin Specific Gene Expression Signatures. Cancers 2022, 14, 1185. [Google Scholar] [CrossRef] [PubMed]
- Houssein, E.H.; Abdelminaam, D.S.; Hassan, H.N.; Al-Sayed, M.M.; Nabil, E. A Hybrid Barnacles Mating Optimizer Algorithm With Support Vector Machines for Gene Selection of Microarray Cancer Classification. IEEE Access 2021, 9, 64895–64905. [Google Scholar] [CrossRef]
- Hira, S.; Bai, A. A Novel Map Reduced Based Parallel Feature Selection and Extreme Learning for Micro Array Cancer Data Classification. Wirel. Pers. Commun. 2022, 123, 1483–1505. [Google Scholar] [CrossRef]
- Vaiyapuri, T.; Liyakathunisa; Alaskar, H.; Aljohani, E.; Shridevi, S.; Hussain, A. Red Fox Optimizer with Data-Science-Enabled Microarray Gene Expression Classification Model. Appl. Sci. 2022, 12, 4172. [Google Scholar] [CrossRef]
- Ke, L.; Li, M.; Wang, L.; Deng, S.; Ye, J.; Yu, X. Improved Swarm-Optimization-Based Filter-Wrapper Gene Selection from Microarray Data for Gene Expression Tumor Classification. Pattern Anal. Applic. 2022. [Google Scholar] [CrossRef]
- Deng, X.; Li, M.; Deng, S.; Wang, L. Hybrid Gene Selection Approach Using XGBoost and Multi-Objective Genetic Algorithm for Cancer Classification. Med. Biol. Eng. Comput. 2022, 60, 663–681. [Google Scholar] [CrossRef] [PubMed]
- Rostami, M.; Forouzandeh, S.; Berahmand, K.; Soltani, M.; Shahsavari, M.; Oussalah, M. Gene Selection for Microarray Data Classification via Multi-Objective Graph Theoretic-Based Method. Artif. Intell. Med. 2022, 123, 102228. [Google Scholar] [CrossRef] [PubMed]
- Xie, W.; Fang, Y.; Yu, K.; Min, X.; Li, W. MFRAG: Multi-Fitness RankAggreg Genetic Algorithm for Biomarker Selection from Microarray Data. Chemom. Intell. Lab. Syst. 2022, 226, 104573. [Google Scholar] [CrossRef]
- Hira, Z.M.; Gillies, D.F. A Review of Feature Selection and Feature Extraction Methods Applied on Microarray Data. Adv. Bioinform. 2015, 2015, 198363. [Google Scholar] [CrossRef]
- Swarna Priya, R.M.; Maddikunta, P.K.R.; Panimala, M.; Koppu, S.; Gadekallu, T.R.; Chowdhary, C.L.; Alazab, M. An Effective Feature Engineering for DNN Using Hybrid PCA-GWO for Intrusion Detection in IoMT Architecture. Comput. Commun. 2020, 160, 139–149. [Google Scholar] [CrossRef]
- Chumerin, N.; Van Hulle, M. Comparison of Two Feature Extraction Methods Based on Maximization of Mutual Information. In Proceedings of the 2006 16th IEEE Signal Processing Society Workshop on Machine Learning for Signal Processing, Maynooth, Ireland, 6–8 September 2006; pp. 343–348. [Google Scholar]
- Tadist, K.; Najah, S.; Nikolov, N.S.; Mrabti, F.; Zahi, A. Feature Selection Methods and Genomic Big Data: A Systematic Review. J. Big Data 2019, 6, 79. [Google Scholar] [CrossRef] [Green Version]
- Khalid, S.; Khalil, T.; Nasreen, S. A Survey of Feature Selection and Feature Extraction Techniques in Machine Learning. In Proceedings of the 2014 Science and Information Conference, London, UK, 27-29 August 2014; IEEE: Piscataway, NJ, USA, 2014; pp. 372–378. [Google Scholar]
- Abd-Elnaby, M.; Alfonse, M.; Roushdy, M. Classification of Breast Cancer Using Microarray Gene Expression Data: A Survey. J. Biomed. Inform. 2021, 117, 103764. [Google Scholar] [CrossRef]
- Park, S.; Shin, B.; Sang Shim, W.; Choi, Y.; Kang, K.; Kang, K. Wx: A Neural Network-Based Feature Selection Algorithm for Transcriptomic Data. Sci. Rep. 2019, 9, 10500. [Google Scholar] [CrossRef]
- García-Díaz, P.; Sánchez-Berriel, I.; Martínez-Rojas, J.A.; Diez-Pascual, A.M. Unsupervised Feature Selection Algorithm for Multiclass Cancer Classification of Gene Expression RNA-Seq Data. Genomics 2020, 112, 1916–1925. [Google Scholar] [CrossRef] [PubMed]
- Wu, J.; Hicks, C. Breast Cancer Type Classification Using Machine Learning. JPM 2021, 11, 61. [Google Scholar] [CrossRef] [PubMed]
- Chen, J.W.; Dhahbi, J. Lung Adenocarcinoma and Lung Squamous Cell Carcinoma Cancer Classification, Biomarker Identification, and Gene Expression Analysis Using Overlapping Feature Selection Methods. Sci. Rep. 2021, 11, 13323. [Google Scholar] [CrossRef]
- Liu, S.; Yao, W. Prediction of Lung Cancer Using Gene Expression and Deep Learning with KL Divergence Gene Selection. BMC Bioinform. 2022, 23, 175. [Google Scholar] [CrossRef] [PubMed]
- Gakii, C.; Mireji, P.O.; Rimiru, R. Graph Based Feature Selection for Reduction of Dimensionality in Next-Generation RNA Sequencing Datasets. Algorithms 2022, 15, 21. [Google Scholar] [CrossRef]
- Mahin, K.F.; Robiuddin, M.; Islam, M.; Ashraf, S.; Yeasmin, F.; Shatabda, S. PanClassif: Improving Pan Cancer Classification of Single Cell RNA-Seq Gene Expression Data Using Machine Learning. Genomics 2022, 114, 110264. [Google Scholar] [CrossRef]
- Li, Y.; Kang, K.; Krahn, J.M.; Croutwater, N.; Lee, K.; Umbach, D.M.; Li, L. A Comprehensive Genomic Pan-Cancer Classification Using The Cancer Genome Atlas Gene Expression Data. BMC Genom. 2017, 18, 508. [Google Scholar] [CrossRef] [PubMed]
- Zhang, Y.; Deng, Q.; Liang, W.; Zou, X. An Efficient Feature Selection Strategy Based on Multiple Support Vector Machine Technology with Gene Expression Data. BioMed Res. Int. 2018, 2018, 7538204. [Google Scholar] [CrossRef] [PubMed]
- Simsek, N.Y.; Haznedar, B.; Kuzudisli, C. A Comparative Study of Different Classification Algorithms on RNA-Seq Cancer Data. GJPAAS 2020, 12, 24–35. [Google Scholar] [CrossRef]
- Al-Obeidat, F.; Rocha, Á.; Akram, M.; Razzaq, S.; Maqbool, F. (CDRGI)-Cancer Detection through Relevant Genes Identification. Neural Comput Applic 2022, 34, 8447–8454. [Google Scholar] [CrossRef]
- Liu, H.-P.; Wang, D.; Lai, H.-M. Can We Infer Tumor Presence of Single Cell Transcriptomes and Their Tumor of Origin from Bulk Transcriptomes by Machine Learning? Comput. Struct. Biotechnol. J. 2022, 20, 2672–2679. [Google Scholar] [CrossRef] [PubMed]
- Al Abir, F.; Shovan, S.M.; Hasan, M.A.M.; Sayeed, A.; Shin, J. Biomarker Identification by Reversing the Learning Mechanism of an Autoencoder and Recursive Feature Elimination. Mol. Omics 2022, 18, 652–661. [Google Scholar] [CrossRef] [PubMed]
- Kong, Y.; Yu, T. A Graph-Embedded Deep Feedforward Network for Disease Outcome Classification and Feature Selection Using Gene Expression Data. Bioinformatics 2018, 34, 3727–3737. [Google Scholar] [CrossRef] [PubMed] [Green Version]
- Jiang, L.; Greenwood, C.M.T.; Yao, W.; Li, L. Bayesian Hyper-LASSO Classification for Feature Selection with Application to Endometrial Cancer RNA-Seq Data. Sci. Rep. 2020, 10, 9747. [Google Scholar] [CrossRef] [PubMed]
- Zhang, Z.; Liu, Z.-P. Robust Biomarker Discovery for Hepatocellular Carcinoma from High-Throughput Data by Multiple Feature Selection Methods. BMC Med. Genom. 2021, 14, 112. [Google Scholar] [CrossRef] [PubMed]
- Arowolo, M.O.; Adebiyi, M.O.; Aremu, C.; Adebiyi, A.A. A Survey of Dimension Reduction and Classification Methods for RNA-Seq Data on Malaria Vector. J. Big Data 2021, 8, 50. [Google Scholar] [CrossRef]
- Liu, S.; Xu, C.; Zhang, Y.; Liu, J.; Yu, B.; Liu, X.; Dehmer, M. Feature Selection of Gene Expression Data for Cancer Classification Using Double RBF-Kernels. BMC Bioinform. 2018, 19, 396. [Google Scholar] [CrossRef] [Green Version]
- Garrido-Castro, A.C.; Lin, N.U.; Polyak, K. Insights into Molecular Classifications of Triple-Negative Breast Cancer: Improving Patient Selection for Treatment. Cancer Discov. 2019, 9, 176–198. [Google Scholar] [CrossRef] [PubMed] [Green Version]
- Chabon, J.J.; Hamilton, E.G.; Kurtz, D.M.; Esfahani, M.S.; Moding, E.J.; Stehr, H.; Schroers-Martin, J.; Nabet, B.Y.; Chen, B.; Chaudhuri, A.A.; et al. Integrating Genomic Features for Non-Invasive Early Lung Cancer Detection. Nature 2020, 580, 245–251. [Google Scholar] [CrossRef]
- Crosby, D.; Bhatia, S.; Brindle, K.M.; Coussens, L.M.; Dive, C.; Emberton, M.; Esener, S.; Fitzgerald, R.C.; Gambhir, S.S.; Kuhn, P.; et al. Early Detection of Cancer. Science 2022, 375, eaay9040. [Google Scholar] [CrossRef]
- Segal, N.H.; Pavlidis, P.; Noble, W.S.; Antonescu, C.R.; Viale, A.; Wesley, U.V.; Busam, K.; Gallardo, H.; DeSantis, D.; Brennan, M.F.; et al. Classification of Clear-Cell Sarcoma as a Subtype of Melanoma by Genomic Profiling. JCO 2003, 21, 1775–1781. [Google Scholar] [CrossRef] [PubMed]
- Ram, M.; Najafi, A.; Shakeri, M.T. Classification and Biomarker Genes Selection for Cancer Gene Expression Data Using Random Forest. Iran J. Pathol. 2017, 12, 339–347. [Google Scholar] [CrossRef] [PubMed]
- Hijazi, H.; Chan, C. A Classification Framework Applied to Cancer Gene Expression Profiles. J. Healthc. Eng. 2013, 4, 255–284. [Google Scholar] [CrossRef] [Green Version]
- Yuan, L.; Sun, Y.; Huang, G. Using Class-Specific Feature Selection for Cancer Detection with Gene Expression Profile Data of Platelets. Sensors 2020, 20, 1528. [Google Scholar] [CrossRef] [Green Version]
- Yuan, F.; Lu, L.; Zou, Q. Analysis of Gene Expression Profiles of Lung Cancer Subtypes with Machine Learning Algorithms. Biochim. Et Biophys. Acta BBA Mol. Basis Dis. 2020, 1866, 165822. [Google Scholar] [CrossRef] [PubMed]
- Abdulqader, D.M.; Abdulazeez, A.M.; Zeebaree, D.Q. Machine Learning Supervised Algorithms of Gene Selection: A Review. Mach. Learn. 2020, 62, 233–244. [Google Scholar]
- Perdomo-Ortiz, A.; Benedetti, M.; Realpe-Gómez, J.; Biswas, R. Opportunities and Challenges for Quantum-Assisted Machine Learning in near-Term Quantum Computers. Quantum Sci. Technol. 2018, 3, 030502. [Google Scholar] [CrossRef] [Green Version]
- Korbar, B.; Olofson, A.M.; Miraflor, A.P.; Nicka, C.M.; Suriawinata, M.A.; Torresani, L.; Suriawinata, A.A.; Hassanpour, S. Deep Learning for Classification of Colorectal Polyps on Whole-Slide Images. J. Pathol. Inform. 2017, 8, 30. [Google Scholar] [CrossRef] [PubMed]
- Lai, Y.-H.; Chen, W.-N.; Hsu, T.-C.; Lin, C.; Tsao, Y.; Wu, S. Overall Survival Prediction of Non-Small Cell Lung Cancer by Integrating Microarray and Clinical Data with Deep Learning. Sci. Rep. 2020, 10, 4679. [Google Scholar] [CrossRef] [Green Version]
- Zhang, D.; Zou, L.; Zhou, X.; He, F. Integrating Feature Selection and Feature Extraction Methods With Deep Learning to Predict Clinical Outcome of Breast Cancer. IEEE Access 2018, 6, 28936–28944. [Google Scholar] [CrossRef]
- Gao, F.; Wang, W.; Tan, M.; Zhu, L.; Zhang, Y.; Fessler, E.; Vermeulen, L.; Wang, X. DeepCC: A Novel Deep Learning-Based Framework for Cancer Molecular Subtype Classification. Oncogenesis 2019, 8, 44. [Google Scholar] [CrossRef] [PubMed]
- Chandrasekar, V.; Sureshkumar, V.; Kumar, T.S.; Shanmugapriya, S. Disease Prediction Based on Micro Array Classification Using Deep Learning Techniques. Microprocess. Microsyst. 2020, 77, 103189. [Google Scholar] [CrossRef]
- Laplante, J.-F.; Akhloufi, M.A. Predicting Cancer Types From MiRNA Stem-Loops Using Deep Learning. In Proceedings of the 2020 42nd Annual International Conference of the IEEE Engineering in Medicine & Biology Society (EMBC), Montreal, QC, Canada, 20–24 July 2020; pp. 5312–5315. [Google Scholar]
- Talatian Azad, S.; Ahmadi, G.; Rezaeipanah, A. An Intelligent Ensemble Classification Method Based on Multi-Layer Perceptron Neural Network and Evolutionary Algorithms for Breast Cancer Diagnosis. J. Exp. Theor. Artif. Intell. 2022, 34, 949–969. [Google Scholar] [CrossRef]
- Alshareef, A.M.; Alsini, R.; Alsieni, M.; Alrowais, F.; Marzouk, R.; Abunadi, I.; Nemri, N. Optimal Deep Learning Enabled Prostate Cancer Detection Using Microarray Gene Expression. J. Healthc. Eng. 2022, 2022, 1–12. [Google Scholar] [CrossRef]
- Yin, X.-X.; Hadjiloucas, S.; Zhang, Y.; Tian, Z. MRI Radiogenomics for Intelligent Diagnosis of Breast Tumors and Accurate Prediction of Neoadjuvant Chemotherapy Responses-a Review. Comput. Methods Programs Biomed. 2022, 214, 106510. [Google Scholar] [CrossRef]
- Nguyen, T.M.; Kim, N.; Kim, D.H.; Le, H.L.; Piran, M.J.; Um, S.-J.; Kim, J.H. Deep Learning for Human Disease Detection, Subtype Classification, and Treatment Response Prediction Using Epigenomic Data. Biomedicines 2021, 9, 1733. [Google Scholar] [CrossRef] [PubMed]
- Sahin, C.B.; Diri, B. Robust Feature Selection With LSTM Recurrent Neural Networks for Artificial Immune Recognition System. IEEE Access 2019, 7, 24165–24178. [Google Scholar] [CrossRef]
- Aher, C.N.; Jena, A.K. Rider-Chicken Optimization Dependent Recurrent Neural Network for Cancer Detection and Classification Using Gene Expression Data. Comput. Methods Biomech. Biomed. Eng. Imaging Vis. 2021, 9, 174–191. [Google Scholar] [CrossRef]
- Majji, R.; Nalinipriya, G.; Vidyadhari, C.; Cristin, R. Jaya Ant Lion Optimization-Driven Deep Recurrent Neural Network for Cancer Classification Using Gene Expression Data. Med. Biol. Eng. Comput. 2021, 59, 1005–1021. [Google Scholar] [CrossRef] [PubMed]
- Suresh, A.; Nair, R.R.; Neeba, E.A.; Kumar, S.A.P. RETRACTED ARTICLE: Recurrent Neural Network for Genome Sequencing for Personalized Cancer Treatment in Precision Healthcare. Neural Process Lett. 2021. [Google Scholar] [CrossRef]
- Karimi Jafarbigloo, S.; Danyali, H. Nuclear Atypia Grading in Breast Cancer Histopathological Images Based on CNN Feature Extraction and LSTM Classification. CAAI Trans Intel Tech 2021, 6, 426–439. [Google Scholar] [CrossRef]
- Batur ŞahiN, C.; DiRi, B. Sequential Feature Maps with LSTM Recurrent Neural Networks for Robust Tumor Classification. Balk. J. Electr. Comput. Eng. 2020, 9, 23–32. [Google Scholar] [CrossRef]
- Siddalingappa, R.; Sekar, K. Bi-Directional Long Short Term Memory Using Recurrent Neural Network for Biological Entity Recognition. IJ-AI 2022, 11, 89. [Google Scholar] [CrossRef]
- Jiang, L.; Sun, X.; Mercaldo, F.; Santone, A. DECAB-LSTM: Deep Contextualized Attentional Bidirectional LSTM for Cancer Hallmark Classification. Knowl. -Based Syst. 2020, 210, 106486. [Google Scholar] [CrossRef]
- Zhao, Y.; Joshi, P.; Shin, D.-G. Recurrent Neural Network for Gene Regulation Network Construction on Time Series Expression Data. In Proceedings of the 2019 IEEE International Conference on Bioinformatics and Biomedicine (BIBM), San Diego, CA, USA, 18–21 November 2019; pp. 610–615. [Google Scholar]
- Liu, L.; Liu, J. Reconstructing Gene Regulatory Networks via Memetic Algorithm and LASSO Based on Recurrent Neural Networks. Soft. Comput. 2020, 24, 4205–4221. [Google Scholar] [CrossRef]
- Chowdhury, S.; Dong, X.; Li, X. Recurrent Neural Network Based Feature Selection for High Dimensional and Low Sample Size Micro-Array Data. In Proceedings of the 2019 IEEE International Conference on Big Data (Big Data), Los Angeles, CA, USA, 9–12 December 2019; pp. 4823–4828. [Google Scholar]
- Altschul, S. Gapped BLAST and PSI-BLAST: A New Generation of Protein Database Search Programs. Nucleic Acids Res. 1997, 25, 3389–3402. [Google Scholar] [CrossRef] [Green Version]
- Ghorbani, M.; Jonckheere, E.A.; Bogdan, P. Gene Expression Is Not Random: Scaling, Long-Range Cross-Dependence, and Fractal Characteristics of Gene Regulatory Networks. Front. Physiol. 2018, 9, 1446. [Google Scholar] [CrossRef] [Green Version]
- Nguyen, P.T.; Nguyen, T.T.; Nguyen, N.C.; Le, T.T. Multiclass Breast Cancer Classification Using Convolutional Neural Network. In Proceedings of the 2019 International Symposium on Electrical and Electronics Engineering (ISEE), Ho Chi Minh, Vietnam, 10–12 October 2019; pp. 130–134. [Google Scholar]
- Xiao, Y.; Wu, J.; Lin, Z.; Zhao, X. A Deep Learning-Based Multi-Model Ensemble Method for Cancer Prediction. Comput. Methods Programs Biomed. 2018, 153, 1–9. [Google Scholar] [CrossRef]
- Lyu, B.; Haque, A. Deep Learning Based Tumor Type Classification Using Gene Expression Data. In Proceedings of the 2018 ACM International Conference on Bioinformatics, Computational Biology, and Health Informatics, Washington DC USA, 29 August–1 September 2018; pp. 89–96. [Google Scholar]
- Mostavi, M.; Chiu, Y.-C.; Huang, Y.; Chen, Y. Convolutional Neural Network Models for Cancer Type Prediction Based on Gene Expression. BMC Med. Genom. 2020, 13, 44. [Google Scholar] [CrossRef]
- López-García, G.; Jerez, J.M.; Franco, L.; Veredas, F.J. Transfer Learning with Convolutional Neural Networks for Cancer Survival Prediction Using Gene-Expression Data. PLoS ONE 2020, 15, e0230536. [Google Scholar] [CrossRef]
- Wang, S.; Chen, Y.; Chen, S.; Zhong, Q.; Zhang, K. Hierarchical Dynamic Convolutional Neural Network for Laryngeal Disease Classification. Sci. Rep. 2022, 12, 13914. [Google Scholar] [CrossRef]
- de Guia, J.M.; Devaraj, M.; Leung, C.K. DeepGx: Deep Learning Using Gene Expression for Cancer Classification. In Proceedings of the 2019 IEEE/ACM International Conference on Advances in Social Networks Analysis and Mining, Vancouver, BC, Canada, 27–30 August 27 2019; pp. 913–920. [Google Scholar]
- Khalifa, N.E.M.; Taha, M.H.N.; Ezzat Ali, D.; Slowik, A.; Hassanien, A.E. Artificial Intelligence Technique for Gene Expression by Tumor RNA-Seq Data: A Novel Optimized Deep Learning Approach. IEEE Access 2020, 8, 22874–22883. [Google Scholar] [CrossRef]
- Wang, Y.; Wang, Y.G.; Hu, C.; Li, M.; Fan, Y.; Otter, N.; Sam, I.; Gou, H.; Hu, Y.; Kwok, T.; et al. Cell Graph Neural Networks Enable the Digital Staging of Tumor Microenvironment and Precise Prediction of Patient Survival in Gastric Cancer. MedRxiv 2021. [Google Scholar] [CrossRef]
- Azadifar, S.; Rostami, M.; Berahmand, K.; Moradi, P.; Oussalah, M. Graph-Based Relevancy-Redundancy Gene Selection Method for Cancer Diagnosis. Comput. Biol. Med. 2022, 147, 105766. [Google Scholar] [CrossRef] [PubMed]
- Pfeifer, B.; Saranti, A.; Holzinger, A. GNN-SubNet: Disease Subnetwork Detection with Explainable Graph Neural Networks. Bioinformatics 2022, 38, ii120–ii126. [Google Scholar] [CrossRef] [PubMed]
- Ramirez, R.; Chiu, Y.-C.; Zhang, S.; Ramirez, J.; Chen, Y.; Huang, Y.; Jin, Y.-F. Prediction and Interpretation of Cancer Survival Using Graph Convolution Neural Networks. Methods 2021, 192, 120–130. [Google Scholar] [CrossRef]
- Zhou, Y.; Graham, S.; Alemi Koohbanani, N.; Shaban, M.; Heng, P.-A.; Rajpoot, N. CGC-Net: Cell Graph Convolutional Network for Grading of Colorectal Cancer Histology Images. In Proceedings of the 2019 IEEE/CVF International Conference on Computer Vision Workshop (ICCVW), Seoul, South Korea, 27–28 October 2019; pp. 388–398. [Google Scholar]
- Rajasekharan, H.; Chivilkar, S.; Bramhankar, N.; Sharma, T.; Daruwala, R. EEG-Based Mental Workload Assessment Using a Graph Attention Network. In Proceedings of the 2021 IEEE 20th International Conference on Cognitive Informatics & Cognitive Computing (ICCI*CC), Banff, AB, Canada, 29–31 October 2021; pp. 78–84. [Google Scholar]
- Xiang, M.; Hou, J.; Luo, W.; Tao, W.; Wang, D. Impute Gene Expression Missing Values via Biological Networks: Optimal Fusion of Data and Knowledge. In Proceedings of the 2021 International Joint Conference on Neural Networks (IJCNN), Shenzhen, China, 18–22 July 2021; pp. 1–8. [Google Scholar]
- Wang, J.; Ma, A.; Ma, Q.; Xu, D.; Joshi, T. Inductive Inference of Gene Regulatory Network Using Supervised and Semi-Supervised Graph Neural Networks. Comput. Struct. Biotechnol. J. 2020, 18, 3335–3343. [Google Scholar] [CrossRef]
- Zhang, X.-M.; Liang, L.; Liu, L.; Tang, M.-J. Graph Neural Networks and Their Current Applications in Bioinformatics. Front. Genet. 2021, 12, 690049. [Google Scholar] [CrossRef]
- Xu, Q.; Zhu, L.; Dai, T.; Yan, C. Aspect-Based Sentiment Classification with Multi-Attention Network. Neurocomputing 2020, 388, 135–143. [Google Scholar] [CrossRef]
- Lv, Z.; Lin, Y.; Yan, R.; Yang, Z.; Wang, Y.; Zhang, F. PG-TFNet: Transformer-Based Fusion Network Integrating Pathological Images and Genomic Data for Cancer Survival Analysis. In Proceedings of the 2021 IEEE International Conference on Bioinformatics and Biomedicine (BIBM), Houston, TX, USA, 9–12 December 2021; pp. 491–496. [Google Scholar]
- Wensel, J.; Ullah, H.; Munir, A. ViT-ReT: Vision and Recurrent Transformer Neural Networks for Human Activity Recognition in Videos. ArXiv 2022, arXiv:2208.07929. [Google Scholar]
- Dirgová Luptáková, I.; Kubovčík, M.; Pospíchal, J. Wearable Sensor-Based Human Activity Recognition with Transformer Model. Sensors 2022, 22, 1911. [Google Scholar] [CrossRef]
- Aljuaid, H.; Alturki, N.; Alsubaie, N.; Cavallaro, L.; Liotta, A. Computer-Aided Diagnosis for Breast Cancer Classification Using Deep Neural Networks and Transfer Learning. Comput. Methods Programs Biomed. 2022, 223, 106951. [Google Scholar] [CrossRef] [PubMed]
- Kakati, T.; Bhattacharyya, D.K.; Kalita, J.K.; Norden-Krichmar, T.M. DEGnext: Classification of Differentially Expressed Genes from RNA-Seq Data Using a Convolutional Neural Network with Transfer Learning. BMC Bioinform. 2022, 23, 17. [Google Scholar] [CrossRef] [PubMed]
- Zhang, Y.; Chen, J.-H.; Lin, Y.; Chan, S.; Zhou, J.; Chow, D.; Chang, P.; Kwong, T.; Yeh, D.-C.; Wang, X.; et al. Prediction of Breast Cancer Molecular Subtypes on DCE-MRI Using Convolutional Neural Network with Transfer Learning between Two Centers. Eur Radiol 2021, 31, 2559–2567. [Google Scholar] [CrossRef]
- Kandaswamy, C.; Silva, L.M.; Alexandre, L.A.; Santos, J.M. High-Content Analysis of Breast Cancer Using Single-Cell Deep Transfer Learning. SLAS Discov. 2016, 21, 252–259. [Google Scholar] [CrossRef] [Green Version]
- Sevakula, R.K.; Singh, V.; Verma, N.K.; Kumar, C.; Cui, Y. Transfer Learning for Molecular Cancer Classification Using Deep Neural Networks. IEEE/ACM Trans. Comput. Biol. Bioinf. 2019, 16, 2089–2100. [Google Scholar] [CrossRef] [PubMed]
- Maudsley, S.; Chadwick, W.; Wang, L.; Zhou, Y.; Martin, B.; Park, S.-S. Bioinformatic Approaches to Metabolic Pathways Analysis. In Signal Transduction Protocols; Luttrell, L.M., Ferguson, S.S.G., Eds.; Methods in Molecular Biology; Humana Press: Totowa, NJ, USA, 2011; Volume 756, pp. 99–130. ISBN 978-1-61779-159-8. [Google Scholar]
- Dalamaga, M. Obesity, Insulin Resistance, Adipocytokines and Breast Cancer: New Biomarkers and Attractive Therapeutic Targets. WJEM 2013, 3, 34. [Google Scholar] [CrossRef] [PubMed]
- Ho, C.-H.; Huang, Y.-J.; Lai, Y.-J.; Mukherjee, R.; Hsiao, C.K. The Misuse of Distributional Assumptions in Functional Class Scoring Gene-Set and Pathway Analysis. G3 Genes Genomes Genet. 2022, 12, jkab365. [Google Scholar] [CrossRef]
- Joshi, P.; Basso, B.; Wang, H.; Hong, S.-H.; Giardina, C.; Shin, D.-G. RPAC: Route Based Pathway Analysis for Cohorts of Gene Expression Data Sets. Methods 2022, 198, 76–87. [Google Scholar] [CrossRef]
- Ma, J.; Shojaie, A.; Michailidis, G. A Comparative Study of Topology-Based Pathway Enrichment Analysis Methods. BMC Bioinform. 2019, 20, 546. [Google Scholar] [CrossRef] [Green Version]
- Bauer-Mehren, A.; Furlong, L.I.; Sanz, F. Pathway Databases and Tools for Their Exploitation: Benefits, Current Limitations and Challenges. Mol. Syst. Biol. 2009, 5, 290. [Google Scholar] [CrossRef] [PubMed]
- Joshi-Tope, G. Reactome: A Knowledgebase of Biological Pathways. Nucleic Acids Res. 2004, 33, D428–D432. [Google Scholar] [CrossRef] [PubMed]
- Zhou, H.; Jin, J.; Zhang, H.; Yi, B.; Wozniak, M.; Wong, L. IntPath--an Integrated Pathway Gene Relationship Database for Model Organisms and Important Pathogens. BMC Syst. Biol. 2012, 6, S2. [Google Scholar] [CrossRef] [PubMed] [Green Version]
- Huang, D.W.; Sherman, B.T.; Tan, Q.; Kir, J.; Liu, D.; Bryant, D.; Guo, Y.; Stephens, R.; Baseler, M.W.; Lane, H.C.; et al. DAVID Bioinformatics Resources: Expanded Annotation Database and Novel Algorithms to Better Extract Biology from Large Gene Lists. Nucleic Acids Res. 2007, 35, W169–W175. [Google Scholar] [CrossRef] [Green Version]
- Wang, J.; Ma, A.; Chang, Y.; Gong, J.; Jiang, Y.; Qi, R.; Wang, C.; Fu, H.; Ma, Q.; Xu, D. ScGNN Is a Novel Graph Neural Network Framework for Single-Cell RNA-Seq Analyses. Nat. Commun. 2021, 12, 1882. [Google Scholar] [CrossRef]
- Arga, K.Y.; Sinha, R. Recent Developments in Cancer Systems Biology: Lessons Learned and Future Directions. JPM 2021, 11, 271. [Google Scholar] [CrossRef]
- Patop, I.L.; Wüst, S.; Kadener, S. Past, Present, and Future of Circ RNA s. EMBO J. 2019, 38, 2018100836. [Google Scholar] [CrossRef] [PubMed]


| Reference | Conventional ML Approaches | Feature Engineering | DL Approaches | Microarray Data | RNA-Seq Data |
|---|---|---|---|---|---|
| Sathe et al., 2019 [29] | No | No | RNN and CNN | Yes | Yes |
| Koumakis et al., 2020 [30] | No | No | RNN and CNN | Yes | Yes |
| Zhu et al., 2020 [31] | No | No | MLPNN, RNN, and CNN | Yes | Yes |
| Gunavathi et al., 2020 [32] | No | No | CNN | Yes | Yes |
| Tabares et al., 2020 [33] | Yes | No | MLP and CNN | Yes | No |
| Bhonde et al., 2021 [12] | No | No | MLPNN, RNN, and CNN | Yes | Yes |
| Mazlan et al., 2021 [34] | Yes | Yes | CNN | Yes | Yes |
| Karim et al., 2021 [35] | Yes | Yes | MLPNN, RNN, and CNN | Yes | Yes |
| Thakur et al., 2021 [36] | Yes | No | CNN | Yes | Yes |
| Montesinos-López et al., 2021 [37] | No | No | MLPNN, RNN, and CNN | Yes | Yes |
| Bhandari et al., 2022 [38] | Yes | Yes | MLPNN, RNN, and CNN | Yes | No |
| Khalsan et al., 2022 [39] | Yes | No | MLPNN, RNN, and CNN | Yes | Yes |
| Alhenawi et al., 2022 [40] | No | Yes | No | Yes | No |
| Characteristics | Microarray Data | RNA-Seq Data |
|---|---|---|
| Gene Discovery | No | Yes |
| Different Isoform | No | Yes |
| High Resolution | No | Yes |
| Background Noise | Yes | No |
| High Cost | Yes | No |
| Rare/New Transcript | No | Yes |
| Noncoding RNA | No | Yes |
| Reference | Classification Task | Type of Cancer and Data Source | Number of Samples | Type of Data |
|---|---|---|---|---|
| Mohammed et al., 2021 [45] | Multiclass Classification (5 types of cancers) | Breast Cancer (BRCA), Colon adenocarcinoma (COAD), Lung adenocarcinoma (LUAD), Ovarian (OV), and Thyroid Cancer (THCA) from Pan-Cancer Atlas | 2166 | RNA-Seq |
| Li et al., 2022 [46] | Binary Classification | Kidney Renal clear cell carcinoma (KIRC) from The Cancer Genome Atlas (TCGA) | 945 | RNA-Seq |
| Zhang et al., 2022 [47] | Binary Classification | Liver Hepatocellular Carcinoma (LIHC) from The Cancer Genome Atlas (TCGA) | 424 | RNA-Seq |
| Coleto-Alcudia et al., 2022 [48] | Binary Classification | Breast Cancer (BC) from The Cancer Genome Atlas (TCGA) | 1178 | RNA-Seq |
| Abdelwahab et al., 2022 [49] | Binary Classification | Lung Adenocarcinoma (LUAD) from The Cancer Genome Atlas (TCGA) | 549 | RNA-Seq |
| Ke et al., 2022 [50] | Multiclass Classification (33 types of cancers) | 33 Types of Cancer from The Cancer Genome Atlas (TCGA) | 10,528 | RNA-Seq |
| Divate et al., 2022 [51] | Multiclass Classification (39 types of cancers) | 39 Types of Cancer from The Cancer Genome Atlas (TCGA) | 14,237 | RNA-Seq |
| Houssein et al., 2021 [52] | Binary Classification | Leukemia from the GEO (Gene Expression Omnibus) | 72 | Microarray |
| Hira et al., 2021 [53] | Multiclass Classification (18 types of cancers) | 18 Types of Cancer from GEO (Gene Expression Omnibus) | 2096 | Microarray |
| Vaiyapuri et al., 2022 [54] | Binary Classification | Ovarian Cancer from the GEO (Gene Expression Omnibus) | 253 | Microarray |
| Lin Ke et al., 2022 [55] | Binary Classification | Lung Cancer from the GEO (Gene Expression Omnibus) | 181 | Microarray |
| Deng et al., 2022 [56] | Binary Classification | Myeloma from the GEO (Gene Expression Omnibus) | 173 | Microarray |
| Rostami et al., 2022 [57] | Binary Classification | Prostate Cancer from the GEO (Gene Expression Omnibus) | 102 | Microarray |
| Xie et al., 2022 [58] | Binary Classification | Colon Cancer from the GEO (Gene Expression Omnibus) | 62 | Microarray |
| Reference | Feature Selection Method | Feature Selection Algorithm | Dataset Type | Accuracy (%) |
|---|---|---|---|---|
| Park et al., 2019 [65] | Filter Methods | Artificial Neural Network (ANN) | RNA-Seq | 90.71% |
| García-Díaz et al., 2019 [66] | Filter Methods | Grouping Genetic Algorithm | RNA-Seq | 98.81% |
| Wu and Hicks, 2021 [67] | Filter Methods | K-nearest neighbor (kNN) Naïve Bayes (NGB) Decision trees (DT) Support Vector Machines (SVM) | RNA-Seq | 87% 85% 87% 90% |
| Chen and Dhahbi, 2021 [68] | Filter Methods | RF | RNA-Seq | 90% |
| Liu and Yao, 2022 [69] | Filter Methods | Deep Neural Network (DNN) | RNA-Seq | 99% |
| Gakii et al., 2022 [70] | Filter Methods | Multilayer Perceptron Sequential Minimal Optimization Naive Bayes Classifier | NSCLC RNA-Seq | 100% 96.42% 98.59% |
| Mahin et al., 2022 [71] | Filter Methods | k-Nearest Neighbor | RNA-Seq | 100% |
| Li et al., 2017 [72] | Wrapper Methods | Genetic Algorithm /k-Nearest Neighbor | RNA-Seq | 90% |
| Zhang et al., 2018 [73] | Wrapper Methods | SVM-RFE-GS SVM-RFE-PSO SVM-RFE-GA RFFS-GS | RNA-Seq | 91% 91.68% 91.34% 92.19% |
| Simsek et al., 2020 [74] | Wrapper Methods | RF Artificial Neural Networks DL Model (RMSProp) | RNA-Seq | 91.83% 89.22% 95.15% |
| Al-Obeidat et al., 2021 [75] | Wrapper Methods | BABC-SVM | RNA-Seq | 97.41% 97.35% 98.50% 95.86% |
| Liu et al., 2022 [76] | Wrapper Methods | Random Forest | RNA-Seq | 99.68% |
| Al Abir et al., 2022 [77] | Wrapper Methods | Support Vector Machines (SVM) SVM-RFE | RNA-Seq | 99.93% |
| Kong and Yu, 2018 [78] | Embedded Methods | Graph-Embedded Deep Feedforward Networks (GEDFN) | BRCA RNA-Seq | 94.50% |
| Jiang et al., 2020 [79] | Embedded Methods | Bayesian Robit regression with Hyper-LASSO (BayesHL) | RNA-Seq | N/A |
| Zhang and Liu, 2021 [80] | Embedded Methods | Robust biomarker discovery framework | RNA-Seq | 97% 98% 99% 98% 99% 98% |
| Abdelwahab et al., 2022 [49] | Embedded Methods | Recursive Feature Elimination (RFE) + SVM | RNA-Seq | 94% |
| Coleto-Alcudia et al., 2022 [48] | Embedded Methods | Filtering + SVM | RNA-Seq | 93% |
| Feature Selection | Filter Methods | Wrapper Methods | Embedded Methods |
|---|---|---|---|
| Pros | Univariate | Deterministic | Interacts with the classifier in a complex way. Models feature dependencies. Reduced computational complexity than wrapper methods. |
| Fast and scalable to large datasets. Independent of the classifier. | Interacts with the classifier in a simple way. Models feature dependencies. Takes less time to compute than randomized methods. | ||
| Multivariate | Randomized | ||
| Models feature dependencies. Independent of the classifier. Reduced computational complexity than wrapper methods. | Interacts with the classifier. Models feature dependencies. Less prone to the local feature interaction problem. | ||
| Cons | Univariate | Deterministic | Classifier-dependent selection. |
| Ignores feature dependencies. Ignores interaction with the classifier. | Risk of overfitting. More prone than randomized algorithms to the local feature interaction problem. Classifier-dependent selection. | ||
| Multivariate | Randomized | ||
| Slower and less scalable than univariate techniques. Ignores interaction with the classifier. | Computationally intensive. Models feature dependencies. Classifier-dependent selection. Higher risk of overfitting than deterministic algorithms. |
| Reference | Dataset | Algorithm | Dataset Type | Performance |
|---|---|---|---|---|
| Segal et al., 2003 [86] | Cancer | SVM | Gene Expression Data | Accuracy: 98.5% |
| Hijazi et al., 2013 [88] | Mixed-Lineage Leukemia (MLL) | SVM Linear | Gene Expression Data | Accuracy: 99.89% |
| Ram et al., 2017 [87] | Colon Cancer | RF | Microarray Data | Accuracy: 87.39% |
| Zhang et al., 2018 [73] | Breast Cancer | SVM-RFE-PSO | Gene Expression Data | Accuracy: 81.54% |
| Yuan et al., 2020 [89] | Tumor-educated platelets | Evolutionary Programming-trained SVM | Gene Expression Data | Accuracy: 95.93% |
| Yuan et al., 2020 [90] | Lung adenocarcinoma (AC) and lung squamous cell cancer (SCC) | RF | Gene Expression Data | Accuracy: 94.9% |
| RF | Gene Expression Data | Accuracy: 93.3% | ||
| SVM | Gene Expression Data | Accuracy: 94.7% | ||
| Abdulqader et al., 2020 [91] | Lymphoma | kNN | Microarray Data | Accuracy: 94.7% |
| Lymphoma | NB | Microarray Data | Accuracy: 74.83% |
| Reference | Dataset | Type of Cancer | Algorithm | Dataset Type | Performance |
|---|---|---|---|---|---|
| Zhang et al., 2018 [95] | NCBI GEO database | Breast | DNN [AdaBoost algorithm (PCA-AE-Ada)] | Gene Expression Data | ROC-AUC: 0.714% |
| Gao et al., 2019 [96] | Breast Cancer | Breast | DeepCC | Gene Expression Data | Accuracy: 89% |
| Lai et al., 2020 [94] | Lung Adenocarcinoma | Lung | DNN [four hidden layers, with the rectified linear unit (ReLU)] | Gene Expression Data | ROC-AUC: 0.8163, Accuracy: 75.44% |
| Chandrasekar et al., 2020 [97] | Microarray Dataset | Cancer (heterogeneous disease) | DNN | Gene Expression Data | Accuracy: 72.5% |
| Laplante et al., 2020 [98] | TCGA | Tumor | DNN | Gene Expression Data | Accuracy: 96.9% |
| Azad et al., 2021 [99] | Breast Cancer Wisconsin (Original) Dataset (WBCD) | Breast Cancer | Intelligent Ensemble Classification method based on Multi-Layer Perceptron neural network (IEC-MLP) | Gene Expression Data | Accuracy: 98.74% |
| Alshareef et al., 2022 [100] | Patient Databases (PubMed, CENTRAL, EMBASE, OASIS, and CNKI) | Prostate Cancer Detection | DNN [CIWO-based F.S.] | Gene Expression Data | Accuracy: 96.21% |
| Reference | Dataset | Type of Cancer | Algorithm | Dataset Type | Performance |
|---|---|---|---|---|---|
| Sahin et al., 2019 [103] | Colon, lung, and prostate datasets from gene expression profile (GEP) datasets | Lung Lymphoma Leukaemia Colon SRBCT Prostate | RNN [LSTM-AIRS] | Microarray data | Accuracy: 89.6% 88.3% 85.3% 84.7% 77.6% 75.7% |
| Zhao et al., 2019 [111] | Data1endoderm (PrE) Cells. Data2: Mouse embryonic fibroblast (MEF) cells. Data3: Definitive endoderm (DE) cells. | Classification | RNN | Gene Expression Data | ROC-AUC Data1: 0.620 Data2: 0.587 Data3: 0.578 |
| Liu et al., 2020 [112] | Benchmark Dataset: DREAM3 and DREAM4 | Classification | MALASSRNN-GRN | Microarray data | ROC-AUC (node = 10, Density = 20%, 40%) 0.6351 0.7188 |
| Aher et al., 2021 [104] | Leukaemia datasets (Leukemia data 2017), SRBCT dataset (SBRCT dataset 2020). SRBCT dataset (SBRCT dataset 2020). | Leukaemia SRBCT Lung | RNN [Rider Chicken Optimization algorithm] (RCO-RNN) | Gene Expression Data | Accuracy: 94.5% 94.0% 95.0% |
| Majji et al., 2021 [105] | AP_Colon_Kidney dataset 2020 AP_Breast_Ovarydataset 2020 AP_Breast_Colon dataset 2020 AP_Breast_Kidney dataset 2020 | Colon Cancer Kidney Cancer Breast Cancer Ovary Cancer | JayaALO-based DeepRNN | Gene Expression Data | Accuracy: 95.27% 95.97% 95.97% 95.27% |
| Suresh et al., 2021 [106] | Acute myeloid (AML) and acute lymphoblastic leukemia (ALL) | Acute myeloid (AML) and acute lymphoblastic leukemia (ALL) | LSTM and Bat sonar Algorithm | Gene Expression Data (via DNA microarray) | Accuracy: 86.35% |
| Reference | Dataset | Type of Cancer | Algorithm | Dataset Type | Performance |
|---|---|---|---|---|---|
| Xiao et al., 2018 [117] | From TCGA LUAD dataset STAD dataset BRCA dataset | LUAD STAD BRCA | Deep learning-based multi-model ensemble method | RNA-seq data | Accuracy: 95.60% 94.63% 94.62% |
| Lyu et al., 2018 [118] | 33 tumor types in Pan-Cancer Atlas | 33 tumor types. | CNN | RNA-Seq data | Accuracy: 95.59% |
| de Guia, et al., 2019 [122] | TCGA | 33 cohorts of cancer types | CNN | RNA-Seq data | Accuracy: 95.65% |
| Elbashir et al., 2019 [18] | TCGA | Breast Cancer | lightweight CNN | RNA-Seq data | Accuracy: 98.76% |
| Mostavi et al., 2020 [119] | From TCGA: 33 cancer types 23 normal tissues. | 33 cancer types and 23 normal tissues. | 1D-CNN 2D-Vanilla-CNN 2D-Hybrid-CNN | RNA-Seq data | Accuracy: 95.7% 92.5% 95.7% |
| Khalifa et al., 2020 [123] | Tumor Gene Expression for five separate cancer types | KIRC BRCA LUSC LUAD UCEC | Binary Particle Swarm Optimization–Decision Tree (BPSO—DT) and CNN. | RNA-Seq data | Accuracy: 98.20% 98.30% 97.7% 84.8% 96.40% |
| Reference | Type of Cancer | Algorithm | Dataset Type | Performance |
|---|---|---|---|---|
| Sevakula et al., 2019 [141] | AP_Omentum_Lung (OL) AP_Omentum_Uterus (OU) AP_Colon_Omentum(CO) AP_Ovary_Uterus (OvU) AP_Endometrium_Uterus (EU) AP_Endometrium_Ovary (EOv) AP_Omentum_Ovary(OOv) | Transfer Learning | Gene Expression Data | Accuracy: 98.30% 97.89% 97.08% 95.60% 94.85% 93.82% 84.80% |
| Lopez-Garcia et al., 2020 [120] | Lung Cancer | Transfer Learning + CNN | Gene Expression Data | Accuracy: 73.26% |
| Zhang et al., 2021 [139] | Breast cancer | Transfer Learning + CNN + CLSTM | Breast cancer molecular subtypes on MRI | Accuracy: CNN with transfer learning = 90% CLTSM with transfer learning = 93% |
| Kakati et al., 2022 [138] | Breast cancer and uterine cancer | Transfer Learning + CNN | Gene Expression Data | ROC-AUC: 88–99% |
| Das et al., 2022 [24] | Liver cancer | Deep Transfer Learning | Gene Sequences | Accuracy: 1D CNN model = 80.36% 2D CNN model = 98.86% |
| Future Perspectives | |
|---|---|
| Introducing additional input features, such as DNA methylations and mutations, can improve the discriminative performance of existing learning algorithms. |
| The design of novel computational algorithms and novel benchmarking approaches is important for advancing gene expression analysis. |
| Investigate methods for identifying biomarkers specific to each form of cancer. |
| GNN architectures can support the integration of single-cell multi-omics data by employing heterogeneous graphs. |
| Emphasize the adoption of interpretable ML models that help to understand the decision-making process and explain the reasons when ML models fail. |
| Combine a variety of new modalities, including imaging, proteomic, metabolomic, glycemic, and epigenetic data, to find and evaluate surrogate biomarkers for cancer gene prevention studies. |
| Multimodal and multitask ML methods based on early and late fusion have the potential to improve classification performance. |
Disclaimer/Publisher’s Note: The statements, opinions and data contained in all publications are solely those of the individual author(s) and contributor(s) and not of MDPI and/or the editor(s). MDPI and/or the editor(s) disclaim responsibility for any injury to people or property resulting from any ideas, methods, instructions or products referred to in the content. |
© 2023 by the authors. Licensee MDPI, Basel, Switzerland. This article is an open access article distributed under the terms and conditions of the Creative Commons Attribution (CC BY) license (https://creativecommons.org/licenses/by/4.0/).
Share and Cite
Alharbi, F.; Vakanski, A. Machine Learning Methods for Cancer Classification Using Gene Expression Data: A Review. Bioengineering 2023, 10, 173. https://doi.org/10.3390/bioengineering10020173
Alharbi F, Vakanski A. Machine Learning Methods for Cancer Classification Using Gene Expression Data: A Review. Bioengineering. 2023; 10(2):173. https://doi.org/10.3390/bioengineering10020173
Chicago/Turabian StyleAlharbi, Fadi, and Aleksandar Vakanski. 2023. "Machine Learning Methods for Cancer Classification Using Gene Expression Data: A Review" Bioengineering 10, no. 2: 173. https://doi.org/10.3390/bioengineering10020173