Review

Social Network Analysis: Applications and New Metrics for Supply Chain Management—A Literature Review

by
Ana Isabel Bento
,
Carla Cruz
,
Gabriela Fernandes
and
Luís Miguel D. F. Ferreira
*
University of Coimbra, CEMMPRE, ARISE, Department of Mechanical Engineering, Coimbra 3030-788, Portugal
*
Author to whom correspondence should be addressed.
Logistics 2024, 8(1), 15; https://doi.org/10.3390/logistics8010015
Submission received: 7 November 2023 / Revised: 30 January 2024 / Accepted: 4 February 2024 / Published: 6 February 2024

Abstract

:
Background: Supply chains, characterized by complexity and sensitivity, require continuous mapping to address challenges, particularly disruptions like the COVID-19 pandemic. In this context, Social Network Analysis (SNA) has proven valuable in analyzing how actors in a network connect and create interdependencies. However, some studies suggest that the SNA literature needs to embrace new fields of application and develop innovative metrics. Methods: The aim of this study is to clarify the role and contribution of SNA when characterizing and understanding the challenges of contemporary supply chains. A literature review was conducted to achieve this. Results: The results reveal that SNA has been applied in a wide variety of areas (e.g., manufacturing and construction sectors), with an emerging application in the tertiary sector. Furthermore, the findings demonstrate that metrics related to the network and to nodes have been used repeatedly, highlighting the need for new supply-chain-related metrics, such as the novel concept of semi-directedness. Conclusions: Despite the versatility of SNA, some aspects may limit its application to supply chain management, including shortcomings in data acquisition and the fact that SNA only allows for the visualization of network configurations, thus preventing the capture of nuances that characterize the relationships between the actors involved.

1. Introduction

Currently, supply chains are characterized by the high number of actors they involve [1]. In this context, market competition is shaped not solely by the capabilities of manufacturers but by the merging of such capabilities across all members of the supply chain [2]. Therefore, the complexity, sensitivity, and dynamism that characterize supply chains [3] lead to a constant need for mapping, which allows companies to visualize their suppliers and customers, identify the relationships, flows, and dynamics of the networks, as well as capture the environment in which the supply chain operates [4]. While various methodologies, such as Value Stream Mapping (VSM), Quick Scan Methodology (QSM), and Supply Chain Operations Reference-model (SCOR), offer different approaches to constructing maps of supply chains [4], a noteworthy perspective involves leveraging the principles of network science [5]. Thus, Social Network Analysis (SNA) has emerged as a particularly promising approach.
The concept of SNA has been studied over time, demonstrating its relevance not only in the fields of Operations and Supply Chain Management (SCM) [6,7]. According to Carter, Ellram, and Tate [8], SNA explains how actors in a network—individuals or companies—connect and; therefore; describes a system of interconnected nodes. As a result, SNA typically assesses two aspects: nodes (members that are part of the network) and ties (relationships between the nodes) [9]. Furthermore, SNA quantifies the complexity of modern supply chains and explores how their structure may be related to issues such as risk, innovation, and profitability [10]. It is, therefore, a useful tool, especially in the case of unpredictable and disruptive events, such as the COVID-19 pandemic, in which companies needed to understand and know their supply chains better [11]. This led, for example, to the enhancement of regional networks, thus avoiding logistical disruptions and restrictions [12].
Analytical metrics have been used at the node level and network level, which involve nodes and their interactions, to characterize networks [7]. Borgatti and Li [9] explain that node-level metrics focus on the concept of centrality, which assesses the relative significance of nodes within a network. In turn, network-level metrics pertain to the overall structure of the network, evaluating the number of existing connections compared to the number of potential connections. However, despite the existence of these metrics, Wang [1] concluded, based on a bibliometric analysis of the application of SNA in SCM, that there is an urgent need to develop new indicators.
Therefore, this study was motivated by several factors. In particular, the most recent literature review on the application of SNA in SCM stops in 2020 [6]. Since then, significant changes in supply chains have occurred, notably in response to the challenges imposed by the pandemic [11]. Additionally, SNA has predominantly found application in the manufacturing and construction sectors, underscoring the imperative to identify novel applications. Simultaneously, there is also a need to identify new metrics [6]. The importance of effective mapping as a first step for supply chain management is also worthy of note [5]. Hence, the following research question may be formulated: How can SNA be used to characterize and understand the challenges of contemporary supply chains?
The aim of this study is to analyze the role and contribution of applying SNA when characterizing and analyzing the challenges of contemporary supply chains and to identify potential new metrics. For this purpose, a literature review was conducted with a focus on publications from the year 2020 onwards.
This study is organized as follows: Section 2 describes the previous studies that applied SNA to SCM. Section 3 presents the research methodology, and Section 4 provides the main descriptive and qualitative results. Finally, Section 5 has the discussion, and the conclusion is presented in Section 6, where the research question is addressed and the study’s main contributions and limitations are highlighted, as well as avenues for future research.

2. Social Network Analysis in Supply Chain Management

SNA is widely recognized as a privileged approach in terms of the characterization and in-depth study of relationships in networks [6,7,13]. The increasing focus on the network rather than its individual components or buyer-supplier interaction has led to a growing number of publications on the use of SNA in the field of SCM.
Borgatti and Li [9] provided an overview of SNA, both in terms of specific concepts, such as structural holes or betweenness centrality and additionally presenting “generic exploratory mechanisms”, namely, forms of associating network variables to the relevant results. These mechanisms make it possible to adapt SNA concepts to the context of SCM, going beyond merely copying. Wichmann and Kaufmann [13] carried out a systematic literature review (SLR), and their findings emphasized that scholars are not yet fully conscious of the potential the SNA approach represents for the field of SCM, complementing Borgatti and Li’s idea that “the SCM context has specific features that cry out for developing new network theory” [9] (p. 20).
Considering more recent studies, Refs. [1,14] both perform bibliometric analyses to ascertain different possibilities regarding the application of SNA. The first finds the main areas that have used SNA as a methodological tool in the business and management area: risk management, project management, SCM, tourism, technology and innovation management, and knowledge management. The latter conducted a study to investigate the growth of SNA in SCM, out of which four major clusters emerged (multi-objective optimization, sustainable SC, supply network, and circular economy), as well as three research trends (supply chain network design, structural characteristics, and supplier selection and evaluation). Han, Caldwell, and Ghadge [6] argue that current approaches to the adoption of SNA in operations management (OM) are centered on linear value creation. The authors contend that the use of SNA should be re-oriented to reflect how contemporary networks reciprocally coordinate to create value.
SNA enables different levels of analysis. Research might focus on the focal company, the relationships between actors (dyads, triads), or the whole network. Wichmann and Kaufmann [13] stated that the majority of studies analyzed focused on the relationships between network members, namely buyer-supplier relationships, concentrating on their ties and performance, presenting it as the most prevalent unit of analysis. Departing from the traditional focus on a single focal company, SNA provides the means to encompass the whole network while acknowledging adversity in terms of data collection [9] and the limitations encountered when working with secondary data, single sample studies, and validity issues, which must be overcome [13].
Contemporary phenomena of disaggregation and turbulence have led to increasingly complex networks [6,13]. SNA emerges as an approach capable of mapping complex systems and analyzing different levels of complexity. In addition to representing complex networks, SNA provides an opportunity to scrutinize the evolution of such networks, departing from static investigation [15,16].
The past few years have been challenging, particularly in the area of SCM. Supply networks, which were already becoming more complex and extensive, have undergone profound changes and have experienced severe impacts during and after the COVID-19 pandemic [12,17,18]. This unforeseen event and its repercussions on supply networks at a global level heightened the need for tools that can provide a precise visualization of networks, actors, and the nature of the ties between them [9,13]. Concepts derived from diverse fields of knowledge, such as SNA, have gained traction in terms of application in the area of SCM [10,17,19,20,21,22,23]. Furthermore, new developments have emerged from the application of SNA in SCM, including directed and non-directed networks [24] and the concept of semi-directedness [25].
The process of analyzing the reviews provided the necessary background to define the scope of this study, as well as the motivation and research question. The main purpose of this review is to provide an outlook on the latest work involving the application of SNA in SCM. The focus is on the areas and sectors of application to reveal new possibilities derived from the use of SNA in the field of SCM that are suitable to attain in-depth knowledge of the networks’ structure and provide the visualization required. Additionally, identifying new metric developments and theoretical extensions to support this falls within the scope of this study.

3. Research Methodology

After providing the background for the present study, a systematic literature review (SLR) was conducted to answer the research question and achieve the goals outlined. An SLR is a methodology to locate appropriate studies, select and evaluate their contributions, analyze and synthesize data, and report the findings. By following these steps, informed evidence may be gathered regarding what is and is not known on the topic. Bearing in mind Denyer and Tranfield’s [26] revised principles for SLR in the field of management, the process of reviewing the latest studies using SNA in the area of SCM was carried out transparently and inclusively, abiding by the explanatory and heuristic nature recommended by the authors.
The following sections document the steps performed regarding question formulation, locating studies, selection and evaluation, and analysis and synthesis.

3.1. Question Formulation

The first step in preparing a systematic review consists of defining the research question. A clear formulation of the research question is the basis for establishing the focus and the criteria for primary inclusion in the study [26]. Contrary to the common practice in the medical field (where SLRs were originally applied), which focused on the definition of boundaries, studies conducted in the SCM context are primarily concerned with justifying their timeliness, relevance, or contribution [27]. Considering the topic under review, the following research question was asked: How can SNA be used to characterize and understand the challenges of contemporary supply chains?

3.2. Locating Studies

The aim of systematic reviews is to identify the main trends, applications, and developments regarding the use of SNA in SCM. A primary search was conducted, looking for literature reviews focused on the subject. Given that the core interest was the most recent work in the field, our search included publications from 2020 to the end of August 2023. The databases selected were SCOPUS and Web of Science (WoS). The keywords used were “supply chain” and “social network analysis”. The choice of a simple and inclusive research string was deliberate, as the study’s timespan was short enough to avoid generating overwhelming results [27] thus making the analysis feasible. The search focused only on journals (articles and reviews) and yielded a total of 179 articles.

3.3. Study Selection and Evaluation

Following the initial search, information from the articles was compiled with the help of a spreadsheet. After conducting a preliminary analysis, 62 articles were found to be duplicates. The subsequent step consisted of analyzing the remaining 117 articles’ keywords and abstracts to identify articles where SNA had been applied to this study and characterization of contemporary supply chains/networks. During this stage, five literature reviews were identified and excluded from the sample. After analyzing keywords and abstracts, 82 documents were excluded, resulting in a final sample of 30 articles, as depicted in Figure 1. These were read in their entirety, analyzed, and deemed suitable for inclusion.

3.4. Analysis and Synthesis

Following the selection and evaluation, the articles considered relevant for the present review were analyzed and summarized. The aim of this process is to dissect individual studies and look for relationships within the final sample. New knowledge may result from extracting and rearranging the information contained in the studies analyzed, which would not necessarily have become apparent from reading them individually [26].
The extraction template (Table 1) sought to gather the relevant information to answer the research question, as well as other study artifacts [27], such as sector (primary, secondary, or tertiary), data source, or time horizon.
Information from the 30 articles reviewed was extracted by the authors of this article, who then carried out their analysis, presented their findings, and subsequently revealed and discussed their results. The final analysis includes the information considered pertinent by unanimous agreement.

4. Results

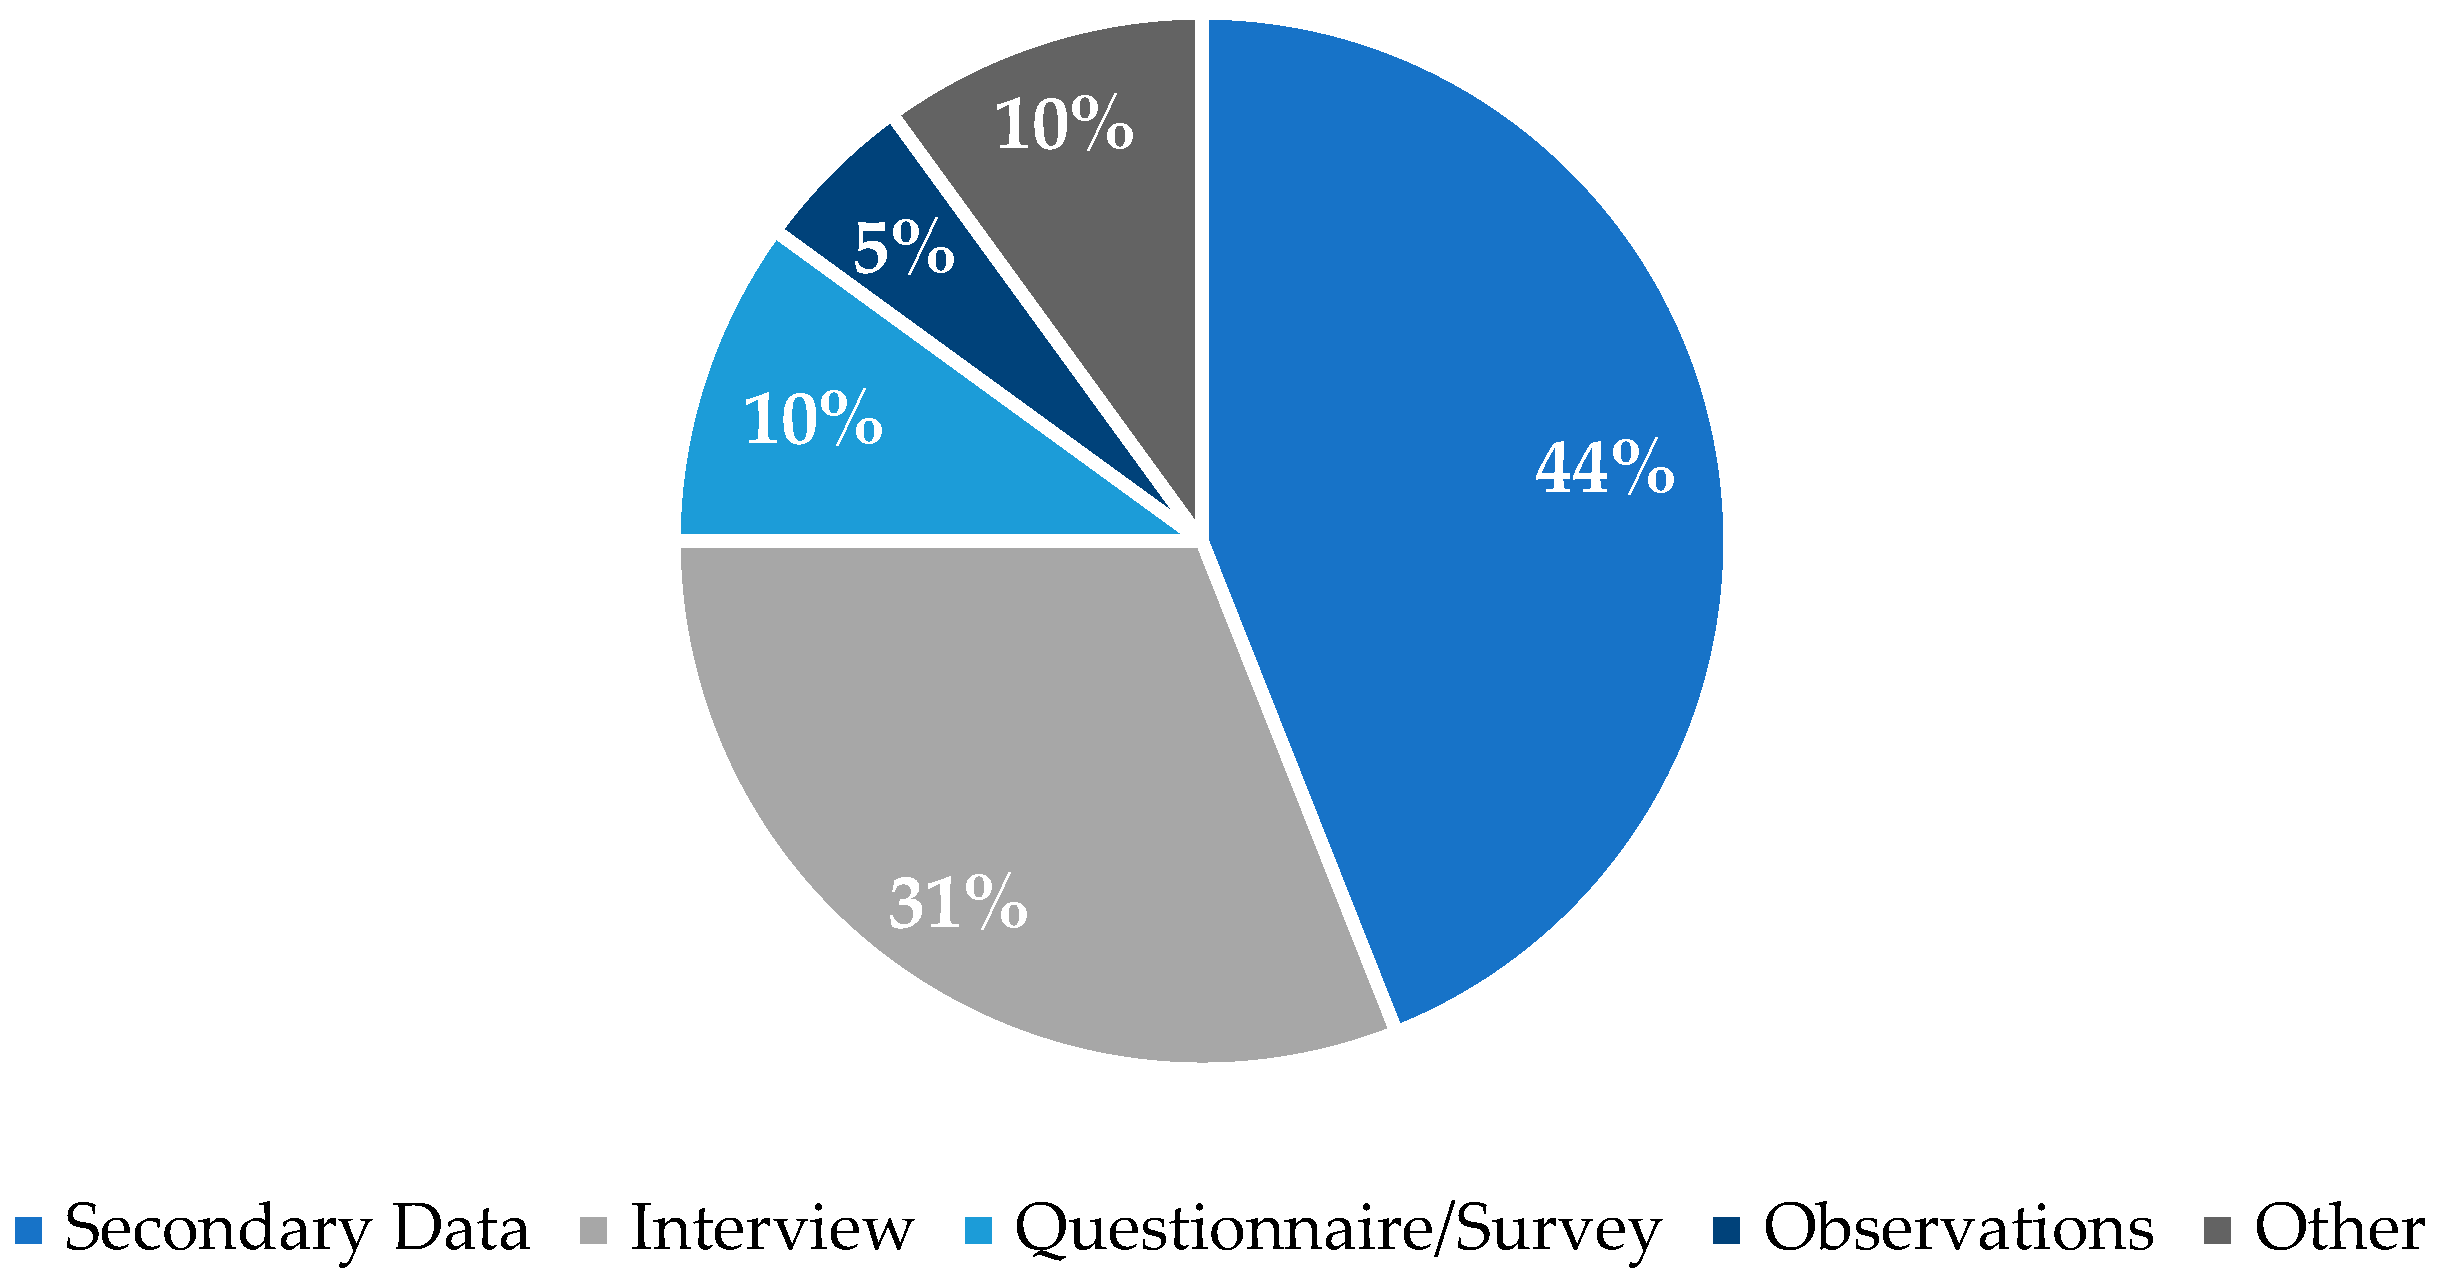
4.1. Descriptive Analysis

Figure 2 shows the distribution of articles according to the search period specified. Several authors have pointed out a growing number of publications on the subject (e.g., [6,13]). 2022 presented a larger number of publications when compared to the two previous years. Concerning 2023, the search retrieved articles published during the first third of the year, which accounted for the average number of articles published in the three previous years. This number is expected to have surpassed the previous records in the remaining two-thirds of the year. The consistent number of publications found in the period analyzed demonstrates that the subject remains relevant and continues to be the object of new research.
The articles selected were distributed across a significant number of journals (Appendix A), with the International Journal of Production Economics, Sustainability, and the Journal of Cleaner Production contributing the final samples with two articles each.
Considering the first author’s affiliation, the article’s publication location was also analyzed. In terms of continental distribution, 40% of the studies have their origins in Asia, the same percentage in Europe, and the remaining 20% were published in America. The geographical distribution of the articles selected illustrates the level of dissemination of the topic under review.
The articles encompassed a wide range in terms of application, according to Figure 3, which depicts the activities the studies focused on. Thus, 20% of the articles referred to those within the primary sector (essentially food-related), while the majority (67%) of the others are related to the secondary sector (automotive industry, construction, electronics, and other manufacturing activities). The tertiary sector accounted for just 13% of the articles sampled, concerning applications in the fields of humanitarian relief activities and health services. These findings are in line with previous research, where the secondary sector accounted for most of the studies carried out and the service sector, technology, and knowledge-based sectors were underrepresented [6].
The sources of data for the studies were also analyzed (Figure 4). Some articles refer to the use of mixed-methods approaches [19,28,29,30,31,32,33], but the leading source was secondary data, with a 44% prevalence in the sample. Interviews (in-depth, semi-structured, and with experts) followed and were carried out in 31% of the studies. Questionnaires/surveys account for 10% of the articles selected, which is the same percentage attained for other data sources (focus groups, consensus analysis, expert suggestions). Foti and Timpanaro [23] administered a questionnaire to consumers regarding their degree of sensitivity towards sustainability behavior, purchasing behavior, knowledge on offer, and their perception of companies’ sustainability actions in their study on the sustainability of farmers’ markets. Refs. [1,34], both research in the construction sector, used surveys to determine the key factors that influence the recycling of construction waste and the relationship between any risks to create a risk network adjacency matrix. Lastly, Marcinkowski [35] applied a survey of humanitarian organizations to characterize their cooperation with humanitarian actors according to a scale ranging from 0 (no cooperation) to 5 (permanent cooperation).
It is clear that many articles identified in the review rely on secondary data. This fact emphasizes the difficulty of finding and accessing data. Difficulties lie in time constraints, concerns related to the anonymity of the respondents, and technical issues related to the application of surveys and questionnaires [6,13].
In terms of data analysis tools and software, 27% of the articles utilized more than one tool. UCINET and VOSviewer were referred to in 27% and 33% of the studies within the sample, respectively. Other software tools mentioned were NETDRAW, R, Gephi, SPSS, Python, and NetMiner. These tools were used to provide graphic output to represent the networks, as well as relevant metric calculations.
The SNA methodology proposes a set of metrics, both node- and network-related [6,7,13]. Among the articles analyzed, such metrics were examined, and a summary in Table 2 depicts their utilization throughout the sample. Regarding node metrics, betweenness centrality—measuring the extent to which an actor is positioned between other actors—was the most frequently used and is present in 73% of the articles reviewed; followed by degree centrality—the number of direct ties an actor has with the other actors within the network—(70%) and closeness centrality—characterizing how close an actor is to all the others in the network—(43%). Network metrics were less frequently used, with network density—the level of connectedness—computed in 37% of the articles and network centralization—measuring how far the cohesion propagates around central actors—in 7%; but network complexity was not present in any of the studies. Network complexity highlights the number of dependency relationships throughout a network, encompassing the overall number of actors within the network and the extent to which they are interconnected [13]. Even when considering studies gathering first-hand data, the unwillingness of even a few actors to participate in surveys and questionnaires makes a full network analysis and the characterization of its complexity an almost impossible task [34,35].
Besides, the metrics summarized in Table 2, others were provided in the articles reviewed. Zhou, Yip, Ren, and To [24] wished to identify the influential factors of the bullwhip effect in a supply chain and the interactive relationships among them, namely by calculating tie prediction metrics regarding a fashion industry and retail network. Adami, Verschoore, and Sellitto [29] conducted a case study in the turbine industry and provided a set of metrics to characterize the structural configuration and complexity of supply chains, namely structural holes [6,13]. Refs. [15,20] calculate the metric degree assortativity, which measures the extent to which companies associate with similar companies in the network, that is, the preference for a network’s node to link to others that have some similarity. Moreover, Cai and other researchers [15] also devised two new metrics to identify outbreaks of disease and contamination: MSC—Maximum Spread Capacity—and MIC—Maximum Infection Chain. Network cohesion was calculated and presented by [23,29,43]. At the node level, eigenvector centrality was calculated in eight articles within the final sample; this is a metric intended to capture the number and importance of adjacent nodes around a particular node within the network [6].
Of the 30 articles reviewed, 2 of them did not resort to the metrics presented in Table 2. Shaharudin and Fernando [44] used an SNA approach to study the cold supply chain of leafy green vegetables. They conducted semi-structured interviews with 19 individuals from 4 companies within the cold supply chain network in order to understand the best practices in the field derived from word association. SNA focused on the output of the interview data, providing the base and visualization tools for clustering analysis and natural language processing, as well as network visualization. Simpson, Tacheva, and Kao [25] introduced a new concept, semi-directedness, thereby adding a new entry to the SNA lexicon and a new set of semi-directed metrics. The authors propose a new set of semi-directedness measures, such as differential betweenness (the number of semi-directed paths in which the node serves as a differential node); in-degree differential betweenness (the number of semi-directed paths in which the node serves as an in-degree differential node); and out-degree differential betweenness (the number of semi-directed paths in which the node serves as an out-degree differential node). The authors propose that these measures are most likely to overcome undirected measures in terms of characterizing supply networks.
As a tool, SNA provides the possibility of performing both static and dynamic analysis. Among the sample articles selected, 21 apply cross-sectional approaches (Ref. [44] is not included in Table 2, as no metrics were presented, although the authors focus on the analysis and visualization of the cold supply chain network). A total of eight articles performed longitudinal studies. One of the articles did not present any such type of analysis [25].
The majority of the articles conducting cross-sectional studies refer to the secondary sector (12 articles), which are applied in areas such as the automotive industry, construction, manufacturing, and energy. There are also five articles applying cross-sectional analysis within the tertiary sector, related to humanitarian help, health services, and retail. The primary sector is studied in four articles, in activities mainly associated with food production/extraction.
Longitudinal studies are mostly undertaken within the context of the secondary sector (6), focusing on the construction and automotive industries. The remaining two articles using the longitudinal approach refer to primary sector activities (agriculture and food production/extraction). There are no longitudinal studies applied in the tertiary sector.

4.2. Qualitative Analysis

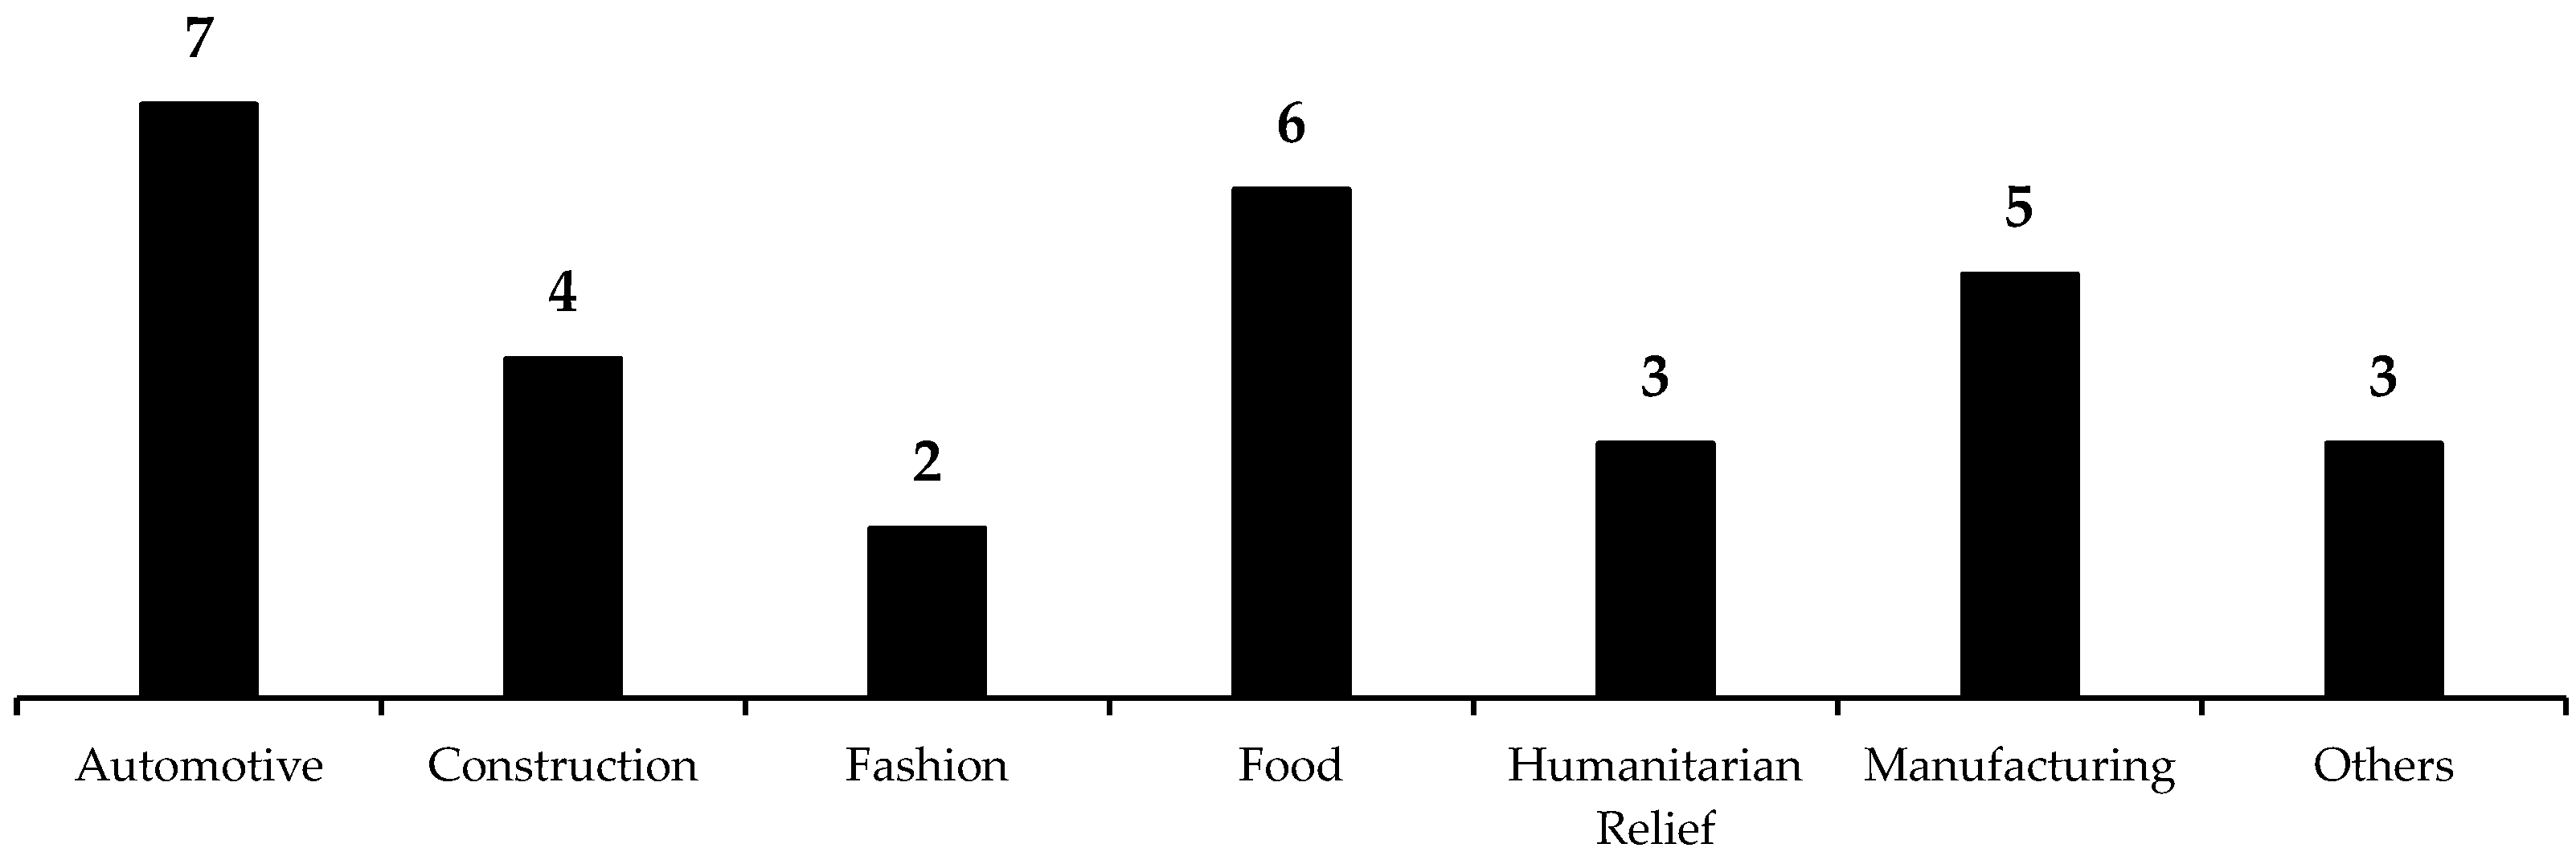
4.2.1. Areas of Application

Following the descriptive analysis, particularly the results reported in Figure 3, it is evident that SNA has been applied in a wide range of areas. This not only addresses structural aspects but also associates SNA with various topics, as explored by Wichmann and Kaufmann [13], indicating that the use of SNA in SCM goes beyond being just an analytical tool. Most of the studies reviewed applied SNA in the context of manufacturing, especially in the automotive sector [10,17,20,21,22,42].
Using SNA, Ref. [17] demonstrates that suppliers exert influence on automobile manufacturers to provide digital services to their customers. Additionally, the authors mentioned that the use of technologies enables a stronger relationship between manufacturers and suppliers. Kang and Oh [10] analyzed 234 suppliers of automotive parts and described the usefulness of the k-core method, which identifies key nodes in complete networks. In this regard, SNA enables the identification of key suppliers that impact a company’s performance. Furthermore, SNA is useful to evaluate supply chain resilience, as explained by [19] in their study of 27 entities in the supply chains of Honda, Acura, and Daimler Chrysler, who stated that placing additional nodes in a network can contribute to its resilience.
In addition, focusing on the automotive sector, Laari, Wetzel, Töyli, and Solakivi [20] explored how network characteristics and nodes can influence sustainability and concluded that the most sustainable companies are not necessarily the ones closest to customers but rather the most central ones. Therefore, according to [20], supply chain managers must map their suppliers and consider network configuration. Regarding network configuration, Le, Oláh, and Pakurár [21] analyze a supply chain composed of 60 assemblers and 210 suppliers and point out that only a few manufacturers predominantly control the exchange of information. For this reason, Seiler, Papanagnou, and Scarf [22] emphasize the importance of companies prioritizing cooperation over competition because cooperation will contribute to improving performance, which will also be influenced by node centrality [42].
Within the context of manufacturing, Lau, Kajikaw, and Sharif [38] applied SNA to 814 companies in Hong Kong with 3086 suppliers to explain that a company’s performance improves through the connections obtained by the focal company (in-degree centrality) and its ability to receive information (closeness centrality). The topic of information sharing was also addressed by [25], who refers to the interdependence among companies.
In the context of 2981 Chinese manufacturers, Du and Zhang [37] studied innovation performance, noting that digital transformation can underestimate the negative effects of a less favorable position in the supply chain. The authors proved that digital strategies can be useful to compensate for shortages in resources; therefore, attention should be paid to combining them with the current market and technologies. Finally, Yan, Wang, Zhao, and Zhang [12] applied SNA to study the creation of regional networks and concluded that these networks emerge from geographical proximity, similarities among companies, and the presence of transportation infrastructure.
Another area where SNA has been applied is the area of agriculture or those related to food production. Examples of studies addressing this field include [15,18,23,36,41,44].
Ashwood and other researchers [18] used SNA to assess the power of different actors and, when analyzing the top 10 pork producers in the USA, concluded that only a small number of actors control most connections, thus giving rise to the concept of monopoly. In addition, Cai and other authors [15] have referred to the usefulness of SNA for identifying outbreaks of disease and contamination in a pork supply chain, proposing two metrics: MSC and MIC.
In turn, Pedroza-Gutiérrez and Hernández [41], through the study of a fish production chain, explained that SNA makes it possible to create a structure to understand the nature and dynamics of the relationships between the actors, mentioning that network changes can increase competitive advantage. This aspect is also referred to by [44], who explained that network design is essential to guarantee the quality, freshness, and safety of vegetables. Therefore, a company must pay attention to its distribution channels. Concerning network design, Brinkley, Manser, and Pesci [36] evaluated the evolution of two food systems over six years and concluded that the actors’ centrality, their magnitude, and the spatiality of the network were altered during this period, in which approximately 80% of the connections were reconfigured. Finally, Foti and Timpanaro [23] associated the analysis of food systems with sustainability, concluding that four factors influence the construction of networks: consumer sensitivity to sustainability processes, individual purchasing and consumption behavior, political expectations, and the company’s knowledge.
SNA has also been applied in the context of the construction sector [16,28,34,43]. Refs. [28,43] apply SNA to the study of the risks associated with the field of prefabricated constructions, thus revealing the importance of this methodology, not only for identifying risk factors but also for tracking and controlling how these are associated with different stakeholders. Tang, Wang, Miao, and Zhang [16], using SNA, explained that the actors’ importance varies according to the phase of the construction project, so that, initially, government and property elements are more important, but at a later stage of the project, the group of actors involved more directly with the construction constitutes the most important stakeholder, verifying the social dynamics of the network. However, Ref. [34] examined the use of waste in the area of construction and, through SNA, found that the government, construction companies, recycling companies, and the public constitute the main stakeholders in the recycling system, highlighting the central role of construction companies.
Sustainable development is also an area of study in which SNA is applied. Marques and Manzanares [39] study the transition from linear to circular models, showing, through SNA, that during this transition, actors can change their roles, for example, no longer occupying a secondary role and starting to have a primary role in the network. In addition, this study demonstrates that suppliers in a network can rebalance power. Ref. [32] used SNA to study low-carbon technologies, thus addressing the cooperation and centrality of stakeholders. Ref. [24] applied SNA to a case study of Zara to assess how minimizing the bullwhip effect contributes to sustainable development.
From a more social perspective, SNA can be used to study networks for humanitarian aid. Copping and other authors [30] studied the network of construction materials for refugee shelters in relation to 272 families dispersed in Afghanistan, Bangladesh, Nepal, and Turkey, noting that SNA helps to distinguish the various configurations of the networks so that specific interventions can be designed. In addition, Ref. [33], a study of humanitarian aid supply chains in Honolulu, shows that the levels of collaboration between the different actors are relatively low, which can be, to a certain extent, explained by the dispersion of activities, which, according to Marcinkowski [35], makes synchronization difficult.
Finally, it is worth mentioning the works of [29,31,40]. Ref. [29] uses SNA to study six wind turbine supply chains in Brazil, noting that the number of critical actors is not a relevant aspect in itself, whereas characterizing the diversity of these actors is. Ref. [40] uses a case study of the H&M supply chain to explain, through SNA, that bargaining power, position in the network, and duration of relationships are related to commercial credit. Finally, Ref. [31] used SNA to study a Dutch hospital’s logistics system, specifically 23 tasks performed by 635 different actors with 31,499 connections between them. In this context, Van Der Ham and other authors refer to a low level of integration, characterized by the low density of the network, and a high level of differentiation since the tasks are carried out, for example, according to the unit/organizational department and medical specialty.
As mentioned earlier, there have been several examples of applying this methodology in the context of industry and services, as well as the coverage of new topics associated with SNA, which, to some extent, constitute a response to the suggestions for future work proposed by [6].

4.2.2. Metrics

In terms of metrics, Ref. [1] noted the need to develop new metrics or indicators within the context of SNA. However, the vast majority of studies reported in the literature focus essentially on the centrality metrics already mentioned: degree centrality, closeness centrality, and betweenness centrality [12,17,21,24,32,45]. However, Ref. [29], when examining six supply chains in the Brazilian wind turbine industry, mentioned the following measures as structural properties of the ego network: cohesion (also known as density), core-periphery (identifying the group of actors with the most ties among themselves), and structural holes (representing non-redundant sets of connections). Additionally, the recent work of Simpson, Tacheva, and Kao [25], which introduces a novel concept known as semi-directedness, is worth mentioning. This metric plays a significant role in identifying and quantifying interdependencies within networks that involve a substantial number of actors.

5. Discussion

The application of SNA in SCM reveals several significant advantages. First, SNA identifies the relationships among organizations [18], highlighting the disproportionate impact that certain entities may have on network stability [36]. This approach, as mentioned by [29] contributes to balancing capabilities, reducing costs, and improving delivery times for customers. In addition, in situations such as outbreaks of contamination, SNA stands out as it makes it possible to design policies aimed at minimizing the extent of these events [15].
SNA goes beyond the static representation of networks and relationships. Several studies adopt a longitudinal approach, mapping network structures over time and highlighting differences and shifts. While most of these studies assume a passive stance, by just documenting the evolution of networks [10,15,16,17,36], some authors explore the dynamic potential of SNA by implementing changes to the network (structure, actors, ties) and documenting the impacts of those modifications in subsequent representations. The impact of these changes is measured in terms of resources, sustainability, governance [39], and risk performance [28,43].
Risk management remains a concern for organizations operating in complex and ever-changing supply chains. Unforeseen and unexpected events, such as the COVID-19 pandemic, may assume global proportions, and networks may be impacted in unpredictable ways. SNA provides a deeper understanding of the structure of the network, the configuration of ties, and how these factors influence the risk of disruption [29,30]. Simpson, Tacheva, and Kao [25] mention the risks associated with sharing suppliers/customers, underscoring the potential of SNA to enhance awareness in this regard. Refs. [22,37] caution against dependencies and competition, noting that companies face a greater risk of being outplayed by nodes that have many alternatives. Therefore, several authors emphasize the importance of collaborative relationships and building trust and cooperation in order to reduce risk [10,19,25,37]. Network metrics derived from SNA can also be used to inform any action taken to control the aspect of risk [15]. Within the context of constructing prefabricated buildings, Refs. [28,43] apply SNA as a risk management approach from a network perspective. Finally, studies focused on the automotive industry stress the need for information sharing, highlighting the role of suppliers and the use of technologies as a means to ensure the visualization of network configurations and, therefore, reduce and effectively manage risk.
However, there are several challenges associated with SNA. For example, limitations in data acquisition [16,21,22,30,34], the binary representation of relationships that may not accurately capture their nuances [24], and difficulties in ensuring participant anonymity [6] are among some of the primary challenges faced in implementing SNA in the context of SCM. In addition to these limitations, it is relevant to note that, although SNA allows for the visualization of network configurations, it cannot capture nuances beyond structural characteristics. In this sense, it is impossible to assess the quality of inter-company relationships—a concept that emerges in the literature and describes the strength of relationships between upstream and downstream actors in a supply chain [46]. In this context, it is noteworthy that the articles analyzed do not present metrics capable of capturing the quality of relationships, and this constitutes an important lack since, according to [47], the quality of the relationships among the various actors plays a crucial role in how objectives are achieved.

6. Conclusions

The aim of the present review is to focus on the role of SNA and its use in the field of SCM to identify the most recent developments in contemporary supply chains in terms of new areas where it may be applied and the development of new metrics.
The results of this literature review reveal an increase in the number of publications on this topic and the global dissemination of SNA, which is indicative of its relevance. It should be noted that, in the current context, the growth of the scale and complexity of supply networks makes continuous mapping imperative. For this reason, the study of network science, namely SNA, has proved to be a useful tool that may be used to reveal the characteristics and structural configuration of the various relationships established in a supply chain.
In line with the preceding findings, the primary and secondary sectors still account for most studies. However, new applications have been carried out in the food industry, namely those related to the cold supply chain and livestock. In the secondary sector, traditional applications in the areas of manufacturing, the automotive industry, or construction have been currently joined by the fashion industry. Application in the tertiary sector, deemed incipient in previous reviews, has grown with new applications related to humanitarian relief. As it may be applied to a wide set of activities and encompasses many subjects and intangible flows, it may be concluded that SNA provides relevant tools to map and visualize today’s complex networks [31].
Some of the studies reviewed propose new concepts such as the directional network [24] and semi-directedness [25]. The latter develops a new set of metrics derived from the concept of semi-directedness, which the authors maintain is preferable in terms of characterizing supply chains as it surpasses conventional metrics. The emergence of new, specific SCM metrics addresses one of the research opportunities identified by previous reviews, thus representing specific developments resulting from the application of SNA to SCM.
Recent studies have presented the application of SNA as a new approach to reduce and manage risk within supply chains. This tool provides in-depth knowledge of the actors and the ties between them. Once a network’s structure has been characterized, organizations can benefit from a clearer understanding of the areas where intervention is necessary. Collaborative relationships and trust, as well as information sharing and visibility, are highlighted as potential drivers to reduce risk. Considering the motivation for the present study, it is clear that the latest publications in the area have both addressed new areas of application as well as new theoretical perspectives, leading to the emergence of new, supply chain-specific metrics.
Regarding the implications, the results of this study, which indicate a gap in capturing the nuances of relationships, mean that researchers can develop new methodologies that manage to articulate the visualization of the network (structural characteristics) with the quality of relationships (relational characteristics). Furthermore, it is recognized that longitudinal studies have great potential for understanding networks due to their dynamic nature. In this sense, researchers can explore the evolution of networks over time.
In turn, the results also have implications for managers. In this way, managers can use SNA to understand the structure and relationships of the supply chain, which will allow them to identify areas for intervention (e.g., risk management). Furthermore, through SNA, managers can promote collaboration between the network actors, contributing to greater efficiency and resilience in the supply chain.
Considering the implications for policymakers, as SNA allows the diagnostic of the network by highlighting central actors and identifying potential structural issues, this methodology can be employed to formulate policies aimed at enhancing connectivity, addressing structural weaknesses within the network, and mitigating the impact of unforeseen events, such as global disruptions like the COVID-19 pandemic. Furthermore, by examining the network, policymakers can promote actions that foster collaboration between actors, which will reduce risks and contribute to the performance of the supply chain.
As with all studies, there are limitations to this study. The search string might have limited the results, as it focused on SNA and supply chains and did not include related terminology, which would have probably generated a greater diversity of entries. On the other hand, focusing on the core concepts of SNA and supply chains has revealed greater diversity in terms of applications and metrics found in the literature. This study might also be limited by the relatively short publication period considered. A more encompassing timeframe is likely to have provided an opportunity for a clearer perspective on the evolution of the application of SNA in the field of SCM. However, the aim of this work was to retrieve the most recent contributions to the field, particularly by analyzing the research carried out during and following the COVID-19 pandemic.
Regarding future work, this area is expanding, as evidenced by the increase in the number of ongoing publications, the diversification of areas of application, and the development of metrics. It would therefore be relevant to conduct an in-depth analysis focused on the development of new metrics and to explore the underlying theoretical developments and the logic that underpins their measurement and calculation. SNA allows the implementation of longitudinal studies, enabling the perception of changes and evolution in networks over time. Although some examples were found in the articles analyzed, this remains a relatively incipient area with great potential for further development. It should be noted that none of the articles reviewed calculated the complexity of the network, since this metric, although not new to SNA, presents considerable challenges in identifying all the relevant actors. Consequently, a more detailed examination of this issue could contribute to overcoming this significant obstacle in future studies.
In addition, it would be interesting for new investigations to explore the complementarity of SNA with the evaluation of relations, namely through the concept of Relationship Quality. As has already been pointed out, none of the methods described in the articles so far can capture nuances in relationships beyond the structural configuration, and this perspective might prove valuable for a deeper understanding of supply chains.

Author Contributions

Conceptualization, L.M.D.F.F. and G.F.; methodology, A.I.B. and C.C.; validation, L.M.D.F.F.; formal analysis, A.I.B. and C.C.; investigation, A.I.B. and C.C.; data curation, C.C.; writing—original draft preparation, A.I.B., C.C., G.F. and L.M.D.F.F.; visualization, A.I.B.; supervision, L.M.D.F.F. and G.F.; project administration, L.M.D.F.F.; funding acquisition, L.M.D.F.F. and G.F. All authors have read and agreed to the published version of the manuscript.

Funding

This research is sponsored by national funds through FCT—Fundação para a Ciência e a Tecnologia, under the projects UIDB/00285/2020 and LA/P/0112/2020. This research is financed by PRR—Recovery and Resilience Plan and by the Next Generation EU Funds, following NOTICE N.º 02/C05-i01/2022, Component 5—Capitalization and Business Innovation—Mobilizing Agendas for Business Innovation under the AM2R project “Mobilizing Agenda for Business Innovation in the Two Wheels Sector” (reference: 7253).

Data Availability Statement

No new data were created or analyzed in this study. Data sharing is not applicable to this article.

Conflicts of Interest

The authors declare no conflicts of interest.

Appendix A. Main Contributions of Analyzed Articles

AuthorsTitleYearJournalMain Contributions
Adami, Verschoore, and Sellitto
[29]
Structure and complexity in the six supply chains of the Brazilian wind turbine industry2021International Journal of Logistics ManagementProvides a set of metrics to characterize the structural configuration and complexity of supply chains.
Ashwood, Pilny,
Canfield, Jamila, and
Thomson
[18]
From Big Ag to Big Finance: a market network approach to power in agriculture2022Agriculture and Human ValuesNetwork approach to market power as a means to identify corporate financial relationships through network structure, dependency across sectors, and
key players (like finance).
Brinkley, Manser, and Pesci
[36]
Growing pains in local food systems: a longitudinal social network analysis of local food marketing in Baltimore County, Maryland, and Chester County, Pennsylvania2021Agriculture and Human ValuesLongitudinal SNA approach to compare the evolution of two local food systems, from growth to decay, providing a new understanding of the social networks behind local food markets.
Cai, Huang, Tan, Jiang, Zhou, and Lu
[15]
Decoding the complexity of large-scale pork supply chain networks in China2020Industrial Management and Data SystemsDescribes and characterizes the nationwide pork supply chain networks in China with large-scale, reliable empirical data. The use of MSC and effective distance can guide the implementation of risk-based control programs for diseases and contamination of PSCNs.
Copping, Kuchai, Hattam, Paszkiewicz, Albadra, Shepherd, Burat, and Coley
[30]
Understanding material and supplier networks in the construction of disaster-relief shelters: the feasibility of using social network analysis as a decision-making tool2022Journal of Humanitarian Logistics and Supply Chain ManagementRepresents the first attempt to theorize and empirically investigate supply networks using SNA in a post-disaster reconstruction context.
Du and Zhang
[37]
Supply network position, digital transformation, and innovation performance: Evidence from listed Chinese manufacturing firms2022PLoS ONEAnalyzes the impact of supply chain relationships and metrics on innovation performance.
Foti and Timpanaro
[23]
Relationships, sustainability, and agri-food purchasing behavior in farmer markets in Italy2021British Food JournalDemonstrates how alternative food systems can become a useful model for large enterprises that are committed to rebuilding their business strategy to overcome the current crisis.
Jankovic-Zugic, Medic, Pavlovic, Todorovic, and Rakic
[17]
Servitization 4.0 as a Trigger for Sustainable Business: Evidence from the Automotive Digital Supply Chain2023Sustainability (Switzerland)Investigates the relationships between deliveries of digital services in the supply chains of the automotive industry.
Kang and Oh
[10]
The configuration and evolution of the Korean automotive supply
network: an empirical study based on k-core network analysis
2023Operations Management ResearchPresents the k-core, a new method to analyze a network’s structure, confirming the structure and evolution of the actual supply network from a macroscopic perspective, and identifying key suppliers that can directly or indirectly affect the company’s performance.
Kazemian, Torabi, Zobel, Li, and Baghersad
[19]
A multi-attribute supply chain network resilience assessment framework based on SNA-inspired indicators2022Operational ResearchProposes a framework to assess the resilience of a supply chain at the network level based on quantifying the supply chain networks’ structural factors and their relationships to different resilience strategies. Adopts network factors from SNA literature.
Laari, Wetzel, Töyli, and Solakivi
[20]
Leveraging supply chain networks for sustainability beyond corporate
boundaries: Explorative structural network analysis
2022Journal of Cleaner ProductionInvestigates the structural characteristics of node- (company) and network-level networks and their implications for sustainability.
Lau, Kajikawa, and Sharif
[38]
The roles of supply network centralities in firm performance and the moderating effects of reputation and export-orientation2020Production Planning and ControlExplores how supply network degree, closeness, and betweenness centralities affect companies’ performances, and the moderating effects of organizational reputation.
Le, Oláh, and Pakurár
[21]
Network Interactions of Global Supply Chain Members2021Journal of Business Economics and ManagementQuantifies the cooperation of each member of the supply chain, and evaluates and visualizes their effects within information-sharing systems to support policymakers in making their decisions regarding supply chain management.
Marcinkowski
[35]
Humanitarian Actors’ Cooperation Network in the Social Sustainability Context-Evidence from Poland2022SustainabilityThe research conducted among Polish humanitarian organizations suggests the possibility of integrating and synchronizing activities during humanitarian crises.
Marques and Manzanares
[39]
Towards social network metrics for supply network circularity2023International Journal of Operations and Production ManagementUses social network analysis (SNA) to depict how the shift from linear to circular not only leads to higher rates of resource economy, repair, and recycling but also reshapes governance dynamics and supply networks.
Parviziomran and Elliot
[40]
The effects of bargaining power on trade credit in a supply network2023Journal of Purchasing and Supply ManagementDevelops a multi-tier supply network model, rooted in social network theory, to evaluate the effect of bargaining power on trade credit and to track the effect of buyers’ trade credit on suppliers’ trade credit. Applies social network analysis to measure companies’ bargaining power in the supply network of Hennes & Mauritz AB (H&M, the Swedish clothing retailer).
Pedroza-Gutiérrez and Hernández
[41]
Social Networks and Supply Chain Management in Fish Trade2020SAGE OpenBuilds a theoretical framework to analyze the elements of network structure and the relationships within a seafood supply chain. Provides new arguments for the relationship between the pattern of interrelationships and the efficiency of a supply chain. Emphasizes the need to combine quantitative and qualitative analyses to understand and explain real-life supply networks.
Schlund, Schulte, and Sprenger
[32]
The who is who of a hydrogen market ramp-up: A stakeholder analysis for Germany2022Renewable and Sustainable Energy ReviewsConducts a stakeholder analysis for Germany with a focus on the market ramp-up period. Interviews with hydrogen experts, literature, and stakeholders from real-world hydrogen research and demonstration projects are analyzed with qualitative content analysis and social network analysis. Stakeholder groups are identified and defined accordingly. The results indicate that established stakeholders’ roles will significantly change in a future hydrogen market.
Seiler, Papanagnou, and Scarf
[22]
The relationship between financial performance and the position of businesses in supply chain networks2020International Journal of Production EconomicsInvestigates how the network position of organizations in an extended supply chain network impacts on their financial performance.
Shaharudin, Fernando
[44]
Cold supply chain of leafy green vegetables: a social network analysis approach2023Journal of Science and Technology Policy ManagementEstablishes the conceptual indicators based on best practices and outcomes for the cold supply chain. Argues that cold supply chain management and performance should be monitored independently. The theory of technological adoption can be expanded to include the nature of the product as a driver. Establishes cold chain best practices based on a perishable supply chain perspective.
Shao, Li, Yu, Han, and Meng
[34]
Collaborative Evolution Mechanism and Simulation of Construction Waste Recycling Stakeholders Based on Social Network2022BuildingsAnalyzes the factors that influence the use of construction waste, determines the key influence factors and the stakeholders in the process of using this waste resource, and applies social network analysis method to identify core stakeholders.
Shen, Chang, Kim, and Julian
[33]
Challenges to maintaining disaster relief supply chains in island communities: disaster preparedness and response in Honolulu, Hawai’i2022Natural HazardsApplies a mixed-methods approach to investigate the challenges of maintaining disaster relief supply chains in Honolulu in the face of emerging risks.
Simpson, Tacheva, Kao
[25]
Semi-directedness: New network concepts for supply chain research2023International Journal of Production EconomicsCharacterizes complex supply network relationships, by proposing that the ontology of network analysis be expanded to recognize the new concept of a semi-directed network. It demonstrates the validity and the value of this construct through a range of applications using 21 years of industrial data.
Tang, Wang, Miao, and Zhang
[16]
Managing Cost-Based Risks in Construction Supply Chains: A Stakeholder-Based Dynamic Social Network Perspective2020ComplexityEmploys social network analysis (SNA) to explore the key indicators of cost-related risks within the supply chain and identify the key risks and stakeholders across four project stages: the planning start-up stage, the design preparation stage, the construction period, and the operations and maintenance period.
Van Der Ham, Van Merode, Ruwaard, and Van Raak
[31]
Identifying integration and differentiation in a Hospital’s logistical system: a social network analysis of a case study2020BMC Health Services ResearchReveals the network structure of a hospital. The cross-functional collaboration, the integration found, and the position of managers, coordinators, nurses, and doctors. It suggest a possible gap between organizational perspectives in hospitals and reality. Sets a basis for further research that should focus on the relation between network structure and performance, on how integration is achieved, and in what way the concepts and social network analysis of organization theory could be used in conjunction with each other.
Wallmann and Gerschberger
[42]
The association between network centrality measures and supply chain performance: The case of distribution networks2021Procedia Computer ScienceConfirms that network theory applies to distribution networks, i.e., that network structure influences the performance of network nodes.
Wang, Gong, and Liu
[28]
Risk Network Evaluation of Prefabricated Building Projects in Underdeveloped Areas: A Case Study in Qinghai2022SustainabilityDevelops a risk network of PBPs, and nine core risk factors and five key risk relationships are identified. Risk effect detection reveals the effectiveness of risk response strategies.
Yan, Wang, Zhao, and Zhang
[12]
Spatial structure and influencing factors of regional city supply networks in manufacturing: A case study of Shandong, China2023Frontiers in Environmental ScienceExplores the spatial characteristics of city supply networks within Shandong using the indexes of degree centrality, closeness centrality, betweenness centrality, eigenvector centrality, and a community detection algorithm using the social network analysis (SNA) method and ArcGIS software. Investigates the factors influencing city supply networks through the correlation and regression of the quadratic assignment procedure (QAP).
Yuan, Li Z, Li X, and Luo
[43]
Managing stakeholder-associated risks and their interactions in the life cycle of prefabricated building projects: A social network analysis approach2021Journal of Cleaner ProductionEmploys social network analysis (SNA) to establish a risk network throughout the PBP life cycle to prioritize stakeholder-associated risks and risk interactions. Stakeholder-associated risks in the life cycle of PBPs were investigated based on a systematic literature review and interviews with critical stakeholders.
Zhou, Yip, Ren, and To
[24]
An Interaction Investigation of the Contributing Factors to the Bullwhip Effect Using a Bi-Level Social Network Analysis Approach2020IEEE AccessIdentifies the factors influencing the bullwhip effect in a supply chain and the interactive relationships among them. Establishes a bi-level bullwhip effect analysis model to evaluate the causes of the bullwhip effect at different levels by using a social network analysis approach.

References

  1. Wang, C. A bibliometric analysis of the application of social network analysis in supply chain management. LogForum 2022, 18, 123–136. [Google Scholar] [CrossRef]
  2. Miyake, D.I.; Silveira, A.; Junior, T.; Favaro, C. Supply chain mapping initiatives in the Brazilian automotive industry: Challenges and opportunities. J. Oper. Supply Chain Manag. 2010, 3, 79–97. [Google Scholar] [CrossRef]
  3. Jain, S.; Jain, V.; Sakhuja, S. Comparing third-party logistics network and fourth-party logistics network using social network analysis approach. Int. J. Bus. Forecast. Mark. Intell. 2019, 5, 205–222. [Google Scholar] [CrossRef]
  4. Mubarik, M.S.; Naghavi, N.; Mubarik, M.; Kusi-Sarpong, S.; Khan, S.A.; Zaman, S.I.; Kazmi, S.H.A. Resilience and cleaner production in industry 4.0: Role of supply chain mapping and visibility. J. Clean. Prod. 2021, 292, 126058. [Google Scholar] [CrossRef]
  5. MacCarthy, B.L.; Ahmed, W.A.H.; Demirel, G. Mapping the supply chain: Why, what and how? Int. J. Prod. Econ. 2022, 250, 108688. [Google Scholar] [CrossRef]
  6. Han, Y.; Caldwell, N.D.; Ghadge, A. Social network analysis in operations and supply chain management: A review and revised research agenda. Int. J. Oper. Prod. 2020, 40, 1153–1176. [Google Scholar] [CrossRef]
  7. Kim, Y.; Choi, T.Y.; Yan, T.; Dooley, K. Structural investigation of supply networks: A social network analysis approach. J. Oper. Manag. 2011, 29, 194–211. [Google Scholar] [CrossRef]
  8. Carter, C.R.; Ellram, L.M.; Tate, W. The Use of Social Network Analysis in Logistics Research. J. Bus. Logist. 2007, 28, 137–168. [Google Scholar] [CrossRef]
  9. Borgatti, S.P.; Li, X. On social network analysis in a supply chain context. J. Supply Chain Manag. 2009, 45, 5–22. [Google Scholar] [CrossRef]
  10. Kang, A.; Oh, J. The configuration and evolution of Korean automotive supply network: An empirical study based on k-core network analysis. Oper. Manag. Res. 2023, 16, 1251–1270. [Google Scholar] [CrossRef]
  11. Handfield, R.B.; Graham, G.; Burns, L. Corona virus, tariffs, trade wars and supply chain evolutionary design. Int. J. Oper. Prod. 2020, 40, 1649–1660. [Google Scholar] [CrossRef]
  12. Yan, Y.; Wang, X.; Zhao, S.; Zhang, Y. Spatial structure and influencing factors of regional city supply networks in manufacturing: A case study of Shandong, China. Front. Environ. Sci. 2023, 11, 131. [Google Scholar] [CrossRef]
  13. Wichmann, B.K.; Kaufmann, L. Social network analysis in supply chain management research: Social network analysis. Int. J. Phys. Distrib. Logist. Manag. 2016, 46, 740–762. [Google Scholar] [CrossRef]
  14. Anugerah, A.R.; Muttaqin, P.S.; Trinarningsih, W. Social network analysis in business and management research: A bibliometric analysis of the research trend and performance from 2001 to 2020. Heliyon 2022, 8, e09270. [Google Scholar] [CrossRef]
  15. Cai, M.; Huang, G.; Tan, Y.; Jiang, J.; Zhou, Z.; Lu, X. Decoding the complexity of large-scale pork supply chain networks in China. Ind. Manag. Data Syst. 2020, 120, 1483–1500. [Google Scholar] [CrossRef]
  16. Tang, H.; Wang, G.; Miao, Y.; Zhang, P. Managing Cost-Based Risks in Construction Supply Chains: A Stakeholder-Based Dynamic Social Network Perspective. Complexity 2020, 2020, 8545839. [Google Scholar] [CrossRef]
  17. Jankovic-Zugic, A.; Medic, N.; Pavlovic, M.; Todorovic, T.; Rakic, S. Servitization 4.0 as a Trigger for Sustainable Business: Evidence from Automotive Digital Supply Chain. Sustainability 2023, 15, 2217. [Google Scholar] [CrossRef]
  18. Ashwood, L.; Pilny, A.; Canfield, J.; Jamila, M.; Thomson, R. From Big Ag to Big Finance: A market network approach to power in agriculture. Agric. Hum. Values 2022, 39, 1421–1434. [Google Scholar] [CrossRef]
  19. Kazemian, I.; Torabi, S.A.; Zobel, C.W.; Li, Y.; Baghersad, M. A multi-attribute supply chain network resilience assessment framework based on SNA-inspired indicators. Oper. Res. 2022, 22, 1853–1883. [Google Scholar] [CrossRef]
  20. Laari, S.; Wetzel, P.; Töyli, J.; Solakivi, T. Leveraging supply chain networks for sustainability beyond corporate boundaries: Explorative structural network analysis. J. Clean. Prod. 2022, 377, 134475. [Google Scholar] [CrossRef]
  21. Le, T.D.C.; Oláh, J.; Pakurár, M. Network interactions of global supply chain members. J. Bus. Econ. Manag. 2021, 22, 1593–1613. [Google Scholar] [CrossRef]
  22. Seiler, A.; Papanagnou, C.; Scarf, P. On the relationship between financial performance and position of businesses in supply chain networks. Int. J. Prod. Econ. 2020, 227, 107690. [Google Scholar] [CrossRef]
  23. Foti, V.T.; Timpanaro, G. Relationships, sustainability and agri-food purchasing behaviour in farmer markets in Italy. Br. Food J. 2021, 123, 428–453. [Google Scholar] [CrossRef]
  24. Zhou, H.; Yip, W.S.; Ren, J.; To, S. An interaction investigation of the contributing factors of the bullwhip effect using a bi-level social network analysis approach. IEEE Access 2020, 8, 208737–208752. [Google Scholar] [CrossRef]
  25. Simpson, N.C.; Tacheva, Z.; Kao, T.W. Semi-directedness: New network concepts for supply chain research. Int. J. Prod. Econ. 2023, 256, 108753. [Google Scholar] [CrossRef]
  26. Denyer, D.; Tranfield, D. The Sage Handbook of Organizational Research Methods; SAGE Publications Ltd.: London, UK, 2009; pp. 671–689. [Google Scholar]
  27. Durach, C.F.; Kembro, J.; Wieland, A. A New Paradigm for Systematic Literature Reviews in Supply Chain Management. J. Supply Chain Manag. 2017, 53, 67–85. [Google Scholar] [CrossRef]
  28. Wang, Q.; Gong, Z.; Liu, C. Risk Network Evaluation of Prefabricated Building Projects in Underdeveloped Areas: A Case Study in Qinghai. Sustainability 2022, 14, 6335. [Google Scholar] [CrossRef]
  29. Adami, V.S.; Verschoore, J.R.; Sellitto, M.A. Structure and complexity in six supply chains of the Brazilian wind turbine industry. Int. J. Logist. Manag. 2021, 32, 23–39. [Google Scholar] [CrossRef]
  30. Copping, A.; Kuchai, N.; Hattam, L.; Paszkiewicz, N.; Albadra, D.; Shepherd, P.; Burat, E.S.; Coley, D. Understanding material and supplier networks in the construction of disaster-relief shelters: The feasibility of using social network analysis as a decision-making tool. J. Humanit. Logist. Supply Chain Manag. 2022, 12, 2042–6747. [Google Scholar] [CrossRef]
  31. Van Der Ham, A.; Van Merode, F.; Ruwaard, D.; Van Raak, A. Identifying integration and differentiation in a Hospital’s logistical system: A social network analysis of a case study. BMC Health Serv Res. 2020, 20, 857. [Google Scholar] [CrossRef]
  32. Schlund, D.; Schulte, S.; Sprenger, T. The who’s who of a hydrogen market ramp-up: A stakeholder analysis for Germany. Renew. Sust. Energy Rev. 2022, 154, 111810. [Google Scholar] [CrossRef]
  33. Shen, S.; Chang, R.H.; Kim, K.; Julian, M. Challenges to maintaining disaster relief supply chains in island communities: Disaster preparedness and response in Honolulu, Hawai’i. Natural Hazards 2022, 114, 1829–1855. [Google Scholar] [CrossRef]
  34. Shao, Z.; Li, M.; Yu, D.; Han, C.; Meng, L. Collaborative Evolution Mechanism and Simulation of Construction Waste Recycling Stakeholders Based on Social Network. Buildings 2022, 12, 2255. [Google Scholar] [CrossRef]
  35. Marcinkowski, J. Humanitarian Actors’ Cooperation Network in the Social Sustainability Context—Evidence from Poland. Sustainability 2022, 14, 5492. [Google Scholar] [CrossRef]
  36. Brinkley, C.; Manser, G.M.; Pesci, S. Growing pains in local food systems: A longitudinal social network analysis on local food marketing in Baltimore County, Maryland and Chester County, Pennsylvania. Agric. Hum. Values 2021, 38, 911–927. [Google Scholar] [CrossRef]
  37. Du, C.; Zhang, Q. Supply network position, digital transformation and innovation performance: Evidence from listed Chinese manufacturing firms. PLoS ONE 2022, 17, e279133. [Google Scholar] [CrossRef] [PubMed]
  38. Lau, A.K.W.; Kajikawa, Y.; Sharif, N. The roles of supply network centralities in firm performance and the moderating effects of reputation and export-orientation. Prod. Plan. Control 2020, 31, 1110–1127. [Google Scholar] [CrossRef]
  39. Marques, L.; Manzanares, M.D. Towards social network metrics for supply network circularity. Int. J. Oper. Prod. Manag. 2022, 43, 595–618. [Google Scholar] [CrossRef]
  40. Parviziomran, E.; Elliot, V. The effects of bargaining power on trade credit in a supply network. J. Purch. Supply Manag. 2023, 29, 100818. [Google Scholar] [CrossRef]
  41. Pedroza-Gutiérrez, C.; Hernández, J.M. Social Networks and Supply Chain Management in Fish Trade. Sage Open 2020, 10, 2158244020931815. [Google Scholar] [CrossRef]
  42. Wallmann, C.; Gerschberger, M. The association between network centrality measures and supply chain performance: The case of distribution networks. Procedia Comput. Sci. 2021, 180, 172–179. [Google Scholar] [CrossRef]
  43. Yuan, M.; Li, Z.; Li, X.; Luo, X. Managing stakeholder-associated risks and their interactions in the life cycle of prefabricated building projects: A social network analysis approach. J. Clean Prod. 2021, 323, 129102. [Google Scholar] [CrossRef]
  44. Shaharudin, M.; Fernando, Y. Cold supply chain of leafy green vegetables: A social network analysis approach. J. Sci. Technol. Policy Manag. 2023; ahead-of-print. [Google Scholar] [CrossRef]
  45. Fouad, H.; Rego, N. Centrality Measures in Supply Chain Management Research. IFAC-PapersOnLine 2022, 55, 2085–2090. [Google Scholar] [CrossRef]
  46. Qian, C.; Seuring, S.; Wagner, R. A review of inter-firm relationship quality in supply chains. J. Bus. Ind. Mark. 2021, 36, 2187–2200. [Google Scholar] [CrossRef]
  47. Alinaghian, L.; Kim, Y.; Srai, J. A relational embeddedness perspective on dynamic capabilities: A grounded investigation of buyer-supplier routines. Ind. Mark. Manag. 2020, 85, 110–125. [Google Scholar] [CrossRef]
Figure 1. The Study’s Location, Selection, and Evaluation Process.
Logistics 08 00015 g001
Figure 2. Number of Articles per Publication Year.
Logistics 08 00015 g002
Figure 3. Areas of application.
Logistics 08 00015 g003
Figure 4. Data Sources.
Logistics 08 00015 g004
Table 1. Extraction template for content analysis.
ItemDescription
AuthorsAuthors of the article
TitleTitle of the article
YearYear of publication
Source TitleJournal in which the article was published
CountryCountry of the 1st author’s affiliation
Main focusMain purpose of the study carried out in the article
SectorEconomic activity sector
Data sourceSource of data used (primary, secondary)
Time horizonCross-sectional/Longitudinal
SNA metricsSNA metrics applied in the article
SoftwareSoftware used to apply SNA methodology in the context of SCM
Table 2. SNA Metrics and Time Horizon.
NetworkNodeTime Horizon
AuthorsNetwork DensityNetwork
Centralization
Degree CentralityCloseness CentralityBetweenness CentralityCS aL b
Adami, Verschoore, and Sellitto
[29]
X XX
Ashwood, Pilny, Canfield, Jamila, and Thomson
[18]
XXXX
Brinkley, Manser, and Pesci
[36]
X X
Cai, Huang, Tan, Jiang, Zhou, and Lu
[15]
XXX X X
Copping, Kuchai, Hattam, Paszkiewicz, Albadra, Shepherd, Burat, and Coley
[30]
XXXX
Du and Zhang
[37]
X X
Foti and Timpanaro
[23]
X XXXX
Van Der Ham, Van Merode, Ruwaard, and Van Raak
[31]
X X X
Jankovic-Zugic, Medic, Pavlovic, Todorovic, and Rakic
[17]
XXX X
Kang and Oh
[10]
X X
Kazemian, Torabi, Zobel, Li, and Baghersad
[19]
X XX
Laari, Wetzel, Töyli, and Solakivi
[20]
X XXXX
Lau, Kajikawa, and Sharif
[38]
XXXX
Le, Oláh, and Pakurár
[21]
XXX
Marcinkowski
[35]
X XXXX
Marques and Manzanares
[39]
X X X
Parviziomran and Elliot
[40]
X X
Pedroza-Gutiérrez and Hernández
[41]
X X
Schlund, Schulte, and Sprenger
[32]
X XX
Seiler, Papanagnou, and Scarf
[22]
XXXX
Shao, Li, Yu, Han, and Meng
[34]
XXXX
Shen, Chang, Kim, and Julian
[33]
XXX
Tang, Wang, Miao, and Zhang
[16]
X X X X
Wallmann and Gerschberger
[42]
X XX
Wang, Gong, and Liu
[28]
X X X
Yan, Wang, Zhao, and Zhang
[12]
XXXX
Yuan, Li Z, Li X, and Luo
[43]
X X X X
Zhou, Yip, Ren, and To
[24]
XXXX
Total112211322208
a CS: Cross-sectional; b L: Longitudinal.
Disclaimer/Publisher’s Note: The statements, opinions and data contained in all publications are solely those of the individual author(s) and contributor(s) and not of MDPI and/or the editor(s). MDPI and/or the editor(s) disclaim responsibility for any injury to people or property resulting from any ideas, methods, instructions or products referred to in the content.

