

Green Supply Chain Management: The Effect of Procurement Sustainability on Reverse Logistics
 , ,
, ,  ,
,  and
and
Abstract
:1. Introduction
2. Literature Review
3. Materials and Methods
3.1. Research Methods
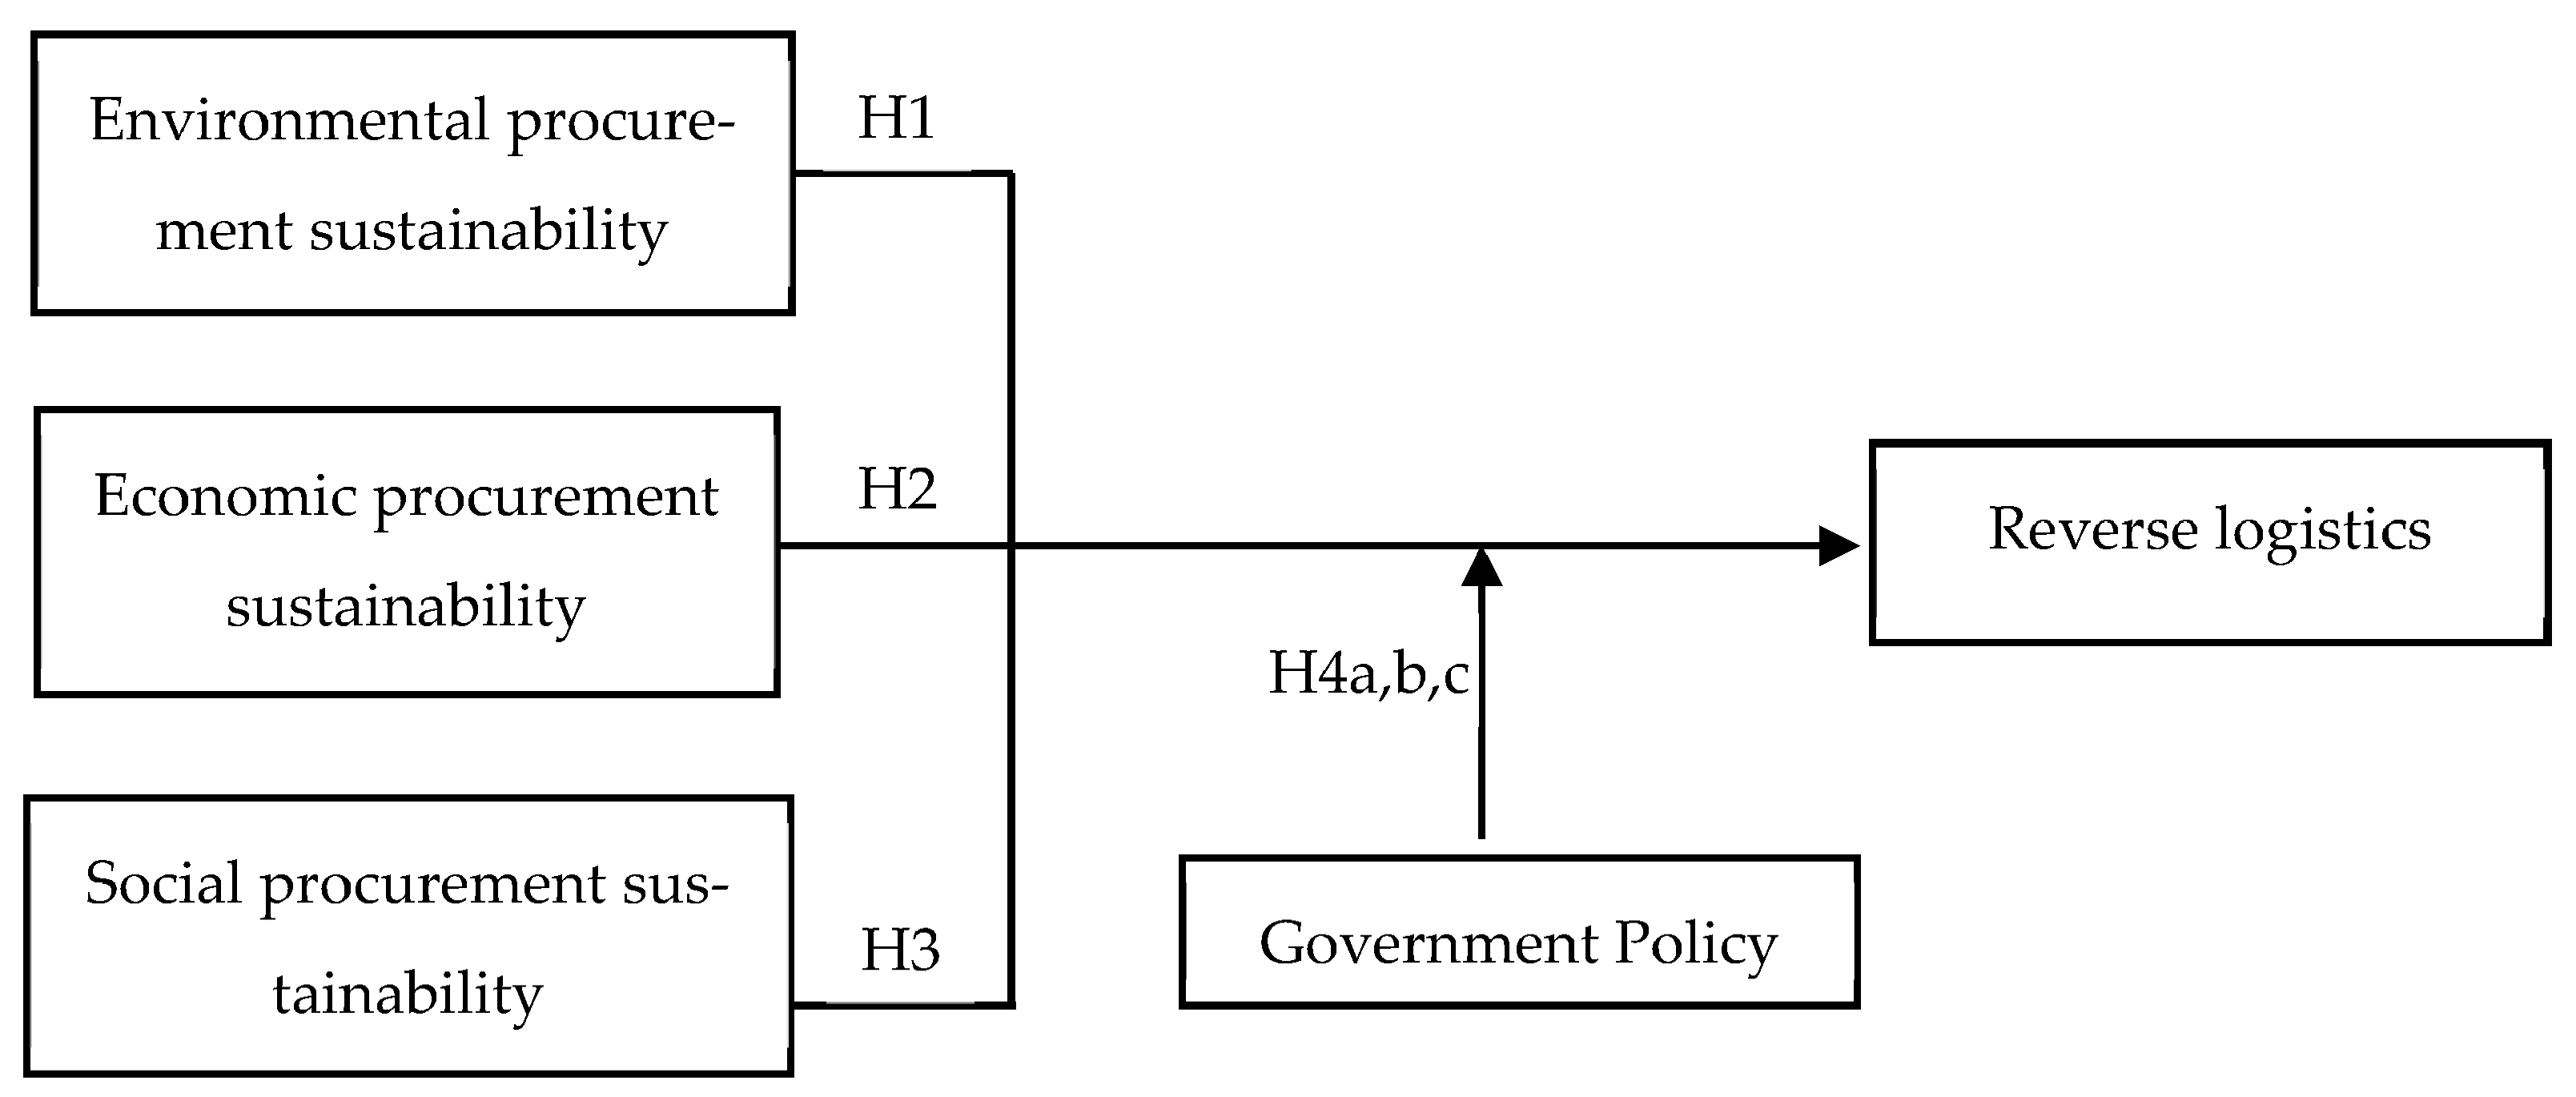
- To what extent does environmental procurement sustainability affect reverse logistics?
- To what extent does social procurement sustainability relate to reverse logistics?
- To what extent does economic procurement sustainability affect reverse logistics?
- To what extent does the moderating factor of government policy on procurement sustainability affect reverse logistics?
3.2. Data and Sources
4. Results
5. Discussion
6. Conclusions
Author Contributions
Funding
Data Availability Statement
Conflicts of Interest
References
- Carter, C.R.; Hatton, M.R.; Wu, C.; Chen, X. Sustainable supply chain management: Continuing evolution and future directions. Int. J. Phys. Distrib. Logist. Manag. 2020, 50, 122–146. [Google Scholar] [CrossRef]
- Waqas, M.; Dong, Q.-L.; Ahmad, N.; Zhu, Y.; Nadeem, M. Critical Barriers to Implementation of Reverse Logistics in the Manufacturing Industry: A Case Study of a Developing Country. Sustainability 2018, 10, 4202. [Google Scholar] [CrossRef] [Green Version]
- Touboulic, A.; Walker, H. Theories in sustainable supply chain management: A structured literature review. Int. J. Phys. Distrib. Logist. Manag. 2015, 45, 16–42. [Google Scholar] [CrossRef]
- Dey, A.; LaGuardia, P.; Srinivasan, M. Building sustainability in logistics operations: A research agenda. Manag. Res. Rev. 2011, 34, 1237–1259. [Google Scholar] [CrossRef] [Green Version]
- Hussein, M.; Eltoukhy, A.E.; Karam, A.; Shaban, I.A.; Zayed, T. Modelling in off-site construction supply chain management: A review and future directions for sustainable modular integrated construction. J. Clean. Prod. 2021, 310, 127503. [Google Scholar] [CrossRef]
- Silva, D.A.L.; Renó, G.W.S.; Sevegnani, G.; Sevegnani, T.B.; Truzzi, O.M.S. Comparison of disposable and returnable packaging: A case study of reverse logistics in Brazil. J. Clean. Prod. 2013, 47, 377–387. [Google Scholar] [CrossRef]
- Ganesh Kumar, R.; Ashlin Nimo, J.R. A conceptual framework for reverse logistics performance and innovation. Int. J. Supply Chain. Manag. 2020, 9, 430–436. [Google Scholar] [CrossRef]
- Mahadevan, K. Collaboration in reverse: A conceptual framework for reverse logistics operations. Int. J. Prod. Perform. Manag. 2019, 68, 482–504. [Google Scholar] [CrossRef]
- Shekarian, E.; Ijadi, B.; Zare, A.; Majava, J. Sustainable Supply Chain Management: A Comprehensive Systematic Review of Industrial Practices. Sustainability 2022, 14, 7892. [Google Scholar] [CrossRef]
- Stverkova, H.; Pohludka, M.; Kurowska-Pysz, J.; Szczepańska-Woszczyna, K. Cross-border enterprepreneurship in euroregion beskydy. [Transgraniczna przedsiębiorczość w euroregionie beskidów]. Pol. J. Manag. Stud. 2018, 18, 324–337. [Google Scholar] [CrossRef]
- Oláh, J.; Hidayat, Y.A.; Dacko-Pikiewicz, Z.; Hasan, M.; Popp, J. Inter-Organizational Trust on Financial Performance: Proposing Innovation as a Mediating Variable to Sustain in a Disruptive Era. Sustainability 2021, 13, 9947. [Google Scholar] [CrossRef]
- World Economic Forum. Available online: https://www.weforum.org/ (accessed on 17 May 2023).
- Nielsen. How Brands Can Take the Lead on Sustainability. Available online: https://www.nielsen.com/eu/en/insights/report/2018/how-brands-can-take-the-lead-on-sustainability (accessed on 2 May 2023).
- European Commission. Directive 2012/19/EU of the European Parliament and of the Council of 4 July 2012 on Waste Electrical and Electronic Equipment. Available online: https://eur-lex.europa.eu/legal-content/EN/TXT/?uri=celex:32012L0019 (accessed on 25 April 2023).
- Guidhouse. Building a More Sustainable Future: The Role of Reverse Logistics. Available online: https://guidehouse.com/media/www/site/insights/sustainability/2019/guidehouse-reverse-logistics-final-web.pdf (accessed on 27 April 2023).
- Zinn, W.; Goldsby, T.J. Supply Chain Plasticity: Redesigning Supply Chains to Meet Major Environmental Change. J. Bus. Logist. 2019, 40, 184–186. [Google Scholar] [CrossRef]
- Veckalne, R.; Tambovceva, T. The Role of Digital Transformation in Education in Promoting Sustainable Development. Virtual Econ. 2022, 5, 65–86. [Google Scholar] [CrossRef]
- Ziabina, Y.; Dzwigol-Barosz, M. A Country’s Green Brand and the Social Responsibility of Business. Virtual Econ. 2022, 5, 31–49. [Google Scholar] [CrossRef]
- Didenko, I.; Volik, K.; Vasylieva, T.; Lyeonov, S.; Antoniuk, N. Environmental migration and country security: Theoretical analysis and empirical research. E3S Web Conf. 2021, 234, 00010. [Google Scholar] [CrossRef]
- Solesvik, M.Z.; Torgersen, M.; Andersson, G.; Valter, P. Green business models: Definitions, types, and life cycle analysis. Forum Sci. Oeconomia 2022, 10, 199–217. [Google Scholar] [CrossRef]
- Rozmiarek, M.; Nowacki, K.; Malchrowicz-Mośko, E.; Dacko-Pikiewicz, Z. Eco-Initiatives in Municipal Cultural Institutions as Examples of Activities for Sustainable Development: A Case Study of Poznan. Sustainability 2022, 14, 682. [Google Scholar] [CrossRef]
- Ziabina, Y.; Navickas, V. Innovations in Energy Efficiency Management: Role of Public Governance. Mark. Manag. Innov. 2022, 4, 218–227. [Google Scholar] [CrossRef]
- Matvieieva, Y.; Sulym, V.; Rosokhata, A.; Jasnikowski, A. Influence of Waste Incineration and Obtaining Energy from it to the Public Health for Certain Territories: A Bibliometric and Substantive Study. Health Econ. Manag. Rev. 2023, 4, 71–80. [Google Scholar] [CrossRef]
- Lee, C.; Lam, J.S.L. Managing reverse logistics to enhance sustainability of industrial marketing. Ind. Mark. Manag. 2012, 41, 589–598. [Google Scholar] [CrossRef]
- Chen, D.; Ignatius, J.; Sun, D.; Zhan, S.-L.; Zhou, C.; Marra, M.; Demirbag, M. Reverse logistics pricing strategy for a green supply chain: A view of customers’ environmental awareness. Int. J. Prod. Econ. 2019, 217, 197–210. [Google Scholar] [CrossRef] [Green Version]
- Elkington, J. Cannibals with Forks: The Triple Bottom Line of 21st Century Business; Capstone: Oxford, UK, 1997. [Google Scholar]
- Carter, C.R.; Rogers, D.S. A framework of sustainable supply chain management: Moving toward new theory. Int. J. Phys. Distrib. Logist. Manag. 2008, 38, 360–387. [Google Scholar] [CrossRef]
- Turrisi, M.; Bruccoleri, M.; Cannella, S. Impact of reverse logistics on supply chain performance. Int. J. Phys. Distrib. Logist. Manag. 2013, 43, 564–585. [Google Scholar] [CrossRef] [Green Version]
- Alnoor, A.; Eneizan, B.; Makhamreh, H.Z.; Rahoma, I.A. The Effect of Reverse Logistics on Sustainable Manufacturing. Int. J. Acad. Res. Account. Financ. Manag. Sci. 2019, 9, 71–79. [Google Scholar] [CrossRef]
- García-Rodríguez, F.J.; Castilla-Gutiérrez, C.; Bustos-Flores, C. Implementation of reverse logistics as a sustainable tool for raw material purchasing in developing countries: The case of Venezuela. Int. J. Prod. Econ. 2012, 141, 582–592. [Google Scholar] [CrossRef]
- Bing, X.; Groot, J.; Bloemhof-Ruwaard, J.M.; Vorst, J.G. Multimodal network design for sustainable household plastic recycling. Int. J. Phys. Distrib. Logist. Manag. 2013, 43, 452–477. [Google Scholar]
- Wondimu, S. Measuring Performance of Reverse Logistics System in Pet Bottles Recovery in Eabsco. Doctoral Dissertation, Addis Ababa University, Addis Ababa, Ethiopia, 2016. [Google Scholar]
- Corrêa, H.L.; Xavier, L.H. Concepts, design and implementation of Reverse Logistics Systems for Sustainable Supply Chains in Brazil. J. Oper. Supply Chain Manag. 2013, 6, 1–25. [Google Scholar] [CrossRef] [Green Version]
- Kumar, S.; Putnam, V. Cradle to cradle: Reverse logistics strategies and opportunities across three industry sectors. Int. J. Prod. Econ. 2008, 115, 305–315. [Google Scholar] [CrossRef]
- Zhu, Q.; Sarkis, J.; Lai, K.H. Confirmation of a measurement model for green supply chain management practices implementation. Int. J. Prod. Econ. 2008, 111, 261–273. [Google Scholar] [CrossRef]
- Govindan, K.; Soleimani, H.; Kannan, D. Reverse logistics and closed-loop supply chain: A comprehensive review to explore the future. Eur. J. Oper. Res. 2015, 240, 603–626. [Google Scholar] [CrossRef] [Green Version]
- Gold, S.; Seuring, S.; Beske, P. Sustainable supply chain management and inter-organizational resources: A literature review. Corp. Soc. Responsib. Environ. Manag. 2009, 17, 230–245. [Google Scholar] [CrossRef]
- Hair, F.J., Jr.; Sarstedt, M.; Hopkins, L.; Kuppelwieser, V. Partial Least Squares Structural Equation Modeling (PLS-SEM): An Emerging Tool in Business Research. Eur. Bus. Rev. 2014, 26, 106–121. [Google Scholar] [CrossRef]
- Hair, J.F.; Ringle, C.M.; Gudergan, S.P.; Fischer, A.; Nitzl, C.; Menictas, C. Partial least squares structural equation modeling-based discrete choice modeling: An illustration in modeling retailer choice. Bus. Res. 2018, 12, 115–142. [Google Scholar] [CrossRef] [Green Version]
- Fornell, C.; Larcker, D.F. Evaluating Structural Equation Models with Unobservable Variables and Measurement Error. J. Mark. Res. 1981, 18, 39–50. [Google Scholar] [CrossRef]
- Podsakoff, P.M.; MacKenzie, S.B.; Lee, J.-Y.; Podsakoff, N.P. Common method biases in behavioral research: A critical review of the literature and recommended remedies. J. Appl. Psychol. 2003, 88, 879–903. [Google Scholar] [CrossRef]
- Hair, J.F.; Hult, G.T.M.; Ringle, C.M.; Sarstedt, M. A Primer on Partial Least Squares Structural Equation Modeling (PLS-SEM), 2nd ed.; Sage Publications Inc.: Thousand Oaks, CA, USA, 2017. [Google Scholar]
- Bagozzi, R.P.; Yi, Y.; Phillips, L.W. Assessing Construct Validity in Organizational Research. Adm. Sci. Q. 1991, 36, 421. [Google Scholar] [CrossRef]
- Podsakoff, P.M.; Todor, W.D. Relationships between Leader Reward and Punishment Behavior and Group Processes and Productivity. J. Manag. 1985, 11, 55–73. [Google Scholar] [CrossRef]
- Taber, K.S. The Use of Cronbach’s Alpha When Developing and Reporting Research Instruments in Science Education. Res. Sci. Educ. 2018, 48, 1273–1296. [Google Scholar] [CrossRef] [Green Version]
- Hair, J.F., Jr.; Haddock, R.L.; Quinn, M.S. Multivariate Data Analysis with Readings; Prentice-Hall: Englewood Cliffs, NJ, USA, 1998. [Google Scholar]
- Rubio, S.; Jiménez-Parra, B. Reverse Logistics: Overview and Challenges for Supply Chain Management. Int. J. Eng. Bus. Manag. 2014, 6, 12. [Google Scholar] [CrossRef]
- Epstein, M.J.; Wisner, P.S. Using a Balanced Scorecard to Implement Sustainability. Environ. Qual. Manag. 2001, 11, 1–10. [Google Scholar] [CrossRef]
- Grabara, J.; Man, M.; Kolcun, M. The Benefits of Reverse Logistics. Int. Lett. Soc. Humanist. Sci. 2014, 26, 138–147. [Google Scholar] [CrossRef] [Green Version]
- Young, S.T.; Dhanda, K.K. Sustainability: Essentials for Business; Sage Publications: Thousand Oaks, CA, USA, 2013. [Google Scholar] [CrossRef]
- Elliot, A.J. The Hierarchical Model of Approach-Avoidance Motivation. Motiv. Emot. 2006, 30, 111–116. [Google Scholar] [CrossRef]
- Hasan, F.; Islam, M.R.; Ishrat, F. COVID-19 Pandemic Impact on the Supply Chains of UK-Based Multinational Manufacturing Companies. Bus. Ethic-Leadersh. 2022, 6, 44–67. [Google Scholar] [CrossRef]
- Boiko, A.; Kramarenko, O.; Mayboroda, T. Open Research Data in the Open Science Ecosystem and Business Environment. Bus. Ethics Leadersh. 2022, 6, 79–91. [Google Scholar] [CrossRef]
- Kolosok, S.; Kovalenko, Y.V. Factor Analysis of Energy Security: Net Import Dependency. Socioecon. Chall. 2022, 6, 138–146. [Google Scholar] [CrossRef]
- Chygryn, O.; Shevchenko, K. Energy industry development: Key trends and the core determinants. Socioecon. Chall. 2023, 7, 115–128. [Google Scholar] [CrossRef]
- Naseer, M.M.; Guo, Y.; Zhu, X. Stock Performance, Sector’s Nature and Macroeconomic Environment. Financ. Mark. Inst. Risks 2022, 6, 13–26. [Google Scholar] [CrossRef]
- Rosokhata, A.A.; Jasnikowski, A.; Kropyva, V.; Deryzemlia, M. Financial Market Trends as a Part of Regional Development: Manifestations of Behavioral Reactions and Impulses. Financ. Mark. Inst. Risks 2022, 6, 112–121. [Google Scholar] [CrossRef]
- Kolosok, S.; Saher, L.; Kovalenko, Y.; Delibasic, M. Renewable Energy and Energy Innovations: Examining Relationships Using Markov Switching Regression Model. Mark. Manag. Innov. 2022, 2, 151–160. [Google Scholar] [CrossRef]
- Iastremska, O.; Strokovych, H.; Gasimov, F. Relationship of Investment in Innovation and Logistics Activity in the Conditions of the Experience Economy Development. Mark. Manag. Innov. 2023, 14, 12–23. [Google Scholar] [CrossRef]
- Vakulenko, I.; Lieonov, H. Renewable Energy and Health: Bibliometric Review of Non-Medical Research. Health Econ. Manag. Rev. 2022, 3, 44–53. [Google Scholar] [CrossRef]
- Vostrykov, P.; Jura, A. Environmental Taxes Impact for the Population Health Protection: Cross-Country Analysis. Health Econ. Manag. Rev. 2022, 3, 35–45. [Google Scholar] [CrossRef]
- Didenko, I.; Volik, K.; Vasylieva, T.; Lyeonov, S.; Antoniuk, N. Migration, environment, and country safety: Analysis of touchpoints. In Proceedings of the The 5th International Conference on Energy, Environmental and Information System (ICENIS 2020), Kota Semarang, Indonesia, 12–13 August 2020; p. 03028. [Google Scholar] [CrossRef]
- Richnák, P.; Gubová, K. Green and reverse logistics in conditions of sustainable development in enterprises in Slovakia. Sustainability 2021, 13, 581. [Google Scholar] [CrossRef]
- Hyder, A.; Uddin, B.; Siddiqui, H.; Naeem, M.; Waheed, A. Mediation of Reverse Logistics in Sustainable Resources and Organizational Performance: Sustainable Resources and Organizational Performance. South Asian J. Oper. Logist. 2023, 2, 11–27. [Google Scholar] [CrossRef]
- Shahidzadeh, M.H.; Shokouhyar, S. Toward the closed-loop sustainability development model: A reverse logistics multi-criteria decision-making analysis. Environ. Dev. Sustain. 2023, 25, 4597–4689. [Google Scholar] [CrossRef]


| Symbols | Questions |
|---|---|
| Environmental sustainability | |
| EVS1 | The company has passed or is preparing to pass, ISO14001 (Environmental Management Series Standard) certification |
| EVS2 | The company exhibits a preferential selection of environmentally friendly products in its purchasing and supply behaviors (environmentally friendly products include green logo products and products with low energy consumption; recycling; products containing minimal or zero toxic substances; the use of green packaging or recyclable packaging of degrading products) |
| EVS3 | The concept of environmental protection is evident throughout the company’s design, procurement, production, sales, use, reuse, processing, and other processes |
| EVS4 | The company prefers its suppliers to have environmental certifications |
| EVS5 | The company actively shares good environmental practice experiences with its partners |
| Social sustainability | |
| SS1 | The company has adopted SA8000 (social responsibility standards) to regulate the company management’s behavior |
| SS2 | The company has established a healthy and safe management system |
| SS3 | The company focuses on improving the working environment and welfare benefits |
| SS4 | The company often engages in community charity work |
| SS5 | The company, when selecting partners, gives priority to those who comply with and support laws, regulations, and standards on social sustainability |
| Economic sustainability | |
| ECS1 | The company considers the costs of management, production, procurement, and other costs |
| ECS2 | In practice, the company considers the results of its behavior, e.g., whether it violates relevant laws and regulations, or whether it will result in potential punishment for the company |
| ECS3 | The company considers whether its behavior will damage the image of the company |
| ECS4 | In practice, the company not only considers short-term profits, but it also focuses on long-term profits |
| The government policy on environmental, social, and economic sustainability and reverse logistics | |
| GP1 | Lack of government-supportive policies for RL |
| GP2 | Changing regulations due to changing political climate |
| GP3 | Lack of regulatory restrictions |
| GP4 | Lack of enforceable laws on products’ return of end-of-life |
| GP5 | Lack of corporate social responsibility and ethical standards |
| GP6 | Company’s policies against RL |
| GP7 | Lack of clarity regarding sustainability |
| GP8 | Limited forecasting and planning in RL |
| Reverse logistics | |
| RL1 | Achieving objectives within reverse logistics contributes to achieving the organizational goals |
| RL2 | Reverse logistics is important for your company’s future success |
| RL3 | Reverse logistics is important for the functioning of your company |
| RL4 | Reverse logistics plays an important role in the strategy of your company |
| RL5 | High cost associated with reverse logistics |
| RL6 | Lack of information on its importance |
| RL7 | Uncertainties relating to product returns |
| RL8 | Lack of top management awareness of the importance of reverse logistics |
| RL9 | Lack of collaboration with supply chain partners in reverse logistics |
| RL10 | Customers’ negative perception of returning the products |
| Variable | Mean | St.D. | 1 | 2 | 3 | 4 | 5 |
|---|---|---|---|---|---|---|---|
| Economic Procurement Sustainability | 3.353 | 1.173 | 1.000 | ||||
| Environmental Procurement Sustainability | 2.927 | 1.115 | −0.001 | 1.000 | |||
| Government Policy | 3.329 | 1.122 | 0.858 | −0.037 | 1.000 | ||
| Reverse Logistics | 3.321 | 1.172 | 0.858 | −0.023 | 0.950 | 1.000 | |
| Social Procurement Sustainability | 3.406 | 1.132 | 0.837 | −0.082 | 0.949 | 0.958 | 1.000 |
| Component | Initial Eigenvalues | Extraction Sums of Squared Loadings | ||||
|---|---|---|---|---|---|---|
| Total | % of Variance | Cumulative % | Total | % of Variance | Cumulative % | |
| 1 | 12.873 | 39.010 | 39.010 | 12.873 | 39.010 | 39.010 |
| 2 | 2.805 | 8.501 | 47.511 | 2.805 | 8.501 | 47.511 |
| 3 | 2.758 | 8.357 | 55.868 | 2.758 | 8.357 | 55.868 |
| 4 | 2.168 | 6.570 | 62.439 | 2.168 | 6.570 | 62.439 |
| 5 | 1.834 | 5.557 | 67.996 | 1.834 | 5.557 | 67.996 |
| 6 | 1.467 | 4.446 | 72.442 | 1.467 | 4.446 | 72.442 |
| 7 | 1.270 | 3.850 | 76.291 | 1.270 | 3.850 | 76.291 |
| 8 | 1.152 | 3.490 | 79.782 | 1.152 | 3.490 | 79.782 |
| 9 | 1.141 | 3.456 | 83.238 | 1.141 | 3.456 | 83.238 |
| 10 | 0.982 | 2.976 | 86.214 | |||
| 11 | 0.838 | 2.540 | 88.753 | |||
| 12 | 0.730 | 2.212 | 90.965 | |||
| 13 | 0.609 | 1.845 | 92.810 | |||
| 14 | 0.591 | 1.792 | 94.602 | |||
| 15 | 0.494 | 1.496 | 96.098 | |||
| 16 | 0.362 | 1.097 | 97.195 | |||
| 17 | 0.326 | 0.989 | 98.184 | |||
| 18 | 0.288 | 0.872 | 99.056 | |||
| 19 | 0.172 | 0.523 | 99.578 | |||
| 20 | 0.081 | 0.244 | 99.822 | |||
| 21 | 0.033 | 0.100 | 99.922 | |||
| 22 | 0.020 | 0.060 | 99.982 | |||
| 23 | 0.006 | 0.018 | 100.000 | |||
| 24 | 1.36 × 10⁻¹⁵ | 4.120 × 10⁻¹⁵ | 100.000 | |||
| 25 | 1.123 × 10⁻¹⁵ | 3.402 × 10⁻¹⁵ | 100.000 | |||
| 26 | 4.751 × 10⁻¹⁶ | 1.440 × 10⁻¹⁵ | 100.000 | |||
| 27 | 1.058 × 10⁻¹⁶ | 3.206 × 10⁻¹⁶ | 100.000 | |||
| 28 | 1.238 × 10⁻¹⁷ | 3.751 × 10⁻¹⁷ | 100.000 | |||
| 29 | 4.857 × 10⁻¹⁸ | 1.472 × 10⁻¹⁷ | 100.000 | |||
| 30 | −5.261 × 10⁻¹⁷ | −1.594 × 10⁻¹⁶ | 100.000 | |||
| 31 | −7.859 × 10⁻¹⁶ | −2.382 × 10⁻¹⁵ | 100.000 | |||
| 32 | −1.520 × 10⁻¹⁵ | −4.607 × 10⁻¹⁵ | 100.000 | |||
| 33 | −1.767 × 10⁻¹⁵ | −5.355 × 10⁻¹⁵ | 100.000 | |||
| Constructs | Items | CA | CR | AVE | VIF | |
|---|---|---|---|---|---|---|
| Economic Procurement Sustainability | ECS1 | 0.727 | 0.745 | 0.853 | 0.660 | 1.379 |
| ECS2 | 0.854 | 1.540 | ||||
| ECS3 | 0.850 | 1.614 | ||||
| Environmental Procurement Sustainability | EVS2 | 0.916 | 0.725 | 0.877 | 0.782 | 1.478 |
| EVS5 | 0.851 | 1.478 | ||||
| Government Policy | GP1 | 0.808 | 0.792 | 0.842 | 0.524 | 2.150 |
| GP4 | 0.839 | 1.384 | ||||
| GP7 | 0.766 | 2.897 | ||||
| GP8 | 0.835 | 2.144 | ||||
| Reverse Logistics | RL3 | 0.800 | 0.852 | 0.895 | 0.630 | 1.058 |
| RL5 | 0.723 | 1.345 | ||||
| RL6 | 0.780 | 1.708 | ||||
| RL8 | 0.833 | 2.159 | ||||
| RL9 | 0.828 | 2.035 | ||||
| Social Procurement Sustainability | SS1 | 0.755 | 0.838 | 0.892 | 0.674 | 1.534 |
| SS2 | 0.846 | 1.772 | ||||
| SS3 | 0.827 | 2.197 | ||||
| SS5 | 0.851 | 2.202 | ||||
| Item | Economic Procurement Sustainability | Environmental Procurement Sustainability | Government Policy | Reverse Logistics | Social Procurement Sustainability |
|---|---|---|---|---|---|
| ECS1 | 0.727 | 0.029 | 0.629 | 0.517 | 0.500 |
| ECS2 | 0.854 | −0.103 | 0.791 | 0.797 | 0.826 |
| ECS3 | 0.850 | 0.089 | 0.662 | 0.734 | 0.666 |
| EVS2 | 0.014 | 0.914 | −0.043 | −0.022 | −0.095 |
| EVS5 | −0.020 | 0.853 | −0.018 | −0.017 | −0.044 |
| GP1 | 0.592 | 0.013 | 0.802 | 0.814 | 0.805 |
| GP2 | 0.726 | −0.002 | 0.623 | 0.521 | 0.513 |
| GP3 | 0.215 | −0.007 | 0.499 | 0.362 | 0.322 |
| GP4 | 0.854 | −0.103 | 0.791 | 0.797 | 0.826 |
| GP5 | 0.167 | 0.038 | 0.207 | 0.159 | 0.121 |
| GP6 | 0.277 | −0.047 | 0.482 | 0.288 | 0.326 |
| GP7 | 0.567 | 0.017 | 0.763 | 0.750 | 0.723 |
| GP8 | 0.706 | −0.057 | 0.790 | 0.793 | 0.816 |
| RL3 | 0.794 | 0.126 | 0.678 | 0.801 | 0.662 |
| RL5 | 0.580 | 0.017 | 0.758 | 0.722 | 0.732 |
| RL6 | 0.622 | −0.020 | 0.799 | 0.780 | 0.787 |
| RL8 | 0.641 | −0.051 | 0.771 | 0.833 | 0.802 |
| RL9 | 0.772 | −0.142 | 0.754 | 0.828 | 0.805 |
| SS1 | 0.555 | −0.019 | 0.726 | 0.715 | 0.755 |
| SS2 | 0.689 | −0.088 | 0.783 | 0.816 | 0.846 |
| SS3 | 0.639 | −0.024 | 0.813 | 0.784 | 0.827 |
| SS5 | 0.846 | −0.129 | 0.794 | 0.826 | 0.851 |
| Construct | 1 | 2 | 3 | 4 | 5 |
|---|---|---|---|---|---|
| Economic Procurement Sustainability | 0.912 | ||||
| Environmental Procurement Sustainability | −0.001 | 0.884 | |||
| Government Policy | 0.858 | −0.037 | 0.651 | ||
| Reverse Logistics | 0.858 | −0.023 | 0.350 | 0.794 | |
| Social Procurement Sustainability | 0.837 | −0.082 | 0.349 | 0.358 | 0.821 |
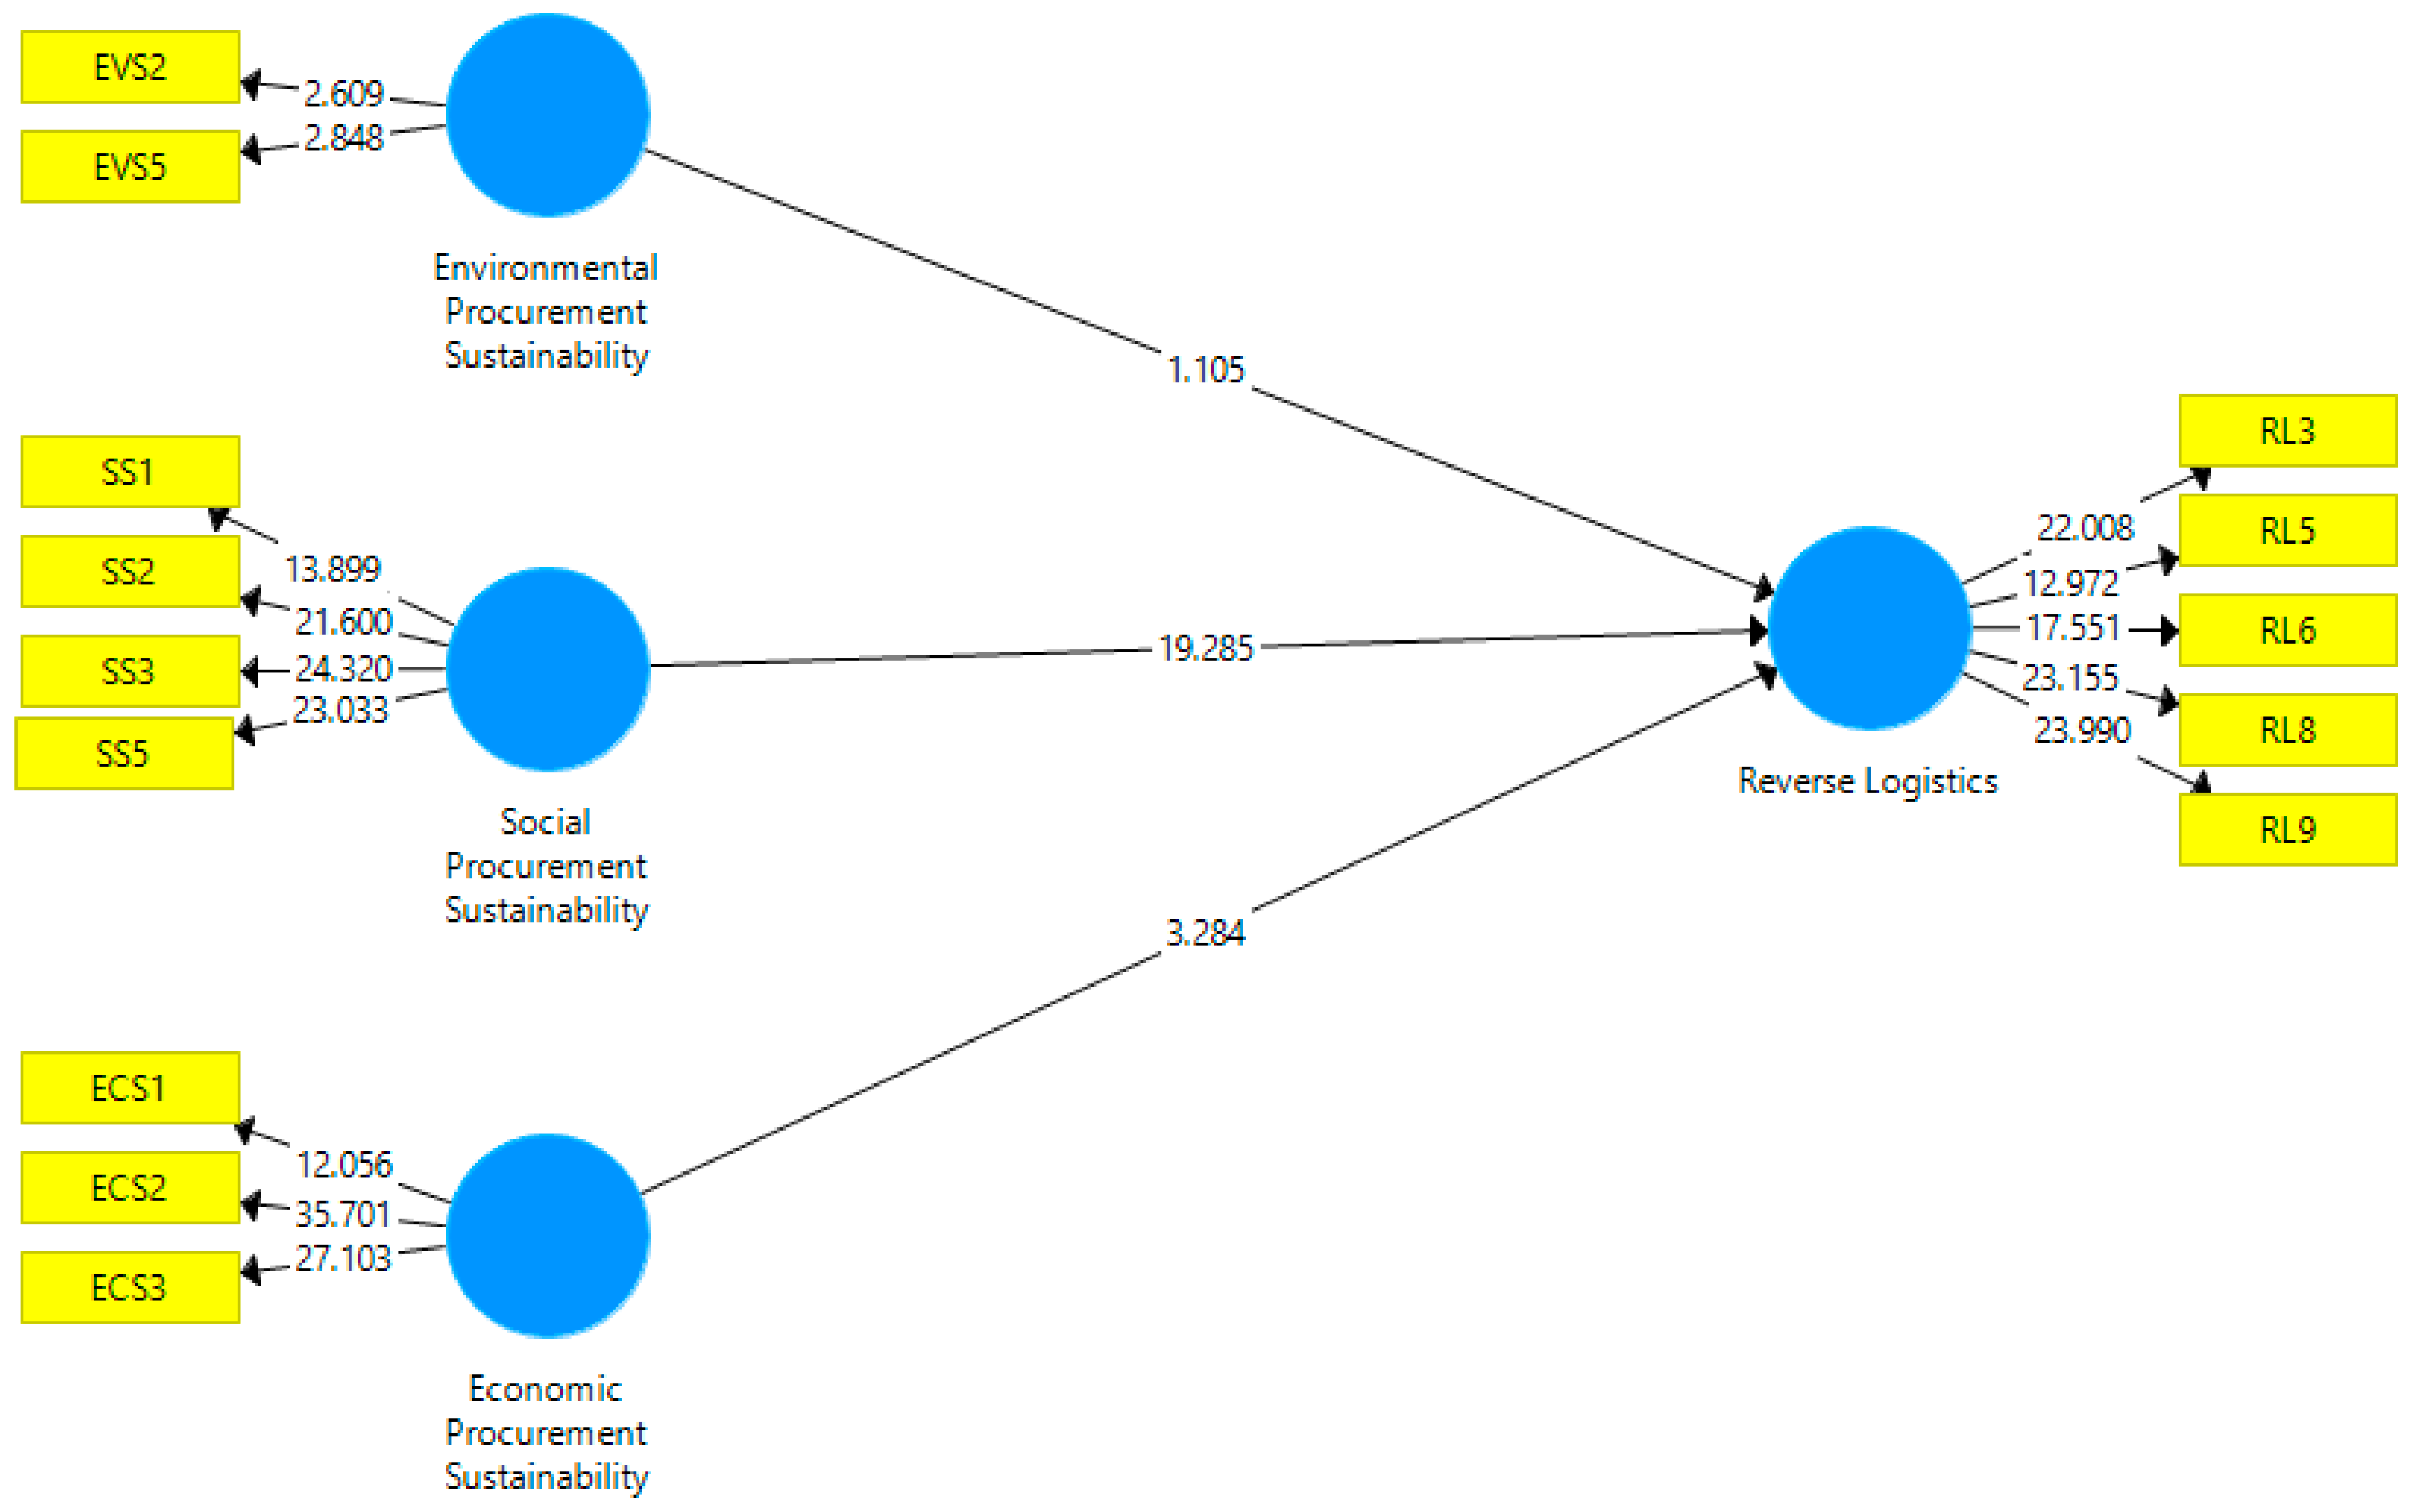
| Hypotheses | Path Coefficient | T Statistics | p-Value | Result |
|---|---|---|---|---|
| Economic Procurement Sustainability -> -> Reverse Logistics | 0.185 | 3.284 | 0.001 | Supported |
| Environmental Procurement Sustainability -> -> Reverse Logistics | 0.036 | 1.105 | 0.270 | Not supported |
| Social Procurement Sustainability -> -> Reverse Logistics | 0.807 | 19.285 | 0.000 | Supported |
| Paths | Effect | (Boot) SE | (Boot) LLCI | (Boot) ULCI |
|---|---|---|---|---|
| EVS → (EVS × GP) → RL | 0.258 | 0.036 | 0.229 | 0.088 |
| ECS → (ECS × GP) → RL | 0.561 | 0.053 | 0.655 | 0.866 |
| SC → (SC × GP) → RL | 0.368 | 0.073 | 0.325 | 0.611 |
Disclaimer/Publisher’s Note: The statements, opinions and data contained in all publications are solely those of the individual author(s) and contributor(s) and not of MDPI and/or the editor(s). MDPI and/or the editor(s) disclaim responsibility for any injury to people or property resulting from any ideas, methods, instructions or products referred to in the content. |
© 2023 by the authors. Licensee MDPI, Basel, Switzerland. This article is an open access article distributed under the terms and conditions of the Creative Commons Attribution (CC BY) license (https://creativecommons.org/licenses/by/4.0/).
Share and Cite
Letunovska, N.; Offei, F.A.; Junior, P.A.; Lyulyov, O.; Pimonenko, T.; Kwilinski, A. Green Supply Chain Management: The Effect of Procurement Sustainability on Reverse Logistics. Logistics 2023, 7, 47. https://doi.org/10.3390/logistics7030047
Letunovska N, Offei FA, Junior PA, Lyulyov O, Pimonenko T, Kwilinski A. Green Supply Chain Management: The Effect of Procurement Sustainability on Reverse Logistics. Logistics. 2023; 7(3):47. https://doi.org/10.3390/logistics7030047
Chicago/Turabian StyleLetunovska, Nataliia, Felix Amoako Offei, Prince Amoh Junior, Oleksii Lyulyov, Tetyana Pimonenko, and Aleksy Kwilinski. 2023. "Green Supply Chain Management: The Effect of Procurement Sustainability on Reverse Logistics" Logistics 7, no. 3: 47. https://doi.org/10.3390/logistics7030047