Article

Determining Factors for Supply Chain Services Provider Selection and Long-Term Relationship Maintenance: Evidence from Greece

by
Damianos P. Sakas
1,
Nikolaos T. Giannakopoulos
1,*,
Nikos Kanellos
1,
Christos Christopoulos
2 and
Kanellos S. Toudas
1
1
BICTEVAC Laboratory—Business Information and Communication Technologies in Value Chains Laboratory, Department of Agribusiness and Supply Chain Management, School of Applied Economics and Social Sciences, Agricultural University of Athens, 118 55 Athens, Greece
2
Global Operations Transformation & Excellence, Swissport International Ltd., Zurich, Switzerland
*
Author to whom correspondence should be addressed.
Logistics 2023, 7(4), 73; https://doi.org/10.3390/logistics7040073
Submission received: 7 August 2023 / Revised: 22 September 2023 / Accepted: 28 September 2023 / Published: 9 October 2023
(This article belongs to the Special Issue Sustainable Logistics in the New Era)

Abstract

:
Background: Due to increased globalization and its subsequent rise in competitiveness, the role of supply chain services (3PL) in managing logistics, reducing operational and non-operational costs, and managing customer and supplier relationships, have become of utmost importance. Customer-centric production has led to the development of a close relationship between production processes. Amidst all this, the demand for logistic services has dramatically increased, thus putting more pressure on firms for enhanced operational results, and leading to the outsourcing of their internal and external logistic activities. On the other hand, supply chain firms that provide 3PL services seek to enhance their sustainability and predict their customers’ demand. Methods: The authors collected quantitative data from 81 firms that operate in various industrial sectors in Greece. A questionnaire was sent for completion, in which firms could rate and evaluate various aspects that were discerned as important for deciding to cooperate with a 3PL service provider and maintain this cooperation in the long run. To extract the required outcomes, statistical analyses like categorical regression (CATREG) and MANOVA were utilized. Results: The demand for 3PL services was affected by 3PL service providers’ operational performance based on accuracy, reputation, and IT capabilities, while the customer firms’ intention for maintaining cooperation with 3PL service providers was affected by their reliability level, improved service efficiency, and trustworthiness. Conclusions: 3PL service providers should seek to improve the reputation, IT infrastructure, and accuracy of their firm's operations to have a continuous demand for their services. Apart from that, 3PL service providers to maintain the cooperation with their customers, need to enhance the levels of their services reliability and efficiency, while also creating a bond of trust with their existing customers.

1. Introduction

1.1. Logistics and Sustainable Supply Chain Management

Logistics describes the component of SCM that organizes, executes, and oversees the successful and efficient movement of supplies, goods, and data across the whole supply chain [1]. As a result, logistics management is operational in definition, whereas supply chain management is conceptual. To effectively satisfy the consumer, supply chain management is primarily concerned with customer service enhancement as well as cost minimization [2]. In the past few years, supply chain firms have attempted to behave greener and provide customers with environmentally friendly commodities and services. This situation has resulted in the birth of the green supply chain, which tries to emphasize methods that cause a supply chain to operate in an environmentally friendly manner.
In the setting of supply chains, one can apply the concept of all three growth foundations, including the ecosystem, economics, and society, all of which are critical factors in establishing global sustainability [3]. Sustainability involves guaranteeing the long-term viability and continuation of company operations whilst improving the foreseeable wellness of the entire system. Sustainability encompasses many more challenges than environmental degradation, which is sometimes conflated with it, like contamination, the conservation of resources, and elements of human existence including welfare, health, etc. [4].
The figurative recognition of the environment and business as interrelated structures that, when possible, preserve and recycle supplies and, as required, resist difficult conditions [5], is critical. Fiscal variables have an impact on the probability of finding natural resources and the pace of utilization of their novel supplies, and higher costs stimulate the development of mining and reclamation work [5]. Because of the rising scarcity of assets, supply chain firms have emerged that are involved with components for reuse, returned items for health or safety concerns, recycling, and goods for restoration [6]. Therefore, it can be noted that many factors related to the internal and external environment of supply chain firms tend to impact the demand for their services, affecting their sustainability.
The purpose of this paper is to analyze and discern the factors that lead firms to the decision to outsource their logistics, thus using 3PL services, as well as those that support firms’ decisions to maintain their cooperation with 3PL service providers. In short, this research will examine, from the demand side, the factors that lead firms in the Greek economy to use 3PL services, and the factors that affect their decision to maintain them. The selected firms operate in sectors where the usage of 3PL services is a common practice.
Hence, it has been discovered that the main factors that affect the decision of customer firms to outsource their logistics activities to a 3PL service provider are based on reputation, the accuracy of the 3PL service provider’s operational performance, and their level of IT capabilities. The demand of the customer firms for 3PL services is expressed by the years of presence in their industry sector and the period of use of such services. Moreover, the factors that affect the decision of firms to maintain their cooperation with 3PL service providers are their reliability level, their improved service efficiency, and their trustworthiness.
The novelty of this research lies in the fact that the authors adopted the same study and sample both for the analysis of the factors affecting the demand for 3PL services and for those that affect the decision to maintain them. Furthermore, the demand for 3PL services has been studied from the spectrum of the customer firms’ years of presence in their industry sector and the period of use of such services. The total of the 26 determinant factors underwent extensive statistical analysis, and from the MANOVA, it was discerned that less traditional and common ones emerged. As seen in the related literature presented below, the reputation, accuracy of operations, and the 3PL service providers’ capabilities for IT were key. The authors separated the factors that determine the demand for 3PL services and those that affect their decision to maintain their cooperation with 3PL service providers. The above action serves as a distinctive factor for the novelty of the present research, since, for the 3PL service providers cooperation maintenance, only firms that currently use these firms were contacted. Given the above, and based on the wide usage of quantitative research methods in the logistics sector, we established of the following research questions:
Research Question 1 (RQ1): 
“Which factors of 3PL services affect the industry sector and the number of employees of customer firms?”.
Research Question 2 (RQ2): 
“Which factors of 3PL services affect the usage and the type of 3PL services used by customer firms?”.
Research Question 3 (RQ3): 
“Which factors contribute more to the demand of customer firms for 3PL services?”.
Research Question 4 (RQ4): 
“Which factors contribute more to customer firms’ intention to maintain the usage of 3PL services?”.
Following the reference of the paper’s contribution, the authors present recent literature and research related to the demand for 3PL services, as well as the maintenance of collaboration with 3PL service providers (Table 1). The referred literature served as a basis for the deployment of the present study, fulfilling the need to extend existing knowledge in the field.
The present research paper is organized to extract valuable insights from the performed analysis regarding supply chain services and firms’ sustainability as follows: in the Introduction section, the presentation and analysis of the related theoretical framework that concerns the present study is given, followed by the Materials and Methods section, where the authors provide an extensive elaboration of the study’s direction, the gathered sample, and the research questions to be answered. Then, in the Results section, through extensive statistical analysis (categorical regression, MANOVA), the main outcomes of the study are presented, while in the Discussion and Conclusions sections, the authors give a clear depiction of the practical and theoretical implications that arose from the sample’s examination and applied analysis.

1.2. Demand for 3PL Services

According to Zailani et al. [15], the majority of companies outsource logistics to decrease operating costs (82.4%), enhance operational flexibility (52.9%), boost their firm’s dedication to fundamental competitive strengths (49.0%), enhance productivity (49.0%), and boost the quality of the logistics activities (37.3%). The assignment of some supply chain activities to an exterior entity is referred to as logistics outsourcing (3PL). Outsourcing entails foreign businesses doing conventional logistics activities in a company, whereas all logistics procedures are operated by 3PL service providers [16]. Firms have decided to outsource either a portion or all of their supply chain functions to gain operational advantages in the supply chain and concentrate on their primary corporate operations [16]. According to Al-Marsy et al. [17], 3PL service providers could analyze their operational effectiveness (alongside location-related efficiency) and utilize the information to advise their customer enterprises in making strategic choices. In a larger sense, logistics activities encompass shipment, vehicle management, storage, recall and reverse logistics, packaging, shipping payments, and oversight [18]. Transportation services are among the most often outsourced. National transportation (80%), storage (66%), global shipping (60%), freight forwarding (48%), customs clearance (45%), and reverse logistics (34%) are the logistics operations commonly outsourced worldwide [19].
While cost is a primary motivation for outsourced labor, several other variables should be considered before the organization may take this step. Corporations are unlikely to outsource an advantageous operation or a process in which they hold a particular understanding or fundamental skill. It seems naive to be giving out this kind of knowledge [20]. The clients of 3PL services show that the fields in which logistics operations could provide an edge over their competitors are lower logistics costs, boosted satisfaction, exceptional performance in achieving objectives, utilization of a broader extent, and effective inventory control [20].
The planning and oversight of 3PL service providers is essential for ensuring profitable outsourcing choices [21]. The higher the risk that the customer senses, the more crucial the former becomes. Some of the most important variables of logistics outsourcing are costs, planning, key expertise, regulations, ambiguity, information technology, and enduring relationships [21]. Furthermore, several additional factors have been uncovered by other investigators. Excellent service, risk management, adaptability, expertise, and elegance are examples of these.
Businesses using a strategic outsourcing perspective seem to put greater emphasis on boosting flexibility, following cost elements, to the benefit of 3PL service providers’ skill to adapt to shifts in demand, while placing a lesser emphasis on enhancing client service and the ability for breakthroughs [22]. Based on the findings of the same study, even though it is mentioned in the research as being one of the essential factors for choosing 3PL services, sustainability was not judged to be extremely relevant. To this point, it should be highlighted that the various activities performed by the government, like the pricing and tax policies, could affect directly the demand for supply chain services, as well as the sustainability of the firms [23,24].

1.3. Determinant Factors of 3PL Services Demand

Partnering with a 3PL service provider versus internal logistics outsourcing is driven by a variety of considerations unique to every firm. Growing customer demand for additional services, enhanced visibility across budgetary limitations, elevated restrictions, fluctuating market situations, and storage challenges have placed companies under severe stress, and thus 3PL service providers with tailored company solutions have become critical for delivering performance [25].
A rising factor with a significant impact on business operations is unpredictability, regardless of the firms’ declarations of advancement in a broad range of logistics operations [26]. 3PL services have become critical for logistics management due to the numerous advantages they offer, including increased efficiency, improved client service quality, lower managerial, staff, and property expenditures, and reduced facility and equipment impact [7]. The quality of logistics services supplied by a 3PL service provider impacts the procedure of selecting an appropriate partner. Service quality is related to the service provider’s service efficiency and expertise, as well as the assessment of its services [27].
The price and the standardization of 3PL services seem to be major factors in enterprises’ decisions to choose and/or extend their collaboration with 3PL service providers [28]. Quality, duration, flexibility, and expenditure have been identified as important criteria too [29]. Other parameters that affect the demand for 3PL services are logistics costs, service quality [30], connectivity, monitoring and transport capabilities, the timeline for delivery, technological infrastructure, overall earnings, geographical reach, and a variety of offered services. According to Soh [31], the most significant efficiency factor is an excellent grasp of information technology (IT), followed by funding, quality of service, international associations, administration, and equipment.
Bulgurcu and Nakiboglu [32] discovered that five of the most commonly cited factors for the on-demand drivers for 3PL services are costs, compatibility, IT operation and service quality, asset possession, and operational factors. To thrive and preserve their competitive ability in the market, companies must compete with one another for the opportunity to acquire the needed essential assets while offering adaptable and rapid services in the supply chain, which is feasible by using either corporate oversight or supply chain network oversight [33]. The capability of a robust transportation system, quality accreditation, safety and health, excellent service, and sustainability credentials, and other factors that need the highest consideration of corporate decision-makers, are among the most significant and inspiring of these aspects [34].
Combining the aforementioned factors, Table 2, presented below, displays the factors determining the selection of 3PL services [32]:
The above factors for determining demand for supply chain services will be validated using similar questionnaires in the following chapter of this paper, like the seven factors for maintaining cooperation with providers of these services, i.e., in companies of various industries related to the use of 3PL services.

1.4. 3PL Services in Greece

A rather important peculiarity for the Greek sector is the fact that the total of the supply chain firms is concentrated exclusively in the wider area of the two major urban centers, Athens and Thessaloniki. In the region of Attica, the available spaces capable of accommodating modern storage needs approach 5% of the market’s potential. For high-end spaces of more than 5000 m2, the market yield in the wider Athens area is around 10%, while the yields for spaces that exceed 10,000 m2 rise to marginally lower levels.
Over 90% of the companies are based in Attica, while most of them have their main facilities in Thriasio Pedio and the rest in Peania, Koropi, the “Eleftherios Venizelos” airport, and in areas in the north of the prefecture, up to Boeotia, and mainly in the regions of Acharne, Krioneri, Avlona, Oinophyta, and Oinoe. Several of the largest supply chain companies also maintain storage areas and facilities in the wider area of Thessaloniki. Major infrastructure projects are setting new standards in the transport and storage fields at a time when businesses are investing in improving their efficiency through better goods management.
In Greece, 3PL companies are used by 10% of the existing businesses, compared to 50–70% use in Europe. The total size of the existing 3PL warehouses in Attica is over 400,000 m2, of which approximately 90% is located in Thriasio Pedio (Mandra, Magoula, Aspropyrgos, Greece). The logistics sector (services to third parties) generates about 6% of the country’s GDP, which rises to 9.5% when including the same logistics services provided internally by many trading and manufacturing enterprises. It gives work to 4.7% of the employed [35]. Also, the supply chain sector, on the one hand, creates a higher gross added value per employee, and, on the other hand, recovers at a faster rate in terms of employment and wages. The recovery in the supply chain sector is largely due to increased activity in the warehousing industry and other activities related to transportation. Distinctively, the contribution of this sector to the total activity of the supply chain sector increased from 19.4% in 2009 to 33.9% in 2016 [36].
Regarding the distribution of the Greek economy by broad product category, in the first place are food and beverages, with a percentage of 32.1%, followed by industrial products and raw materials, which obtained a share of 16.7%, and in third place are the electrical appliances, with 9.6%, while other products make up lower percentages [37]. Given the increasing expansion in worldwide demand for 3PL services, continued expansion of the supply chain infrastructure is becoming increasingly crucial [38], a similar case to that of Greece.

2. Materials and Methods

2.1. Questionnaire Deployment

To increase the efficiency of the responses, the questionnaire was prepared with multiple option questions, deployed in the Google Forms platforms [39], to gather information without tiring the reader. Thus, it was divided into two parts, one containing the “demographic” characteristics of the company concerned, and the other annexing all the general information relating to its activity (Appendix B). The first part had four open-ended questions and one multiple-choice question, while the second part had seven multiple-choice questions, two of which required each option to be rated on a scale of 1 to 4 (completely unimportant to very important). Finally, the second part included two multiple-choice questions that asked the respondent to choose a preferred demand or retention factor for sustainable supply chain services. The questionnaire included the demand factors mentioned in paragraph 1.4, and specifically in Table 1. Quantitative research methods such as questionnaires, mathematical modeling, and simulation are used in 50% of the literature. In most questionnaire, there is a section on non-response bias, reliability, and validity checks. This clearly illustrates the fact that journals are becoming more rigorous in terms of reliability and validity issues [40]. According to Mangan et al. [41], the majority of research on logistics is overwhelmingly dominated by quantitative research methods.

2.2. Sample and Data Collection

For this particular survey, responses were collected from 81 companies from various sectors of the Greek economy throughout the past year (2022). The questionnaire was distributed through a Google Forms link [39] to firms from various sectors based in Greece, and the data from their responses were collected in a single Excel file. In addition, the distribution of the link for the questionnaire’s fulfillment was executed through email messages to the sample firms’ emails, available for communication with the public (“contact us” website section) [40]. Most of the firms taking part in this survey were based in Attica and a few of them were based outside Attica. This survey was addressed to 600 enterprises that operate in the following sectors (Figure 1): (a) insurance, (b) energy, (c) construction, (d) technology, (e) retail, (f) wholesale, (g) pharmaceutical, (h) chemical, (i) wholesale and retail, and (j) service enterprises. These are the industry sectors with the most extensive use of 3PL. Communication with them was conducted exclusively by e-mail. In total, 87.7% of the responding companies use 3PL services, with 12.3% not using them, with the period of use (for the 88% using them) ranging between 1 and 420 months, with an average period of use of 68.5 months (Figure 2), i.e., about six years.
The method applied to collect the data through the questionnaire was the sending of emails with the questionnaire attached in the form of a link, while providing the incentive of communicating to them the results of the survey as a technique to improve their response rate [41]. The initial mailing of the questionnaires to the 600 firms resulted in the collection of 35 responses. In a subsequent phase, the response rate improvement methods used included the polite reminder of our initial conversation, thus personalizing it further [42,43], which increased the response of the firms by 131%, reaching 81 responses.
Participating firms were asked to answer 11 questions about the factors influencing their need for 3PL services, including their rating of each factor’s importance on a four-point Likert scale (very important, probably important, probably unimportant, totally unimportant), etc. Among these firms, some are new and others have operated for a long period in their sectors, ranging from 1 to 120 months. Their size also varies as follows: 16% of the firms employ less than 10 employees, 24.7% employ more than 10 and less than 50, 50.37% employ more than 50 and less than 250, and the remaining 22.3% employ more than 250 employees (Figure 3).

3. Results

3.1. Descriptive Statistics

Based on the results of the survey, the most widely used type of 3PL services is the provision of transport facilities at 66.7%, followed by warehousing facilities at 42%, and thirdly, warehousing and inventory control services at 33.3%. In the next stage, after all the firms rated the 26 factors, they also selected the most important one. Notably, only 16 were selected by at least one firm as the most determinant for 3PL services demand, characterizing the remaining 10 as less important. The most important 3PL service demand drivers are presented in Figure 4 and Figure 5. The satisfaction of 3PL services customers is ranked first with 27.2%, second was the price of 3PL services with 14.8%, and third was the operational efficiency based on the delivery time with 9.9%. In the same framework, the selection of the main factor for maintaining cooperation with 3PL service providers was reliability at 54.3%, followed by trust and improved efficiency/effectiveness at 13.6% (Figure 6).
Therefore, we see that in terms of the general categories of demand factors for 3PL services, the most decisive is that of quality of service with a percentage of 55.6%, followed by the category of cost of service with 20.9%, competitiveness (9.8%), relational factors (6.2%), and the general characteristics of the 3PL service provider (6.2%).
Table 3 shows the descriptors of the 3PL service demand and cooperation maintenance factors, where the most frequently occurring factors receive the lowest values in terms of their range, mean, and standard deviation, verifying the results of the questionnaire and underlining the preference shown by the respondents (e.g., customer satisfaction, service price, reliability, etc.).

3.2. Statistical Analysis

From the questionnaire’s factors’ descriptive statistics, we can discern that in the question of the most important determinant factor of demand for 3PL services, customer satisfaction has the highest mean value and the lowest standard deviation of the other factors, meaning that it is consistently rated with the highest score (4) of the questionnaire scale and with small deviations from this value (4). Moving on, Cronbach’s alpha statistic [44] implicitly assumes that the average correlation of a set of items is an accurate estimate of the average correlation of all items about a particular construct. Therefore, if the value of this statistic exceeds 0.7, the sample is considered acceptable for further analysis. In this particular case, Table 4 exceeds 0.9 for 35 items (or questions) so that the sample is considered suitable. The result of Cronbach’s alpha = 0.919 (higher than 0.7), indicating a high internal consistency of the selected scales of the questionnaire, meaning that the sample produces reliable outcomes and has a reasonable length and that the selected factors are closely related, while also ensuring the homogeneity of the sample [45]. Apart from the referred statistical analysis, more statistical tablesrelated to the study, are presented in Appendix A.
In Table 5, the Kaiser–Meyer–Olkin statistic, used to measure the sufficiency of the sample, and Bartlett’s statistic, used to control for the sphericity of the sample, are shown. The Kaiser–Meyer–Olkin statistic indicates sample adequacy above the threshold of 0.6, which in this case proves that our sample is adequate. The Bartlett test’s [46] null hypothesis is rejected because the significance level of the statistic (p-value) is 0.00 < a = 0.05. The above tests combined suggest that our data are suitable for further analysis.

3.2.1. Categorical Regression

Categorical regression quantifies the categorical data by assigning numerical values to the categories, resulting in an optimal linear regression equation for the transformed variables [47]. Thus, starting with the categorical regression, we will examine the association of qualitative variables (namely the industry sector, the number of employees, the usage of 3PL services, and the type of 3PL services used) with the twenty-six factors influencing 3PL services. In Table 6, we observe that the industry sector is related to only two factors, namely positively to sufficient capacity (significance level < a = 0.01) and negatively to IT capabilities (significance level < a = 0.05).
Similarly in Table 7, we observe that the number of employees is positively related to only two factors, the standardization and culture compatibility of the 3PL service providers (level of significance < a = 0.05).
In Table 8, we observe that the use or non-use of 3PL services is negatively related to culture compatibility (significance level < a = 0.05).
Therefore, in Table 9, we observe that the type of 3PL services used is negatively related to standardization (significance level < a = 0.01), and positively related to the ownership of assets for operations (significance level < a = 0.05).

3.2.2. MANOVA

MANOVA assumes multivariate normality of variables at each factor level and a common covariance matrix [47]. In Table 10, the process of comparing the multivariable means of the years of presence in a specific branch, of the time interval of using 3PL services, and their quotient with the 26 factors is observed, from which it emerged that the four tests, except for Roy’s largest root, reject the null hypothesis of MANOVA; therefore, the variable means (mean vector) of populations are not the same (significance level < a = 0.05). Pillai’s trace is statistically positive, meaning that increasing values of the statistic indicate outcomes that contribute more to the model. There is evidence that Pillai’s trace is more robust than other statistics to violations of model assumptions [48].
In the second phase of the MANOVA, we compare the means of the 26 factors affecting the demand for 3PL services, as expressed by the combination of the years of presence in a specific industry and the period of using 3PL services (Table 11). From the results obtained, we can see that the factors of operational performance based on accuracy and reputation significantly impact the years of presence in a sector and period of use of 3PL services (significance level < a = 0.05).
The last table of the MANOVA results, Table 12, presents the effect and importance of each of the 26 factors individually in the years of presence in a specific industry and the period of use of 3PL services. Here, we see that operational performance based on the accuracy (significance level < a = 0.05) and 3PL service usage span have a significant effect on years of presence in a specific sector, IT capabilities (significance level < a = 0.05), and reputation (significance level < a = 0.01).

4. Discussion

The companies of the sample chose customer satisfaction as the most important determinant at 27.2%, followed by the price of 3PL services at 14.8%, and the operational efficiency based on the delivery time at 9.9%. As we understand from the statistical analysis that followed, additional factors surfaced, highlighting the impact of these factors on the demand for 3PL services and the decision to maintain cooperation with 3PL service providers. The variables of the years of presence in a particular industry and the period of use of 3PL services were used as dependent variables for 3PL services demand, and the industry sector, the number of employees, the usage of 3PL services, and the type of 3PL services used were deployed as dependent variables of the customer firms’ profile.
From the results of the statistical analysis, it can be concluded that the factors that influence the demand of firms for supply chain services, as expressed by their years of presence in a given industry and the period of 3PL services usage, are the reputation, the operational performance based on accuracy, and the capabilities for IT of the provider of 3PL services. The selection of the main factor for maintaining cooperation with 3PL service providers and promoting firms’ sustainability, showed that the reliability of the 3PL service provider is of greater importance, with trust and improved efficiency/effectiveness coming second. Last in order came alignment to strategic objectives, communication, and business integration.
Summing up, regarding the research questions of the paper, it is worth referring that the answer to research questions 1 and 2 is:
(a)
The factors of adequate capacity and IT capabilities of 3PL service providers affect the industry sector of firms that tend to use such services, while the factors of standardization and culture compatibility of 3PL service providers affect those firms’ number of employees.
(b)
The factor of 3PL service providers’ culture compatibility affects the choice of firms for utilizing 3PL services, while the factors of standardization and ownership of assets for operations affect the type of 3PL services used by customer firms.
Furthermore, concerning research questions 3 and 4, the following outcomes have been provided throughout this paper:
(a)
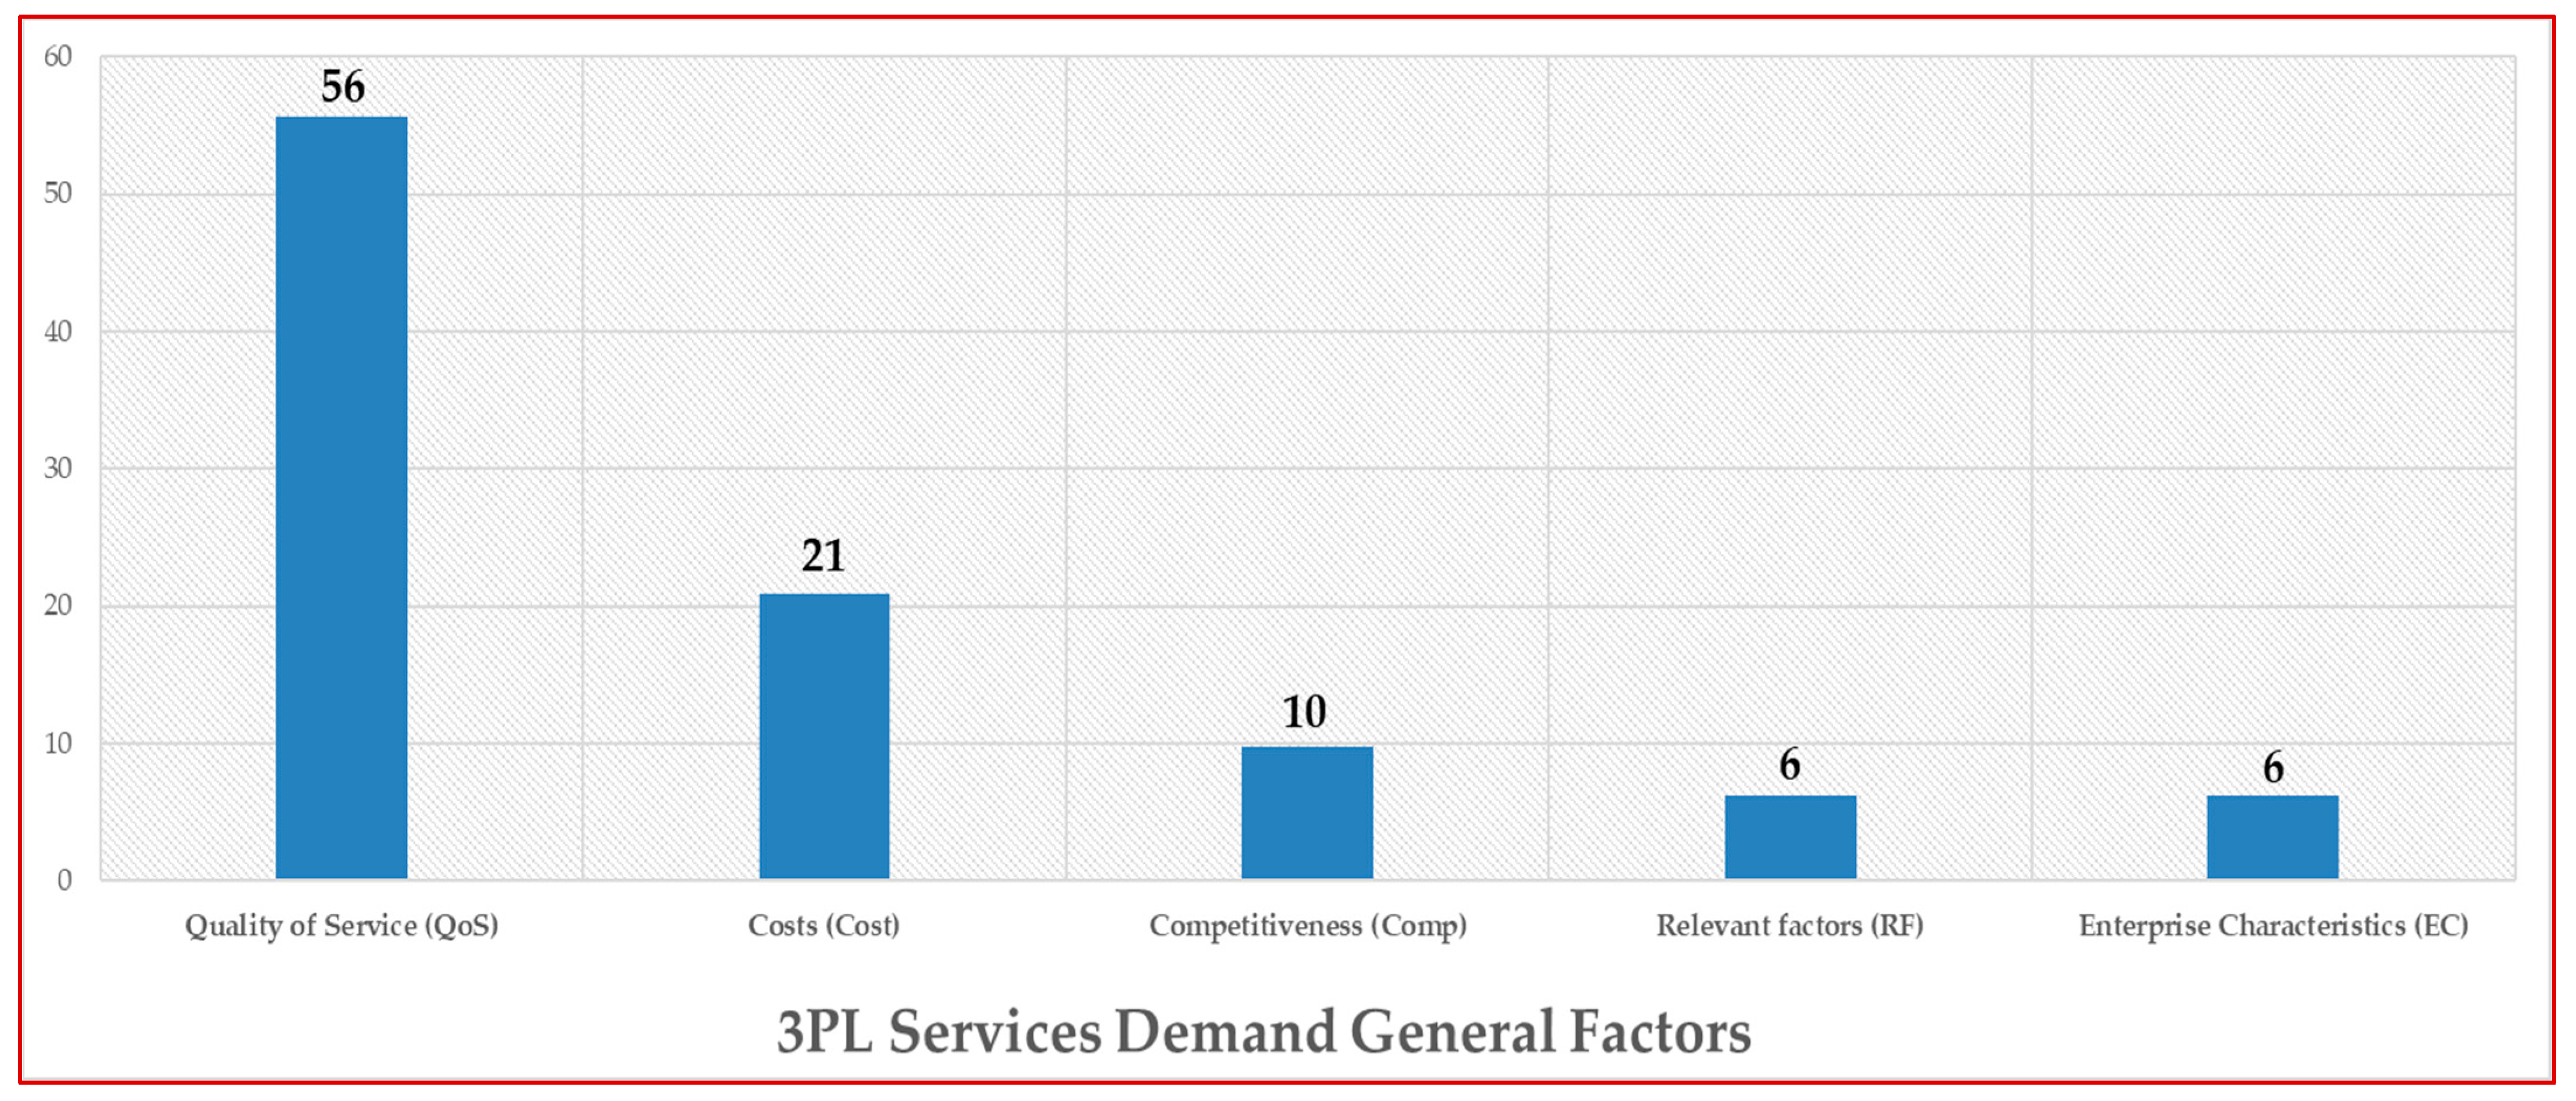
The factors that have emerged as important for accurately explaining the demand of firms for 3PL services are 3PL service providers’ reputation, accuracy of operational performance, and their IT capabilities.
(b)
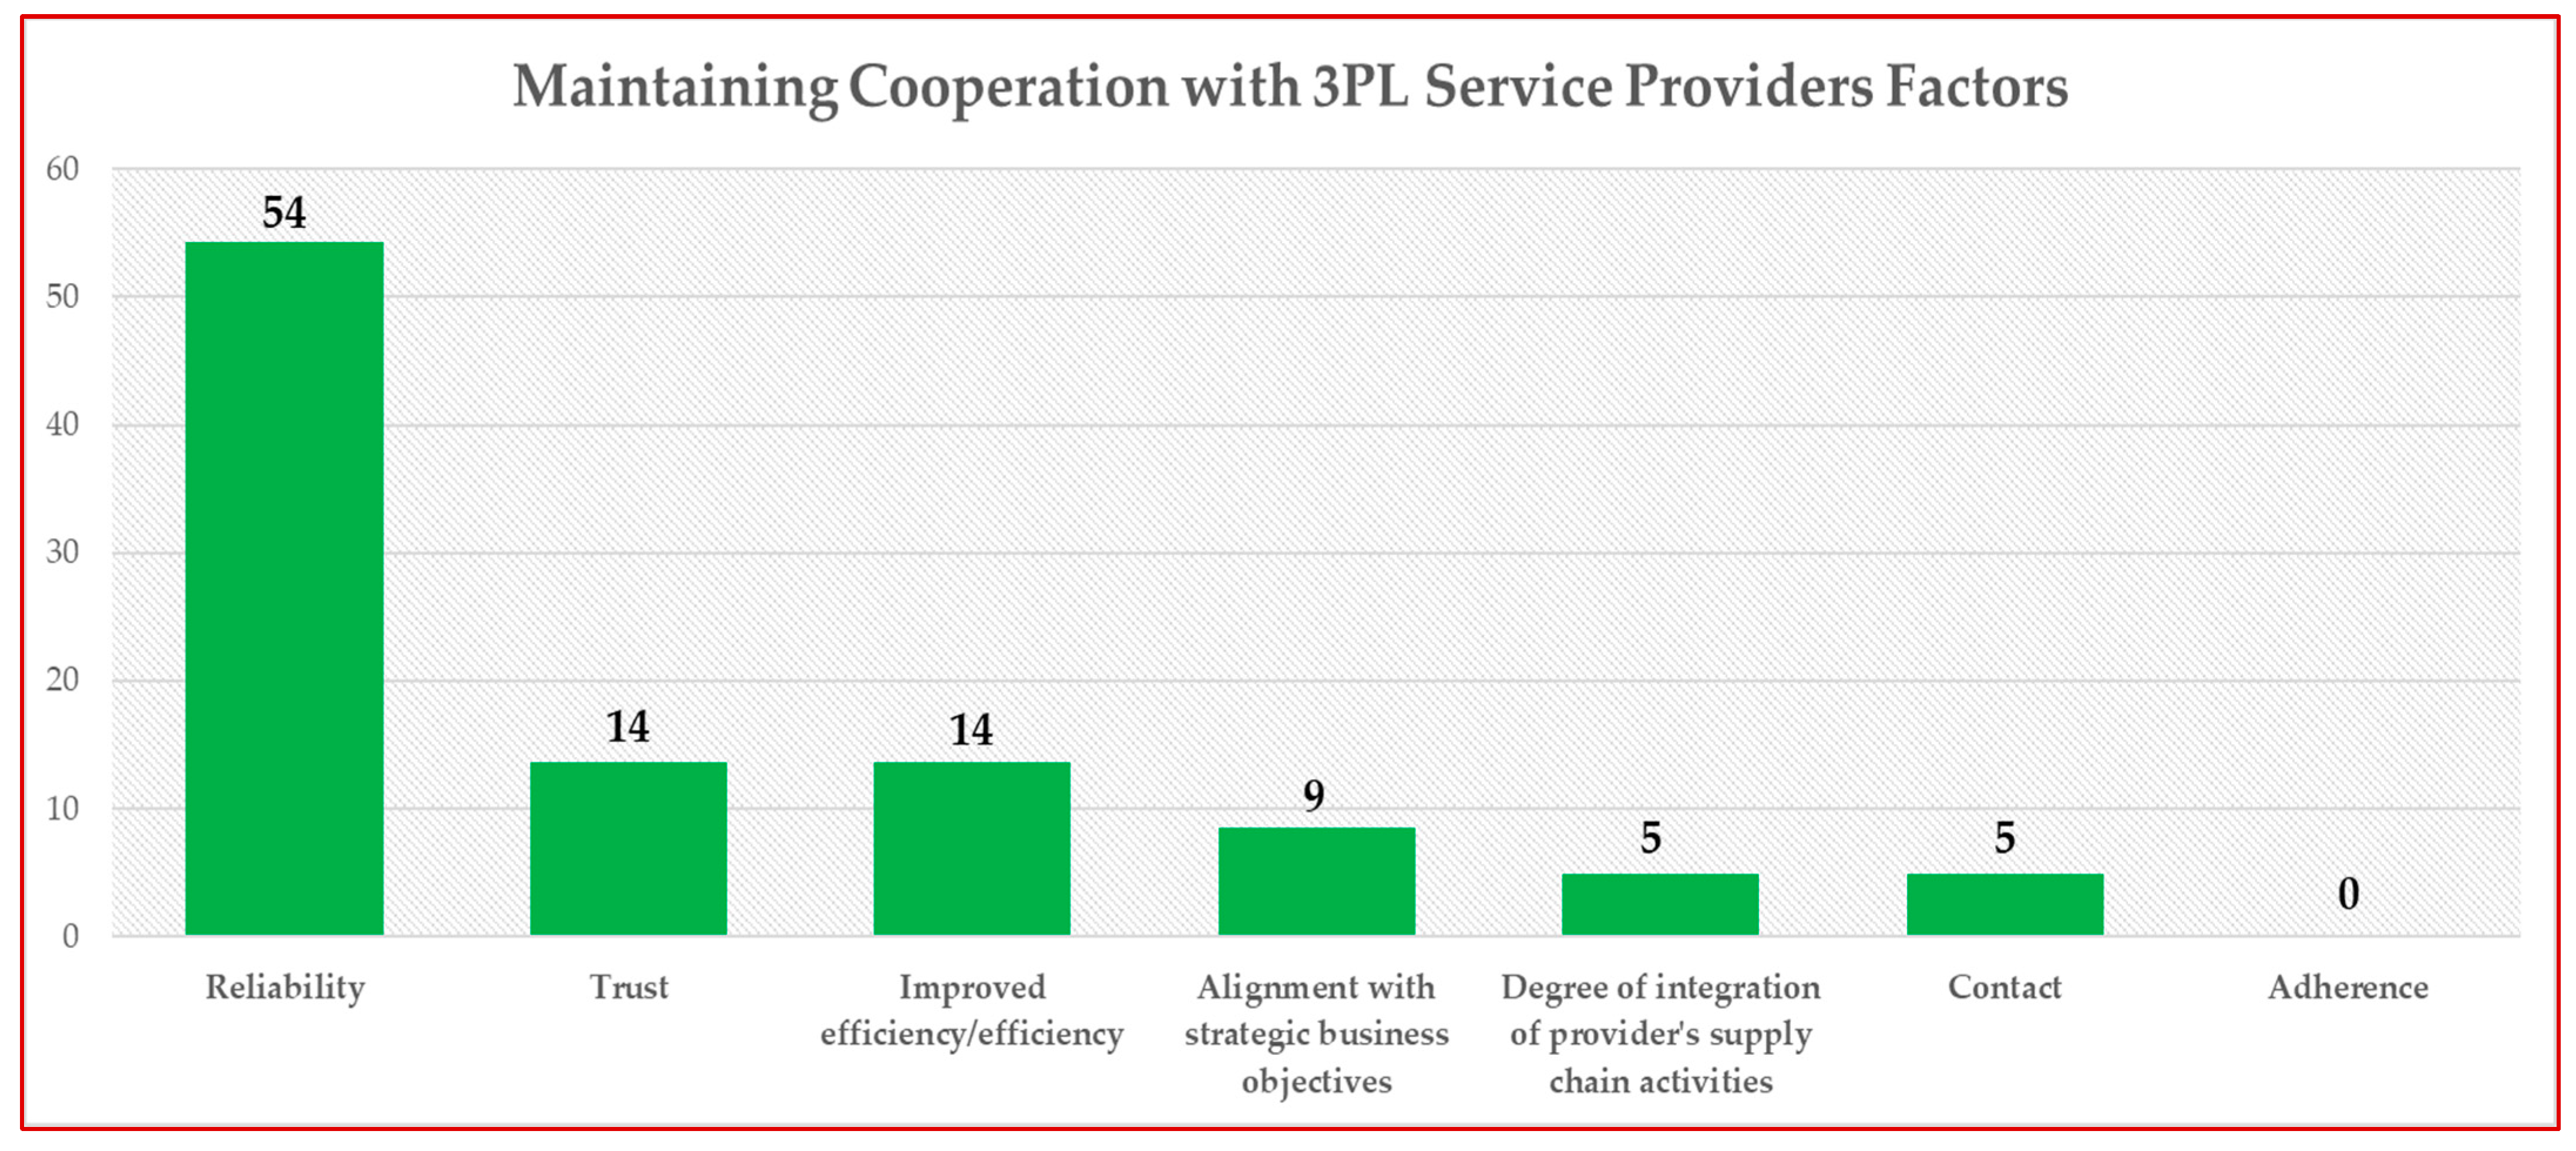
The factors that contribute more to customer firms’ intention to maintain cooperation with 3PL service providers are their reliability level, improved service efficiency, and trustworthiness.
The specific firms in our sample did not select adherence as a factor in maintaining their partnership with supply chain service providers at all, which means that they do not consider it to be a sufficiently important factor compared to the other six. Of these, therefore, we distinguish the reliability of 3PL service providers as the most dominant sustainability factor, followed jointly by trust and improved efficiency.

5. Conclusions

The main purpose of this study was to analyze and discern the factors that influence companies’ demand for 3PL services and their decision to maintain their cooperation with them. The factors that affect the demand for 3PL services are the operational performance based on the accuracy, the reputation, and the IT capabilities of the 3PL service providers. On the other hand, the reliability, improved service efficiency, and trustworthiness of the 3PL service providers were discerned as determinant factors in customer firms’ decision to maintain cooperation with them. With the increasing expansion of businesses on a global scale, companies around the world need to have a highly flexible and efficient supply chain to improve the levels of corporate sustainability. Collaboration across the supply chain is crucial in this quest [49].
As the results of the present study demonstrate, 3PL service providers that wish to enhance their firms’ sustainability should prioritize any activities that might enhance the reputation of their business, as well as the accuracy of their operations and their capability of utilizing IT tools. The results of this research are in line with the results of Meng et al. [50], Soh [31], and Bulgurcu and Nakiboglu [32] regarding the importance of specific determinants of demand for 3PL services, but also with the results of Huo et al. [51], Bagchi and Virum [52], and Karmazin [53] regarding the results of maintaining cooperation with existing 3PL service providers. Concerning the sustainability of supply chain firms, as expressed by the decision of customer firms to maintain the usage of 3PL services, our findings are aligned with the studies of Ji et al. [54] and Nila and Roy [55], which refer to logistic services provider selection based on sustainability characteristics. Moreover, our research comes in terms of the increasing need for supply chain firms to predict their customers’ demand for their services [56], as well as the prioritization and promotion of their sustainability through long-term relationships with their customers [57] and operational efficiency [58].
For their part, 3PL service providers should formulate an appropriate strategy to improve the level of their services by promoting sustainability factors such as the reputation of their business, their capitalization of IT tools, and the improved accuracy of their operations. Finally, in their need for a long-lasting collaboration with their current customers, they should evaluate and emphasize factors that will contribute to maintaining this cooperation. Such factors consist of a high reliability level of their services, as well as the trust that customers have in the provider and improved efficiency in their activities and relationships.
The present research has some weaknesses in terms of the questionnaire and the size of the sample. In particular, the study’s sample does not include equal portions of the business sectors, while also it does not include all the industry sectors where logistic activities are developed and 3PL services take place. This fact affects the generalizability of the survey results, as the sample is not representative, since the response rate [59] of the surveyed firms is low, close to 30%. Furthermore, the representativity of the survey could be undermined by the fact that not all of the studied firms use a supply chain management (SCM) tool, with some using only some modules of it.

Author Contributions

Conceptualization, N.T.G. and N.K.; methodology, D.P.S., N.T.G. and C.C.; software, N.T.G. and N.K.; validation, C.C. and K.S.T.; formal analysis, N.T.G., N.K. and C.C.; investigation, N.T.G. and N.K.; resources, N.T.G. and N.K.; data curation, C.C. and K.S.T.; writing—original draft preparation, N.T.G. and N.K.; writing—review and editing, N.T.G., N.K., C.C. and K.S.T.; visualization, D.P.S., N.T.G. and N.K.; supervision, D.P.S., C.C. and K.S.T.; project administration, D.P.S., C.C. and K.S.T.; funding acquisition, N.K. and C.C. All authors have read and agreed to the published version of the manuscript.

Funding

This research received no external funding.

Data Availability Statement

Not applicable.

Conflicts of Interest

The authors declare no conflict of interest.

Appendix A. Statistical Tables

Table A1. Industry sector model summary.
R2Adjusted R2Prediction Error
0.7380.2510.262
Table A2. ANOVA of the industry sector.
Sum of SquaresAverage SquareF StatisticSig.
Regression59.7571.0711.1850.319
Residuals21.2430.904--
Sum81.000---
Table A3. Number of employees model summary.
R2Adjusted R2Prediction Error
0.6880.1070.312
Table A4. ANOVA of the number of employees.
Sum of SquaresAverage SquareF StatisticSig.
Regression55.6931.0711.1850.319
Residuals25.3070.904--
Sum81.000---
Table A5. Type of 3PL services used model summary.
R2Adjusted R2Prediction Error
0.6180.5810.382
Table A6. ANOVA of the type of 3PL services used.
Sum of SquaresAverage SquareF StatisticSig.
Regression50.0961.0020.9730.545
Residuals30.9041.030--
Sum81.000---
Table A7. Levene’s test 1.
SubfactorsF StatisticDegrees of Freedom 1Degrees of Freedom 2Sig.
Factor 1: Service price0.93069110.606
Factor 2: Continuous effort to cut costs4.58269110.004
Factor 3: Payment flexibility-6911-
Factor 4: Customer satisfaction2.20769110.075
Factor 5: Operational efficiency based on the speed of execution-6911-
Factor 6: Operational performance based on the delivery time-6911-
Factor 7: Operational performance based on accuracy4.00569110.008
Factor 8: Problem-solving capability2.83769110.030
Factor 9: Customer orientation3.13269110.021
Factor 10: Functional coverage3.18569110.019
Factor 11: Geographical coverage of processes1.41169110.274
Factor 12: Ownership of assets for functions1.99569110.104
Factor 13: Technological infrastructure for operations7.74269110.000
Factor 14: Sufficient capacity12.76069110.000
Factor 15: Flexibility1.63569110.187
Factor 16: Information Technologies, Information Technology capabilities4.26169110.006
Factor 17: Location9.89469110.000
Factor 18: Standardization (ISO etc.)5.95269110.001
Factor 19: Reputation2.22769110.073
Factor 20: Experience0.76869110.758
Factor 21: Financial stability4.26169110.006
Factor 22: Environmental sustainability1.93769110.114
Factor 23: Safety and health2.83769110.030
Factor 24: Cultural compatibility0.84669110.684
Factor 25: Customer relations6.15769110.001
Factor 26: Willingness to share information2.46369110.051
Table A8. Levene’s test 2.
FactorsF StatisticDegrees of
Freedom 1
Degrees of
Freedom 2
Sig.
Years of presence in the industry156.0177910.064
Period of use of 3PL services128.1147910.052
Table A9. Variables normality test.
VariablesKolmogorov–SmirnovShapiro–WilkSig.
Years of presence in the industry0.1230.8950.000/0.000
Period of use of 3PL services0.2780.7680.000/0.000

Appendix B. Parts of the Research Questionnaire

Part 1: Demographic characteristics
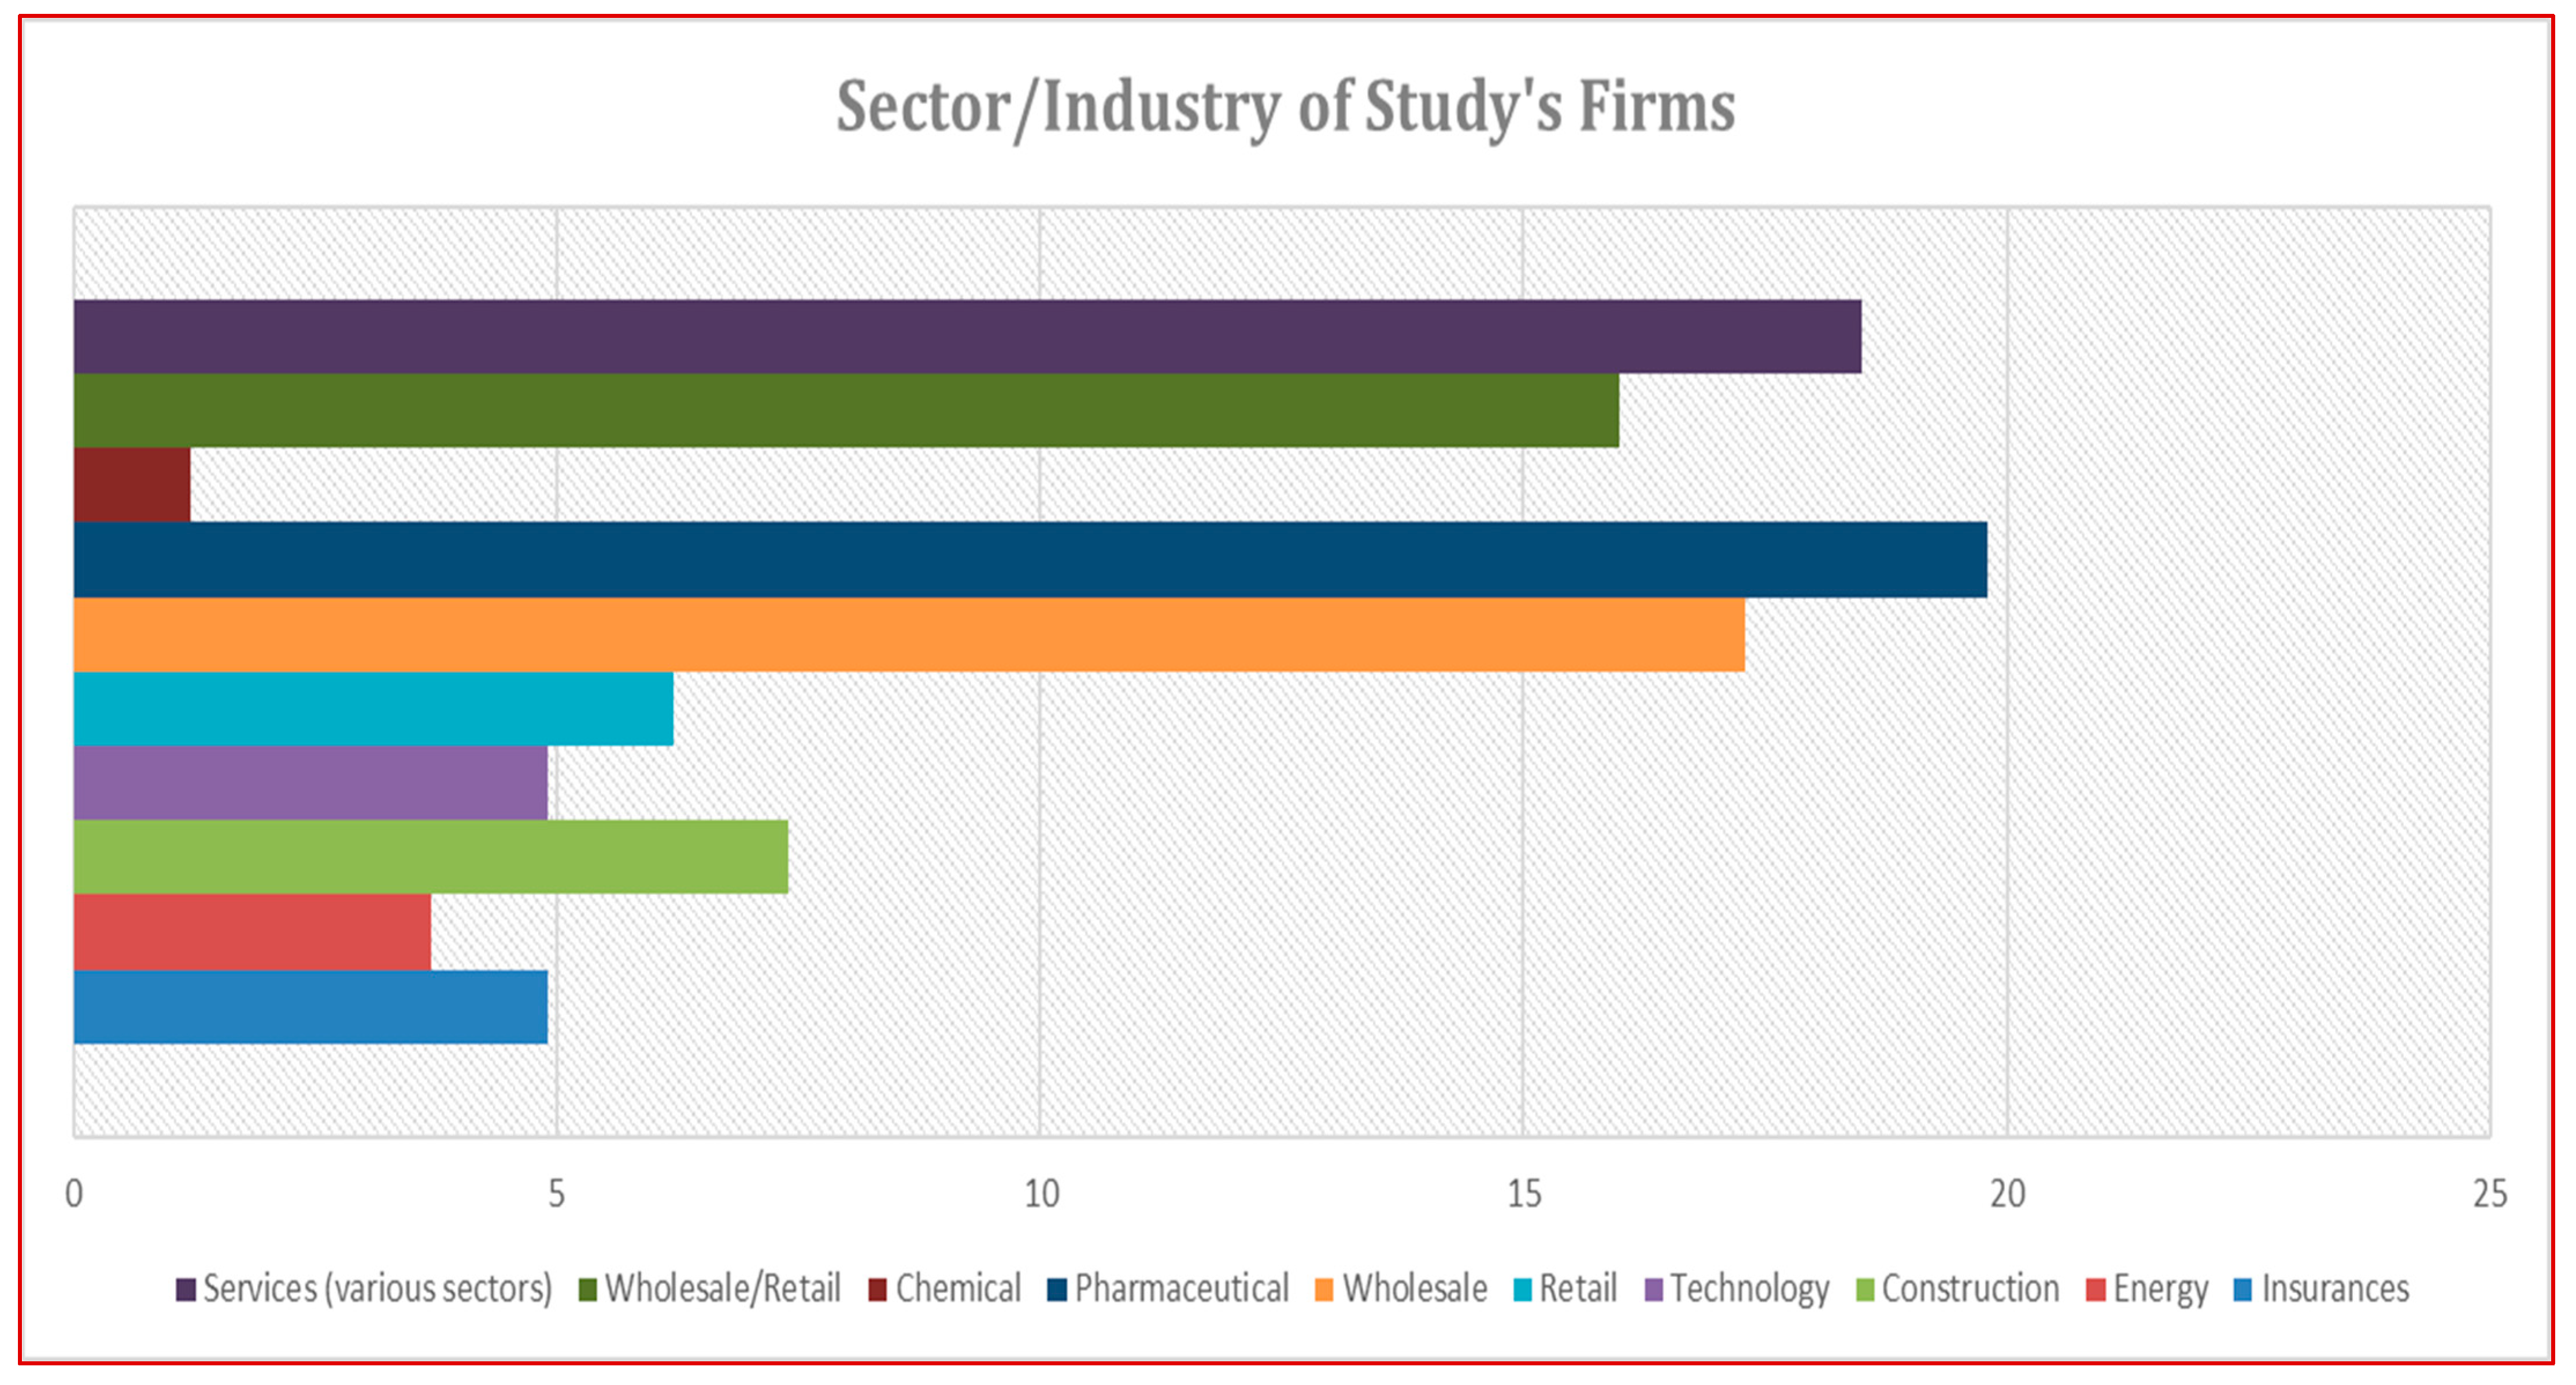
  • Sector/industry (Mandatory):
  • Years of presence in the industry (Mandatory):
  • Location—County (Optional):
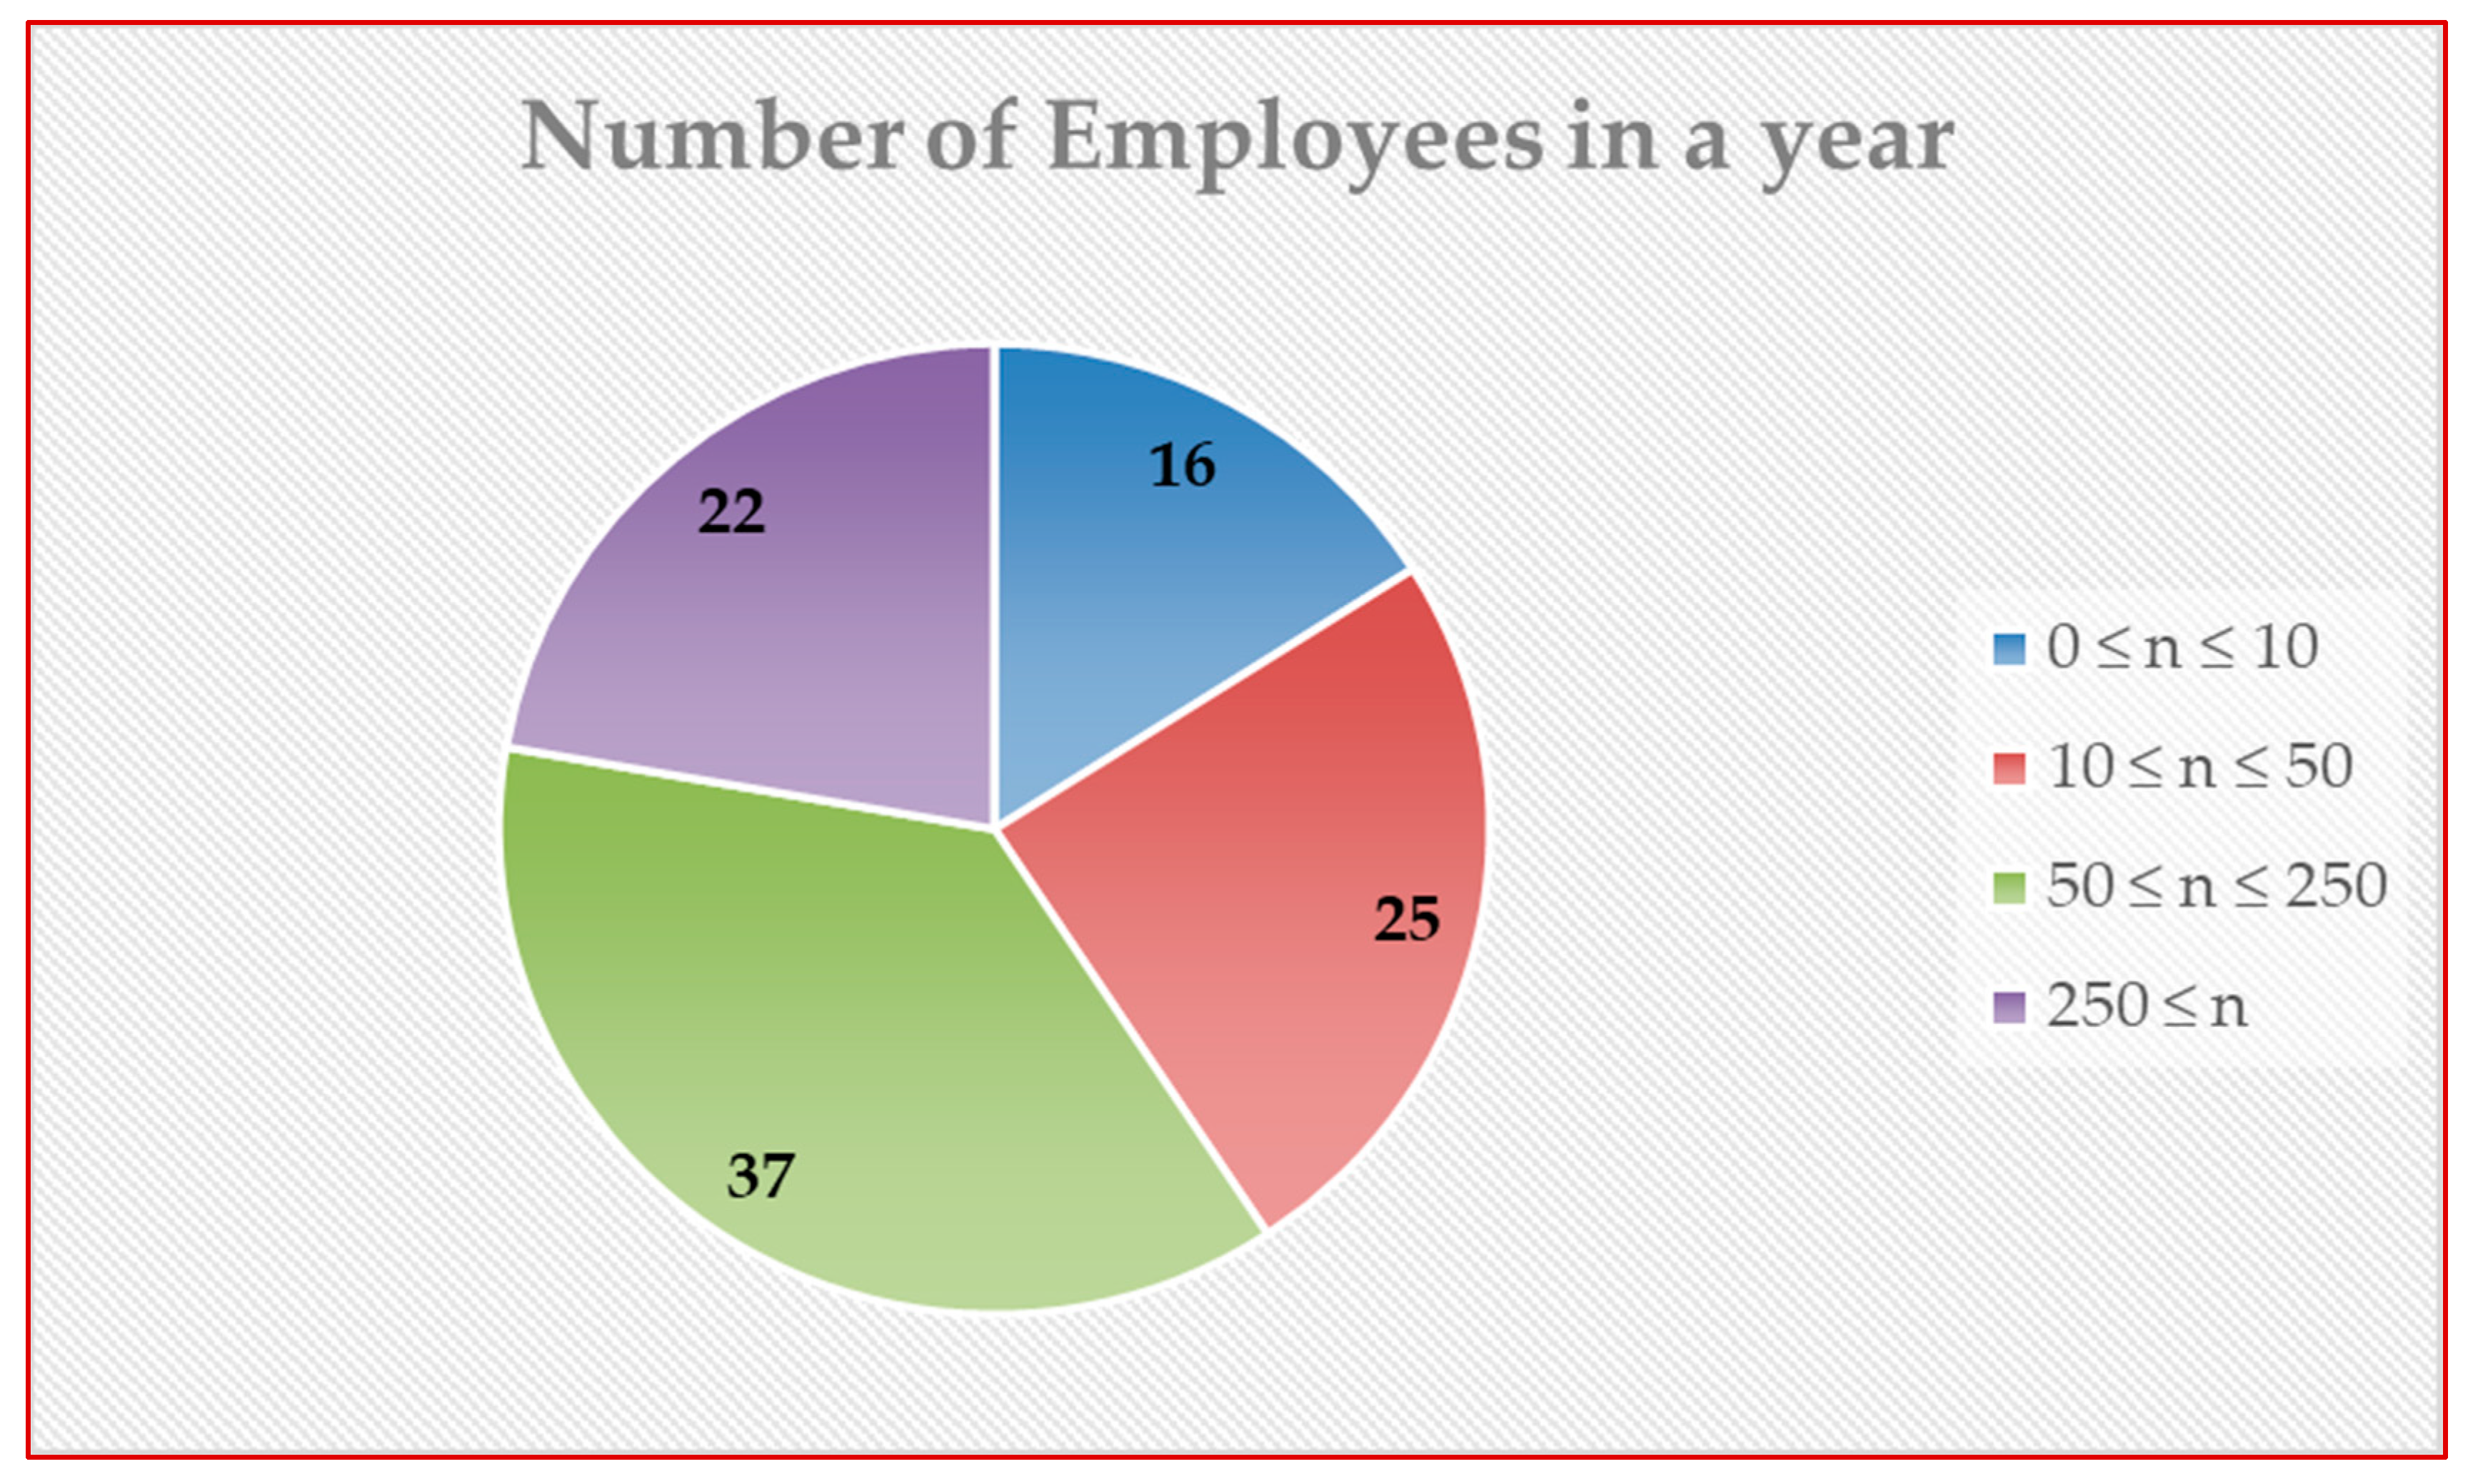
  • Number of employees in a period—year (Mandatory):
Table A10. Number of employees in a period.
Very Small SizedSmall SizedMedium-SizedLarge Sized
0 ≤ n ≤ 1010 ≤ n < 5050 ≤ n < 250250 ≤ n
Part 2: General Information
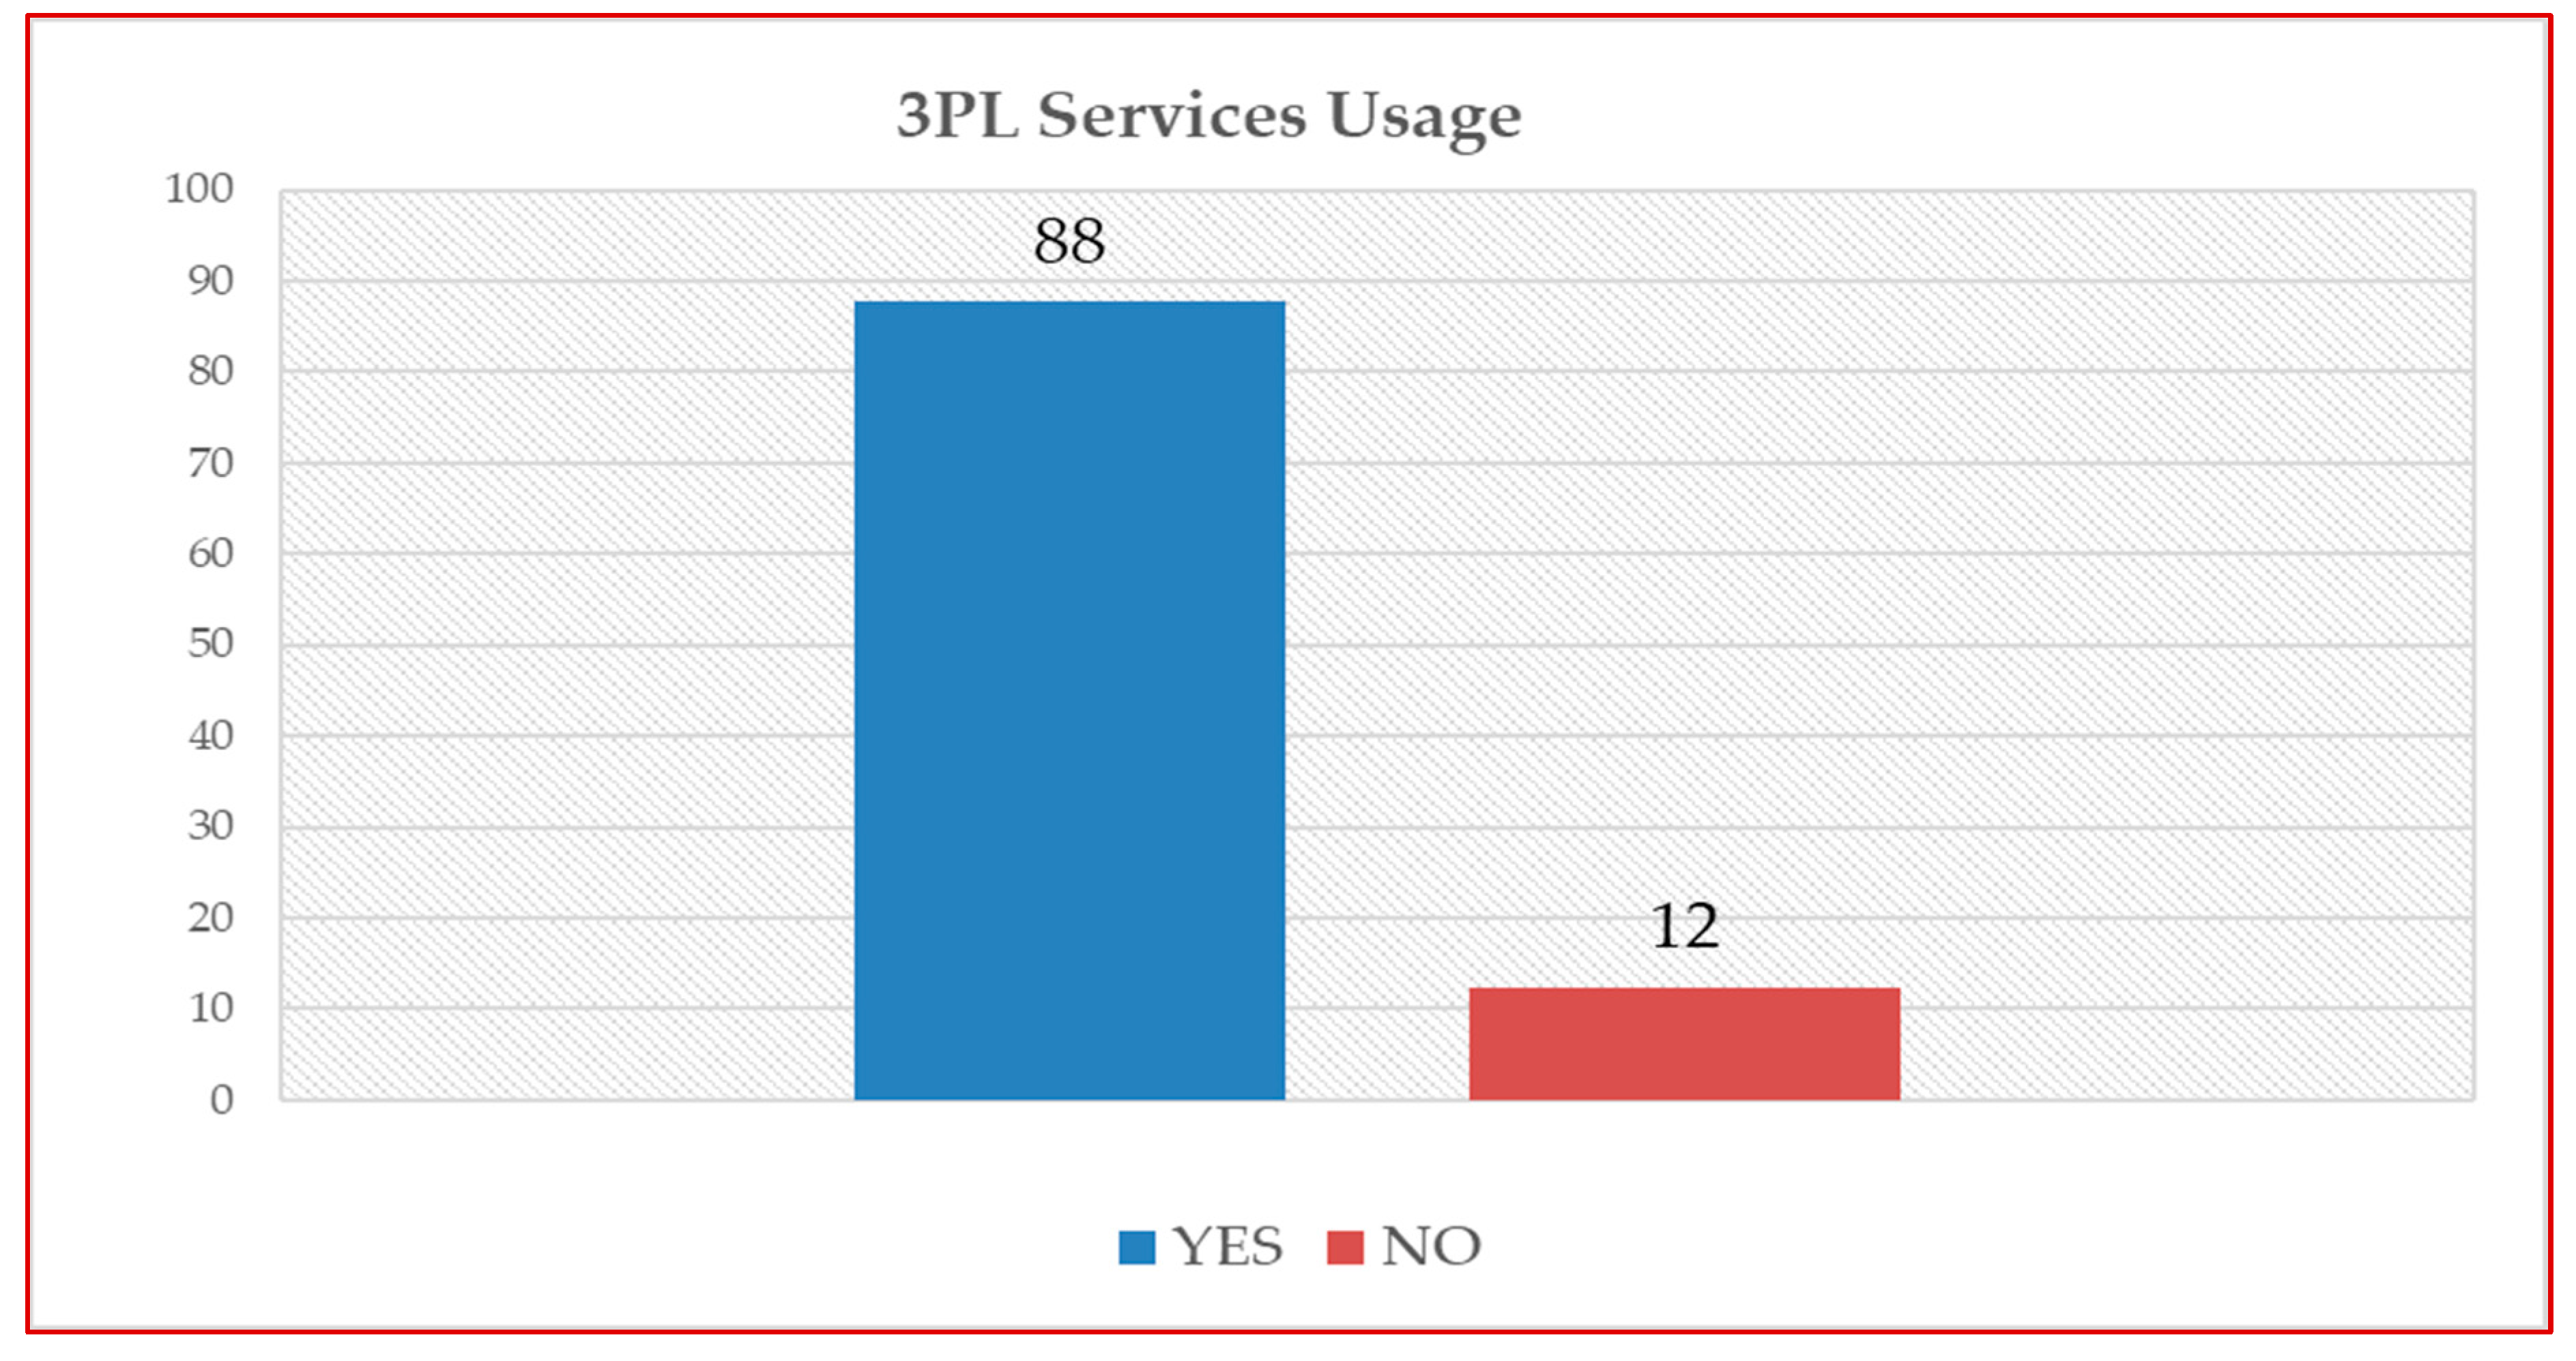
  • Do you use 3PL services? (Mandatory):
YESNO
2.
If so, for how long? (Mandatory, in months):
3.
Type of 3PL services used (Mandatory, multiple choice):
  • Provision of means of transport,
  • Provision of storage facilities,
  • Surplus goods transport and storage services,
  • Storage and inventory control services,
  • Enterprise management services,
  • Subcontracted physical distribution services,
  • Provision of services for the management and execution of transport and warehouse activities,
  • Provide improved supply chain oversight and continuous information,
  • Services to reduce inventory levels, reordering time, order fulfillment time and improve customer service,
  • Market penetration and advanced technology acquisition services,
  • Providing support on integrated supply chain issues,
  • Providing support on environmental sustainability issues,
  • Provide support in freight consolidation and distribution, cross-docking, e-refunds, and order management.
4.
Indicate, in your opinion, the importance of the following factors in the selection of 3PL services. Indicate how important each factor is (Mandatory):
Table A11. 3PL services selection factors’ importance.
FactorsVery
Important
Probably ImportantProbably IrrelevantTotally
Irrelevant
1. Price of service
2. Continuous effort to cut costs
3. Payment flexibility
4. Customer satisfaction
5. Operational efficiency based on speed of execution
6. Operational performance based on delivery time
7. Operational performance based on accuracy
8. Problem solving capability
9. Customer orientation
10. Coverage of functions
11. Geographical coverage of processes
12. Ownership of assets for the functions
13. Technological infrastructure for the operations
14. Sufficient capacity
15. Flexibility
16. Information Technologies, Information Technology capabilities
17. Location
18. Standardization (ISO etc.)
19. Reputation
20. Experience
21. Financial stability
22. Environmental sustainability
23. Safety and health
24. Cultural compatibility
25. Customer relations
26. Willingness to share information
5.
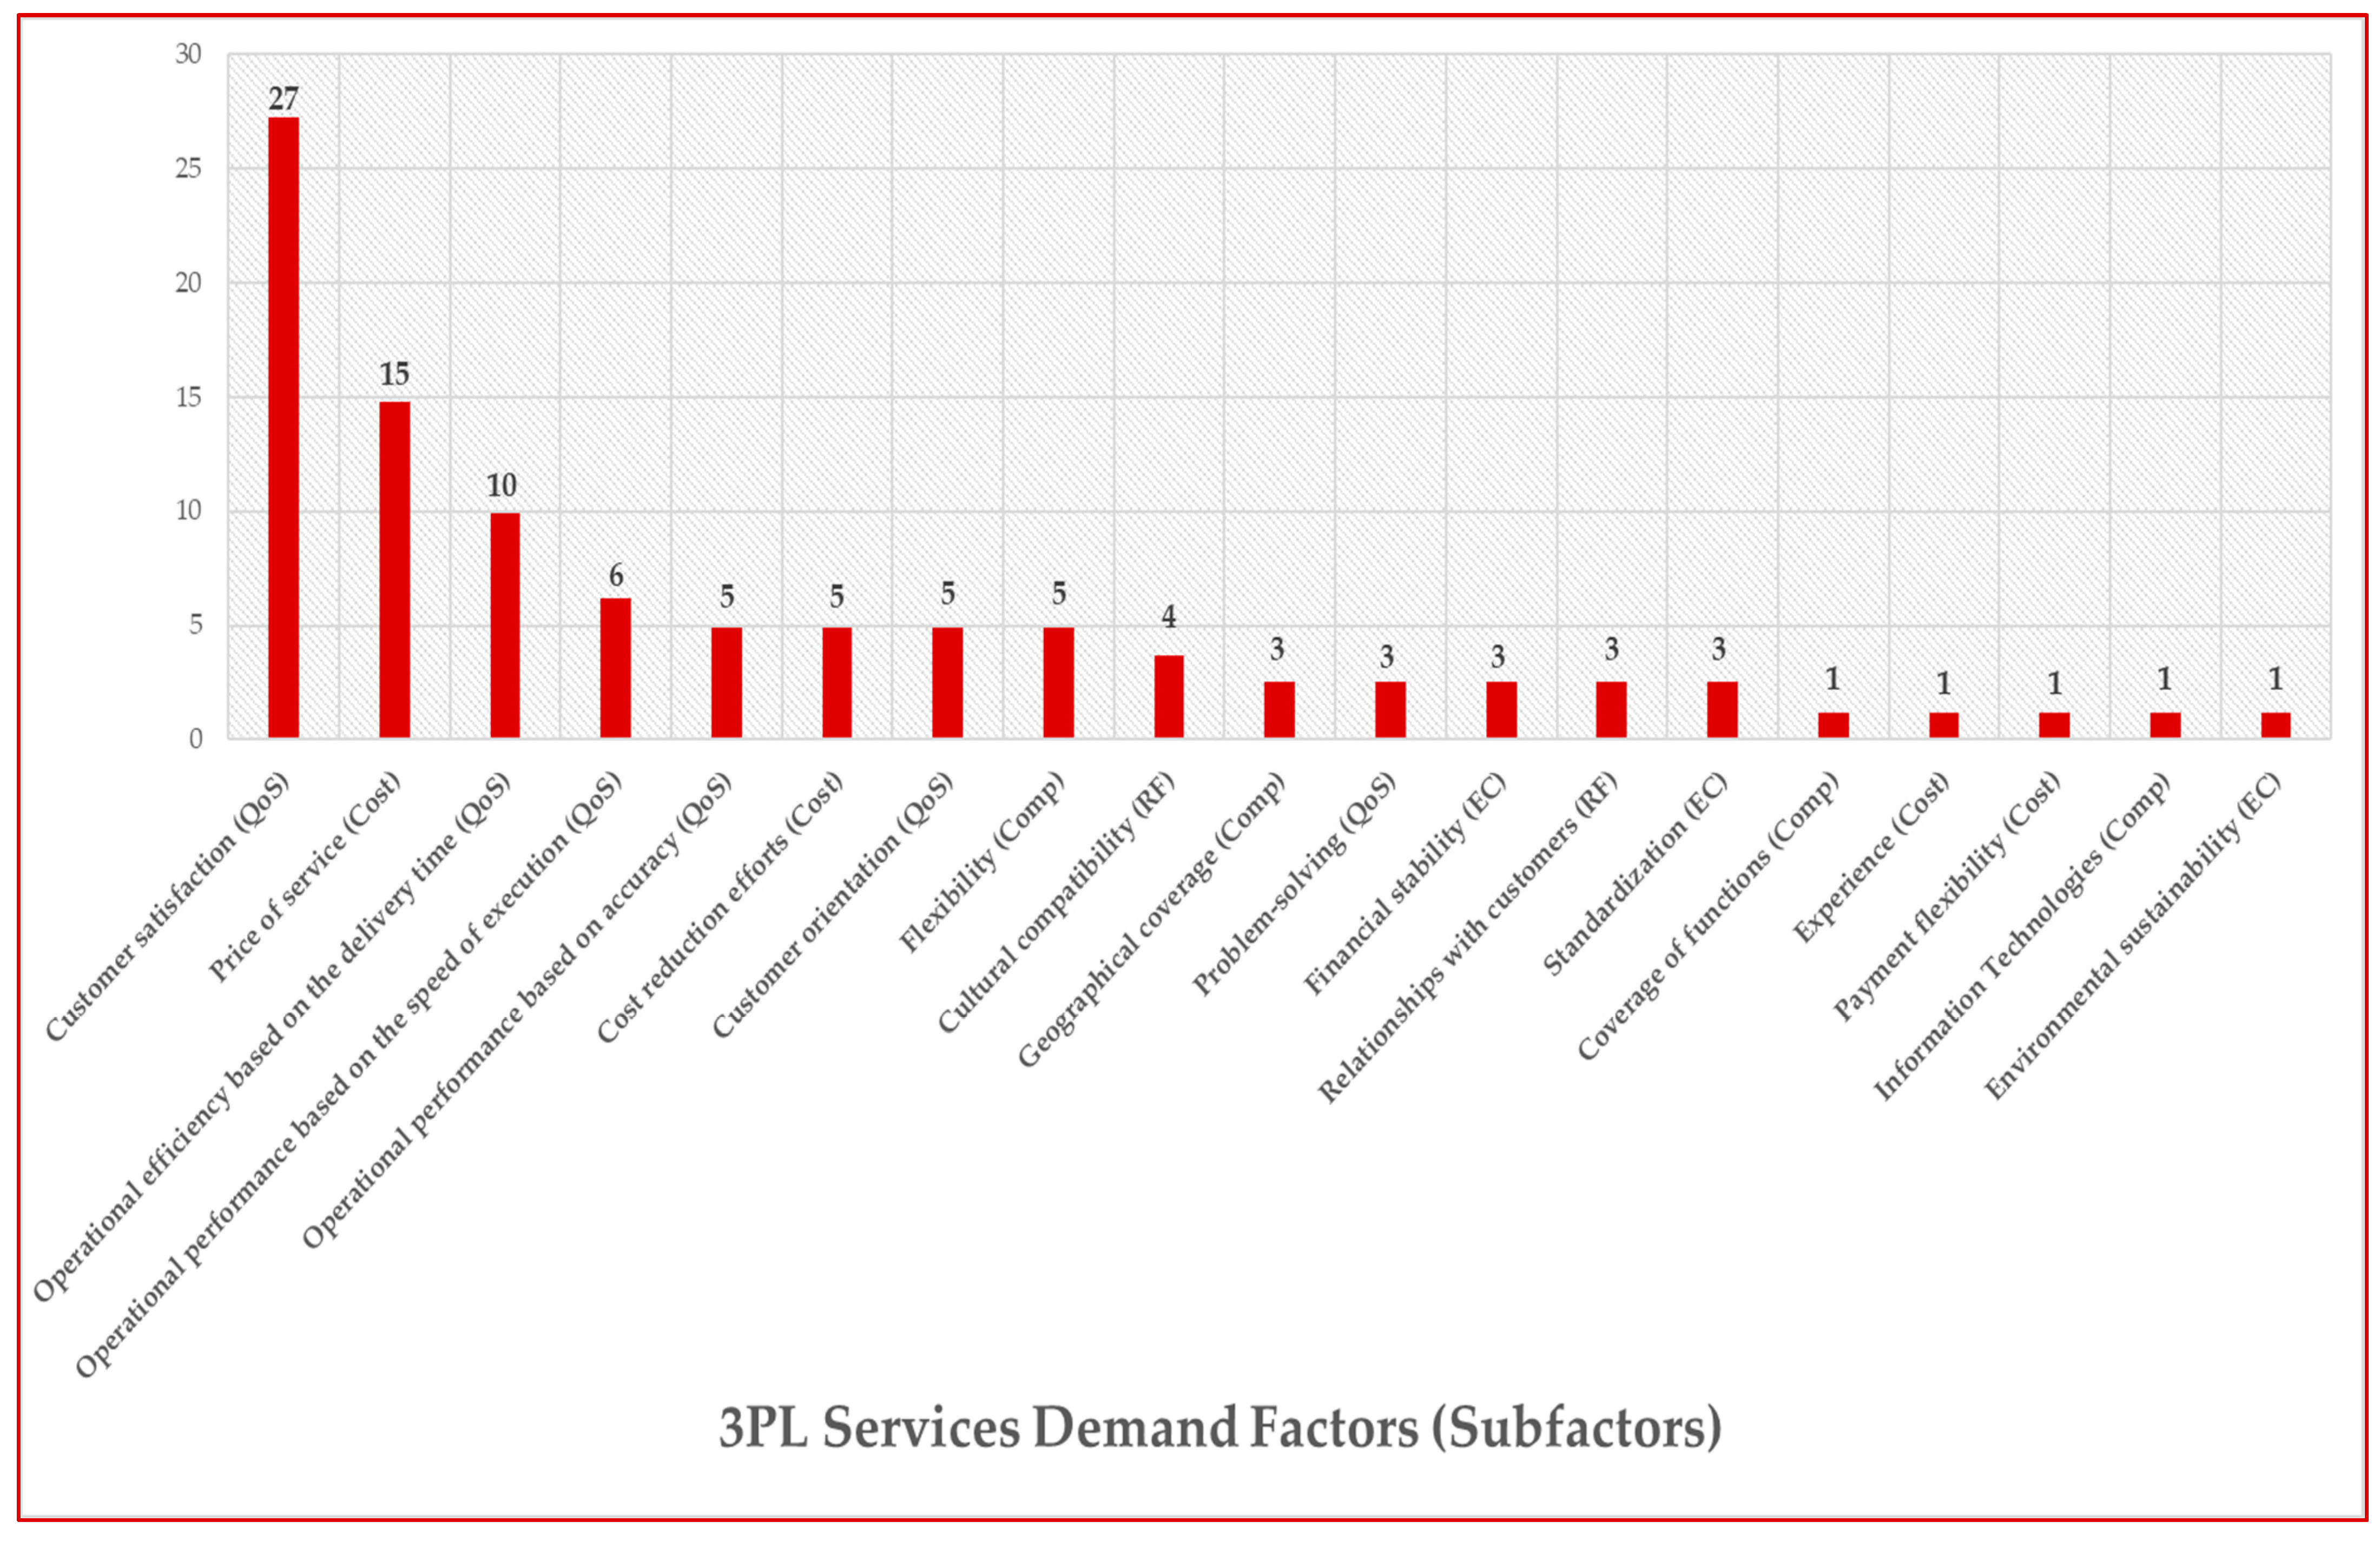
Which of the above factors do you consider most important for your business? (Mandatory, choose only one):
6.
Indicate, in your opinion, the importance of the following factors in maintaining cooperation with 3PL service providers. Please indicate how important each factor is (Mandatory):
Table A12. 3PL cooperation maintaining factors’ importance.
FactorsVery
Important
Probably ImportantProbably IrrelevantTotally
Irrelevant
1. Reliability
2. Trust
3. Improved efficiency/efficiency
4. Alignment with strategic business objectives
5. Degree of integration of provider’s supply chain activities
6. Contact
7. Adherence
7.
Which of the following factors do you consider most important for maintaining your cooperation with 3PL service providers? (Mandatory, select only one):

References

  1. Slack, N.; Chambers, S.; Harland, C.; Harrison, A.; Johnston, R. Operations Management; Prentice—Hall: Upper Saddle River, NJ, USA, 1997. [Google Scholar]
  2. Arlbjørn, J.S.; Freytag, P.V.; Haas, D.H. Service supply chain management: A survey of lean application in the municipal sector. Int. J. Phys. Distrib. Logist. Manag. 2011, 41, 277–295. [Google Scholar] [CrossRef]
  3. Elkington, J. Cannibals with Forks: The Triple Bottom Line for 21st Century Business; Capstone Publishing: Oxford, UK, 1997. [Google Scholar]
  4. Van de Kerk, G.; Manuel, R.A. A comprehensive index for a sustainable society: The SSI—The Sustainable Society Index. Ecol. Econ. 2008, 66, 228–242. [Google Scholar] [CrossRef]
  5. Graedel, T.E.; Allenby, B. Industrial Ecology and Sustainable Engineering; Pearson: Cambridge, UK, 2009; p. 1. [Google Scholar]
  6. Letunovska, N.; Offei, F.A.; Junior, P.A.; Lyulyov, O.; Pimonenko, T.; Kwilinski, A. Green Supply Chain Management: The Effect of Procurement Sustainability on Reverse Logistics. Logistics 2023, 7, 47. [Google Scholar] [CrossRef]
  7. Ngah, A.H.; Thurasamy, R.; Han, H. If you don’t care, I will switch: Online retailers’ behaviour on third-party logistics services. Int. J. Phys. Distrib. Logist. Manag. 2023, 53, 813–837. [Google Scholar] [CrossRef]
  8. Hassan, M.F.A.; Ngah, A.H.; Tio, M.B.Y. Third-party logistics intention to provide cold transportation services. The mediating effect of top management support and organizational readiness in TOE framework. OPSEARCH 2023, 1–23. [Google Scholar] [CrossRef]
  9. Narasimharajan, M.; Venkatesan, R. Factors influencing decision-making models for the estimation of competitive effectiveness among third-party logistics providers. S. Afr. J. Ind. Eng. 2022, 33, 128–142. [Google Scholar] [CrossRef]
  10. Kmiecik, M. Logistics Coordination Based on Inventory Management and Transportation Planning by Third-Party Logistics (3PL). Sustainability 2022, 14, 8134. [Google Scholar] [CrossRef]
  11. Darko, E.O.; Vlachos, I. Creating Valuable Relationships with Third-Party Logistics (3PL) Providers: A Multiple-Case Study. Logistics 2022, 6, 38. [Google Scholar] [CrossRef]
  12. Khan, S.A.; Alkhatib, S.; Ammar, Z.; Moktadir, M.A.; Kumar, A. Benchmarking the outsourcing factors of third-party logistics services selection: Analysing influential strength and building a sustainable decision model. Benchmark. Int. J. 2022, 29, 1797–1825. [Google Scholar] [CrossRef]
  13. German, J.D.; Ong, A.K.S.; Redi, A.A.N.R.; Robas, K.P.E. Predicting factors affecting the intention to use a 3PL during the COVID-19 pandemic: A machine learning ensemble approach. Heliyon 2022, 8, e11382. [Google Scholar] [CrossRef]
  14. Wu, X.; Wang, Q.; Wang, L.; Zhao, X. Customer integration and the performance of third-party logistics firms: A moderated mediation model. Int. J. Logist. Res. Appl. 2021, 26, 615–632. [Google Scholar] [CrossRef]
  15. Zailani, S.; Shaharudin, M.R.; Razmi, K.; Iranmanesh, M. Influential factors and performance of logistics outsourcing practices: An evidence of Malaysian companies. Rev. Manag. Sci. 2017, 11, 53–93. [Google Scholar] [CrossRef]
  16. Ali, A.; Cao, M.; Allen, J.; Liu, Q.; Ling, Y.; Cheng, L. Investigation of the drivers of logistics outsourcing in the United Kingdom’s pharmaceutical manufacturing industry. Multimodal Transp. 2023, 2, 100064. [Google Scholar] [CrossRef]
  17. Al-Marsy, A.; Chaudhary, P.; Rodger, J.A. A Model for Examining Challenges and Opportunities in Use of Cloud Computing for Health Information Systems. Appl. Syst. Innov. 2021, 4, 15. [Google Scholar] [CrossRef]
  18. Lahiri, S.; Karna, A.; Kalubandi, S.C.; Edacherian, S. Performance implications of outsourcing: A meta-analysis. J. Bus. Res. 2022, 139, 1303–1316. [Google Scholar] [CrossRef]
  19. Christopher, M. Logistics and Supply Chain Management; Pearson: London, UK, 2022; p. 6. [Google Scholar]
  20. Selim, N.I.I.B.; Zailani, S.; Aziz, A.A.; Rahman, M.K. Halal logistic services, trust and satisfaction amongst Malaysian 3PL service providers. J. Islam. Mark. 2022, 13, 81–99. [Google Scholar] [CrossRef]
  21. Wei, C.-L. How Relationship Quality, Service Quality, and Value Affect the Intention to Purchase IT/IS Outsourcing Services. Inf. Syst. Manag. 2022, 39, 202–219. [Google Scholar] [CrossRef]
  22. Santa, R.; Ferrer, M.; Tegethoff, T.; Scavarda, A. An investigation of the impact of human capital and supply chain competitive drivers on firm performance in a developing country. PLoS ONE 2022, 17, e0274592. [Google Scholar] [CrossRef]
  23. Barman, A.; Das, R.; De, P.K.; Sana, S.S. Optimal Pricing and Greening Strategy in a Competitive Green Supply Chain: Impact of Government Subsidy and Tax Policy. Sustainability 2021, 13, 9178. [Google Scholar] [CrossRef]
  24. Barman, A.; Kanti De, P.; Chakraborty, A.K.; Lim, C.P.; Das, R. Optimal pricing policy in a three-layer dual-channel supply chain under government subsidy in green manufacturing. Math. Comput. Simul. 2023, 204, 401–429. [Google Scholar] [CrossRef]
  25. Deng, Q.; Noorliza, K. Integration, Resilience, and Innovation Capability Enhance LSPs’ Operational Performance. Sustainability 2023, 15, 1019. [Google Scholar] [CrossRef]
  26. Luo, X.; Liao, W. Collaborative Reverse Logistics Network for Infectious Medical Waste Management during the COVID-19 Outbreak. Int. J. Environ. Res. Public Health 2022, 19, 9735. [Google Scholar] [CrossRef]
  27. Dabees, A.; Barakat, M.; Elbarky, S.S.; Lisec, A. A Framework for Adopting a Sustainable Reverse Logistics Service Quality for Reverse Logistics Service Providers: A Systematic Literature Review. Sustainability 2023, 15, 1755. [Google Scholar] [CrossRef]
  28. Perotti, S.; Bastidas Santacruz, R.F.; Bremer, P.; Beer, J.E. Logistics 4.0 in warehousing: A conceptual framework of influencing factors, benefits and barriers. Int. J. Logist. Manag. 2022, 33, 193–220. [Google Scholar] [CrossRef]
  29. Qureshi, M.R.N.M. A Bibliometric Analysis of Third-Party Logistics Services Providers (3PLSP) Selection for Supply Chain Strategic Advantage. Sustainability 2022, 14, 11836. [Google Scholar] [CrossRef]
  30. Mismar, H.; Shamayleh, A.; Qazi, A. Prioritizing Risks in Last Mile Delivery: A Bayesian Belief Network Approach. IEEE Access 2022, 10, 118551–118562. [Google Scholar] [CrossRef]
  31. Soh, S. A decision model for evaluating third-party logistics providers using fuzzy analytic hierarchy process. Afr. J. Bus. Manag. 2010, 4, 339–349. [Google Scholar]
  32. Bulgurcu, B.; Nakiboglu, G. An extent analysis of 3PL provider selection criteria: A case on Turkey cement sector. Cogent Bus. Manag. 2018, 5, 146–183. [Google Scholar] [CrossRef]
  33. Börteçine, A.S.; Ismail, I. Corporate and supply chain network governance of third party logistics service providers: The effects on buyers’ intention to relationship continuity, Management & Marketing. Chall. Knowl. Soc. 2017, 12, 277–296. [Google Scholar] [CrossRef]
  34. Gardas, B.B.; Raut, D.R.; Narkhede, E.B. Analyzing the 3PL service provider’s evaluation criteria through a sustainable approach. Int. J. Product. Perform. Manag. 2019, 68, 958–980. [Google Scholar] [CrossRef]
  35. SEB. Development of Logistics with European Standards: A Determining Factor for the Extroversion of Greek Production, Economy & Business, 10 January 2019. 2019. Available online: http://www.sev.org.gr/Uploads/Documents/EconBulletin_10_01_2019_V4.pdf (accessed on 23 July 2019).
  36. SEB. Future Occupations and Skills in Supply Chain, Economy & Business, 22 October 2018. 2018. Available online: http://www.sev.org.gr/Uploads/Documents/51600/sr_efodiastiki_alysida_22_10_2018.pdf (accessed on 23 July 2019).
  37. ICAP. The Leading Sectors of the Greek Economy 2011; ICAP Group A.E.: Athens, Greece, 2011. [Google Scholar]
  38. Cedillo-Campos, M.G.; Piña-Barcenas, J.; Pérez-González, C.M.; Mora-Vargas, J. How to measure and monitor the transportation infrastructure contribution to logistics value of supply chains? Transp. Policy 2022, 120, 120–129. [Google Scholar] [CrossRef]
  39. Travis, L. One of Many Free Survey Tools: Google Docs. J. Electron. Resour. Med. Libr. 2010, 7, 105–114. [Google Scholar] [CrossRef]
  40. Zadeh, L.A.; Kacprzyk, I.; Mastorakis, N.; Kuri-Morales, A.; Borne, P.; Kazovsky, L. Recent Advances in Artificial Intelligence, Knowledge Engineering and Data Bases. In Proceedings of the 9th WSEAS International Conference on Artificial Intelligence, Knowledge Engineering and Data Bases (Aiked ‘10), University of Cambridge, Cambridge, UK, 20–22 February 2010; WSEAS Press: Attica, Greece, 2010. [Google Scholar]
  41. Mangan, J.; Lalwani, C.; Gardner, B. Combining quantitative and qualitative methodologies in logistics research. Int. J. Phys. Distrib. Logist. Manag. 2004, 34, 565–578. [Google Scholar] [CrossRef]
  42. Baruch, Y.; Holtom, C.B. Survey response rate levels and trends in organizational research. Hum. Relat. 2008, 61, 1139–1160. [Google Scholar] [CrossRef]
  43. Anseel, F.; Lievens, F.; Schollaert, E.; Choragwicka, Β. Response Rates in Organizational Science, 1995–2008: A Meta-analytic Review and Guidelines for Survey Researchers. J. Bus Psychol. 2010, 25, 335–349. [Google Scholar] [CrossRef]
  44. Cronbach, L.J. Coefficient alpha and the internal structure of tests. Psychometrika 1951, 16, 297–334. [Google Scholar] [CrossRef]
  45. Tavakol, M.; Dennick, R. Making sense of Cronbach’s alpha. Int. J. Med. Educ. 2011, 27, 53–55. [Google Scholar] [CrossRef]
  46. Bartlett, M.S. A note on the multiplying factors for various chi square approximations. J. R. Stat. Soc. 1954, 16, 296–298. [Google Scholar]
  47. Aguinis, H. Regression Analysis for Categorical Moderators; Guilford Press: New York, NY, USA; London, UK, 2004. [Google Scholar]
  48. Olson, C.L. Comparative Robustness of Six Tests in Multivariate Analysis of Variance. J. Am. Stat. Assoc. 1974, 69, 894–908. [Google Scholar] [CrossRef]
  49. Sudusinghe, J.I.; Seuring, S. Supply chain collaboration and sustainability performance in circular economy: A systematic literature review. Int. J. Prod. Econ. 2022, 245, 108402. [Google Scholar] [CrossRef]
  50. Meng, X.; Yang, Z.; Sun, J. Understanding Influential Factors in Selecting Sustainable Third-party Logistics Providers: An Interpretive Structural Modeling and MICMAC Analysis. In Proceedings of the 2018 IEEE International Conference on Industrial Engineering and Engineering Management (IEEM), Bangkok, Thailand, 16–19 December 2018; pp. 864–868. [Google Scholar] [CrossRef]
  51. Huo, B.; Liu, C.; Chen, H.; Zhao, X. Dependence, trust, and 3PL integration: An empirical study in China. Int. J. Phys. Distrib. Logist. Manag. 2017, 47, 927–948. [Google Scholar] [CrossRef]
  52. Bagchi, P.K.; Virum, H. European logistics alliances: A management model. Int. J. Logist. Manag. 1996, 7, 93–108. [Google Scholar] [CrossRef]
  53. Karmazin, G. Research Results on the Key Success Factors of Hungarian Logistics Service Providers. Period. Polytech. Transp. Eng. 2014, 42, 91–95. [Google Scholar] [CrossRef]
  54. Ji, J.; Zheng, H.; Qi, J.; Ji, M.; Kong, L.; Ji, S. Financial and Logistical Service Strategy of Third-Party Logistics Enterprises in Cross-Border E-Commerce Environment. Sustainability 2023, 15, 6874. [Google Scholar] [CrossRef]
  55. Nila, B.; Joy, J. A new hybrid MCDM framework for third-party logistics provider selection under sustainability perspectives. Expert Syst. Appl. 2023, 234, 121009. [Google Scholar] [CrossRef]
  56. Mazanec, J.; Harantová, V.; Štefancová, V.; Brůhová Foltýnová, H. Estimating Mode of Transport in Daily Mobility during the COVID-19 Pandemic Using a Multinomial Logistic Regression Model. Int. J. Environ. Res. Public Health 2023, 20, 4600. [Google Scholar] [CrossRef] [PubMed]
  57. Caldeirinha, V.; Felício, J.A.; Pinho, T. Role of Cargo Owner in Logistic Chain Sustainability. Sustainability 2023, 15, 10018. [Google Scholar] [CrossRef]
  58. Andruetto, C.; Mårtensson, J.; Von Wieding, S.; Pernestål, A. Indicators for Sustainability Assessment in City Logistics: Perspectives of Society and Logistic Service Providers. Transp. Res. Board Annu. Meet. 2023, 1–14. [Google Scholar] [CrossRef]
  59. Han, J.; Fang, M.; Ye, S.; Chen, C.; Wan, Q.; Qian, X. Using decision tree to predict response rates of consumer satisfaction, attitude, and loyalty surveys. Sustainability 2019, 11, 2306. [Google Scholar] [CrossRef]
Figure 1. Sector/industry of participating companies.
Logistics 07 00073 g001
Figure 2. 3PL services usage.
Logistics 07 00073 g002
Figure 3. Number of employees in a year.
Logistics 07 00073 g003
Figure 4. 3PL services demand subfactors.
Logistics 07 00073 g004
Figure 5. 3PL services demand general factors.
Logistics 07 00073 g005
Figure 6. Factors for maintaining cooperation with 3PL providers.
Logistics 07 00073 g006
Table 1. Existing literature for 3PL services demand.
StudiesMethodologyLiterature Contribution
Ngah et al. [7]Smart Partial Least Squares (PLS)Satisfaction and relationship management tend to reduce conflict and switch the intentions of 3PL customers.
Hassan et al. [8]Smart Partial Least Squares (PLS)The intention of firms to adopt cold 3PL transportation services is affected by the relative advantage, top management support, and organizational readiness of the 3PL service provider
Narasimharajan and Venkatesan [9]Smart Partial Least Squares (PLS) and Analytical Hierarchical Process (AHP)Factors such as the need for time- and cost-saving processes, competitiveness, as well as efficient project planning and the environmental impact of the 3PL service providers were discerned as important for 3PL services demand.
Kmiecik [10]Exponential Smoothing, ARIMA, Machine Learning techniquesAccurate management of inventory levels and transportation coordination management comprise the main variables of 3PL service providers’ development.
Darco and Vlachos [11]Comparative Analysis of InterviewsFor efficient collaboration and cooperation maintenance between customer firms and 3PL service providers, information sharing and trust should be promoted.
Khan et al. [12]DEMATEL techniqueThe most influential factors for outsourcing a firm’s logistics are the level of strategic alliances of the 3PL service provider, the uncertainty and risk mitigation of the outsourcing decision, and the deficiency of internal resources for this service from the customer firm.
German et al. [13]Artificial Neural Network (ANN) and Random Forest Classifier (RFC) methodsDuring the COVID-19 pandemic, customers intended to use 3PL services based on their attitude, satisfaction, perceived value, assurance by the 3PL, and perceived environmental concerns.
Wu et al. [14]Structural Equation Modeling (SEM)The integration of customer firms is closely related to the operational efficiency of 3PL service providers, the cost reduction possibilities, the information acquisition, and the IT capabilities of the 3PL firms.
Table 2. Demand factors for supply chain services (3PL).
General FactorsSubfactors
(1) Costs(a) Price of the service
(b) Continuous effort to cut costs
(c) Flexibility of payment
(2) Quality of Service(a) Customer satisfaction
(b) Operational performance based on the speed of execution
(c) Operational performance based on delivery time
(d) Operational performance based on accuracy
(e) Problem-solving capability
(f) Customer orientation
(3) Competitiveness(a) Coverage of functions
(b) Geographical coverage of processes
(c) Ownership of assets for operations
(d) Technological infrastructure for operations
(e) Sufficient capacity
(f) Flexibility
(g) Information technologies, information technology
capabilities
(4) General characteristics(a) Location
(b) Standardization (ISO, etc.)
(c) Reputation
(d) Experience
(e) Financial stability
(f) Environmental sustainability
(g) Safety and health
(5) Relationship Factors(a) Cultural compatibility
(b) Relationships with customers
(c) Willingness to share information
Table 3. Descriptors of demand and retention subfactors for 3PL services.
3PL Services Demand
Subfactors
RangeMeanStd.
Deviation
3PL Services Maintaining SubfactorsRangeMeanStd.
Deviation
Subfactor 1: Service price2.03.5680.5687Subfactor 14: Sufficient
capacity
3.03.3460.8391
Subfactor 2: Continuous cost reduction efforts3.03.2470.7337Subfactor 15: Flexibility2.03.5800.5887
Subfactor 3: Payment
flexibility
3.02.9260.9589Subfactor 16: Information Technologies, Information Technology capabilities3.03.3090.7849
Subfactor 4: Customer
satisfaction
1.03.8640.3447Subfactor 17: Location3.02.9140.8396
Subfactor 5: Operational
efficiency based on the speed of execution
3.03.5800.6298Subfactor 18: Standardization (ISO etc.)3.03.2960.8131
Subfactor 6: Operational
performance based on the
delivery time
2.03.7040.5349Subfactor 19: Reputation2.03.1110.7583
Subfactor 7: Operational
performance based on
accuracy
3.03.5930.6280Subfactor 20: Experience2.03.4940.5942
Subfactor 8: Problem-solving capability2.03.5930.5869Subfactor 21: Financial
stability
2.03.4940.5942
Subfactor 9: Customer
orientation
3.03.5800.6298Subfactor 22: Environmental sustainability3.03.0370.7322
Subfactor 10: Functional
coverage
3.03.3460.6921Subfactor 23: Safety and health3.03.4940.6731
Subfactor 11: Geographical coverage of processes3.03.3210.7216Subfactor 24: Cultural
compatibility
3.03.1110.8062
Subfactor 12: Ownership of assets for functions3.02.5190.9501Subfactor 25: Customer
relations
3.03.4440.6892
Subfactor 13: Technological infrastructure for operations3.03.3830.6627Subfactor 26: Willingness to share information3.03.2590.7207
3PL services maintaining subfactorsRangeMeanStd.
Deviation
1. Reliability1.03.8520.3575
2. Trustworthiness2.03.7280.5247
3. Improved efficiency/efficiency1.03.6050.4919
4. Alignment with strategic business objectives3.03.2720.7585
5. Degree of integration of provider’s supply chain
activities
3.03.2720.7248
6. Contact2.03.5930.5652
7. Adherence3.02.7530.7831
Table 4. Cronbach’s alpha test.
Cronbach’s AlphaNumber of Items
0.91935
Table 5. KMO and Barlett’s test.
Kaiser–Meyer–Olkin Measure of Sampling Adequacy0.778
Bartlett’s Test of Sphericity922.960
Significance0.000
Table 6. Industry sector’s significant coefficients.
SubfactorsCoefficient ΒStd. ErrorF
Statistic
Sig.
Factor 14: Adequate capacity1.0040.4165.8340.003
Factor 16: Information Technology, Information Technology capabilities−0.5600.3063.3520.023
Table 7. Number of employees’ significant coefficients.
SubfactorsCoefficient ΒStd. ErrorF
Statistic
Sig.
Factor 18: Standardization (ISO etc.)0.5680.3203.1430.030
Factor 24: Culture Compatibility0.6420.3603.1780.039
Table 8. Usage of 3PL services’ significant coefficients.
SubfactorsCoefficient ΒStd.
Error
F
Statistic
Sig.
Factor 24: Culture Compatibility−0.5670.3352.8610.038
Table 9. Type of used 3PL services’ significant coefficients.
SubfactorsCoefficient ΒStd. ErrorF StatisticSig.
Factor 12: Ownership of assets for operations0.5940.2754.6500.017
Factor 18: Standardization (ISO etc.)−1.1900.5005.6700.008
Table 10. Multivariate means comparison.
FactorsValuesF StatisticSig.Observed Power
Years of presence in the sectorRoy’s Largest Root207.55265.2310.0001.000
Period of use of 3PL servicesRoy’s Largest Root103.88060.1410.0001.000
Years of presence in the industry and Period of use of 3PL servicesRoy’s Largest Root90.91166.6680.0001.000
Table 11. MANOVA test 1.
SubfactorsPillai’s TraceF StatisticSig.Observed Power
Factor 7: Operational performance based on accuracy0.1133.3830.0410.613
Factor 19: Reputation0.1514.7010.0130.765
Table 12. MANOVA test 2.
Subfactors/FactorsF StatisticSig.Observed Power
Factor 7: Operational performance based on accuracyYears of presence in the industry4.5010.0380.549
Period of use of 3PL services1.4950.2270.225
Factor 16: Information Technologies, Information Technology capabilitiesYears of presence in the industry1.3070.2580.202
Period of use of 3PL services4.0620.0490.508
Factor 19: ReputationYears of presence in the industry0.4880.4880.105
Period of use of 3PL services8.3070.0060.808
Disclaimer/Publisher’s Note: The statements, opinions and data contained in all publications are solely those of the individual author(s) and contributor(s) and not of MDPI and/or the editor(s). MDPI and/or the editor(s) disclaim responsibility for any injury to people or property resulting from any ideas, methods, instructions or products referred to in the content.

