
Techniques for Dealcoholization of Wines: Their Impact on Wine Phenolic Composition, Volatile Composition, and Sensory Characteristics

 ,
,  ,
,
Abstract
:1. Introduction
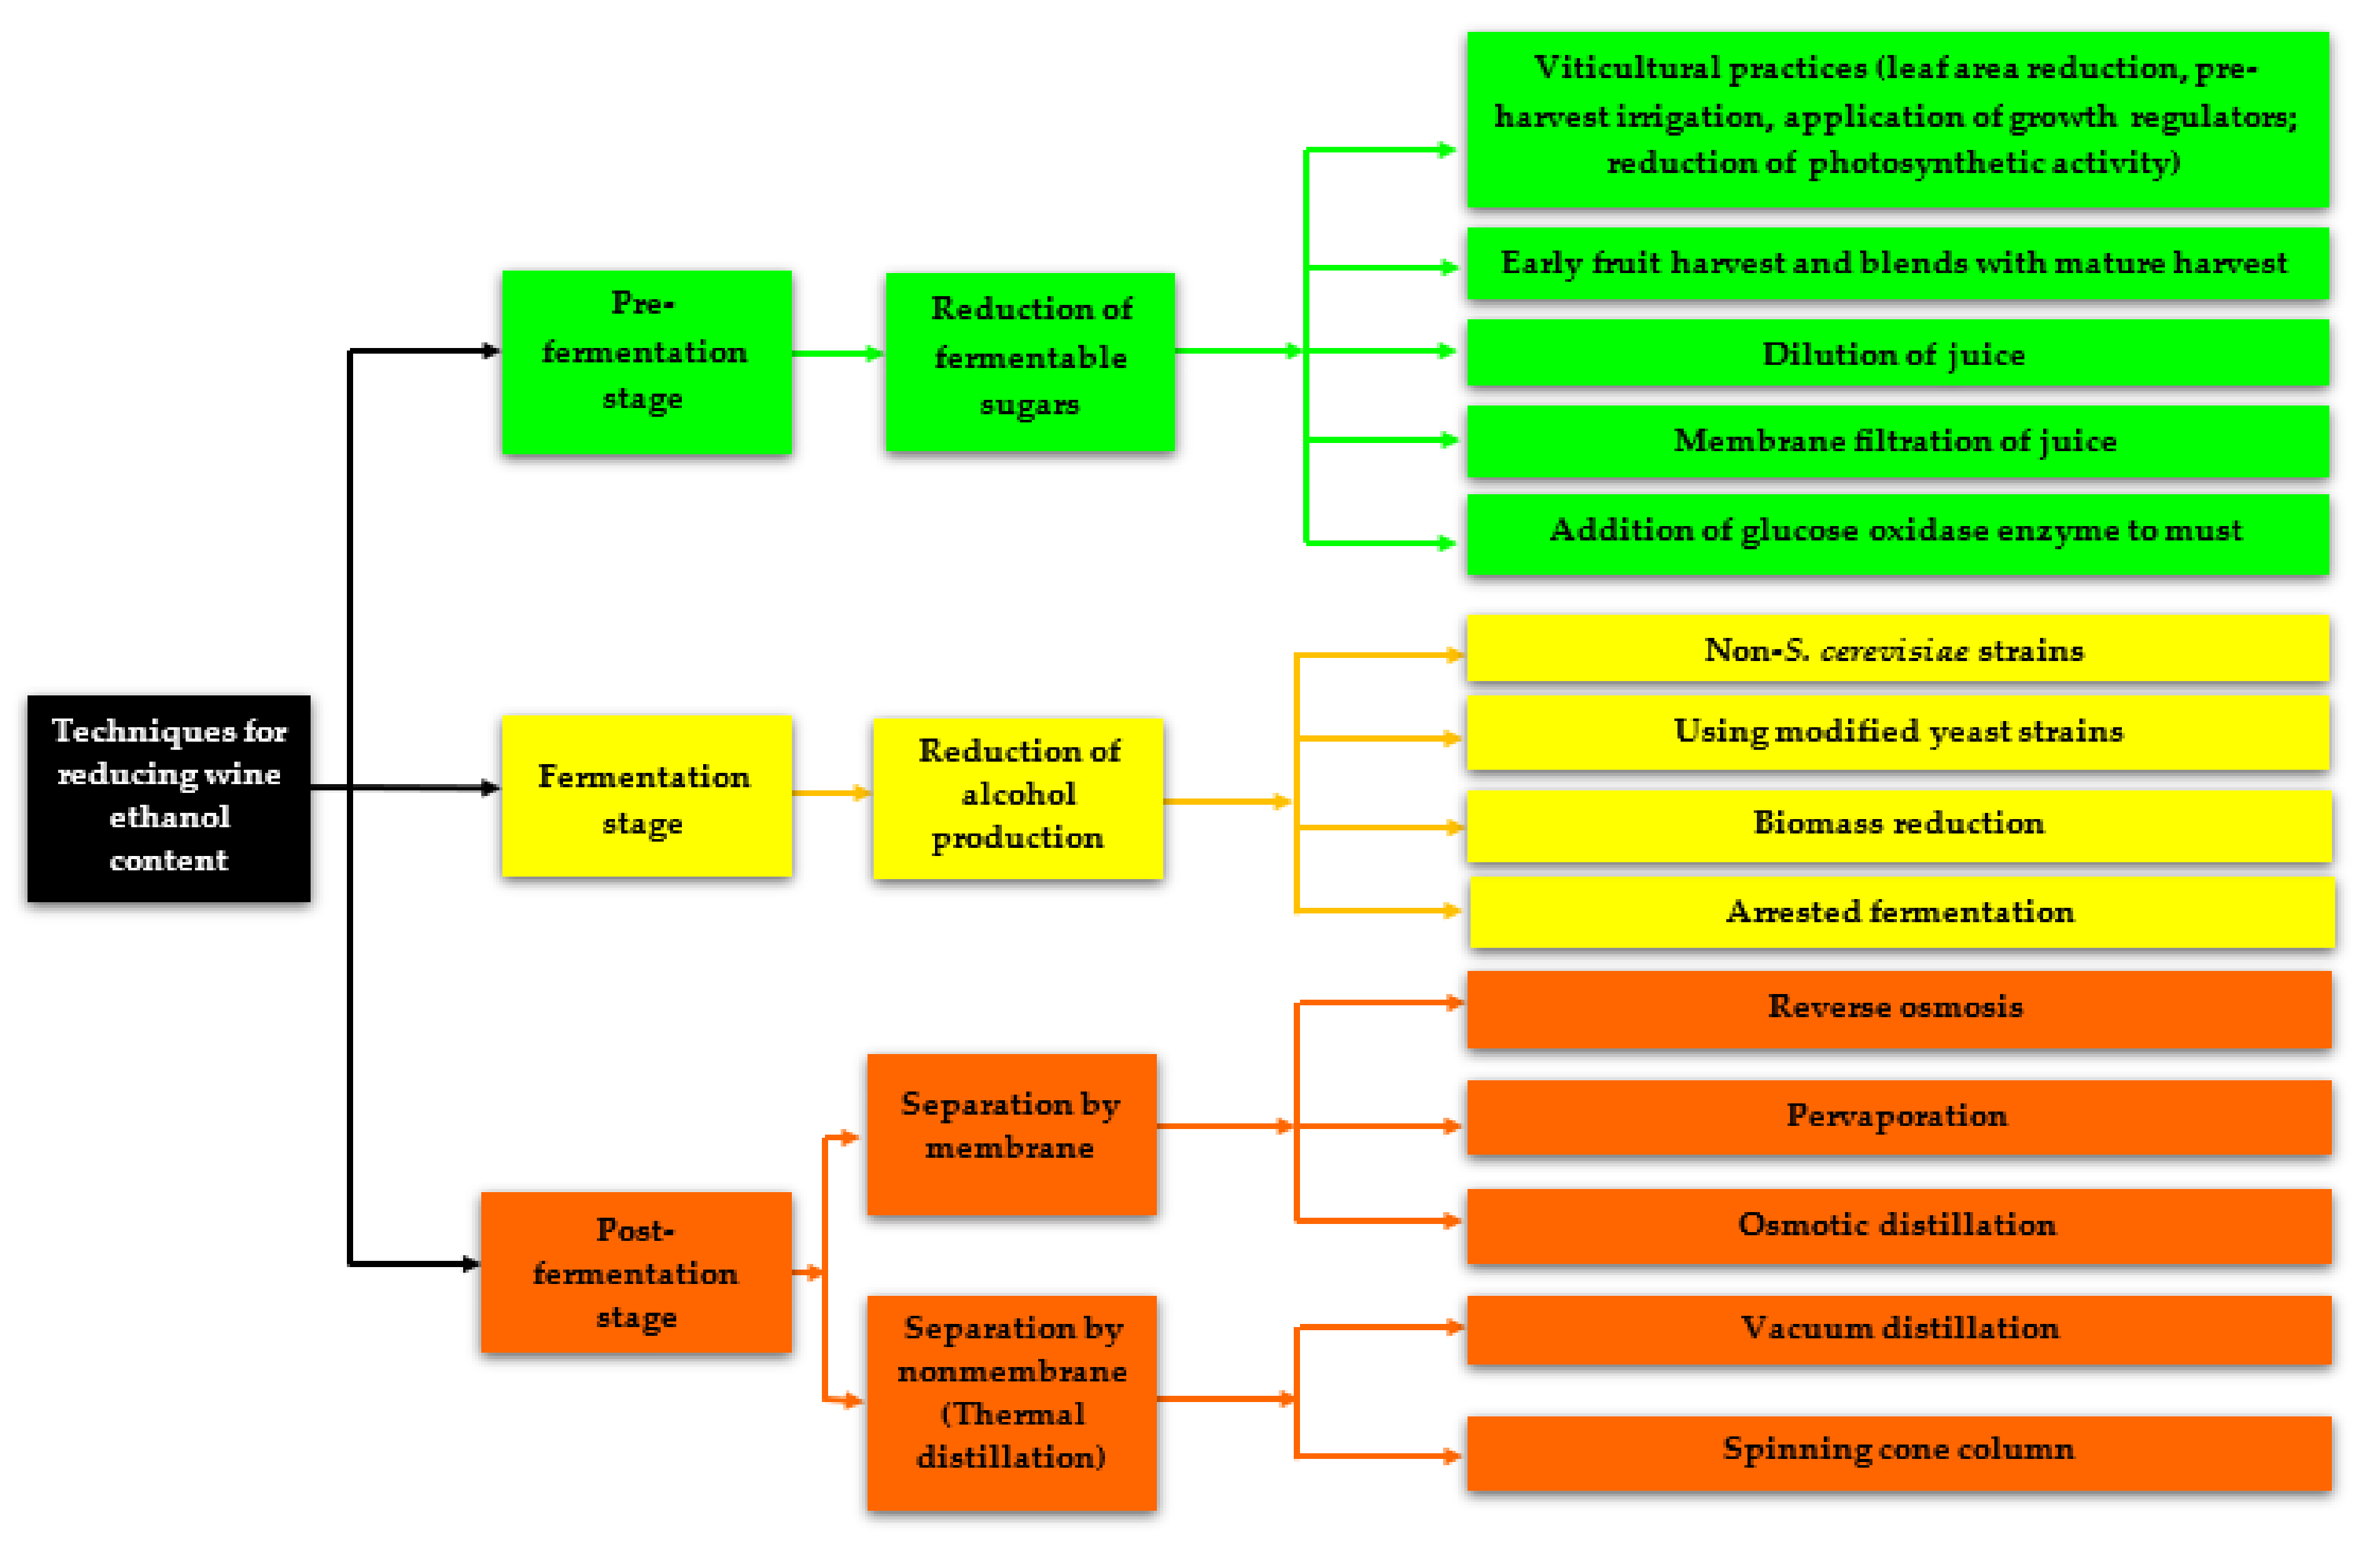
2. Techniques for Wine Alcohol Reduction
2.1. Limiting Alcohol Production during Pre-Fermentation Stage
2.1.1. Viticultural Techniques
2.1.2. Early Grape Harvest
2.1.3. Dilution/Blending of Grape Must
2.1.4. Filtration of Grape Juice
2.1.5. Addition of Enzyme (Glucose Oxidase)
2.2. Reducing Alcohol Production during Fermentation Stage
2.2.1. Use of Non-Saccharomyces cerevisiae Yeasts
2.2.2. Use of Modified Yeast Strains
2.2.3. Biomass Reduction
2.2.4. Arrested or Limited Fermentation
2.3. Reducing Alcohol Production during Post-Fermentation
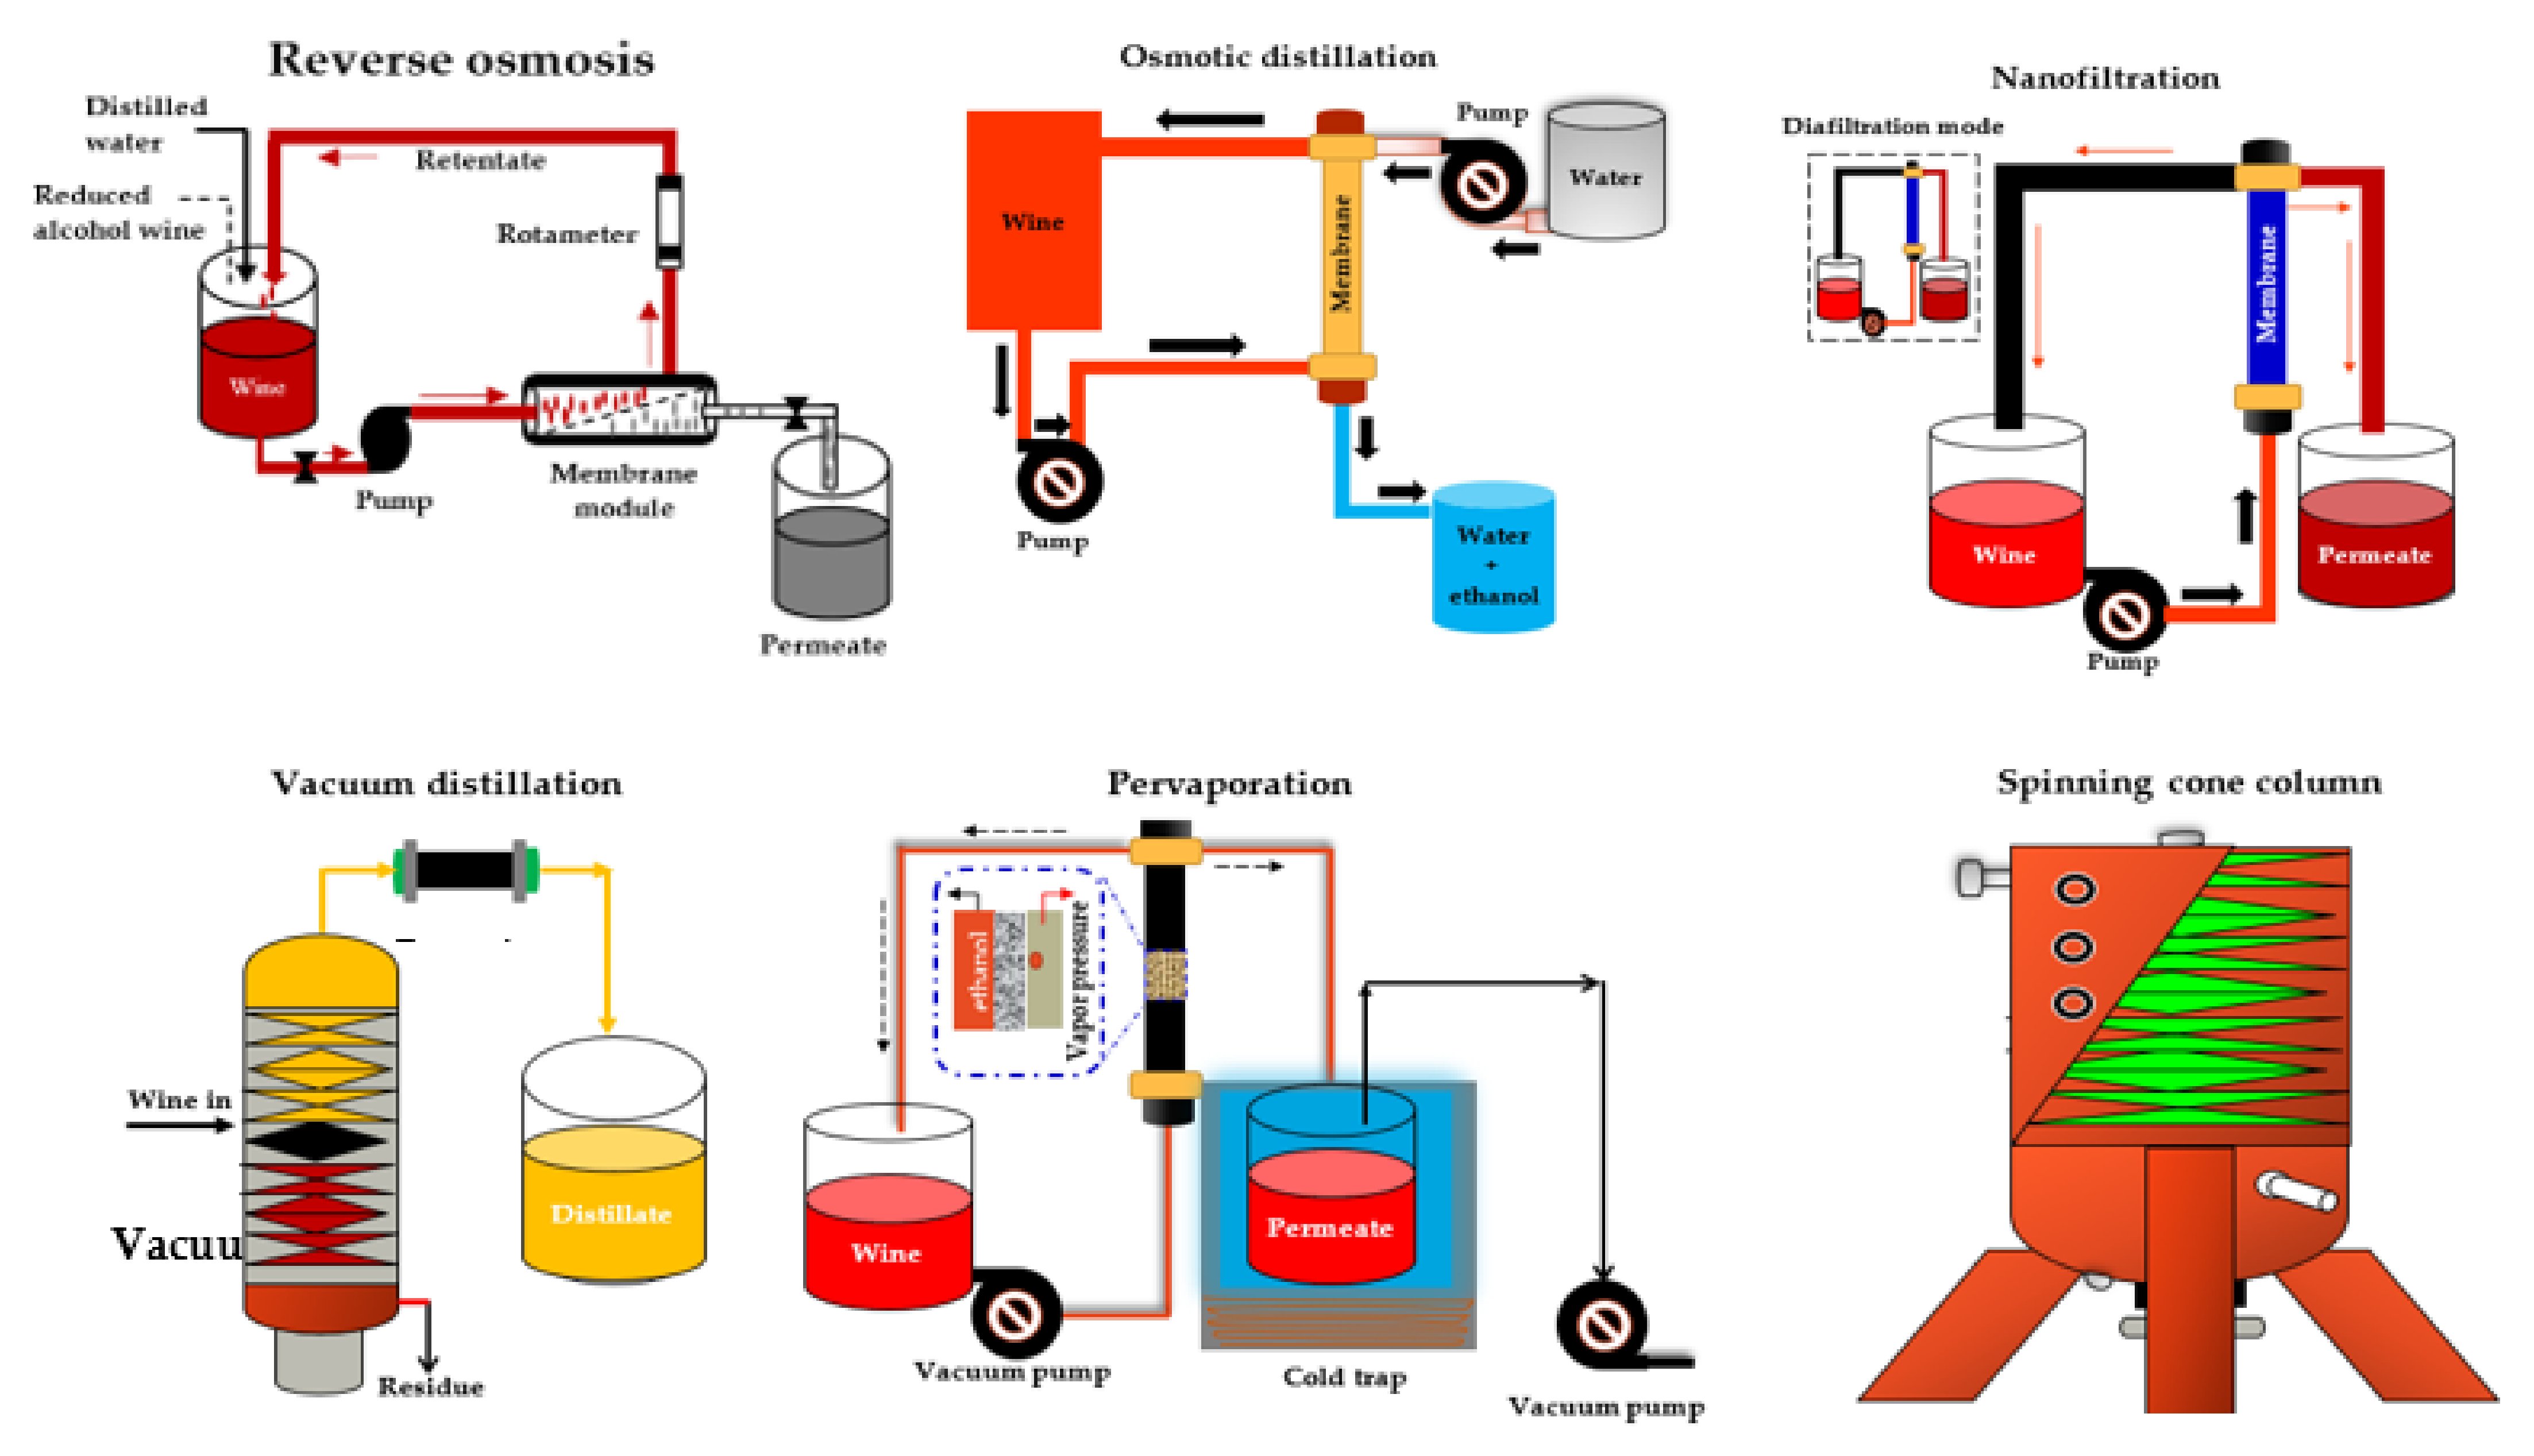
2.3.1. Nanofiltration (NF)
2.3.2. Reverse osmosis (RO)
2.3.3. Osmotic Distillation (OD) or Evaporative Perstraction (EP)
2.3.4. Pervaporation (PV)
2.3.5. Vacuum Distillation or Distillation under Vacuum (VD)
2.3.6. Spinning Cone Column (SCC)
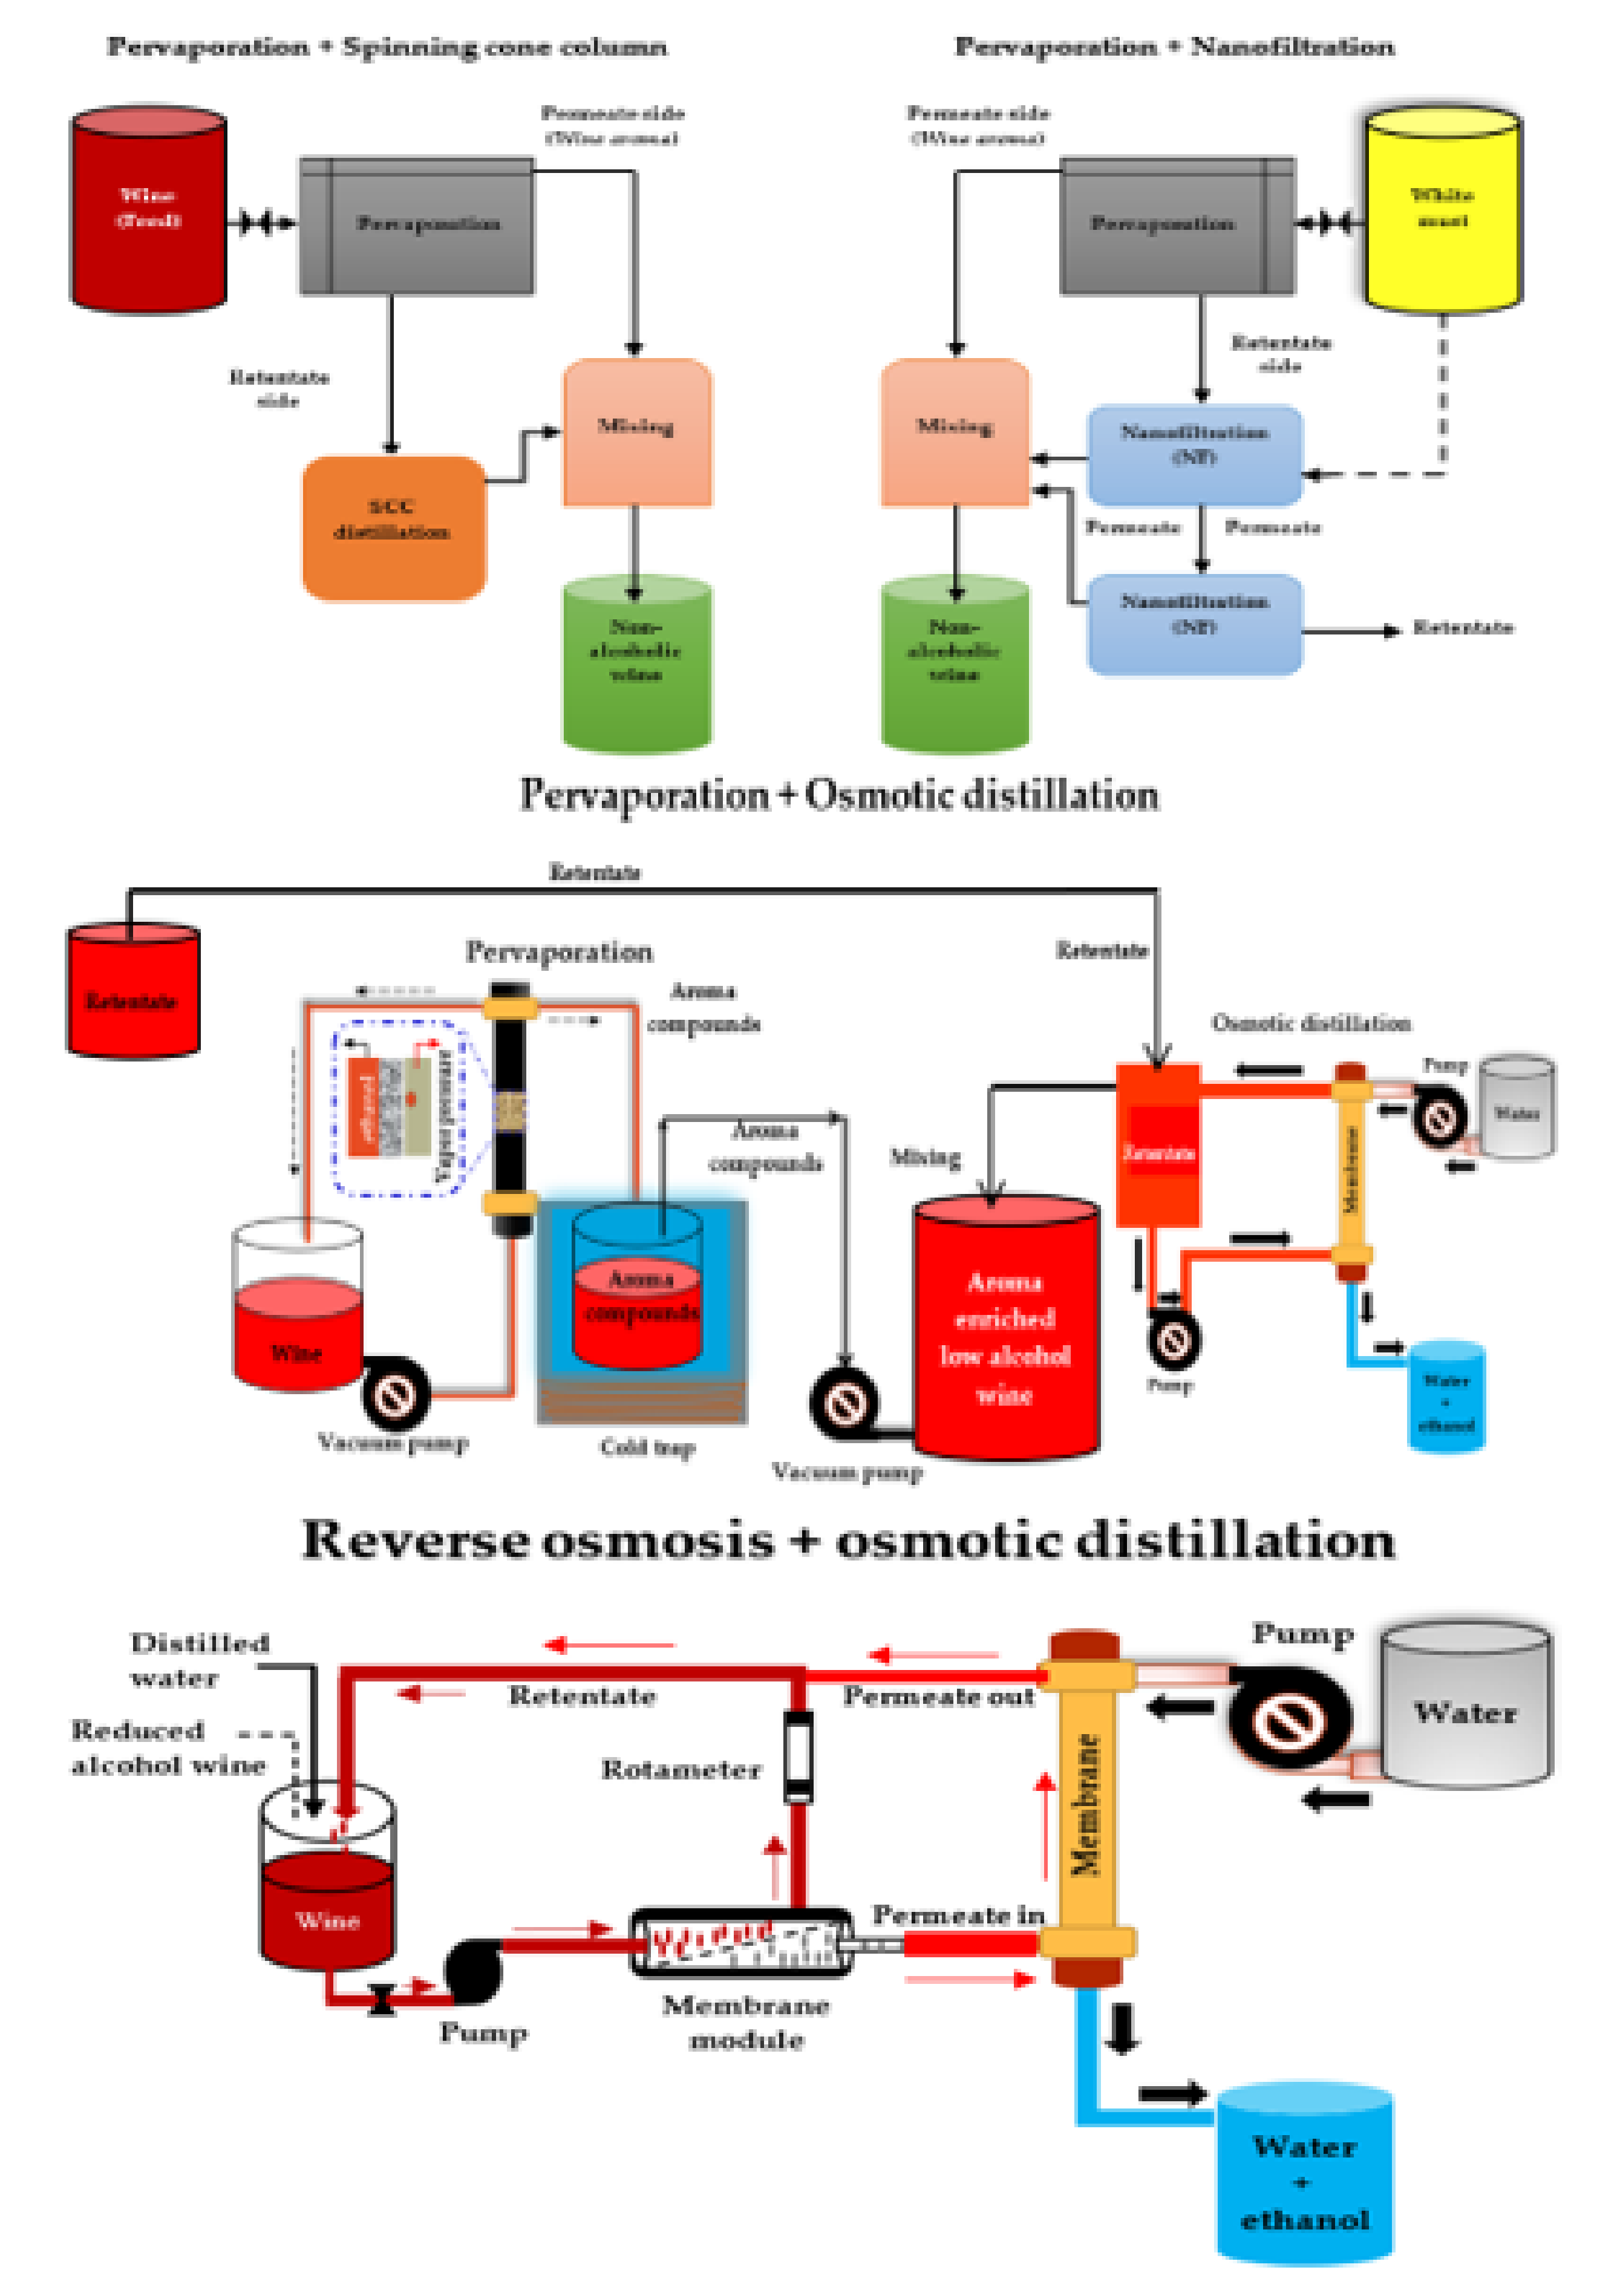
2.3.7. Multi-stage Membrane-based Systems
3. Impact of Dealcoholization Techniques on Wine Quality
3.1. Impact on phenolic composition
3.2. Impact on Volatile Composition
3.3. Impact on Sensory Characteristics
4. Conclusions and Potential Challenges
Author Contributions
Funding
Institutional Review Board Statement
Informed Consent Statement
Data Availability Statement
Conflicts of Interest
References
- Joshi, V.K.; Sharma, S.; Thakur, A.D. Wines: White, Red, Sparkling, Fortified, and Cider. In Current Developments in Biotechnology and Bioengineering: Food and Beverages Industry; Elsevier: Amsterdam, The Netherlands, 2016; pp. 353–406. [Google Scholar] [CrossRef]
- Jackson, R.S. Wines: Types of Table Wines, 1st ed.; Elsevier: Amsterdam, The Netherlands, 2015. [Google Scholar] [CrossRef]
- Pereira, V.; Pereira, A.C.; Marques, J.C. Emerging Trends in Fortified Wines: A Scientific Perspective. In Alcoholic Beverages: Volume 7: The Science of Beverages; Elsevier: Amsterdam, The Netherlands, 2019; pp. 419–470. [Google Scholar] [CrossRef]
- Jackson, R.S. Innovations in Winemaking; Elsevier: Amsterdam, The Netherlands, 2017. [Google Scholar] [CrossRef]
- Pickering, G.J. Low and Reduced-Alcohol Wine: A Review. J. Wine Res. 2000, 11, 37–41. [Google Scholar] [CrossRef]
- Saliba, A.J.; Ovington, L.A.; Moran, C.C. Consumer Demand for Low-Alcohol Wine in an Australian Sample. Int. J. Wine Res. 2013, 5, 1–8. [Google Scholar] [CrossRef] [Green Version]
- OIV. International Standard for the Labelling of Wines, 2022nd ed.; OIV Publications: Paris, France, 2021. [Google Scholar]
- Wine Australia. Low Alcohol Wine; Wine Australia: Adelaide, Australia, 2021. [Google Scholar]
- Taborsky, M.; Ostadal, P.; Petrek, M. A Pilot Randomized Trial Comparing Long-Term Effects of Red and White Wines on Biomarkers of Atherosclerosis (In Vino Veritas: IVV Trial). Bratisl. Lek. List. 2012, 113, 156–158. [Google Scholar] [CrossRef] [PubMed] [Green Version]
- Di Renzo, L.; Carraro, A.; Valente, R.; Iacopino, L.; Colica, C.; De Lorenzo, A. Intake of Red Wine in Different Meals Modulates Oxidized LDL Level, Oxidative and Inflammatory Gene Expression in Healthy People: A Randomized Crossover Trial. Oxidative Med. Cell. Longev. 2014, 2014, 1–9. [Google Scholar] [CrossRef]
- World Health Organisation. Global Status Report on Alcohol and Health 2018; WHO: Geneva, Switzeland, 2018; Volume 65. [Google Scholar] [CrossRef]
- World Health Organisation. Global Status Report on Alcohol and Health 2014. 2014, pp. 1–392. Available online: https://doi.org//entity/substance_abuse/publications/global_alcohol_report/en/index.html (accessed on 31 December 2020).
- Snopek, L.; Mlcek, J.; Sochorova, L.; Baron, M.; Hlavacova, I.; Jurikova, T.; Kizek, R.; Sedlackova, E.; Sochor, J. Contribution of Red Wine Consumption to Human Health Protection. Molecules 2018, 23, 1684. [Google Scholar] [CrossRef] [Green Version]
- Artero, A.; Artero, A.; Tarín, J.J.; Cano, A. The Impact of Moderate Wine Consumption on Health. Maturitas 2015, 80, 3–13. [Google Scholar] [CrossRef]
- Boban, M.; Stockley, C.; Teissedre, P.-L.; Restani, P.; Fradera, U.; Stein-Hammer, C.; Ruf, J.C. Drinking Pattern of Wine and Effects on Human Health: Why Should We Drink Moderately and with Meals? Food Funct. 2016, 7, 2937–2942. [Google Scholar] [CrossRef] [Green Version]
- Yuan, J.-M.; Ross, R.K.; Gao, Y.-T.; Henderson, B.E.; Yu, M.C. Follow up Study of Moderate Alcohol Intake and Mortality among Middle Aged Men in Shanghai, China. BMJ 1997, 314, 18–23. [Google Scholar] [CrossRef] [Green Version]
- Buettner, D.; Skemp, S. Blue Zones: Lessons from the World’s Longest Lived. Am. J. Lifestyle Med. 2016, 10, 318–321. [Google Scholar] [CrossRef]
- Stockley, C.S. Is It Merely a Myth That Alcoholic Beverages Such as Red Wine Can Be Cardioprotective? Sci. Food Agric. 2012, 92, 1815–1821. [Google Scholar] [CrossRef]
- Escudero, A.; Campo, E.; Fariña, L.; Cacho, J.; Ferreira, V. Analytical Characterization of the Aroma of Five Premium Red Wines. Insights into the Role of Odor Families and the Concept of Fruitiness of Wines. J. Agric. Food Chem. 2007, 55, 4501–4510. [Google Scholar] [CrossRef]
- Frost, R.; Quiñones, I.; Veldhuizen, M.; Alava, J.I.; Small, D.; Carreiras, M. What Can the Brain Teach Us about Winemaking? An FMRI Study of Alcohol Level Preferences. PLoS ONE 2015, 10, e0119220. [Google Scholar] [CrossRef]
- Robinson, A.L.; Ebeler, S.E.; Heymann, H.; Boss, P.K.; Solomon, P.S.; Trengove, R.D. Interactions between Wine Volatile Compounds and Grape and Wine Matrix Components Influence Aroma Compound Headspace Partitioning. J. Agric. Food Chem. 2009, 57, 10313–10322. [Google Scholar] [CrossRef]
- Gil, M.; Estévez, S.; Kontoudakis, N.; Fort, F.; Canals, J.-M.; Zamora, F. Influence of Partial Dealcoholization by Reverse Osmosis on Red Wine Composition and Sensory Characteristics. Eur. Food Res. Technol. 2013, 237, 481–488. [Google Scholar] [CrossRef]
- Alston, J.M.; Fuller, K.B.; Lapsley, J.T.; Soleas, G.; Tumber, K.P. Splendide Mendax: False Label Claims About High and Rising Alcohol Content of Wine. J. Wine Econ. 2015, 10, 275–313. [Google Scholar] [CrossRef]
- Report FACT4532MR. Non-Alcoholic Wine Market Forecast, Trend Analysis & Competition Tracking. Global Market Insights 2019 to 2027; Market Forecast R: London, UK, 2020. [Google Scholar]
- Ruf, J.-C. The Implementation of the OIV Standards at the International Level and in the Framework of Innovation in the Wine Sector, CEICS-Tarragona; OIV: Paris, France, 2011; Volume 33. [Google Scholar]
- Thompson, D. Wine Intelligence Report Brochure. Lower Alcohol Wines a Multi-market Perspective; Wine Intelligence: London, UK, 2016. [Google Scholar]
- Longo, R.; Blackman, J.W.; Torley, P.J.; Rogiers, S.Y.; Schmidtke, L.M. Changes in Volatile Composition and Sensory Attributes of Wines during Alcohol Content Reduction. J. Sci. Food Agric. 2017, 97, 8–16. [Google Scholar] [CrossRef]
- Schmidtke, L.M.; Blackman, J.W.; Agboola, S.O. Production Technologies for Reduced Alcoholic Wines. J. Food Sci. 2012, 77, 25–41. [Google Scholar] [CrossRef]
- Takács, L.; Vatai, G.; Korány, K. Production of Alcohol Free Wine by Pervaporation. J. Food Eng. 2007, 78, 118–125. [Google Scholar] [CrossRef]
- Varela, C.; Dry, P.R.; Kutyna, D.R.; Francis, I.L.; Henschke, P.A.; Curtin, C.D.; Chambers, P.J. Strategies for Reducing Alcohol Concentration in Wine. Aust. J. Grape Wine Res. 2015, 21, 670–679. [Google Scholar] [CrossRef]
- Kosseva, M.R. Chemical Engineering Aspects of Fruit Wine Production. In Science and Technology of Fruit Wine Production; Kosseva, M.R., Joshi, V.K., Panesar, P.S., Eds.; Academic Press: San Diego, CA, USA, 2017; pp. 253–293. [Google Scholar] [CrossRef]
- Lisanti, M.T.; Gambuti, A.; Genovese, A.; Piombino, P.; Moio, L. Partial Dealcoholization of Red Wines by Membrane Contactor Technique: Effect on Sensory Characteristics and Volatile Composition. Food Bioprocess Technol. 2013, 6, 2289–2305. [Google Scholar] [CrossRef]
- Catarino, M.; Mendes, A. Dealcoholizing Wine by Membrane Separation Processes. Innov. Food Sci. Emerg. Technol. 2011, 12, 330–337. [Google Scholar] [CrossRef]
- Bui, K.; Dick, R.; Moulin, G.; Galzy, P. A Reverse Osmosis for the Production of Low Ethanol Content Wine. Am. J. Enol. Vitic. 1986, 37, 297–300. [Google Scholar]
- Corona, O.; Liguori, L.; Albanese, D.; Di Matteo, M.; Cinquanta, L.; Russo, P. Quality and Volatile Compounds in Red Wine at Different Degrees of Dealcoholization by Membrane Process. Eur. Food Res. Technol. 2019, 245, 2601–2611. [Google Scholar] [CrossRef]
- Liguori, L.; Albanese, D.; Crescitelli, A.; Di Matteo, M.; Russo, P. Impact of Dealcoholization on Quality Properties in White Wine at Various Alcohol Content Levels. J. Food Sci. Technol. 2019, 56, 3707–3720. [Google Scholar] [CrossRef]
- Jones, G.V.; White, M.A.; Cooper, O.R.; Storchmann, K. Climate Change and Global Wine Quality. Clim. Change 2005, 73, 319–343. [Google Scholar] [CrossRef]
- Martínez De Toda, F.; Balda, P. Delaying Berry Ripening through Manipulating Leaf Area to Fruit Ratio. Vitis J. Grapevine Res. 2013, 52, 171–176. [Google Scholar]
- Palliotti, A.; Panara, F.; Silvestroni, O.; Lanari, V.; Sabbatini, P.; Howell, G.S.; Gatti, M.; Poni, S. Influence of Mechanical Postveraison Leaf Removal Apical to the Cluster Zone on Delay of Fruit Ripening in Sangiovese (Vitis Vinifera L.). Grapevines. Aust. J. Grape Wine Res. 2013, 19, 369–377. [Google Scholar] [CrossRef]
- Novello, V.; de Palma, L. Viticultural strategy to reduce alcohol levels in wine. In Alcohol Level Reduction in Wine—Oenoviti International Network; Vigne Et Vin Publications International: Bordeuax, France, 2013. [Google Scholar]
- Poni, S.; Gatti, M.; Bernizzoni, F.; Civardi, S.; Bobeica, N.; Magnanini, E.; Palliotti, A. Late Leaf Removal Aimed at Delaying Ripening in Cv. Sangiovese: Physiological Assessment and Vine Performance. Aust. J. Grape Wine Res. 2013, 19, 378–387. [Google Scholar] [CrossRef]
- Kliewer, W.M.; Dokoozlian, N.K. Leaf Area/Crop Weight Ratios of Grapevines: Influence on Fruit Composition and Wine Quality. Am. J. Enol. Vitic. 2005, 56, 170–181. [Google Scholar]
- Liguori, L.; Russo, P.; Albanese, D.; Di Matteo, M. Production of Low-Alcohol Beverages: Current Status and Perspectives; Elsevier Inc.: Amsterdam, The Netherlands, 2018. [Google Scholar] [CrossRef]
- Zhang, P.; Wu, X.; Needs, S.; Liu, D.; Fuentes, S.; Howell, K. The Influence of Apical and Basal Defoliation on the Canopy Structure and Biochemical Composition of Vitis Vinifera Cv. Shiraz Grapes and Wine. Front. Chem. 2017, 5, 1–9. [Google Scholar] [CrossRef] [Green Version]
- Filippetti, I.; Allegro, G.; Movahed, N.; Pastore, C.; Valentini, G.; Intrieri, C. Effect of Late-Season Limitations Induced by Trimming and Antitranspirants Canopy Sray on Grape Composition during Ripening in Vitis Vinifera Cv. Sangiovese Progr. Agric. Vitic. Hors Série Spec. 2011, 17, 259–262. [Google Scholar]
- Böttcher, C.; Harvey, K.; Forde, C.G.; Boss, P.K.; Davies, C. Auxin Treatment of Pre-Veraison Grape (Vitis Vinifera L.) Berries Both Delays Ripening and Increases the Synchronicity of Sugar Accumulation. Aust. J. Grape Wine Res. 2011, 17, 1–8. [Google Scholar] [CrossRef]
- Palliotti, A.; Poni, S.; Berrios, J.G.; Bernizzoni, F. Vine Performance and Grape Composition as Affected by Early-Season Source Limitation Induced with Anti-Transpirants in Two Red Vitis Vinifera L. Cultivars. Aust. J. Grape Wine Res. 2010, 16, 426–433. [Google Scholar] [CrossRef]
- Martínez De Toda, F.; Sancha, J.C.; Zheng, W.; Balda, P. Leaf Area Reduction by Trimming, a Growing Technique to Restore the Anthocyanins: Sugars Ratio Decoupled by the Warming Climate. Vitis J. Grapevine Res. 2014, 53, 189–192. [Google Scholar]
- Stoll, M.; Lafontaine, M.; Schultz, H.R. Possibilities to Reduce the Velocity of Berry Maturation through Various Leaf Area to Fruit Ratio Modifications in Vitis Vinifera L. Riesling. Progrès Agric. Vitic. 2010, 127, 68–71. [Google Scholar]
- Stoll, M.; Bischoff-Schaefer, M.; Lafontaine, M.; Tittmann, S.; Henschke, J. Impact of Various Leaf Area Modifications on Berry Maturation in Vitis Vinifera L. “Riesling.”. Acta Hortic. 2013, 978, 293–300. [Google Scholar] [CrossRef]
- Sun, Q.; Sacks, G.L.; Lerch, S.D.; van den Heuvel, J.E. Impact of Shoot and Cluster Thinning on Yield, Fruit Composition, and Wine Quality of Corot Noir. Am. J. Enol. Vitic. 2012, 63, 49–56. [Google Scholar] [CrossRef]
- Parker, A.K.; Hofmann, R.W.; van Leeuwen, C.; Mclachlan, A.R.G.; Trought, M.C.T. Manipulating the Leaf Area to Fruit Mass Ratio Alters the Synchrony of Total Soluble Solids Accumulation and Titratable Acidity of Grape Berries. Aust. J. Grape Wine Res. 2015, 21, 266–276. [Google Scholar] [CrossRef]
- Palliotti, A.; Cini, R.; Leoni, F.; Silvestroni, O.; Poni, S. Effects of Late Mechanized Leaf Removal above the Clusters Zone to Delay Grape Ripening in “Sangiovese” Vines. Acta Hortic. 2013, 978, 301–308. [Google Scholar] [CrossRef]
- De Toda, F.M.; Sancha, J.C.; Balda, P. Reducing the Sugar and PH of the Grape (Vitis Vinifera l. Cvs. “Grenache” and ’Tempranillo’) through a Single Shoot Trimming. South African J. Enol. Vitic. 2013, 34, 246–251. [Google Scholar] [CrossRef]
- De Palma, L.; Tarricone, L.; Muci, G.; Limosani, P.; Savino, M.; Novello, V. Leaf Removal, Vine Physiology and Wine Quality in Cv. Negroamaro (Vitis Vinifera L.). Progrès Agric. Vitic. 2011, 17, 231–234. [Google Scholar]
- Bindon, K.; Varela, C.; Kennedy, J.; Holt, H.; Herderich, M. Relationships between Harvest Time and Wine Composition in Vitis Vinifera L. Cv. Cabernet Sauvignon 1. Grape and Wine Chemistry. Food Chem. 2013, 138, 1696–1705. [Google Scholar] [CrossRef]
- Bindon, K.; Holt, H.; Williamson, P.O.; Varela, C.; Herderich, M.; Francis, I.L. Relationships between Harvest Time and Wine Composition in Vitis Vinifera L. Cv. Cabernet Sauvignon 2. Wine Sensory Properties and Consumer Preference. Food Chem. 2014, 154, 90–101. [Google Scholar] [CrossRef]
- Martínez de Toda, F.; Balda, P. Decreasing the alcohol level in quality red wines by the “double harvest” technique. In Proceedings of the 17th International Symposium Giesco, Asti, Italia, 29 August–2 September 2011. [Google Scholar]
- Kontoudakis, N.; Esteruelas, M.; Fort, F.; Canals, J.-M.; Zamora, F. Use of Unripe Grapes Harvested during Cluster Thinning as a Method for Reducing Alcohol Content and PH of Wine. Aust. J. Grape Wine Res. 2011, 17, 230–238. [Google Scholar] [CrossRef]
- Asproudi, A.; Ferrandino, A.; Bonello, F.; Vaudano, E.; Pollon, M.; Petrozziello, M. Key Norisoprenoid Compounds in Wines from Early-Harvested Grapes in View of Climate Change. Food Chem. 2018, 268, 143–152. [Google Scholar] [CrossRef]
- Schelezki, O.J.; Antalick, G.; Šuklje, K.; Jeffery, D.W. Pre-Fermentation Approaches to Producing Lower Alcohol Wines from Cabernet Sauvignon and Shiraz: Implications for Wine Quality Based on Chemical and Sensory Analysis. Food Chem. 2019, 309, 125698. [Google Scholar] [CrossRef]
- Schelezki, O.J.; Šuklje, K.; Boss, P.K.; Jeffery, D.W. Comparison of Consecutive Harvests versus Blending Treatments to Produce Lower Alcohol Wines from Cabernet Sauvignon Grapes: Impact on Wine Volatile Composition and Sensory Properties. Food Chem. 2018, 259, 196–206. [Google Scholar] [CrossRef]
- Schelezki, O.J.; Deloire, A.; Jeffery, D.W. Substitution or Dilution? Assessing Pre-Fermentative Water Implementation to Produce Lower Alcohol Shiraz Wines. Molecules 2020, 25, 2245. [Google Scholar] [CrossRef]
- Piccardo, D.; Favre, G.; Pascual, O.; Canals, J.M.; Zamora, F.; González-Neves, G. Influence of the Use of Unripe Grapes to Reduce Ethanol Content and PH on the Color, Polyphenol and Polysaccharide Composition of Conventional and Hot Macerated Pinot Noir and Tannat Wines. Eur. Food Res. Technol. 2019, 245, 1321–1335. [Google Scholar] [CrossRef]
- Teslić, N.; Patrignani, F.; Ghidotti, M.; Parpinello, G.P.; Ricci, A.; Tofalo, R.; Lanciotti, R.; Versari, A. Utilization of ‘Early Green Harvest’ and Non-Saccharomyces Cerevisiae Yeasts as a Combined Approach to Face Climate Change in Winemaking. Eur. Food Res. Technol. 2018, 244, 1301–1311. [Google Scholar] [CrossRef]
- Longo, R.; Blackman, J.W.; Antalick, G.; Torley, P.J.; Rogiers, S.Y.; Schmidtke, L.M. Harvesting and Blending Options for Lower Alcohol Wines: A Sensory and Chemical Investigation. J. Sci. Food Agric. 2018, 98, 33–42. [Google Scholar] [CrossRef]
- Petrie, P.R.; Teng, B.; Smith, P.A.; Bindon, K.A. Sugar Reduction: Managing High Baume Juice Using Dilution. Wine Vitic. J. 2019, 34, 36–37. [Google Scholar]
- Heymann, H.; Licalzi, M.; Conversano, M.R.; Bauer, A.; Skogerson, K.; Matthews, M.; Cellars, B.W.; Street, W. Effects of Extended Grape Ripening with or Without Must and Wine Alcohol Manipulations on Cabernet Sauvignon Wine Sensory Characteristics. South African J. Enol. Vitic. 2013, 34, 86–99. [Google Scholar] [CrossRef]
- Gardner, J.M.; Walker, M.E.; Boss, P.K.; Jiranek, V. The Effect of Grape Juice Dilution on Oenological Fermentation. bioRxiv 2020. [Google Scholar] [CrossRef]
- Teng, B.; Petrie, P.R.; Nandorfy, D.E.; Smith, P.; Bindon, K. Pre-Fermentation Water Addition to High-Sugar Shiraz Must: Effects on Wine Composition and Sensory Properties. Foods 2020, 9, 1193. [Google Scholar] [CrossRef]
- Teng, B.; Petrie, P.R.; Smith, P.A.; Bindon, K.A. Comparison of Water Addition and Early-Harvest Strategies to Decrease Alcohol Concentration in Vitis Vinifera Cv. Shiraz Wine: Impact on Wine Phenolics, Tannin Composition and Colour Properties. Aust. J. Grape Wine Res. 2020, 26, 158–171. [Google Scholar] [CrossRef]
- Salomon, A. Techniques to Achieve Moderate Alcohol Levels in South African Wine; Cape Wine Masters (Diplome Assignment): Sandton, South Africa, 2006. [Google Scholar]
- Harbertson, J.F.; Mireles, M.S.; Harwood, E.D.; Weller, K.M.; Ross, C.F. Chemical and Sensory Effects of Saignée, Water Addition, and Extended Maceration on High Brix Must. Am. J. Enol. Vitic. 2009, 60, 450–460. [Google Scholar]
- García-Martín, N.; Perez-Magariño, S.; Ortega-Heras, M.; González-Huerta, C.; Mihnea, M.; González-Sanjosé, M.L.; Palacio, L.; Prádanos, P.; Hernández, A. Sugar Reduction in Musts with Nanofiltration Membranes to Obtain Low Alcohol-Content Wines. Sep. Purif. Technol. 2010, 76, 158–170. [Google Scholar] [CrossRef]
- García-Martín, N.; Perez-Magariño, S.; Ortega-Heras, M. Sugar reduction in white and red musts with nanofiltration membranes. Desalin. Water Treat. 2011, 27, 167–174. [Google Scholar] [CrossRef]
- Mihnea, M.; González-SanJosé, M.L.; Ortega-Heras, M.; Pérez-Magariño, S.; García-Martin, N.; Palacio, L.; Prádanos, P.; Hernández, A. Volatile Composition of Verdejo Wines. J. Agric. Food Chem. 2012, 60, 7050–7063. [Google Scholar] [CrossRef]
- Mira, H.; Guiomar, A.; Geraldes, V.; De Pinho, M.N. Membrane Processing of Grape Must for Control of the Alcohol Content in Fermented Beverages. J. Membr. Sci. Res. 2017, 3, 308–312. [Google Scholar] [CrossRef]
- Salgado, C.; Carmona, F.J.; Palacio, L.; Prádanos, P.; Hernández, A. Evaluation of Nanofiltration Membranes for Sugar Reduction in Red Grape Must. Procedia Eng. 2012, 44, 1716–1717. [Google Scholar] [CrossRef] [Green Version]
- Salgado, C.M.; Fernández-Fernández, E.; Palacio, L.; Hernández, A.; Prádanos, P. Alcohol Reduction in Red and White Wines by Nanofiltration of Musts before Fermentation. Food Bioprod. Process. 2015, 96, 285–295. [Google Scholar] [CrossRef] [Green Version]
- Salgado, C.M.; Fernández-Fernández, E.; Palacio, L.; Carmona, F.J.; Hernández, A.; Prádanos, P. Application of Pervaporation and Nanofiltration Membrane Processes for the Elaboration of Full Flavored Low Alcohol White Wines. Food Bioprod. Process. 2017, 101, 11–21. [Google Scholar] [CrossRef]
- Salgado, C.M.; Palacio, L.; Prádanos, P.; Hernández, A.; González-Huerta, C.; Pérez-Magari, S. Comparative Study of Red Grape Must Nanofiltration: Laboratory and Pilot Plant Scales. Food Bioprod. Process. 2015, 94, 610–620. [Google Scholar] [CrossRef] [Green Version]
- Cassano, A.; Mecchia, A.; Drioli, E. Analyses of Hydrodynamic Resistances and Operating Parameters in the Ultrafiltration of Grape Must. J. Food Eng. 2008, 89, 171–177. [Google Scholar] [CrossRef]
- Salgado, C.; Palacio, L.; Carmona, F.J.; Hernández, A.; Prádanos, P. In Fluence of Low and High Molecular Weight Compounds on the Permeate Flux Decline in Nano Filtration of Red Grape Must. Desalination 2013, 315, 124–134. [Google Scholar] [CrossRef]
- Biyela, B.N.E.; du Toit, W.J.; Divol, B.; Malherbe, D.F.; van Rensburg, P. The Production of Reduced-Alcohol Wines Using Gluzyme Mono® 10.000 BG-Treated Grape Juice. South African J. Enol. Vitic. 2009, 30, 124–132. [Google Scholar] [CrossRef] [Green Version]
- Pickering, G.J.; Heatherbell, D.A.; Barnes, M.F. The Production of Reduced-Alcohol Wine Using Glucose Oxidase-Treated Juice. Part III. Sensory. Am. J. Enol. Vitic. 1999, 50, 307–316. [Google Scholar]
- Pickering, G.J.; Heatherbell, D.A.; Barnes, M.F. Optimising Glucose Conversion in the Production of Reduced Alcohol Wine Using Glucose Oxidase. Food Res. Int. 1998, 31, 685–692. [Google Scholar] [CrossRef]
- Röcker, J.; Schmitt, M.; Pasch, L.; Ebert, K.; Grossmann, M. The Use of Glucose Oxidase and Catalase for the Enzymatic Reduction of the Potential Ethanol Content in Wine. Food Chem. 2016, 210, 660–670. [Google Scholar] [CrossRef] [PubMed]
- Ruiz, E.; Busto, M.D.; Ramos-Gómez, S.; Palacios, D.; Pilar-Izquierdo, M.C.; Ortega, N. Encapsulation of Glucose Oxidase in Alginate Hollow Beads to Reduce the Fermentable Sugars in Simulated Musts. Food Biosci. 2018, 24, 67–72. [Google Scholar] [CrossRef]
- Pickering, G. The Production of Reduced-Alcohol Wine Using Glucose Oxidase. Ph.D. Thesis, Lincoln University, Lincoln, UK, 1997. [Google Scholar]
- Al Daccache, M.; Koubaa, M.; Salameh, D.; Vorobiev, E.; Maroun, R.G.; Louka, N. Control of the Sugar/Ethanol Conversion Rate during Moderate Pulsed Electric Field-Assisted Fermentation of a Hanseniaspora Sp. Strain to Produce Low-Alcohol Cider. Innov. Food Sci. Emerg. Technol. 2020, 59, 102258. [Google Scholar] [CrossRef]
- Canonico, L.; Comitini, F.; Oro, L.; Ciani, M. Sequential Fermentation with Selected Immobilized Non- Saccharomyces Yeast for Reduction of Ethanol Content in Wine. Front. Microbiol. 2016, 7, 278. [Google Scholar] [CrossRef] [PubMed] [Green Version]
- Ferraro, L.; Fatichenti, F.; Ciani, M. Pilot Scale Vinification Process Using Immobilized Candida Stellata Cells and Saccharomyces cerevisiae. Process Biochem. 2000, 35, 1125–1129. [Google Scholar] [CrossRef]
- García, V.; Vásquez, H.; Fonseca, F.; Manzanares, P.; Viana, F.; Martínez, C.; Ganga, M.A. Effects of Using Mixed Wine Yeast Cultures in the Production of Chardonnay Wines. Rev. Argent. Microbiol. 2010, 42, 226–229. [Google Scholar]
- Gonzalez, R.; Quirós, M.; Morales, P. Yeast Respiration of Sugars by Non-Saccharomyces Yeast Species: A Promising and Barely Explored Approach to Lowering Alcohol Content of Wines. Trends Food Sci. Technol. 2013, 29, 55–61. [Google Scholar] [CrossRef]
- Kutyna, D.R.; Varela, C.; Henschke, P.A.; Chambers, P.J.; Stanley, G.A. Microbiological Approaches to Lowering Ethanol Concentration in Wine. Trends Food Sci. Technol. 2010, 21, 293–302. [Google Scholar] [CrossRef]
- Lemos, W.J.F., Jr.; Nadai, C.; Tamara, L.; Sales, V.; Oliveira, D.; Dupas, A.; Matos, D.; Giacomini, A.; Corich, V. Potential Use of Starmerella bacillaris as Fermentation Starter for the Production of Low-Alcohol Beverages Obtained from Unripe Grapes. Int. J. Food Microbiol. 2019, 303, 1–8. [Google Scholar] [CrossRef]
- Magyar, I.; Tóth, T. Comparative Evaluation of Some Oenological Properties in Wine Strains of Candida Stellata, Candida zemplinina, Saccharomyces uvarum and Saccharomyces cerevisiae. Food Microbiol. 2011, 28, 94–100. [Google Scholar] [CrossRef]
- Maturano, Y.P.; Mestre, M.V.; Kuchen, B.; Toro, M.E.; Mercado, L.A.; Vazquez, F.; Combina, M. Optimization of Fermentation-Relevant Factors: A Strategy to Reduce Ethanol in Red Wine by Sequential Culture of Native Yeasts. Int. J. Food Microbiol. 2019, 289, 40–48. [Google Scholar] [CrossRef]
- Milanovic, V.; Ciani, M.; Oro, L.; Comitini, F. Starmerella Bombicola Influences the Metabolism of Saccharomyces cerevisiae at Pyruvate Decarboxylase and Alcohol Dehydrogenase Level during Mixed Wine Fermentation. Microb. Cell Factories 2020, 11, 10–13. [Google Scholar] [CrossRef] [Green Version]
- Morales, P.; Rojas, V.; Quirós, M.; Gonzalez, R. The Impact of Oxygen on the Final Alcohol Content of Wine Fermented by a Mixed Starter Culture. Appl. Microbiol. Biotechnol. 2015, 99, 3993–4003. [Google Scholar] [CrossRef] [Green Version]
- Quirós, M.; Rojas, V.; Gonzalez, R.; Morales, P. Selection of Non-Saccharomyces Yeast Strains for Reducing Alcohol Levels in Wine by Sugar Respiration. Int. J. Food Microbiol. 2014, 181, 85–91. [Google Scholar] [CrossRef] [Green Version]
- Canonico, L.; Solomon, M.; Comitini, F.; Ciani, M.; Varela, C. Volatile Profile of Reduced Alcohol Wines Fermented with Selected Non-Saccharomyces Yeasts under Different Aeration Conditions. Food Microbiol. 2019, 84, 103247. [Google Scholar] [CrossRef]
- Tofalo, R.; Schirone, M.; Torriani, S.; Rantsiou, K.; Cocolin, L.; Perpetuini, G.; Suzzi, G. Diversity of Candida zemplinina Strains from Grapes and Italian Wines. Food Microbiol. 2012, 29, 18–26. [Google Scholar] [CrossRef]
- Varela, C. The Impact of Non-Saccharomyces Yeasts in the Production of Alcoholic Beverages. Appl. Microbiol. Biotechnol. 2016, 100, 9861–9874. [Google Scholar] [CrossRef]
- Ciani, M.; Comitini, F. Use of Non-Saccharomyces Yeasts in Red Winemaking. In Red Wine Technology; Academic Press: Cambridge, MA, USA, 2019; pp. 51–68. [Google Scholar] [CrossRef]
- Varela, J.; Varela, C. Microbiological Strategies to Produce Beer and Wine with Reduced Ethanol Concentration. Curr. Opin. Biotechnol. 2019, 56, 88–96. [Google Scholar] [CrossRef]
- Contreras, A.; Hidalgo, C.; Schmidt, S.; Henschke, P.A.; Curtin, C.; Varela, C. The Application of Non-Saccharomyces Yeast in Fermentations with Limited Aeration as a Strategy for the Production of Wine with Reduced Alcohol Content. Int. J. Food Microbiol. 2015, 205, 7–15. [Google Scholar] [CrossRef]
- Ciani, M.; Comitini, F.; Mannazzu, I.; Domizio, P. Controlled Mixed Culture Fermentation: A New Perspective on the Use of Non-Saccharomyces Yeasts in Winemaking. FEMS Yeast Res. 2010, 10, 123–133. [Google Scholar] [CrossRef] [Green Version]
- Wang, C.; Mas, A.; Esteve-Zarzoso, B. Interaction between Hanseniaspora Uvarum and Saccharomyces cerevisiae during Alcoholic Fermentation. Int. J. Food Microbiol. 2015, 206, 67–74. [Google Scholar] [CrossRef]
- Belda, I.; Ruiz, J.; Alastruey-Izquierdo, A.; Navascués, E.; Marquina, D.; Santos, A. Unraveling the Enzymatic Basis of Wine “Flavorome”: A Phylo-Functional Study of Wine Related Yeast Species. Front. Microbiol. 2016, 7, 1–13. [Google Scholar] [CrossRef] [Green Version]
- Hu, K.; Zhu, X.L.; Mu, H.; Ma, Y.; Ullah, N.; Tao, Y.S. A Novel Extracellular Glycosidase Activity from Rhodotorula mucilaginosa: Its Application Potential in Wine Aroma Enhancement. Lett. Appl. Microbiol. 2016, 62, 169–176. [Google Scholar] [CrossRef]
- Masneuf-Pomarede, I.; Bely, M.; Marullo, P.; Albertin, W. The Genetics of Non-Conventional Wine Yeasts: Current Knowledge and Future Challenges. Front. Microbiol. 2016, 6, 1563. [Google Scholar] [CrossRef]
- Comitini, F.; Gobbi, M.; Domizio, P.; Romani, C.; Lencioni, L.; Mannazzu, I.; Ciani, M. Selected Non-Saccharomyces Wine Yeasts in Controlled Multistarter Fermentations with Saccharomyces cerevisiae. Food Microbiol. 2011, 28, 873–882. [Google Scholar] [CrossRef]
- Oro, L.; Ciani, M.; Comitini, F. Antimicrobial Activity of Metschnikowia Pulcherrima on Wine Yeasts. J. Appl. Microbiol. 2014, 116, 1209–1217. [Google Scholar] [CrossRef]
- Alonso, A.; Belda, I.; Santos, A.; Navascués, E.; Marquina, D. Advances in the Control of the Spoilage Caused by Zygosaccharomyces Species on Sweet Wines and Concentrated Grape Musts. Food Control 2015, 51, 129–134. [Google Scholar] [CrossRef]
- Contreras, A.; Hidalgo, C.; Henschke, P.A.; Chambers, P.J.; Curtin, C.; Varela, C. Evaluation of Non-Saccharomyces Yeasts for the Reduction of Alcohol Content in Wine. Appl. Environ. Microbiol. 2014, 80, 1670–1678. [Google Scholar] [CrossRef] [PubMed] [Green Version]
- Contreras, A.; Curtin, C.; Varela, C. Yeast Population Dynamics Reveal a Potential ‘Collaboration’ between Metschnikowia pulcherrima and Saccharomyces uvarum for the Production of Reduced Alcohol Wines during Shiraz Fermentation. Appl. Microbiol. Biotechnol. 2014, 99, 1885–1895. [Google Scholar] [CrossRef] [PubMed]
- Di Maio, S.; Genna, G.; Gandolfo, V.; Amore, G.; Ciaccio, M.; Oliva, D. Presence of Candida zemplinina in Sicilian Musts and Selection of a Strain for Wine Mixed Fermentations. South African J. Enol. Vitic. 2012, 33, 80–87. [Google Scholar] [CrossRef]
- Englezos, V.; Rantsiou, K.; Torchio, F.; Rolle, L.; Gerbi, V.; Cocolin, L. Exploitation of the Non-Saccharomyces Yeast Starmerella Bacillaris (Synonym Candida zemplinina) in Wine Fermentation: Physiological and Molecular Characterizations. Int. J. Food Microbiol. 2015, 199, 33–40. [Google Scholar] [CrossRef]
- Englezos, V.; Rantsiou, K.; Cravero, F.; Torchio, F.; Ortiz-julien, A.; Gerbi, V.; Rolle, L.; Cocolin, L. Starmerella bacillaris and Saccharomyces cerevisiae Mixed Fermentations to Reduce Ethanol Content in Wine. Appl. Microbiol. Biotechnol. 2016, 100, 5515–5526. [Google Scholar] [CrossRef]
- De Barros Lopes, M.; Ata-ur-Rehman, A.; Gockowiak, H.; Heinrich, A.J.; Langridge, P.; Henschke, P.A. Fermentation Properties of a Wine Yeast Over-Expressing the Saccharomyces cerevisiae Glycerol 3-Phosphate Dehydrogenase Gene (GPD2). Aust. J. Grape Wine Res. 2000, 6, 208–215. [Google Scholar] [CrossRef]
- Ehsani, M.; Fernández, M.R.; Biosca, J.A.; Julien, A.; Dequin, S. Engineering of 2,3-Butanediol Dehydrogenase to Reduce Acetoin Formation by Glycerol-Overproducing, Low-Alcohol Saccharomyces cerevisiae. Appl. Environ. Microbiol. 2009, 75, 3196–3205. [Google Scholar] [CrossRef] [Green Version]
- Puškaš, V.S.; Miljić, U.D.; Djuran, J.J.; Vučurović, V.M. The Aptitude of Commercial Yeast Strains for Lowering the Ethanol Content of Wine. Food Sci. Nutr. 2020, 8, 1489–1498. [Google Scholar] [CrossRef]
- Ozturk, B.; Anli, E. Different Techniques for Reducing Alcohol Levels in Wine: A Review. BIO Web Conf. 2014, 3, 02012. [Google Scholar] [CrossRef]
- Geertman, J.M.A.; van Maris, A.J.A.; van Dijken, J.P.; Pronk, J.T. Physiological and Genetic Engineering of Cytosolic Redox Metabolism in Saccharomyces cerevisiae for Improved Glycerol Production. Metab. Eng. 2006, 8, 532–542. [Google Scholar] [CrossRef]
- Heux, S.; Sablayrolles, J.M.; Cachon, R.; Dequin, S. Engineering a Saccharomyces cerevisiae Wine Yeast That Exhibits Reduced Ethanol Production during Fermentation under Controlled Microoxygenation Conditions. Appl. Environ. Microbiol. 2006, 72, 5822–5828. [Google Scholar] [CrossRef] [Green Version]
- Heux, S.; Cachon, R.; Dequin, S. Cofactor Engineering in Saccharomyces cerevisiae: Expression of a H2O-Forming NADH Oxidase and Impact on Redox Metabolism. Metab. Eng. 2006, 8, 303–314. [Google Scholar] [CrossRef]
- Rossouw, D.; Heyns, E.H.; Setati, M.E.; Bosch, S.; Bauer, F.F. Adjustment of Trehalose Metabolism in Wine Saccharomyces cerevisiae Strains to Modify Ethanol Yields. Appl. Environ. Microbiol. 2013, 79, 5197–5207. [Google Scholar] [CrossRef] [Green Version]
- Tilloy, V.; Ortiz-Julien, A.; Dequin, S. Reduction of Ethanol Yield and Improvement of Glycerol Formation by Adaptive Evolution of the Wine Yeast Saccharomyces cerevisiae under Hyperosmotic Conditions. Appl. Environ. Microbiol. 2014, 80, 2623–2632. [Google Scholar] [CrossRef] [Green Version]
- Tilloy, V.; Cadière, A.; Ehsani, M.; Dequin, S. Reducing Alcohol Levels in Wines through Rational and Evolutionary Engineering of Saccharomyces cerevisiae. Int. J. Food Microbiol. 2015, 213, 49–58. [Google Scholar] [CrossRef]
- Varela, C.; Kutyna, D.R.; Solomon, M.R.; Black, C.A.; Borneman, A.; Henschke, P.A.; Pretorius, I.S.; Chambers, P.J. Evaluation of Gene Modification Strategies for the Development of Low-Alcohol-Wine Yeasts. Appl. Environ. Microbiol. 2012, 78, 6068–6077. [Google Scholar] [CrossRef]
- Hou, J.; Lages, N.F.; Oldiges, M.; Vemuri, G.N. Metabolic Impact of Redox Cofactor Perturbations in Saccharomyces cerevisiae. Metab. Eng. 2009, 11, 253–261. [Google Scholar] [CrossRef]
- Nogueira, A.; Le Quéré, J.M.; Gestin, P.; Michel, A.; Wosiacki, G.; Drilleau, J.F.; Brew, J.I. Slow Fermentation in French Cider Processing Due to Partial Biomass Reduction. J. Inst. Brew. 2008, 114, 102–110. [Google Scholar] [CrossRef]
- Nogueira, A.; Mongruel, C.; Rosana, D.; Simões, S. Effect of Biomass Reduction on the Fermentation of Cider. Brazilian Arch. Biol. Technol. 2007, 50, 1083–1092. [Google Scholar] [CrossRef] [Green Version]
- Fan, G.; Shengyun, T.; Rong, W.; Qingbin, L.; Jinsheng, Z.; Xiaodong, Y.; Yang, L. Fermentation Process of Low-Alcohol Cider by Biomass Reduction. China Brew. 2012, 31, 186–190. [Google Scholar]
- Malfeito-Ferreira, M. Yeasts and Wine Off-Flavours: A Technological Perspective. Ann. Microbiol. 2011, 61, 95–102. [Google Scholar] [CrossRef]
- Banvolgyi, S.; Kiss, I.; Bekassy-Molnar, E.; Vatai, G. Concentration of Red Wine by Nanofiltration. Desalination 2006, 198, 8–15. [Google Scholar] [CrossRef]
- Banvolgyi, S.; Savaş Bahçeci, K.; Vatai, G.; Bekassy, S.; Bekassy-Molnar, E. Partial Dealcoholization of Red Wine by Nanofiltration and Its Effect on Anthocyanin and Resveratrol Levels. Food Sci. Technol. Int. 2016, 22, 677–687. [Google Scholar] [CrossRef]
- Conidi, C.; Castro-Muñoz, R.; Cassano, A. Nanofiltration in Beverage Industry. In Nanotechnology in the Beverage Industry; Elsevier: Amsterdam, The Netherlands, 2020; pp. 525–548. [Google Scholar] [CrossRef]
- Labanda, J.; Vichi, S.; Llorens, J.; López-Tamames, E. Membrane Separation Technology for the Reduction of Alcoholic Degree of a White Model Wine. LWT Food Sci. Technol. 2009, 42, 1390–1395. [Google Scholar] [CrossRef]
- Mangindaan, D.; Khoiruddin, K.; Wenten, I.G. Beverage Dealcoholization Processes: Past, Present, and Future. Trends Food Sci. Technol. 2018, 71, 36–45. [Google Scholar] [CrossRef]
- Takács, L.; Korány, K.; Vatai, G. Process Modelling in the Production of Low Alcohol Content Wines by Direct Concentration and Diafiltration Using Nanofiltration Membranes. Acta Aliment. 2010, 39, 397–412. [Google Scholar] [CrossRef]
- Lopez, M.; Alvarez, S.; Riera, F.A.; Alvarez, R.; Julia, C. Production of Low Alcohol Content Apple Cider by Reverse Osmosis. Ind. Eng. Chem. Res. 2002, 41, 6600–6606. [Google Scholar] [CrossRef]
- Massot, A.; Mietton-peuchot, M.; Peuchot, C.; Milisic, V. Nanofiltration and Reverse Osmosis in Winemaking. Desalination 2008, 231, 283–289. [Google Scholar] [CrossRef]
- Pilipovik, M.V.; Riverol, C. Assessing Dealcoholization Systems Based on Reverse Osmosis. J. Food Eng. 2005, 69, 437–441. [Google Scholar] [CrossRef]
- Russo, P.; Liguori, L.; Corona, O.; Albanese, D.; DiMatteo, M.; Cinquanta, L. Combined Membrane Process for Dealcoholization of Wines: Osmotic Distillation and Reverse Osmosis. Chem. Eng. Trans. 2019, 75, 7–12. [Google Scholar] [CrossRef]
- Diban, N.; Athes, V.; Bes, M.; Souchon, I. Ethanol and Aroma Compounds Transfer Study for Partial Dealcoholization of Wine Using Membrane Contactor. J. Memb. Sci. 2008, 311, 136–146. [Google Scholar] [CrossRef]
- Diban, N.; Arruti, A.; Barceló, A.; Puxeu, M.; Urtiaga, A.; Ortiz, I. Membrane Dealcoholization of Different Wine Varieties Reducing Aroma Losses. Modeling and Experimental Validation. Innov. Food Sci. Emerg. Technol. 2013, 20, 259–268. [Google Scholar] [CrossRef]
- Ferrarini, R.; Maria, G.; Camin, F.; Bandini, S.; Gostoli, C. Variation of Oxygen Isotopic Ratio during Wine Dealcoholization by Membrane Contactors: Experiments and Modelling. J. Memb. Sci. 2016, 498, 385–394. [Google Scholar] [CrossRef]
- Gambuti, A.; Rinaldi, A.; Lisanti, M.T.; Pessina, R.; Moio, L. Partial Dealcoholisation of Red Wines by Membrane Contactor Technique: Influence on Colour, Phenolic Compounds and Saliva Precipitation Index. Eur. Food Res. Technol. 2011, 233, 647–655. [Google Scholar] [CrossRef]
- Liguori, L.; Russo, P.; Albanese, D.; Di Matteo, M. Evolution of Quality Parameters during Red Wine Dealcoholization by Osmotic Distillation. Food Chem. 2013, 140, 68–75. [Google Scholar] [CrossRef]
- Liguori, L.; Russo, P.; Albanese, D.; Di Matteo, M. Effect of Process Parameters on Partial Dealcoholization of Wine by Osmotic Distillation. Food Bioprocess Technol. 2013, 6, 2514–2524. [Google Scholar] [CrossRef]
- Karlsson, H.O.E.; Trägårdh, G. Applications of Pervaporation in Food Processing. Trends Food Sci. Technol. 1996, 7, 78–83. [Google Scholar] [CrossRef]
- Verhoef, A.; Figoli, A.; Leen, B.; Bettens, B.; Drioli, E.; Van der Bruggen, B. Performance of a Nanofiltration Membrane for Removal of Ethanol from Aqueous Solutions by Pervaporation. Sep. Purif. Technol. 2008, 60, 54–63. [Google Scholar] [CrossRef]
- Castro-Muñoz, R.; Ahmad, M.Z.; Cassano, A. Pervaporation-Aided Processes for the Selective Separation of Aromas, Fragrances and Essential (AFE) Solutes from Agro-Food Products and Wastes. Food Rev. Int. 2021, 1–27. [Google Scholar] [CrossRef]
- Castro-Muñoz, R. Pervaporation-Based Membrane Processes for the Production of Non-Alcoholic Beverages. Food Sci. Technol. 2019, 56, 2333–2344. [Google Scholar] [CrossRef]
- Castro-Muñoz, R. Pervaporation: The Emerging Technique for Extracting Aroma Compounds from Food Systems. J. Food Eng. 2019, 253, 27–39. [Google Scholar] [CrossRef]
- Catarino, M.; Mendes, A. Non-Alcoholic Beer—A New Industrial Process. Sep. Purif. Technol. 2011, 79, 342–351. [Google Scholar] [CrossRef]
- Németh, L.; Jóvér, B.; Doleschall, S.; Pap, G.; Gáti, G.; Juhász, I.; Sápi, I.; Százhalombatta Sándor Kovacs, K.; Horváth, K. Product and Process for Production of Alcohol-Free Wines or Alcohol Reduced Wines and Brandy. U.S. Patent 5,093,141, 3 March 1992. [Google Scholar]
- Motta, S.; Guaita, M.; Petrozziello, M.; Ciambotti, A.; Panero, L.; Solomita, M.; Bosso, A. Comparison of the Physicochemical and Volatile Composition of Wine Fractions Obtained by Two Different Dealcoholization Techniques. Food Chem. 2017, 221, 1–10. [Google Scholar] [CrossRef]
- Taran, N.; Stoleicova, S.; Soldatenco, O.; Morari, B. The Influence of Pressure on Chemical and Physical Parametres of White and Red Wines Obtained by Dealcoholization Method. J. Agroaliment. Proc. Technol. 2014, 20, 215–219. [Google Scholar]
- Belisario-Sánchez, Y.Y.; Taboada-Rodríguez, A.; Marín-Iniesta, F.; Iguaz-Gainza, A.; López-Gómez, A. Aroma Recovery in Wine Dealcoholization by SCC Distillation. Food Bioprocess Technol. 2012, 5, 2529–2539. [Google Scholar] [CrossRef]
- Belisario-Sánchez, Y.Y.; Taboada-Rodríguez, A.; Marín-Iniesta, F.; López-Gómez, A. Dealcoholized Wines by Spinning Cone Column Distillation: Phenolic Compounds and Antioxidant Activity Measured by the 1,1-Diphenyl-2-Picrylhydrazyl Method. J. Agric. Food Chem. 2009, 57, 6770–6778. [Google Scholar] [CrossRef]
- Gómez-Plaza, E.; López-Nicolás, J.M.; López-Roca, J.M.; Martínez-Cutillas, A. Dealcoholization of Wine. Behaviour of the Aroma Components during the Process. LWT Food Sci. Technol. 1999, 32, 384–386. [Google Scholar] [CrossRef]
- Huerta-Pérez, F.; Pérez-Correa, J.R. Optimizing Ethanol Recovery in a Spinning Cone Column. J. Taiwan Inst. Chem. Eng. 2018, 83, 1–9. [Google Scholar] [CrossRef]
- Margallo, M.; Aldaco, R.; Barceló, A.; Diban, N.; Ortiz, I.; Irabien, A. Life Cycle Assessment of Technologies for Partial Dealcoholisation of Wines. Sustain. Prod. Consum. 2015, 2, 29–39. [Google Scholar] [CrossRef]
- Longo, R.; Blackman, J.W.; Antalick, G.; Torley, P.J.; Rogiers, S.Y.; Schmidtke, L.M. A Comparative Study of Partial Dealcoholisation versus Early Harvest: Effects on Wine Volatile and Sensory Profiles. Food Chem. 2018, 261, 21–29. [Google Scholar] [CrossRef]
- Pham, D.-T.; Stockdale, V.J.; Wollan, D.; Jeffery, D.W.; Wilkinson, K.L. Compositional Consequences of Partial Dealcoholization of Red Wine by Reverse Osmosis-Evaporative Perstraction. Molecules 2019, 24, 1404. [Google Scholar] [CrossRef] [Green Version]
- Pham, D.-T.; Ristic, R.; Stockdale, V.J.; Jeffery, D.W.; Tuke, J.; Wilkinson, K. Influence of Partial Dealcoholization on the Composition and Sensory Properties of Cabernet Sauvignon Wines. Food Chem. 2020, 325, 126869. [Google Scholar] [CrossRef]
- Wollan, D. Alcohol Reduction in Beverages. U.S. Patent 2008/0272041 A1, 6 November 2008. [Google Scholar]
- Burberg, F.; Zarnkow, M. Special production methods. In Handbook of Brewing: Processes, Technology, Markets; Eslinger, H.M., Ed.; Wiley-VCH: Weinheim, Germany, 2009; pp. 235–256. [Google Scholar]
- Strejc, J.; Siříšťová, L.; Karabín, M.; Almeida e Silva, J.B.; Brányik, T. Production of Alcohol-Free Beer with Elevated Amounts of Flavouring Compounds Using Lager Yeast Mutants. J. Inst. Brew. 2013, 119, 149–155. [Google Scholar] [CrossRef]
- Brányik, T.; Silva, D.P.; Baszczyn, M. A Review of Methods of Low Alcohol and Alcohol-Free Beer Production. J. Food Eng. 2012, 108, 493–506. [Google Scholar] [CrossRef]
- Sohrabvandi, S.; Mousavi, S.M.; Razavi, S.H.; Mortazavian, A.M.; Rezaei, K. Alcohol-Free Beer: Methods of Production, Sensorial Defects, and Healthful Effects. Food Rev. Int. 2010, 26, 335–352. [Google Scholar] [CrossRef]
- Montanari, L.; Marconi, O.; Mayer, H.; Fantozzi, P. 6—Production of Alcohol-Free Beer. In Beer in Health and Disease Prevention; Preedy, V.R., Ed.; Academic Press: San Diego, CA, USA, 2009; pp. 61–75. [Google Scholar] [CrossRef]
- Capece, A.; Romano, P. Yeasts and Their Metabolic Impact on Wine Flavour. In Yeasts in the Production Wine; Romano, P., Ciani, M., Fleet, G.H., Eds.; Springer: New York, NY, USA, 2019; pp. 43–80. [Google Scholar] [CrossRef]
- Walker, G.; Stewart, G. Saccharomyces cerevisiae in the Production of Fermented Beverages. Beverages 2016, 2, 30. [Google Scholar] [CrossRef]
- Walker, G.M. Wines: Microbiology of Winemaking, 2nd ed.; Elsevier: Amsterdam, The Netherlands, 2014; Volume 3. [Google Scholar] [CrossRef]
- Parker, M.; Capone, D.L.; Francis, I.L.; Herderich, M.J. Aroma Precursors in Grapes and Wine: Flavor Release during Wine Production and Consumption. J. Agric. Food Chem. 2018, 66, 2281–2286. [Google Scholar] [CrossRef]
- Porter, M.C. Handbook of Industrial Membrane Technology. J. Memb. Sci. 1990, 53, 301–302. [Google Scholar] [CrossRef]
- Liguori, L.; De Francesco, G.; Russo, P.; Perretti, G.; Albanese, D.; Di Matteo, M. Quality Attributes of Low-Alcohol Top-Fermented Beers Produced by Membrane Contactor. Food Bioprocess Technol. 2016, 9, 191–200. [Google Scholar] [CrossRef]
- Wang, Y.N.; Wang, R. Reverse Osmosis Membrane Separation Technology; Elsevier Inc.: Amsterdam, The Netherlands, 2018. [Google Scholar] [CrossRef]
- Wenten, I.G.; Khoiruddin, K. Reverse Osmosis Applications: Prospect and Challenges. Desalination 2016, 391, 112–125. [Google Scholar] [CrossRef]
- Bui, K.; Dick, R.; Moulin, G.; Galzy, P. Partial Concentration of Red Wine by Reverse Osmosis. J. Food Sci. 1988, 53, 647–648. [Google Scholar] [CrossRef]
- Catarino, M.; Mendes, A.; Madeira, L.M.; Ferreira, A. Alcohol Removal from Beer by Reverse Osmosis. Sep. Sci. Technol. 2007, 42, 3011–3027. [Google Scholar] [CrossRef]
- Ambrosi, A.; Motke, M.B.; Souza-Silva, É.A.; Zini, C.A.; McCutcheon, J.R.; Cardozo, N.S.M.; Tessaro, I.C. Beer Dealcoholization by Forward Osmosis Diafiltration. Innov. Food Sci. Emerg. Technol. 2020, 63, 102371. [Google Scholar] [CrossRef]
- Arriagada-Carrazana, J.P.; Sáez-Navarrete, C.; Bordeu, E. Membrane Filtration Effects on Aromatic and Phenolic Quality of Cabernet Sauvignon Wines. J. Food Eng. 2005, 68, 363–368. [Google Scholar] [CrossRef]
- Pozderović, A.; Moslavac, T.; Pichler, A. Concentration of Aqua Solutions of Organic Components by Reverse Osmosis. I: Influence of Trans-Membrane Pressure and Membrane Type on Concentration of Different Ester and Aldehyde Solutions by Reverse Osmosis. J. Food Eng. 2006, 76, 387–395. [Google Scholar] [CrossRef]
- Meillon, S.; Urbano, C.; Schlich, P. Contribution of the Temporal Dominance of Sensations (TDS) Method to the Sensory Description of Subtle Differences in Partially Dealcoholized Red Wines. Food Qual. Prefer. 2009, 20, 490–499. [Google Scholar] [CrossRef]
- Varavuth, S.; Jiraratananon, R.; Atchariyawut, S. Experimental Study on Dealcoholization of Wine by Osmotic Distillation Process. Sep. Purif. Technol. 2009, 66, 313–321. [Google Scholar] [CrossRef]
- Liguori, L.; De Francesco, G.; Russo, P.; Perretti, G.; Albanese, D.; Di Matteo, M. Production and Characterization of Alcohol-Free Beer by Membrane Process. Food Bioprod. Process. 2015, 94, 158–168. [Google Scholar] [CrossRef]
- Liguori, L.; De Francesco, G.; Russo, P.; Albanese, D.; Perretti, G.; Di Matteo, M. Quality Improvement of Low Alcohol Craft Beer Produced by Evaporative Pertraction. Chem. Eng. Trans. 2015, 43, 13–18. [Google Scholar] [CrossRef]
- Hogan, P.A.; Canning, R.P.; Peterson, P.A.; Johnson, R.A.; Michaels, A.S. A New Option: Osmotic Distillation. Chem. Eng. Prog. 1998, 94, 49–61. [Google Scholar]
- Russo, P.; Liguori, L.; Albanese, D.; Crescitelli, A.; Di Matteo, M. Investigation of Osmotic Distillation Technique for Beer Dealcoholization. Chem. Eng. Trans. 2013, 32, 1735–1740. [Google Scholar]
- Esteras-Saz, J.; de la Iglesia, Ó.; Peña, C.; Escudero, A.; Téllez, C.; Coronas, J. Theoretical and Practical Approach to the Dealcoholization of Water-Ethanol Mixtures and Red Wine by Osmotic Distillation. Sep. Purif. Technol. 2021, 270. [Google Scholar] [CrossRef]
- Fedrizzi, B.; Nicolis, E.; Camin, F.; Bocca, E.; Carbognin, C.; Scholz, M.; Barbieri, P.; Finato, F.; Ferrarini, R. Stable Isotope Ratios and Aroma Profile Changes Induced Due to Innovative Wine Dealcoholisation Approaches. Food Bioprocess Technol. 2014, 7, 62–70. [Google Scholar] [CrossRef]
- Liguori, L.; Attanasio, G.; Albanese, D.; Di Matteo, M. Aglianico Wine Dealcoholization Tests. In Computer Aided Chemical Engineering; Elsevier: Amsterdam, The Netherlands, 2010; Volume 28, pp. 325–330. [Google Scholar] [CrossRef]
- Del Olmo, Á.; Blanco, C.A.; Palacio, L.; Prádanos, P.; Hernández, A. Pervaporation Methodology for Improving Alcohol-Free Beer Quality through Aroma Recovery. J. Food Eng. 2014, 133, 1–8. [Google Scholar] [CrossRef] [Green Version]
- Castro-Muñoz, R.; Conidi, C.; Cassano, A. Membrane-Based Technologies for Meeting the Recovery of Biologically Active Compounds from Foods and Their by-Products. Crit. Rev. Food Sci. Nutr. 2018, 59, 2927–2948. [Google Scholar] [CrossRef]
- Figoli, A.; Santoro, S.; Galiano, F.; Basile, A. 2—Pervaporation Membranes: Preparation, Characterization, and Application. In Pervaporation, Vapour Permeation and Membrane Distillation; Woodhead Publishing: Cambridge, UK, 2015; pp. 19–63. [Google Scholar] [CrossRef]
- Benedict, D.J.; Parulekar, S.J.; Tsai, S. Pervaporation-Assisted Esterification of Lactic and Succinic Acids with Downstream Ester Recovery. J. Membr. Sci. 2006, 281, 435–445. [Google Scholar] [CrossRef]
- Wenten, I.G.; Dharmawijaya, P.T. RSC Advances LTA Zeolite Membranes: Current Progress and Challenges in Pervaporation. RSC Adv. 2017, 7, 29520–29539. [Google Scholar] [CrossRef] [Green Version]
- Brazinha, C.; Crespo, J.G. Aroma Recovery from Hydro Alcoholic Solutions by Organophilic Pervaporation: Modelling of Fractionation by Condensation. J. Memb. Sci. 2009, 341, 109–121. [Google Scholar] [CrossRef]
- Crespo, J.G.; Brazinha, C. 1—Fundamentals of Pervaporation. In Pervaporation, Vapour Permeation and Membrane Distillation; Woodhead Publishing: Cambridge, UK, 2015; pp. 3–17. [Google Scholar] [CrossRef]
- Wijmans, J.G.; Baker, R.W. The Solution-Diffusion Model: A Review. J. Membr. Sci. 1995, 107, 1–21. [Google Scholar] [CrossRef]
- Heintz, A.; Stephan, W. A Generalized Solution-Diffusion Model of the Pervaporation Process through Composite Membranes Part II. Concentration Polarization, Coupled Diffusion and the Influence of the Porous Support Layer. J. Membr. Sci. 1994, 89, 153–169. [Google Scholar] [CrossRef]
- Wee, S.-L.; Tye, C.-T.; Bhatia, S. Membrane separation process—Pervaporation through zeolite membrane. Sep. Purif. Technol. 2008, 63, 500–516. [Google Scholar] [CrossRef]
- Baudot, A.; Marin, M. Pervaporation of Aroma Compounds: Comparison of Membrane Performances with Vapour-Liquid Equilibria and Engineering Aspects of Process Improvement. Food Bioprod. Process. Trans. Inst. Chem. Eng. Part C 1997, 75, 117–142. [Google Scholar] [CrossRef]
- Catarino, M.; Ferreira, A.; Mendes, A. Study and Optimization of Aroma Recovery from Beer by Pervaporation. J. Membr. Sci. 2009, 341, 51–59. [Google Scholar] [CrossRef]
- Sun, X.; Dang, G.; Ding, X.; Shen, C.; Liu, G.; Zuo, C.; Chen, X.; Xing, W.; Jin, W. Production of Alcohol-Free Wine and Grape Spirit by Pervaporation Membrane Technology. Food Bioprod. Process. 2020, 123, 262–273. [Google Scholar] [CrossRef]
- Yang, J.; Yoshioka, T.; Tsuru, T.; Asaeda, M. Pervaporation Characteristics of Aqueous-Organic Solutions with Microporous SiO2-ZrO2 Membranes: Experimental Study on Separation Mechanism. J. Memb. Sci. 2006, 284, 205–213. [Google Scholar] [CrossRef]
- Di Giacomo, G.; Romano, P. Advanced Fractionation Process for Wine-Based Products Diversification. J. Food Sci. Technol. 2021, 58, 4685–4692. [Google Scholar] [CrossRef] [PubMed]
- Makarytchev, S.V.; Langrish, T.A.G.; Fletcher, D.F. Exploration of Spinning Cone Column Capacity and Mass Transfer Performance Using CFD. Chem. Eng. Res. Des. 2005, 83, 1372–1380. [Google Scholar] [CrossRef]
- Makarytchev, S.V.; Langrish, T.A.G.; Fletcher, D.F. Mass Transfer Analysis of Spinning Cone Columns Using Cfd. Chem. Eng. Res. Des. 2004, 82, 752–761. [Google Scholar] [CrossRef]
- Wright, A.J.; Pyle, D.L. An Investigation into the Use of the Spinning Cone Column for in Situ Ethanol Removal from a Yeast Broth. Process Biochem. 1996, 31, 651–658. [Google Scholar] [CrossRef]
- Aguera, E.; Bes, M.; Roy, A.; Camarasa, C.; Sablayrolles, J.-M. Partial Removal of Ethanol during Fermentation to Obtain Reduced-Alcohol Wines. Am. J. Enol. Vitic. 2010, 61, 53–60. [Google Scholar]
- Jordão, A.; Vilela, A.; Cosme, F. From Sugar of Grape to Alcohol of Wine: Sensorial Impact of Alcohol in Wine. Beverages 2015, 1, 292–310. [Google Scholar] [CrossRef] [Green Version]
- Ma, T.; Sun, X.; Gao, G.; Wang, X.; Liu, X.; Du, G.; Zhan, J. Phenolic Characterisation and Antioxidant Capacity of Young Wines Made From Different Grape Varieties Grown in Helanshan Donglu Wine Zone (China). S. Afr. J. Enol. Vitic. 2014, 35, 321–331. [Google Scholar] [CrossRef]
- Suo, H.; Tian, R.; Li, J.; Zhang, S.; Cui, Y.; Li, L.; Sun, B. Compositional Characterization Study on High-Molecular -Mass Polymeric Polyphenols in Red Wines by Chemical Degradation. Food Res. Int. 2019, 123, 440–449. [Google Scholar] [CrossRef]
- Cuzmar, P.D.; Salgado, E.; Ribalta-Pizarro, C.; Olaeta, A.; Eugenio, L.; Pastenes, C.; Alejandro, C. Original Article Phenolic Composition and Sensory Characteristics of Cabernet Sauvignon Wines: Effect of Water Stress and Harvest Date. Int. J. Food Sci. Technol. 2018, 53, 1–10. [Google Scholar] [CrossRef]
- Ivanova, V.; Stefova, M.; Chinnici, F. Determination of the Polyphenol Contents in Macedonian Grapes and Wines by Standardized Spectrophotometric Methods. J. Serb. Chem. Soc. 2010, 75, 45–59. [Google Scholar] [CrossRef]
- Cozzolino, D. The Role of Visible and Infrared Spectroscopy Combined with Chemometrics to Measure Phenolic Compounds in Grape and Wine Samples. Molecules 2015, 20, 726–737. [Google Scholar] [CrossRef] [Green Version]
- Basli, A.; Chaher, N.; Chibane, M.; Monti, J.; Richard, T. Wine Polyphenols: Potential Agents in Neuroprotection. Oxidative Med. Cell. Longev. 2012, 2012, 1–14. [Google Scholar] [CrossRef]
- Vidal, S.; Francis, L.; Noble, A.; Kwiatkowski, M.; Cheynier, V.; Waters, E. Taste and Mouth-Feel Properties of Different Types of Tannin-like Polyphenolic Compounds and Anthocyanins in Wine. Anal. Chim. Acta 2004, 513, 57–65. [Google Scholar] [CrossRef]
- Sakaki, J.; Melough, M.; Lee, S.G.; Pounis, G.; Chun, O.K. Polyphenol-Rich Diets in Cardiovascular Disease Prevention. In Analysis in Nutrition Research: Principles of Statistical Methodology and Interpretation of the Results; Elsevier Inc.: Amsterdam, The Netherlands, 2018; pp. 259–298. [Google Scholar] [CrossRef]
- Doonan, B.B.; Iraj, S.; Pellegrino, L.; Hsieh, T.-C.; Wu, J.M. 22. The French Paradox Revisited: Cardioprotection via Hormesis, Red Wine and Resveratrol. In Handbook of Nutrition in Heart Health; Human Health Handbooks; Wageningen Academic Publishers: Wageningen, The Netherlands, 2017; Volume 14, pp. 22–467. [Google Scholar] [CrossRef]
- Stephan, L.S.; Almeida, E.D.; Markoski, M.M.; Garavaglia, J.; Marcadenti, A. Red Wine, Resveratrol and Atrial Fibrillation. Nutrients 2017, 9, 190. [Google Scholar] [CrossRef] [Green Version]
- Pickering, G.J.; Heatherbell, D.A.; Vanhanen, L.P.; Barnes, M.F. The Effect of Ethanol Concentration on the Temporal Perception of Viscosity and Density in White Wine. Am. J. Enol. Vitic. 1998, 49, 306–318. [Google Scholar]
- Bogianchini, M.; Cerezo, A.B.; Gomis, A.; López, F.; García-Parrilla, M.C. Stability, Antioxidant Activity and Phenolic Composition of Commercial and Reverse Osmosis Obtained Dealcoholised Wines. LWT Food Sci. Technol. 2011, 44, 1369–1375. [Google Scholar] [CrossRef]
- Vernhet, A.; Dupre, K.; Boulange-Petermann, L.; Cheynier, V.; Pellerin, P.; Moutounet, M. Composition of Tartrate Precipitates Deposited on Stainless Steel Tanks During the Cold Stabilization of Wines. Part I. White Wines. Am. J. Enol. Vitic. 1999, 50, 391–397. [Google Scholar]
- Sánchez-Palomo, E.; Delgado, J.A.; Ferrer, M.A.; Viñas, M.A.G. The Aroma of La Mancha Chelva Wines: Chemical and Sensory Characterization. Food Res. Int. 2019, 119, 135–142. [Google Scholar] [CrossRef]
- Duan, W.-P.; Zhu, B.-Q.; Song, R.-R.; Zhang, B.; Lan, Y.-B.; Zhu, X.; Duan, C.-Q.; Han, S.-Y. Volatile Composition and Aromatic Attributes of Wine Made with Vitisvinifera l.Cv Cabernet Sauvignon Grapes in the Xinjiang Region of China: Effect of Different Commercial Yeasts. Int. J. Food Prop. 2018, 21, 1423–1441. [Google Scholar] [CrossRef] [Green Version]
- Cadot, Y.; Caillé, S.; Samson, A.; Barbeau, G.; Cheynier, V. Analytica Chimica Acta Sensory Dimension of Wine Typicality Related to a Terroir by Quantitative Descriptive Analysis, Just About Right Analysis and Typicality Assessment. Anal. Chim. Acta 2010, 660, 53–62. [Google Scholar] [CrossRef] [PubMed]
- Maitre, I.; Symoneaux, R.; Jourjon, F.; Mehinagic, E. Sensory Typicality of Wines: How Scientists Have Recently Dealt with This Subject. Food Qual. Prefer. 2010, 21, 726–731. [Google Scholar] [CrossRef]
- Laborde, B.; Moine-Ledoux, V.; Richard, T.; Saucier, C.; Dubourdieu, D.; Monti, J.P. PVPP-Polyphenol Complexes: A Molecular Approach. J. Agric. Food Chem. 2006, 54, 4383–4389. [Google Scholar] [CrossRef]
- Flanzy, C. Enologia Fundamentos Cientificos y Tecnológicos, AMV ed.; Mundi-Prensa: Madrid, Spain, 2003. [Google Scholar]
- Nurgel, C.; Pickering, G. Contribution of Glycerol, Ethanol and Sugar to the Perception of Viscosity and Density Elicited by Model White Wines. J. Texture Stud. 2005, 36, 303–323. [Google Scholar] [CrossRef]
- Fontoin, H.; Saucier, C.; Teissedre, P.L.; Glories, Y. Effect of PH, Ethanol and Acidity on Astringency and Bitterness of Grape Seed Tannin Oligomers in Model Wine Solution. Food Qual. Prefer. 2008, 19, 286–291. [Google Scholar] [CrossRef]
- Goldner, M.C.; Zamora, M.C.; Lira, P.D.L.; Gianninoto, H.; Bandoni, A. Effect of Ethanol Level in the Perception of Aroma Attributes and the Detection of Volatile Compounds in Red Wine. J. Sens. Stud. 2009, 24, 243–257. [Google Scholar] [CrossRef]
- Fischer, U.; Noble, A.C. The Effect of Ethanol, Catechin Concentration, and PH on Sourness and Bitterness of Wine. Am. J. Enol. Vitic. 1994, 45, 6–10. [Google Scholar]
- Coulter, A.; Henschke, P.A.; Simos, C.A.; Pretorius, I. When the Heat Is on, Yeast Fermentation Runs out of Puff. Aust. New Zeal. Wine Ind. J. 2008, 23, 26–30. [Google Scholar]
- King, E.S.; Dunn, R.L.; Heymann, H. The Influence of Alcohol on the Sensory Perception of Red Wines. Food Qual. Prefer. 2013, 28, 235–243. [Google Scholar] [CrossRef]
- Meillon, S.; Urbano, C.; Guillot, G.; Schlich, P. Acceptability of Partially Dealcoholized Wines—Measuring the Impact of Sensory and Information Cues on Overall Liking in Real-Life Settings. Food Qual. Prefer. 2010, 21, 763–773. [Google Scholar] [CrossRef]
- Meillon, S.; Viala, D.; Medel, M.; Urbano, C.; Guillot, G.; Schlich, P. Impact of Partial Alcohol Reduction in Syrah Wine on Perceived Complexity and Temporality of Sensations and Link with Preference. Food Qual. Prefer. 2010, 21, 732–740. [Google Scholar] [CrossRef]
- King, E.S.; Heymann, H. The Effect of Reduced Alcohol on the Sensory Profiles and Consumer Preferences of White Wine. J. Sens. Stud. 2014, 29, 33–42. [Google Scholar] [CrossRef]
- Gawel, R.; Sluyter, S.V.A.N.; Waters, E.J. The Effects of Ethanol and Glycerol on the Body and Other Sensory Characteristics of Riesling Wines. Aust. J. Grape Wine Res. 2007, 13, 38–45. [Google Scholar] [CrossRef]
- Jones, P.R.; Gawel, R.; Francis, I.L.; Waters, E.J. The Influence of Interactions between Major White Wine Components on the Aroma, Flavour and Texture of Model White Wine. Food Qual. Prefer. 2008, 19, 596–607. [Google Scholar] [CrossRef]
- Mattes, R.D.; DiMeglio, D. Ethanol Perception and Ingestion. Physiol. Behav. 2001, 72, 217–229. [Google Scholar] [CrossRef]
- Muñoz-González, C.; Martín-Álvarez, P.J.; Moreno-Arribas, M.V.; Pozo-Bayón, M.Á. Impact of the Nonvolatile Wine Matrix Composition on the in Vivo Aroma Release from Wines. J. Agric. Food Chem. 2014, 62, 66–73. [Google Scholar] [CrossRef] [Green Version]
- Muñoz-González, C.; Sémon, E.; Martín-Álvarez, P.J.; Guichard, E.; Moreno-Arribas, M.V.; Feron, G.; Pozo-Bayón, M. Wine Matrix Composition Affects Temporal Aroma Release as Measured by Proton Transfer Reaction—Time-of-Flight—Mass Spectrometry. Aust. J. Grape Wine Res. 2015, 21, 367–375. [Google Scholar] [CrossRef] [Green Version]


| Stage of Wine Production | Ethanol Removal Process | Technology | Alcohol Content Reduction | References |
|---|---|---|---|---|
| Pre-fermentation | Reduction of fermentable sugars | Viticultural practices (leaf area reduction, pre-harvest irrigation, application of growth regulators; reduction in photosynthetic activity) | Up to 2% v/v | [37,38,39,40,41,42,43,44,45,46,47,48,49,50,51,52,53,54,55] |
| Early fruit harvest and blends with mature harvest | Up to 3% v/v | [56,57,58,59,60,61,62,63,64,65,66] | ||
| Dilution of grape must | Up to 7% v/v | [61,62,63,67,68,69,70,71,72,73] | ||
| Filtration of must | Up to 5% v/v | [74,75,76,77,78,79,80,81,82,83] | ||
| Addition of enzyme (glucose oxidase) | Up to 4% v/v | [5,84,85,86,87,88,89] | ||
| Fermentation | Reduction of alcohol production | Use of Non-Saccharomyces cerevisiae yeasts | Up to 2% v/v | [90,91,92,93,94,95,96,97,98,99,100,101,102,103,104,105,106,107,108,109,110,111,112,113,114,115,116,117,118,119,120] |
| Use of modified yeast strains | Up to 3.6% v/v | [121,122,123,124,125,126,127,128,129,130,131,132] | ||
| Biomass reduction | Up to 4% v/v | [133,134,135] | ||
| Arrested fermentation | High reduction | [5,136] | ||
| Post-fermentation | Separation by membrane | Nanofiltration (NF) | Up to 4% v/v | [77,137,138,139,140,141,142] |
| Reverse osmosis (RO) | Up to 0.5% v/v or less | [22,32,34,140,143,144,145,146] | ||
| Osmotic distillation (OD) | Up to 0.5% v/v or less | [32,35,36,146,147,148,149,150,151,152] | ||
| Pervaporation (PV) | Up to 0.5% v/v or less | [29,153,154,155,156,157,158] | ||
| Vacuum distillation (VD) | Up to 1% v/v or less | [159,160,161] | ||
| Spinning cone column (SCC) | Up to 0.3% v/v | [28,162,163,164,165,166] | ||
| Multi-stage membrane-based systems | Up to 0.5% v/v or less | [80,144,167,168,169,170] |
| Wine Type | Dealcoholization Process | Alcohol Reduction | Reported Effects on Phenolic Composition | Reference | |
|---|---|---|---|---|---|
| Co (% v/v) | Cf (% v/v) | ||||
| Red wine | NF | 12.0 | 6.0–4.0 | Reduction in wine alcohol volume by a factor of 4 leads to 2.5–3 times more anthocyanins and resveratrol in the wine concentrates | [138] |
| Cabernet Sauvignon–Merlot–Tempranillo red wine | RO | 12.7 | 4.0–2.0 | No significant differences were observed in total anthocyanins and phenolic compounds for both original and dealcoholized wines. Colour intensity increased by around 20% in dealcoholized wines (due to the concentration effect from the removal of ethanol as well as the retention of anthocyanins by the membrane), while the tonality diminished by around 15% | [229] |
| Cabernet Sauvignon red wine | RO | 14.8 | 13.8–12.8 | The total phenolic index, total proanthocyanidins, and percentages of procyanidins, prodelphinidins, and galloylation of partially dealcoholized wines and the control wine remains almost unchanged and did not differ. Control wine and partially dealcoholized wines have statistically similar total anthocyanin concentrations with no observed color differences between these wines | [22] |
| Grenache–Carignan red wine | RO | 16.2 | 15.1–14.1 | The total phenolic index and total proanthocyanidins of partially dealcoholized wines and the control wine remain almost unchanged and do not differ. Slight but statistically significant differences were observed in the percentages of procyanidins, prodelphinidins, and galloylation during alcohol reduction. Total anthocyanin concentrations of partially dealcoholized wines were statistically significantly higher than that of the control wine | [22] |
| Montepulciano d’Abruzzo red wine | RO | 13.2 | 9.0 | Increase in total phenols and decrease in total anthocyanins during ethanol reduction in wine samples. Color intensity increases during ethanol removal | [146] |
| Aglianico red wine | OD/EP | 12.8 | 4.9–0.4 | Higher amount of total phenols in dealcoholized wine samples compared to the original wine. Color intensity decreased slightly at the end of dealcoholization | [197] |
| Aglianico red wine | OD/EP | 15.4 | 13.5–10.8 | The alcohol removal process did not affect the content of vanillin reactive flavans and total phenolics. A loss of 49% of total monomeric anthocyanins was observed after dealcoholization while total anthocyanins remained almost unchanged with no significant differences. Color parameters of dealcoholized wines were not significantly different compared to the original wine after alcohol removal | [150] |
| Merlot red wine | OD/EP | 13.8 | 11.1–8.9 | The alcohol removal process did not affect the content of vanillin reactive flavans and total phenolics. A loss of 57% of total monomeric anthocyanins was observed after dealcoholization while total anthocyanins remained almost unchanged with no significant differences. Color parameters of dealcoholized wines were not significantly different compared to the original wine after alcohol removal | [150] |
| Piedirosso red wine | OD/EP | 13.6 | 11.5– 8.4 | The alcohol removal process did not affect the content of vanillin reactive flavans and total phenolics. A loss of 52% of total monomeric anthocyanins was observed after dealcoholization while total anthocyanins remained almost unchanged with no significant differences. Color parameters of dealcoholized wines were not significantly different compared to the original wine after alcohol removal | [150] |
| Aglianico red wine | OD/EP | 12.5 | 10.6 | No significant differences between base wine and dealcoholized wine in terms of total polyphenols and color intensity | [152] |
| Barbera red wine | OD/EP | 15.2 | 5.0 | Higher contents of total anthocyanins and total flavonoids compared to the original wine. Color: the intensity increases and the hue decreases (loss of orange notes) due to the increased content of total anthocyanins | [160] |
| Langhe Rosè wine | OD/EP | 13.2 | 5.0 | Higher contents of total anthocyanins and total flavonoids compared to the original wine. Color: the intensity increases and the hue decreases (loss of orange notes) due to the increased content of total anthocyanins | [160] |
| Verduno Pelaverga red wine | OD/EP | 14.6 | 5.0 | Higher contents of total anthocyanins and total flavonoids compared to the original wine. Color: the intensity increases and the hue decreases (loss of orange notes) due to the increased content of total anthocyanins | [160] |
| Falanghina white wine | OD/EP | 12.5 | 9.8–0.3 | At different alcohol content levels of wines, the total phenols and flavonoids do not differ significantly as they remain almost unchanged during the alcohol removal process | [36] |
| Montepulciano d’Abruzzo red wine | OD/EP | 13.2 | 8.3–5.4 | Both total phenols and total anthocyanins decrease in dealcoholized wines with no significant differences compared to the original wine. The color intensity remains almost unchanged during ethanol removal | [146] |
| Montepulciano d’Abruzzo red wine | OD/EP | 13.2 | 8.3–2.7 | Flavonoids and phenolic compounds remain almost unchanged in all dealcoholized samples compared to the base wine with no significant differences. Color intensity (evaluated by flavonoids and phenolic compounds) decrease slightly in all dealcoholized samples | [35] |
| Langhe Rosè wine | VD | 13.2 | 5.0 | Higher contents of total anthocyanins and total flavonoids compared to the original wine. Color the intensity increases and the hue decreases (loss of orange notes) due to the increased content of total anthocyanins | [160] |
| Barbera red wine | VD | 15.2 | 5.0 | Higher contents of total anthocyanins and total flavonoids compared to the original wine. Color: the intensity increases and the hue decreases (loss of orange notes) due to the increased content of total anthocyanins | [160] |
| Verduno Pelaverga red wine | VD | 14.6 | 5.0 | Higher contents of total anthocyanins and total flavonoids compared to the original wine. Color the intensity increases and the hue decreases (loss of orange notes) due to the increased content of total anthocyanins | [160] |
| Red wine | SCC | 14.0 | < 0.3 | Increase in phenolic compounds, total phenolic, flavonol, tartaric ester, and anthocyanin contents by approximately 24%. Higher content of resveratrol than the original wine | [163] |
| Rose wine | SCC | 14.0 | < 0.3 | Increase in phenolic compounds, total phenolic, flavonol, tartaric ester, and anthocyanin contents by approximately 24%. Higher content of resveratrol than the original wine | [163] |
| White wine | SCC | 14.0 | < 0.3 | Increase in phenolic compounds content by approximately 24% | [163] |
| Montepulciano d’Abruzzo red wine (cv.) | RO–OD/EP | 13.2 | 7.1–5.5 | Total phenols increase while total anthocyanins decrease in the dealcoholized wine samples. Color intensity increases during ethanol removal | [146] |
| Cabernet Sauvignon red wine | RO–OD/EP | 14.1 | 12.5 | Significantly increase in color intensity due to increased content of anthocyanins during alcohol reduction compared to the base wine | [168] |
| Shiraz red wine | RO–OD/EP | 15.2 | 12.6 | Increase in color intensity due to increased content of anthocyanins during alcohol reduction compared to the base wine | [168] |
| Dealcoholization Process | Wine Type | Membrane | Operating Mode/Conditions | Alcohol Reduction | Volatile Composition | Sampling and Analytical Method | Reference | ||
|---|---|---|---|---|---|---|---|---|---|
| Co (% v/v) | Cf (% v/v) | Volatile Compounds | Estimated Average Losses (%) | ||||||
| NF | White model wine | TORAY–UB70 | Batch retentate–recycling mode T = 15 P = 10 | 12.0 | 8.4 | Diethyl succinate 2–phenyl–ethanol cis–3–hexenol Isovaleric acid | 2.4 2.9 12.6 11.7 | HS/SPME–GC/MS | [140] |
| Red Wine | Polyamide, NF9, Alfa Laval | T = 30 P = 16 | 12.0 | 9.1 | Total volatile aroma** | 30.0 | GC–FID | [33] | |
| RO | Model wine | Osmonics–SE | Batch retentate–recycling mode T = 15 P = 17–29 | 12.0 | 8.4 | Diethyl succinate 2–phenyl–ethanol cis–3–hexenol Isovaleric acid | 0.6–1.6 2.5–3.5 7.8–11 11.9–18.1 | HS/SPME–GC/MS | [140] |
| Red Wine | Cellulose acetate, CA995PE | T = 30◦C P = 16 | 12.0 | 8.4 | Total aroma** | 90.0 | GC–FID | [33] | |
| Montepulciano d’Abruzzo red wine | RO membrane (100 DA) | T = 10 P = ns Time = 40 | 13.2 | 9.0 | Alcohols Acids Esters Phenols Lactones | 30.0 22.0 8.0 13.0 14.0 | SPME–GC/MS | [146] | |
| OD/EP | Model wine | Polyvinylidene fluoride (PVDF) Memcor | Qf = 0.053 Qs = 0.093 T = 30 Time = 60 | 13.0 | 8.1 | Isoamyl alcohol Ethyl acetate | 44.0 70.0 | GC–FID | [190] |
| Falanghina white wine | Liqui–Cel 0.5 × 1, PP hollow fiber | Qf = 0.07 Qs = 0.14 T = 10 Time = 240 | 12.5 | 9.8–0.3 | Higher alcohols Acids Esters Ketones lactones | 49.5–98.9 60.5–98.7 71.5–99.0 67.1–99.9 73.6–98.2 | LE–GC/MS, LE–GC/FID | [36] | |
| Xarelo white wine | Liqui–Cel ExtraFlow | Qf = 10 Qs = 10 T = room temperature Time = 20 | 11.5 | 10.1 | Isoamyl acetate Ethyl hexanoate Ethyl octanoate Ethyl decanoate | 27.0 37.0 28.0 24.0 | SBSE–GC/MS | [148] | |
| Soave white wine | PTFE hollow fiber (Teflon, Verona, Italy) | Qf = 0.2 Qs = 0.2 T = 20 Time = ns | ns | * | Alcohols Acids Esters Terpenes | 12.6–32.2 5.6–16.4 34.0–58.4 22.0–26.0 | SPE–GC/MS | [196] | |
| Verdicchio white wine | PTFE hollow fiber (Teflon, Verona, Italy) | Qf = 0.2 Qs = 0.2 T = 20 Time = ns | ns | * | Alcohols Acids Esters Terpenes | 8.9–25.8 8.0–15.8 40.0–54.1 21.0–28.0 | SPE–GC/MS | [196] | |
| Aglianico red wine | Liqui–Cel Extra–flow, PP hollow fiber | Qf = 0.583 Qs = 0.183 T = 20 Time = 283 | 13.8 | 11.6–8.8 | Alcohols Esters Acids Terpenes Others: Benzaldehyde 𝛾–Butyrolactone | 8.4–31.8 42.9–60.9 12.5–17.1 13.8–32.3 55.3–65.9 4.5–13.6 | SPE–GC/MS | [32] | |
| Aglianico red wine | Liqui–Cel Extra–flow, PP hollow fiber | Qf = 0.583 Qs = 0.183 T = 20 Time = 283 | 15.5 | 13.5–10.8 | Alcohols Esters Acids Terpenes Others: Benzaldehyde 𝛾–Butyrolactone Vitispirane | 9.2–13.7 33.8–50.6 11–18.5 3.6–14.5 nf 12.9 Unc | SPE–GC/MS | [32] | |
| Aglianico red wine | Liqui–Cel 0.5×1, PP hollow fiber | Qf = 0.07 Qs = 0.14 T = 20 Time = 255 | 13.0 | 6.5–0.2 | Alcohols Acids Esters Sulfur compounds Phenols Ketones and lactones Aldehydes | 57.9–99.9 23.6–78.9 12.8–89.9 2.1–78.7 66.7–100 23.6–97.9 unc–100 | LE–GC/MS, LE–GC/FID | [151] | |
| Merlot red wine | Liqui–Cel Extra–flow, PP hollow fiber | Qf = 5.8 Qs = 8.1 T = 20 Time = 60 | 13.4 | 11.3 | Ethyl acetate Isoamyl acetate Isoamyl alcohol Ethyl hexanoate Ethyl octanoate Linalool 2–Phenylethyl acetate | 37.4 34.9 13.7 33.0 67.8 14.5 13.6 | HS/SPME–GC/MS | [147] | |
| Barbera red wine | Polypropylene hollow fibers (JU.CLA.S. LTD, Verona, Italy) | Qf = 1.6 Qs = 0.8 T = 10 Time = 360 | 14.6 | 5.0 | Alcohols Acids Esters | 63.9 17.4 23.8 | SPE–GC/FID | [160] | |
| Tempranillo red wine | Liqui–Cel ExtraFlow | Qf = 5.8 Qs = 5.8 T = room temperature Time = 60 | 13.3 | 9.0 | Isoamyl alcohol Ethyl hexanoate | 21.0 20.0 | SBSE–GC/MS | [148] | |
| Garnacha red wine | Liqui–Cel ExtraFlow | Qf = 5 Qs = 5 T = room temperature Time = 60 | 13.9 | 9.3 | Isoamyl acetate Ethyl hexanoate | 24.0 36.0 | SBSE–GC/MS | [148] | |
| Verduno Pelaverga red wine | Polypropylene hollow fibers (JU.CLA.S. LTD, Verona, Italy) | Qf = 1.6 Qs = 0.8 T = 10 Time = 360 | 14.6 | 5.0 | Alcohols Acids Esters | 59.9 23.6 45.2 | SPE–GC/FID | [160] | |
| Montepulciano d’Abruzzo red wine | Liqui–Cel 0.5×1, PP hollow fiber | Recycling mode Qf = 1.5 Qs = 0.5 T = 10 Time = 240 | 13.2 | 8.3–2.7 | Alcohols Acids Esters Lactones Phenols Others: Benzaldehyde α–Terpineol | 56.0–84.0 18.0–23.0 64.0–85.0 11.0–37.0 11.0–37.0 2.0–26.0 5.0–49.0 | SPE– LE–GC/MS/FID | [35] | |
| Montepulciano d’Abruzzo red wine | Liqui–Cel mini module 1.7x5.5 Membrana | Recycling mode Qf = 1.5 Qs = 0.5 T = 10 Time = 120 | 13.2 | 8.3–5.4 | Alcohols Acids Esters Phenols Lactones | 2.0–3.0 18.0–25.0 15.0–19.0 5.0–10.0 7.0–25.0 | SPME–GC/MS | [146] | |
| Langhe Rosè wine | Polypropylene hollow fibers (JU.CLA.S. LTD, Verona, Italy) | Qf = 1.6 Qs = 0.8 T = 10 Time = 360 | 13.2 | 5.0 | Alcohols Acids Esters | 60.4 30.9 47.8 | SPE–GC/FID | [160] | |
| PV | Tokaji Hárslevelű white wine | PERVAP.Sulzer 1060 PDMS | ‘‘Carrier gas mode’’ under atmospheric pressure T = 40–70 | 13.1 | 0.1 | Total volatile aroma** | 70.0 | Distillation/LE–GC/MS | [29] |
| Cabernet Sauvignon red wine | PDMS JS–WSM–8040 (JiuSi High–Tech, Nanjing, China) | Batch operation T = 45 VP = 0.05 | 12.5 | 0.5 | Alcohols Acids Esters | 19.7–39.5 12.7–28.2 48.0–99.9 | GC/MS | [210] | |
| VD | Barbera red wine | – | T = 15 | 15.2 | 5.0 | Alcohols Acids Esters | 50.4 13.7 19.8 | SPE–GC/FID | [160] |
| Verduno Pelaverga red wine | – | T = 15 | 14.6 | 5.0 | Alcohols Acids Esters | 53.6 2.3 19.5 | SPE–GC/FID | [160] | |
| Langhe Rosè wine | – | T = 15 | 13.2 | 5.0 | Alcohols Acids Esters | 51.4 2.5 22.9 | SPE–GC/FID | [160] | |
| SCC | White wine | – | T = 25 VP = 0.08 Time = 60 | 10.6 | 0.3 | Aliphatic alcohols Aromatic alcohols Acids Esters Ketones | 98.0 3.0 20.0 53.0 71.0 | LE–GC/FID | [164] |
| Chardonnay white wine | – | T = 30 VP = 0.04 Time = 60 | ns | ns | Total aroma** | 1.0–9.0 | HS/SPME–GC/MS | [162] | |
| Tempranillo red wine | – | T = 30 VP = 0.04 Time = 60 | ns | ns | Total aroma** | 3.0–18.0 | HS/SPME–GC/MS | [162] | |
| Cabernet Sauvignon rose wine | – | T = 30 VP = 0.04 Time = 60 | ns | ns | Total aroma** | 1.0–4.0 | HS/SPME–GC/MS | [162] | |
| RO-OD/EP | Shiraz red wine | Memstar AA MEM–074 and Liqui–Cel 2.5×8 Extra–flow PP hollow fiber | Qf = ns Qs = ns T = ns P = ns Time = ns | 16.3 | 13.3–10.4 | Alcohols Esters Monoterpenes C13–Norisoprenoids Lactones Others: Dimethyl sulfide | 14.9–38.9 29.8–49.5 9.2–20.8 9.4–14.5 17.1–21.4 52.6–71.9 | HS–SPME–GC/MS | [217] |
| Montepulciano d’Abruzzo red wine | RO membrane (100 DA) and Liqui–cel mini module 1.7×5.5 Membrane | Recycling mode Qf = 1.5 Qs = 0.5 T = 10 P = ns Time = 120 | 13.2 | 7.1–5.5 | Alcohols Acids Esters Phenols Lactones | 17.0–27.0 19.0–24.0 15.0–22.0 16.0–18.0 unc–14.0 | SPME–GC/MS | [146] | |
| Barossa Valley Shiraz – Cabernet Sauvignon red wine | Spiral wound 4040 and hollow fiber perstractive membrane (VA Filtration, Nuriootpa, Australia) | Qf = ns Qs = ns T = 55 P = 30 Time = 90 | 14.1 | 12.5 | Alcohols Acids Esters | 15.5 10.0 5.1 | SPME–GC/MS | [168] | |
| McLaren Vale Cabernet Sauvignon red wine | Spiral wound 4040 and hollow fiber perstractive membrane (VA Filtration, Nuriootpa, Australia) | Qf = ns Qs = ns T = 55 P = 30 Time = 90 | 17.1 | 14.5 | Alcohols Acids Esters | 13.6 6.1 18.8 | SPME–GC/MS | [168] | |
| Adelaide Hills Shiraz red wine | Spiral wound 4040 and hollow fiber perstractive membrane (VA Filtration, Nuriootpa, Australia) | Qf = ns Qs = ns T = 55 P = 30 Time = 90 | 14.9 | 14.2 | Alcohols Acids Esters | 7.0 0.4 8.6 | SPME–GC/MS | [168] | |
| Barossa Valley Shiraz red wine | Spiral wound 4040 and hollow fiber perstractive membrane (VA Filtration, Nuriootpa, Australia) | Qf = ns Qs = ns T = 55 P = 30 Time = 90 | 15.2 | 12.6 | Alcohols Acids Esters | 11.0 5.6 21.2 | SPME–GC/MS | [168] | |
| McLaren Vale Shiraz red wine | Spiral wound 4040 and hollow fiber perstractive membrane | Qf = ns Qs = ns T = 55 P = 30 Time = 90 | 14.7 | 12.3 | Alcohols Acids Esters | 7.1 2.5 9.7 | SPME–GC/MS | [168] | |
| Cabernet Sauvignon red wine A | Spiral wound 4040 and hollow fiber perstractive membrane (VA Filtration, Nuriootpa, Australia) | Qf = ns Qs = ns T = 55 P = 30 Time = 90 | 17.0 | 14.5 | Alcohols Acids Esters | 8.2 15.9 17.4 | [169] | ||
| Cabernet Sauvignon red wine B | Spiral wound 4040 and hollow fiber perstractive membrane (VA Filtration, Nuriootpa, Australia) | Qf = ns Qs = ns T = 55 P = 30 Time = 90 | 15.5 | 13.3 | Alcohols Acids | 3.8 12.0 | [169] | ||
| Cabernet Sauvignon red wine C | Spiral wound 4040 and hollow fiber perstractive membrane (VA Filtration, Nuriootpa, Australia) | Qf = ns Qs = ns T = 55 P = 30 Time = 90 | 14.9 | 13.3 | Alcohols | 16.4 | [169] | ||
| Cabernet Sauvignon red wine D | Spiral wound 4040 and hollow fiber perstractive membrane (VA Filtration, Nuriootpa, Australia) | Qf = ns Qs = ns T = 55 P = 30 Time = 90 | 14.5 | 13.2 | Alcohols Acids Esters | 7.1 4.7 76.5 | [169] | ||
| Dealcoholization Process | Wine Type | Membrane | Operating Mode/Conditions | Alcohol Reduction | Findings on Sensory Characteristics | Reference | |
|---|---|---|---|---|---|---|---|
| Co (% v/v) | Cf (% v/v) | ||||||
| NF | Red Wine | Polyamide, NF97, NF99 HF Alfa Laval | T = 30 P = 16 | 12.0 | 9.1 | Increase in astringency and unbalanced aroma and taste due to alcohol reduction | [33] |
| RO | Syrah red wine | ns | T = ns P = ns | 12.7 | 11.1–9.6 | Decrease in wine length in the mouth and increase in red fruits and then woody and blackcurrant perceptions (using TDS and attributed to alcohol reduction). Decrease in heat and sweetness intensity (attributed to alcohol reduction) and red fruit intensity (attributed to RO) | [189] |
| Merlot red wine | ns | T = ns P = ns | 13.4 | 11.8–10.2 | Decrease om wine length in the mouth and increase in astringent and then of fruity perceptions (using TDS and attributed to alcohol reduction). Decrease in heat and texture intensity (attributed to alcohol reduction) and increase in acid intensity (attributed to RO) | [189] | |
| Syrah red wine | ns | T = ns P = ns | 13.4 | 11.4–7.9 | Decrease in persistence, complexity, number of aromas and increase in balance, harmony, and familiarity. Decrease in familiarity and harmony after 4% v/v reduction | [244] | |
| OD/EP | white wine | PTFE hollow fiber (Teflon, Verona, Italy) | Qf = 0.2 Qs = 0.2 T = 20 Time = ns | ns | * | Floral, fruity, and vegetable notes, as well as acidity, saltiness, and bitterness, were not significantly influenced. Decrease in wine body, persistence, and honey note. | [196] |
| Falanghina white wine | Liqui-Cel 0.5x1, PP hollow fiber | Qf = 0.07 Qs = 0.14 T = 10 Time = 240 | 12.5 | 9.8–0.3 | Decrease in odor, sweetness, and body, resulting in unbalanced taste and overall unacceptable, with an unpleasant aftertaste | [36] | |
| Aglianico red wine | Liqui-Cel Extra-flow, PP hollow fiber | Qf = 0.583 Qs = 0.183 T = 20 Time = 283 | 13.8 | 11.6–8.8 | Decrease in cherry, red fruits, and sweet notes. Increase in flowers notes only within 2% v/v reduction. Increase in grass and cooked notes and increase in astringency within 5% v/v reduction. Increase in bitterness and acid sensations within 3% v/v reduction | [32] | |
| Aglianico red wine | Liqui-Cel Extra-flow | Qf = ns Qs = ns T = ns Time = 180 | 12.8 | 4.9–0.4 | Decrease in sweet and solvent aroma series (due to alcohol reduction) which characterize the wine | [197] | |
| Aglianico red wine | Liqui-Cel Extra-flow, PP hollow fiber | Qf = 0.583 Qs = 0.183 T = 20 Time = 283 | 15.5 | 13.5–10.8 | Decrease in cherry, red fruits, flowers, and grass notes. Increase in acid and astringent sensations | [32] | |
| Montepulciano d’Abruzzo red wine | Liqui-Cel 0.5×1, PP hollow fiber | Recycling mode Qf = 1.5 Qs = 0.5 T = 10 Time = 240 | 13.2 | 8.3–2.7 | Increase in acidity, a decrease in red fruits and spices notes, astringency, bitterness, and sweetness, resulting in lower acceptability | [35] | |
| PV | Cabernet Sauvignon red wine | PDMS JS-WSM-8040 (JiuSi High-Tech, Nanjing, China) | Batch operation T = 45 VP = 0.05 | 12.5 | 0.5 | High retention of fruit aroma, producing wine with better smell and taste | [210] |
| SCC | Chardonnay white wine | – | ns | 14.9 | 14.6–12.9 | Decrease in overall aroma intensity and hot mouthfeel sensation | [245] |
| RO-OD/EP | Shiraz red wine | Memstar AA MEM-074 and Liqui-Cel 2.5 × 8 Extra-flow PP hollow fiber | Qf = ns Qs = ns T = ns P = ns Time = ns | 16.3 | 13.3–10.4 | Increase in dark fruit, raisin/prune, alcohol, and astringency in all dealcoholized wines with no significant effects. Increase in black pepper note and overall aroma intensity, and decrease in herbaceous note within 6% v/v reduction off alcohol | [217] |
| Cabernet Sauvignon red wine A | Spiral wound 4040 and hollow fiber perstractive membrane (VA Filtration, Nuriootpa, Australia) | Qf = ns Qs = ns T = 55 P = 30 Time = 90 | 17.0 | 14.5 | Increase in dark fruit aroma and decrease of green aroma, dried fruit, and chocolate flavors with no significant difference in the overall intensity. A small decrease in acidity. Small but significant decreases in sweetness and saltiness. Increase in the sensation of astringency | [169] | |
| Cabernet Sauvignon red wine B | Spiral wound 4040 and hollow fiber perstractive membrane (VA Filtration, Nuriootpa, Australia) | Qf = ns Qs = ns T = 55 P = 30 Time = 90 | 15.5 | 13.3 | Decreases in hotness, bitterness, and body (attributed to lower ethanol level). Decrease in confection and ‘chocolate’ aromas. Significant decrease in the overall flavor intensity (largely due to the decreased intensity of dark fruit, sweet spice, and chocolate flavors) with no significant effect on the overall intensity | [169] | |
| Cabernet Sauvignon red wine C | Spiral wound 4040 and hollow fiber perstractive membrane (VA Filtration, Nuriootpa, Australia) | Qf = ns Qs = ns T = 55 P = 30 Time = 90 | 14.9 | 13.3 | Decrease in hotness (attributed to lower ethanol level). Decrease in confection, dried fruit, and chocolate aromas with no significant difference in the overall intensity. Decrease in the sensation of astringency | [169] | |
| Cabernet Sauvignon red wine D | Spiral wound 4040 and hollow fiber perstractive membrane (VA Filtration, Nuriootpa, Australia) | Qf = ns Qs = ns T = 55 P = 30 Time = 90 | 14.5 | 13.2 | Decrease in hotness (attributed to lower ethanol level). Increase in red fruit aroma with no significant difference in the overall intensity | [169] | |
| Cabernet Sauvignon red wine E | Spiral wound 4040 and hollow fiber perstractive membrane (VA Filtration, Nuriootpa, Australia) | Qf = ns Qs = ns T = 55 P = 30 Time = 90 | 16.0 | 14.2 | Decrease in hotness (attributed to lower ethanol level). Decrease in overall flavor intensity with no significant difference in the overall intensity. Small but significant decreases in sweetness and saltiness | [169] | |
Publisher’s Note: MDPI stays neutral with regard to jurisdictional claims in published maps and institutional affiliations. |
© 2021 by the authors. Licensee MDPI, Basel, Switzerland. This article is an open access article distributed under the terms and conditions of the Creative Commons Attribution (CC BY) license (https://creativecommons.org/licenses/by/4.0/).
Share and Cite
Sam, F.E.; Ma, T.-Z.; Salifu, R.; Wang, J.; Jiang, Y.-M.; Zhang, B.; Han, S.-Y. Techniques for Dealcoholization of Wines: Their Impact on Wine Phenolic Composition, Volatile Composition, and Sensory Characteristics. Foods 2021, 10, 2498. https://doi.org/10.3390/foods10102498
Sam FE, Ma T-Z, Salifu R, Wang J, Jiang Y-M, Zhang B, Han S-Y. Techniques for Dealcoholization of Wines: Their Impact on Wine Phenolic Composition, Volatile Composition, and Sensory Characteristics. Foods. 2021; 10(10):2498. https://doi.org/10.3390/foods10102498
Chicago/Turabian StyleSam, Faisal Eudes, Teng-Zhen Ma, Rafia Salifu, Jing Wang, Yu-Mei Jiang, Bo Zhang, and Shun-Yu Han. 2021. "Techniques for Dealcoholization of Wines: Their Impact on Wine Phenolic Composition, Volatile Composition, and Sensory Characteristics" Foods 10, no. 10: 2498. https://doi.org/10.3390/foods10102498