
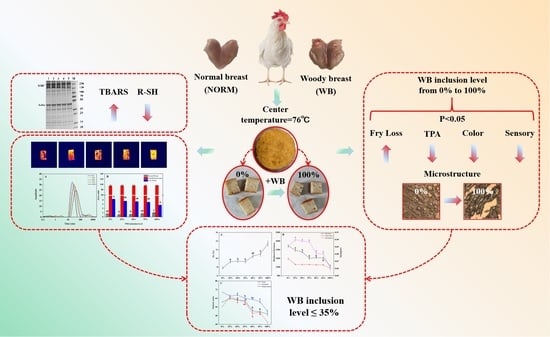
Low-Field NMR Analysis of Chicken Patties Prepared with Woody Breast Meat and Implications to Meat Quality


Abstract
:
1. Introduction
2. Materials and Methods
2.1. Sample Preparation
2.2. Determination of TBARS Value
2.3. Protein Oxidation Analysis
2.3.1. Determination of Sulfhydryl Groups and Surface Hydrophobicity
2.3.2. Sodium Dodecyl Sulfate-Polyacrylamide Gel Electrophoresis (SDS-PAGE)
2.4. Fry Loss
2.5. Nuclear Magnetic Resonance (NMR) Relaxation Measurements
2.6. Color of Patties
2.7. Texture Profile Analysis (TPA)
2.8. Microstructural of Patties
2.9. Sensory Evaluation
2.10. Optimal Application of WB
2.11. Data Analysis
3. Results
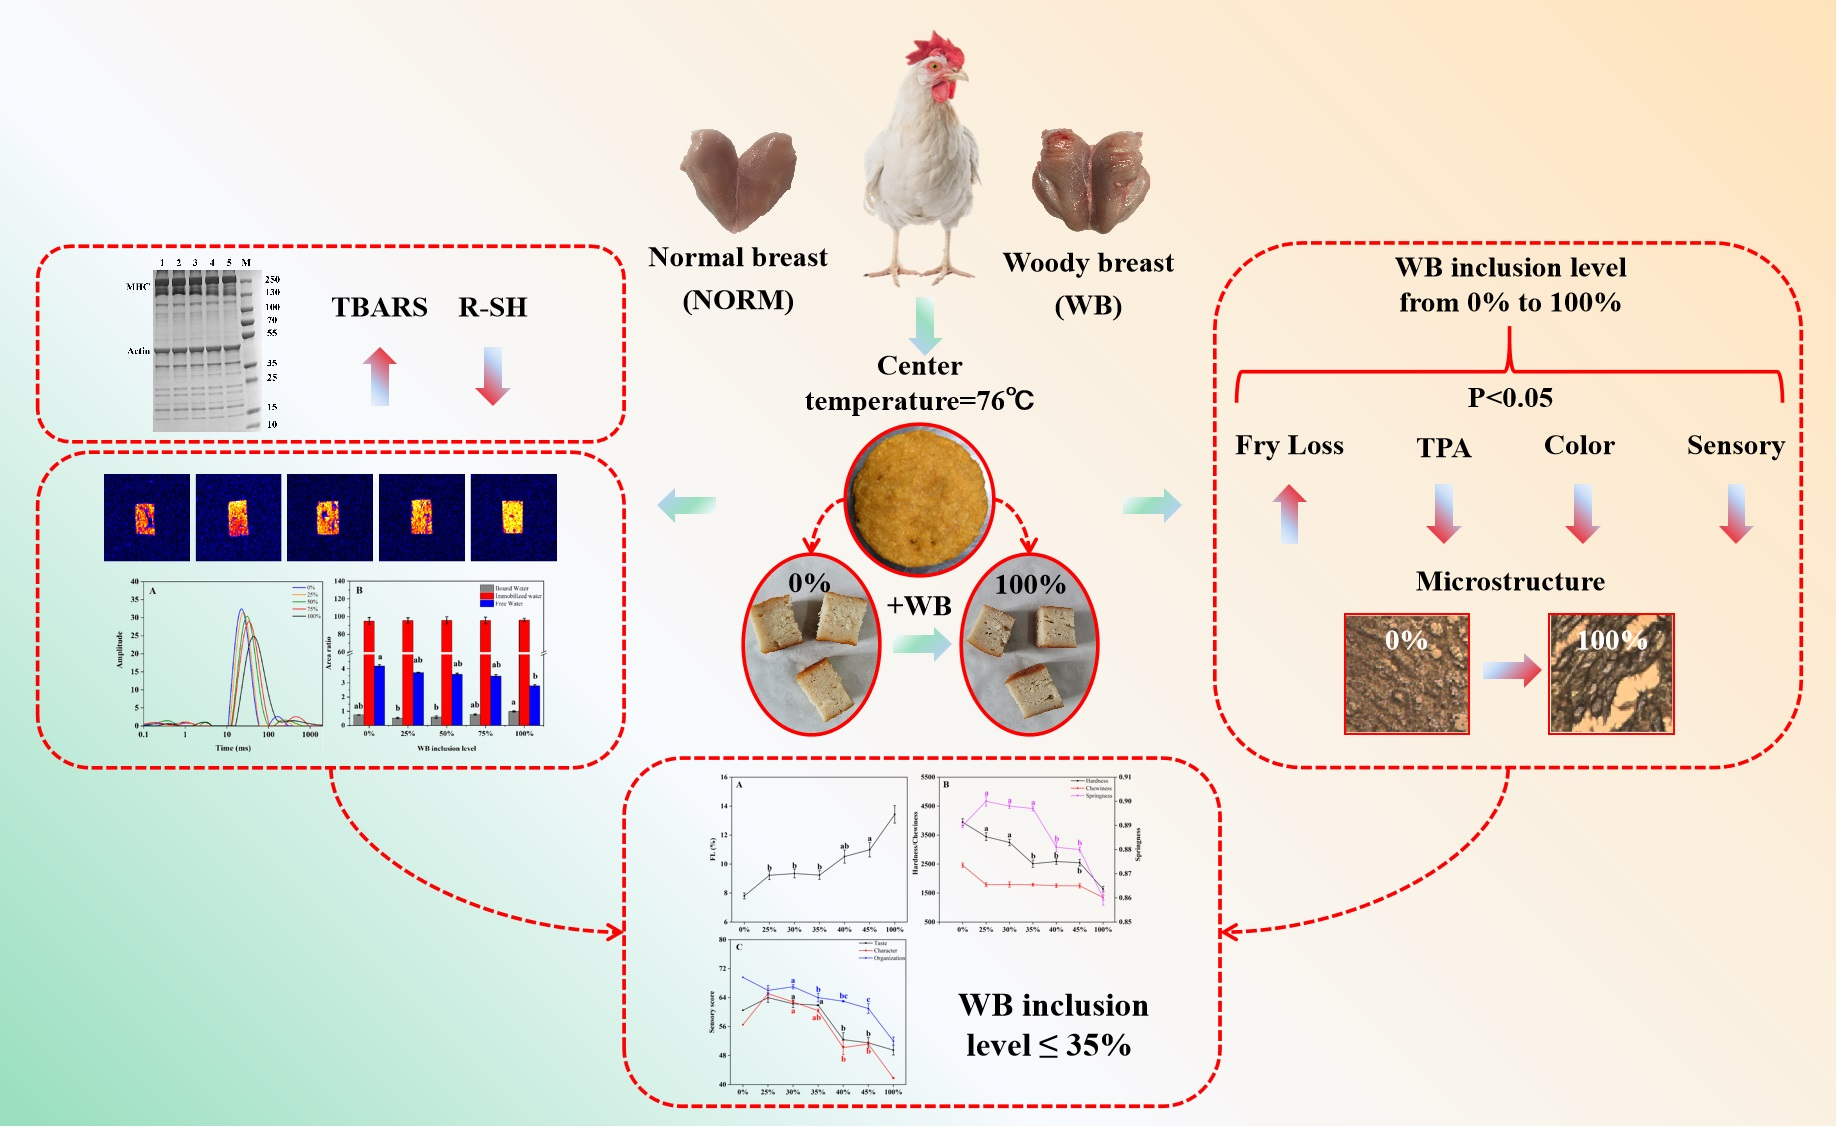
3.1. Lipid Oxidation
3.2. Protein Oxidation
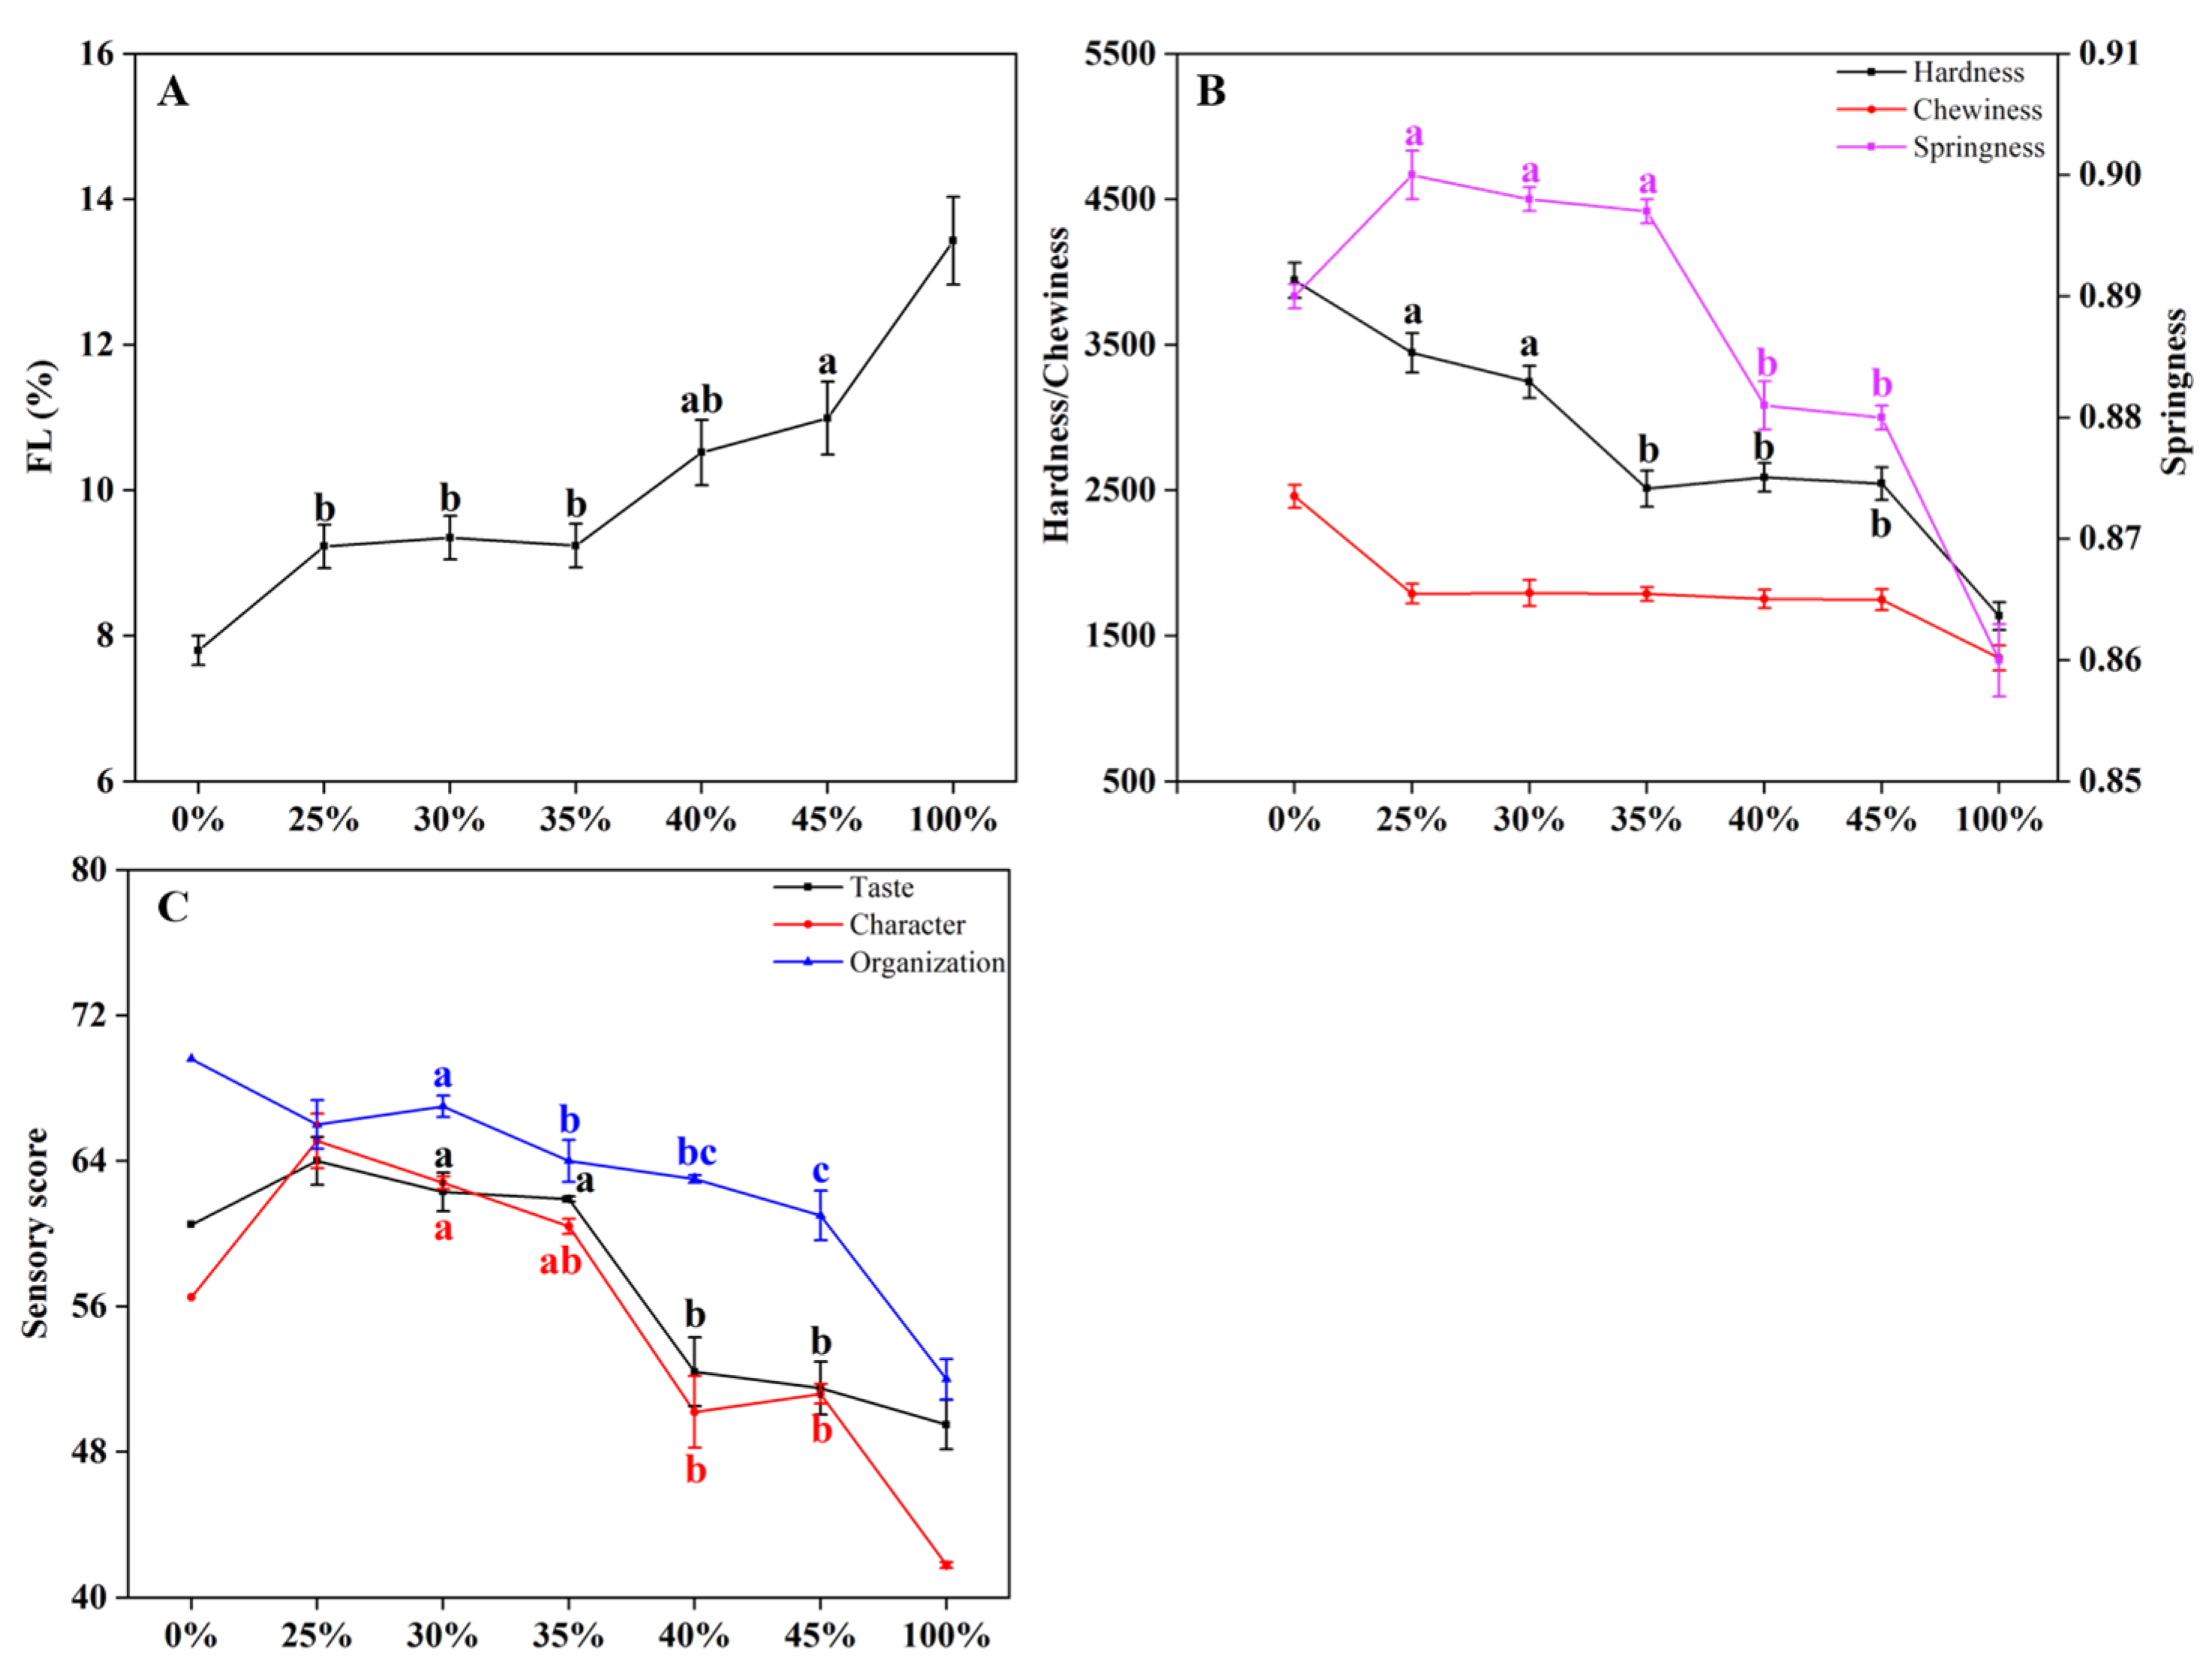
3.3. Frying Loss
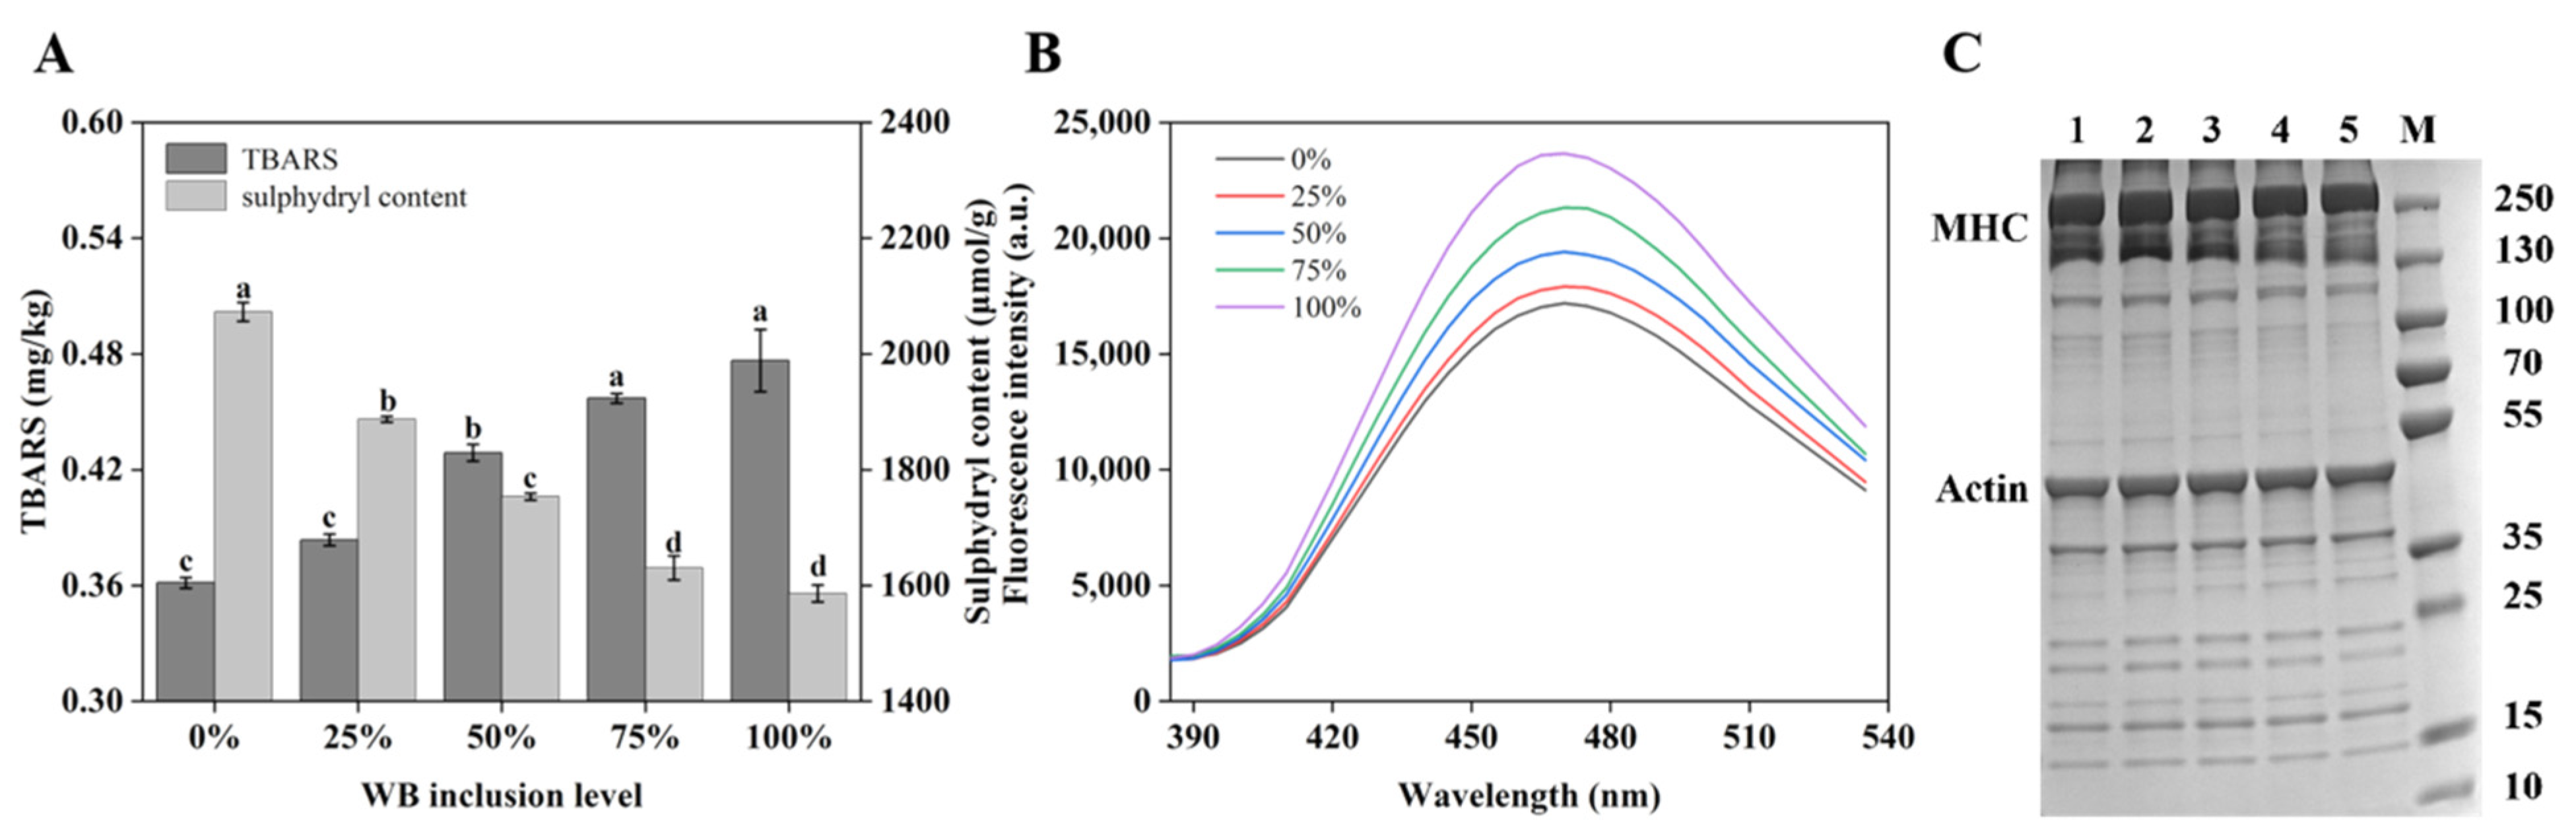
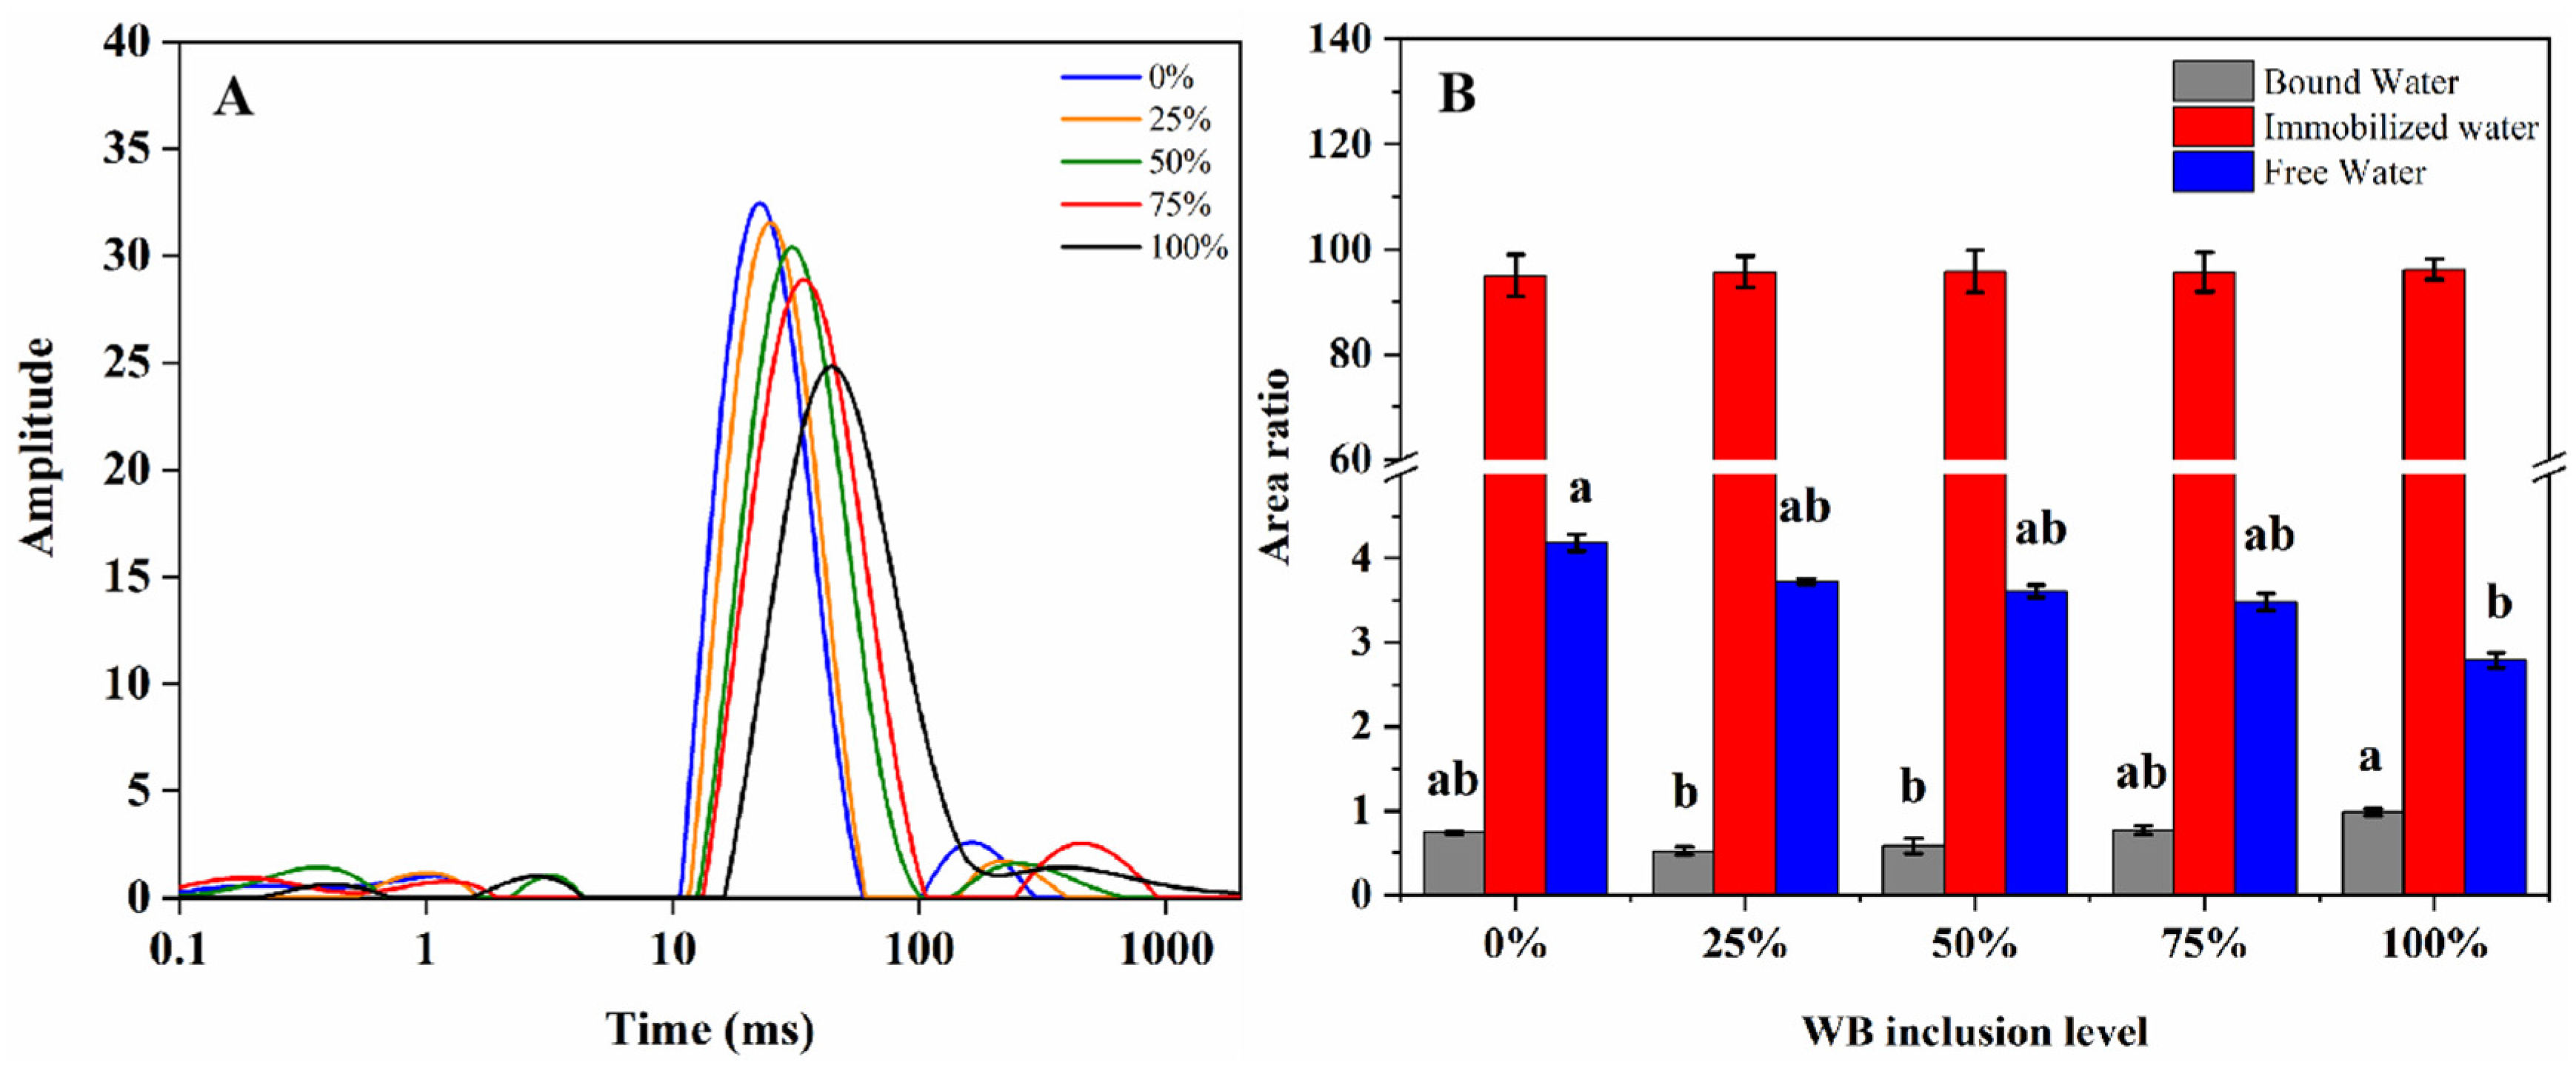
3.4. Low-Field NMR
3.5. Color
3.6. Texture Attributes
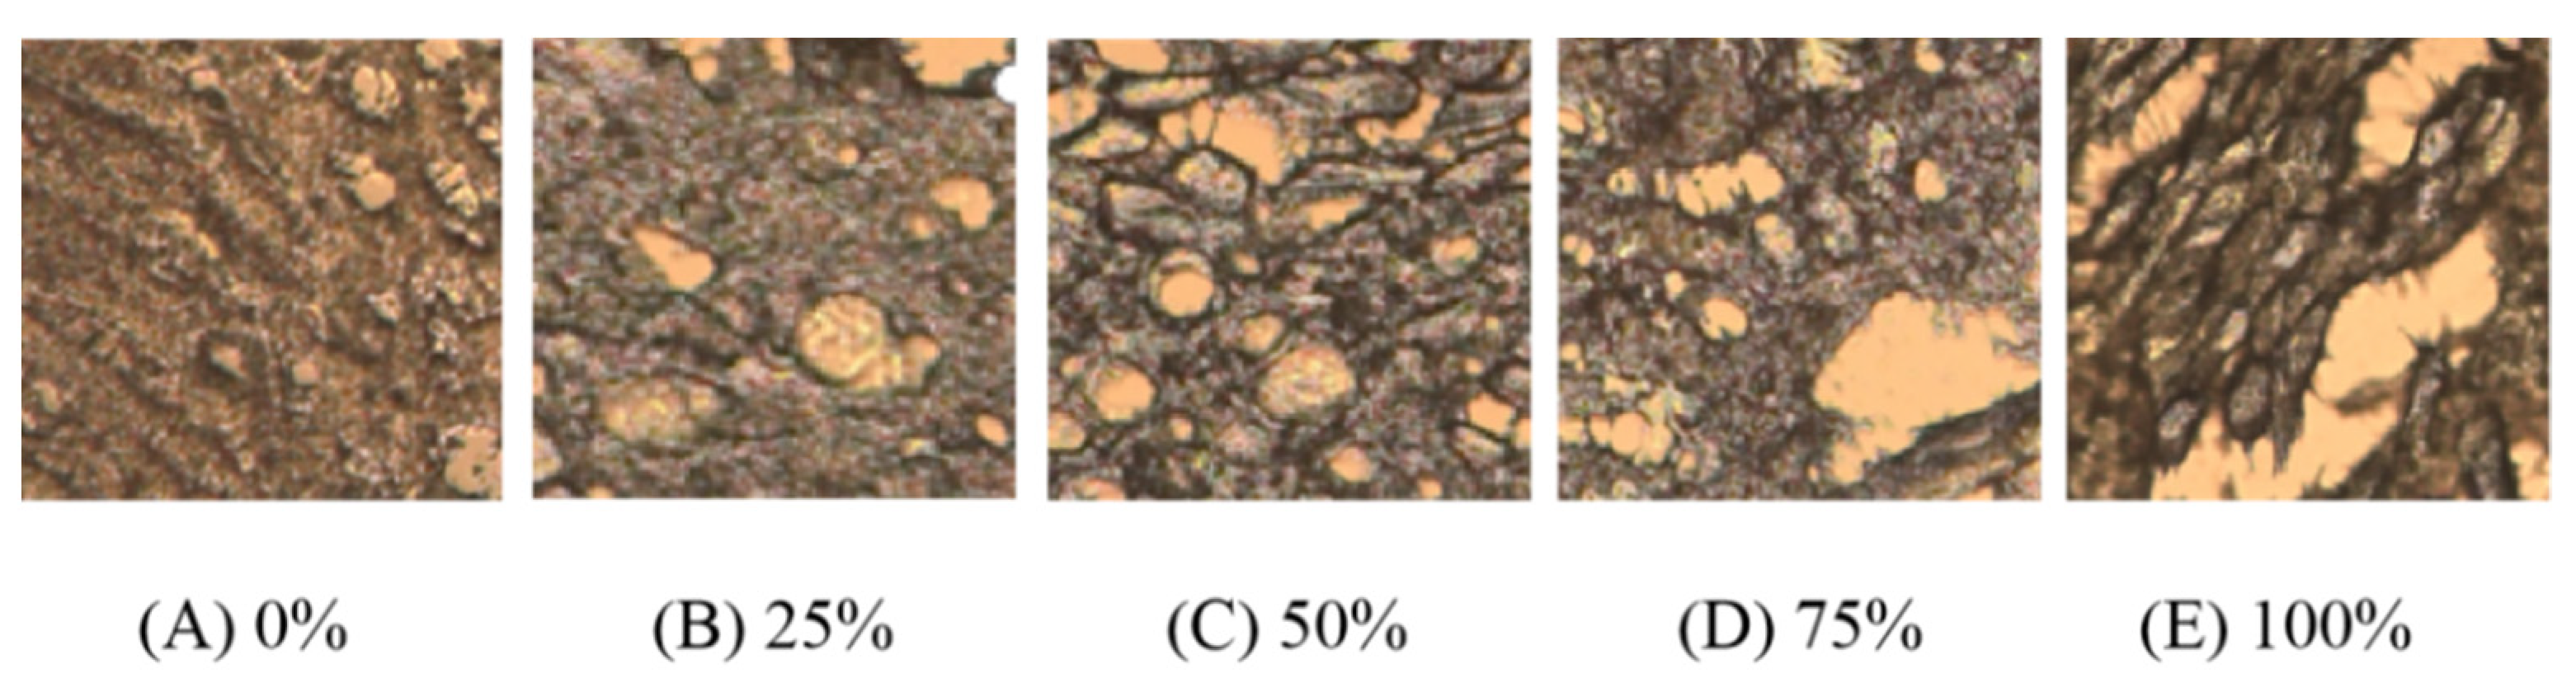
3.7. Microstructural
3.8. Sensory Attributes
3.9. Optimal WB Application
4. Discussion
5. Conclusions
Author Contributions
Funding
Institutional Review Board Statement
Informed Consent Statement
Data Availability Statement
Acknowledgments
Conflicts of Interest
References
- Caldas-Cueva, J.P.; Mauromoustakos, A.; Owens, C.M. Instrumental texture analysis of chicken patties prepared with broiler breast fillets exhibiting woody breast characteristics. Poult. Sci. 2021, 100, 1239–1247. [Google Scholar] [CrossRef] [PubMed]
- Petracci, M.; Soglia, F.; Madruga, M.; Carvalho, L.; Ida, E.; Estévez, M. Wooden-breast, white striping, and spaghetti meat: Causes, consequences and consumer perception of emerging broiler meat abnormalities. Compr. Rev. Food Sci. Food Saf. 2019, 18, 565–583. [Google Scholar] [CrossRef] [PubMed] [Green Version]
- Sihvo, H.-K.; Lindén, J.; Airas, N.; Immonen, K.; Valaja, J.; Puolanne, E. Wooden breast myodegeneration of pectoralis major muscle over the growth period in broilers. Vet. Pathol. 2016, 54, 119–128. [Google Scholar] [CrossRef] [PubMed]
- Mudalal, S.; Lorenzi, M.; Soglia, F.; Cavani, C.; Petracci, M. Implications of white striping and wooden breast abnormalities on quality traits of raw and marinated chicken meat. Animal 2015, 9, 728–734. [Google Scholar] [CrossRef] [PubMed] [Green Version]
- Soglia, F.; Mudalal, S.; Babini, E.; di Nunzio, M.; Mazzoni, M.; Sirri, F.; Cavani, C.; Petracci, M. Histology, composition, and quality traits of chicken Pectoralis major muscle affected by wooden breast abnormality. Poult. Sci. 2016, 95, 651–659. [Google Scholar] [CrossRef] [PubMed]
- Tasoniero, G.; Bertram, H.C.; Young, J.F.; Zotte, A.D.; Puolanne, E. Relationship between hardness and myowater properties in wooden breast affected chicken meat: A nuclear magnetic resonance study. LWT 2017, 86, 20–24. [Google Scholar] [CrossRef]
- Xing, T.; Zhao, X.; Cai, L.; Guanghong, Z.; Xu, X. Effect of salt content on gelation of normal and wooden breast myopathy chicken pectoralis major meat batters. Int. J. Food Sci. Technol. 2017, 52, 2068–2077. [Google Scholar] [CrossRef]
- Sanchez-Brambila, G.; Chatterjee, D.; Bowker, B.; Zhuang, H. Descriptive texture analyses of cooked patties made of chicken breast with the woody breast condition. Poult. Sci. 2017, 96, 3489–3494. [Google Scholar] [CrossRef]
- Zhang, Y.; Wang, P.; Xu, X.; Xia, T.; Li, Z.; Zhao, T. Effect of wooden breast myopathy on water-holding capacity and rheological and gelling properties of chicken broiler breast batters. Poult. Sci. 2020, 99, 3742–3751. [Google Scholar] [CrossRef]
- Caldas-Cueva, J.P.; Owens, C.M. A review on the woody breast condition, detection methods, and product utilization in the contemporary poultry industry. J. Anim. Sci. 2020, 98, skaa207. [Google Scholar] [CrossRef]
- Sun, X.; You, J.; Xu, L.; Zhou, D.; Cai, H.; Maynard, C.J.; Caldas-Cueva, J.P. Quality properties of chicken meatballs prepared with varying proportions of woody breast meat. J. Food Sci. Technol. 2021, 1–11. [Google Scholar] [CrossRef]
- Chen, H.; Wang, H.; Qi, J.; Wang, M.; Xu, X.; Zhou, G. Chicken breast quality–normal, pale, soft and exudative (PSE) and woody–influences the functional properties of meat batters. Int. J. Food Sci. Technol. 2018, 53, 654–664. [Google Scholar] [CrossRef]
- Caldas-Cueva, J.P.; Maynard, C.J.; Mauromoustakos, A.; Owens, C.M. Effect of woody breast condition on instrumental texture characteristics of poultry deli loaves. Meat Muscle Biol. 2020, 4, 1–10. [Google Scholar] [CrossRef]
- Sanchez, B.; Bowker, G.B.C.; Zhuang, H. Comparison of sensory texture attributes of broiler breast fillets with different degrees of white striping. Poult. Sci. 2016, 95, 2472–2476. [Google Scholar] [CrossRef] [PubMed]
- Dalgaard, L.B.; Rasmussen, M.K.; Bertram, H.C.; Jensen, J.A.; Møller, H.S.; Aaslyng, M.D.; Hejbøl, E.K.; Pedersen, J.R.; Elsser-Gravesen, D.; Young, J.F. Classification of wooden breast myopathy in chicken pectoralis major by a standardised method and association with conventional quality assessments. Int. J. Food Sci. Technol. 2018, 53, 1744–1752. [Google Scholar] [CrossRef]
- Pang, B.; Bowker, B.; Yang, Y.; Zhang, J.; Zhuang, H. Relationships between instrumental texture measurements and subjective woody breast condition scores in raw broiler breast fillets. Poult. Sci. 2020, 99, 3292–3298. [Google Scholar] [CrossRef]
- Tijare, V.V.; Yang, F.L.; Kuttappan, V.A.; Alvarado, C.Z.; Coon, C.N.; Owens, C.M. Meat quality of broiler breast fillets with white striping and woody breast muscle myopathies. Poult. Sci. 2016, 95, 2167–2173. [Google Scholar] [CrossRef] [PubMed]
- Sun, X.; Koltes, D.; Coon, C.; Chen, K.; Owens, C. Instrumental compression force and meat attribute changes in woody broiler breast fillets during short-term storage. Poult. Sci. 2018, 97, 2600–2606. [Google Scholar] [CrossRef] [PubMed]
- Zhang, W.; Xiao, S.; Lee, E.J.; Ahn, D.U. Consumption of oxidized oil increases oxidative stress in broilers and affects the quality of breast meat. J. Agric. Food Chem. 2011, 59, 969–974. [Google Scholar] [CrossRef] [PubMed] [Green Version]
- Han, M.; Zhang, Y.; Fei, Y.; Xu, X.; Zhou, G. Effect of microbial transglutaminase on NMR relaxometry and microstructure of pork myofibrillar protein gel. Eur. Food Res. Technol. 2009, 228, 665–670. [Google Scholar] [CrossRef]
- Guo, X.; Peng, Z.; Zhang, Y.; Liu, B.; Cui, Y. The solubility and conformational characteristics of porcine myosin as affected by the presence of L-lysine and L-histidine. Food Chem. 2015, 170, 212–217. [Google Scholar] [CrossRef]
- Creamer, L.; Zoerb, H.; Olson, N.; Richardson, T. Surface hydrophobicity of αs1 -I, αs1 -casein A and B and its implications in cheese structure. J. Dairy Sci. 1982, 65, 902–906. [Google Scholar] [CrossRef]
- Li, K.; Kang, Z.-L.; Zou, Y.-F.; Xu, X.-L.; Zhou, G.-H. Effect of ultrasound treatment on functional properties of reduced-salt chicken breast meat batter. J. Food Sci. Technol. 2015, 52, 2622–2633. [Google Scholar] [CrossRef]
- Lyon, B.G.; Lyon, C.E. Texture evaluations of cooked, diced broiler breast samples by sensory and mechanical methods. Poult. Sci. 1996, 75, 812–819. [Google Scholar] [CrossRef]
- Morita, K.; Kubota, K.; Aishima, T. Comparison of aroma characteristics of 16 fish species by sensory evaluation and gas chromatographic analysis. J. Sci. Food Agric. 2003, 83, 289–297. [Google Scholar] [CrossRef]
- Zhuang, H.; Savage, E.M.; Smith, D.P.; Berrang, M.E. Effect of dry-air chilling on sensory descriptive profiles of cooked broiler breast meat deboned four hours after the initiation of chilling. Poult. Sci. 2009, 88, 1282–1291. [Google Scholar] [CrossRef]
- Guyon, C.; Meynier, A.; de Lamballerie, M. Protein and lipid oxidation in meat: A review with emphasis on high-pressure treatments. Trends Food Sci. Technol. 2016, 50, 131–143. [Google Scholar] [CrossRef]
- Johnson, D.R.; Decker, E.A. The role of oxygen in lipid oxidation reactions: A review. Annu. Rev. Food Sci. Technol. 2015, 6, 171–190. [Google Scholar] [CrossRef] [PubMed]
- Utrera, M.; Morcuende, D.; Estévez, M. Fat content has a significant impact on protein oxidation occurred during frozen storage of beef patties. LWT 2014, 56, 62–68. [Google Scholar] [CrossRef]
- Sharedeh, D.; Gatellier, P.; Astruc, T.; Daudin, J.-D. Effects of pH and NaCl levels in a beef marinade on physicochemical states of lipids and proteins and on tissue microstructure. Meat Sci. 2015, 110, 24–31. [Google Scholar] [CrossRef]
- Mitchell, J.; Gladden, L.; Chandrasekera, T.; Fordham, E. Low-field permanent magnets for industrial process and quality control. Prog. Nucl. Magn. Reson. Spectrosc. 2014, 76, 1–60. [Google Scholar] [CrossRef]
- Kim, H.-W.; Choi, Y.-S.; Choi, J.-H.; Kim, H.-Y.; Lee, M.-A.; Hwang, K.-E.; Song, D.-H.; Lim, Y.-B.; Kim, C.-J. Tenderization effect of soy sauce on beef M. biceps femoris. Food Chem. 2013, 139, 597–603. [Google Scholar] [CrossRef]
- Kang, Z.-L.; Zou, Y.-F.; Xu, X.-L.; Zhu, C.-Z.; Wang, P.; Zhou, G.-H. Effect of a beating process, as a means of reducing salt content in Chinese-style meatballs (kung-wan): A physico-chemical and textural study. Meat Sci. 2014, 96, 147–152. [Google Scholar] [CrossRef] [PubMed]
- Pietrasik, Z. Effect of content of protein, fat and modified starch on binding textural characteristics, and colour of comminuted scalded sausages. Meat Sci. 1999, 51, 17–25. [Google Scholar] [CrossRef]
- Cai, K.; Shao, W.; Chen, X.; Campbell, Y.L.; Nair, M.N.; Suman, S.; Beach, C.M.; Guyton, M.C.; Schilling, M.W. Meat quality traits and proteome profile of woody broiler breast (pectoralis major) meat. Poult. Sci. 2018, 97, 337–346. [Google Scholar] [CrossRef] [PubMed]
- García-Segovia, P.; Andrés-Bello, A.; Martínez-Monzó, J. Effect of cooking method on mechanical properties, color and structure of beef muscle (M. pectoralis). J. Food Eng. 2007, 80, 813–821. [Google Scholar] [CrossRef]
- Kılıç, B.; Şimşek, A.; Claus, J.R.; Atılgan, E. Encapsulated phosphates reduce lipid oxidation in both ground chicken and ground beef during raw and cooked meat storage with some influence on color, pH, and cooking loss. Meat Sci. 2014, 96, 93–103. [Google Scholar] [CrossRef] [PubMed]
- Zhuang, H.; Bowker, B. The wooden breast condition results in surface discoloration of cooked broiler pectoralis major. Poult. Sci. 2018, 97, 4458–4461. [Google Scholar] [CrossRef]
- Chatterjee, D.; Zhuang, H.; Bowker, B.C.; Sanchez-Brambila, G.; Rincon, A.M. Instrumental texture characteristics of broiler pectoralis major with the wooden breast condition. Poult. Sci. 2016, 95, 2449–2454. [Google Scholar] [CrossRef]
- Zotte, A.D.; Tasoniero, G.; Puolanne, E.; Remignon, H.; Cecchinato, M.; Catelli, E.; Cullere, M. Effect of “wooden breast” appearance on poultry meat quality, histological traits, and lesions characterization. Czech J. Anim. Sci. 2017, 62, 51–57. [Google Scholar] [CrossRef] [Green Version]
- Kuttappan, V.A.; Hargis, B.M.; Owens, C.M. White striping and woody breast myopathies in the modern poultry industry: A review. Poult. Sci. 2016, 95, 2724–2733. [Google Scholar] [CrossRef]
- Qin, N. The Utilization of Poultry Breast Muscle of Different Quality Classes. Master’s Thesis, University of Helsinki, Helsinki, Finland, 2013. [Google Scholar]


| Parameter | Definition | Grade and Grading Criteria |
|---|---|---|
| Character phase | Hardness and cohesiveness of samples, compressed the sample with tooth and feeling of the degree of breakage | Hard, sticky taste (0–25); Soft texture, slightly sticky (26–50); Moderate soft and hard, not sticky (51–75); Entrance is soft and elastic (76–100) |
| Organization phase | Stomata and section structure of the chicken patties were observed along the inside or cross section of the chicken patties | Internal porosity, loose structure (0–25); More internal pores and complete structure (26–50); A small number of stomata and particulate matter, structural integrity (51–75); No porosity, compact structure (76–100) |
| Taste phase | Smell (aromatic taste sensation) and flavor of chicken patties. | No chicken flavor with peculiar smell (0–25); Has chicken meat flavor, no peculiar smell (26–50); Tastes good and no peculiar smell (51–75); The chicken has strong flavor, good taste and no peculiar smell (76–100) |
| Measured Parameters | Woody Breast Additions | p | |||||
|---|---|---|---|---|---|---|---|
| 0% | 25% | 50% | 75% | 100% | |||
| FL/% | 7.80 ± 0.20 c | 9.23 ± 0.20 c | 11.33 ± 0.42 b | 12.47 ± 0.44 ab | 13.43 ± 0.80 a | <0.05 | |
| Color | |||||||
| External | L* | 62.48 ± 0.47 c | 63.27 ± 0.75 bc | 63.85 ± 0.46 bc | 65.49 ± 0.39 a | 65.67 ± 0.76 a | <0.01 |
| a* | 6.91 ± 0.31 a | 6.39 ± 0.18 a | 4.55 ± 0.54 b | 4.00 ± 0.35 bc | 3.24 ± 0.09 c | <0.01 | |
| b* | 38.13 ± 0.74 ab | 38.89 ± 0.37 a | 36.96 ± 0.40 b | 36.68 ± 0.75 b | 33.84 ± 0.28 c | <0.01 | |
| Internal | L* | 77.77 ± 1.03 | 78.93 ± 0.18 | 79.13 ± 0.22 | 78.85 ± 0.20 | 77.85 ± 0.76 | >0.05 |
| a* | 0.33 ± 0.06 a | 0.20 ± 0.07 a | 0.13 ± 0.06 ab | 0.14 ± 0.05 ab | −0.02 ± 0.10 b | <0.05 | |
| b* | 14.08 ± 0.12 d | 14.86 ± 0.06 c | 15.09 ± 0.16 bc | 15.27 ± 0.09 b | 15.82 ± 0.07 a | <0.01 | |
| Measured Parameters | Woody Breast Additions | p | ||||
|---|---|---|---|---|---|---|
| 0% | 25% | 50% | 75% | 100% | ||
| TPA | ||||||
| Hardness/g | 3944.84 ± 88.71 a | 3445.24 ± 114.62 a | 2457.08 ± 123.80 b | 2296.87 ± 114.15 b | 1637.81 ± 75.68 c | <0.01 |
| Springiness | 0.89 ± 0.01 ab | 0.90 ± 0.01 a | 0.88 ± 0.01 bc | 0.88 ± 0.01 bc | 0.86 ± 0.01 c | <0.01 |
| Chewiness/g | 2458.90 ± 176.73 a | 1790.45 ± 87.55 b | 1739.33 ± 85.93 bc | 1416.00 ± 88.80 cd | 1348.76 ± 125.44 d | <0.01 |
| Cohesiveness | 0.73 ± 0.01 | 0.74 ± 0.01 | 0.73 ± 0.01 | 0.74 ± 0.01 | 0.73 ± 0.01 | >0.05 |
| Resilience | 0.36 ± 0.01 | 0.36 ± 0.00 | 0.37 ± 0.01 | 0.37 ± 0.01 | 0.38 ± 0.01 | >0.05 |
| Sensory | ||||||
| Character | 56.50 ± 3.17 ab | 65.10 ± 4.49 a | 48.10 ± 5.63 bc | 52.50 ± 2.27 bc | 41.80 ± 5.51 c | <0.01 |
| Organization | 69.60 ± 2.43 a | 66.00 ± 2.21 ab | 63.90 ± 2.96 ab | 58.60 ± 2.70 bc | 52.80 ± 2.90 c | <0.01 |
| Taste | 60.50 ± 3.61 a | 64.00 ± 3.32 a | 50.10 ± 2.11 b | 56.90 ± 2.79 ab | 49.50 ± 3.36 b | <0.01 |
| Total score | 61.63 ± 2.19 ab | 65.04 ± 2.02 a | 53.44 ± 2.17 cd | 55.65 ± 1.37 bc | 47.41 ± 2.85 d | <0.01 |
Publisher’s Note: MDPI stays neutral with regard to jurisdictional claims in published maps and institutional affiliations. |
© 2021 by the authors. Licensee MDPI, Basel, Switzerland. This article is an open access article distributed under the terms and conditions of the Creative Commons Attribution (CC BY) license (https://creativecommons.org/licenses/by/4.0/).
Share and Cite
Sun, X.; You, J.; Dong, Y.; Xu, L.; Maynard, C.J.; Owens, C.M. Low-Field NMR Analysis of Chicken Patties Prepared with Woody Breast Meat and Implications to Meat Quality. Foods 2021, 10, 2499. https://doi.org/10.3390/foods10102499
Sun X, You J, Dong Y, Xu L, Maynard CJ, Owens CM. Low-Field NMR Analysis of Chicken Patties Prepared with Woody Breast Meat and Implications to Meat Quality. Foods. 2021; 10(10):2499. https://doi.org/10.3390/foods10102499
Chicago/Turabian StyleSun, Xiao, Jinjie You, Yan Dong, Ligen Xu, Clay J. Maynard, and Casey M. Owens. 2021. "Low-Field NMR Analysis of Chicken Patties Prepared with Woody Breast Meat and Implications to Meat Quality" Foods 10, no. 10: 2499. https://doi.org/10.3390/foods10102499