Effect of Clearance and Cavity Geometries on Leakage Performance of a Stepped Labyrinth Seal


Abstract
:1. Introduction
2. Labyrinth Seal and Experiment
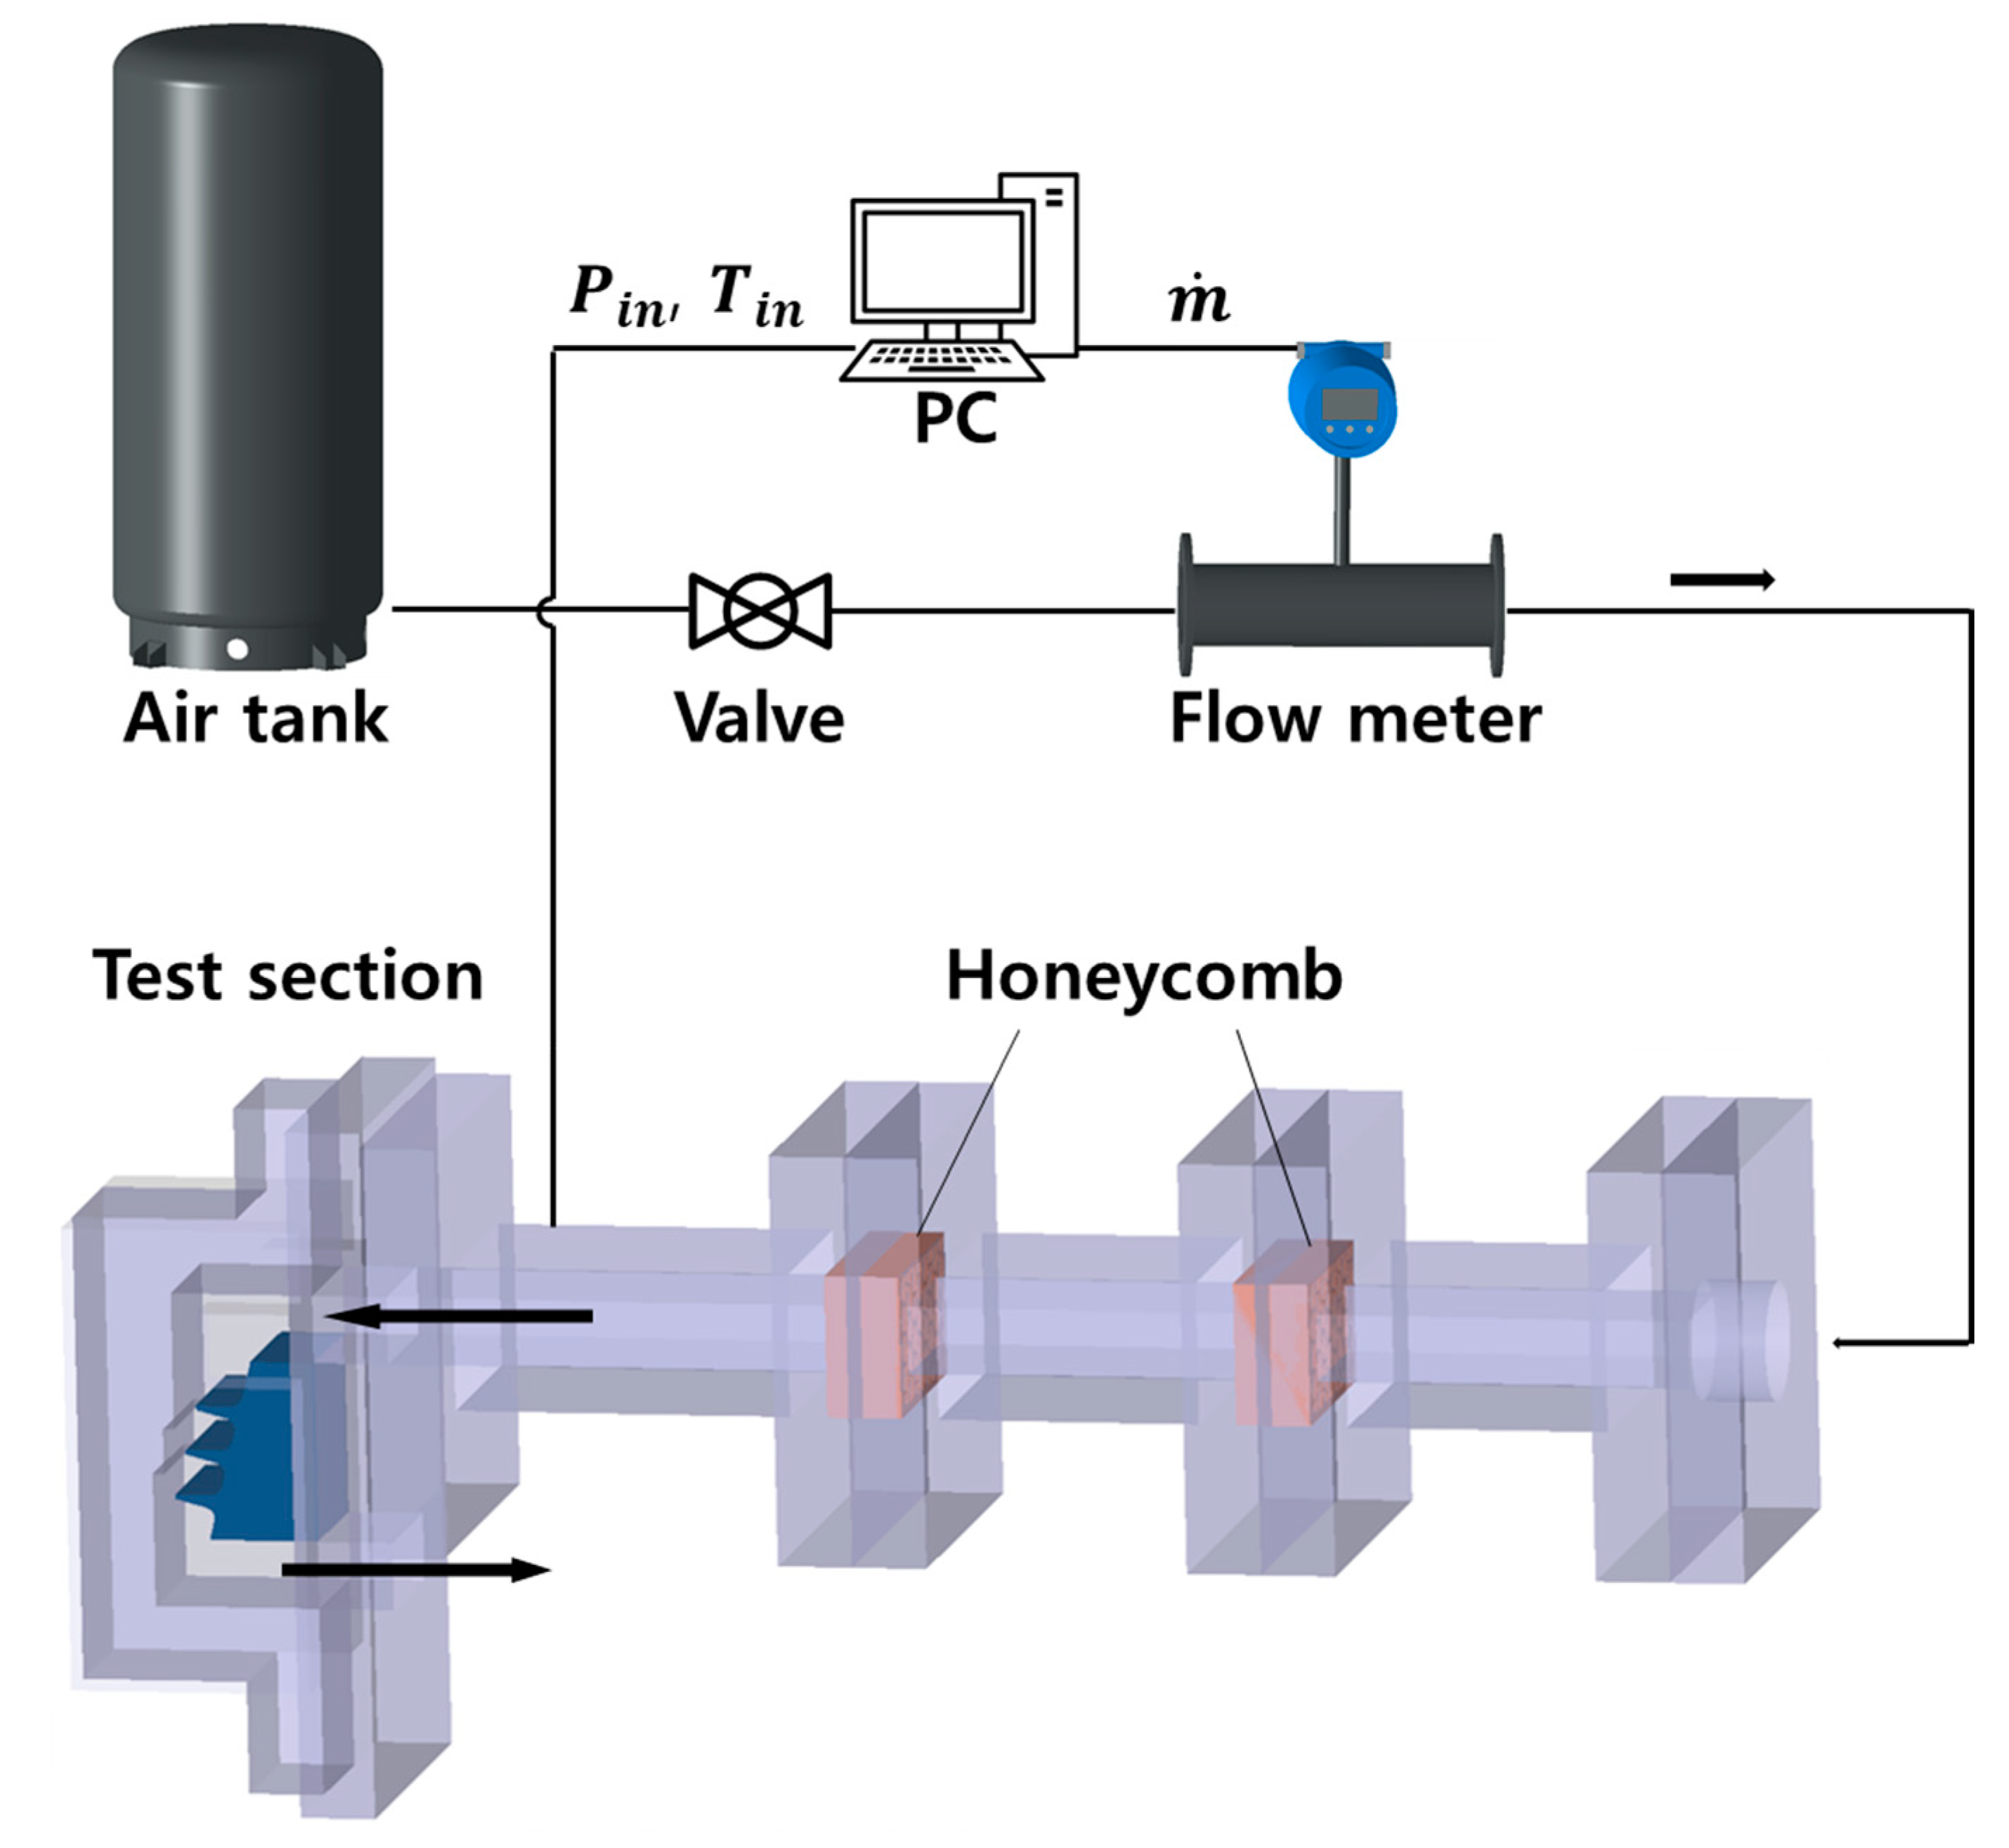
2.1. Test Rig
2.2. Seal Performance
2.3. Measurement Uncertainty
3. Analysis
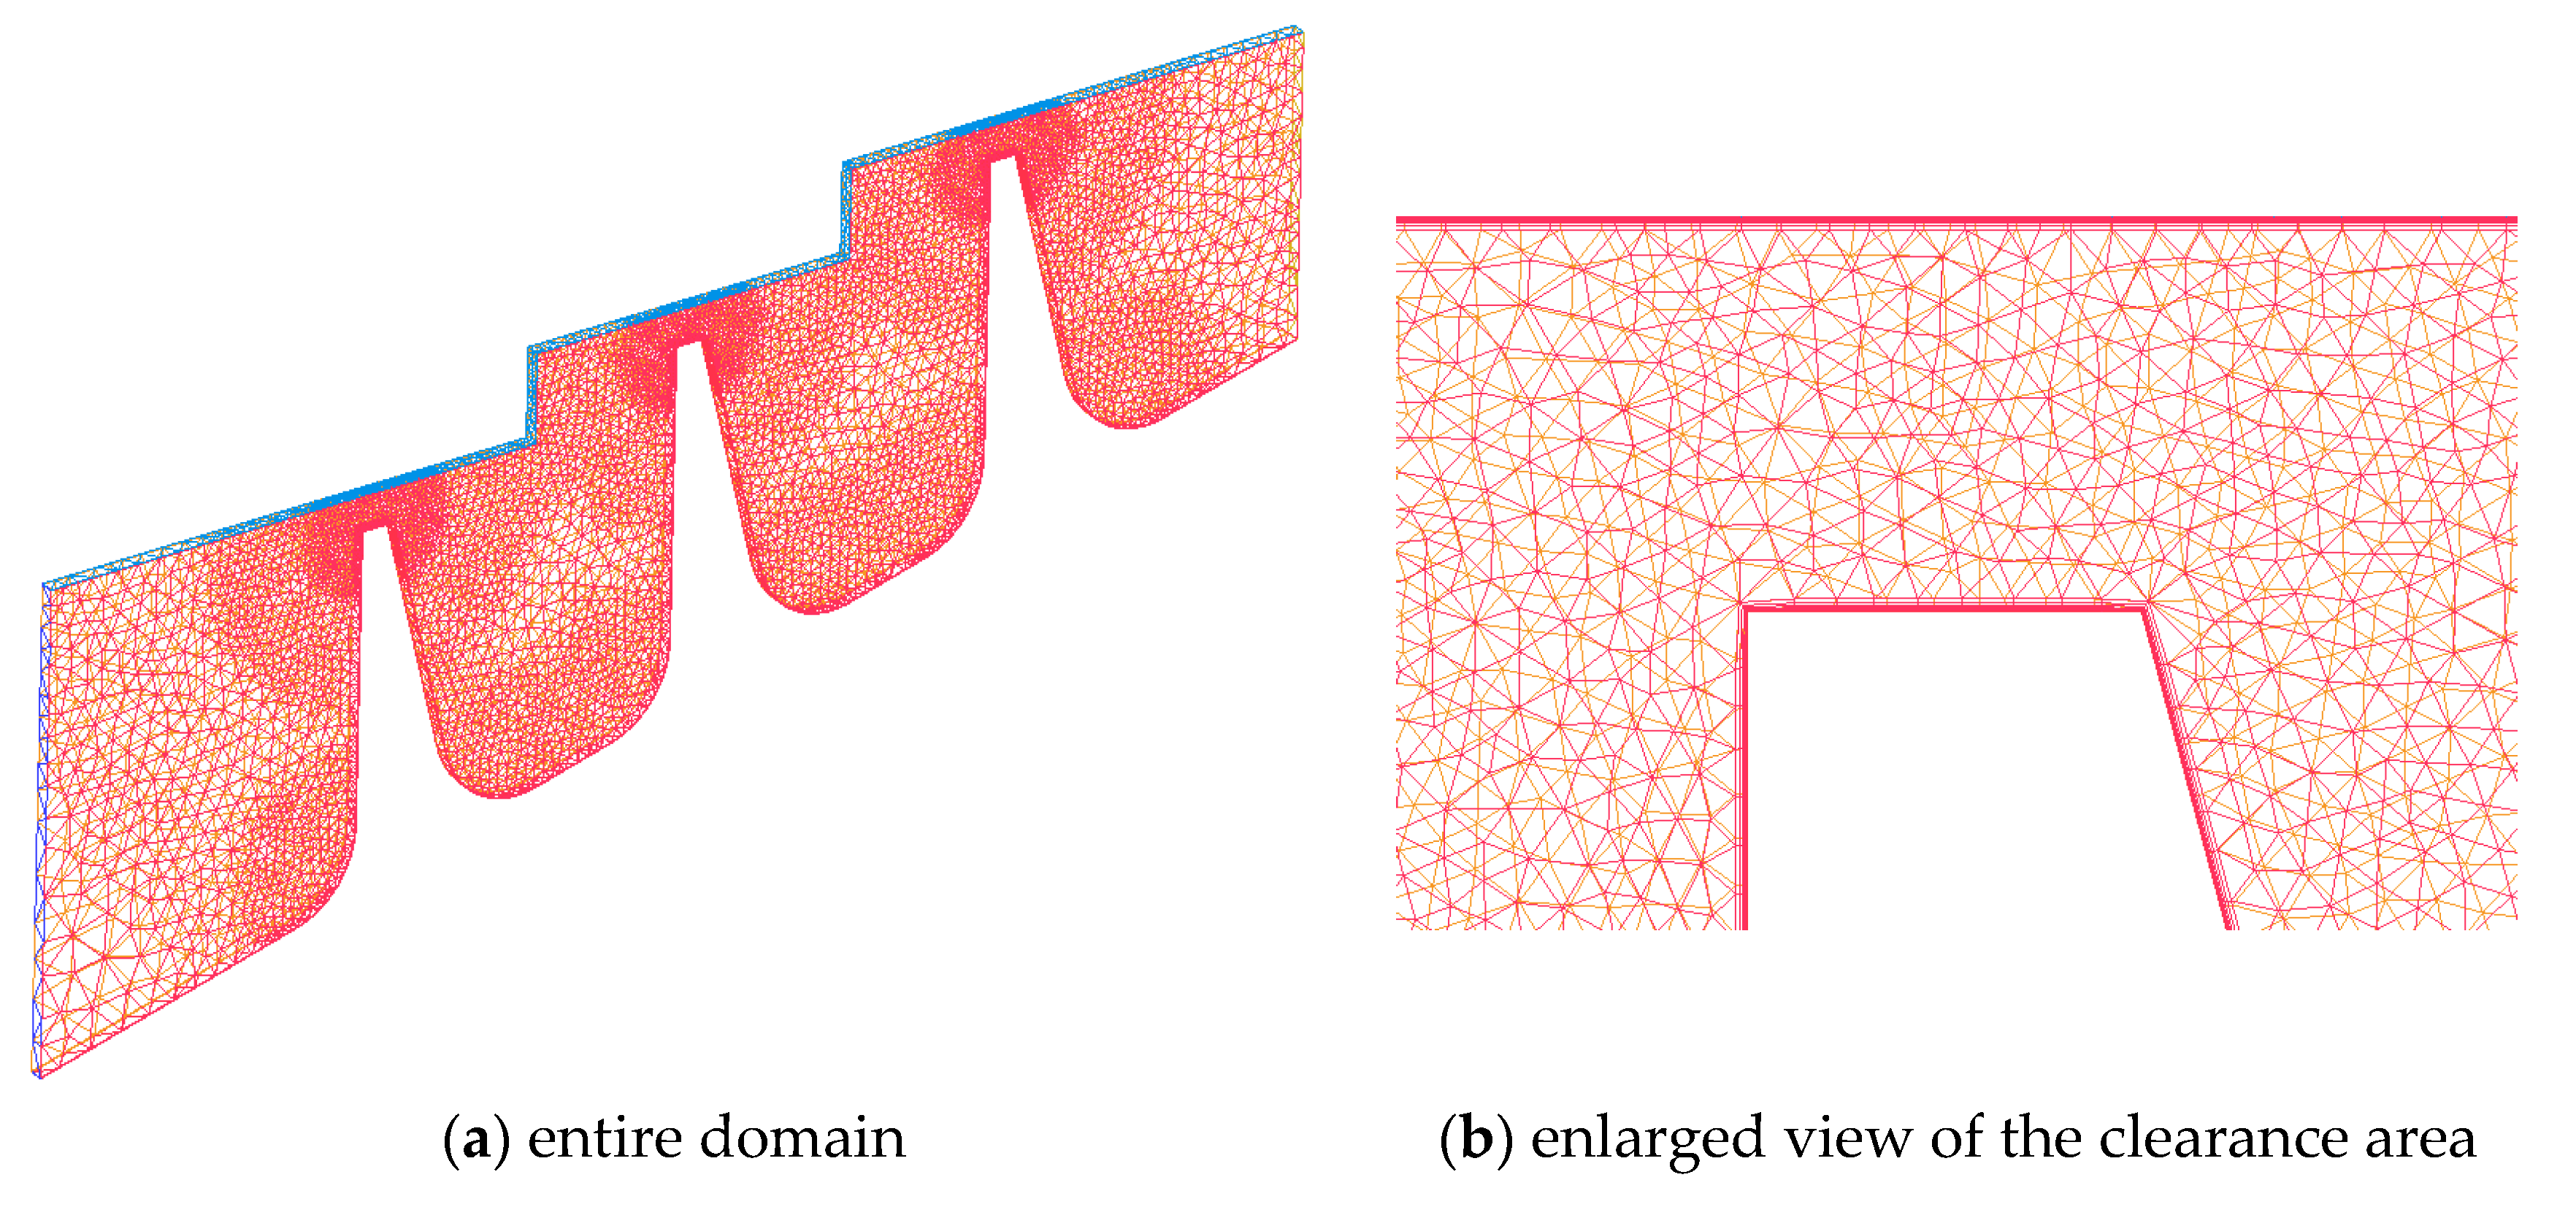
3.1. Numerical Approach
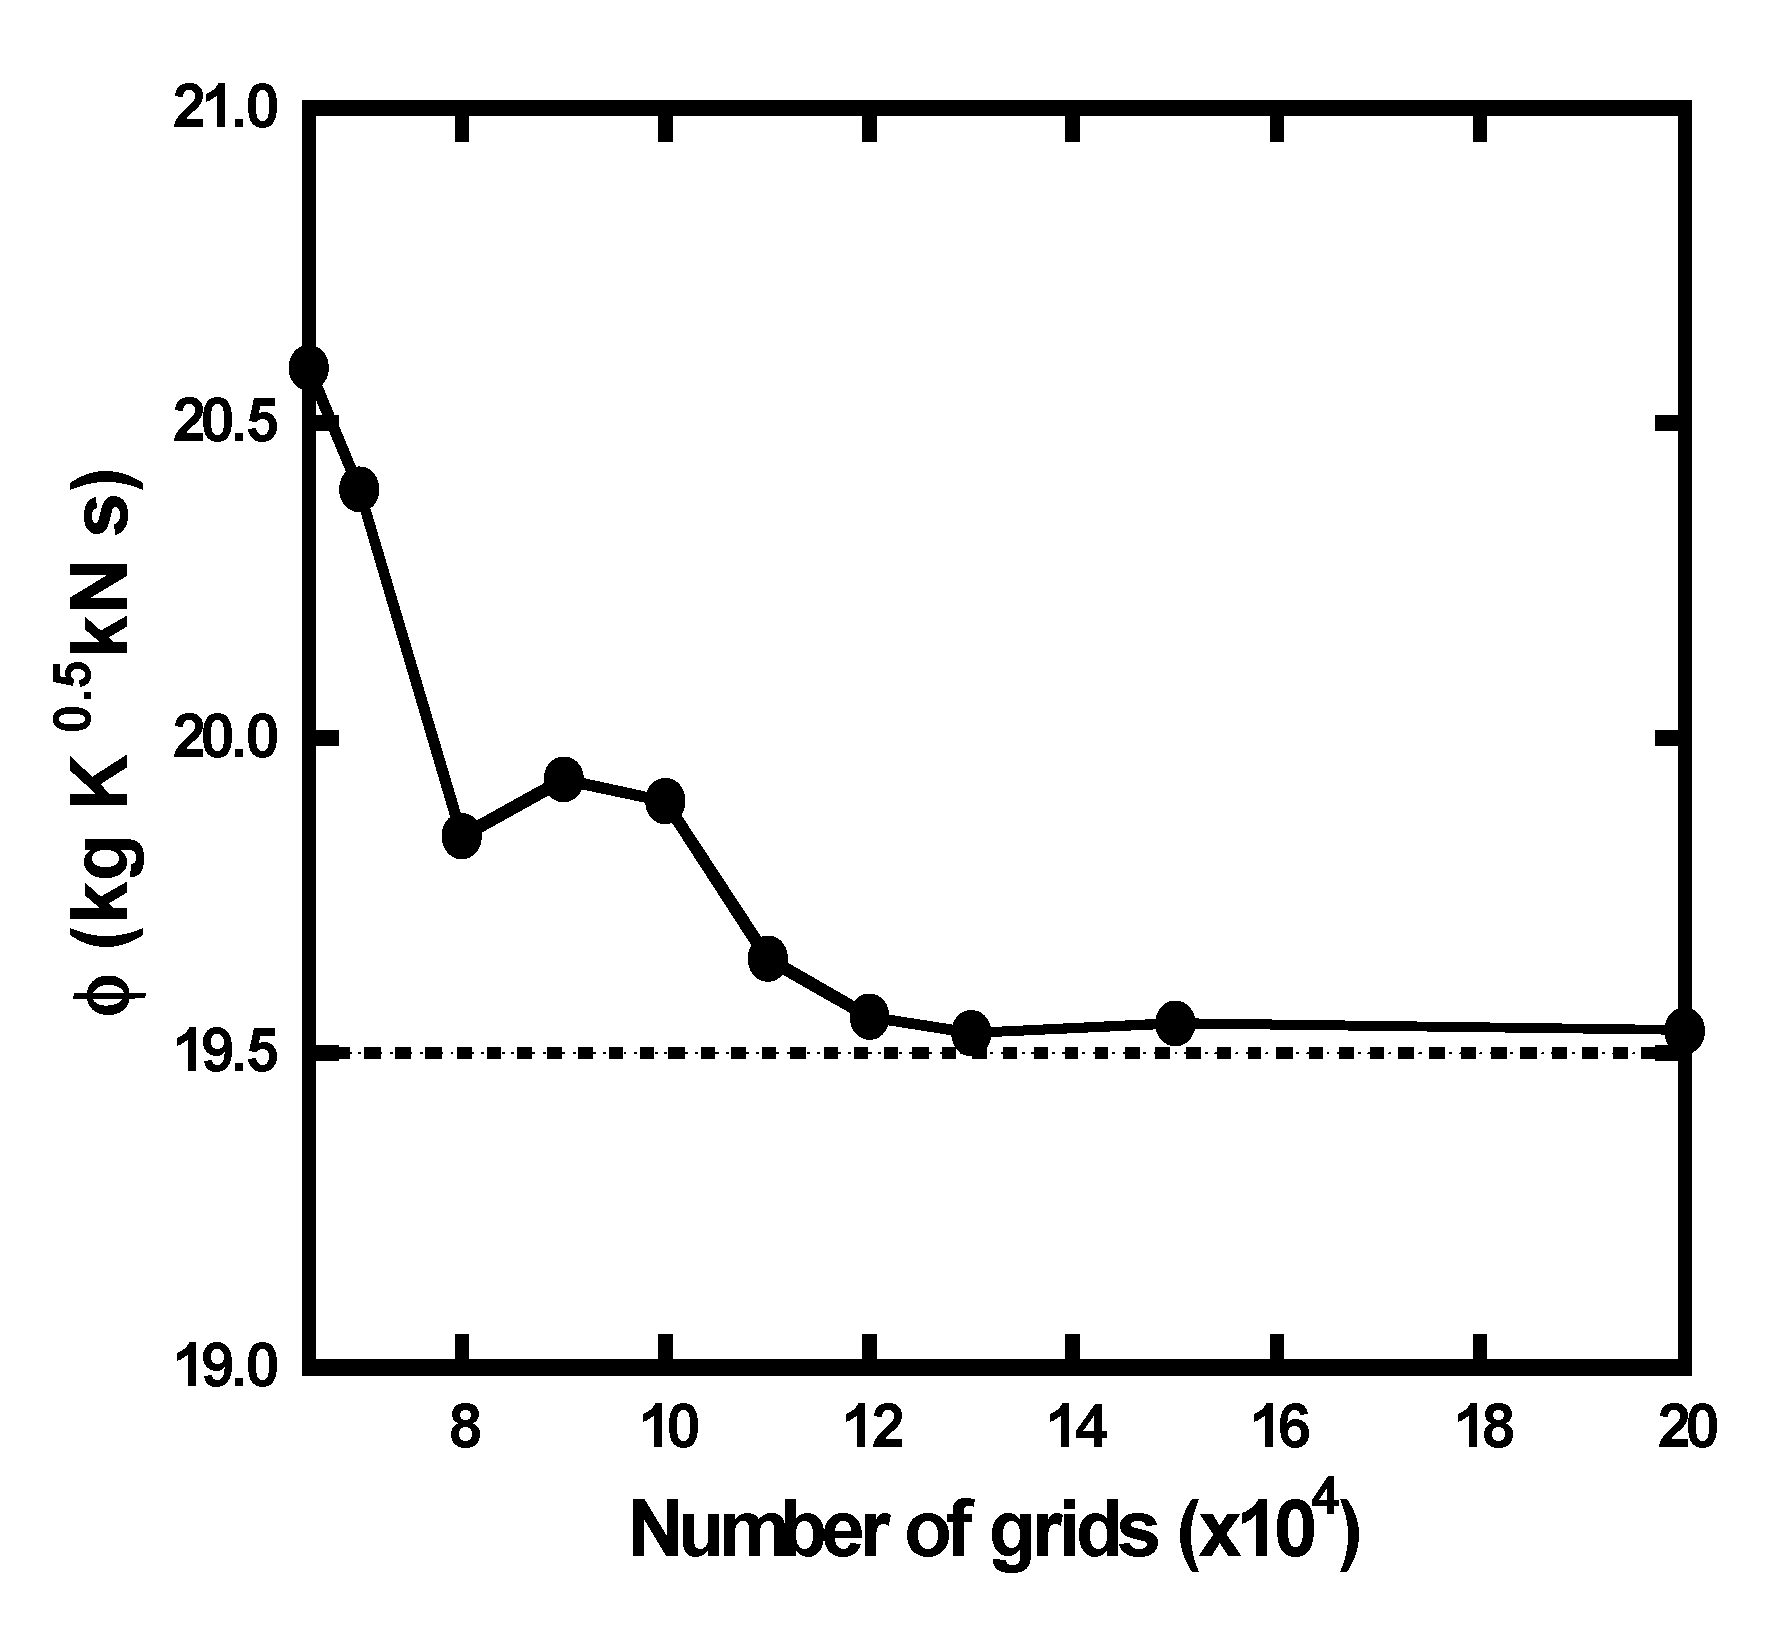
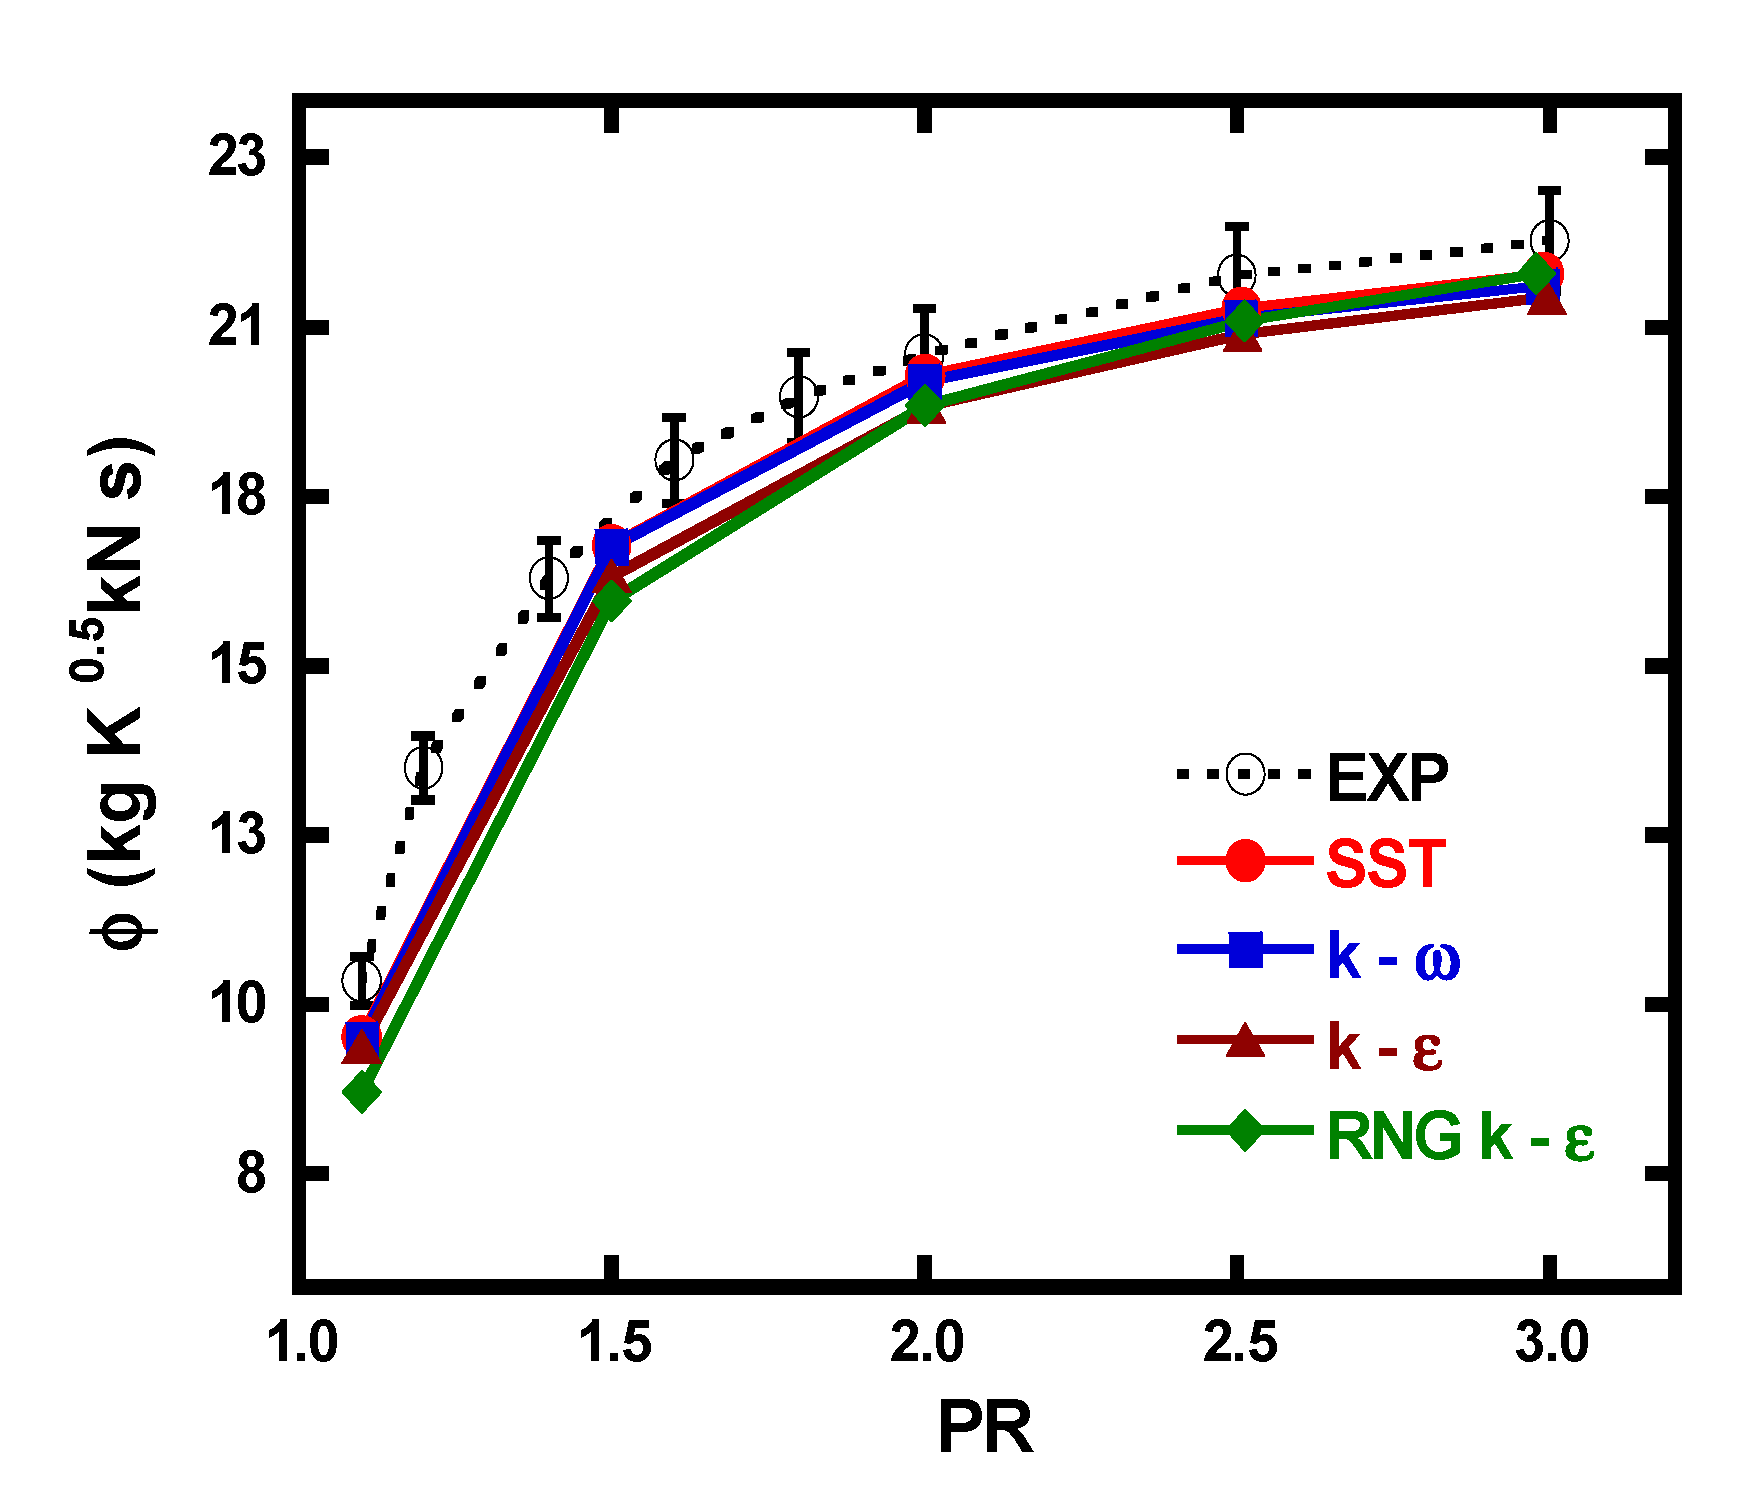
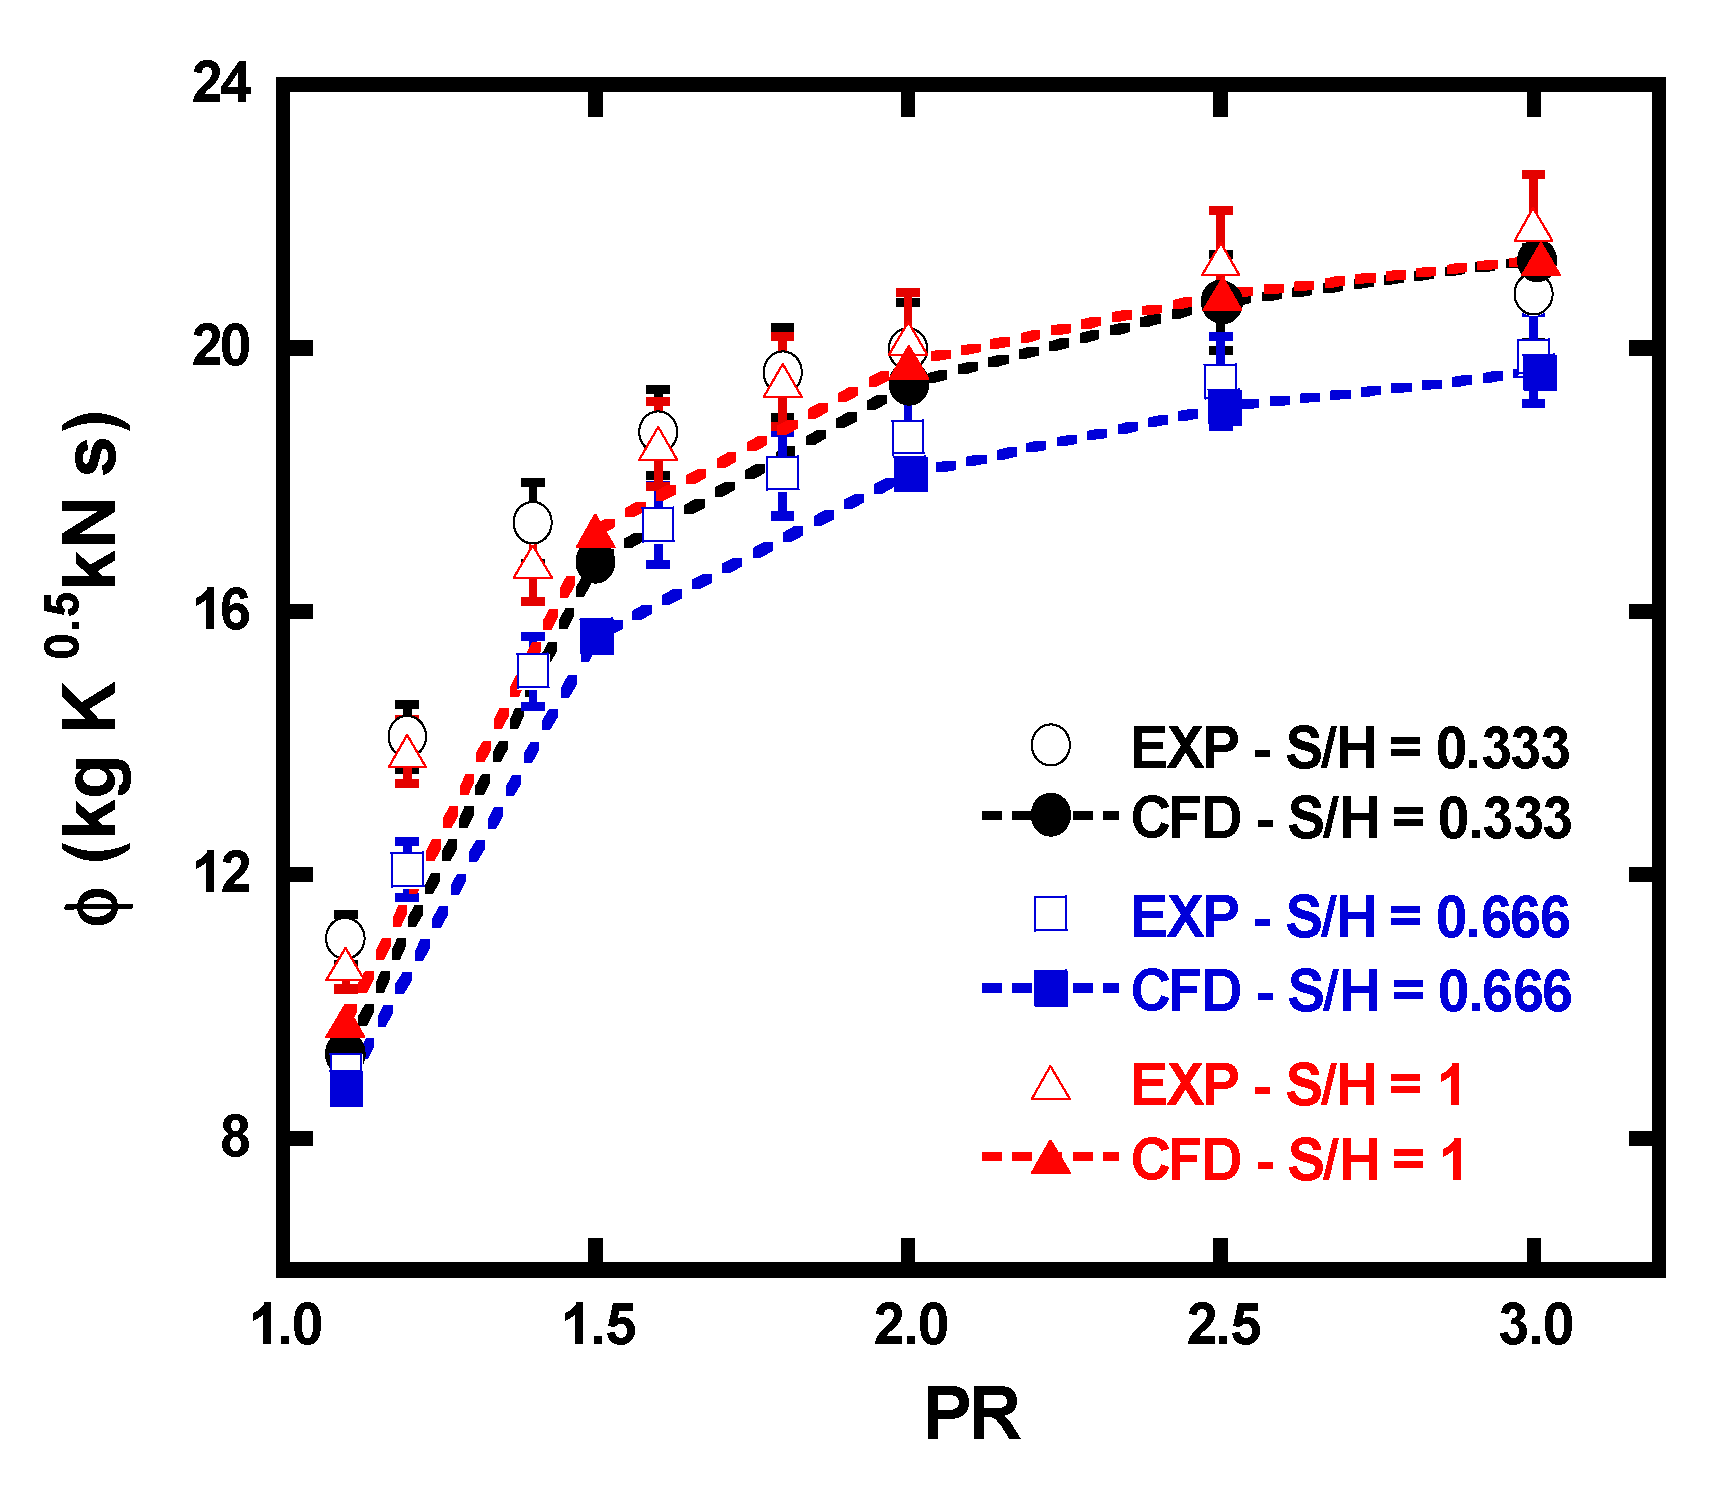
3.2. Boundary Conditions and Validation
4. Results and Discussion
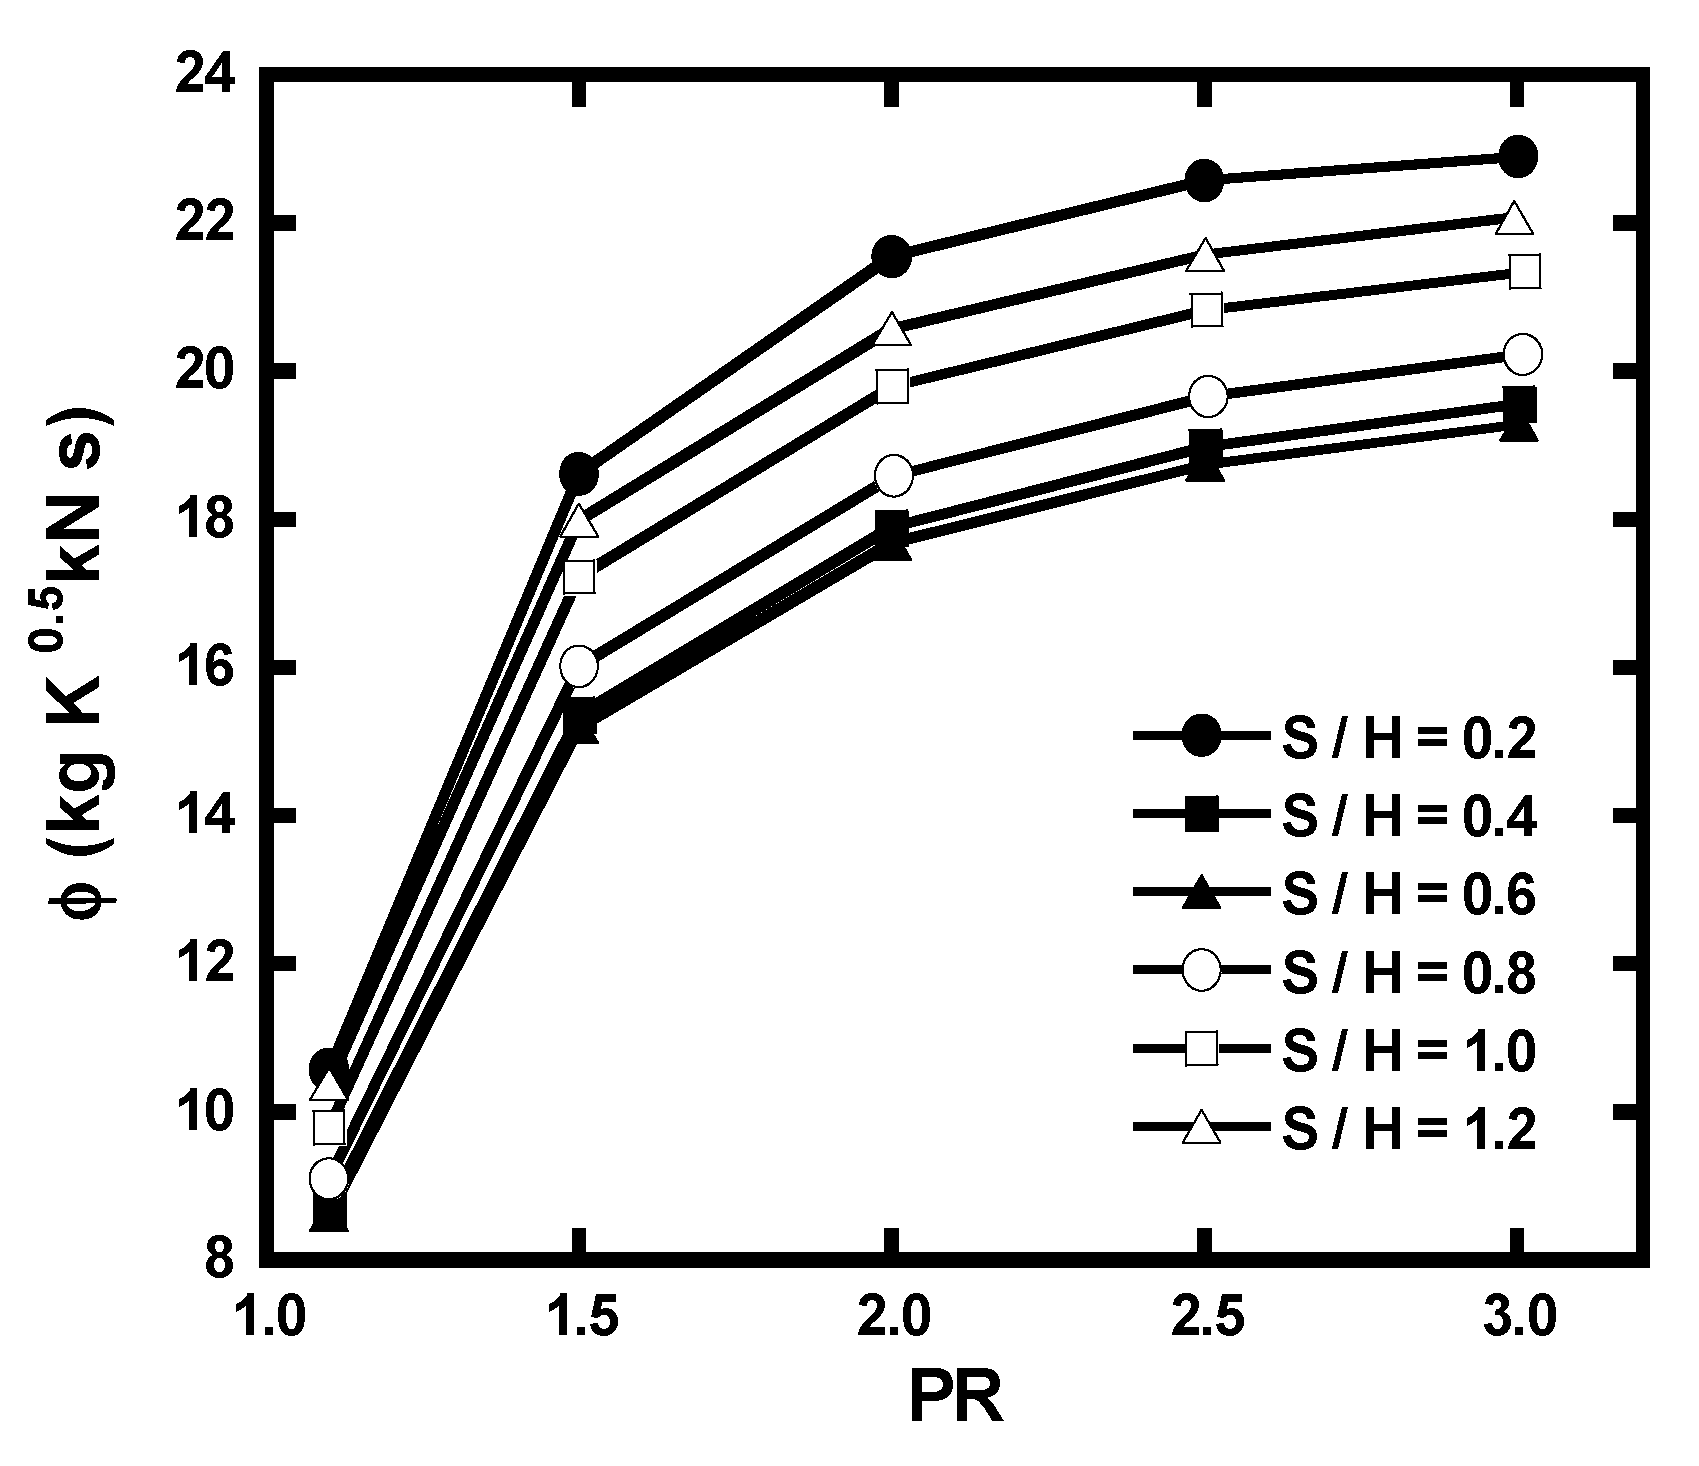
4.1. Leakage Characteristics According to Clearance Size
4.2. Parametric Study on the Impact of Cavity Size
4.2.1. Outline
4.2.2. Tooth Height
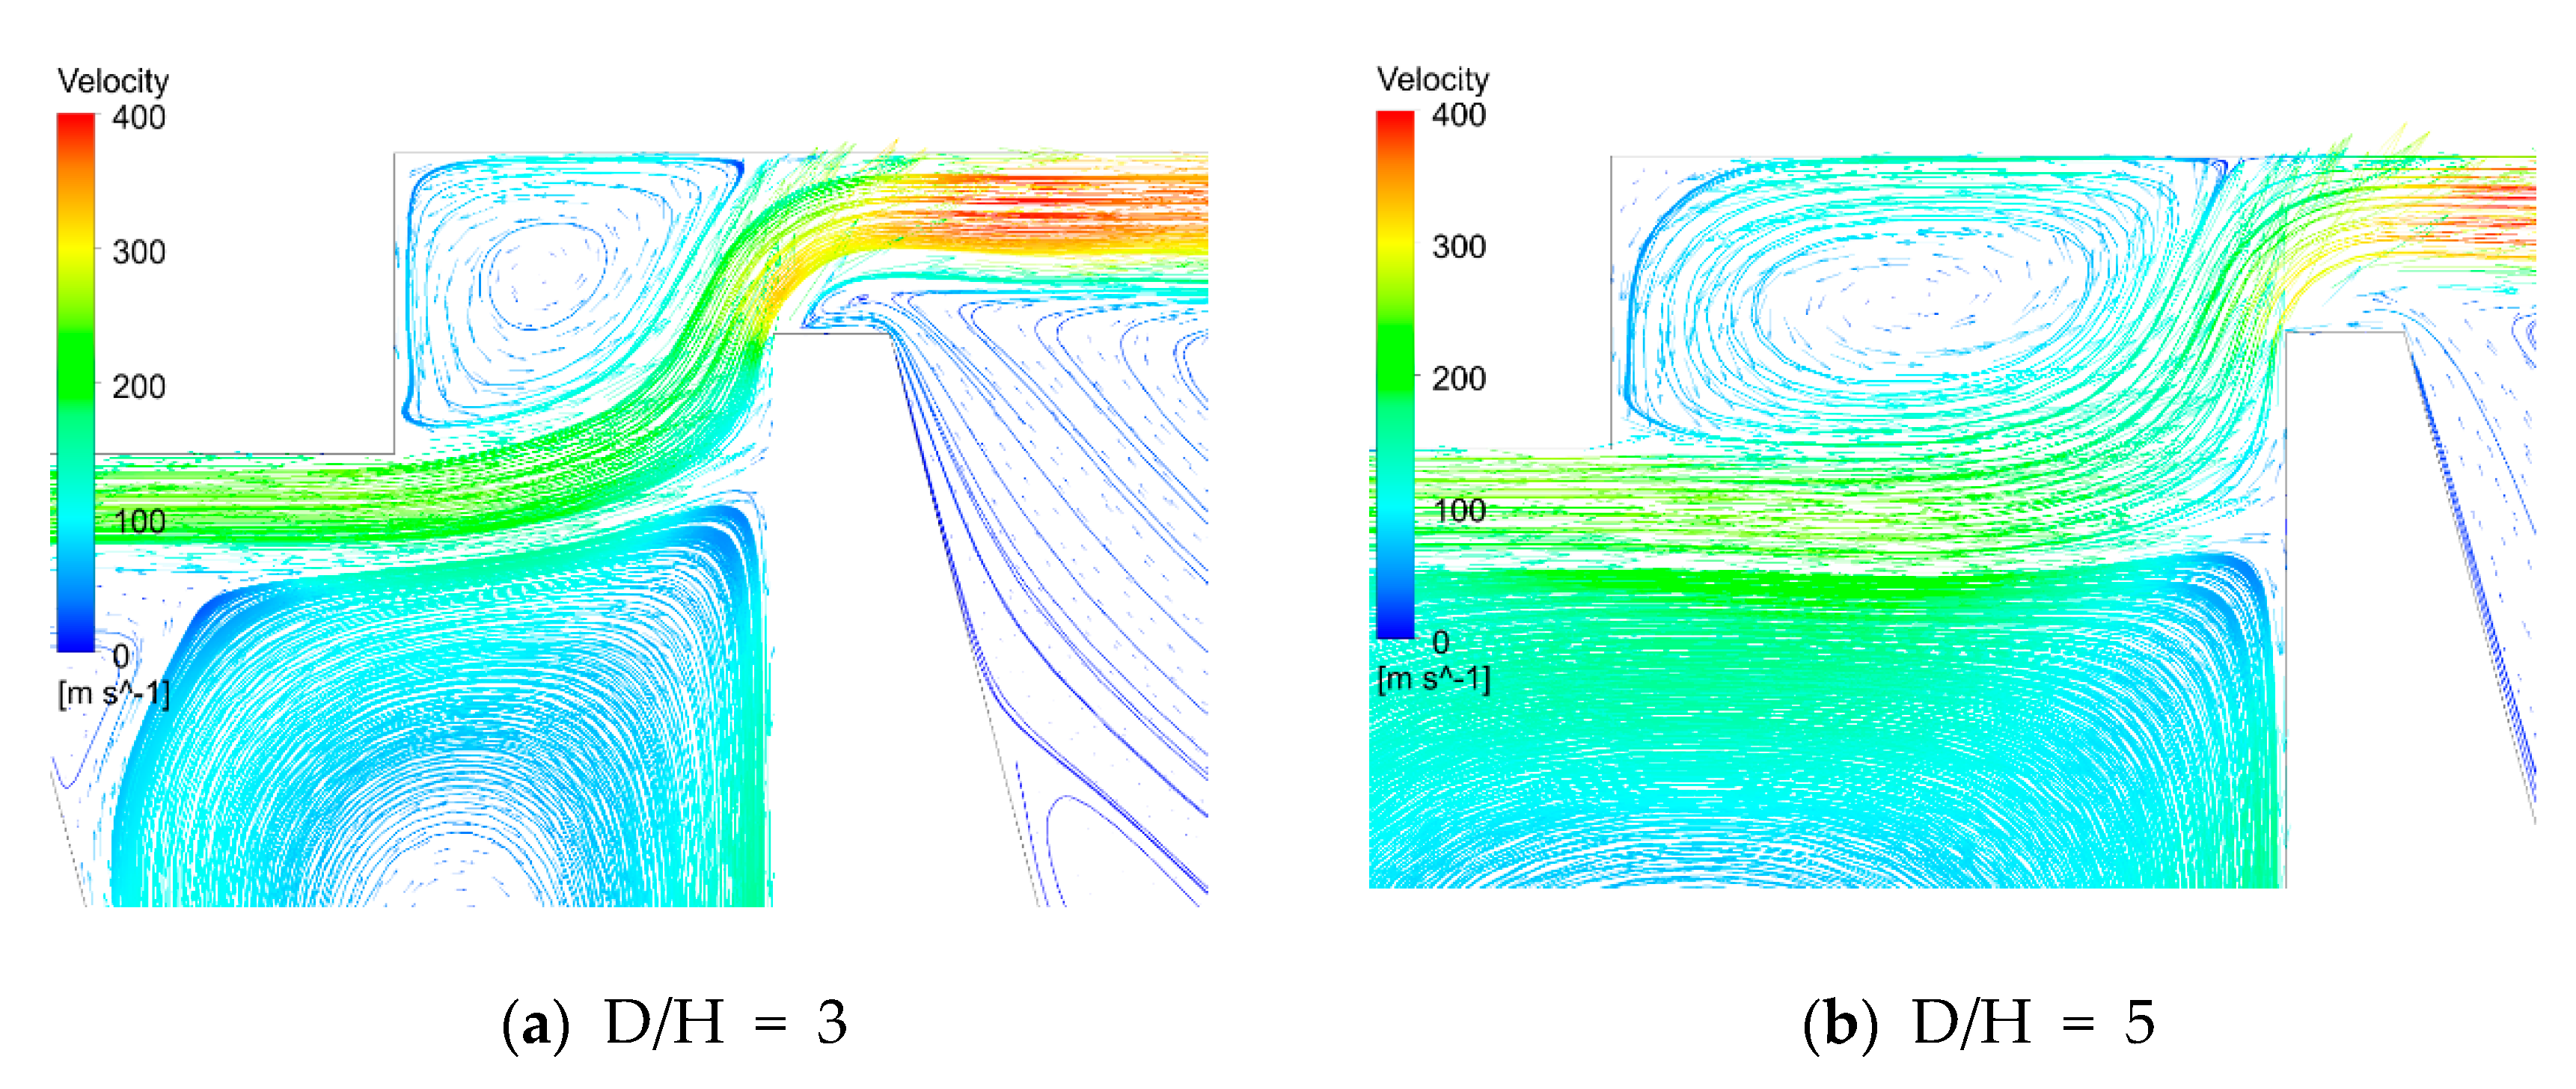
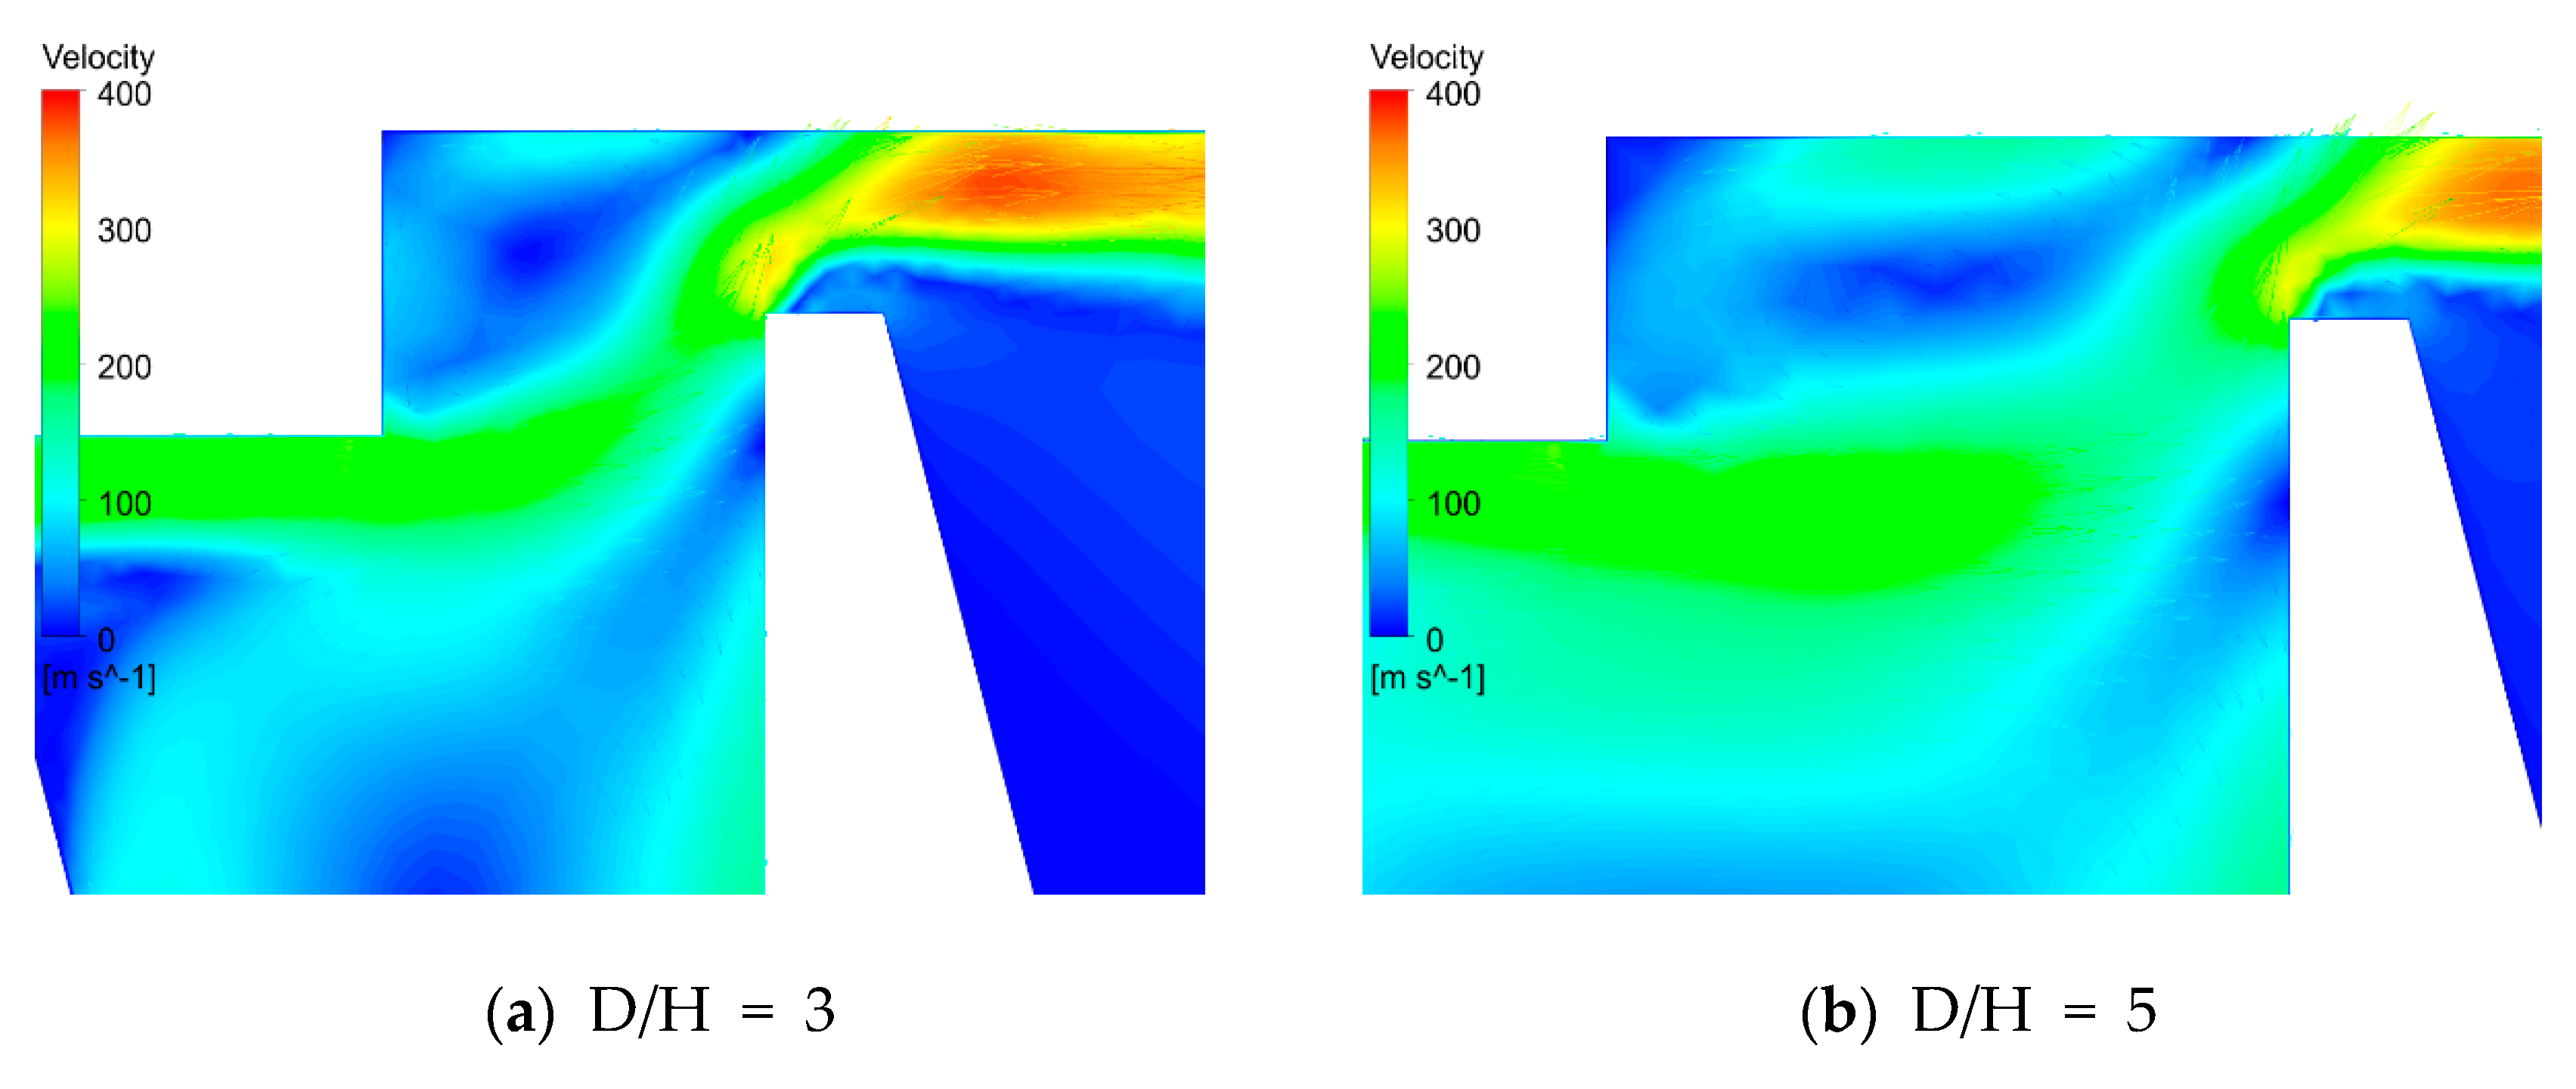
4.2.3. Pitch
4.2.4. Summary of the Parametric Study
5. Conclusions
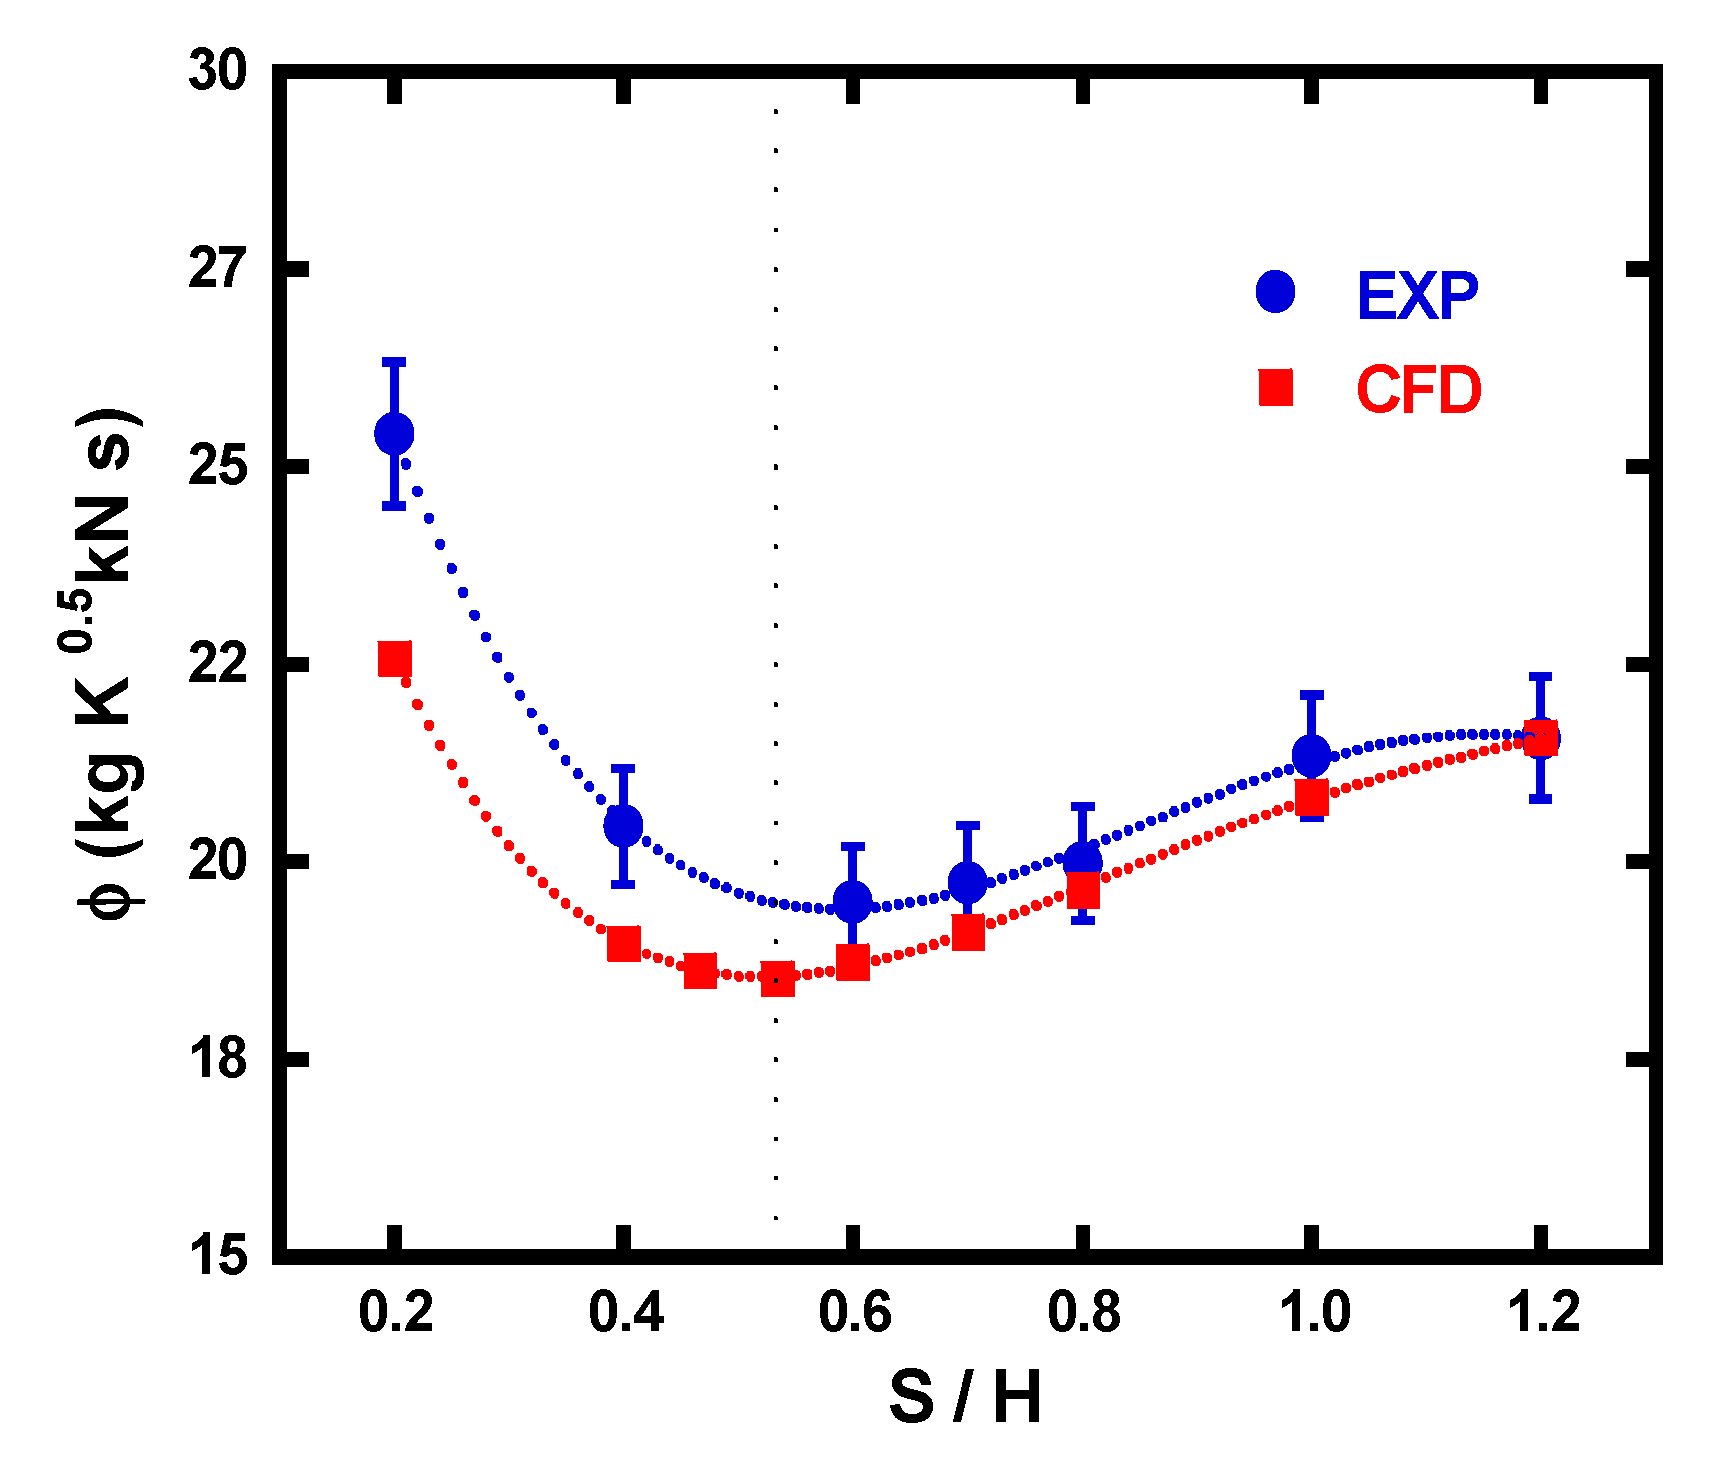
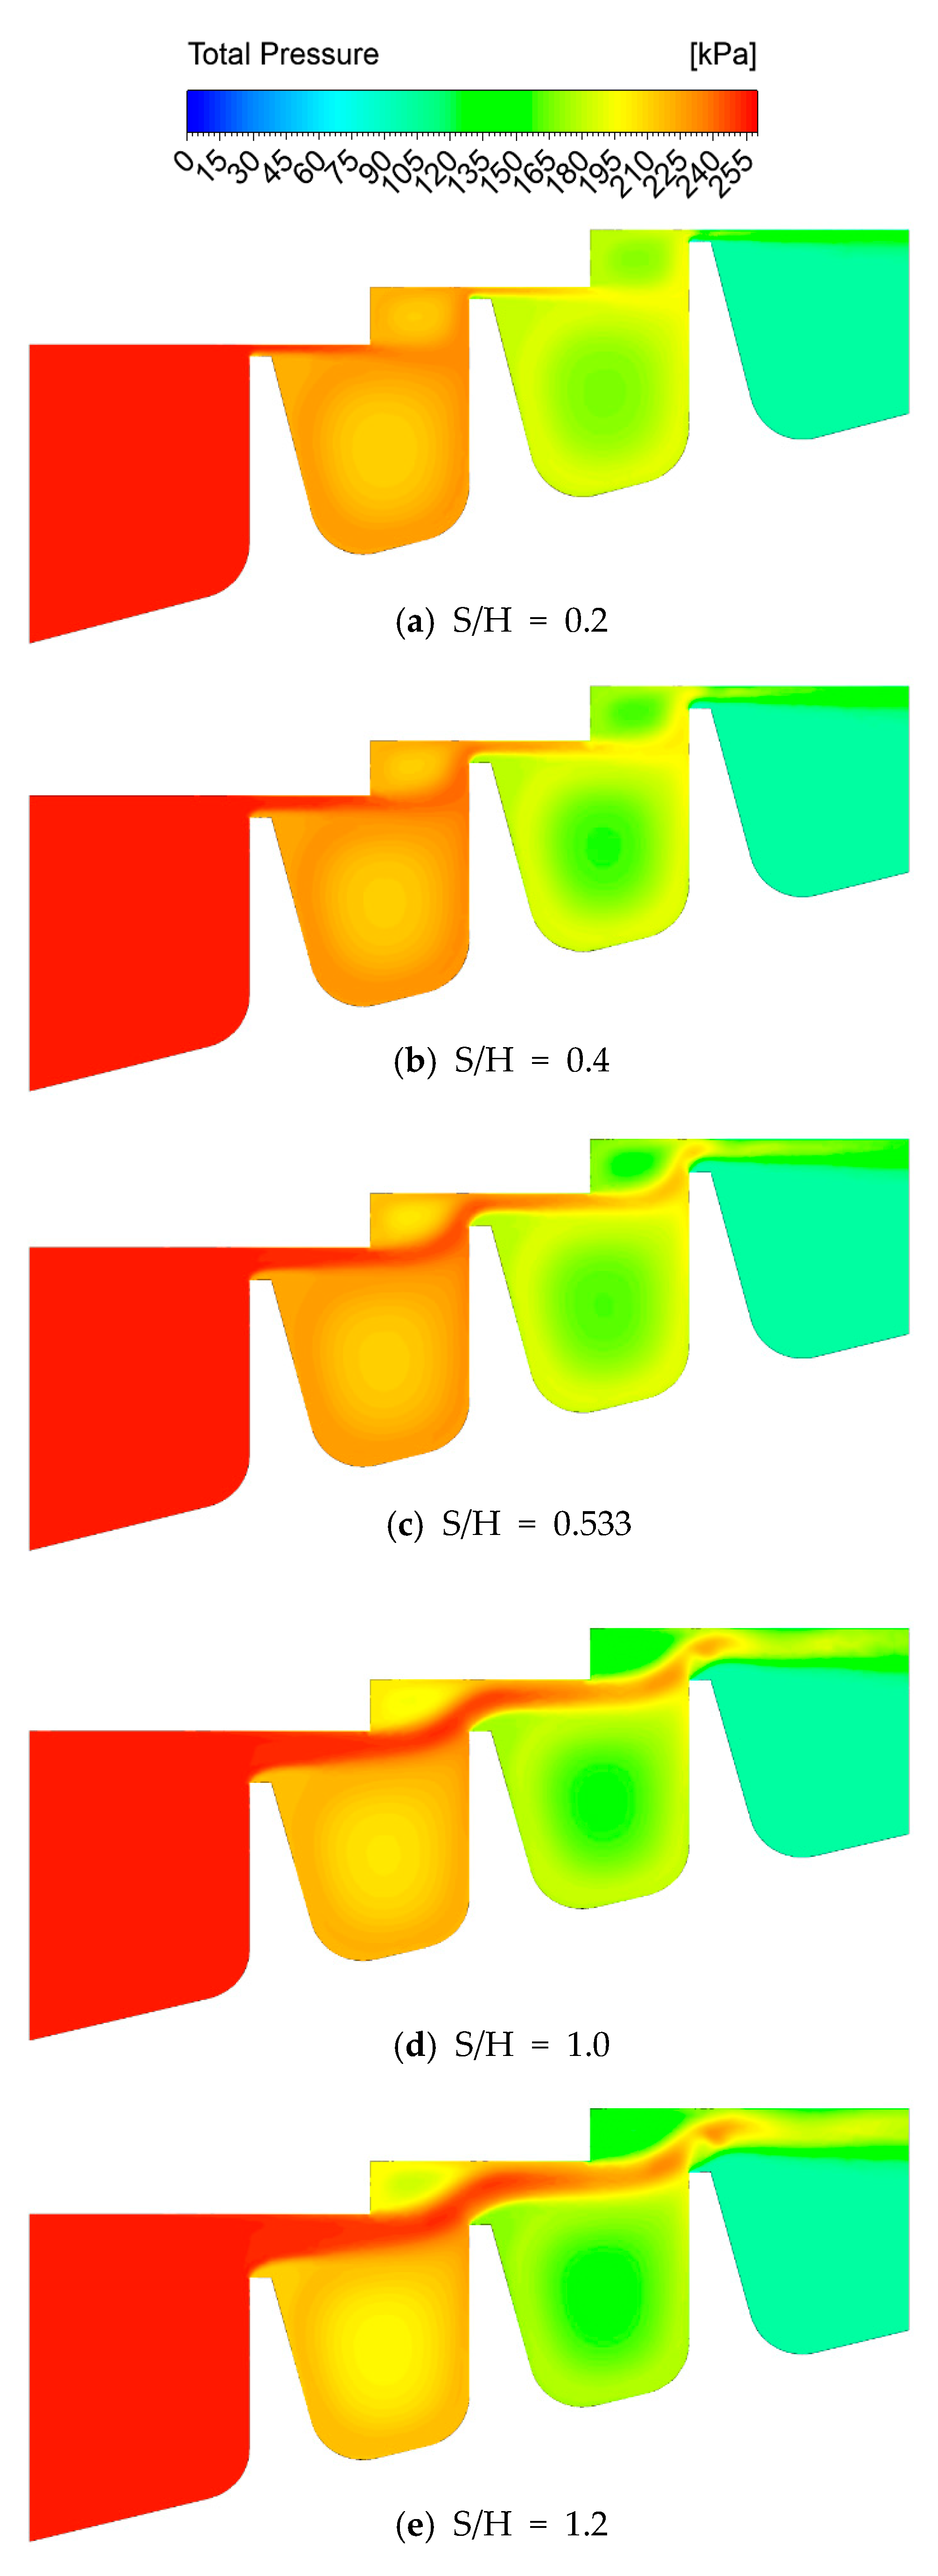
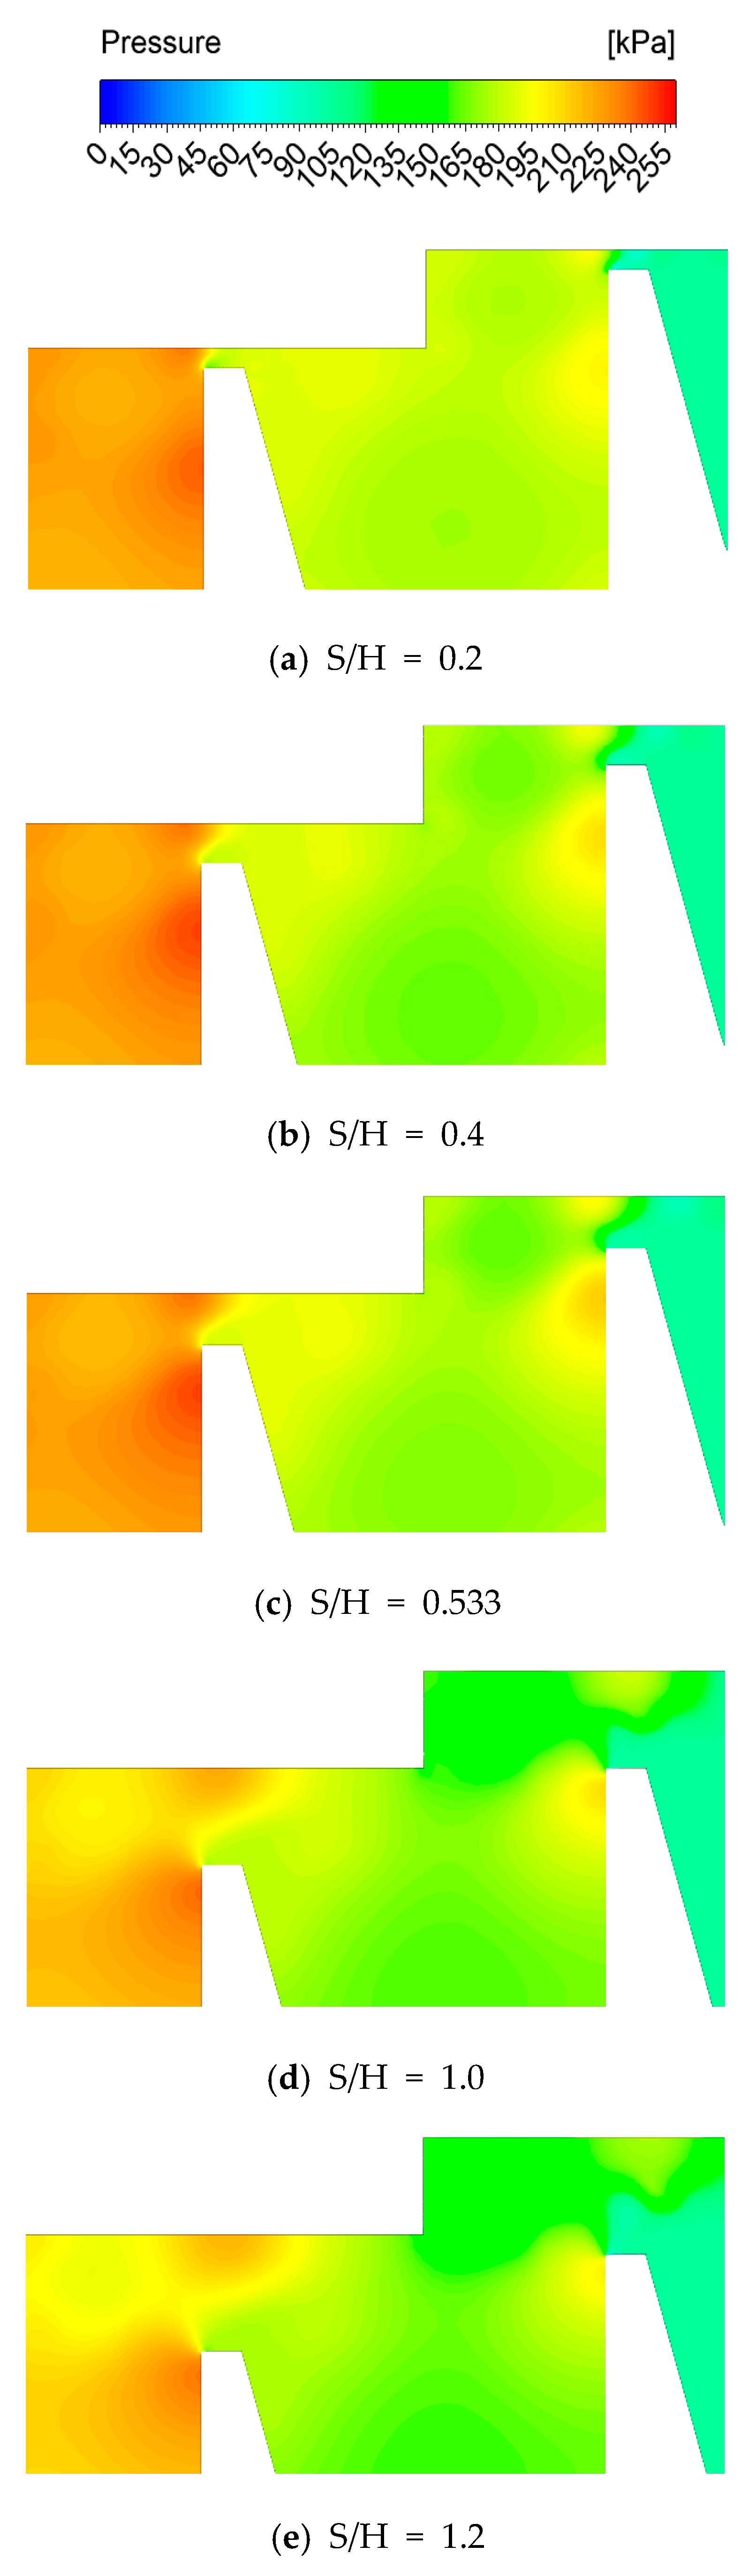
- As the clearance size increases, the flow function of the seal decreases initially, but it tends to increase at a certain clearance size. In other words, the stepped labyrinth seal has a clearance size that minimizes the flow function and this specific clearance size is approximately half the step height (S/H = 0.533). This change in the tendency of the flow function was examined through flow analysis. The analysis results showed that the leakage characteristics of the stepped labyrinth seal are affected by the value of S/H relative to the cavity size.
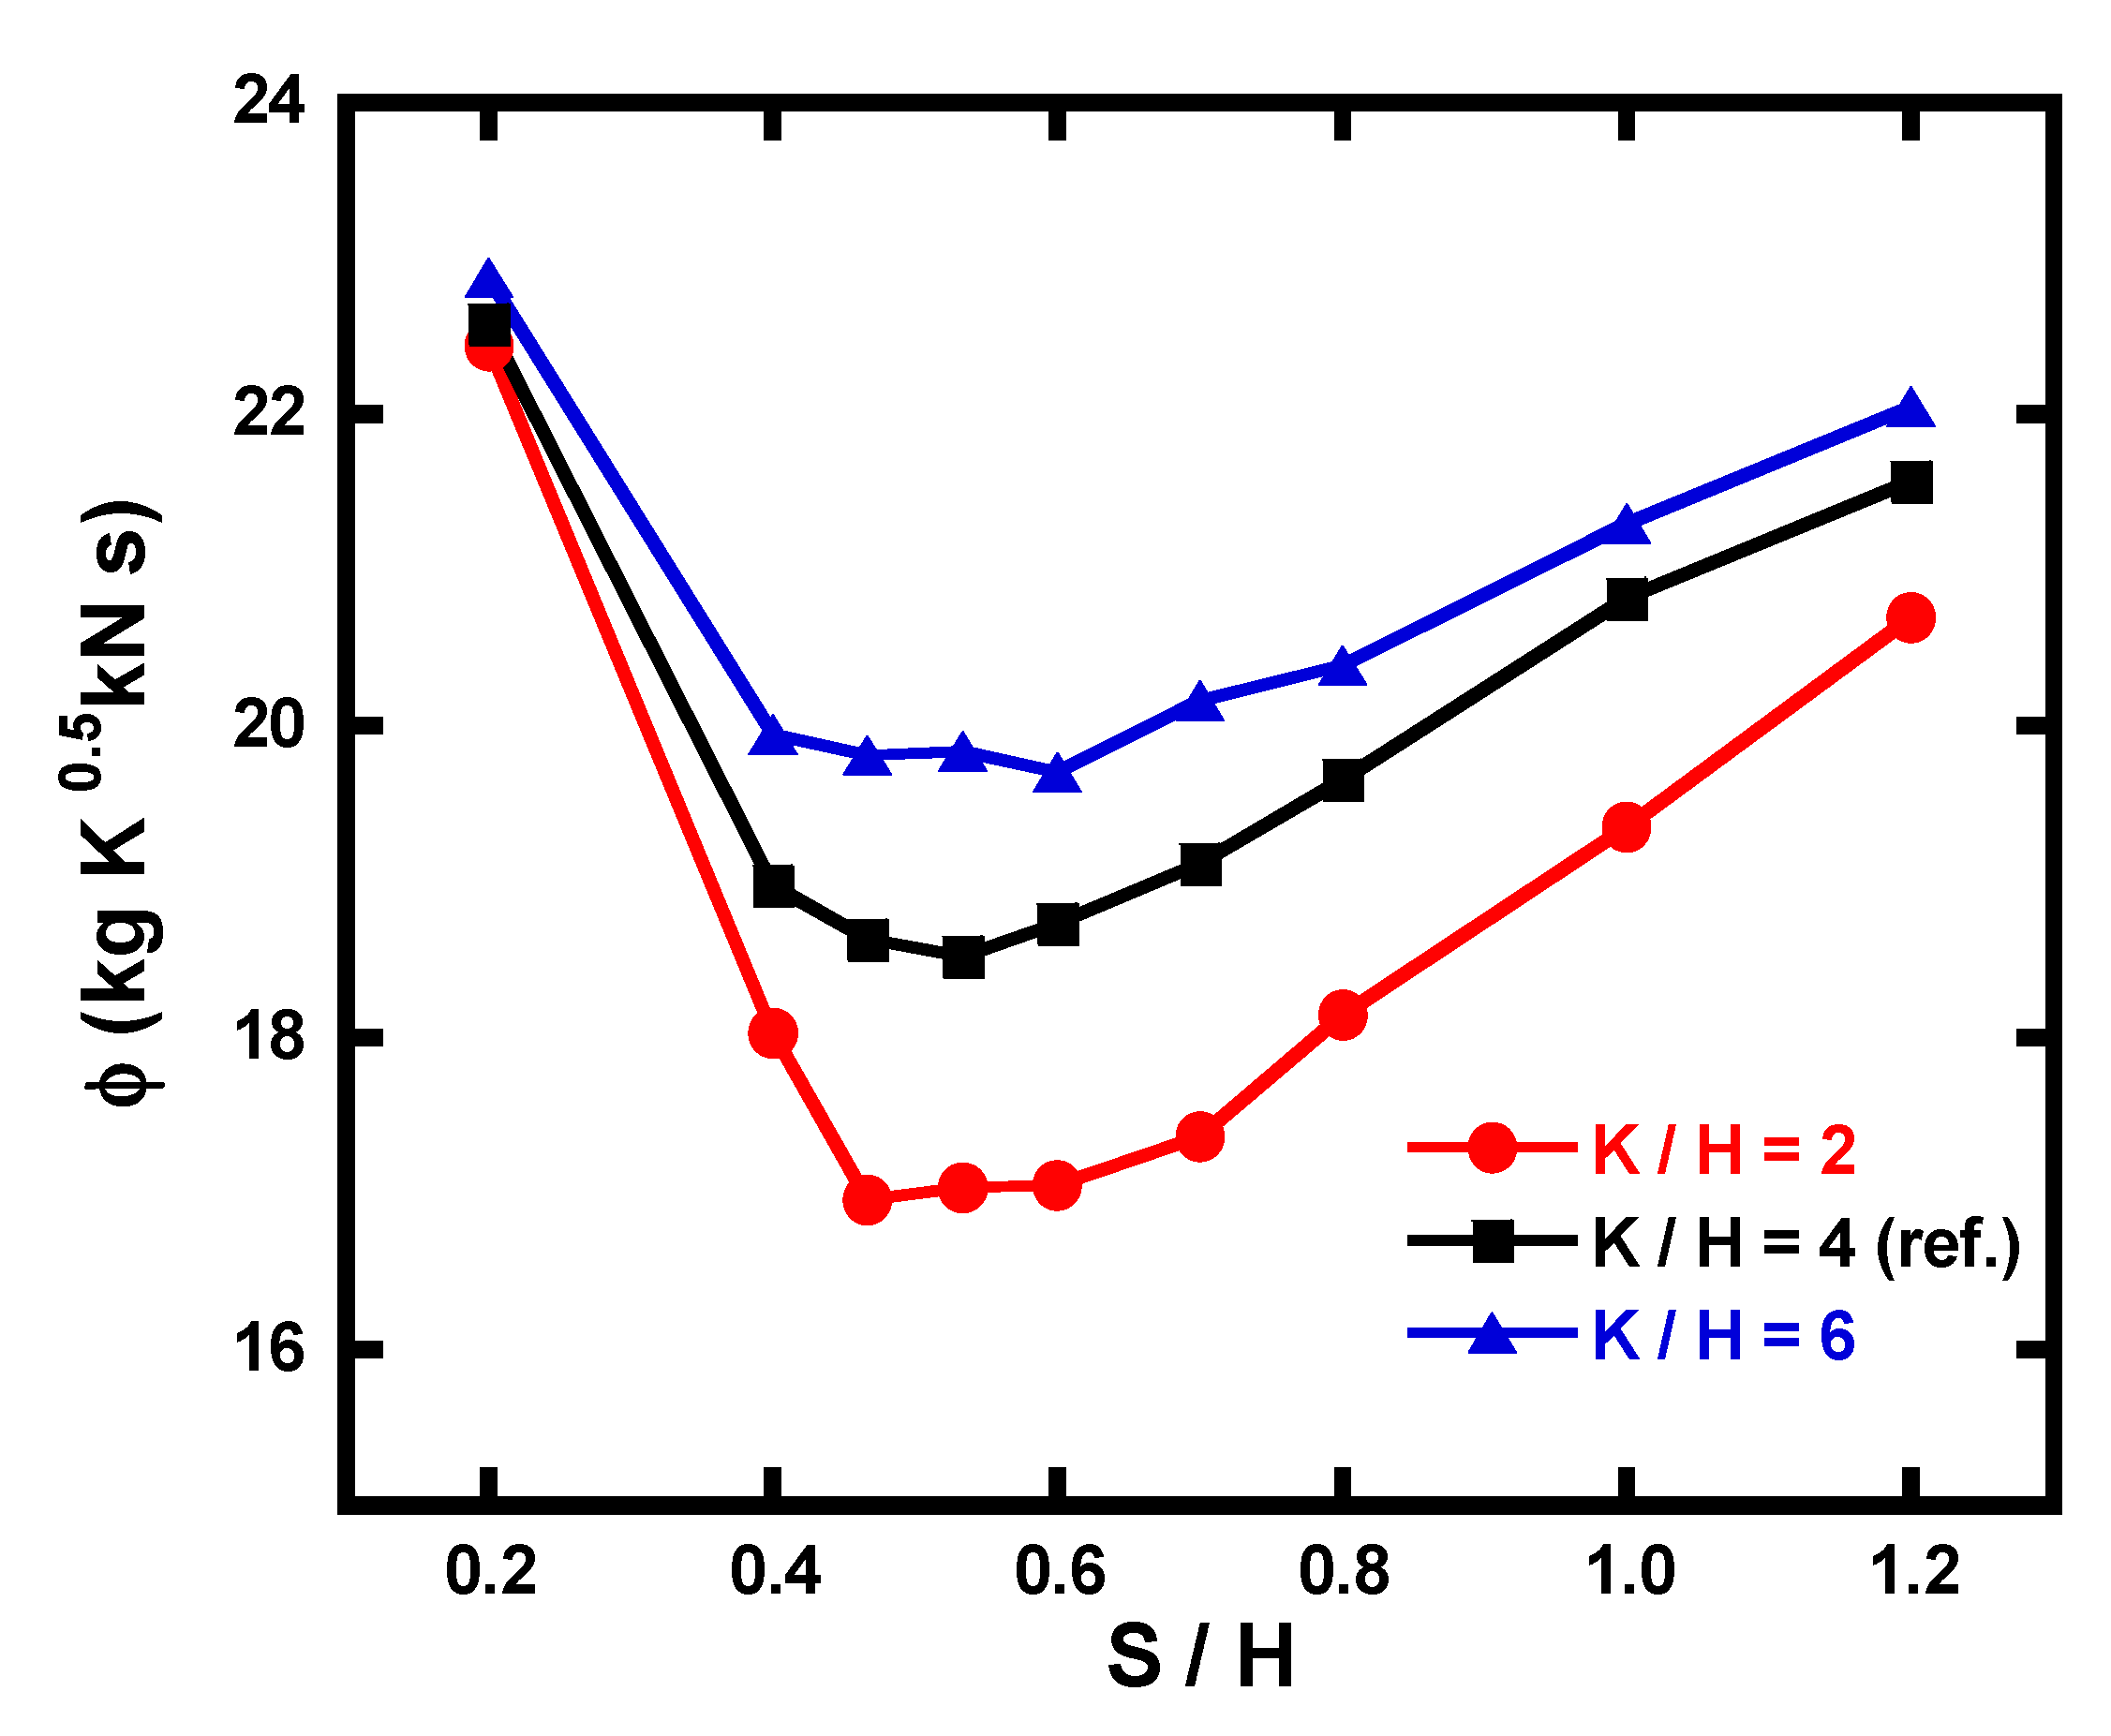
- The flow function of the stepped labyrinth seal is affected by the tooth height and pitch, and the leakage reduction effect increases as both these geometric parameters decrease (the minimum value of the flow function is 8.4% lower at K/H = 2 in comparison to the reference value at K/H = 4 and 5.4% lower at D/H = 3 in comparison to the reference value at D/H = 4). In addition, as the tooth height and pitch decrease, the changes in flow function due to the increase in clearance increase. When the clearance is considerably small, changes in the tooth height and pitch hardly affect the flow function.
- The most important conclusion obtained in this study is that the stepped labyrinth seal has a specific clearance size (Smin) at which the flow function is minimized. The finding that Smin varies depending on the tooth height and pitch is also important. Another important finding is that Smin decreases as the tooth height increases and the pitch decreases. This study is significant in that it provides basic data required for optimizing the geometry of stepped labyrinth seals to improve their leakage performance through determining the clearance size and geometric parameters that minimize the flow function.
Author Contributions
Funding
Conflicts of Interest
Nomenclature
| Throat area [m2] | |
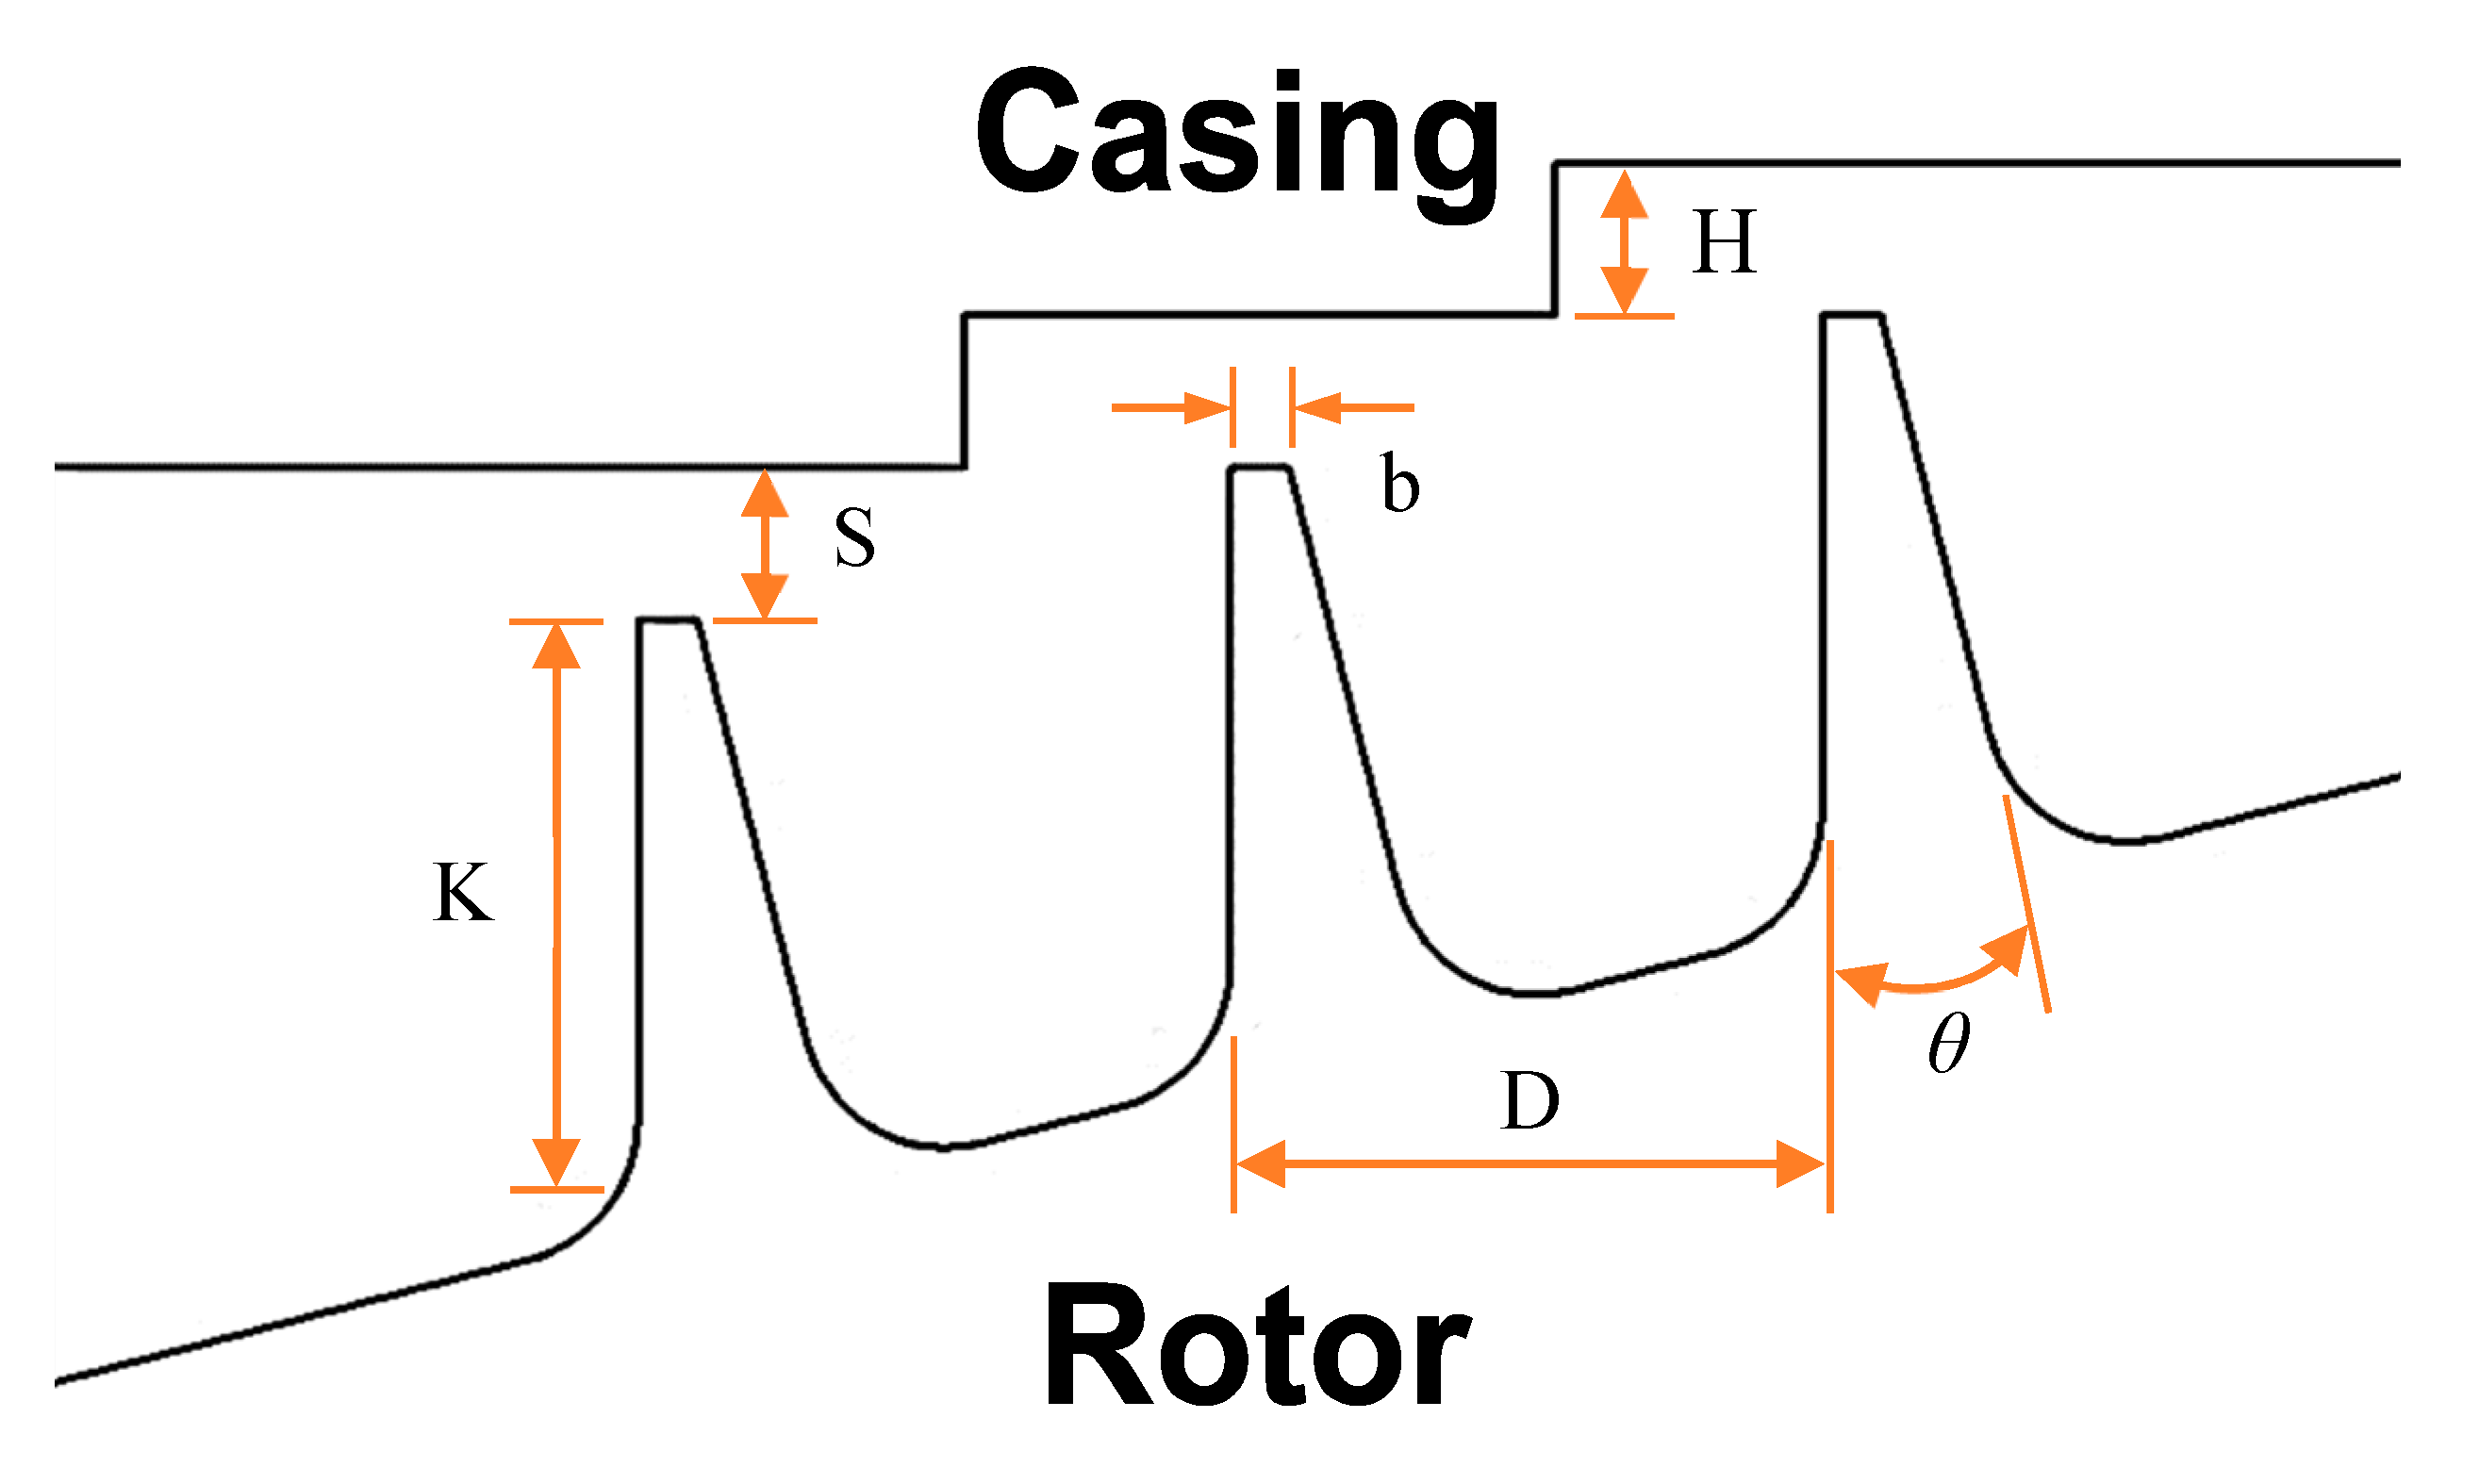
| Tooth width [mm] | |
| Pitch [mm] | |
| Test section width [mm] | |
| Step height [mm] | |
| Tooth height [mm] | |
| Specific heat ratio | |
| Mass flow rate [kg/s] | |
| Number of teeth | |
| Total pressure [kPa] | |
| Static pressure [kPa] | |
| Pressure ratio | |
| Gas constant [kJ/kg · K] | |
| Clearance [mm] | |
| Clearance for a minimal flow function [mm] | |
| Total temperature [K] | |
| Uncertainty | |
| Flow function [kgK0.5/kNs] | |
| Tooth angle [°] | |
| Subscripts | |
| Contraction | |
| Inlet | |
| Minimum | |
| Outlet | |
References
- Lattime, S.B.; Steinetz, B.M. Turbine Clearance Control Systems: Current Practices and Future Directions; TM-2002-211794; NASA: Washington, DC, USA, 2002.
- Vermes, G. A fluid mechanics approach to the labyrinth seal leakage problem. J. Eng. Power 1961, 83, 161–169. [Google Scholar] [CrossRef]
- Stocker, H.L.; Cox, D.M.; Holle, G.F. Aerodynamic Performance of Conventional and Advanced Design Labyrinth Seals with Solid-Smooth, Abradable, and Honeycomb Lands; CR-135307; NASA: Washington, DC, USA, 1977.
- Stocker, H.L. Determining and improving labyrinth seal performance in current and advanced high performance gas turbines. AGARD Conf. Proc. 1978, 237, 13.1–13.22. [Google Scholar]
- Wittig, S.; Dorr, L.; Kim, S. Scaling effects on leakage losses in labyrinth seals. J. Eng. Power 1983, 105, 305–309. [Google Scholar] [CrossRef]
- Wittig, S.; Schelling, U.; Jacobsen, K.; Kim, S. Numerical Predictions and Measurements of Discharge Coefficients in Labyrinth Seals. In Proceedings of the ASME 1987 International Gas Turbine Conference and Exhibition, Anaheim, CA, USA, 31 May–4 June 1987. ASME Paper 87-GT-188. [Google Scholar]
- Waschka, W.; Wittig, S.; Kim, S. Influence of high rotational speeds on the heat transfer and discharge coefficients in labyrinth seals. J. Turbomach. 1992, 114, 462–468. [Google Scholar] [CrossRef]
- Tipton, D.L.; Scott, T.E.; Vogel, R.E. Labyrinth Seal Analysis; ASME: New York, NY, USA, 1986; Volume III: Analytical and experimental development of a design model for labyrinth seals, AFWAL-TR-85-2103. [Google Scholar]
- Chupp, R.E.; Holle, G.; Scott, T.E. Labyrinth Seal Analysis; ASME: New York, NY, USA, 1986; Volume IV: User’s manual for the labyrinth seal design model, AFWAL-TR-85-2103. [Google Scholar]
- Zimmermann, H.; Wolff, K.H. Air System Correlations, Part 1: Labyrinth Seals. In Proceedings of the ASME 1998 International Gas Turbine and Aeroengine Congress and Exhibition, Stockholm, Sweden, 2–5 June 1998. ASME Paper 98-GT-206. [Google Scholar]
- Zimmermann, H.; Kammerer, A.; Wolff, K.H. Performance of Worn Labyrinth Seals. In Proceedings of the ASME 1994 International Gas Turbine and Aeroengine Congress and Exposition, The Hague, The Netherlands, 13–16 June 1994. Paper 94-GT-131. [Google Scholar]
- Rhode, D.L.; Johnson, J.W.; Broussard, D.H. Flow Visualization and Leakage Measurements of Stepped Labyrinth Seal: Part 1—Annular Groove. In Proceedings of the ASME 1996 International Gas Turbine and Aeroengine Congress and Exposition, Birmingham, UK, 10–13 June 1996. ASME Paper 96-GT-136. [Google Scholar]
- Schramm, V.; Willenborg, K.; Kim, S.; Wittig, S. Influence of a honeycomb facing on the flow through a stepped labyrinth seal. J. Eng. Gas Turbines Power 2000, 124, 140–146. [Google Scholar] [CrossRef]
- Schramm, V.; Denecke, J.; Kim, S.; Wittig, S. Shape optimization of a labyrinth seal applying the simulated annealing method. Int. J. Rotating Mach. 2004, 10, 365–371. [Google Scholar] [CrossRef]
- Willenborg, K.; Kim, S.; Wittig, S. Effects of Reynolds Number and Pressure Ratio on Leakage Loss and Heat Transfer in a Stepped Labyrinth Seal. In Proceedings of the ASME Turbo Expo 2001: Power for Land, Sea, and Air, New Orleans, LA, USA, 4–7 June 2001. ASME Paper 2001-GT-0123. [Google Scholar]
- Doğu, Y.; Sertçakan, M.C.; Bahar, A.S.; Pişkin, A.; Arıcan, E.; Kocagül, M. CFD Investigation of Labyrinth Seal Leakage Performance Depending on Mushroom Shaped Tooth Wear. In Proceedings of the ASME Turbo Expo 2015: Power for Land, Sea, and Air, Montreal, QC, Canada, 15–19 June 2015. ASME Paper GT2015-43607. [Google Scholar]
- Yan, X.; Dai, X.; Zhang, K.; Li, J.; He, K. Effect of teeth bending and mushrooming damages on leakage performance of a labyrinth seal. J. Mech. Sci. Technol. 2018, 32, 4697–4709. [Google Scholar] [CrossRef]
- Yan, X.; Dai, X.; Zhang, K.; Li, J.; He, K. Influence of Hole-Pattern Stator on Leakage Performance of Labyrinth Seals. In Proceedings of the ASME Turbo Expo 2018: Power for Land, Sea, and Air, Oslo, Norway, 11–15 June 2018. ASME Paper GT2018-75349. [Google Scholar]
- Kim, T.S.; Kang, Y.; Moon, H.K. Aerodynamic performance of double-sided labyrinth seals. In Fluid Machinery and Fluid Mechanics; Springer: Berlin/Heidelberg, Germany, 2009; pp. 377–382. [Google Scholar]
- Kim, T.S.; Cha, K.S. Comparative analysis of the influence of labyrinth seal configuration on leakage behavior. J. Mech. Sci. Technol. 2009, 23, 2830–2838. [Google Scholar] [CrossRef]
- Kim, T.S.; Kang, S.Y. Investigation of leakage characteristics of straight and stepped labyrinth seals. Int. J. Fluid Mach. Syst. 2010, 3, 253–259. [Google Scholar] [CrossRef]
- Kang, Y.; Kim, T.S.; Kang, S.Y.; Moon, H.K. Aerodynamic Performance of Stepped Labyrinth Seal for Gas Turbine Applications. In Proceedings of the ASME Turbo Expo 2010: Power for Land, Sea, and Air, Glasgow, UK, 14–18 June 2010. ASME Paper GT2010-23256. [Google Scholar]
- Zhang, L.; Zhu, H.R.; Liu, C.L.; Tong, F. Experimental and Numerical Investigation on Leakage Characteristic of Stepped Labyrinth Seal. In Proceedings of the ASME Turbo Expo 2016: Power for Land, Sea, and Air, Seoul, Korea, 13–17 June 2016. Paper GT2016-56743. [Google Scholar]
- Vakili, A.D.; Meganathan, A.J.; Michaud, M.; Radhakrishnan, S. An Experimental and Numerical Study of Labyrinth Seal Flow. In Proceedings of the ASME Turbo Expo 2005: Power for Land, Sea, and Air, Reno, NV, USA, 6–9 June 2005. ASME Paper GT2005-68224. [Google Scholar]
- Braun, E.; Dullenkopf, K.; Bauer, H.J. Optimization of Labyrinth seal Performance Combining Experimental, Numerical and Data Mining Methods. In Proceedings of the ASME Turbo Expo 2012: Power for Land, Sea, and Air, Copenhagen, Denmark, 11–15 June 2012. ASME Paper GT2012-68077. [Google Scholar]
- Kline, S.J. The purposes of uncertainty analysis. J. Fluids Eng. Trans. 1985, 107, 153–160. [Google Scholar] [CrossRef]
- ANSYS Inc. ANSYS CFX 19.0; ANSYS Inc.: Canonsburg, PA, USA, 2018. [Google Scholar]
- ANSYS Inc. ANSYS CFX-Solver Modeling Guide; ANSYS Inc.: Canonsburg, PA, USA, 2011. [Google Scholar]
- Menter, F.R. Two-equation eddy-viscosity turbulence models for engineering applications. AIAA J. 1994, 32, 1598–1605. [Google Scholar] [CrossRef] [Green Version]
- Coughtrie, A.R.; Borman, D.J.; Sleigh, P.A. Effects of turbulence modelling on prediction of flow characteristics in a bench-scale anaerobic gas-lift digester. Bioresour. Technol. 2013, 138, 297–306. [Google Scholar] [CrossRef] [PubMed] [Green Version]


| Parameter | Description | Value |
|---|---|---|
| S/H | Clearance/Step height | 0.2~1.2 |
| D/H | Pitch/Step height | 4 |
| K/H | Tooth height/Step height | 4 |
| θ | Tooth angle | 15° |
| N | Number of teeth | 3 |
| Software | ANSYS CFX 19.0 |
|---|---|
| Turbulence model | Shear Stress Transport (SST) |
| Advection scheme | High resolution |
| Fluid | Air (ideal gas) |
| Pressure ratio | 1.1~3.0 |
| Inlet total temperature | 295 K |
| Outlet static pressure | 101.325 kPa |
| Wall | Adiabatic, no slip |
| Lateral faces | Symmetry |
| Parameter | Description | Value | Variation Range |
|---|---|---|---|
| D/H | Pitch/Step height | 4 | 2~6 |
| K/H | Tooth height/Step height | 4 | 3~5 |
Publisher’s Note: MDPI stays neutral with regard to jurisdictional claims in published maps and institutional affiliations. |
© 2020 by the authors. Licensee MDPI, Basel, Switzerland. This article is an open access article distributed under the terms and conditions of the Creative Commons Attribution (CC BY) license (http://creativecommons.org/licenses/by/4.0/).
Share and Cite
Hur, M.S.; Lee, S.I.; Moon, S.W.; Kim, T.S.; Kwak, J.S.; Kim, D.H.; Jung, I.Y. Effect of Clearance and Cavity Geometries on Leakage Performance of a Stepped Labyrinth Seal. Processes 2020, 8, 1496. https://doi.org/10.3390/pr8111496
Hur MS, Lee SI, Moon SW, Kim TS, Kwak JS, Kim DH, Jung IY. Effect of Clearance and Cavity Geometries on Leakage Performance of a Stepped Labyrinth Seal. Processes. 2020; 8(11):1496. https://doi.org/10.3390/pr8111496
Chicago/Turabian StyleHur, Min Seok, Soo In Lee, Seong Won Moon, Tong Seop Kim, Jae Su Kwak, Dong Hyun Kim, and Il Young Jung. 2020. "Effect of Clearance and Cavity Geometries on Leakage Performance of a Stepped Labyrinth Seal" Processes 8, no. 11: 1496. https://doi.org/10.3390/pr8111496