Influence of Tip Clearance on Flow Characteristics of Axial Compressor


Abstract
:1. Introduction
2. Experiment and Numerical Setup
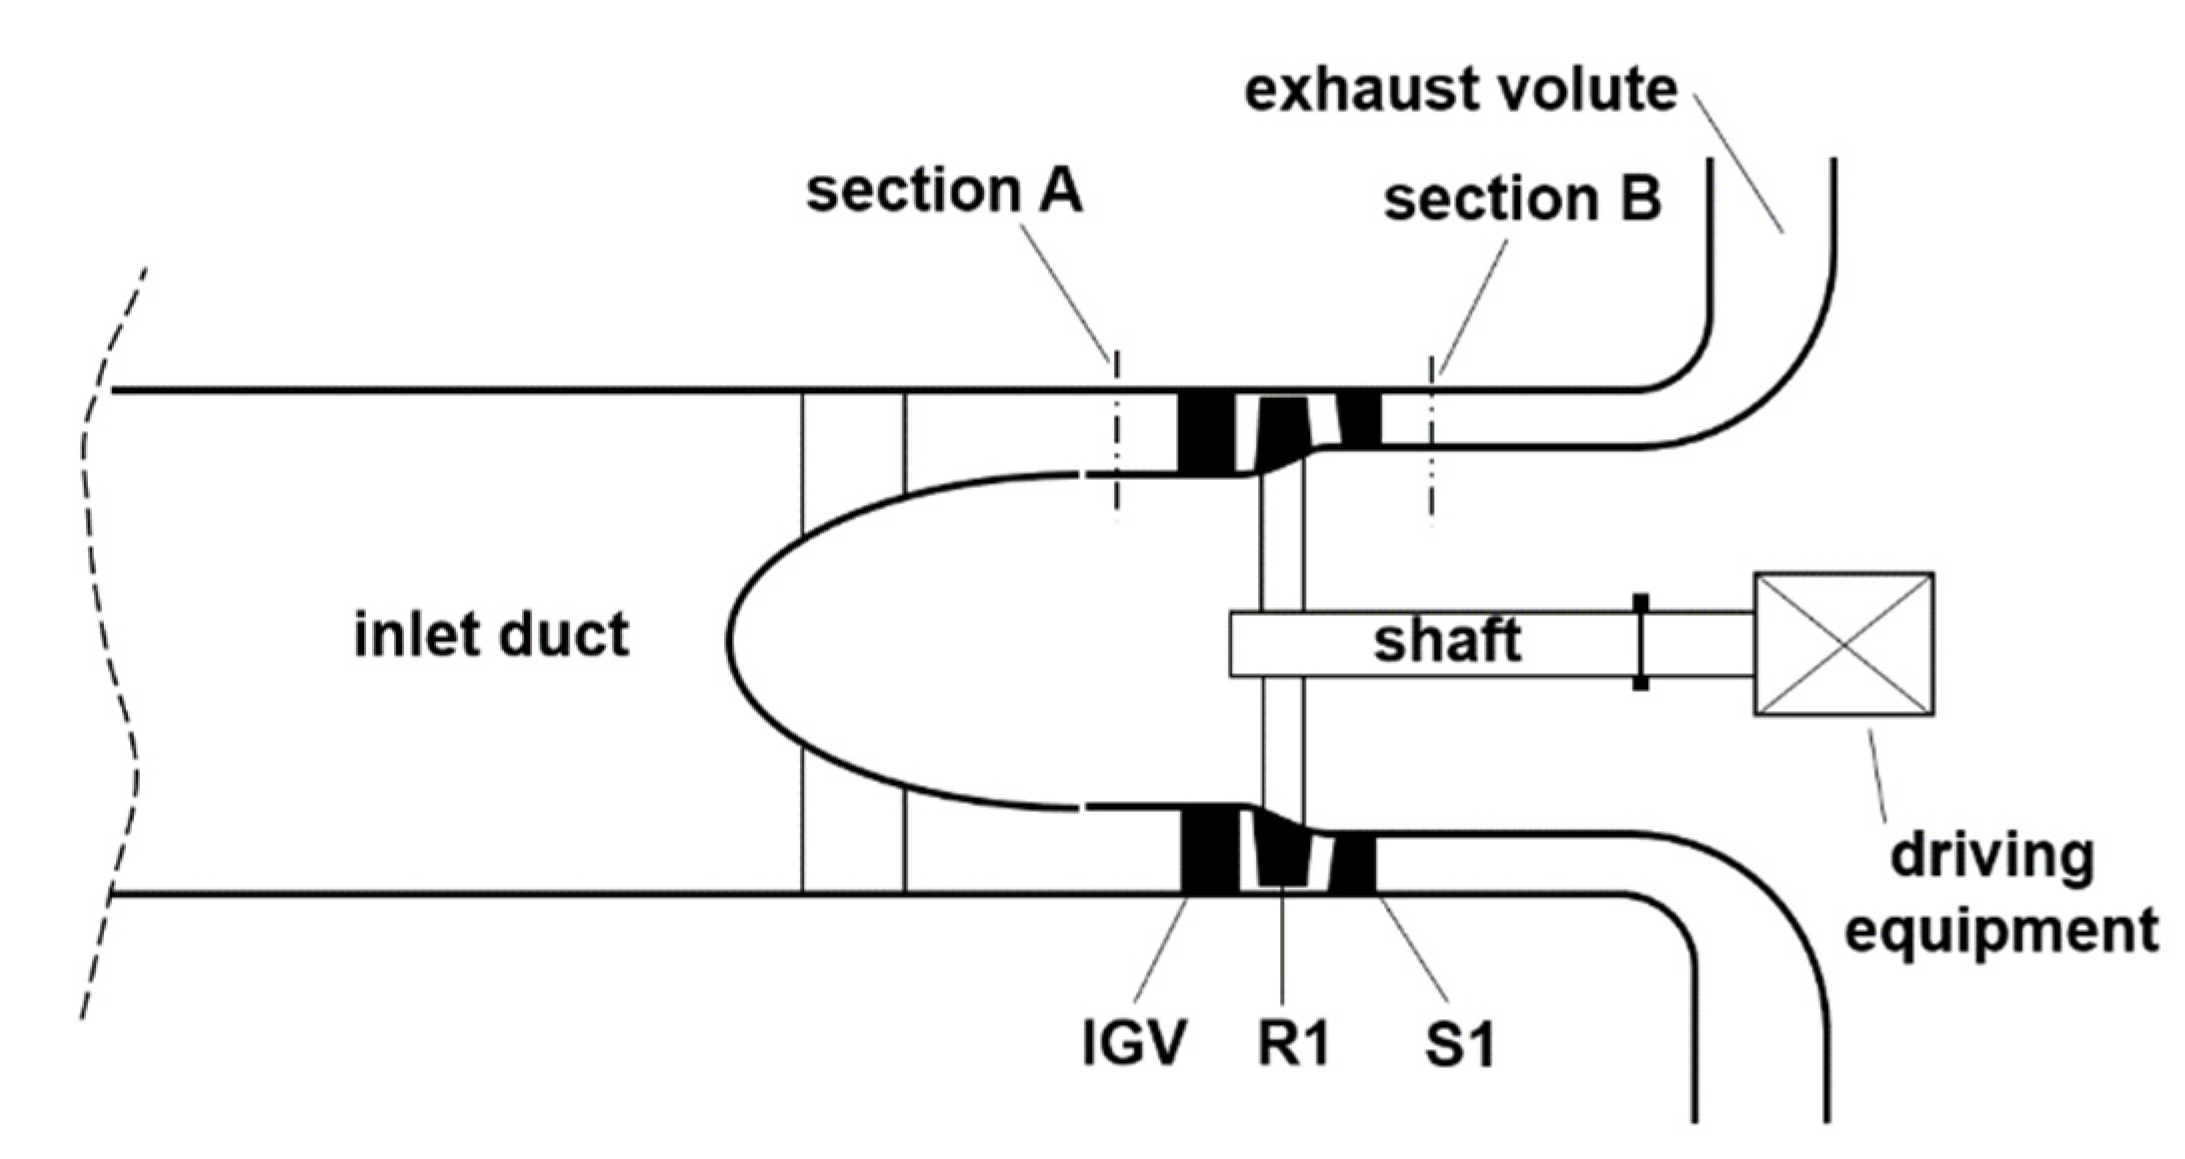
2.1. Description of the Test Rig and the Measurement
2.2. Numerical Model
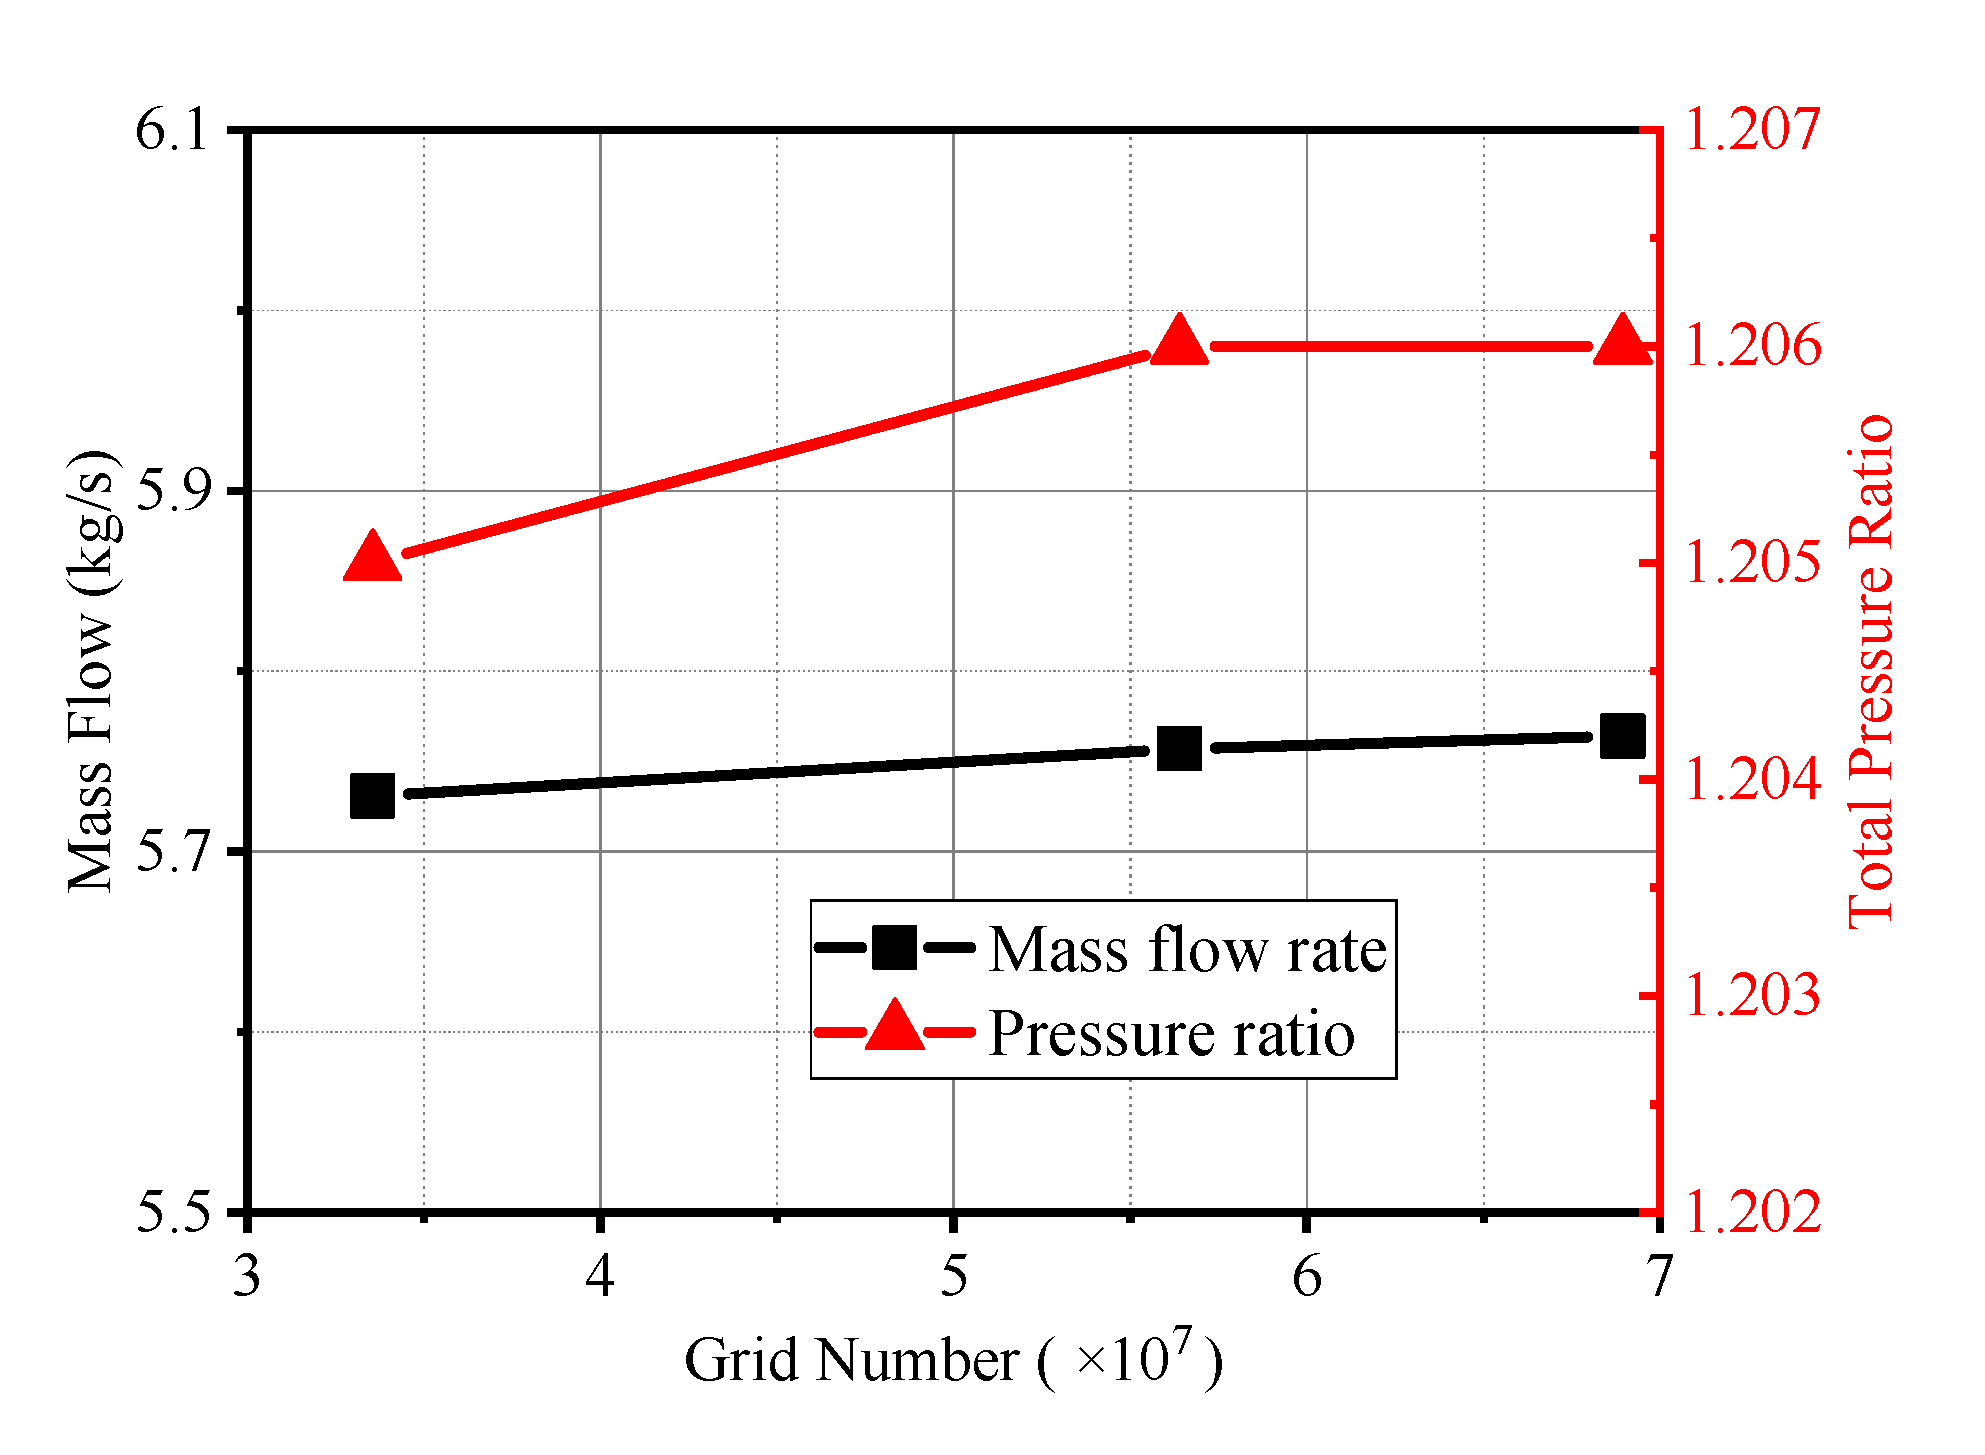
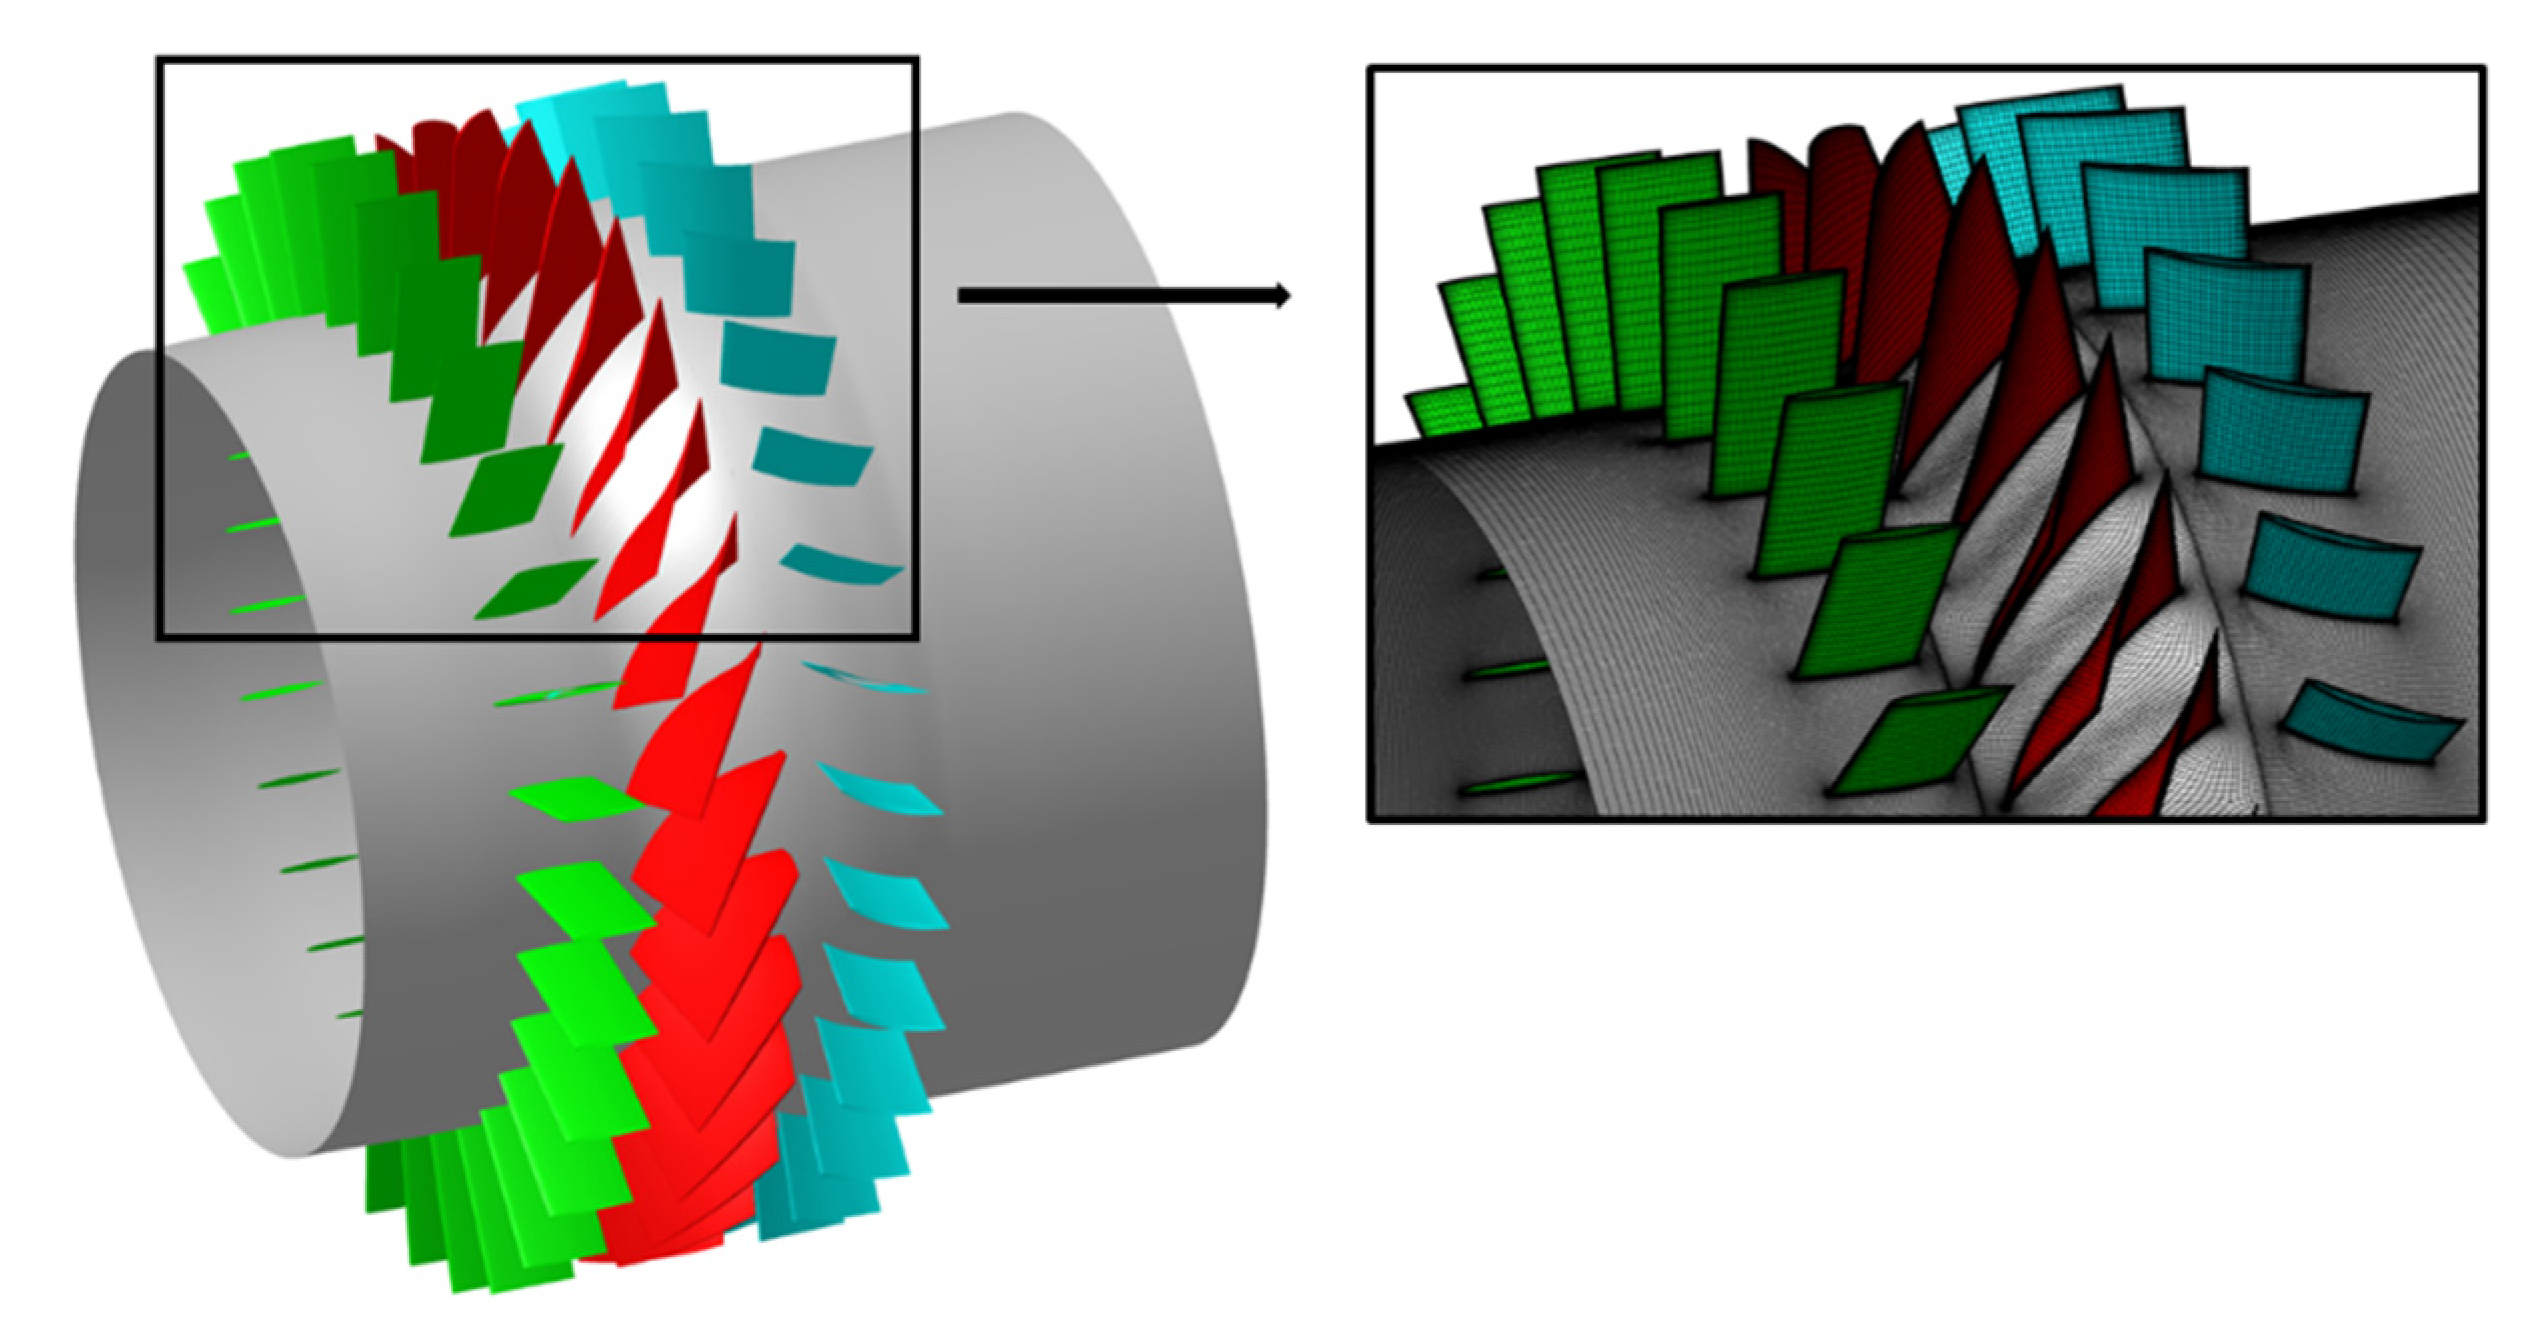
2.3. Grid Generation and Independent Test
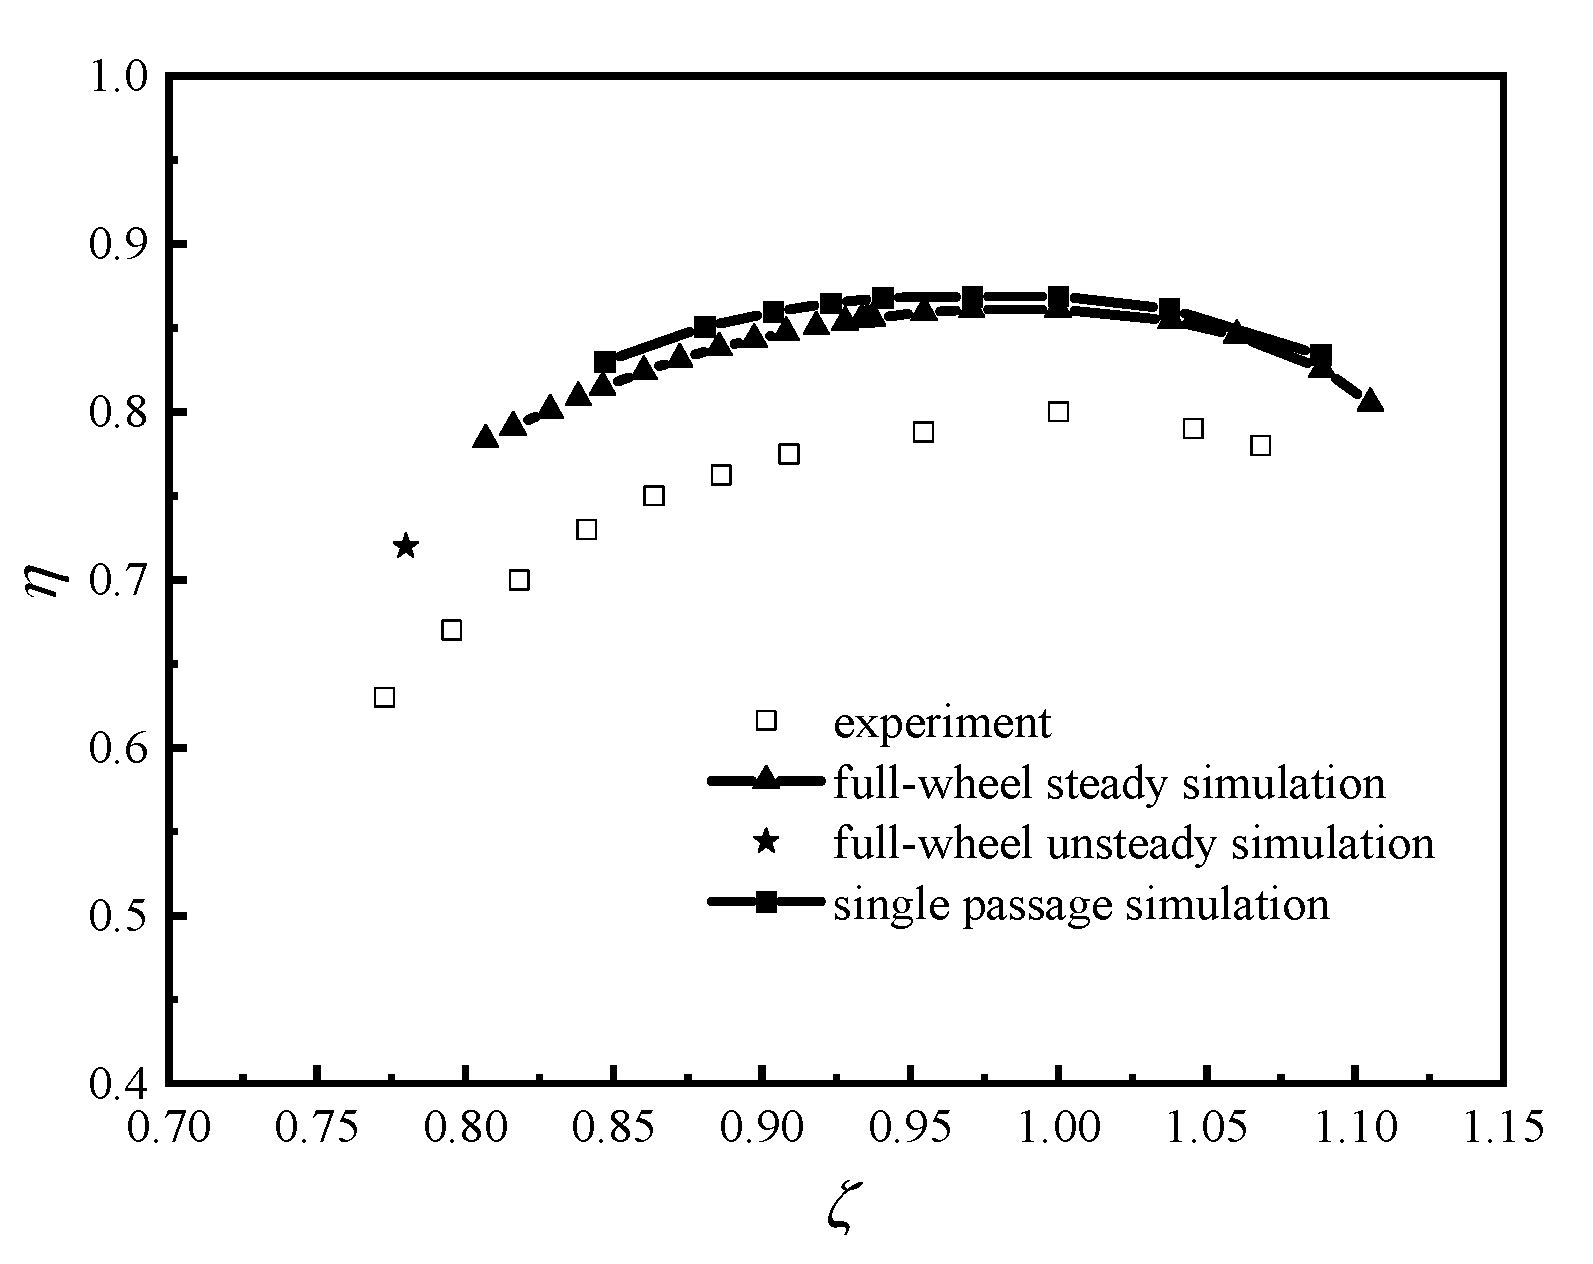
2.4. Model Validation
3. Results
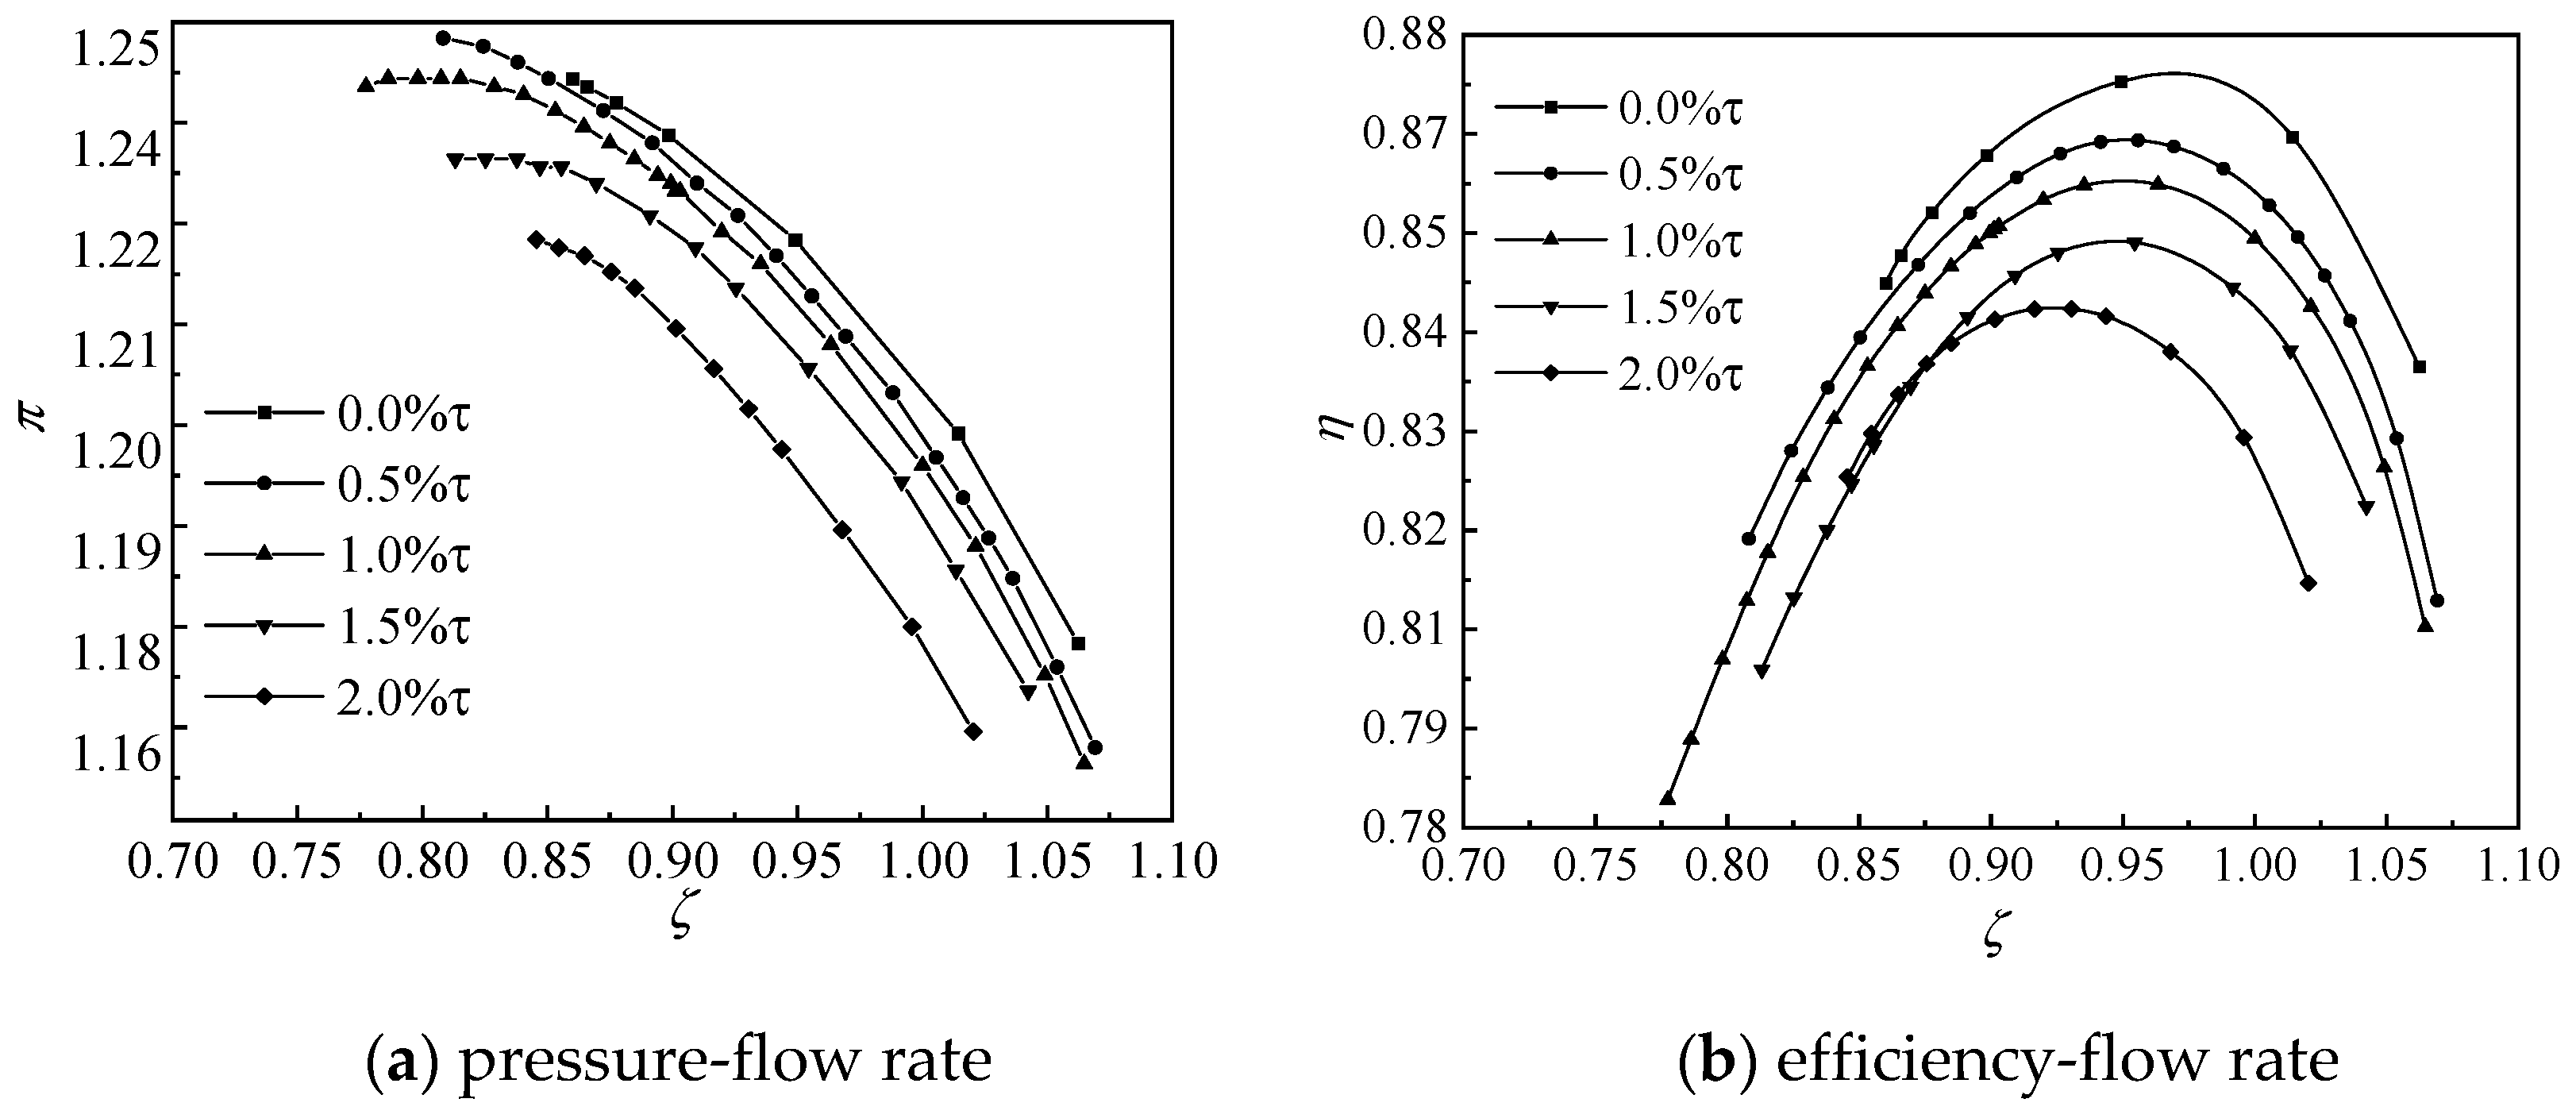
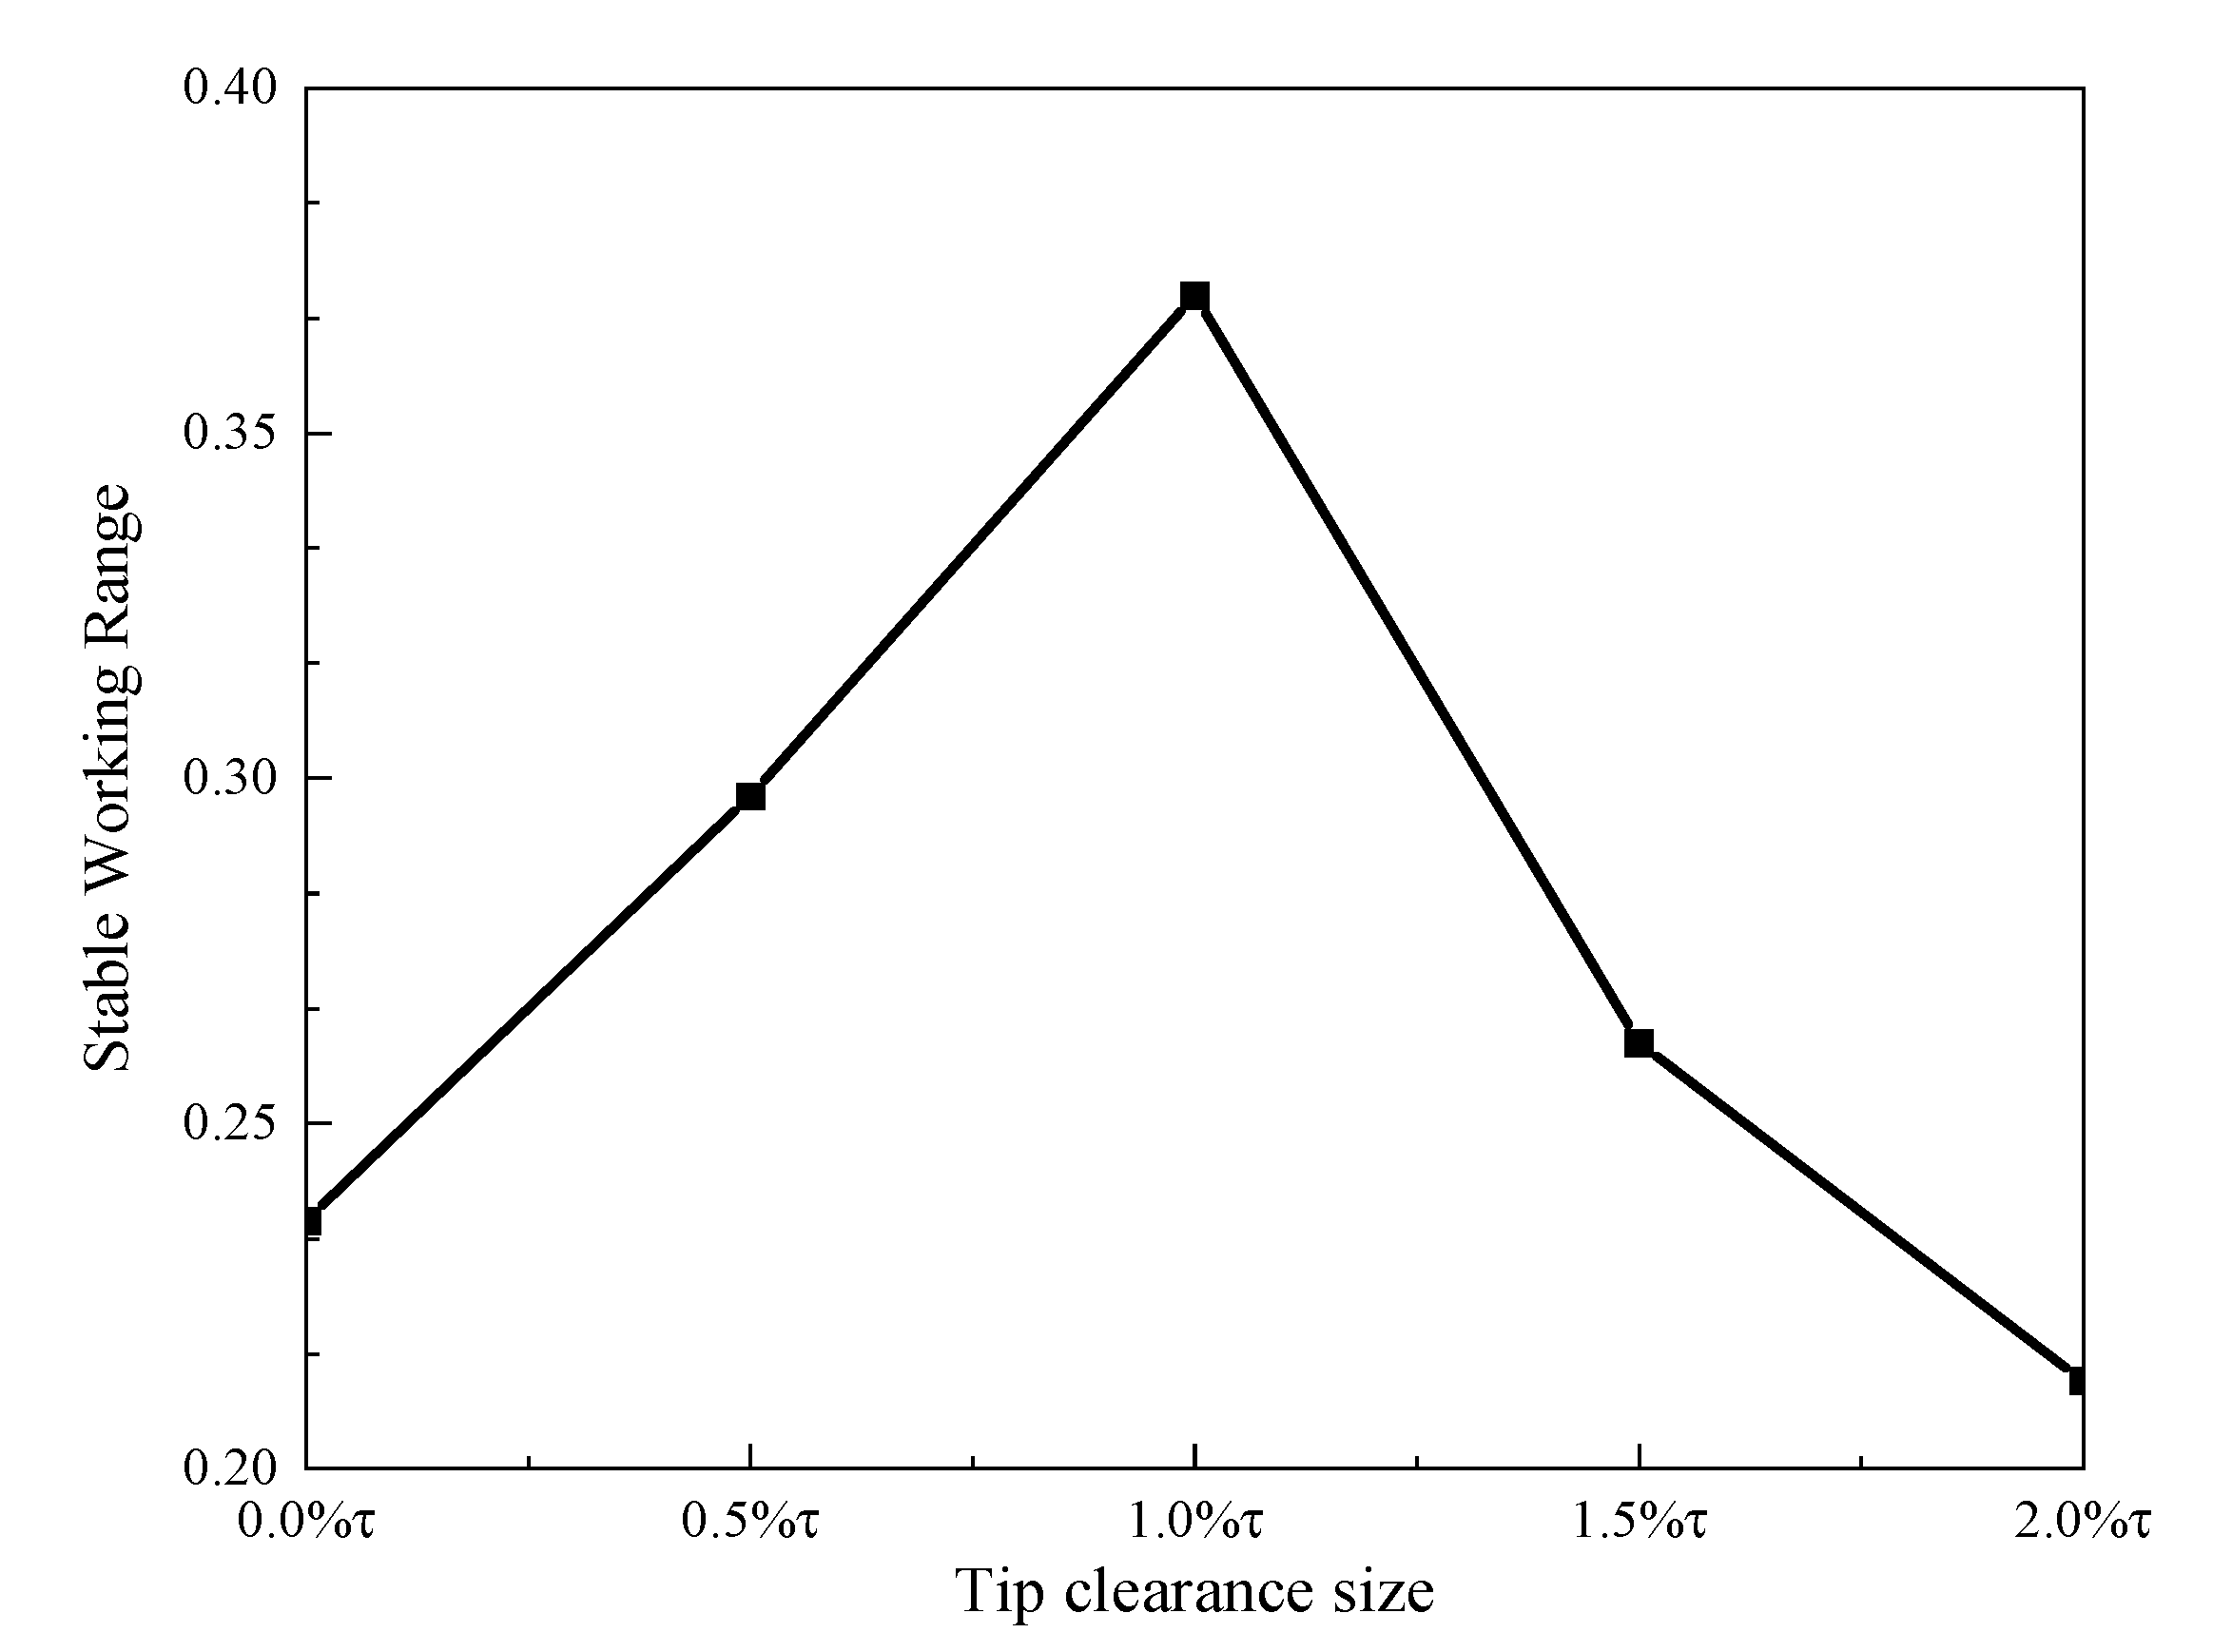
3.1. Overall Performance
3.2. Detail Results of Zero Clearance Model
3.3. Detail Results of Design Clearance Model
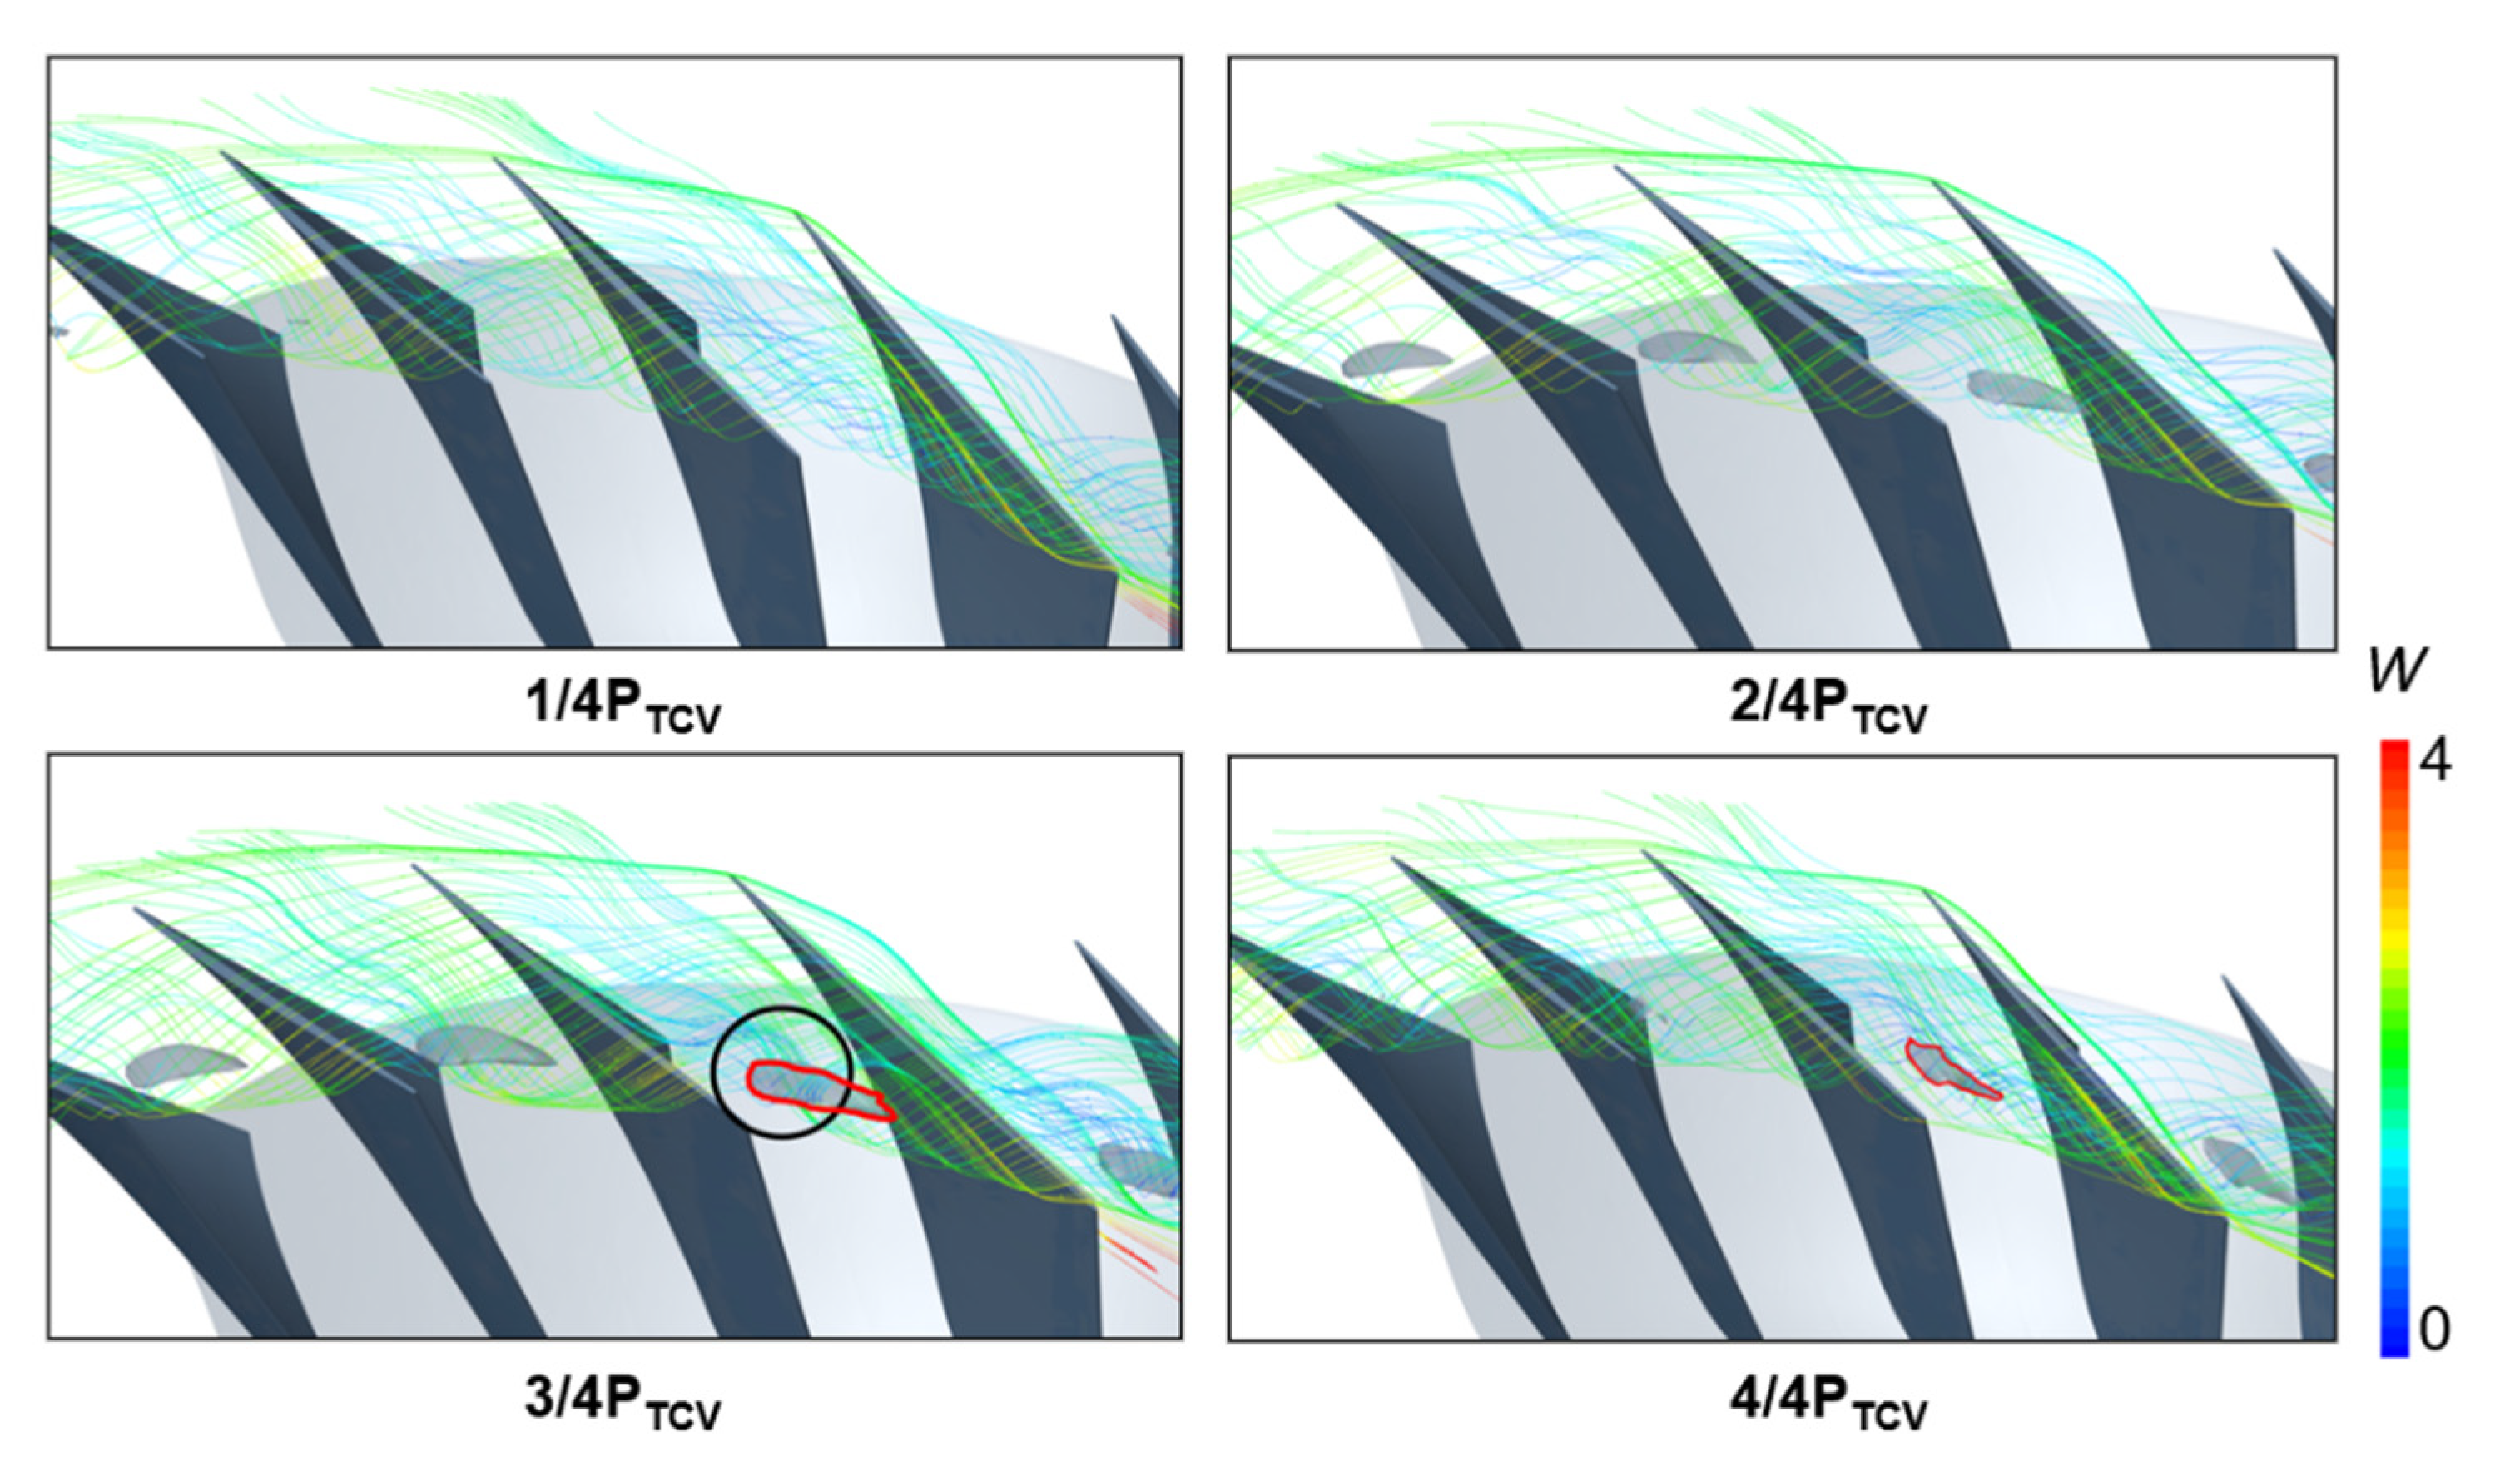
3.4. Detailed Results of Large Clearance Model
4. Conclusions
Author Contributions
Funding
Conflicts of Interest
Nomenclature
| c | chord length at rotor tip |
| m | mass flow rate |
| p | pressure |
| v | velocity |
| w | relative velocity |
| T | Time |
| U | tangential velocity |
| V | absolute velocity projection to the span |
| W | relative velocity projection to the span |
| Greek Symbols | |
| ρ | density |
| normalized mass flow | |
| total pressure ratio | |
| τ | radial length of the tip clearance |
| isentropic efficiency | |
| Abbreviations | |
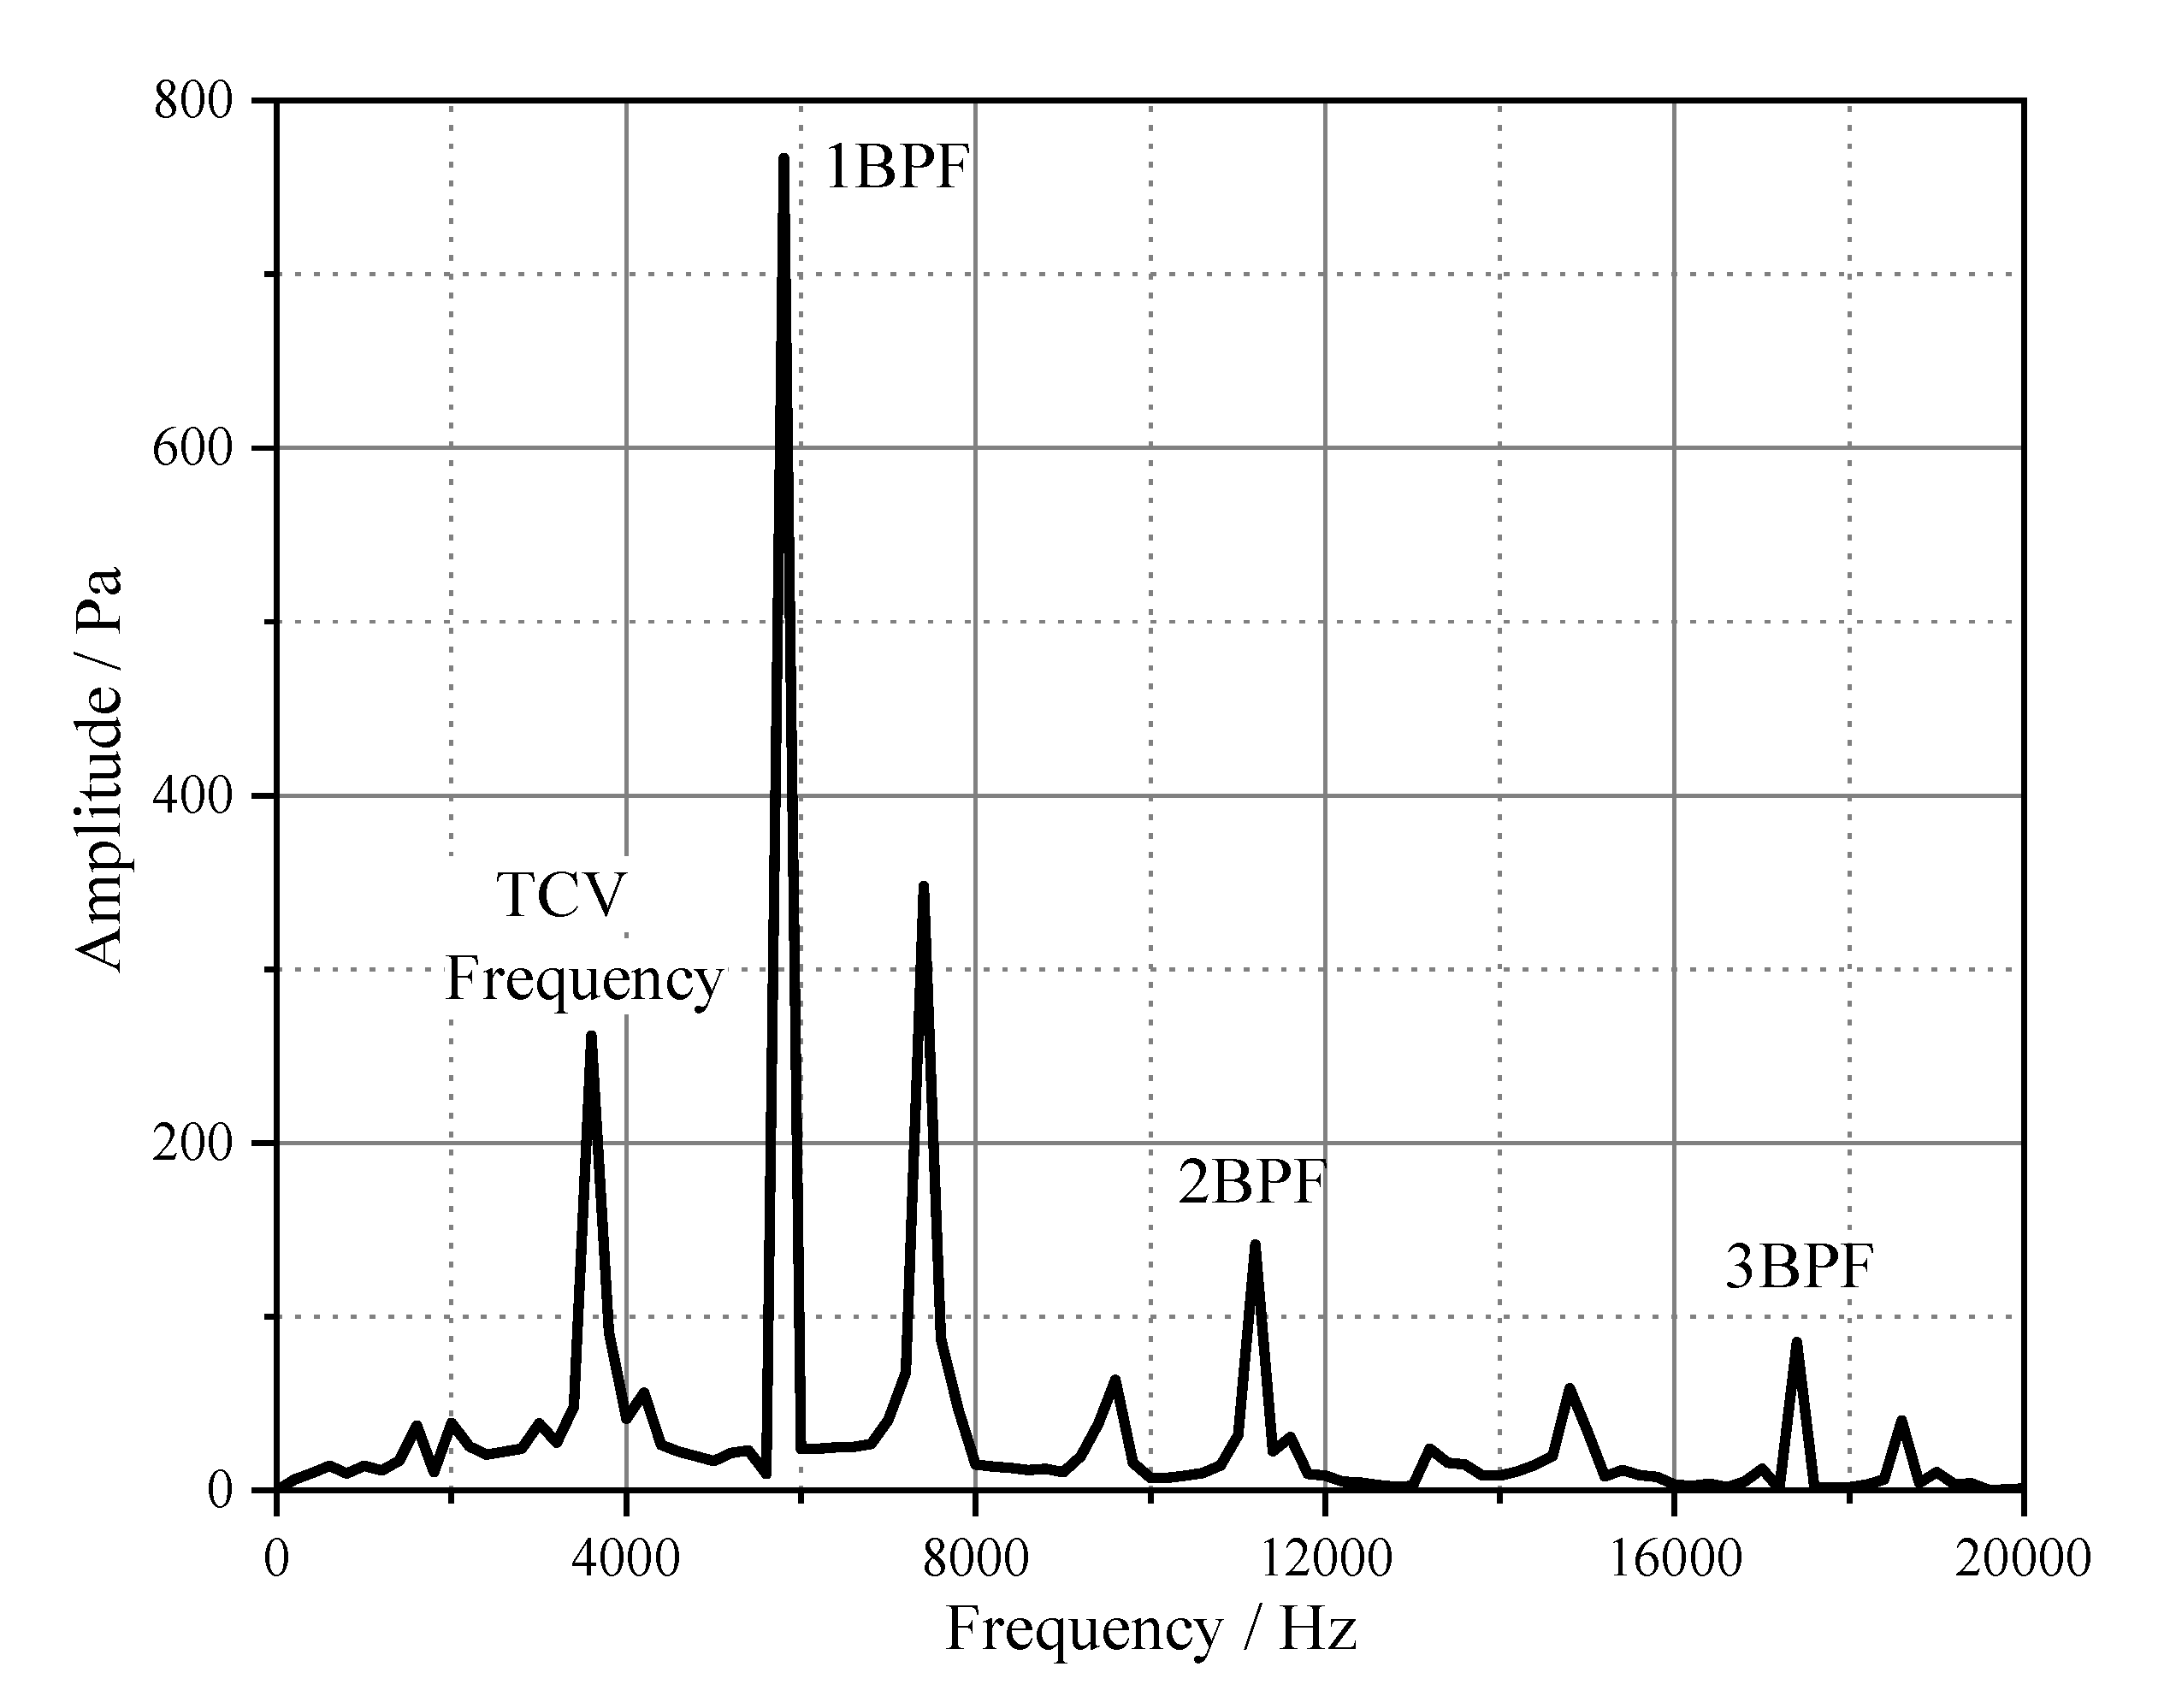
| BPF | blade passing frequency |
| CFD | computational fluid dynamics |
| IGV | inlet guide vane |
| DP | design condition |
| LE | leading edge |
| Ma | Mach number |
| NS | near stall condition |
| PE | peak efficiency condition |
| PS | pressure side |
| R1 | rotor |
| S1 | stator |
| SS | suction side |
| TCV | tip clearance vortex |
| TE | trailing edge |
| TLF | tip leakage flow |
| Subscript | |
| i | inlet |
| o | outlet |
| r | relative |
| s | static variable |
| t | total variable |
| BPF | quantity related to the period of blade passing |
| TCV | quantity related to the period of the generation of tip clearance vortex |
References
- Lakshminarayana, B. Methods of predicting the tip clearance effects in axial flow turbomachinery. J. Basic Eng. 1970, 92, 467–480. [Google Scholar] [CrossRef]
- Inoue, M.; Kuroumaru, M.; Fukuhara, M. Behavior of tip leakage flow behind an axial compressor rotor. J. Eng. Gas Turbines Power 1986, 108, 7–14. [Google Scholar] [CrossRef]
- Inoue, M.M.; Kuroumaru, M.M. Structure of tip clearance flow in an isolated axial compressor rotor. J. Turbomach. 1989, 111, 250–256. [Google Scholar] [CrossRef]
- Day, I.J. Stall inception in axial flow compressors. J. Turbomach. 1991, 115, 1–9. [Google Scholar] [CrossRef]
- Khalid, S.A.; Khalsa, A.S.; Waitz, I.A.; Tan, C.S.; Greitzer, E.M.; Cumpsty, N.A.; Adamczyk, J.; Marble, F.E. Endwall blockage in axial compressors. J. Turbomach. 1999, 121, 499–509. [Google Scholar] [CrossRef]
- Mailach, R.; Lehmann, I.; Vogeler, K. Rotating instabilities in an axial compressor originating from the fluctuating blade tip vortex. J. Turbomach. 2001, 123, 453–460. [Google Scholar] [CrossRef]
- Mailach, R.; Sauer, H.; Vogeler, K. The periodical interaction of the tip clearance flow in the blade rows of axial compressors. In ASME Turbo Expo 2001: Power for Land, Sea, and Air; American Society of Mechanical Engineers: New York, NY, USA, 2001; p. V001T03A004. [Google Scholar] [CrossRef]
- Sirakov, B.T.; Tan, C.S. Effect of unsteady stator wake—Rotor double-leakage tip clearance flow interaction on time-average compressor performance. J. Turbomach. 2003, 125, 465–474. [Google Scholar] [CrossRef]
- Du, H.; Yu, X.; Liu, B. Modeling of the double leakage and leakage spillage flows in axial flow compressors. J. Therm. Sci. 2014, 23, 103–113. [Google Scholar] [CrossRef]
- Hah, C. Effects of double-leakage tip clearance flow on the performance of a compressor stage with a large rotor tip gap. J. Turbomach. 2017, 139, 061006. [Google Scholar] [CrossRef]
- Schlechtriem, S.; Lötzerich, M. Breakdown of tip leakage vortices in compressors at flow conditions close to stall. In ASME 1997 International Gas Turbine and Aeroengine Congress and Exhibition; American Society of Mechanical Engineers: New York, NY, USA, 1997; p. V001T03A004. [Google Scholar] [CrossRef] [Green Version]
- Furukawa, M.; Saiki, K.; Nagayoshi, K.; Kuroumaru, M.; Inoue, M. Effects of stream surface inclination on tip leakage flow fields in compressor rotors. J. Turbomach. 1998, 120, 683–692. [Google Scholar] [CrossRef]
- Furukawa, M.; Inoue, M.; Saiki, K.; Yamada, K. The role of tip leakage vortex breakdown in compressor rotor aerodynamics. In ASME 1998 International Gas Turbine and Aeroengine Congress and Exhibition; American Society of Mechanical Engineers: New York, NY, USA, 1998; p. V001T01A054. [Google Scholar] [CrossRef]
- Furukawa, M.; Saiki, K.; Yamada, K.; Inoue, M. Unsteady flow behavior due to breakdown of tip leakage vortex in an axial compressor rotor at near-stall condition. In ASME Turbo Expo 2000: Power for Land, Sea, and Air; American Society of Mechanical Engineers: New York, NY, USA, 2000; p. V001T03A112. [Google Scholar] [CrossRef]
- Yamada, K.; Funazaki, K.; Furukawa, M. The behavior of tip clearance flow at near-stall condition in a transonic axial compressor rotor. In ASME Turbo Expo 2007: Power for Land, Sea, and Air; American Society of Mechanical Engineers: New York, NY, USA, 2007; pp. 295–306. [Google Scholar] [CrossRef] [Green Version]
- McDougall, N.M.; Cumpsty, N.A.; Hynes, T.P. Stall inception in axial compressors. J. Turbomach. 1990, 112, 116–123. [Google Scholar] [CrossRef]
- McDougall, N.M. A comparison between the design point and near stall performance of an axial compressor. In ASME 1989 International Gas Turbine and Aeroengine Congress and Exposition; American Society of Mechanical Engineers: New York, NY, USA, 1989; p. V001T01A040. [Google Scholar] [CrossRef]
- Camp, T.R.; Day, I.J. A Study of Spike and Modal Stall Phenomena in a Low-Speed Axial Compressor. J. Turbomach. 1998, 120, 393–401. [Google Scholar] [CrossRef]
- Hoying, D.A.; Tan, C.S.; Vo, H.D.; Greitzer, E.M. Role of blade passage flow structures in axial compressor rotating stall inception. In ASME 1998 International Gas Turbine and Aeroengine Congress and Exhibition; American Society of Mechanical Engineers: New York, NY, USA, 1998; p. V001T01A138. [Google Scholar] [CrossRef]
- Hah, C.; Bergner, J.; Schiffer, H.P. Short length-scale rotating stall inception in a transonic axial compressor: Criteria and mechanisms. In ASME Turbo Expo 2006: Power for Land, Sea, and Air; American Society of Mechanical Engineers: New York, NY, USA, 2006; pp. 61–70. [Google Scholar] [CrossRef]
- Vo, H.D.; Tan, C.S.; Greitzer, E.M. Criteria for spike initiated rotating stall. J. Turbomach. 2008, 130, 011023. [Google Scholar] [CrossRef]
- Pullan, G.; Young, A.M.; Day, I.J.; Greitzer, E.M.; Spakovszky, Z.S. Origins and structure of spike-type rotating stall. J. Turbomach. 2015, 137, 051007. [Google Scholar] [CrossRef]
- Hewkin-Smith, M.; Pullan, G.; Grimshaw, S.D.; Greitzer, E.M.; Spakovszky, Z.S. The Role of Tip Leakage Flow in Spike-Type Rotating Stall Inception. In ASME Turbo Expo 2017: Turbomachinery Technical Conference and Exposition; American Society of Mechanical Engineers: New York, NY, USA, 2017; p. V02DT46A009. [Google Scholar] [CrossRef]
- Spalart, P.; Allmaras, S. A one-equation turbulence model for aerodynamic flows. In Proceedings of the 30th Aerospace Sciences Meeting and Exhibit, Reno, NV, USA, 6–9 January 1992; p. 439. [Google Scholar]
- Song, M.R.; Yang, B.; Dong, G.M.; Liu, X.L.; Wang, J.Q.; Xie, H.; Lu, Z.H. Research on Accuracy of Flowing Field Based on Numerical Simulation for Tonal Noise Prediction in Axial Compressor. In ASME Turbo Expo 2018: Turbomachinery Technical Conference and Exposition; American Society of Mechanical Engineers: New York, NY, USA, 2018; p. V02BT43A006. [Google Scholar]
- Jameson, A. Time dependent calculations using multigrid, with applications to unsteady flows past airfoils and wings. In Proceedings of the 10th Computational Fluid Dynamics Conference, Honolulu, HI, USA, 24–26 June 1991; p. 1596. [Google Scholar]
- Rai, M.M. Three-dimensional Navier-Stokes simulations of turbine rotor-stator interaction. Part I-Methodology. J. Propuls. Power 1989, 5, 305–311. [Google Scholar] [CrossRef]


| Mesh | Inlet Guide Vane (IGV) | Rotor | Stator | Full-Passages |
|---|---|---|---|---|
| Grid1 | 0.34 | 0.31 | 0.38 | 33.55 |
| Grid2 | 0.53 | 0.64 | 0.58 | 56.40 |
| Grid3 | 0.64 | 0.79 | 0.71 | 68.95 |
Publisher’s Note: MDPI stays neutral with regard to jurisdictional claims in published maps and institutional affiliations. |
© 2020 by the authors. Licensee MDPI, Basel, Switzerland. This article is an open access article distributed under the terms and conditions of the Creative Commons Attribution (CC BY) license (http://creativecommons.org/licenses/by/4.0/).
Share and Cite
Song, M.; Xie, H.; Yang, B.; Zhang, S. Influence of Tip Clearance on Flow Characteristics of Axial Compressor. Processes 2020, 8, 1445. https://doi.org/10.3390/pr8111445
Song M, Xie H, Yang B, Zhang S. Influence of Tip Clearance on Flow Characteristics of Axial Compressor. Processes. 2020; 8(11):1445. https://doi.org/10.3390/pr8111445
Chicago/Turabian StyleSong, Moru, Hong Xie, Bo Yang, and Shuyi Zhang. 2020. "Influence of Tip Clearance on Flow Characteristics of Axial Compressor" Processes 8, no. 11: 1445. https://doi.org/10.3390/pr8111445