Article

How to Power the Energy–Water Nexus: Coupling Desalination and Hydrogen Energy Storage in Mini-Grids with Reversible Solid Oxide Cells

1
Department of Engineering, Università degli Studi di Perugia, Via Duranti 93, 06125 Perugia, Italy
2
Department of Physics and Geology, Università degli Studi di Perugia, Via Pascoli 93, 06123 Perugia, Italy
*
Author to whom correspondence should be addressed.
Processes 2020, 8(11), 1494; https://doi.org/10.3390/pr8111494
Submission received: 21 October 2020 / Revised: 7 November 2020 / Accepted: 17 November 2020 / Published: 19 November 2020
(This article belongs to the Special Issue Recent Advances of Solid Oxide Fuel Cells (SOFC))

Abstract

:
Sustainable Development Goals establish the main challenges humankind is called to tackle to assure equal comfort of living worldwide. Among these, the access to affordable renewable energy and clean water are overriding, especially in the context of developing economies. Reversible Solid Oxide Cells (rSOC) are a pivotal technology for their sector-coupling potential. This paper aims at studying the implementation of such a technology in new concept PV-hybrid energy storage mini-grids with close access to seawater. In such assets, rSOCs have a double useful effect: charge/discharge of the bulk energy storage combined with seawater desalination. Based on the outcomes of an experimental proof-of-concept on a single cell operated with salty water, the operation of the novel mini-grid is simulated throughout a solar year. Simulation results identify the fittest mini-grid configuration in order to achieve energy and environmental optimization, hence scoring a renewable penetration of more than 95%, marginal CO2 emissions (13 g/kWh), and almost complete coverage of load demand. Sector-coupling co-production rate (desalinated water versus electricity issued from the rSOC) is 0.29 L/kWh.

1. Introduction

The United Nation’s 2030 Agenda for Sustainable Development sets affordable access to renewable energy and clean water among the grand challenges that humanity is called to face for a full transition towards a prosperous and equal society (Sustainable Development Goals SDG 6 and SDG 7 [1]). Access to energy and clean water are key factors for human communities, enabling economic growth, and improving life-comforts and security [2]. Unfortunately, worldwide, many countries severely suffer from energy and water scarcity. The absence—or intermittent/scarce supply—of electricity and clean water profoundly impacts the quality of services available to the population, from supporting essential economic activities (such as efficient irrigation methods) up to assuring education, health services, telecommunications, etc. Such issues become very restrictive in developing countries featured by a high population growth rate and a high share of population living in remote/rural areas [3,4]. Nonetheless, these regions seem promising fields for the demonstration of new technologies devoted to distributed power generation and sector-coupling.
Thus, looking at assuring reliable access to electricity to the inhabitants of remote rural areas/small urban centres with poor electricity infrastructure, the priorities are: (i) finding affordable off-grid solutions; (ii) strengthening the reliability and affordability of supply from the grid. Then, concerning water resources, the problem of water scarcity in coastal regions at least may be overcome by upgraded seawater desalination methods. Since desalination is an energy-intensive process [5], it becomes particularly burdensome when either the electric supply is low, or the access to the electric infrastructure is inexistent. For these reasons, the main idea presented in this paper assumes great relevance. Sector-coupling between desalination and renewable energy production/storage through the synthesis of green hydrogen is claimed very promising, especially for the implementation in small distributed off-grid renewable plants. The technology proposed for an efficient sector-coupling is Solid Oxide Cells, used in their reversible operation (rSOC). rSOCs can be connected to solar photovoltaic for power-to-gas conversion, to store renewable energy in the form of chemical energy [6,7,8]. Then, to fulfil electricity demand in periods of photovoltaic underproduction, rSOCs can be operated in gas-to-power mode, reconverting hydrogen into electricity. Desalinated water is a valuable by-product: whether seawater is used as feedstock for hydrogen production, ionic compounds like salt are separated from the liquid phase. The system, as a whole, releases desalinated water as the main exhaust species during the gas-to-power phase.
This paper proposes a brand-new innovation tackling the critical energy–water nexus. For that, it presents advancements covering the following points of novelty: experimental proof-of-concept of the operability of rSOC with simulated seawater, an innovative micro-grid configuration (embedding both renewable energy and energy-active water desalination), and new metrics to assess the impact of sector-coupling technologies. This study adopts numerical simulation as the principal methodology to evaluate the effect of the proposed micro-grid architecture and management strategy. However, since the field of application is almost new to rSOC technology, preliminary experimental trials were done for two fundamental reasons: first, to demonstrate the technical feasibility of seawater electrolysis through rSOC, and second, to retrieve a few essential parameters to run the numeric simulations. Since a positive outcome from the experimental characterization is a prerequisite for the contents presented afterwards, Section 3 stays ahead of Section 4 and Section 5, where system design is addressed. For an easier understanding of the research approach, Section 4.5.1, from Section 4, summarizes the information transferred from the experimental characterization of a rSOC single cell to the micro-grid model.

2. Overview of State-of-the-Art and Innovative Technology

2.1. Renewable Energy Storage Technologies

The topic of energy storage is one of the main challenges coupled to diffusion of renewable energy sources (RES) and the achievement of sustainable development. As of 2018, the world’s total energy storage installed capacity was only 166 GW [9]. More than 96% (160 GW) of capacity is provided by pumped-hydro, and this technology is subject to site-specific limitations. The remaining 4% is constituted by thermal and electrochemical storage. The latter embeds a terrific potential for the incredible scale flexibility, opening vast market opportunities in decentralized (or even stand-alone) electric plants. In particular, electrochemical storage becomes a crucial element to deploy further the concept of decarbonized mini and micro-grids [10].
At present, batteries are the most popular technologic solution of this field. Batteries, however, are suitable for short- and mid-term storage (up to days) [11], but not for seasonal storage. Moreover, conventional batteries (viz. Li-ions, Lead-Acid, etc.) do not permit the decoupled sizing of power and capacity. To tackle seasonal storage necessities and to tailor power and energy capacity independently, the most promising set of technologies is based on a mix of electrochemical devices constituted by conventional batteries, redox flow batteries, and electrolyzers. Electrolyzers show several advantages; primarily, they are key in power-to-gas (hydrogen) conversion. For this reason, energy storage based on electrolysis unlocks multiple uses of energy (transport, industry, heating and, trivially, electricity) and the benefits of sector-coupling [12]. In particular, green hydrogen produced from RES-powered electrolysis is expected to substitute the requested feedstock that nowadays is mainly generated by hydrocarbons reforming in several industrial processes [8].
Moreover, the production of hydrogen or other synthetic fuel gas mixtures store energy in a way that lasts indefinitely in time, overcoming the problem of self-discharge. With fuel cells, it is possible to convert the produced gas back to electricity at high efficiency.

2.2. Desalination Systems

At present, several technologies are available for water desalination. The main classification is based on the physical principle they use to separate water from ionic compounds (salt). According to this criterion, standard desalination technologies are classified into thermal and filtration systems:
  • Thermal systems use heat and different pressure levels to evaporate part of the water that flows in the plant. Leftover water exhibits a high salt concentration, and then it is discarded. The most used thermal systems are Multi-Stage Flash (MSF) and Multi-Effect Distillation (MED). Their advantages are almost negligible salt content in the output water and the possibility of using waste heat from other processes. Nevertheless, being based on the evaporation principle, their energy consumption is high [13].
  • Filtration systems’ desalination working principle stands on a differential pressure over a porous membrane. The most used technology of this kind is Reverse Osmosis (RO), which nowadays contributes to 62% of the water produced by desalination plants [13]. In RO systems, electricity is required as the main driver for the process (energy consumption is between 3–10 kWh per water cubic meter [14]). However, their energy consumption is lower compared to thermal systems, but this is counterbalanced by a higher need for maintenance owing to membranes. RO is the cheapest method for water desalination [15].
With the rising necessity of freshwater and the growing number of desalination plants, the topic of their sustainability becomes of paramount importance. As exposed before, desalination is an energy-intensive process. However, it can be coupled with renewables power sources. This is possible both for thermal (requiring heat) and filtration technologies (calling for electric energy).

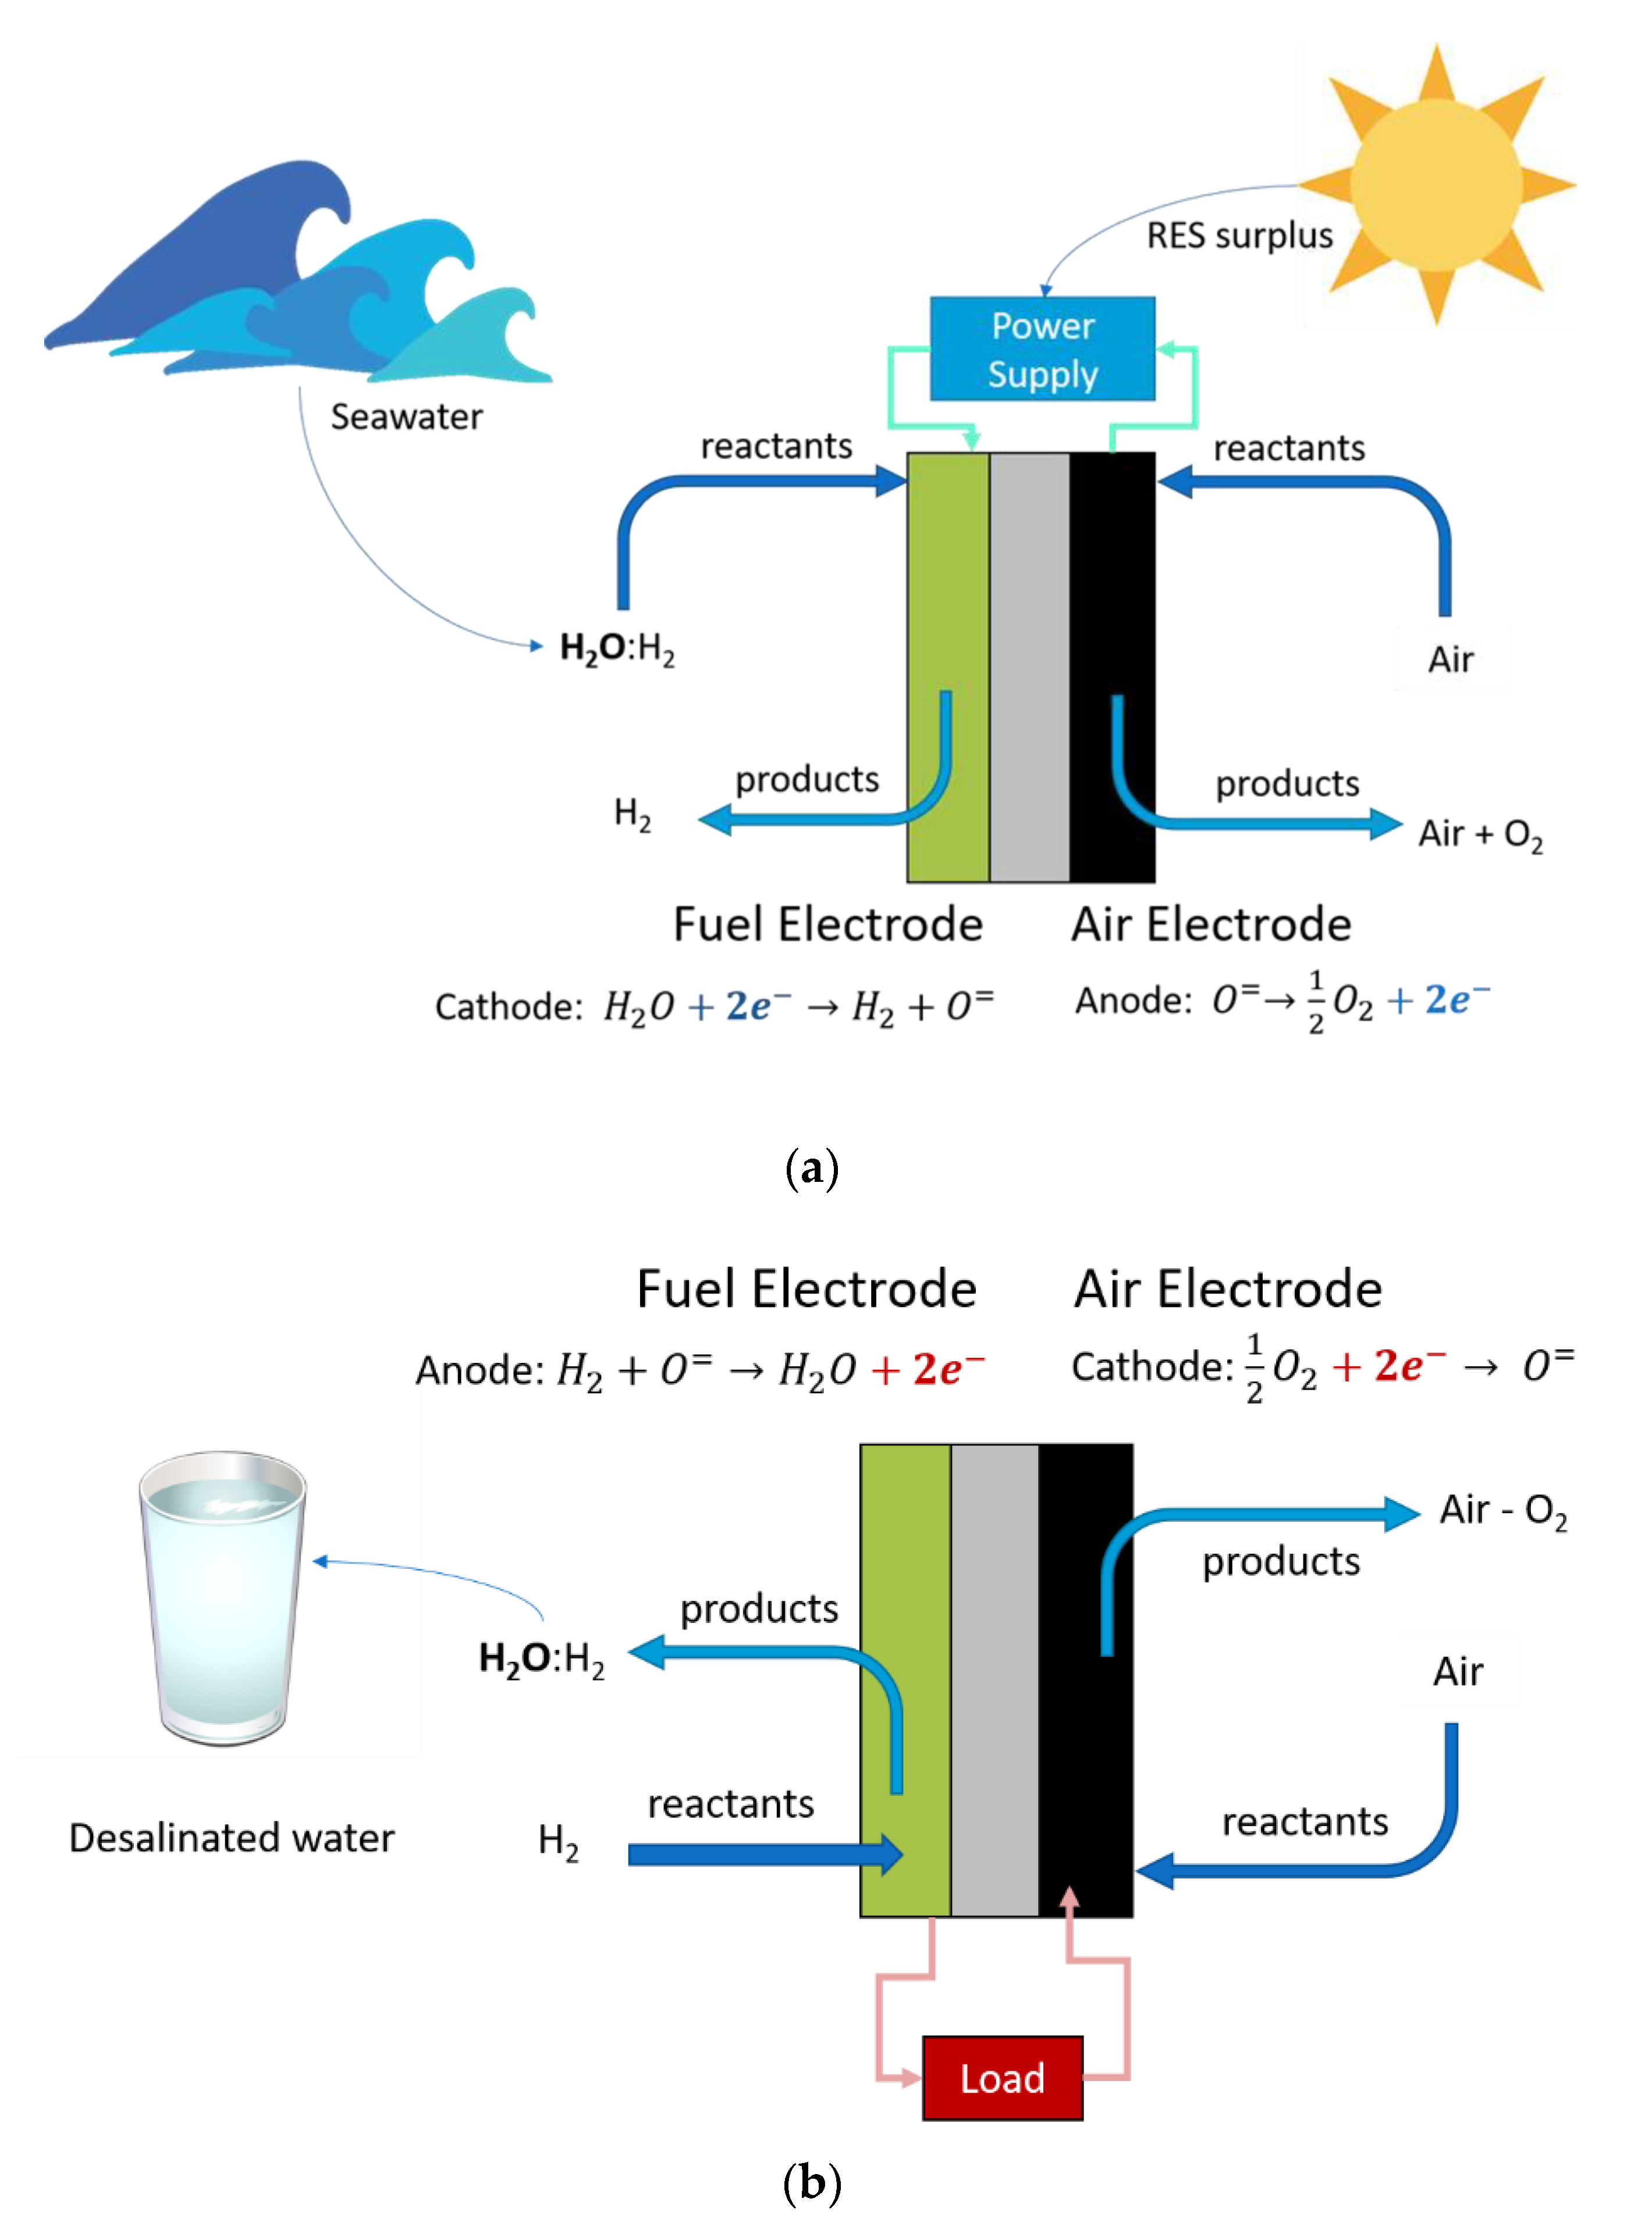
2.3. Innovative System: Coupling Energy Storage and Water Desalination by rSOCs

rSOC systems are a class of innovative energy generation and storage systems in the field of hydrogen and fuel cells technologies. They have several advantages, such as high conversion efficiency and system flexibility. rSOC stacks accept a wide range of fuels (H2, light hydrocarbons, NH3). However, most importantly, they can be coupled to industrial processes and chemical reactors for synthetic fuel production [16,17], with significant benefits in terms of heat integration thanks to high-temperature operation. The maturity and TRL level of such systems took giant leaps forward in the last 15 years, and the technology is approaching maturity, both at stack and system level [18].
The central point of strength, enabling a higher capacity factor and shorter investment recovery in the coupling with RES power source, is their reversible operation [19]: rSOCs can be operated both as electrolyzer (Figure 1a) and fuel cell (Figure 1b). As electrolyzer (SOE, Figure 1a), rSOC receives electric power from an external source (like PV or any other renewable generator) and converts water into hydrogen and, separately, oxygen. Feeding water is always supplied in excess to the system to avoid reactant starvation and minimize polarization losses connected to reactant concentration in the inlet stream [20], which would lead to increased voltage and power required by the cell to work. The amount of water in excess is usually limited to reduce the capital cost of the steam generator and energy losses in the process. When seawater is available, it can be used as feedstock to produce steam in SOE mode. Then, in the fuel cell mode (SOFC, Figure 1b), the rSOC converts hydrogen back to electricity, heat and water. Produced water comes from the electro-oxidation of hydrogen and atmospheric oxygen (air), and therefore is salt-free. The amount of water is proportional to the electrical energy issued by the SOFC. For optimal energy management, excess heat of the system could be used for water desalination in a dedicated section of the plant. The valorization of water produced by this kind of system is a topic of great interest, and it has not been tackled until now. Beside extremely positive remarks about the flexibility of this technology, rSOC suffers from several degradation problems. rSOC stacks expected lifetimes complies with a degradation rate < 0.5%1000 h. This target is expected to be achieved by the year 2030 [6], hence pushing towards wider commercial diffusion. Considering state-of-the-art rSOC materials (Ni-YSZ bilayer fuel electrode, 8YSZ electrolyte, GDC + LSCF barrier layer + air electrode), the component suffering the highest degradation in the cell is the Ni-YSZ cermet. Operation in SOFC mode is stable and yields low degradation rates (already as low as 0.1–0.2%1000 h [21]), while electrolysis is responsible for most of the degradation during cell lifetime. Cell materials degradation is often due to a loss of catalyst (Ni), to its migration, coarsening and accumulation of impurities on electrochemically active reaction sites [22]. Degradation is influenced by local current density and electrode microstructure [23,24], but also by the accumulation of several kinds of impurities that partially or entirely block the reaction sites [25]. Then, the presence of impurities in the inlet gas stream could lead to increased rates of degradation due to their effect of the fuel electrode. Moreover, glassy elements (Si, Al, but also Na, which becomes relevant when using seawater) [26], tend to accumulate close to reaction sites, especially in SOE mode.
Once technologic challenges are overcome, it follows that rSOCs are excellent candidates to experiment novel concepts of cross-sectoral integration. In this paper, the coupling of energy storage and desalination in the context of RES micro-grids is investigated.

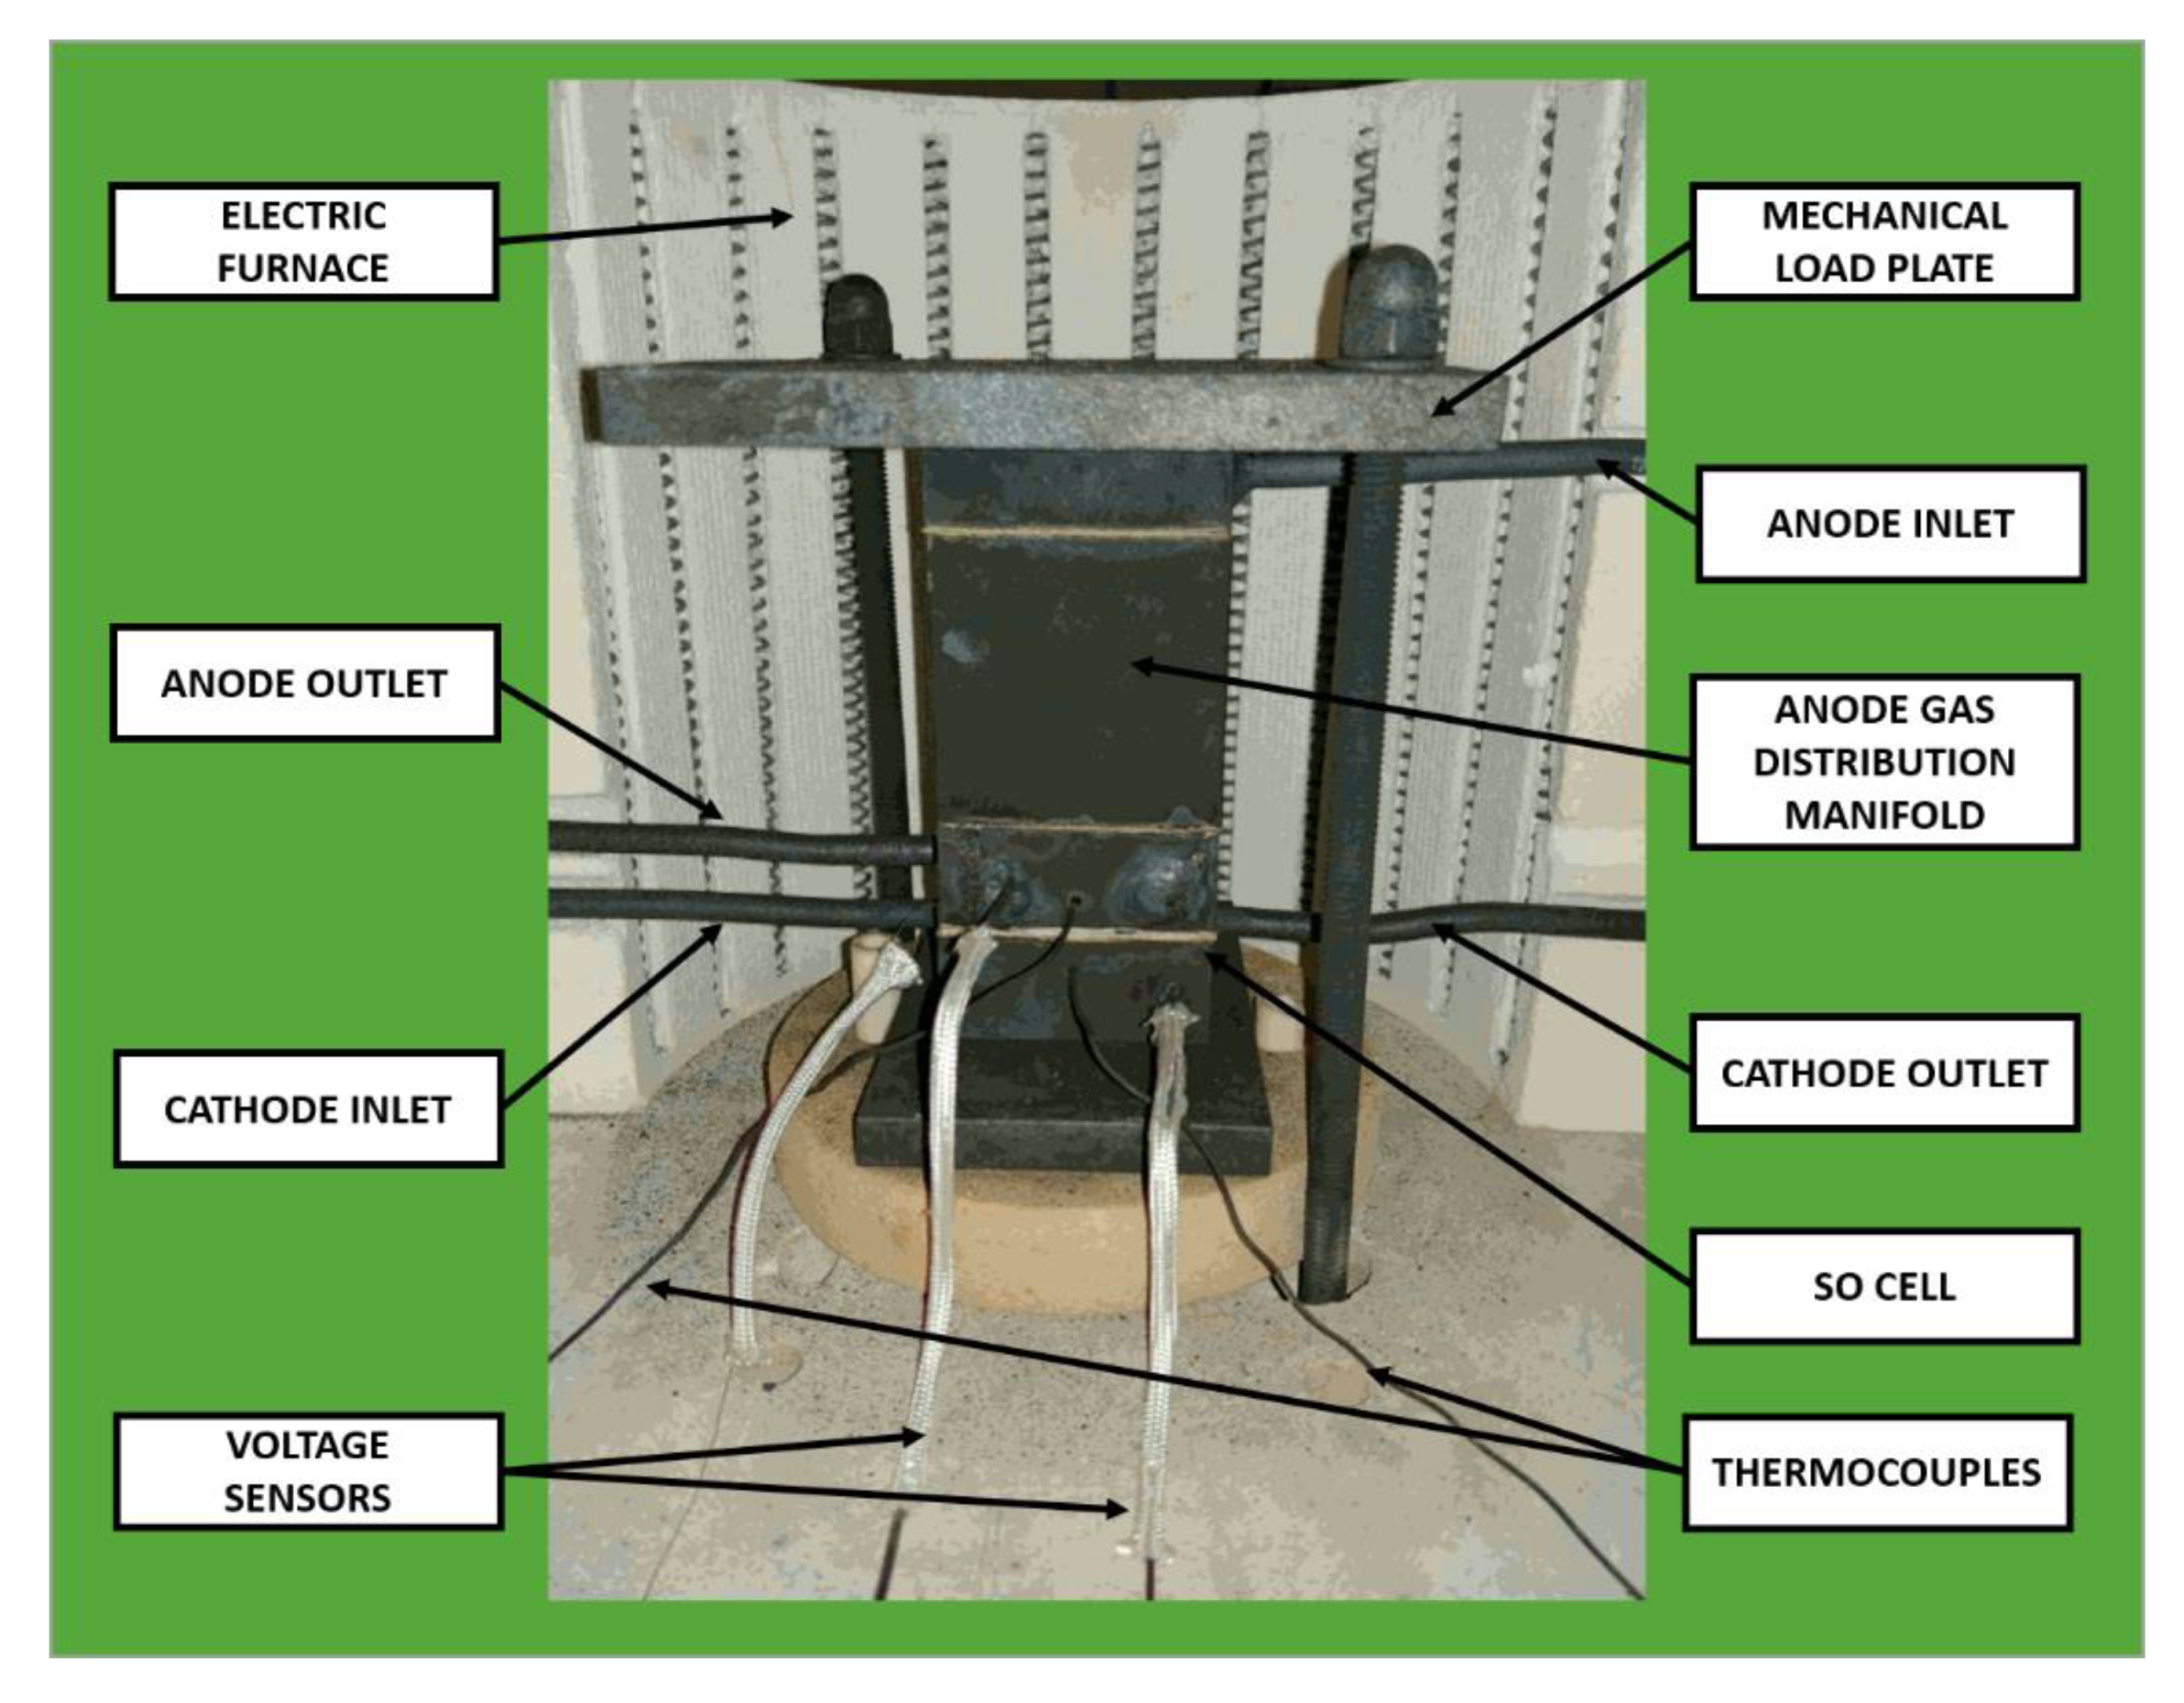
3. Experimental Proof-of-Concept

The full potential of rSOC in maritime areas needs to be demonstrated due to several challenges. In the frame of this paper, a simple proof-of-concept supported by experimental data is presented. The tests were carried out with in-house equipment, and the empirical evidence about rSOC performance is reported and discussed. The scope of the experimental study is the analysis of the effects of simulated seawater (a mixture of common NaCl dissolved in demineralized water) in commercial cells operated in electrolysis mode. This is finalized at assessing the potential increase in glassy elements accumulation in the chosen set of operating conditions. Moreover, some experimental parameters are retrieved to tune the system simulation model.

3.1. Materials and Experiment Preparation

A schematic of the test bench is sketched in Figure 2.The test is realized on a square 5 × 5 cm solid oxide single cell. The cell is a commercial planar anode-supported cell, with the following composition and thickness: 240 ± 20 µm Ni-YSZ fuel electrode, 8 ± 2 µm 8YSZ electrolyte, 6–8 µm GDC barrier layer and 50 ± 10 µm LSCF bilayer air electrode. The cell is tested in a steel housing (steel type AISI310S), corrugated metal wire meshes are used as current collectors, namely Ni for the fuel electrode, and Crofer22 for the air electrode. The fuel side was sealed by a multilayer sealing composed by a mineral core (Spetech Spetoterm TUI 910, Bielsko-Biala, Poland) and a glass-ceramic paste (SCHOTT G018-311, Schott AG, Mainz, Germany). The further guarantees the compliance of the sealing under mechanical load, also allowing the use of materials with slightly different thermal expansion behaviour. The latter improves gas retention capability, compensating for small surface defects of the sealed elements (non-planarity and surface roughness of the steel manifold, non-planarity of the cell, etc.). Air and hydrogen are introduced in the system by the use of mass flow controllers. Water steam content in the inlet flow is controlled by bubbling hydrogen in a temperature-controlled bubbler and checked by comparison with Nernst voltage calculation at open circuit voltage (OCV). NaCl is added and dissolved in the thermostatic bubbler (concentration 35 g/kgH2O) to simulate the average salinity of seawater.
The cell is heated in a nitrogen atmosphere up to 850 °C (heating rate 1 °C/min) to melt the glass-ceramic sealing. Then, temperature ramps down to 800 °C, and the fuel electrode is reduced by switching the inert gas supply gradually to pure hydrogen with a flow of 0.625 Nl/h/cm2. After a preliminary check due to start-up operation (i.e., OCV measurement to check the sealing fitness), the cell is polarized in SOFC mode to verify performances, then kept at OCV for 50 h until stabilization.

3.2. Test Plan

The cell is qualified in both SOFC and SOE modes with a polarization test. Table 1 shows accurate details about feeding gases composition. Then, for the constant current test, the fuel electrode is supplied with an equimolar mixture of hydrogen and water steam (H2:H2O 50%:50%). Steam is produced out of salty-water (NaCl 35 g/kgH2O). The gas flow rate is set to obtain a reactant utilization rate of 33% at 250 mA/cm2. The constant current SOE test starts and lasts for 50 h.

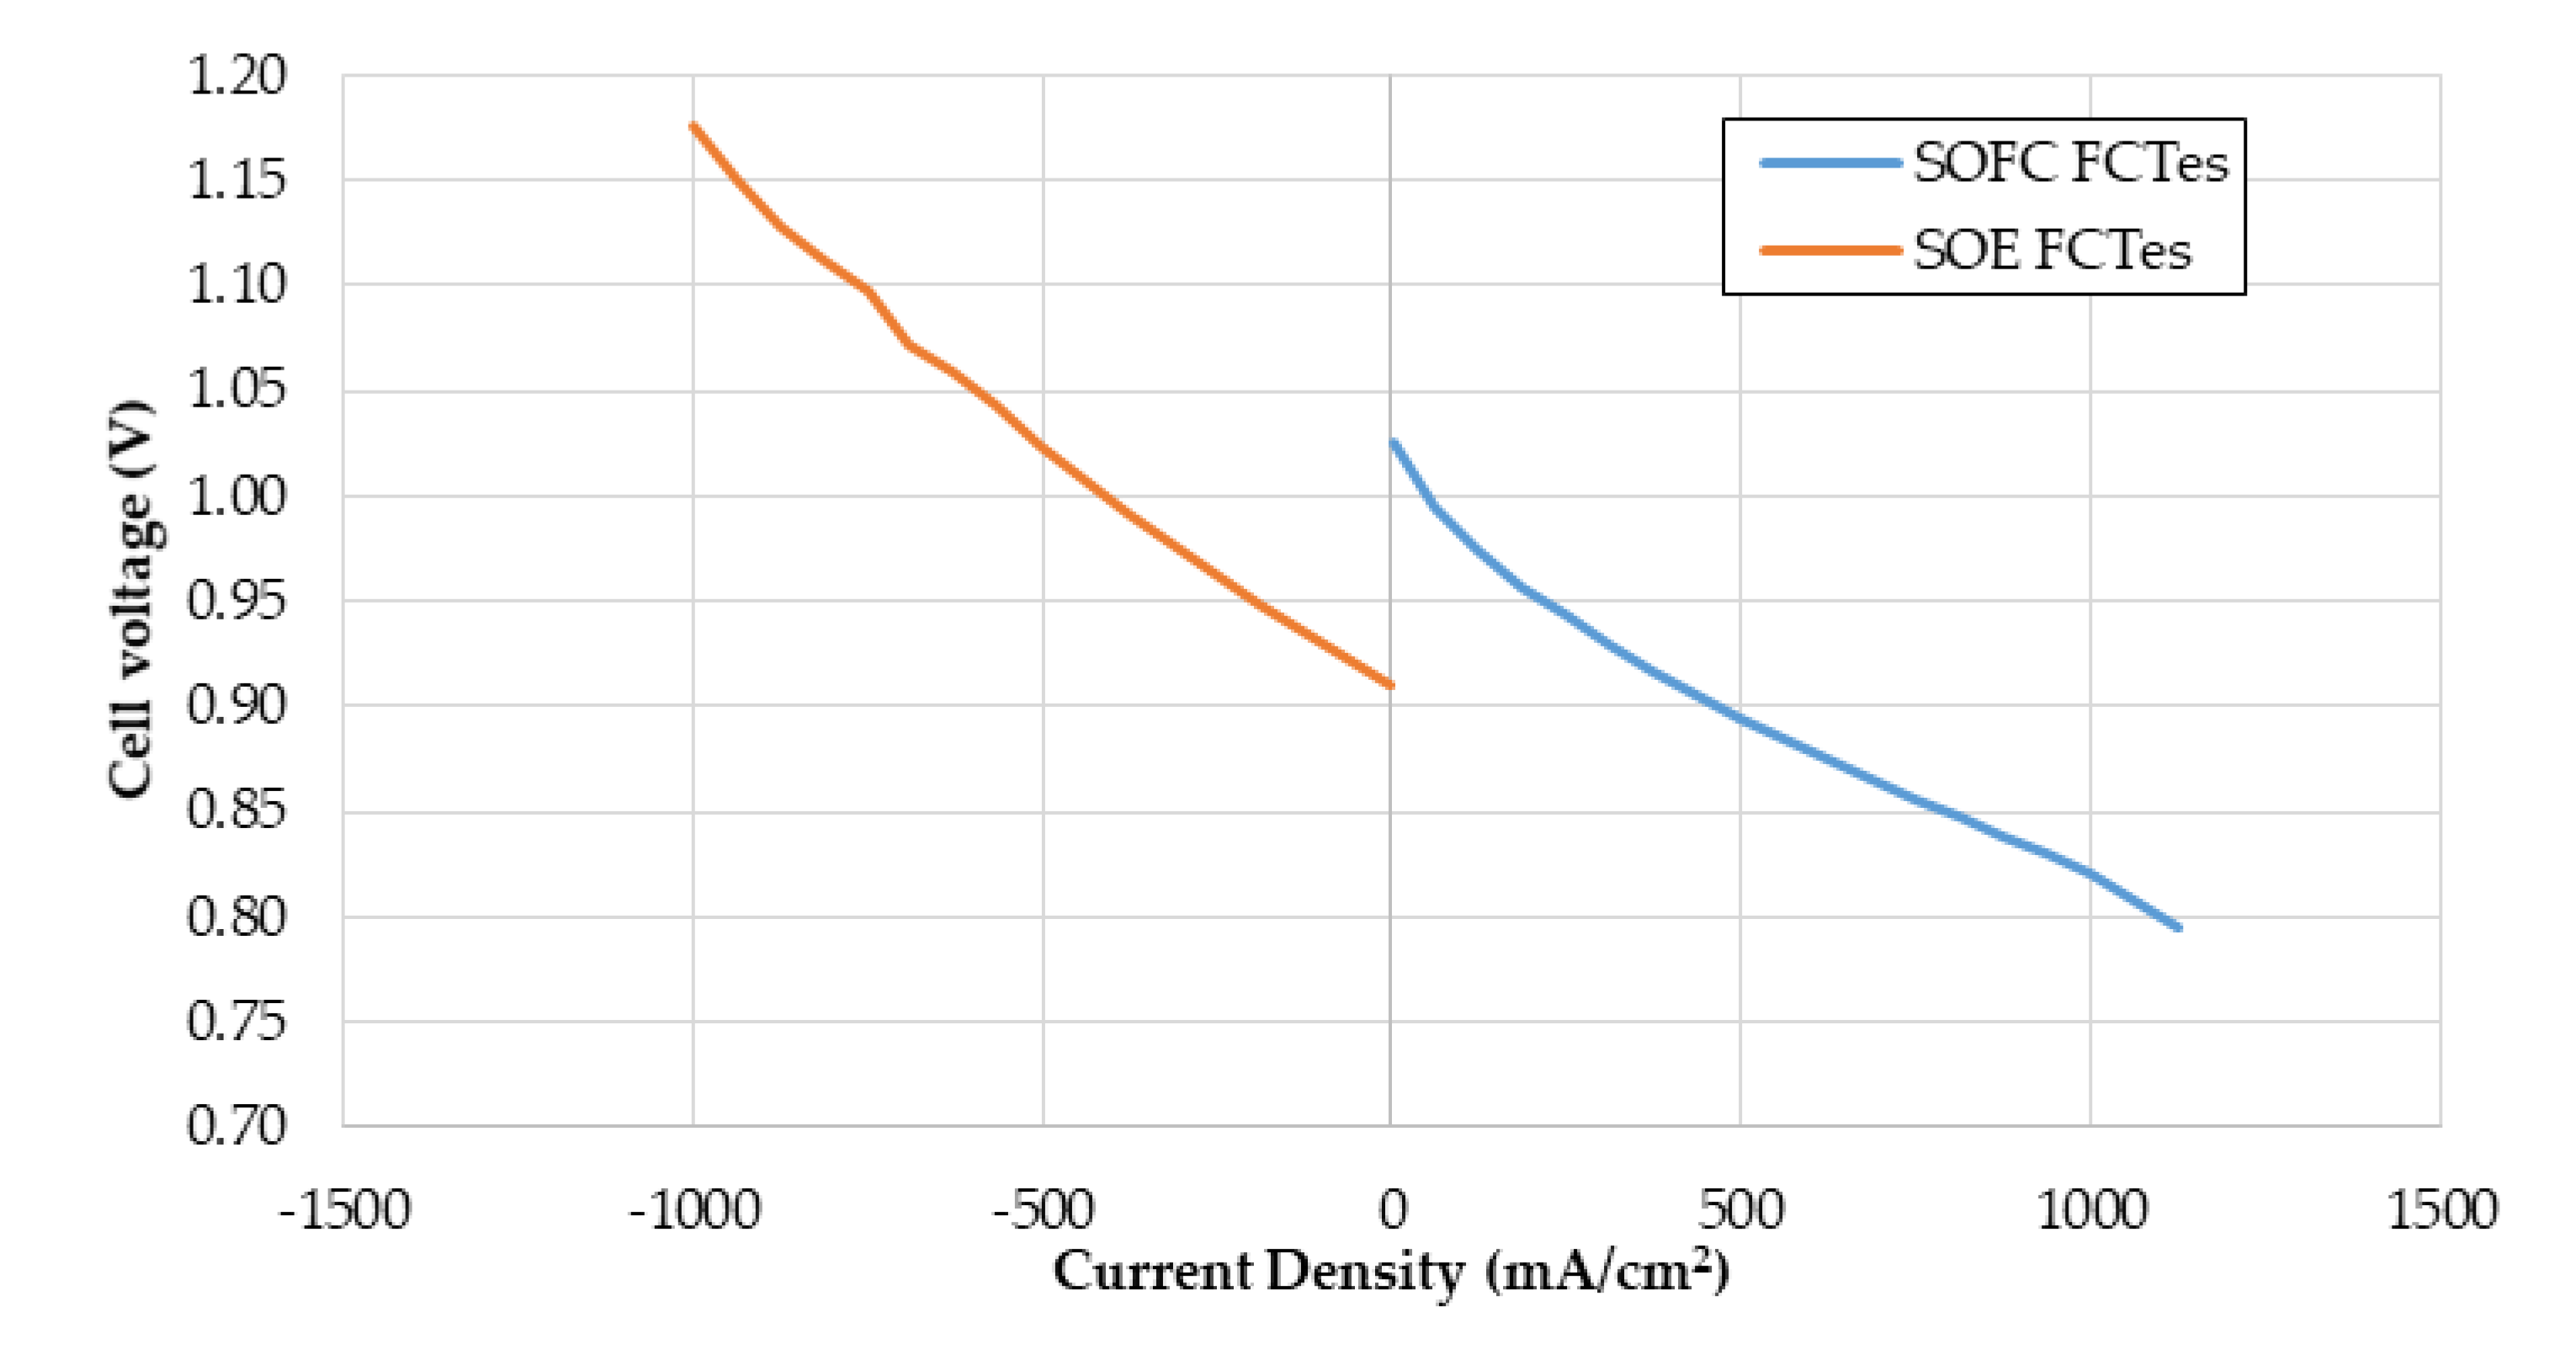
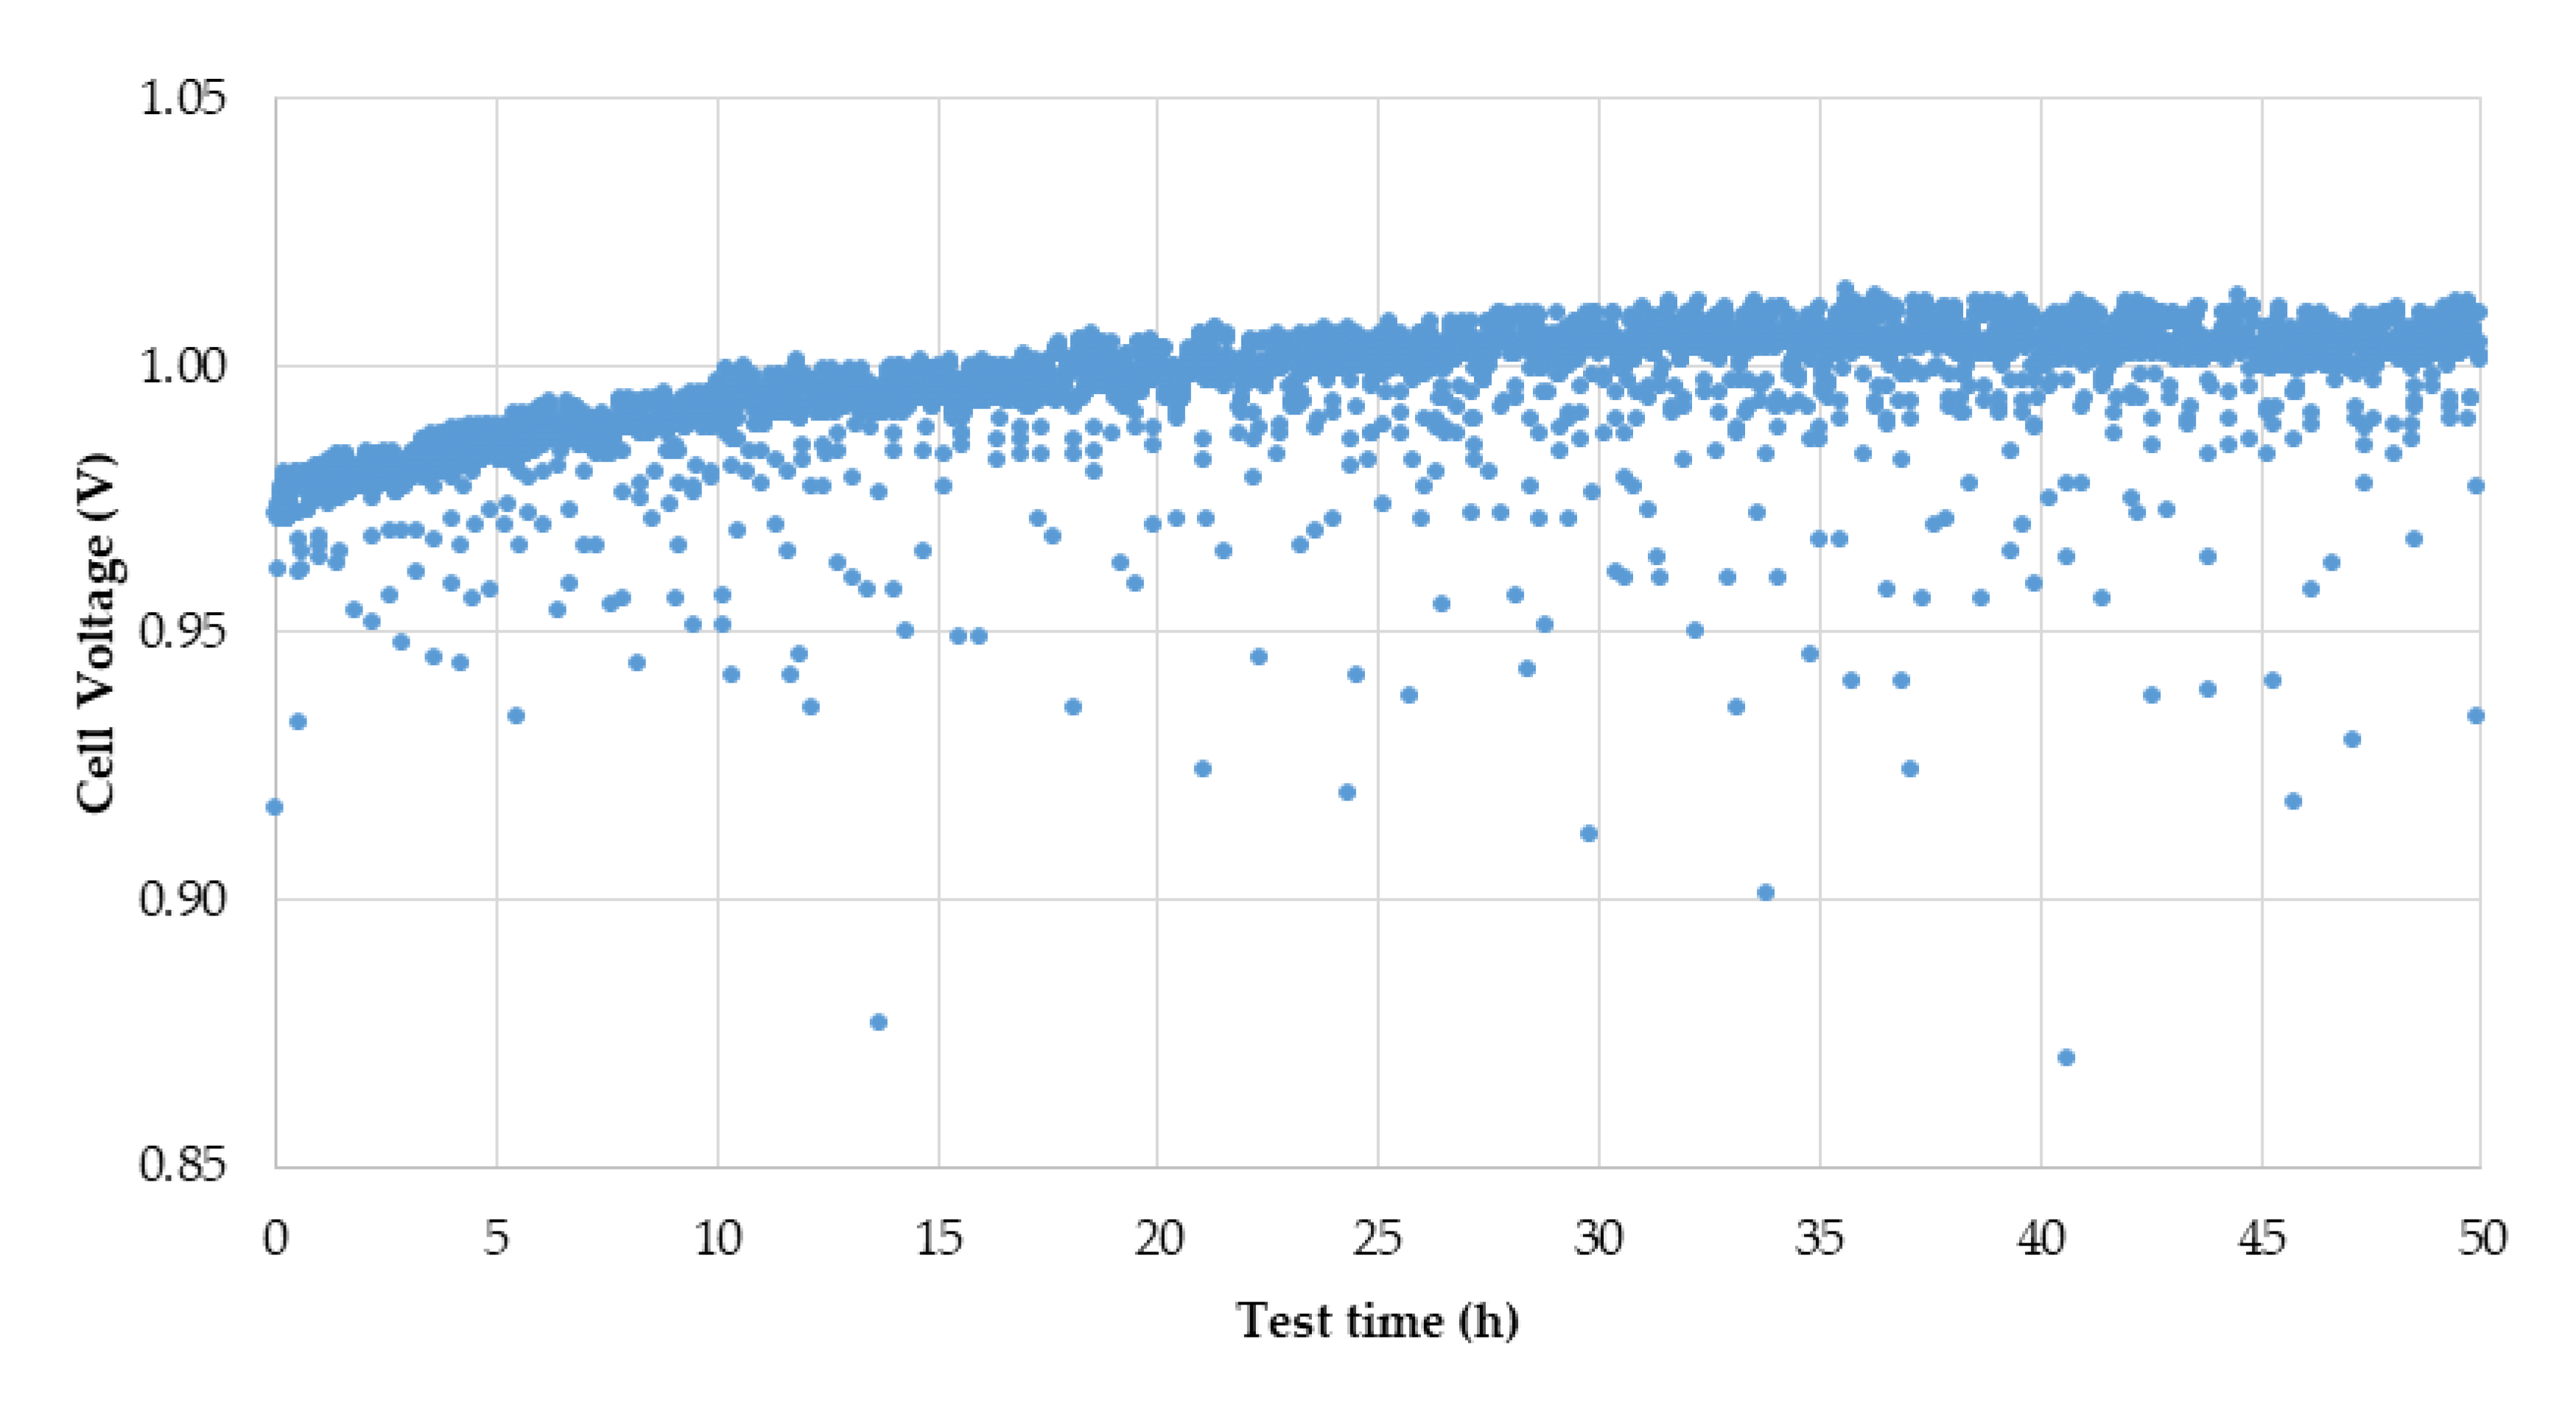
3.3. Experimental Results

Polarization test. Figure 3 shows the polarization performance of the cell at 800 °C, in both SOE and SOFC mode. The discontinuity of the curve at OCV (0 mA/cm2) reflects the change of inlet gas composition, from pure hydrogen to an equimolar mixture of hydrogen and water steam. The calculated area-specific resistance at 500 mA/cm2 is 174.13 and 287.04 mΩcm2, in SOFC and SOE mode respectively. This finds agreement with tests in the literature on the same cell type [27,28].
Constant-current electrolysis test: The cell showed good performances at the beginning of the test. Then, the cell voltage exhibited three distinct levels of degradation intensity, namely in the period between 0–10 h, 10–30 h, and 30–50 h, as reported in Figure 4 (the signal is slightly affected by noise and small oscillations due to the humidification system and its temperature controller). Degradation is visible at the beginning of the test, yet the cell voltage stabilizes after about 30 h. In the last time window (30–50 h), the degradation rate is approximately 10.58%1000 h. The trend is coherent with literature about SOE fed with pure water, which reports a strong degradation in the first 1000 h of test and a constant lower degradation in the rest of the cell life [23].
The degradation rate is relatively high, but after the first 30 h, the cell performance seems to stabilize. The presence of salt in the water did not lead to increased degradation.

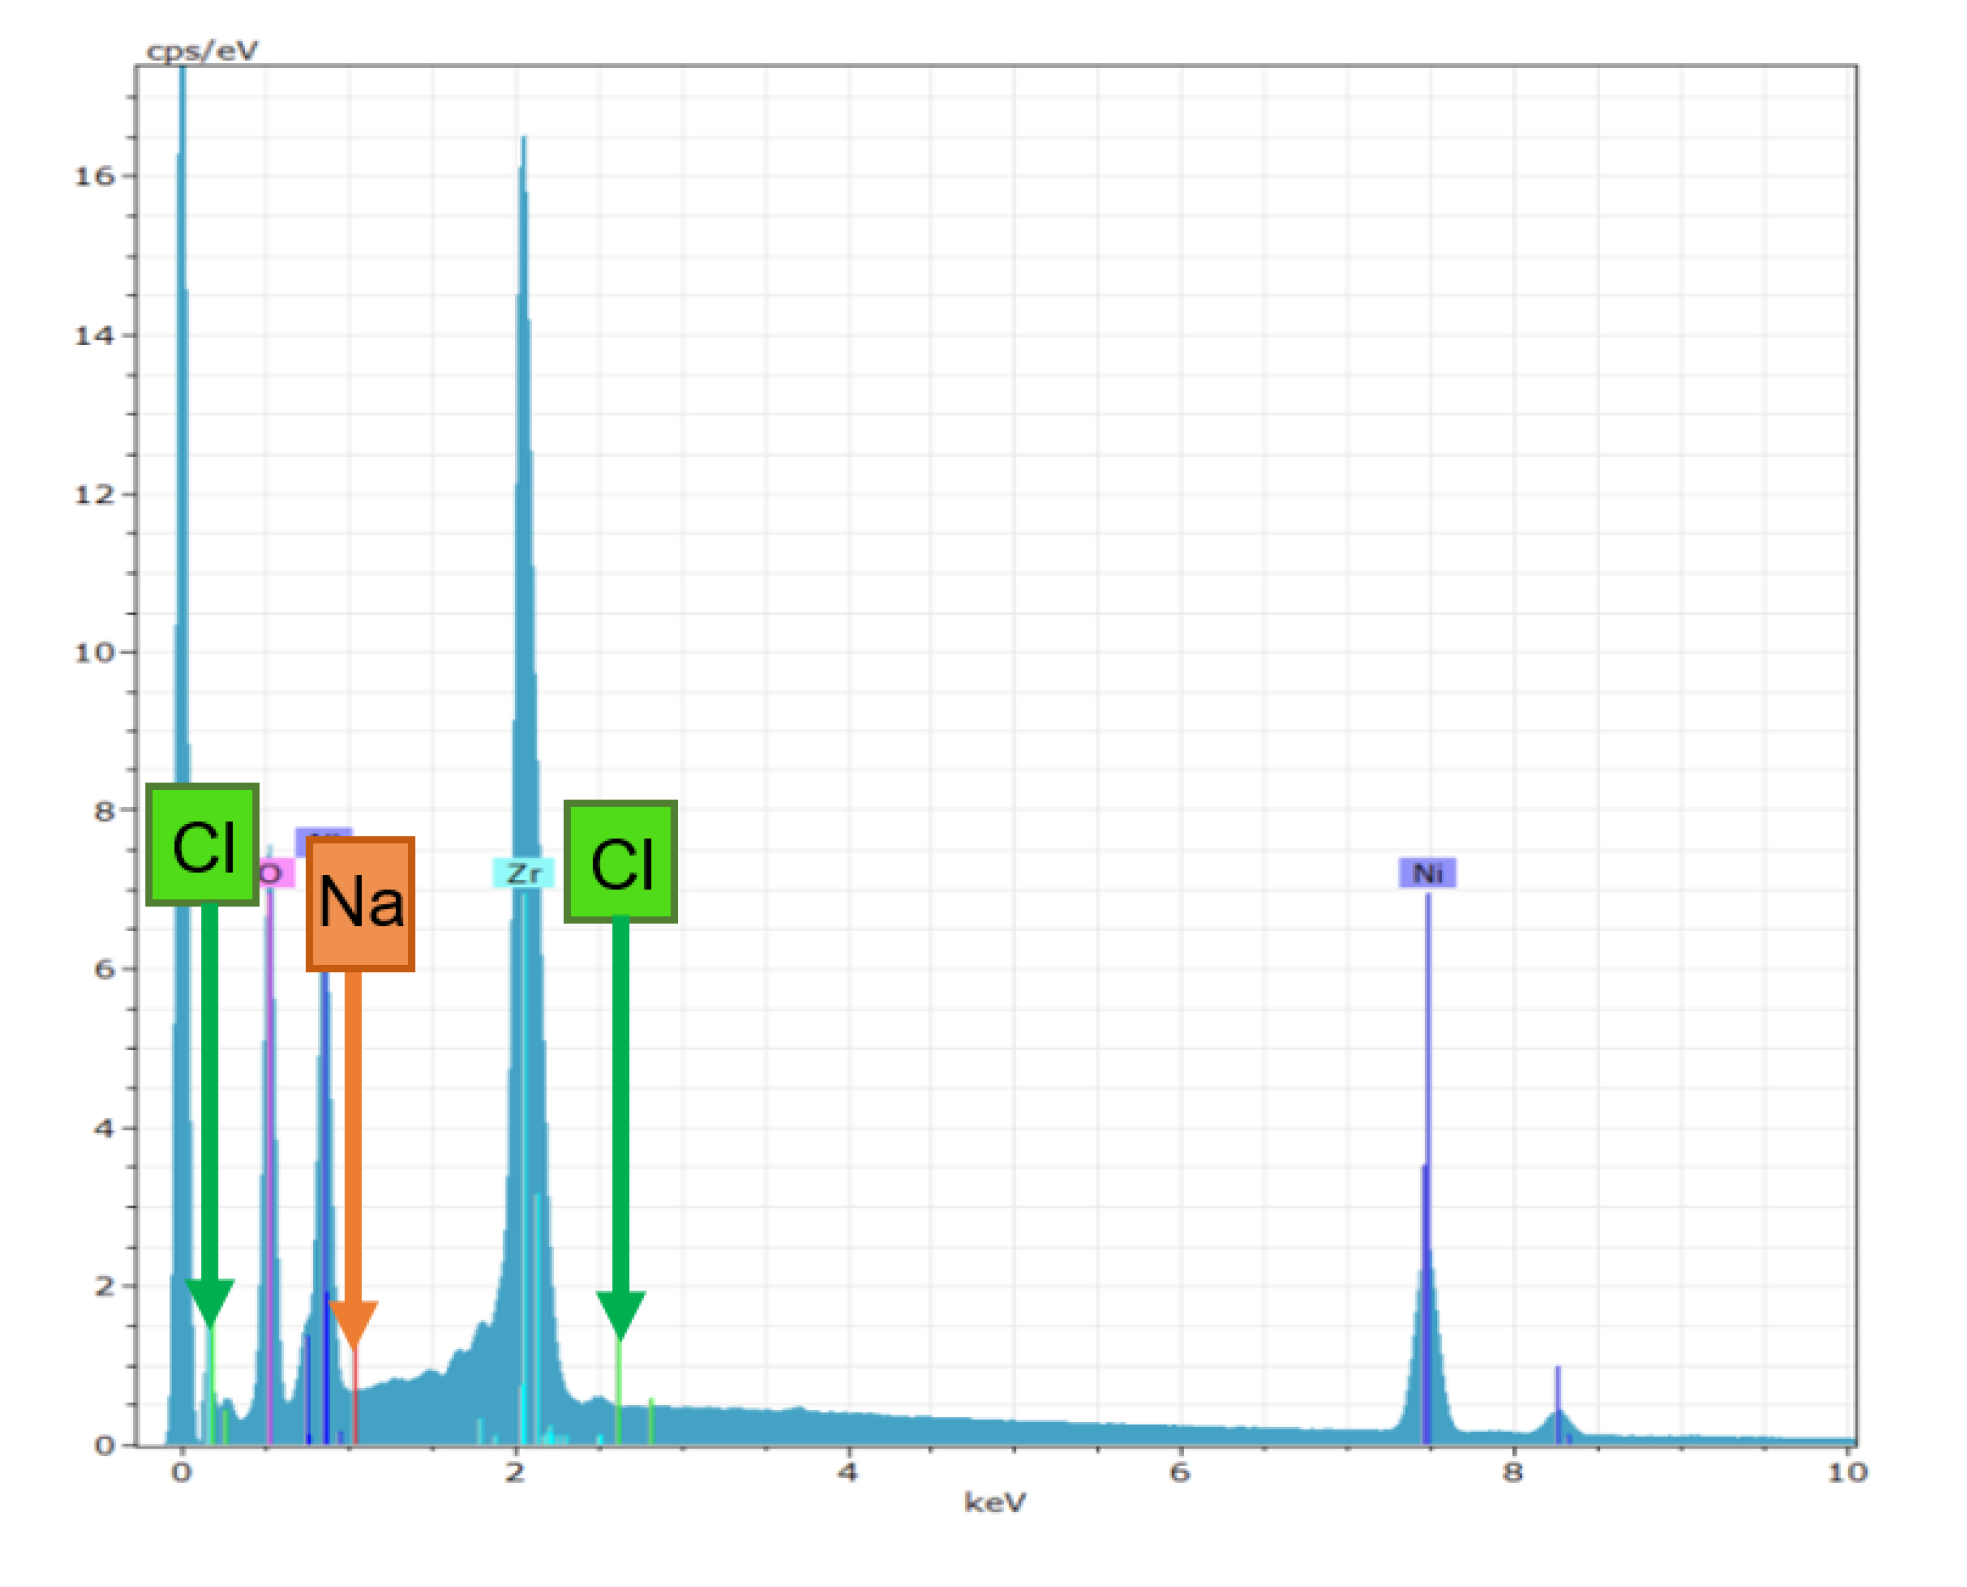
3.4. Post-Mortem Analysis

For ex-situ analyses, the cell surface is investigated by SEM/EDX. The test did not show the presence of Na and Cl, as reported in Figure 5. Then, exhaust water was condensed and analyzed to check for the presence of salt by AgNO3 test. The test confirmed the absence of salt. This is good in the outlook of a durable system operated with real seawater.

4. System Design: Model, Methods and Scenarios

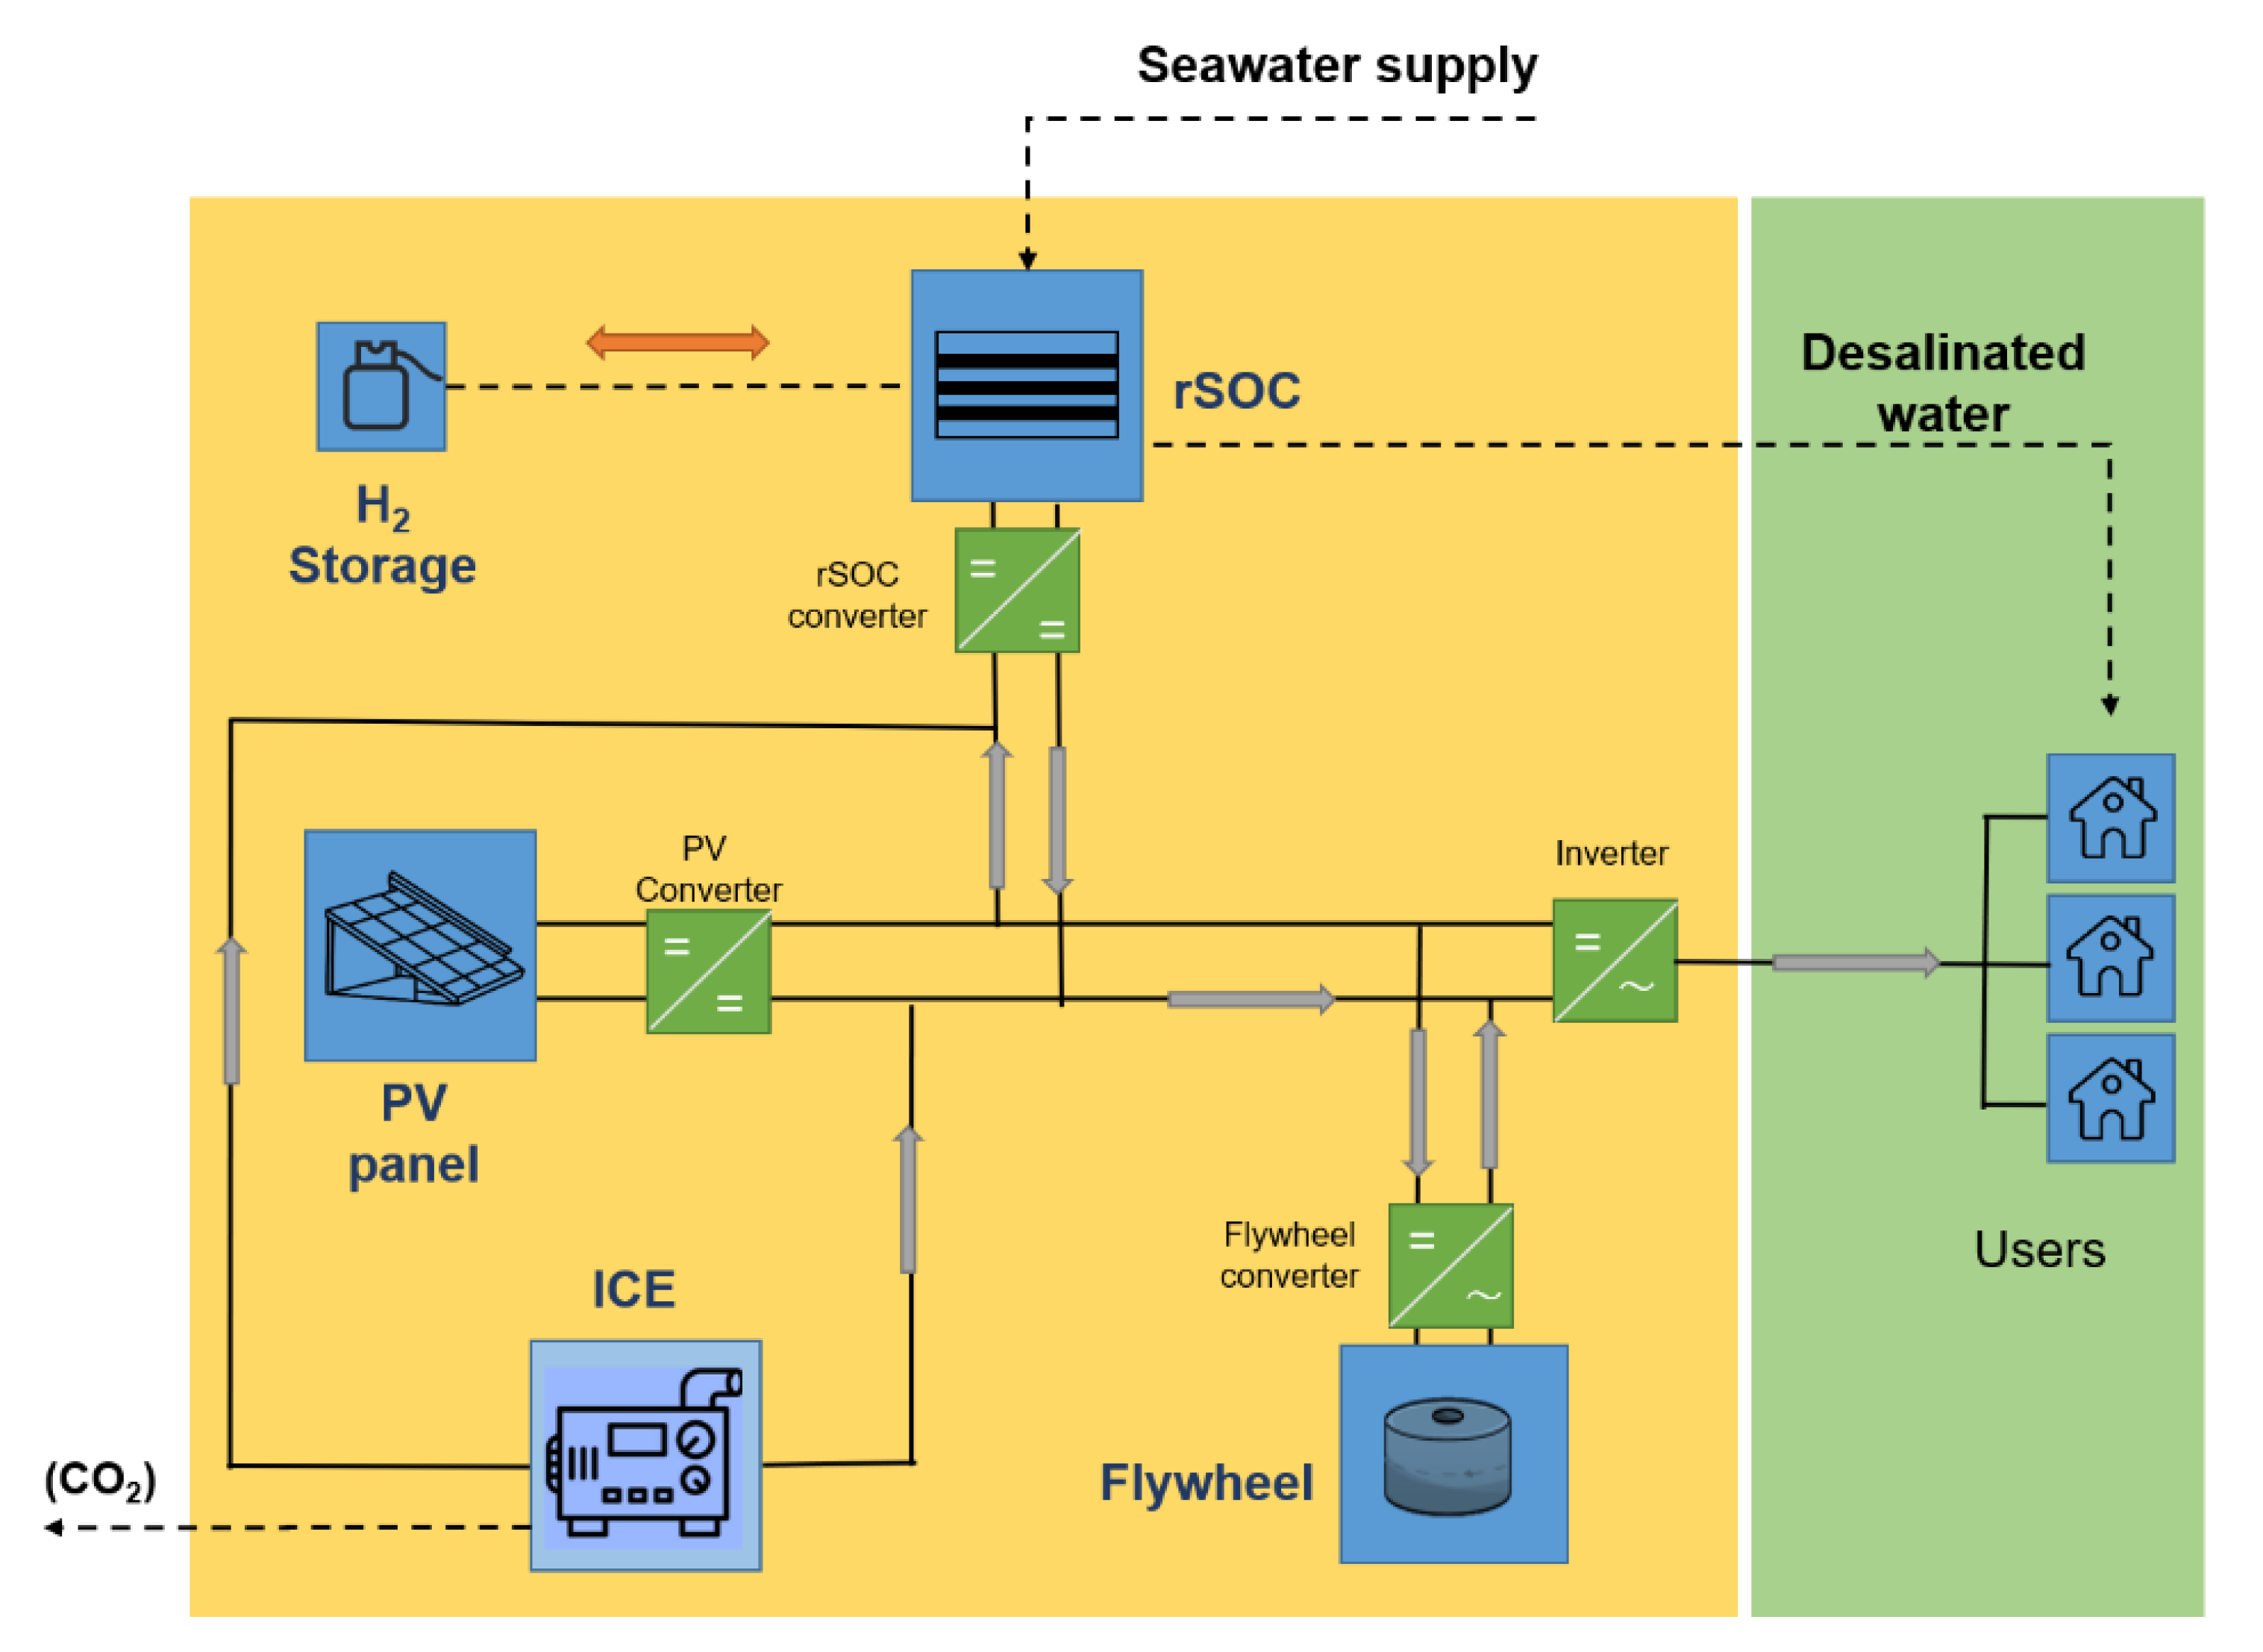
4.1. System Architecture

Figure 6 reports the conceptual scheme of the proposed architecture, where the main elements are: user loads, photovoltaic panels (PV), a bulk storage unit (rSOC + hydrogen tank), a fast-responding storage unit (flywheel) and an emergency internal combustion engine generator (ICE). The hydrogen tank is charged by the SOC unit operated as an electrolyzer.
The same rSOC, while operated as generator in the fuel cell mode, accomplishes the reverse process, from stored hydrogen back to electricity. This is the primary storage device, which provides most of the storage capacity in the Hybrid Energy Storage (HES). The flywheel is the auxiliary storage device and improves the regulation flexibility. It enables peak-shaving, providing/absorbing power peaks and reducing fluctuations of power from/to both rSOC and ICE. All the benefits ascribed to energy storage hybridization are described in a previous paper by the authors [29]. The system is off-grid, and the main components of the PV-HES subsystem are placed in parallel branches linked to a 650 V-DC bus through voltage inverters/converters. The choice of a DC bus connecting the PV panels and storage units enhances the quality of power transmission, reducing losses [30] and avoiding problems related to harmonics and reactive power [31]. Then, an inverter for power management is implemented to optimally meet the DC bus connection [32,33]. Despite DC/DC and AC/DC converters being reported in the conceptual scheme, their efficiencies are neglected in the model for the matter of simplicity. Component sizing is made according to the micro/mini-grid requirements. A case study is presented in the following sections, and sizing data are contextually reported. Then, the management tree is sketched in Figure 7. Energy flows from one component to another are controlled, considering: first, the availability of RES surplus; second the state of charge of each unit of the hybrid energy storage system (i.e., kinetic energy of the flywheel, hydrogen in the tank). Finally, in an off-grid system, backup power is supplied by the ICE and energy surplus exceeding the energy storage capacity is curtailed. The management logic is deeply commented afterwards.

4.2. Management Strategy

The control algorithm is designed on the following criteria: (i) operating the rSOC at constant power within every single charge/discharge phase, following the rule of the daily surplus, (ii) optimizing the utilization of self-produced energy, and (iii) thereby minimizing the integration from the auxiliary generator. The prioritization of the operating strategy is primarily based on the availability of energy surplus. The logic-trees in Figure 7 graphically describe this strategy. Every time the photovoltaic production exceeds the simultaneous load demand, an amount of energy can be potentially stored. The bulk storage charge (rSOC as SOE) is activated in the event of daily surplus ( Δ P V L + ). Otherwise, the hydrogen storage discharges energy to fill the negative gap between production and load (rSOC as SOFC). This happens regularly during night-time, but also when daily photovoltaic production is scarce compared to load. The contingent value of δPV-L might be: (i) positive, in agreement with the daily integral, or (ii) negative, as a result of a particular combination of photovoltaic production and load.
Moreover, δPV-L determines to what extent the flywheel regulation is required and, the need for the auxiliary generator intervention. Therefore, when, during daylight hours, δPV-L is positive, the system management strategy enters CASE S “Surplus of solar energy” (Figure 7a). Otherwise, when δPV-L is negative, the management strategy enters CASE L “Lack of solar energy” (Figure 7b). Secondly, the availability of the flywheel to compensate the energy gap—varying its rotational kinetic energy—is verified, allowing the selection between S1/S2 and L1/L2, respectively. Therefore, the contingent value of the flywheel angular speed is compared with lower ( ω l w r ) and upper ( ω u p r ) operating speed limits. Finally, the third condition that determines the specific operating rule embeds the charge limitations of the bulk energy storage unit (either full charge, or maximum depth of discharge). Complete depth of discharge and full state of charge of the capacity are singular events; therefore, these conditions are checked only after the primary selection criterion has been resolved. Similarly, the achievement of boundary angular speed for the flywheel is checked in inner loops of the control algorithm, to cut energy flows to/from the flywheel when needed.

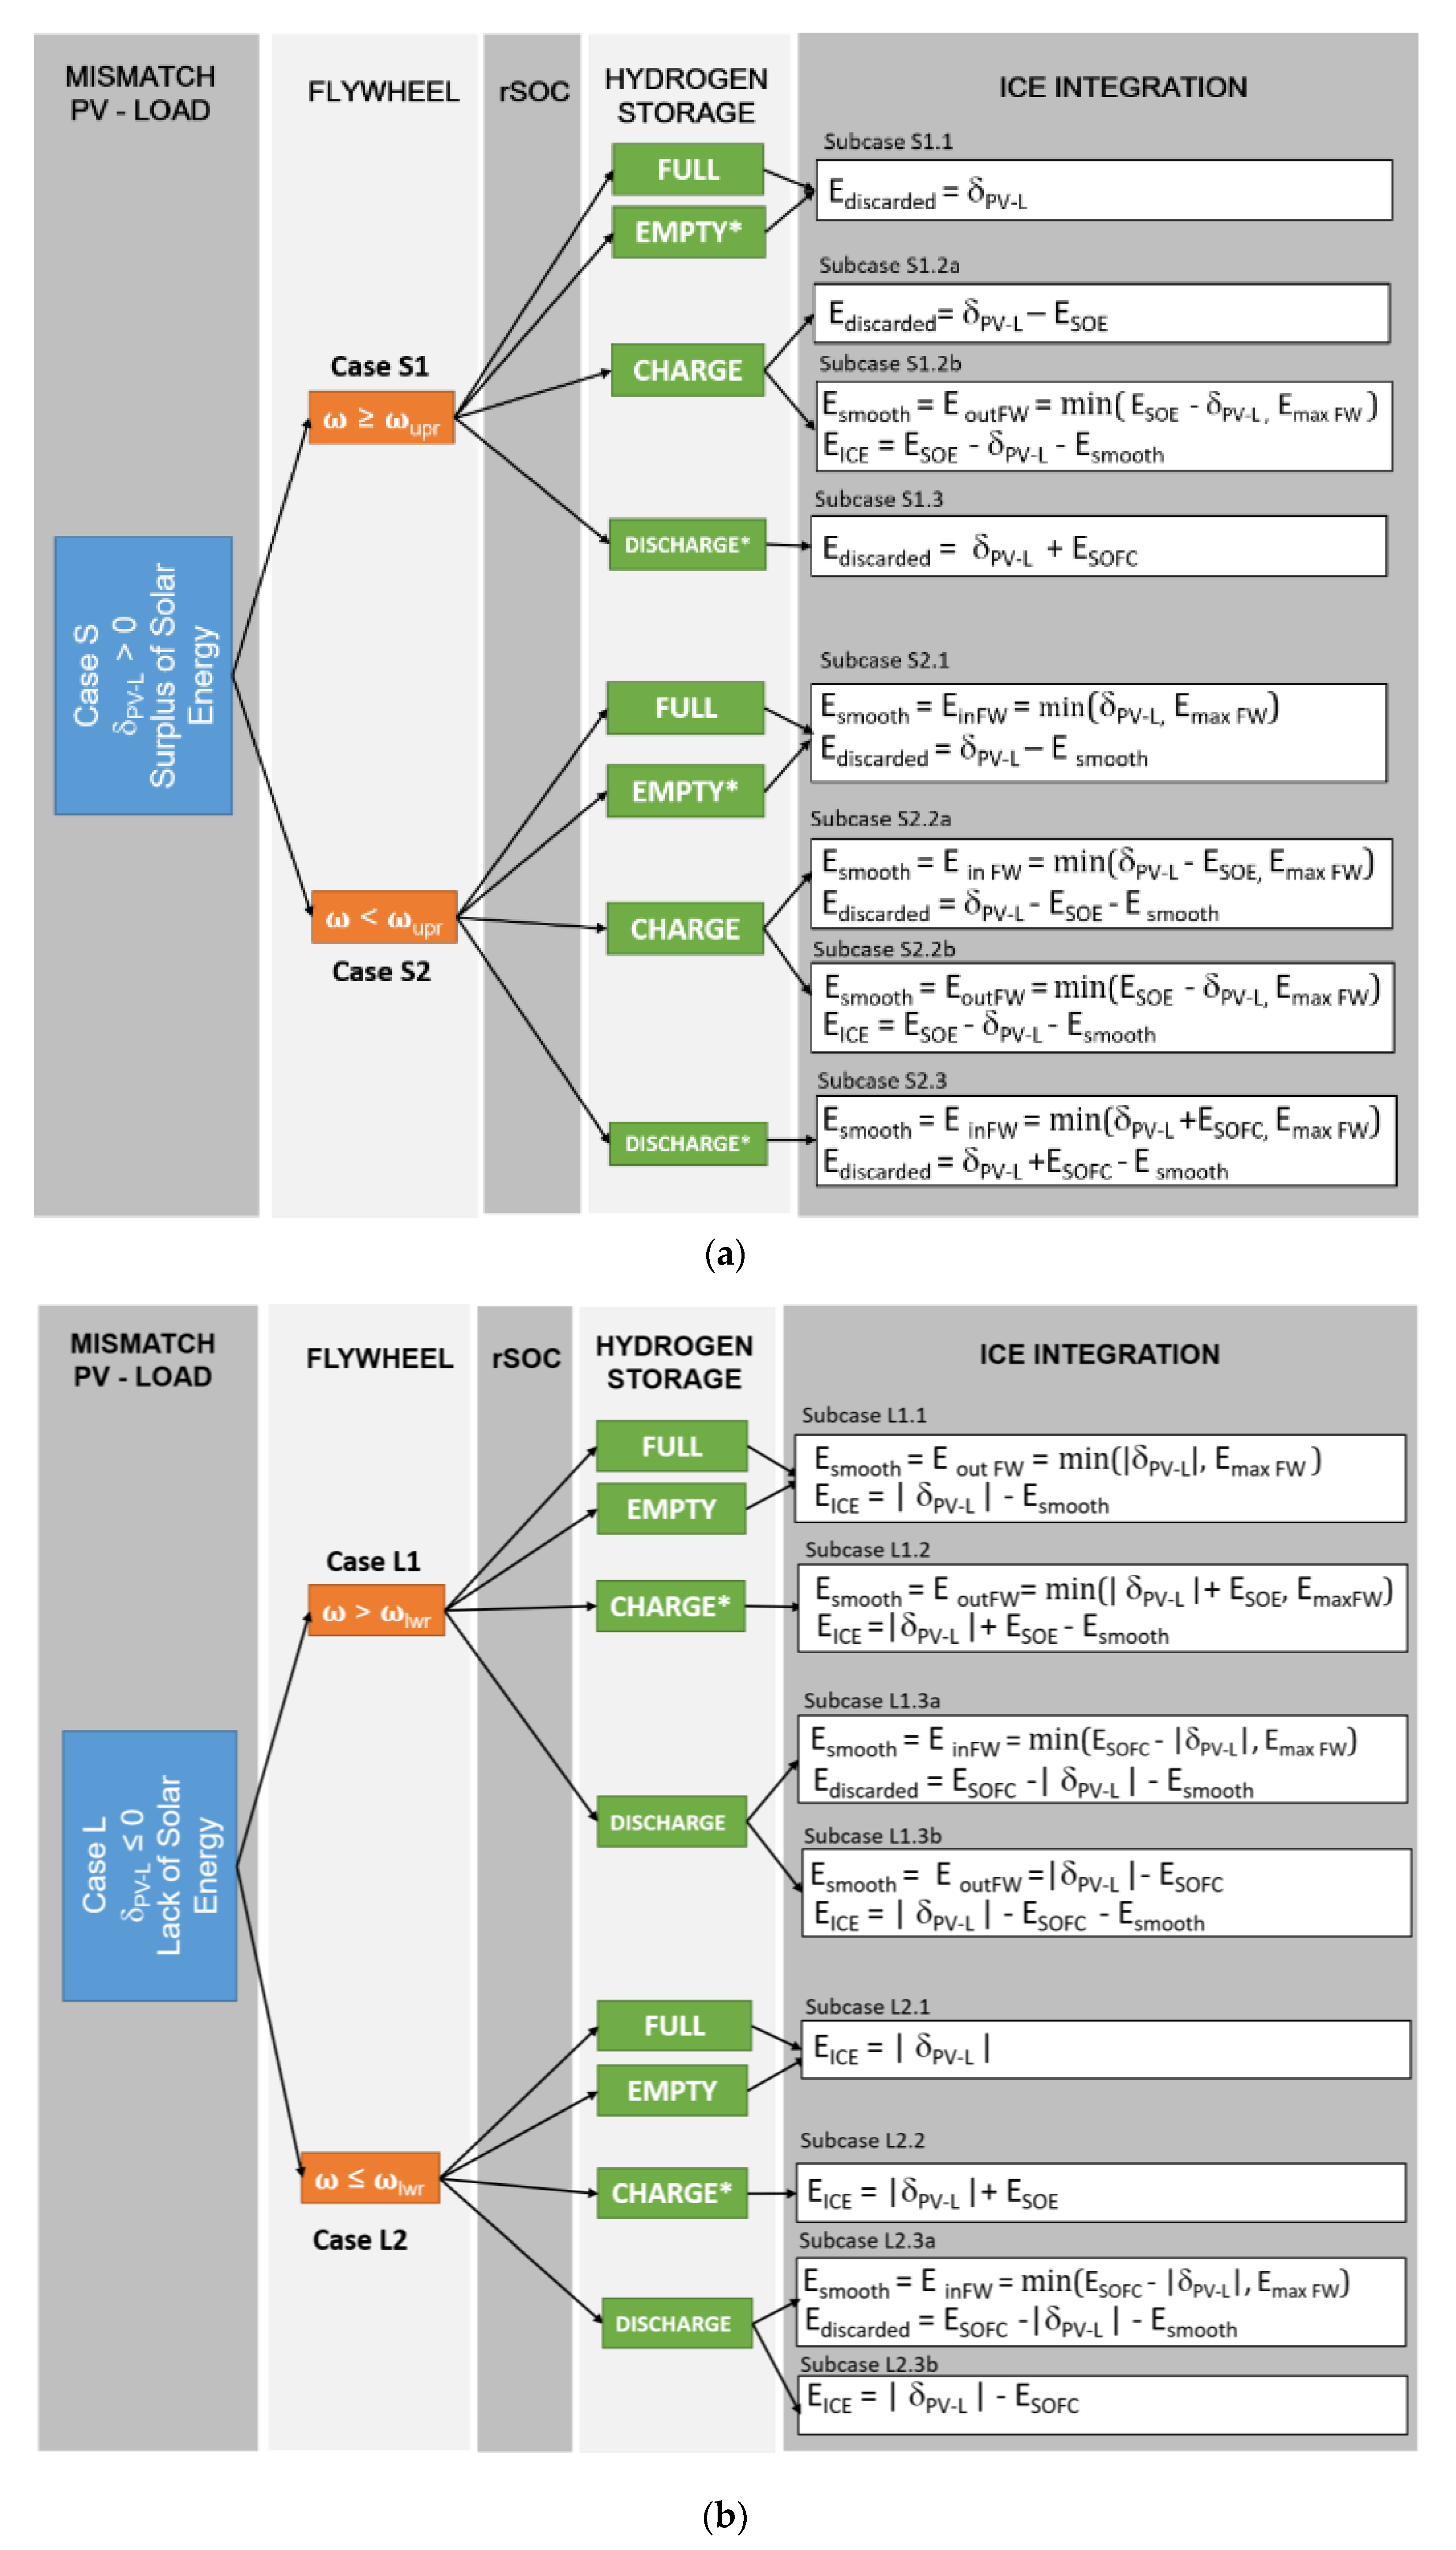
4.2.1. CASE S “Surplus of Solar Energy”

When δ PV L is positive, considering the SoC of the storage units, the system management proceeds as depicted in the flow diagram at Figure 7a and described hereinafter.

S1: ω = ωupr The Flywheel Is Fully Charged

The flywheel cannot be charged when its rotational speed has already reached the upper threshold ωupr. Therefore, the flywheel does not smooth the energy flows from/to the rSOC, and it is not able to reduce the contribution from the auxiliary generator.
  • Subcase S1.1 rSOC does not run
  • This happens either when daily surplus occurs ( Δ P V L + = Δ d a y l i g h t 0 ) and the hydrogen storage cannot be charged because it has reached maximum capacity (EH2=EH2,max), or when the daily integral of δ PV L is negative, but the rSOC cannot be run as a fuel cell because the hydrogen tank is empty. Consequently, the net surplus of energy is discarded.
  • Subcase S1.2 rSOC charges the hydrogen storage (electrolysis)
  • In days of energy surplus ( Δ P V L + = Δ d a y l i g h t 0 ), the rSOC runs in electrolysis.
    S1.2a:
    when rSOC requires less than δPV-L (reduced by the flywheel losses at ωupr), all energy required by the rSOC in electrolysis (ESOE) comes from the solar panel. The energy surplus exceeding electrolysis demand is discarded.
    S1.2b:
    whereas rSOC requires more energy than δ PV L , the entire instantaneous energy surplus is fed to the rSOC. Besides, an integration from the auxiliary generator is necessary to satisfy the power profile superimposed by the rSOC management. The flywheel is fully charged and is able to release energy to the rSOC according to its maximum capacity and power, reducing the participation from the auxiliary generator.
  • Subcase S1.3 rSOC discharges energy from the hydrogen storage (fuel cell)
  • Subcase S1.3 occurs in days of lack of surplus: when δ PV L is positive, the bulk storage is not charged, and the rSOC just runs as fuel cell. Hence, the energy produced by the rSOC (ESOFC), minus the flywheel losses, is discarded. The flywheel is idle.

S2: ω < ωupr the Flywheel Can Be Charged

The flywheel can be charged; therefore, it can perform its smoothing function both as energy acceptor and as energy generator. This lowers the power output from the auxiliary generator.
  • Subcase S2.1 rSOC does not run
  • As explained in Subcase S1.1, rSOC does not run in two different circumstances. However, the flywheel absorbs the instantaneous energy surplus. The energy exceeding the flywheel charging capability (either the maximum capacity or the maximum flywheel power) is discarded.
  • Subcase S2.2 rSOC charges the hydrogen storage (electrolysis, smoothed)
  • Electrolysis has priority with regard to the flywheel. Hence, the flywheel smooths the participation of the auxiliary generator and subcases are managed as it follows:
    S2.2a:
    instantaneously δPV-L exceeds rSOC demand; thus, the leftover is absorbed by the flywheel. If the flywheel maximum capacity/motor power is reached, energy is discarded.
    S2.2b:
    δPV-L is not enough to satisfy rSOC energy demand to sustain electrolysis. To fill the gap, the flywheel decelerates, transferring energy to the rSOC. However, either if the flywheel is discharged until ωlwr or if the maximum motor power is reached, the ICE provides energy.
  • Subcase S2.3 rSOC discharges energy from the hydrogen storage (fuel cell, smoothed)
  • Similarly to subcase S1.3, the hydrogen storage is not charged, and the rSOC runs as fuel cell in agreement to the daily power profile (ESOFC). Nevertheless, before discarding energy not required by the load, the flywheel is charged and smooths energy profiles according to its capacity/power limitations (see also S2.1 and S2.2). Finally, only if the flywheel limits are reached, some energy is discarded. When the flywheel angular speed is below ωlwr, the flywheel cannot participate until it is charged over ωlwr. This happens only when δ PV L is positive and beyond rSOC requirements.

4.2.2. CASE L “Lack of Solar Energy”

When the PV production does not cover load demand (or it is merely zero), the bulk energy storage supplies electricity to the load. The flywheel shaves peaks and reduces the dependency from the auxiliary generator. Figure 7b schematizes the detailed management logic.

L1: ω > ωlwr The flywheel Releases and Absorbs Energy

The flywheel is able to work, hence reducing the participation of the auxiliary generator.
  • Subcase L1.1 rSOC is deactivated
  • This circumstance may arise: (i) during days with a positive cumulated surplus of energy ( Δ P V L + = Δ d a y l i g h t 0 ), in conjunction with an instantaneous negative value of δ PV L , when either the hydrogen tank is already full (EH2=EH2,max), or the rSOC cannot be operated as a fuel cell for the power profile superimposed; (ii) during days with a negative integral of δ PV L during daylight hours ( Δ P V L , d a y l i g h t = Δ d a y l i g h t 0 ), when the rSOC cannot run in fuel cell mode since the hydrogen tank is empty. Thus, load demand exceeding the PV production is satisfied by the flywheel, which decelerates until its capacity/power limitations are reached. If the flywheel contribution is not sufficient, the auxiliary generator provides the residual part.
  • Subcase L1.2 rSOC charges hydrogen storage (electrolysis, smoothed)
  • This is possible in periods of energy surplus ( Δ P V L + = Δ d a y l i g h t 0 ), when the rSOC works as an electrolyzer, according to the given power profile. The intervention of the flywheel solves temporary negative gap between production and load, at least partially. The flywheel decelerates and, only if ωlwr or the flywheel maximum generator power are reached, the auxiliary generator provides energy (in this event, electrolysis worsens the energy balance of the system).
  • Subcase L1.3 rSOC discharges energy (fuel cell, smoothed)
  • rSOC is operated as fuel cell, at the given power profile. According to the gap between the energy supplied by the rSOC (ESOFC) and ΔPV-L, the following instances may occur:
    L1.3a:
    ESOFC is greater than |ΔPV-L|, then the leftover is used to accelerate the flywheel, within the limitation imposed by ωupr/maximum motor power. Eventually, the excess is discarded.
    L1.3b:
    ESOFC is lower than |ΔPV-L|. Firstly, the flywheel decelerates until its maximum capacity/generator power limits, and it transfers energy to the load. Whether the flywheel and the fuel cell entirely balance|ΔPV-L|, there is no participation of the auxiliary generator. Conversely, the auxiliary generator closes the energy balance and fill up the load demand.
When the net rSOC energy output perfectly balances load demand exceeding the PV production, neither the flywheel nor the auxiliary generator participates.

L2: ω < ωlwr The Flywheel Is Not Able to Supply Energy

The flywheel is not able to take part in the energy balance of the system as a generator, yet it can be charged. Hence, its smoothing performances are partial.
  • Subcase L2.1 rSOC is deactivated
  • Likewise, subcase L1.1; this happens either in days with a cumulated surplus of energy when both δ PV L is negative and the hydrogen tank is fully charged, or in periods of lack of cumulate energy surplus, when the rSOC cannot run in fuel cell mode since the hydrogen storage tank is empty. Because of the low speed of the flywheel operability speed (<ωlwr), load demand exceeding the PV production is satisfied by the ICE alone. The flywheel is idle.
  • Subcase L2.2 rSOC charges hydrogen storage (electrolysis)
  • L2.2 is similar to L1.2, but without the flywheel smoothing action. Therefore, the energy debt introduced by electrolysis is not mitigated. The energy required to run the rSOC in electrolysis is filled with the auxiliary generator. The flywheel is idle until it completely decelerates.
  • Subcase L2.3 rSOC discharges energy
  • This partially returns to subcase L1.3. The flywheel is charged if the rSOC releases more energy than required. However, when the rSOC does not supply enough energy to fill the Δ PV L   gap, the flywheel is not charged, and only the auxiliary generator closes the energy balance.

4.3. Simulation Methodology and Performance Indicators

The mini-grid simulation is carried out with a Matlab model developed in-house, which performs energy balance calculations with a 1-min time resolution. All energy balances are referred to the same simulation timespan. For the sake of simplicity and to be allowed to neglect performance decay rates, simulations are carried out over the time of one solar year. This is claime as sufficient to highlight all possible critical events arising from the annual variation of the solar cycle. Whereas this approach is generic regarding the solar source features (climate zone and geo-spatial coordinates), it is more than recommended for temperate climate zone where the annual solar cycle is affected by seasonality.

4.3.1. Dimensional Parameters

The simulation results are presented with regard to dimensionless indexes expressing the size of the main components of the plant and, in some cases, regulation threshold power. PV generator peak power (Pp,PV) varies as a function of the desired RES surplus ( σ P V , Equation (1)), giving a measure of the excess RES production compared to the overall user load in the timeframe of analysis. Then, the ratio Π F W stands for the relative flywheel maximum motor/brake power (normalized Pp,PV, Equation (2)) and Δ S O E is the electrolysis activation power, calculated as the ratio between the PV actual power versus PV peak power (Equation (3)). It defines the minimum power needed at the PV to trigger the electrolysis process. Finally, the time coefficient τ E H 2 is defined as in Equation (4) and represents the average discharge duration of the bulk storage full capacity (EH2) at the rate of the average load power ( P a v g , L ) .
σ P V = ( E P V   t h E L ) E L
Π F W = P m a x , F W P P , P V
Δ S O E = P P V P P , P V
τ E H 2 = E H 2 P a v g , L

4.3.2. Performance Indicators

The energy and environmental performances of the system are measured with few dimensionless parameters, which can be correlated to the sizing indexes presented hereinabove. The energy performance indicators here defined are:
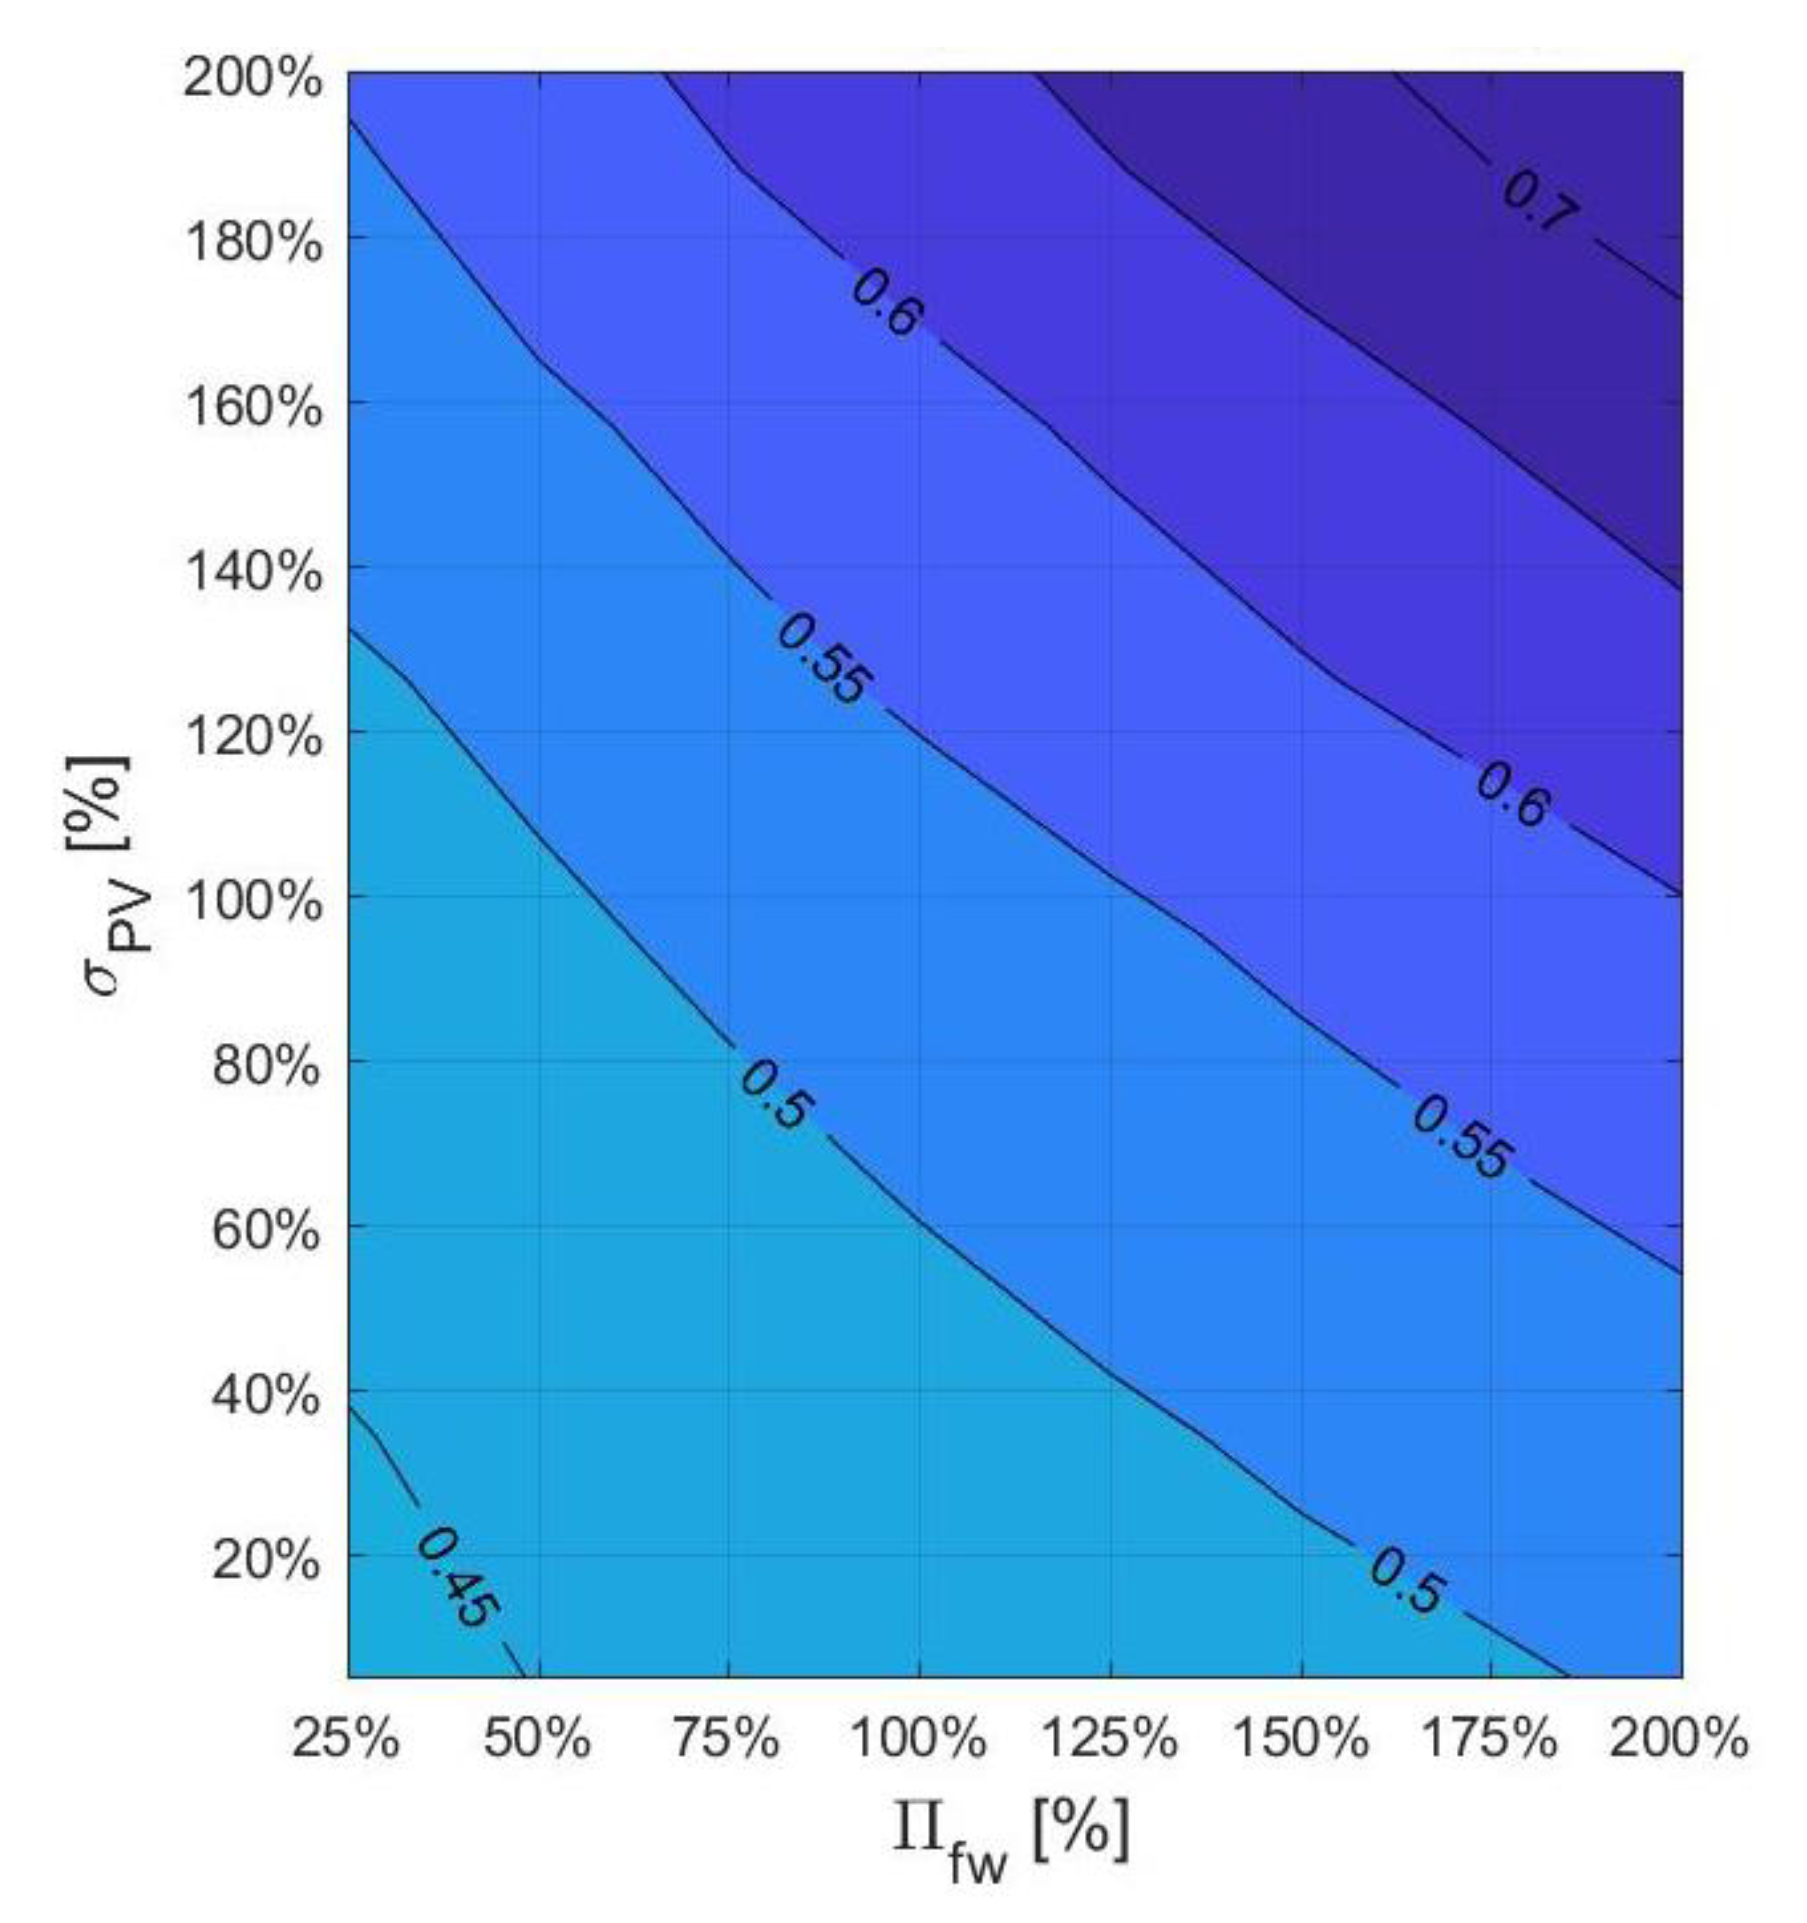
  • the renewable energy self-consumption efficiency ( α P V —Equation (5)): it represents a portion of the renewable electricity produced in the mini-grid, which is usefully employed within the same system. When the prime RES generator is a PV plant, it is complementary to the PV curtailment;
  • the renewable energy consumption ratio ( α L —Equation (6)): it is a measure of renewable energy penetration. Thus, it represents to what extent the load is covered by renewable power generated within the mini-grid;
  • the load satisfaction rate ( χ L —Equation (7)): it is a measure of energy security in the mini-grid, and it becomes particularly relevant for islanded operation. It accounts for the share of the total load demand covered by the energy supply provided by the mini-grid generators and the storage units. It is non-unitary while power and capacity limitations are encountered;
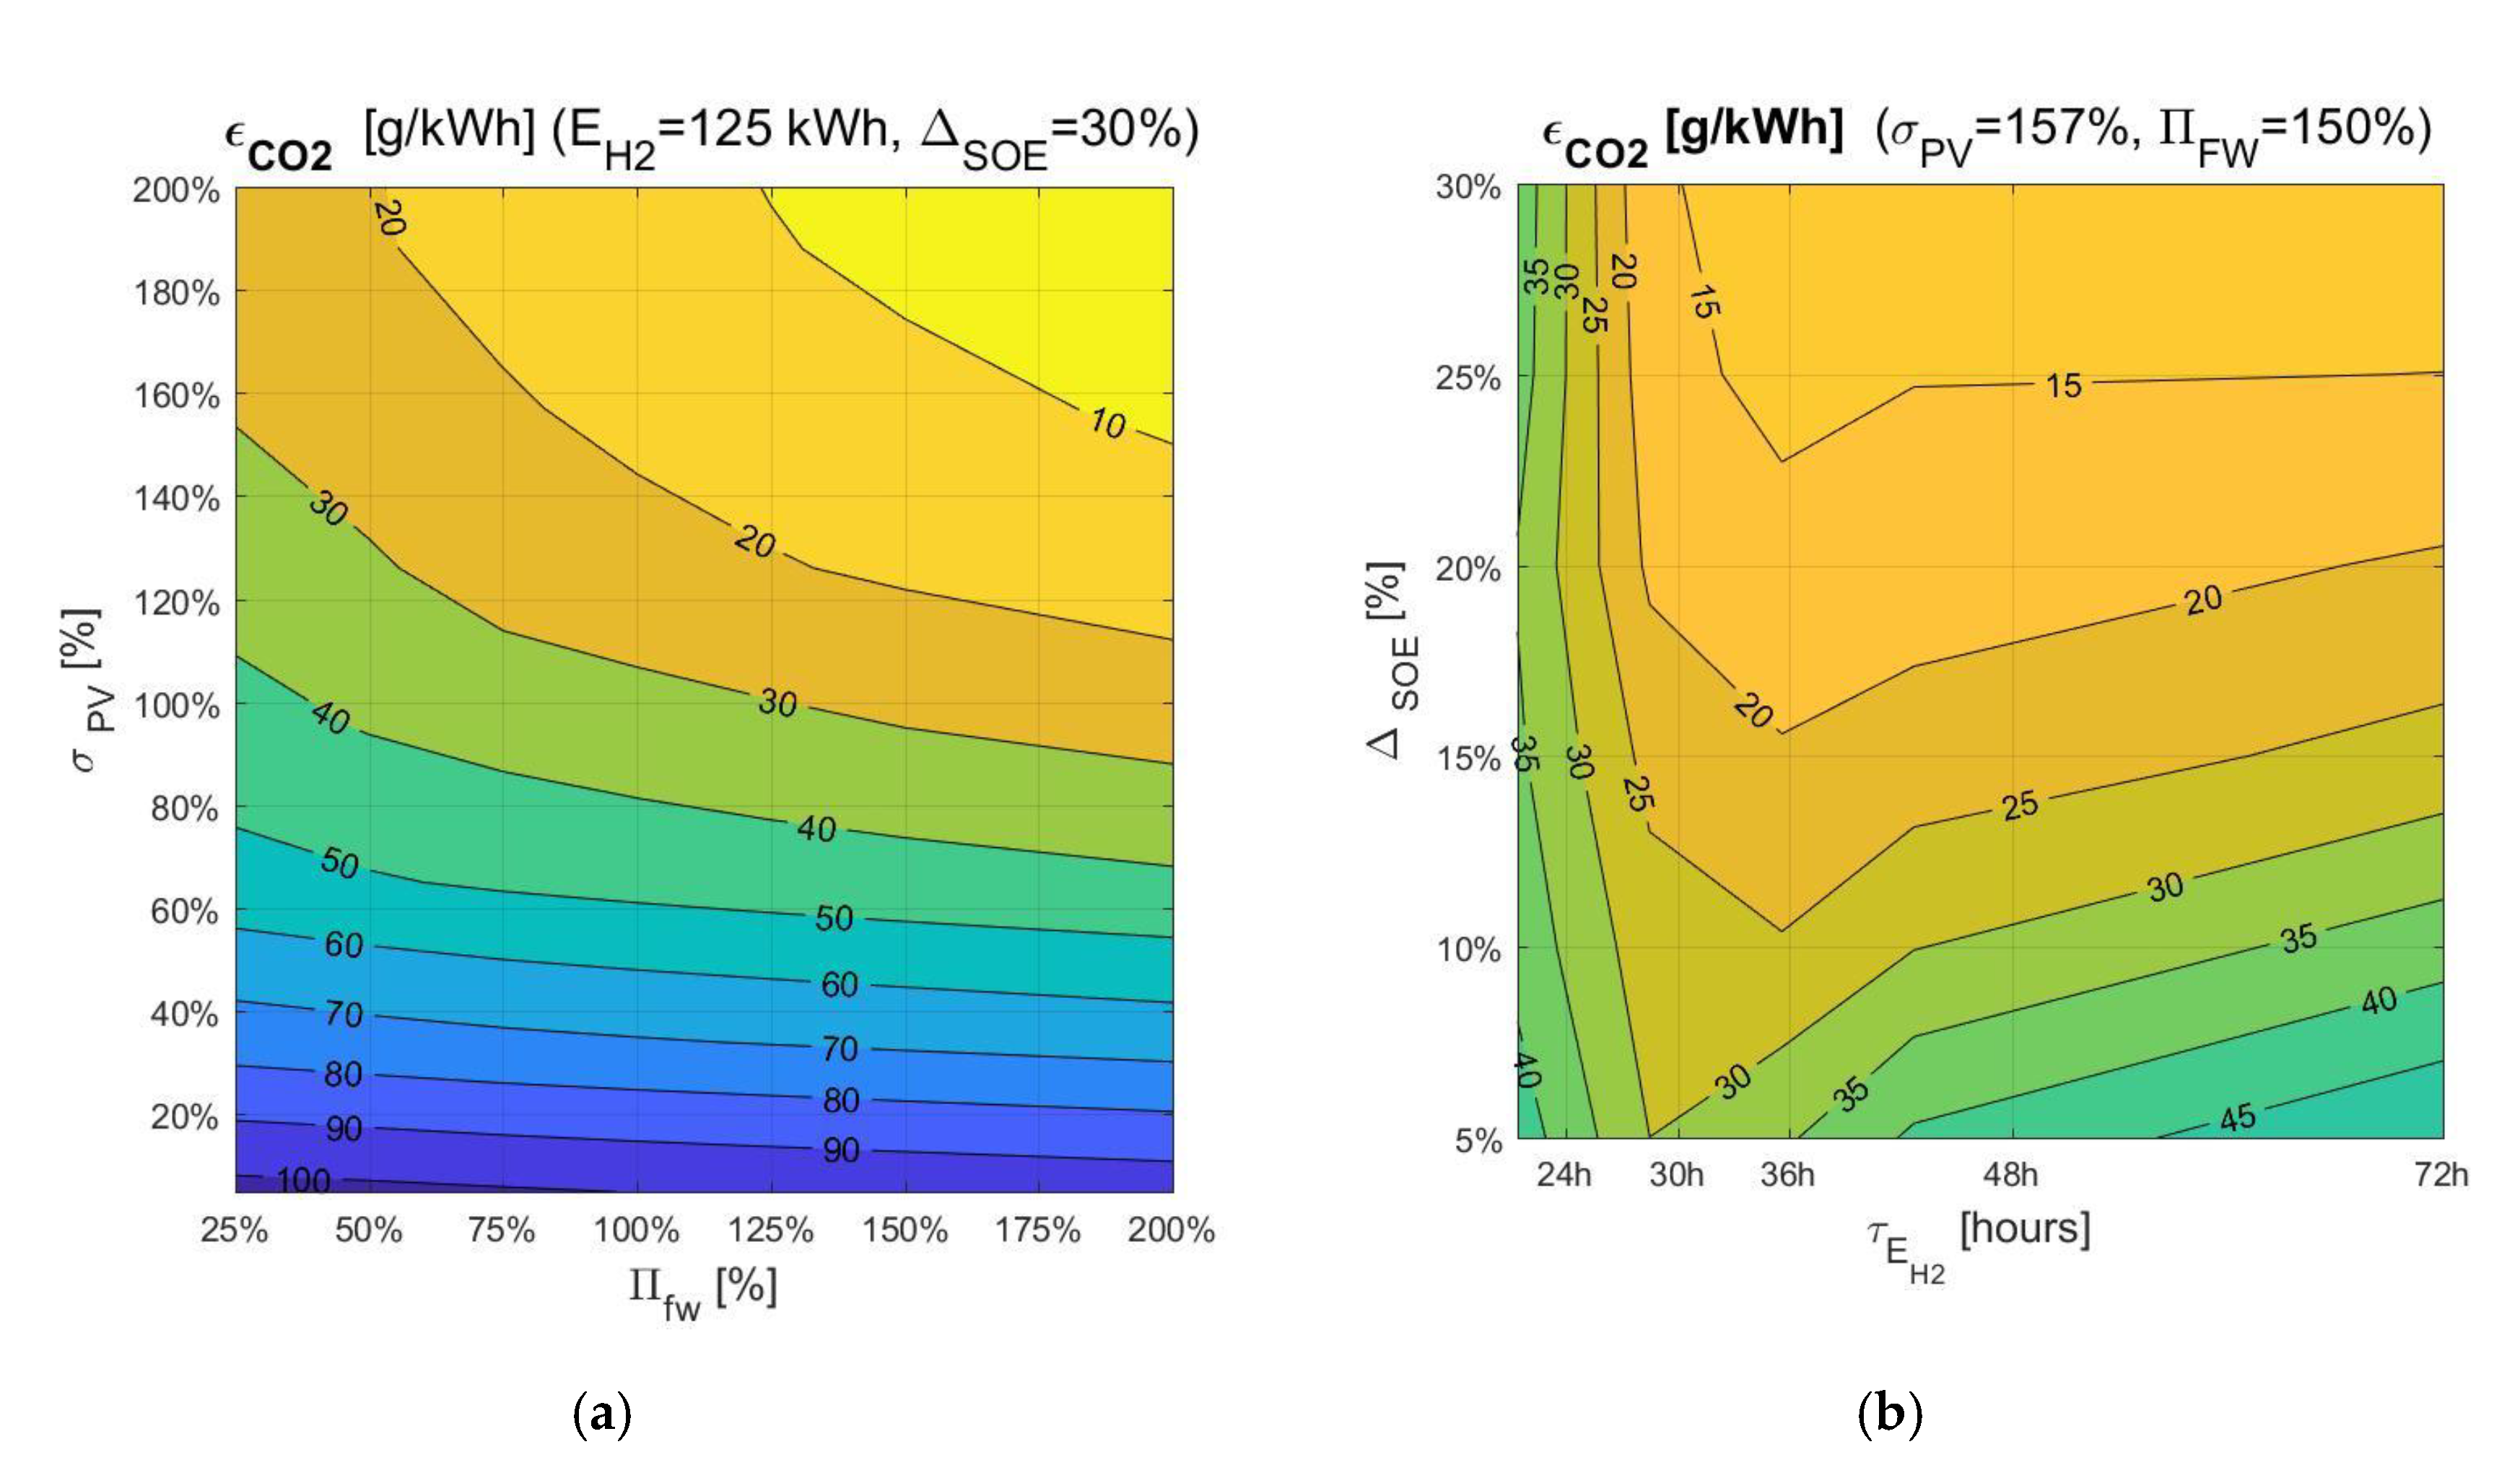
  • the carbon dioxide emission factor ( ε C O 2 —Equation (8)): it is a penalty factor, due to the residual GHG emissions of the system. It refers to the system as a whole, since it relates the total emissions to the total energy produced, by both RES and fossils generators.
All of these indicators can be evaluated in the event of both mini-grid equipped with energy storage devices and basic mini-grid without energy storage devices installed (e.g., PV-auxiliary diesel generator only, as state-of-the art for solar mini-grids).
α P V = E P V L + E P V r S O C + E P V F W E P V t h
α L = E L E I C E E L
χ L = E P V L + E r S O C L + E F W L + E I C E L E L
ε C O 2 = e C O 2   δ I C E χ L E L
Regarding the terms having the physical dimension of energy, the symbolic notation adopted in the previous expressions is clarified here:
E L
Load energy demand, calculated as time-integral of load power profile.
E P V   t h
Theoretical production of the PV generator—calculated as the time-integral of PV power.
E P V L
Share of PV energy output directly supplied from the photovoltaic generator to load.
E P V r S O C
Share of PV energy used to run the rSOC in electrolysis.
E P V F W
Share of PV energy absorbed by the power storage (flywheel).
E r S O C L
Energy supplied from the bulk energy storage to the load (rSOC in fuel cell operation).
E F W L
Energy supplied from the power storage to the load (flywheel).
E I C E
Energy integration from the auxiliary generator, namely an internal combustion engine.
δ I C E
Share of load supplied with fossil energy by the internal combustion engine.
e C O 2
Specific CO2 emissions, referred to the full combustion of diesel fuel (270 g/kWh [34]).

4.4. System Features Optimization: Criteria to Define the Set of Optimal Solutions

Access to affordable solar energy means both high energy efficiency and low cost and, usually, these two criteria are in opposition. The final target is a complete transition towards the use of renewables, but the real evolution of energy systems is nothing but a gradual change. It is reasonable to assume that, as mini-grid implementations mature, energy demand per capita may increase, thus diminishing the average price of electricity. Hence, the set of acceptable solutions (A) is selected superimposing a few arbitrary yet sensible filters on energy and economic performance indicators:
  • Load demand must be satisfied most of the time during the solar year. Therefore, a minimum load satisfaction rate of 95% is set (Equation (9)).
  • Regarding the affordability of solar energy, the Levelized Cost of Electricity (LCOE [35]) is set as a constraint to determine the set of acceptable solutions (A). A complete techno-economic analysis is not presented in this paper since it is out of the main scope. However, to keep it short and straightforward, acceptable solutions are sought among the ones achieving market parity according to the IRENA Innovation outlook [36]. Therefore, acceptable solutions are featured by an LCOE lower than 0.630 €/kWh (Equation (10)). In such a number of possibilities, the convenience is attained when the solution proposed reaches—or in the best cases overcomes—the lower bounds for electricity costs in mini-grids identified by IRENA. It is not meaningful to use the electricity price offered by the electricity provider, because this mini-grid solution is meant at refurnishing remote areas which do not benefit from a power grid infrastructure.
  • The optimal solution is sought in the set A defined by Equations (9) and (10). Then, looking at the energy performance optimization, the condition at Equation (11) must be satisfied, achieving the highest α P V ,   α L and χ L , as well as the lowest ε C O 2 (Equation (11)).
χ L χ L , m i n =   95 %
LCOE ≤ 0.630 €/kWh
max A ( α P V ,   α L ,   χ L )   and   min A ( ε C O 2   )

4.5. Modelling Assumptions

The simulation of the system operation is based on two data-sets: first, specific data concerning the rSOC technology (mainly retrieved from the experimental characterization, Section 4.5.1), and second, solar radiation and load profiles to define simulation boundary conditions (Section 4.5.2).

4.5.1. From the Experimental Characterization to the Model Parametrization

A few parameters are retrieved from the experimental activity to adapt the system model described in Section 3. Namely, they are:
  • Thermoneutral voltage = 1.228 V;
  • Area Specific Resistance SOE/SOFC (ASR) = 0.261 x 10 4 Ohm m2 and it is assumed constant with current density for the sake of simplicity;
  • Open circuit voltage, SOE operation (working conditions Table 1 = 0.911 V;
  • Open circuit voltage, SOFC operation (working conditions Table 1) = 1.03 V.
On the other hand, the experimental activity being carried out on a single cell test apparatus, the authors preferred to consider literature data regarding the roundtrip efficiency of the rSOC stack (0.6 according to [37]).

4.5.2. Broader Context

The implementation of the technology here proposed is simulated in an archetype rural community in sub-Saharan Africa, with close access to the Indian Ocean. At present, the population is 410 inhabitants, and the electrification rate barely reaches 17%. The average annual electricity demand per capita is 75 kWh/y/p and the average electric power is 3.5 kW (historical data referred to 2018). Regarding the geo-economic collocation of the case study, the following assumptions are set:
  • The average solar area-specific power is 250 W/m2, while the yearly solar energy radiation scores up to 2270 kWh/m2 (solar radiation yearly profiles taken from PV GIS database [38]);
  • Electric efficiency of solar PV is assumed equal to 14% [39];
  • The unitary cost of Diesel fuel is 0.830 €/kWh;
  • Electricity price for stand-alone mini-grids in sub-Saharan rural communities with scarce access to the electric infrastructure: 0.390–0.630 €/kWh for solar PV-diesel mini-grids for 100 users, 0.400–0.600 €/kWh for equivalent 100%-solar PV mini-grids (reference: IRENA price forecast [36,40]);
  • Discount rate: 11.8% [41].

5. Simulation Results

The simulation was meant to find the most proper sizing of the system components in terms of RES penetration, efficiency, and energy costs. All key performance indicators have been expressed through dimensionless indexes representing sizing and regulation features of the mini-grid.

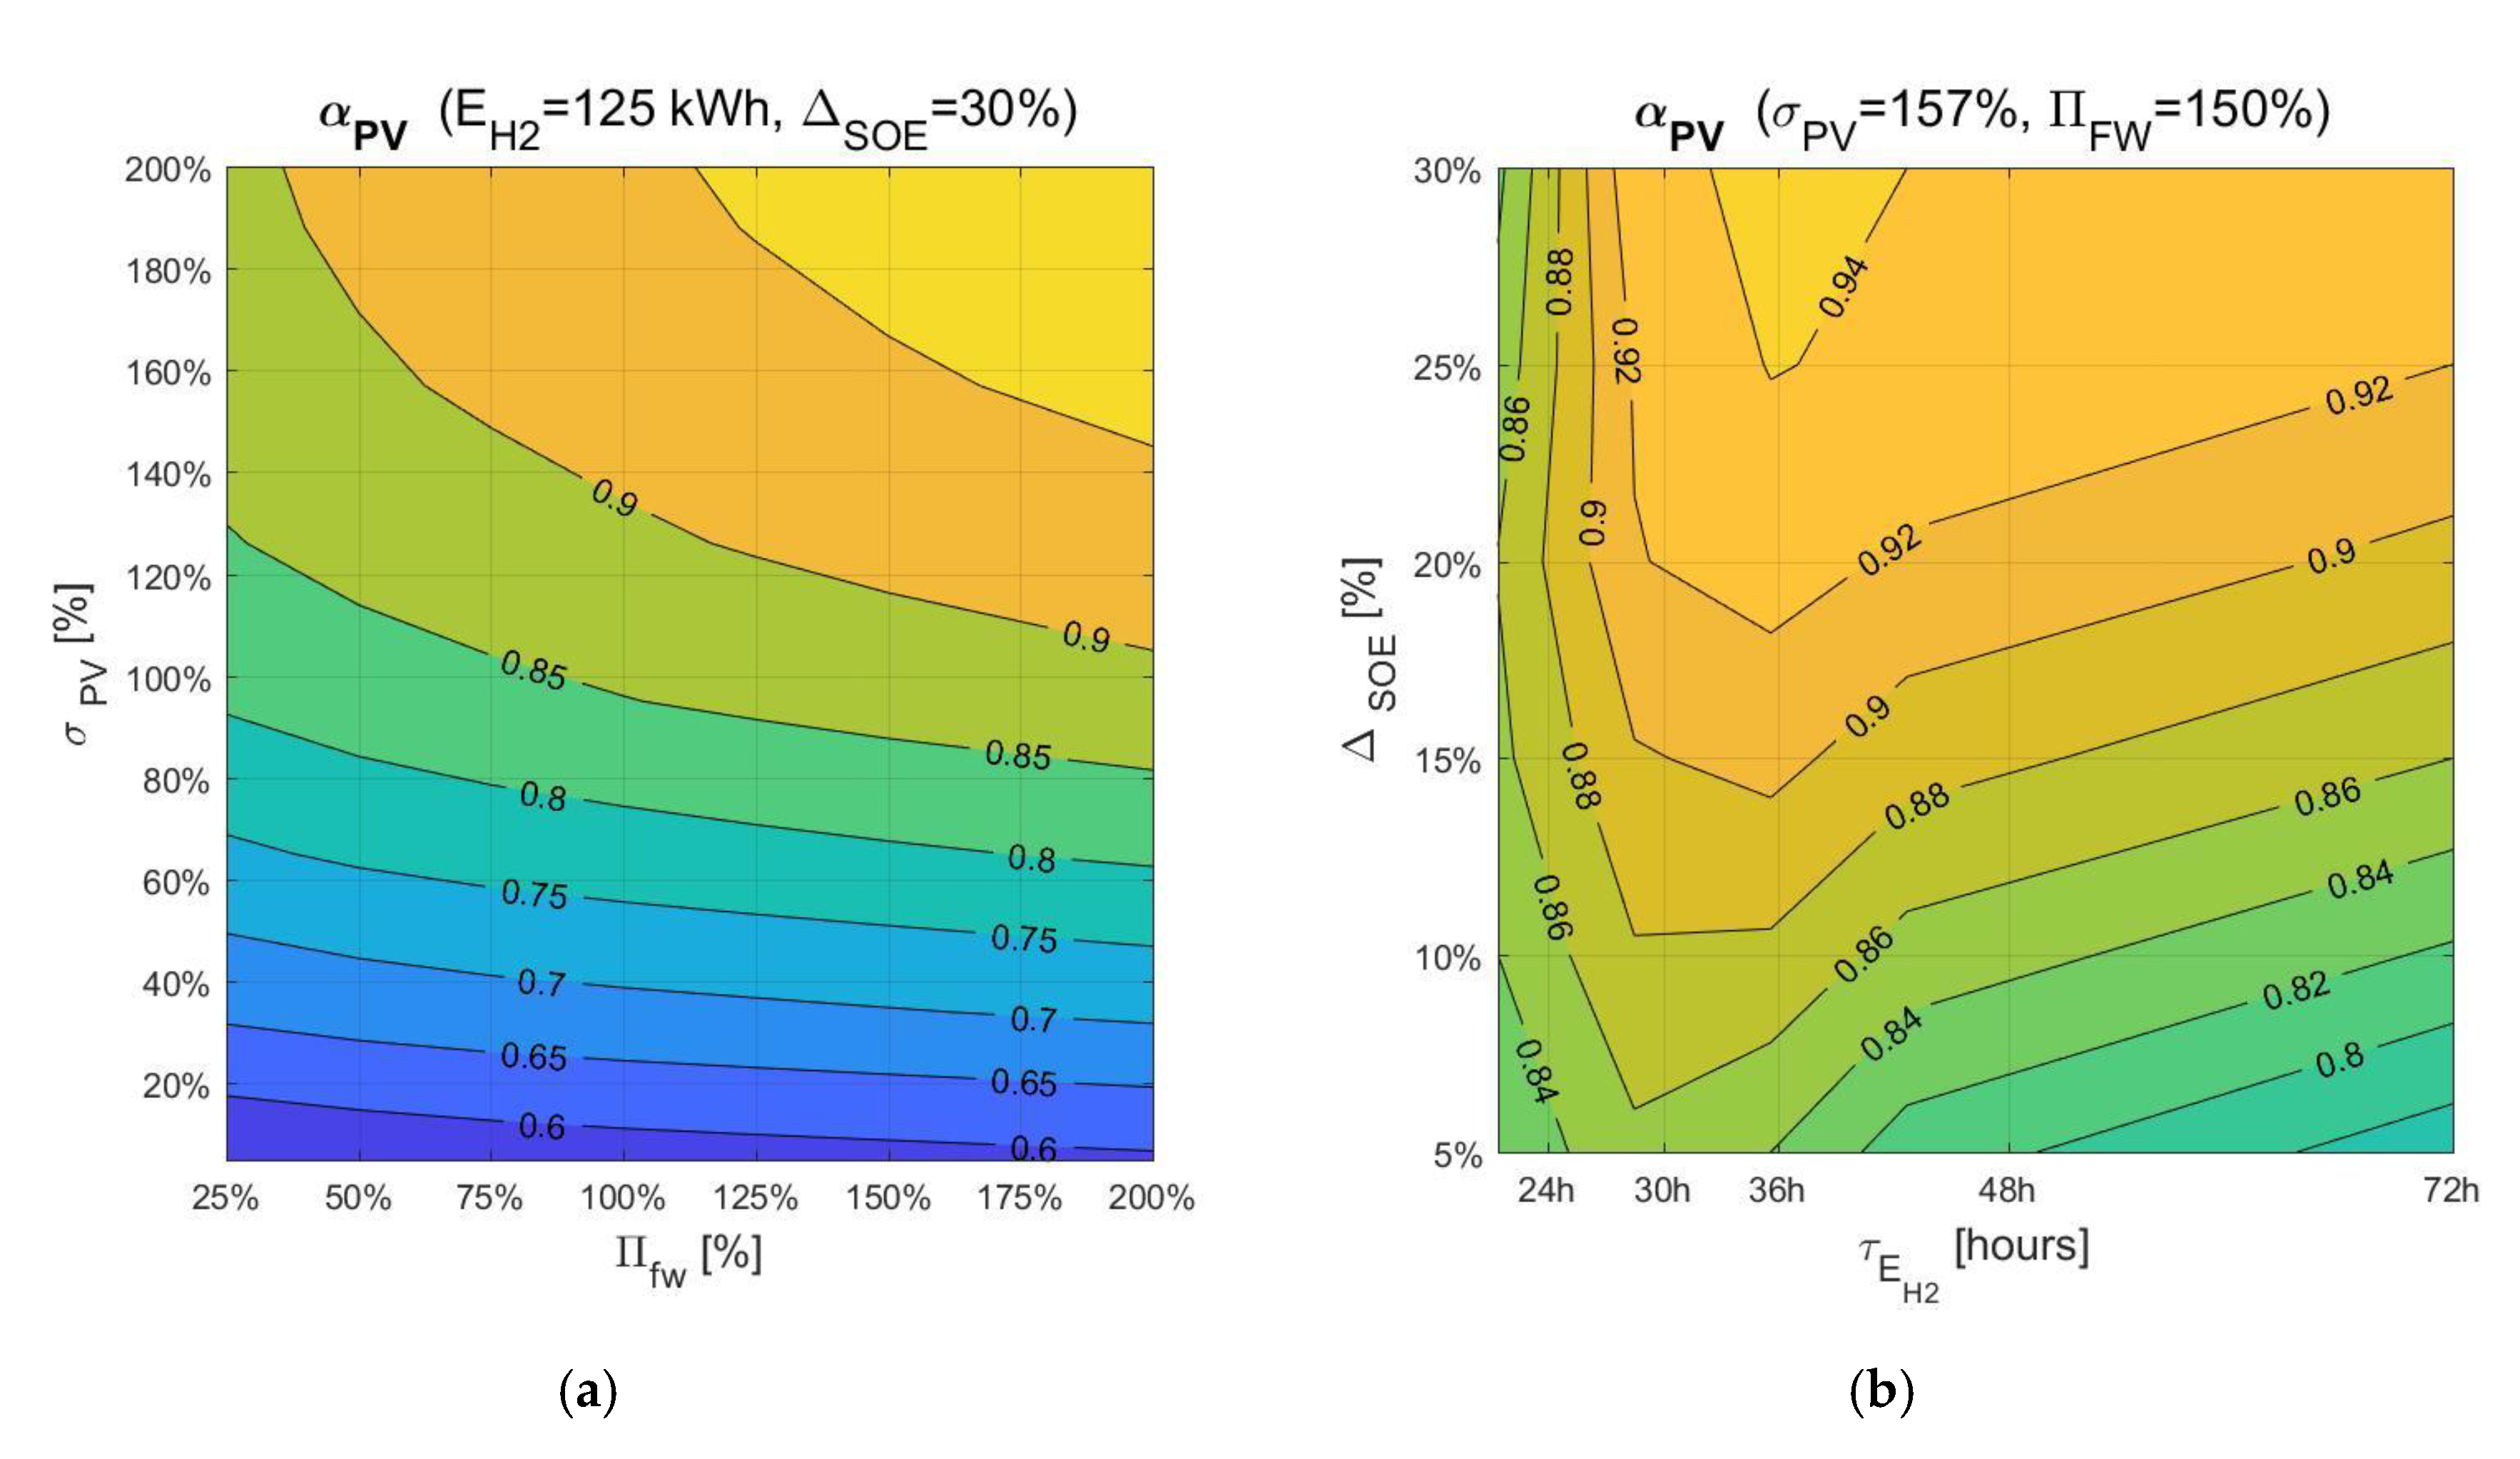
5.1. Energy and Environmental Performance Optimization

The optimal solution regarding energy and environment performances is found seeking at satisfying Equations (9)–(11). Therefore, the main indicators under observation are α P V , α L , and ε C O 2 (once the filter of χ L > 95% is applied). A PV-diesel mini-grid with the same load and same RES generation capability, but no energy storage equipment (NS) provides the baseline for results comparison. The maximum penetration of renewables in the mini-grid is attained with a high surplus of PV generation. Whilst in the NS mini-grid the PV surplus is very high (218%), the energy performance indicators α P V , α L , and ε C O 2 are not encouraging. Conversely, the addition of the energy storage section drives α P V up to 94.4%, α L up to 95.4%, and lowers the emission factor ε C O 2 down to 13 g/kWh. As trivial to remark, due to the possibility to store energy, this requires a lower PV generation capacity (PV surplus 157%). The best energy performance solution for the sector-coupled mini-grid (HES+DES) features the following sizing:
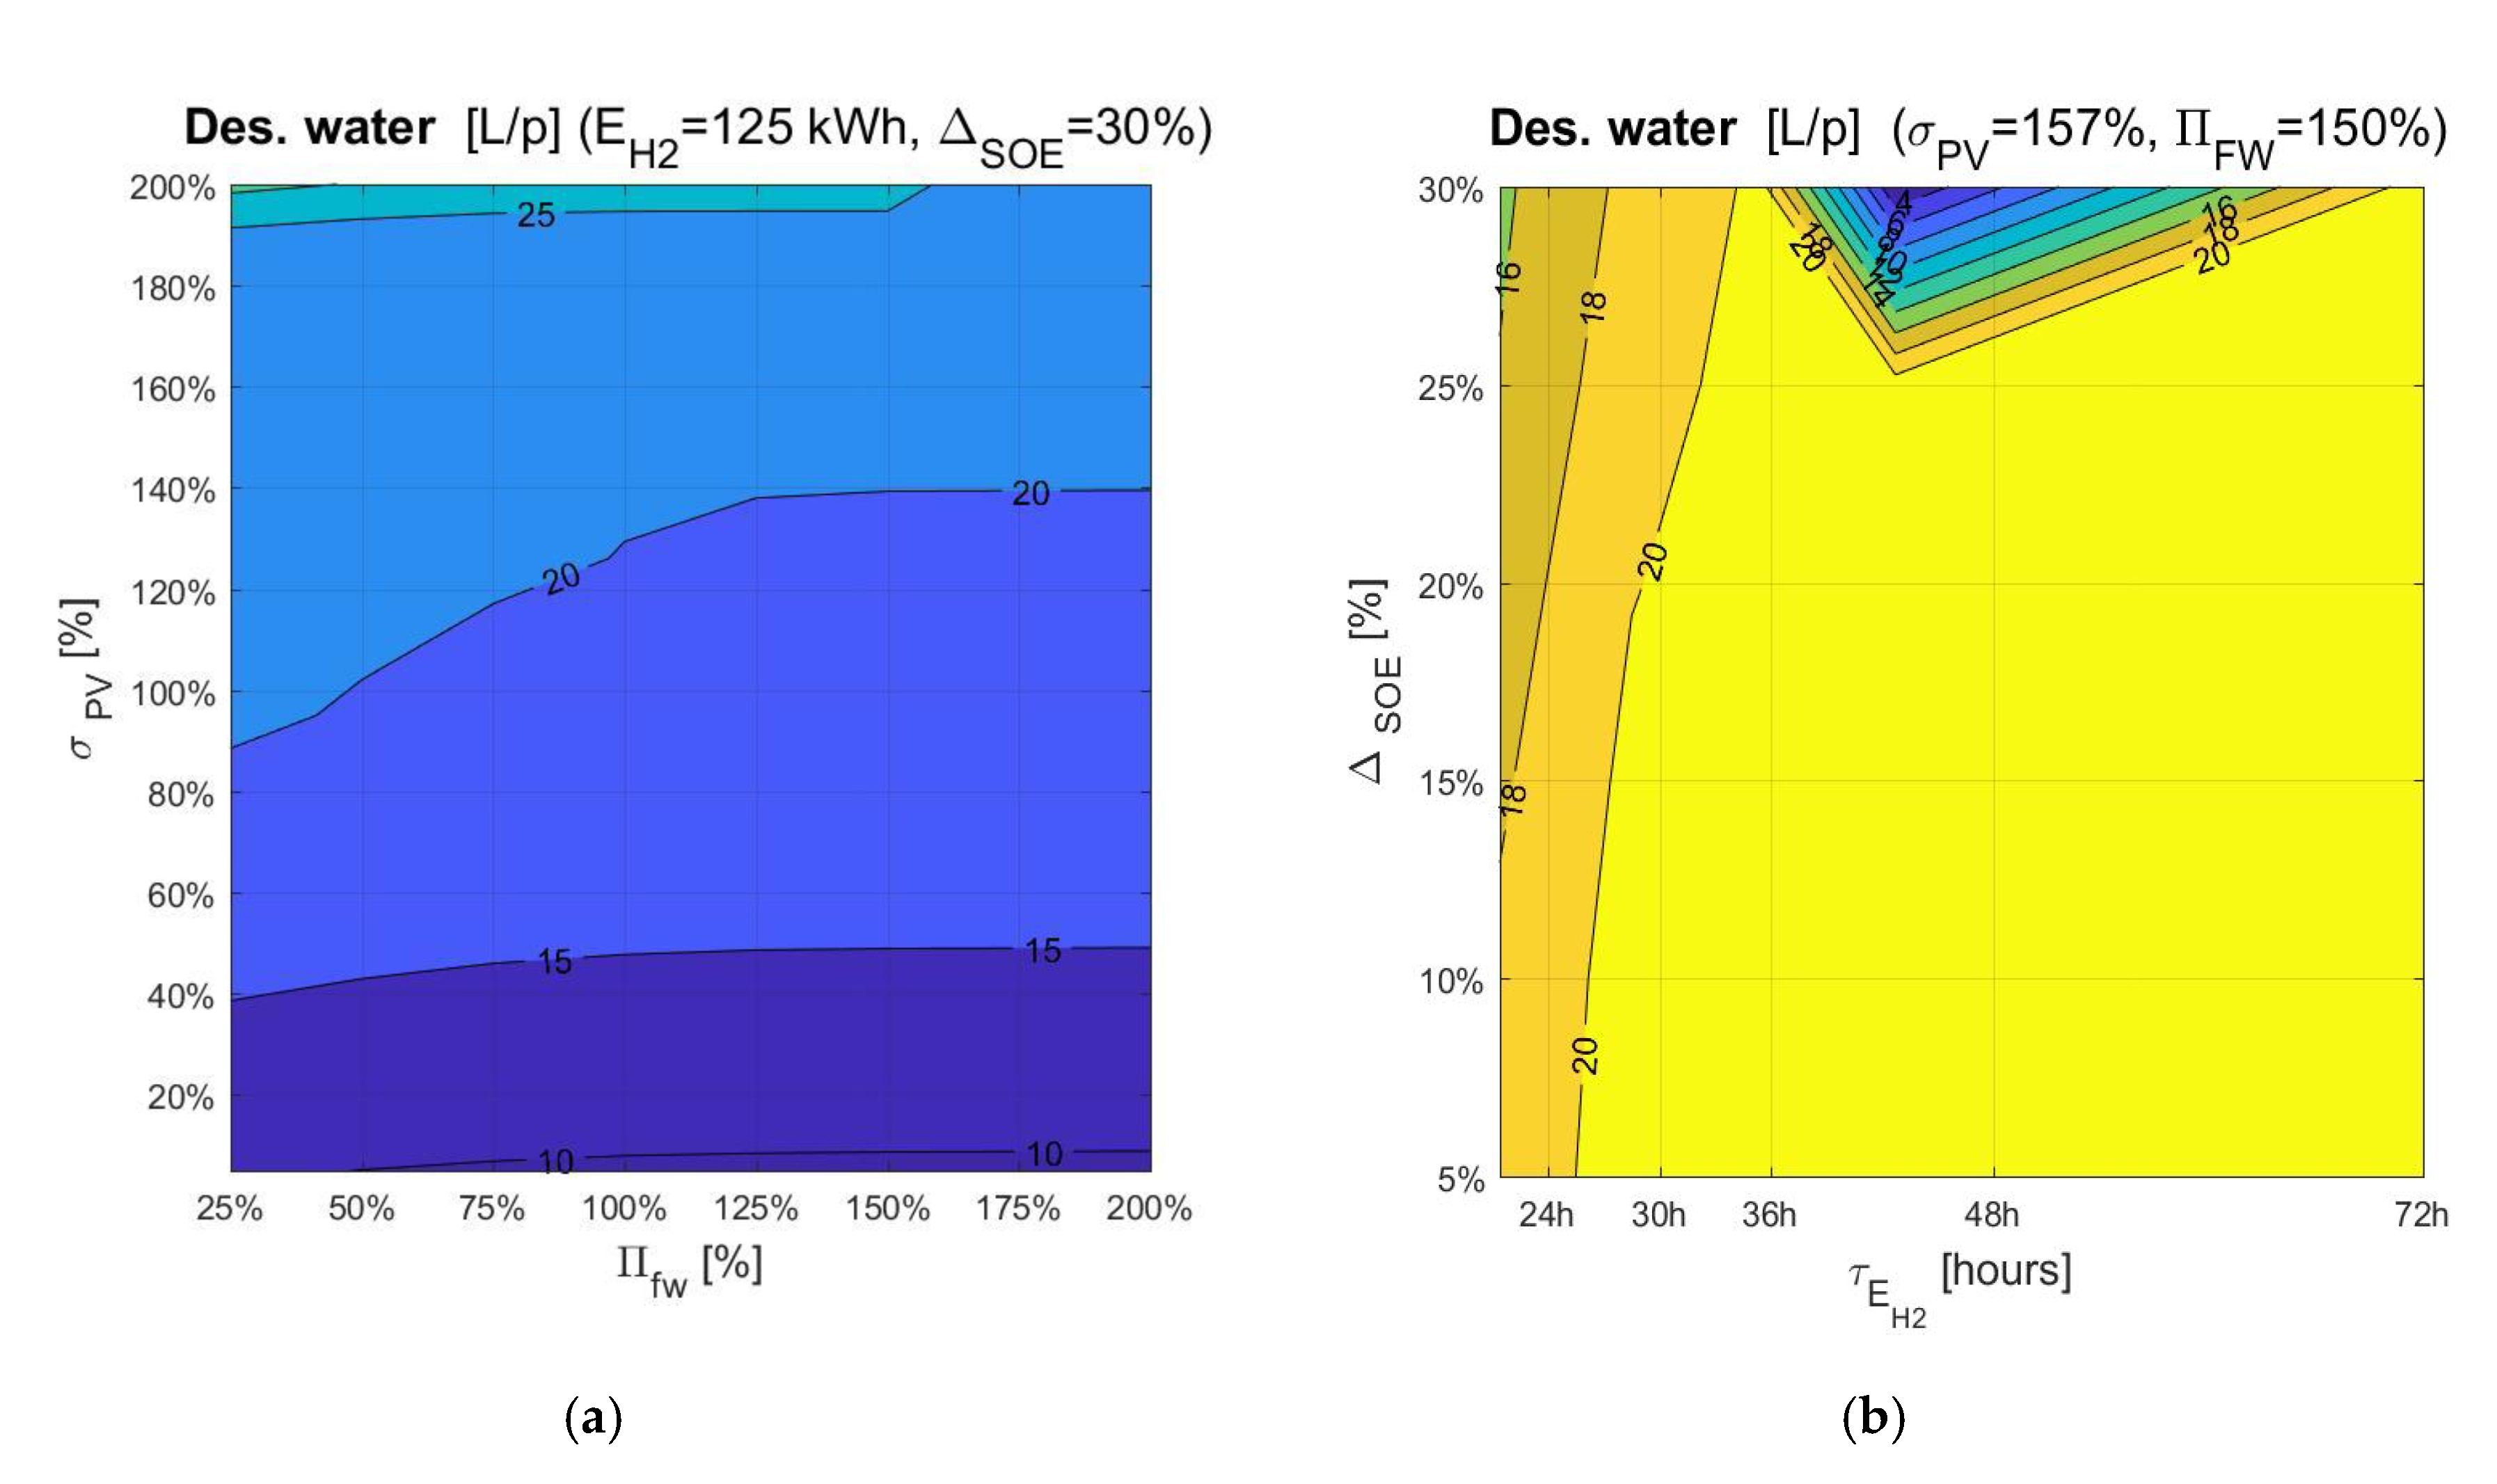
  • a solar PV generator with a Pp,PV of 39 kW (providing energy with a yearly surplus of 157%);
  • an auxiliary ICE generator with a nameplate power of 5 kW;
  • hydrogen storage capacity of 125 kWh ( τ E H 2 ≈ 36 h) which is charged by the rSOC reaching 11 kW maximum charging power (electrolysis is activated when ΔSOE = 30%);
  • for the flywheel section, a total generator peak power of 58 kW.
While the most promising results are summarized in Table 2, Figure 8 and Figure 9 report contour diagrams about the sensitivity of α P V and ε C O 2 to dimensional features of the mini-grid.
As clear from the contour plot in Figure 8a, regarding α P V , best energy performance are achieved for a significant surplus of PV generation potential (150–200%), and high flywheel power ratio (0.75–2). In Figure 8b, one can notice that, once σPV and ΠFW are set to proper values, the gradient in the α P V plane is more pronounced in the region between τ E H 2 = 30 h and τ E H 2 = 36 h (equivalent to a bulk storage capacity of 125 kWh for the load asset assumed in this study). Therefore, optimal values of α P V approach their maximum as far as ΔSOE increases. Likewise, it can be argued that the optimal values for α L and ε C O 2 have a similar trend. To get an overview about CO2 emission reduction as a consequence of an improved penetration of RES, Figure 9 depicts emission maps related to dimensional parameters of the mini-grid (Figure 9a concerning σPV and ΠFW, while Figure 9b concerning τ E H 2 and ΔSOE). The region in between the 0.85–0.95 iso- α P V curves (or, in equivalent terms referred to CO2 emission < 30 g/kWh) shows a good potential for energy performance and a small sensitivity on the flywheel power ratio, which is assumed to generate a remarkable increase of the system costs.

5.2. Desalinated Water Co-Production

The innovation of the proposed system lies in sector-coupling between renewable micro-grids and water desalination. This is allowed by the conversion of excess electricity into hydrogen, as chemical energy storage medium, and by the subsequent re-electrification phase having water as a by-product. Conventional desalination systems (like RO membranes) imply electricity consumption (about 3–10 kWh per cubic meter desalinated water [14]). In this case, no energy is explicitly used to accomplish this task. On the contrary, it is possible to define a desalinated water yield per energy released from the discharge of the hydrogen energy storage capacity (or in other words, when the rSOC runs in SOFC mode). Concerning the optimal solution set presented in the previous paragraphs, desalinated water co-production is on average 0.29 L/kWhSOFC. The normalization of water production by the electric energy issued by the SOFC is meaningful information to understand to what extent this system architecture based on rSOC and hydrogen achieves sector-coupling. Nonetheless, for the purpose claimed by SDG 7, it is interesting to see the same results in terms of per-capita clean water availability. The annual water production varies in agreement with the system dimensional parameters and the surplus of RES energy available. Figure 10 displays annual desalinated water production in litre per-capita (L/p), in a similar fashion to energy and environmental performance indicators. (Figure 10a concerning the sensitivity to σPV and ΠFW, and Figure 10b regarding τ E H 2 and ΔSOE). In the best system configurations, per-capita water availability increases by 20–25 litres each year. One may notice firsthand that this is a minimal gain. Nevertheless, it is essential to recall that this is the water co-production associated with a per-capita electricity annual demand of 75 kWh/y/p. For the sake of example, in the outlook of an increased life comfort with a per-capita electricity demand of 3300 kWh/y/p (world average in 2018), annual desalinated water co-production would ramp up to 880–1100 L/p (roughly equivalent to 2.5–3 L/p each day).

5.3. Economic Observations in Brief

The burden for performance improvements lies in a higher specific cost for electricity. LCOE is 0.507 €/kWh for the fitter NS mini-grid, while it equals 0.630 €/kWh for the HES+DES mini-grid. Additionally, the shift from the optimum towards neighbourhood regions of the solutions set is expected to produce a decrease in electricity cost. Whilst this is going to be debated in further works, a flavour of the economic impact is sketched in Figure 11).

5.4. Discussion

Developing countries are an excellent ground for the demonstration and the implementation of novel energy technologies. This is true for the following reasons, at least: high rate of population growth, low penetration of electric infrastructure and—very often—abundant resource of RES power (especially regarding the solar source). In such a context, a quick and efficient development may be achieved through the installation of micro and mini-grids based on the PV power source. However, this paper demonstrates and quantifies the advantages of equipping micro/mini-grids with energy storage, namely based on reversible Solid Oxide Cells (rSOC) and hydrogen.
Besides improved efficiency, lower carbon footprint and high modularity matters, rSOCs allows building a double-effect system, which yields clean water simultaneously to the discharge phase of the energy storage capacity. Therefore, the synergies between these two effects make rSOC a convenient technology, especially when seawater is available close to the mini-grid location (the operability of rSOC with seawater is proved to be feasible thanks to experimental characterization of commercial cells). These results are impressive in the outlook of an improved comfort of living, in agreement with the principles laying into SDG6 and SDG7. In the case study analyzed, considering an archetype rural community with poor access to electricity and clean water, RES penetration and utilization can reach up to very high grades. This fact is particularly meaningful with a glance over the future, when RES penetration is expected to rise. Nonetheless, the economic competitivity with standard PV-diesel mini-grid is not attained in this scenario without the valorization of desalination. Sector-coupling is proved to be a real game-changer in making RES more valuable on the energy market [42]. For that, aiming at ascribing an economic value to desalinated water produced as secondary output of the rSOC, rural communities facing the coast may be identified as elected spots for the development of seawater-rSOCs plants at their earlier stages of commercialization.

6. Conclusions

Reversible Solid Oxide Cells show a great potential looking at sector-coupling, since they allow RES energy storage into hydrogen which opens several utilization pathways other than solely energy generation. This embeds a tremendous potential for the diffusion and the commercial success of SOC, following the light of two global sustainable development goals: equal access to affordable renewable energy and clean water. First, this paper experimentally demonstrated a proof-of-concept of coupled energy storage and seawater desalination. Second, it presented a novel mini-grid architecture pointing at the ambitious target of 100% renewable energy dependency, as well as desalinated water co-production (0.29 L/kWhSOFC)with no extra energy consumption.
In further works following the outcomes presented here, the impacts in real geographical contexts will be evaluated, in agreement with local energy policies. At the same time, upcoming research will draw a roadmap for the scale-up of rSOCs in similar mini-grids.

Author Contributions

Conceptualization, L.B.; methodology, A.B. and G.C.; software, A.B.; validation, F.M.; formal analysis, A.B. and G.C.; investigation, A.B., G.C., A.D.M. and F.M.; resources, G.B., data curation, A.B. and F.M.; writing—original draft preparation, A.B. and F.M.; writing—review and editing, L.B. and G.C.; visualization, A.B.; supervision, G.B. All authors have read and agreed to the published version of the manuscript.

Funding

This research received no external funding.

Conflicts of Interest

The authors declare no conflict of interest.

List of Abbreviations and Nomenclature

ASRArea Specific Resistance
DESDesalination
DoDDepth of Discharge
EDXEnergy Dispersive X-rays
FWFlywheel
HESHybrid Energy Storage
ICEInternal Combustion Engine
IEAInternational Energy Agency
IRENAInternational Renewable Energy Agency
LCOELevelized Cost of Electricity
MEDMulti-Effect Distillation
MSFMulti-Stage Flash
NSNo Storage
OCVOpen Circuit Voltage
PVPhotovoltaic
RESRenewable Energy Sources
rSOCReversible Solid Oxide Cell
SDGSustainable Development Goal
SEMScanning Electron Microscopy
SOSolid Oxide
SoCState of Charge
SOESolid Oxide Electrolyzer
SOFCSolid Oxide Fuel Cell
WATWater
WHOWorld Health Organization

References

  1. U.N. Organization. Agenda 2030—Sustainable Development Goals. Available online: https://unric.org/it/agenda-2030/ (accessed on 2 September 2020).
  2. International Energy Agency. SDG7: Data And Projections. Access to Affordable: Reliable, Sustainable And Modern Energy For All; IEA: Paris, France, 2019. [Google Scholar]
  3. International Energy Agency. Africa Energy Outlook. A Focus on the Energy Prospects in Sub-Saharan Africa; IEA: Paris, France, 2014. [Google Scholar]
  4. International Energy Agency. Africa Energy Outlook Paris; IEA: Paris, France, 2019. [Google Scholar]
  5. Khawaji, A.D.; Kutubkhanah, I.K.; Wie, J.-M. Advances in seawater desalination technologies. Desalination 2008, 221, 47–69. [Google Scholar] [CrossRef]
  6. Venkataraman, V.; Pérez-Fortes, M.; Wang, L.; Hajimolana, Y.S.; Boigues-Muñoz, C.; Agostini, A.; McPhail, S.J.; Maréchal, F.; Van Herle, J.; Aravind, P. Reversible solid oxide systems for energy and chemical applications—Review & perspectives. J. Energy Storage 2019, 24, 100782. [Google Scholar]
  7. Jensen, S.H.; Graves, C.R.; Mogensen, M.B.; Wendel, C.H.; Braun, R.J.; Hughes, G.; Gao, Z.; Barnett, A.S. Large-scale electricity storage utilizing reversible solid oxide cells combined with underground storage of CO2 and CH4. Energy Environ. Sci. 2015, 8, 2471–2479. [Google Scholar] [CrossRef]
  8. Posdziech, O.; Schwarze, K.; Brabandt, J. Efficient hydrogen production for industry and electricity storage via high-temperature electrolysis. Int. J. Hydrogen Energy 2019, 44, 19089–19101. [Google Scholar] [CrossRef]
  9. International Energy Agency. World Energy Outlook 2019; IEA: Paris, France, 2019. [Google Scholar]
  10. Brown, T.; Zhu, K.; Brown, T.; Andresen, G.B.; Greiner, M. The role of storage technologies throughout the decarbonisation of the sector-coupled European energy system. Energy Convers. Manag. 2019, 201, 111977. [Google Scholar]
  11. Kousksou, T.; Bruel, P.; Jamil, A.; El Rhafiki, T.; Zeraouli, Y. Energy storage: Applications and challenges. Sol. Energy Mater. Sol. Cells 2014, 120, 59–80. [Google Scholar] [CrossRef]
  12. Buttler, A.; Spliethoff, H. Current status of water electrolysis for energy storage, grid balancing and sector coupling via power-to-gas and power-to-liquids: A review. Renew. Sustain. Energy Rev. 2018, 82, 2440–2454. [Google Scholar] [CrossRef]
  13. Alkaisi, A.; Mossad, R.; Sharifian-Barforoush, A. A Review of the Water Desalination Systems Integrated with Renewable Energy. Energy Procedia 2017, 110, 268–274. [Google Scholar] [CrossRef]
  14. Dashtpour, R.; Al-Zubaid, S.N. Energy Efficient Reverse Osmosis Desalination Process. Int. J. Environ. Sci. Dev. 2012, 3, 339–345. [Google Scholar]
  15. Gude, V.G. Desalination and sustainability — An appraisal and current perspective. Water Res. 2016, 89, 87–106. [Google Scholar] [CrossRef]
  16. Wang, L.; Zhang, Y.; Pérez-Fortes, M.; Aubin, P.; Lin, T.-E.; Yang, Y.; Maréchal, F.; Herle, J. Reversible solid-oxide cell stack based power-to-x-to-power systems: Comparison of thermodynamic performance. Appl. Energy 2020, 275, 115330. [Google Scholar] [CrossRef]
  17. Koberg, F.; Reichholf, D.; Schauperl, R. Scenario Based Optimization of SOE and Reversible-SOC Systems. ECS Trans. 2019, 91, 2475–2484. [Google Scholar] [CrossRef]
  18. Hauch, A.; Küngas, R.; Blennow, P.; Hansen, A.B.; Mathiesen, B.V.; Mogensen, M.B. Recent advances in solid oxide cell technology for electrolysis. Science 2020, 370, eaba6118. [Google Scholar] [CrossRef] [PubMed]
  19. Baldinelli, A.; Barelli, L.; Bidini, G.; Discepoli, G. Economics of innovative high capacity-to-power energy storage technologies pointing at 100% renewable micro-grids. J. Energy Storage 2020, 28, 101198. [Google Scholar] [CrossRef]
  20. Ovtar, S.; Tong, X.; Bentzen, J.J.; Thydén, K.T.S.; Simonsen, S.B.B.; Chen, M. Boosting the performance and durability of Ni/YSZ cathode for hydrogen production at high current densities via decoration with nano-sized electrocatalysts. Nanoscale 2019, 11, 4394–4406. [Google Scholar] [CrossRef]
  21. Skafte, T.L.; Hjelm, J.; Blennow, P.; Graves, C. Quantitative review of degradation and lifetime of solid oxide cells and stacks. In Proceedings of the 12th European SOFC & SOE Forum, Lucerne, Switzerland, 5–8 July 2016; pp. 8–26. [Google Scholar]
  22. Mogensen, M.B.; Chen, M.; Frandsen, H.L.; Graves, C.R.; Hauch, A.; Jacobsen, T.; Jensen, S.H.; Skafte, T.L.; Sun, X. Comprehensive Hypotheses for Degradation Mechanisms in Ni-Stabilized Zirconia Electrodes. ECS Trans. 2019, 91, 613–620. [Google Scholar] [CrossRef]
  23. Hauch, A.; Brodersen, K.; Chen, M.; Graves, C.R.; Jensen, S.R.; Jørgensen, P.S.; Hendriksen, P.V.; Mogensen, M.B.; Ovtar, S.; Sun, X. A Decade of Solid Oxide Electrolysis Improvements at DTU Energy. ECS Trans. 2017, 75, 3–14. [Google Scholar] [CrossRef] [Green Version]
  24. Hauch, A.; Brodersen, K.; Chen, M.; Mogensen, M.B. Ni/YSZ electrodes structures optimized for increased electrolysis performance and durability. Solid State Ionics 2016, 293, 27–36. [Google Scholar] [CrossRef] [Green Version]
  25. Irvine, J.T.S.; Neagu, D.; Verbraeken, M.C.; Chatzichristodoulou, C.; Graves, C.; Mogensen, M.B. Evolution of the electrochemical interface in high-temperature fuel cells and electrolysers. Nat. Energy 2016, 1, 15014. [Google Scholar] [CrossRef] [Green Version]
  26. Wang, Y.; Li, W.; Ma, L.; Li, W.; Liu, X. Degradation of solid oxide electrolysis cells: Phenomena, mechanisms, and emerging mitigation strategies—A review. J. Mater. Sci. Technol. 2020, 55, 35–55. [Google Scholar] [CrossRef]
  27. Jeanmonod, G.; Diethelm, S.; Van herle, J. Active Near-Infrared Imaging for Spatio-Temporal Monitoring of a Solid Oxide Cell in Operation. ECS Trans. 2019, 91, 437–446. [Google Scholar] [CrossRef]
  28. Caliandro, P.; Nakajo, A.; Diethelm, S.; Van Herle, J. Model-assisted identification of solid oxide cell elementary processes by electrochemical impedance spectroscopy measurements. J. Power Sources 2019, 436, 226838. [Google Scholar] [CrossRef]
  29. Baldinelli, A.; Barelli, L.; Bidini, G. Progress in renewable power exploitation: Reversible solid oxide cells-flywheel hybrid storage systems to enhance flexibility in micro-grids management. J. Energy Storage 2019, 23, 202–219. [Google Scholar] [CrossRef]
  30. Mariam, L.; Basu, M.; Conlon, M.F. Microgrid: Architecture, policy and future trends. Renew. Sustain. Energy Rev. 2016, 64, 477–489. [Google Scholar] [CrossRef]
  31. Martin-Martínez, F.; Sánchez-Miralles, A.; Rivier, M. A literature review of Microgrids: A functional layer based classification. Renew. Sustain. Energy Rev. 2016, 62, 1133–1153. [Google Scholar] [CrossRef]
  32. Patrao, I.; Figueres, E.; Garcerá, G.; González-Medina, R. Microgrid architectures for low voltage distributed generation. Renew. Sustain. Energy Rev. 2015, 43, 415–424. [Google Scholar] [CrossRef]
  33. Planas, E.; Andreu, J.; Gárate, J.I.; De Alegría, I.M.; Ibarra, E. AC and DC technology in microgrids: A review. Renew. Sustain. Energy Rev. 2015, 43, 726–749. [Google Scholar] [CrossRef]
  34. United States Environmental Protection Agency (EPA). Emission Factors for Greenhouse Gas Inventories; EPA: Washington, DC, USA, 2014; p. 5.
  35. International Energy Agency. 2015 Key World Energy Statistics; IEA: Paris, France, 2015. [Google Scholar]
  36. International Renewable Energy Agency. Innovation Outlook Mini-Grids; IRENA: Abu Dhabi, UAE, 2016. [Google Scholar]
  37. Shi, Y.; Cai, N.; Cao, T.; Zhang, J. High-Temperature Electrochemical Energy Conversion and Storage: Fundamentals; CRC Press: Boca Raton, FL, USA, 2017. [Google Scholar]
  38. JRC Photovoltaic GIS. Available online: https://ec.europa.eu/jrc/en/pvgis (accessed on 9 July 2020).
  39. Akbari, H.; Browne, M.C.; Ortega, A.; Huang, M.J.; Hewitt, N.; Norton, B.; McCormack, S.J. Efficient energy storage technologies for photovoltaic systems. Sol. Energy 2019, 192, 144–168. [Google Scholar] [CrossRef]
  40. Norplan; Norad. Norplan Study: Cost Competitiveness of Rural Electrification Solutions; Norplan: Oslo, Norway, 2013. [Google Scholar]
  41. Grant Thornton, Africa Renewable Energy Discount Rate Survey—2018. Available online: https://www.grantthornton.co.uk/globalassets/1.-member-firms/united-kingdom/pdf/documents/africa-renewable-energy-discount-rate-survey-2018.pdf (accessed on 10 August 2020).
  42. Bernath, C.; Deac, G.; Sensfu, F. Impact of sector coupling on the market value of renewable energies—A model-based scenario analysis. Appl. Energy 2021, 281, 115985. [Google Scholar] [CrossRef]
Figure 1. rSOC operation scheme: (a) Electrolysis (SOE), (b) Fuel cell (SOFC).
Processes 08 01494 g001
Figure 2. rSOC test apparatus: cell housing.
Processes 08 01494 g002
Figure 3. Polarization characterizations in SOFC and SOE mode, 800 °C.
Processes 08 01494 g003
Figure 4. SOE endurance test, 800 °C, 250 mA/cm2, 50%–50% H2-H2O.
Processes 08 01494 g004
Figure 5. EDX results of elemental mapping on the cell surface.
Processes 08 01494 g005
Figure 6. Hybrid Energy Storage System: schematic architecture for stand-alone mini-grids.
Processes 08 01494 g006
Figure 7. Management logic-tree: (a) Case S (RES Surplus), (b) Case L (Lack of RES).
Processes 08 01494 g007
Figure 8. Sensitivity analysis of the key performance indicator α P V scored for the best mini-grid configuration reaching energy optimization. α P V contour maps are plotted vs: (a) σPV and ΠFW, for constant value of τ E H 2 and ΔSOE; (b) versus τ E H 2 and ΔSOE, for constant value of σPV and ΠFW.
Processes 08 01494 g008
Figure 9. Sensitivity analysis of the key performance indicator ε C O 2 scored in the best mini-grid configuration reaching environmental optimization. ε C O 2 contour maps are plotted vs: (a) σPV and ΠFW, for constant value of τ E H 2 and ΔSOE; (b) versus τ E H 2 and ΔSOE, for constant value of σPV and ΠFW.
Processes 08 01494 g009
Figure 10. Annual desalinated water production per-capita. Sensitivity analysis about: (a) σPV and ΠFW, for constant value of τ E H 2 and ΔSOE; (b) versus τ E H 2 and ΔSOE, for constant value of σPV and ΠFW.
Processes 08 01494 g010
Figure 11. A preliminary study on the variation of LCOE (€/kWh). Iso-cost plots are drawn against the PV surplus factor σPV and the flywheel power ratio ΠFW.
Processes 08 01494 g011
Table 1. Compositions and operating conditions of the cell in SOE and SOFC mode.
Test ModeFuel Electrode
Inlet Gas Composition
Air Electrode
Inlet Gas Composition
Temperature
SOFC (Polarization)H2 100%100% Air800 °C
SOE (Polarization)H2:H2O 50%:50%100% Air800 °C
SOE (constant current)H2:H2O 50%:50% + NaCl 35 g/kgH2O100% Air800 °C
Table 2. Energy and environmental performance optimization: NS (Basic PV-Diesel mini-grid) and HES+DES (PV-Hydrogen Energy Storage- Diesel mini-grid coupled with desalination) mini-grids.
Mini-Grid TypeLCOE χ L α P V α L ε C O 2 PP,PVPV PSOESOE EH2 PFWFW PICE
€/kWh%%%g/kWhkW/%kW/%kWhkW/%kW
NS0.50796–9740.243.5153 47/218%n.dn.d.n.d7
HES + DES0.63099–10094.495.413 39/157%11/30%12558/1.55
Publisher’s Note: MDPI stays neutral with regard to jurisdictional claims in published maps and institutional affiliations.

