Article

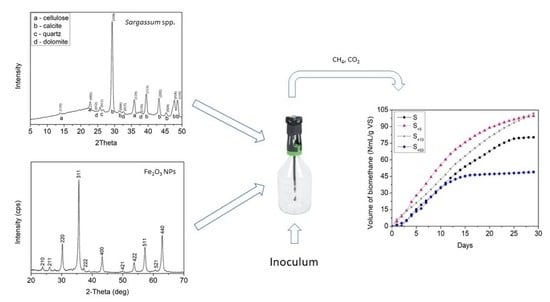
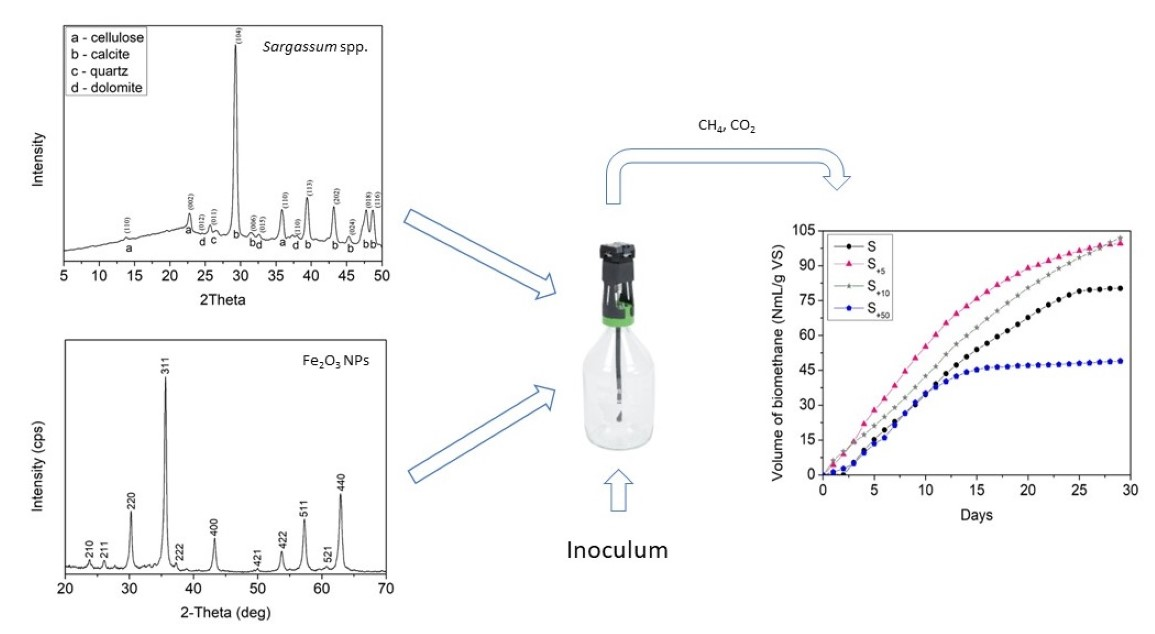
Influence of Fe2O3 Nanoparticles on the Anaerobic Digestion of Macroalgae Sargassum spp.

by
Rosy Paletta
1,
Sebastiano Candamano
2,
Pierpaolo Filippelli
2 and
Catia Giovanna Lopresto
1,*
1
Department of Computer Engineering, Modelling, Electronics and Systems (DIMES), University of Calabria, 87036 Rende, Italy
2
Department of Mechanical, Energy and Management Engineering (DIMEG), University of Calabria, 87036 Rende, Italy
*
Author to whom correspondence should be addressed.
Processes 2023, 11(4), 1016; https://doi.org/10.3390/pr11041016
Submission received: 14 February 2023 / Revised: 20 March 2023 / Accepted: 23 March 2023 / Published: 27 March 2023
(This article belongs to the Special Issue Process Intensification for Waste Valorization)

Abstract

:
The anaerobic digestion (AD) of biomass is a green technology with known environmental benefits for biogas generation. The biogas yield from existing substrates and the biodegradability of biomasses can be improved by conventional or novel enhancement techniques, such as the addition of iron-based nanoparticles (NPs). In this study, the effect of different concentrations of Fe2O3-based NPs on the AD of brown macroalga Sargassum spp. has been investigated by 30 days trials. The effect of NPs was evaluated at different concentrations. The control sample yielded a value of 80.25 ± 3.21 NmLCH4/gVS. When 5 mg/g substrate and 10 mg/g substrate of Fe2O3 NPs were added to the control sample, the yield increased by 24.07% and 26.97%, respectively. Instead, when 50 mg/g substrate of Fe2O3 NPs was added to the control sample, a negative effect was observed, and the biomethane yield decreased by 38.97%. Therefore, low concentrations of Fe2O3 NPs favor the AD process, whereas high concentrations have an inhibitory effect. Direct interspecies electron transfer (DIET) via Fe2O3 NPs and their insolubility play an important role in facilitating the methanogenesis process during AD.

Graphical Abstract

1. Introduction

Anaerobic digestion (AD) of wastes is a promising green approach to valorize various waste streams and generate renewable bioenergy. Indeed, organic wastes are the most profitable source of renewable energy, and the production of biogas by AD seems to be the closest to commercial-scale exploitation [1].
Nanotechnology is an emerging technology to improve AD performance. Nano-sized particles (1–100 nm) have excellent physicochemical properties, such as high activity, high reactive surface area, chemical stability, high specificity for improving performance, and ability to stimulate microbial growth in the AD process. The addition of nanoparticles (NPs) affects the microbial community [2] and, in suitable concentrations, increases the degradation of biomass through direct or indirect interspecies electron transfer [3,4], thus enhancing biogas production [5,6,7].
Among NPs, iron-based NPs (Fe-NPs) seem to be the most promising nanomaterials for enhancing biogas production, improving biodigester process stability, achieving better substrate treatment, and increasing pathogen reduction [8,9,10]. Fe-NPs include zero-valent iron (ZVI) with paramagnetic properties and iron oxide NPs (IONPs) with ferromagnetic properties. Recently, their influence on the fundamental mechanisms of the anaerobic digestion process and on the fertility of effluents have been extensively discussed [11,12]. Among IONPs, magnetite (Fe3O4) NPs have been widely applied in recent years for their magnetic properties, non-toxicity, high coercivity, biocompatibility, and ability to improve electron transport efficiency, increasing the activity of enzymes during methanogenesis, providing nutrients to microorganisms, reducing the inhibiting effect of sulphate-reducing bacteria. Indeed, iron ions (Fe2+ and Fe3+) are essential constituents of cofactors and enzymes, and their addition to anaerobic digesters can improve the activity of methanogen Archaea microorganisms. However, very few experimental works have focused on the use of Fe2O [13] and Fe2O3 [14,15,16,17].
Biogas production was found to be improved when cattle manure was exposed to two different concentrations of Fe2O3 NPs (20 and 100 mg/L) in comparison to the control, either individually or in combination with TiO2 NPs. Specifically, Fe2O3 NPs promoted the production of metabolic intermediates and the activity of key enzymes in the methanogenic Archaea, stimulated the production of extracellular polymeric substances by anaerobic bacteria providing cell protection against microbial cytotoxicity, and reduced the amount of H2S in the digestate by forming a ferrous sulfide deposit (FeS) [16]. Moreover, Farghali et al. attributed the improved biogas and CH4 production efficiencies to the release of Fe+2/+3 from Fe2O3 NPs [16]. Instead, Wang et al. stated that Fe2O3 NPs do not dissolve easily in their liquid phase under near-neutral conditions, and no ions were released from Fe2O3 NPs; however, low concentration of Fe2O3 NPs (100 mg/gTSS, TSS: Total Suspended Solids) quantitatively changed the AD microorganisms and improved the activity of key enzymes and methane yield from waste activated sludge to 117% [15]. Singh Rana et al. tested three Fe2O3 NPs concentrations (10, 20 and 30 mg·L1) on AD from microalgae and the best performance was achieved at 30 mg·L1, whereas the two lowest concentrations did not improve biogas production significantly [17]. Moreover, the addition of Fe2O3 NPs influences the biogas composition, reaching almost 100% methane [14]. Nevertheless, Fe2O3 NPs at different concentrations in the range of 5–500 mg/gTS decreased methane production from waste activated sludge by 4–28.9% compared to the raw substrate. This inhibitory effect became evident after the 12th day of AD tests [18].
Algae is a potential organic waste for the production of biogas. The exploitation of macroalgae to produce biofuels has received significant interest in recent decades. Macroalgae, also called seaweeds, are generally composed of polysaccharides, lipids and proteins. Recent and unprecedented blooms of brown pelagic macroalga Sargassum in the Caribbean have caused massive coastal accumulation, with a strong impact on the environment, ecosystems, health and the local economy. Despite adverse impacts, waste-accumulated Sargassum is an economically viable aquatic energy crop and a potential substrate for biogas production through AD [19]. It is an ideal biomass because of its high polysaccharide content and negligible lignin content. Recently, many researchers have reviewed the application of macroalgae in the bioenergy field and reported a great variability in biomethane yields due to variations in the species and seasonal/geographical chemical composition of the biomass. Despite many efforts, the yield of biogas from many algae varies between 19% and 81% of a theoretical maximum, but in most cases, it is less than 50% of that from common commercially exploited feedstocks [1]. Low yields can be attributed to recalcitrant structure and cell wall structure, non-optimal carbon-to-nitrogen ratio and the presence of polysaccharides that are not readily hydrolysed, polyphenols, organic sulphur compounds, toxins, heavy metals and other inhibitory compounds.
Different methods can be used to increase the efficiency of AD of macroalgae, such as pretreatments, co-digestion with other substrates, innovative digesters, different operating conditions and additives. Following the recent increasing interest, the addition of NPs is also attractive for the AD of macroalgae. Despite several works related to NP-aided AD from different substrates, very few studies have been concerned with macroalgal biomass and focused on the positive effect of NPs on the AD of green algae. The effect of three different treatments (ozonation, sonication and microwaves), either singly or in conjunction with magnetite NPs, was investigated on the AD of the green macroalga Ulva intestinalis. The results showed that NPs enhanced the microwave treatment and increased biogas yield by 145% compared with an individual microwave treatment [20]. Furthermore, the biogas production from green algae Enteromorpha was increased by Ni, Co, Fe3O4 and MgO NPs [21,22,23], also in combination with a microwave pretreatment [24,25,26,27]. The best performances were obtained after 170 h by adding 10 mg·L−1 of Fe3O4 or 1 mg·L−1 of Ni NPs, resulting in a cumulative biogas increase of 28% and 26%, respectively. The biogas production from 20 g of dry algae powder was 624 mL for Fe3O4 and 618 mL for Ni [22].
Nevertheless, after an extensive study of the literature and to the best of our knowledge, no other study has focused on the application of NPs for the AD of brown macroalgae. Therefore, this paper is the first investigation concerned with the NP-aided AD of brown macroalgae and, in particular, Sargassum. Among different possible NPs, we selected Fe2O3 for our investigation due to its low cost compared to the most extensively used, which is magnetite. The application of Fe2O3 NPs in biogas production is very rare in the literature. Similar to the more used magnetite Fe3O4 [28], Fe2O3 NPs efficiently promote direct interspecies electron transfer between bacteria and methanogens, with a positive impact on the activity of methanogenic archaea and biogas yield [29]. Nevertheless, Fe2O3 can have an inhibition effect on the methanogenic consortium, which is strongly dependent on concentration and time [18]. However, this study is designed to be the first aimed at evaluating the effects of Fe2O3 NPs on biogas generation during the AD of brown algae Sargassum from the Gulf of Mexico.

2. Materials and Methods

2.1. Sargassum spp. Characterization

Sargassum spp. was harvested in Punta Cana (Dominican Republic) during the summer season after beaching events (Figure 1). After being washed with tap water, it was left to dry in the open air.

2.1.1. Physico-Chemical Characterization

Sargassum spp. was divided into four samples, each of them ground by a Philips-ProBlend Tech mixer (Milan, Italy) for 1 min at maximum speed (2200 W). For each sample, the total solids (TS), moisture (M), volatile solids (VS) and ash were evaluated.
Moisture and TS were determined by drying open-air pre-dried Sargassum spp. samples in an oven at 105 °C ± 2 °C.The total moisture was calculated by Equation (1):
M = m i m d m i   · 100   ( % )
The ash content was determined using calcination at 550 °C ± 10 °C for 6 h in a muffle, where an aliquot of the test sample was incinerated in an oxidizing atmosphere until the organic substance was completely burned and a constant mass was reached.
About 5 g of sample were weighed in the tared capsule by an analytical balance. The capsule was placed into the muffle previously heated until complete combustion of the organic substance and the achievement of constant mass. When the ashing was completed (4–6 h), the capsule was removed from the muffle and cooled in a desiccator. Once the room temperature was reached, it was weighed. VS was calculated by Equation (2):
V S = m d m c m i   · 100   ( % )
The ash content was calculated by Equation (3):
A s h = m c m i   · 100   ( % )
In Equations (1)–(3), mi was the initial mass of the open-air pre-dried sample before oven drying, md was the mass of the sample after drying in oven at 105 °C ± 2 °C and mc was the residual mass of the sample after calcination in a muffle at 550 °C ± 10 °C for 6 h.
Moreover, the content of proteins, carbohydrates, lipids, carbon, nitrogen, metals and metalloids was evaluated.
The Bradford method was used for the determination of the protein content. Firstly, the protein fraction was extracted from 2.5 g of finely ground matrix by using PDS Dulbecco’s Phosphate-Buffered Saline solution. Then, the extract was filtered, and the supernatant was analyzed by a spectrophotometer at a wavelength of 595 nm.
The lipid fraction was extracted in a Soxhlet apparatus with petroleum ether for 8 h at 50 °C. The solvent was removed by distillation, and the extract was further concentrated by a rotary evaporator.
The carbohydrate content was determined by two-step hydrolysis in sulfuric acid, followed by quantification of soluble carbohydrates by a spectrophotometric method (based on derivatization of the aldehyde functional group) for an overall determination of the combined monomeric sugar concentration.
The organic carbon content was calculated according to the CNR-IRSA Q no. 84 n5 (1985) method, while the organic nitrogen content was calculated according to the Kjeldahi method.
Regarding the content of metals and metalloids, the samples were previously mineralized by a Milestone® Star D-Microwave Digestion System microwave mineralizer. Each sample was previously introduced into a suitable Teflon vessel with 12 mL of acid solution (HCl:HNO3/1:3) and placed to mineralize at 250 W for 40 min. The mineralized solutions obtained were filtered with a 0.45 μm filter and suitably diluted for ICP-MS analysis. The concentrations of metals and metalloids in the resulting solutions were determined by a Thermo Scientific ™ iCAP ™ TQ ICP-MS ICP-MS.
The content of metals and metalloids (CM) was calculated by Equation (4):
C M = B · V m
where B is the concentration obtained by the ICP-MS analysis, V is the volume of the solution after the mineralization and m is the mass of the mineralized sample.

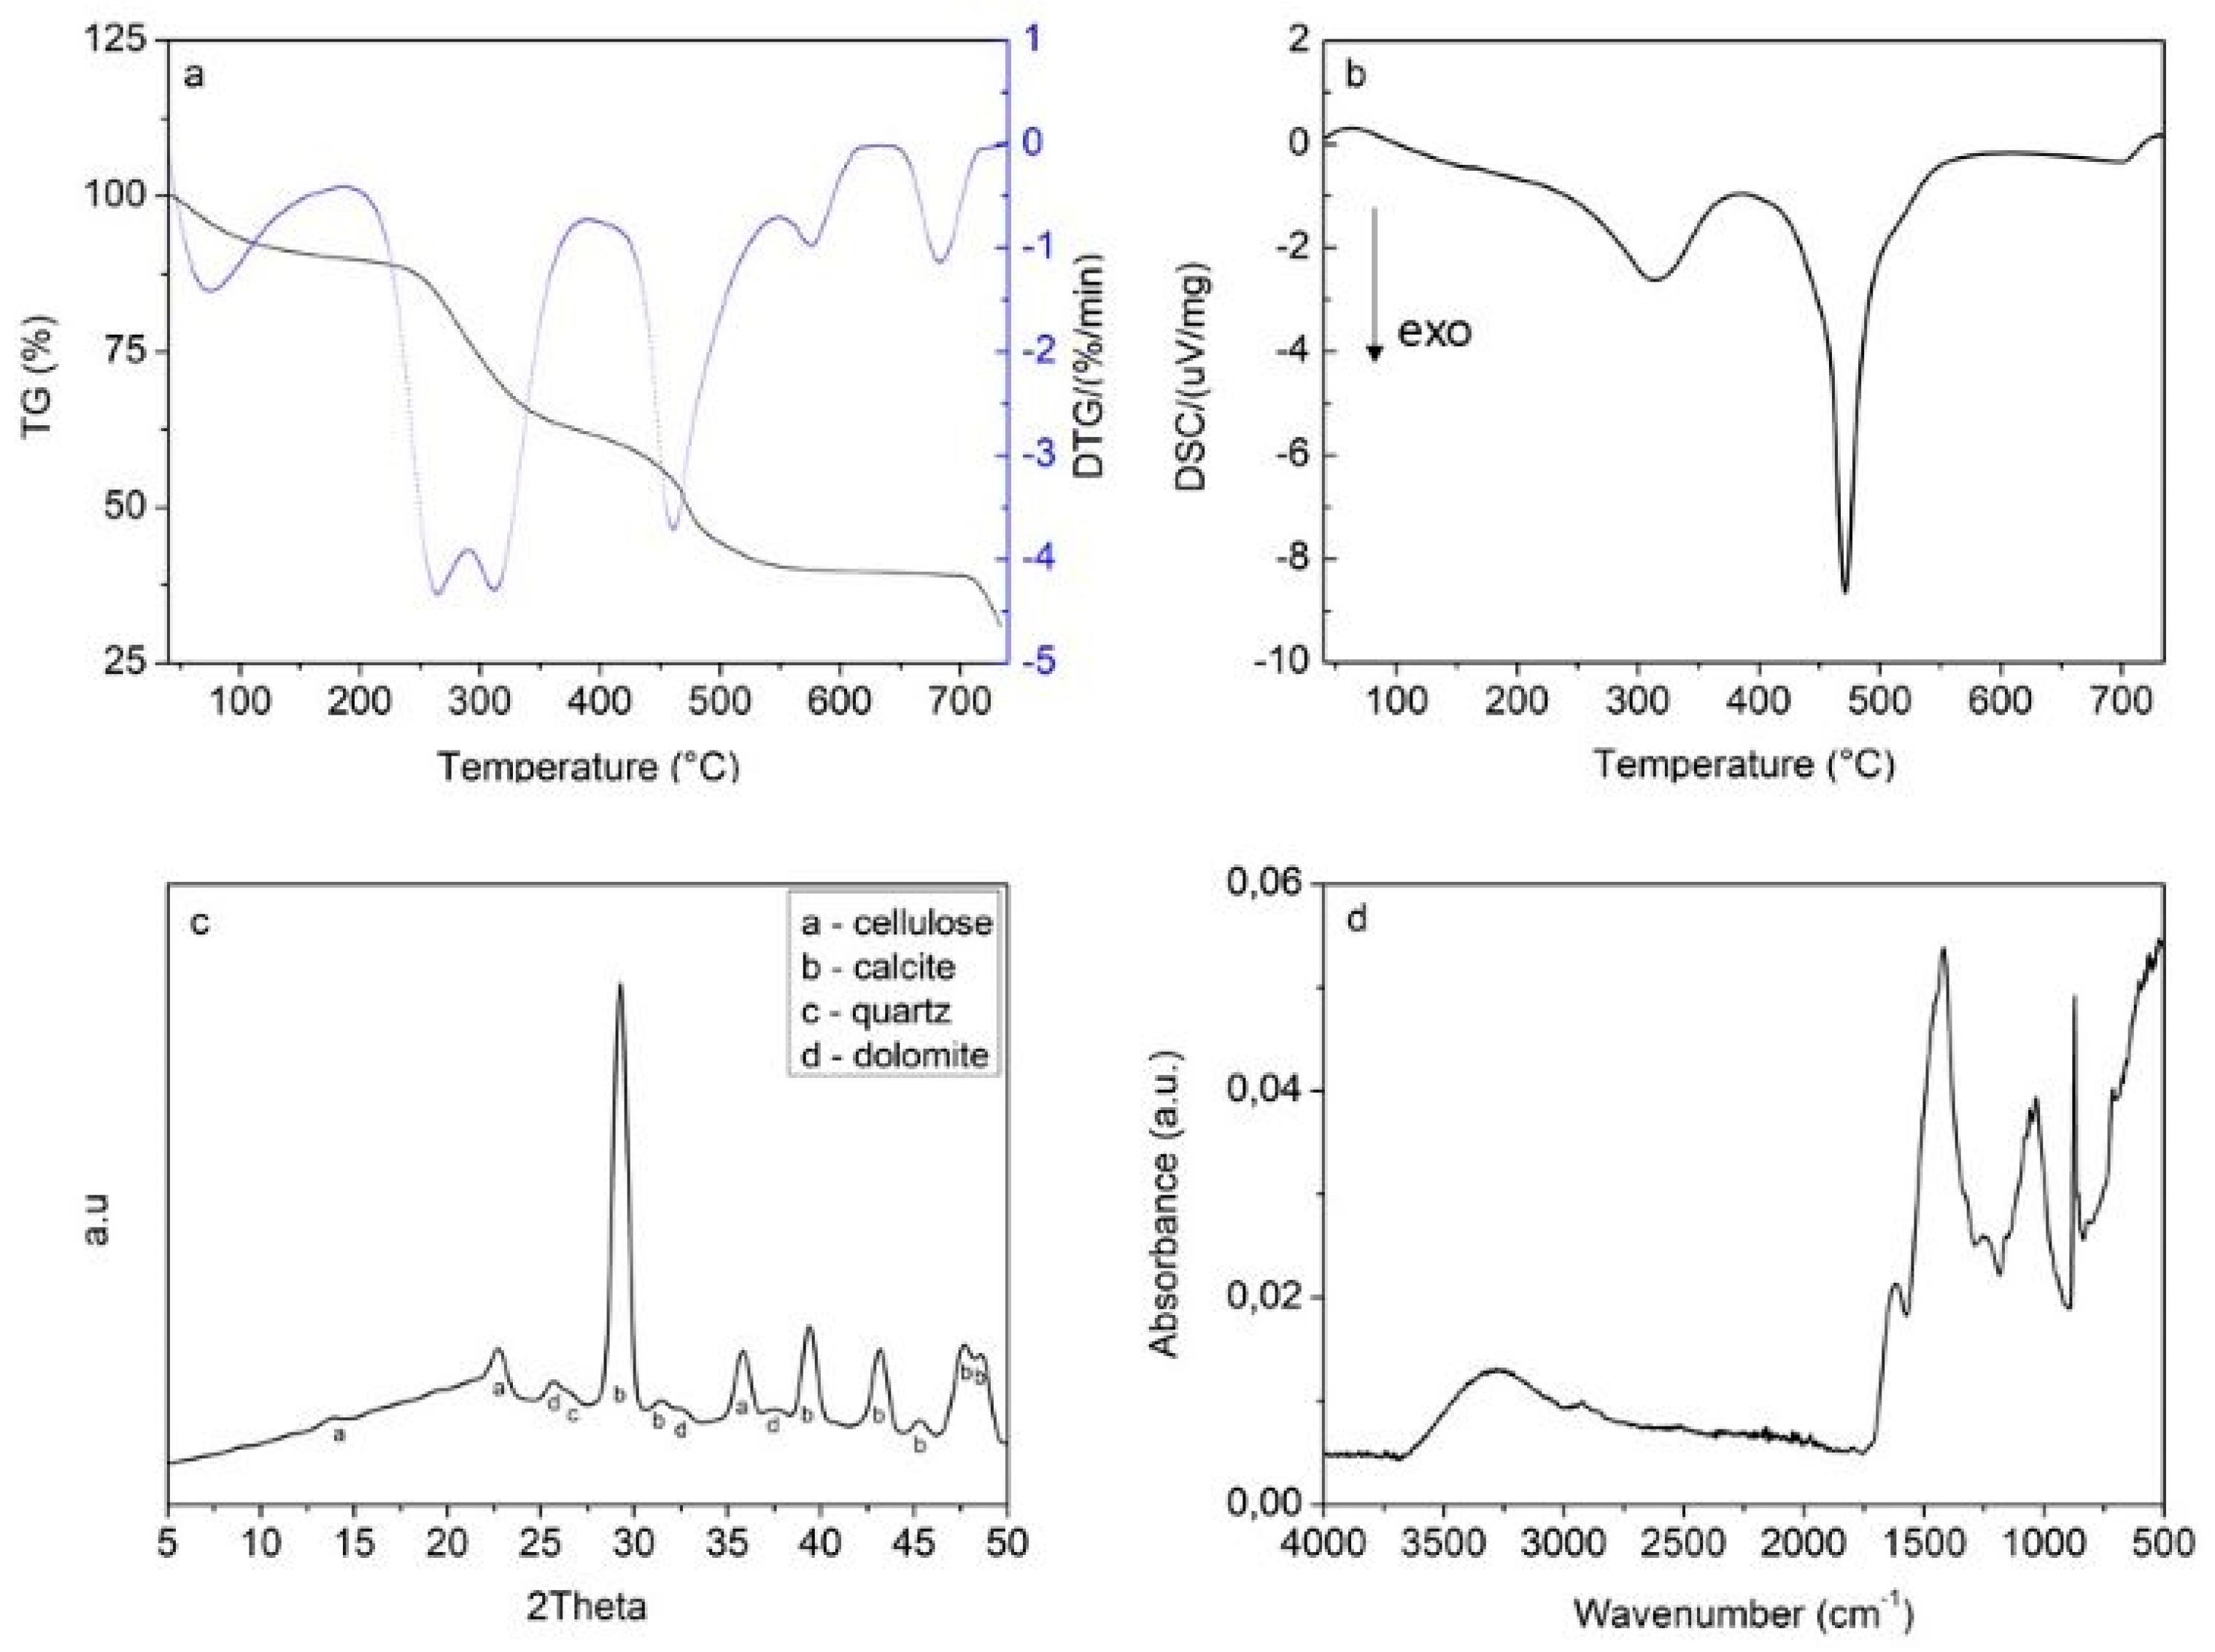
2.1.2. Thermogravimetric Analysis and Differential Scanning Calorimetry

The thermal stability of Sargassum spp. was evaluated by thermogravimetric analysis (TGA) and differential scanning calorimetry (DSC) using Netzsch STA 409. Static air, a heating rate of 10 °C·min−1 from 25 °C up to 740 °C and 10 ± 2 mg of sample were used.

2.1.3. X-ray Diffractometry

The presence of crystalline phases in the Sargassum spp. sample was evaluated by X-ray diffractometry (XRD) using a Rigaku MiniFlex 600 X-ray diffractometer with CuKα radiation generated at 20 mA and 40 KV. The samples were scanned at 0.02 2θ step at a rate of 1°·min−1 between 5° and 50° (2θ angle range).

2.1.4. FT-IR Analysis

Transmittance mode FT-IR analysis was used to characterize the presence of specific functional groups. The FT-IR was carried out by Spectrometer PerkinElmer Spectrum 100. The resolution used to capture the spectrum is 4 cm−1 in the range of 400–4000 cm−1.

2.2. Fe2O3 NPs Characterization

Commercial Iron (III) oxide nanopowder (Fe2O3 NPs) with an average size < 50 nm was purchased from Sigma Aldrich (lot. MKCM1032, CAS: 1309-37-1, MW: 156.69 g/mol).
The presence of crystalline phases was evaluated by X-ray diffractometry (XRD) using a Rigaku MiniFlex 600 X-ray diffractometer with CuKα radiation generated at 20 mA and 40 KV. NPs were scanned at 0.02 2θ step at a rate of 1°·min−1 between 20° and 70° (2θ angle range).

2.3. Sargassum + NPs Samples

NPs were added to open-air pre-dried Sargassum samples–generically indicated with “S”—at three different concentrations. S is the control sample, S+5 is the sample of Sargassum spp. with the addition of NPs at a concentration of 5 mgNPs/gS; S+10 is the sample of Sargassum spp. with a with the addition of NPs at a concentration of 10 mgNPs/gS; S+50 is the sample of Sargassum spp. with the addition of NPs at a concentration of 50 mgNPs/gS.

2.4. Inoculum

The inoculum was prepared by diluting fresh cow manure in tap water and mixing until complete dissolution. The total solids (TS), volatile solids (VS), ash and moisture were determined as described in Section 2.1.1.

2.5. Long-Term Biochemical Potential Test

The biochemical methane potential (BMP) was evaluated by anaerobic digestion trials performed by the Automatic Methane Potential Test System II (AMPTS-II®) manufactured by BPC instruments (Lund, Sweden), shown in Figure 2. 500 mL reactors contained inoculum, NPs and macroalgae within a working volume of 450 mL. The control reactors contained the same components as the sample reactors except for the NPs. The BMP tests lasted 30 days, and each condition was tested under mesophilic temperature conditions (37 °C), with an inoculum VS/substrate VS ratio equal to 3. This value has been selected because it falls within the suggested VS ratios range (between 2 and 3) for batch tests [30]. The range provides an adequate number of bacteria able to consume the substrate. Values lower than 2 can lead to the so-called substrate inhibition, whereas values higher than 3 can lead, in the presence of a substrate with low biodegradability, to an amplification of measurements’ errors as the amount of biogas produced by the substrate can be close to the inoculum background noise.
Duplicate reactors were set for all conditions, and average results were used for calculations. Experimental data were processed by Origin Pro 2019.

2.6. Mathematical Models

Kinetic models of the anaerobic digestion process represent useful instruments to be used for the scale-up of bioprocesses. They provide significant information that allows for the development of more stable processes. In the present investigation, the authors proposed three kinetic models, the first-order kinetic model (Equation (5)), the modified Gompertz model (Equation (6)) and the logistic function model (Equation (7)) to evaluate the performance of the AD of Sargassum spp. without and with the addition of different amounts of Fe2O3 NPs.
y   ( t ) = A ( 1 e k t )
y   ( t ) = A e exp [   u e A   ( m t ) + 1 ]
y   ( t ) = A 1 + e 4 u ( m t ) A + 2
where y(t) is the cumulative biogas production (NmL·g−1VS), A is the biogas production potential (NmL·g−1VS), u is maximum biogas production rate (NmL·g−1VS·day−1), e is a mathematical constant (2.718282), m is the lag phase period (days) and t is the cumulative time for biogas production (days). It is possible to determine the kinetic constants A, u and m applying a nonlinear regression model by OriginPro software. It is assumed that the biogas production corresponds to the specific growth rate of the methanogenic bacteria in the digester [24,31].

3. Results and Discussion

3.1. Sargassum spp. Characterization

Sargassum spp. is a very heterogeneous biomass. Indeed, TS, moisture, VS and ash values were in the following ranges: 76.30–82.47%, 17.53–23.70%, 37.42–55.95%, 26.52–41.60%, respectively. It is evident that an important content of ash is inert for AD. Based on these values, the dosage of NPs can be normalized, as shown in Table 1, where the mass of substrate refers to gram of open-air pre-dried biomass, total solids, and volatile solids, respectively.
The chemical composition of macroalgal biomass is summarized in Table 2.
The chemical composition of macroalgae is very important and influences the anaerobic digestion to produce biogas when macroalgae are used as the substrate. Consistent with the literature [19], the most abundant compounds were carbohydrates and ash, while the content of lipids and proteins was low. The most abundant elements in our biomass were potassium, calcium and sodium, whereas other elements had a content lower than 1%. This result substantiates previous studies on pelagic Sargassum [32]. Macronutrients (Na, Mg, Al, P, K and Ca) are essential for anaerobic growth, metabolic activity and biodigester stability. In particular, the Na level that depends on oceanic growth conditions has been found to be relevant because it reduces the potential of NH3-N toxicity, but at excessively high content, it causes severe inhibition of methanogen proliferation [33]. Heavy metal concentrations, which can be toxic and disrupt digester function, are all within the range documented in the literature for optimal microbial bioconversion efficiency [34,35]. The concentration of carbon and nitrogen is critical because the carbon-to-nitrogen (C/N) ratio strongly affects the AD process. When C/N is very high, nitrogen consumption happens quickly, and biogas production decreases. On the contrary, a low C/N ratio cause the release and accumulation of nitrogen in the form of ammonium ions, whose high level increases the pH in the digester and is toxic for methanogens bacteria. The biomass used in this work had a C/N of 7.92, significantly lower than the optimal C/N ratio of 20–30 required for a stable digestion process [19].
The TGA and its derivative DTGA of the Sargassum sample (Figure 2a) showed a first zone from 50 °C to 150 °C with an index of water loss equal to 9.2% in mass, indicating dehydration [36]. The second zone, from 150 °C to 581 °C with a mass loss of 50.90%, had two important peaks in the DTG curve at 260 °C and 320 °C. These peaks have been attributed to the decomposition of hemicellulose and cellulose, respectively [24]. The peak at 461.19 °C indicates the decomposition of lignin-based compounds [36]. The peak at 683.69 °C indicates the decomposition of inorganic material, such as the transformation of some carbonates and the elimination of heavy metals [37]. A third zone was observed from 581 °C to 740 °C with a weight loss of 18.60%, indicating the inorganic components of the sample [37] due to the presence of calcite, dolomite and quartz.
The DSC curve of the Sargassum sample (Figure 2b) was characterized by the presence of an exothermic peak at 311.7 °C associated with the thermal depolymerization of the hemicellulose [38], an exothermic peak at 471.1 °C was associated with lignin decomposition, and an endothermic peak around 700 °C indicated the decomposition of calcite.
The XRD patterns of a sample of Sargassum spp. are shown in Figure 2c, where it is possible to observe several peaks. The highest peak at 2θ = 29.28° is associated with the calcite plane (104), followed by the peaks corresponding to 2θ = 39.40–43.18–47.76–48.70°, associated with the planes (113)–(202)–(018)–(116) of calcite, respectively [39]. Furthermore, two peaks at 2θ = 13.80–22.76 are associated with the cellulose planes (110) and (002), respectively [38]. In addition to calcite and cellulose, there are traces of dolomite and quartz. Dolomite peaks at 2θ = 24.58–32.62–37.34–37.88° are associated with the planes (012)–(015)–(110)–(110), respectively [39]. Quartz is present in almost negligible quantities with only one peak at 2θ = 25.56° corresponding to the plane (011) [40]. The presence of calcite in Sargassum spp. is due to the exoskeletons of brioza living on the surface of the macroalgae [41].
The FT-IR spectrum of the sample in the range of 500–4000 cm−1 is shown in Figure 2d. The broad absorption band centered at 3300 cm−1 and 1622 cm−1 are associated with O-H stretching and the bending vibration of water [42]. Bands at around 2932 cm−1 can be attributed to methyl and methylene stretching groups of both hemicellulose and cellulose [38]. The absorption bands at 1100–1000 cm−1 are associated with several modes, such as C-H deformation or C-O or C-C stretching pertaining to carbohydrates [43] and polysaccharides [44]. The peaks at 875 and 1425 cm−1 correspond to the O–C–O out-of-plane bending and asymmetric stretching vibration peaks of calcite, respectively [45].

3.2. Fe2O3 NPs Characterization

Fe2O3 NPs were analyzed by XRD (Figure 3). The obtained pattern corresponds to maghemite (γ-Fe2O3) (PDF 9006317) [46]. Maghemite exhibits a cubic spinel structure, containing only iron cations in the trivalent state (Fe3+). The charge neutrality is guaranteed by the presence of the cation octahedral vacancies. Maghemite exhibits ferromagnetic/super-paramagnetic properties, and its chemical stability and low cost led to different applications [47].

3.3. Inoculum

Inoculum was characterized by total solids TS (4.04 ± 0.21%), moisture (95.96 ± 0.26%), volatile solids VS (2.38 ± 0.23%) and ash (1.66 ± 0.25%). These data are essential to know the mass of substrate to add in order to have an inoculum VS/substrate VS ratio of 3.

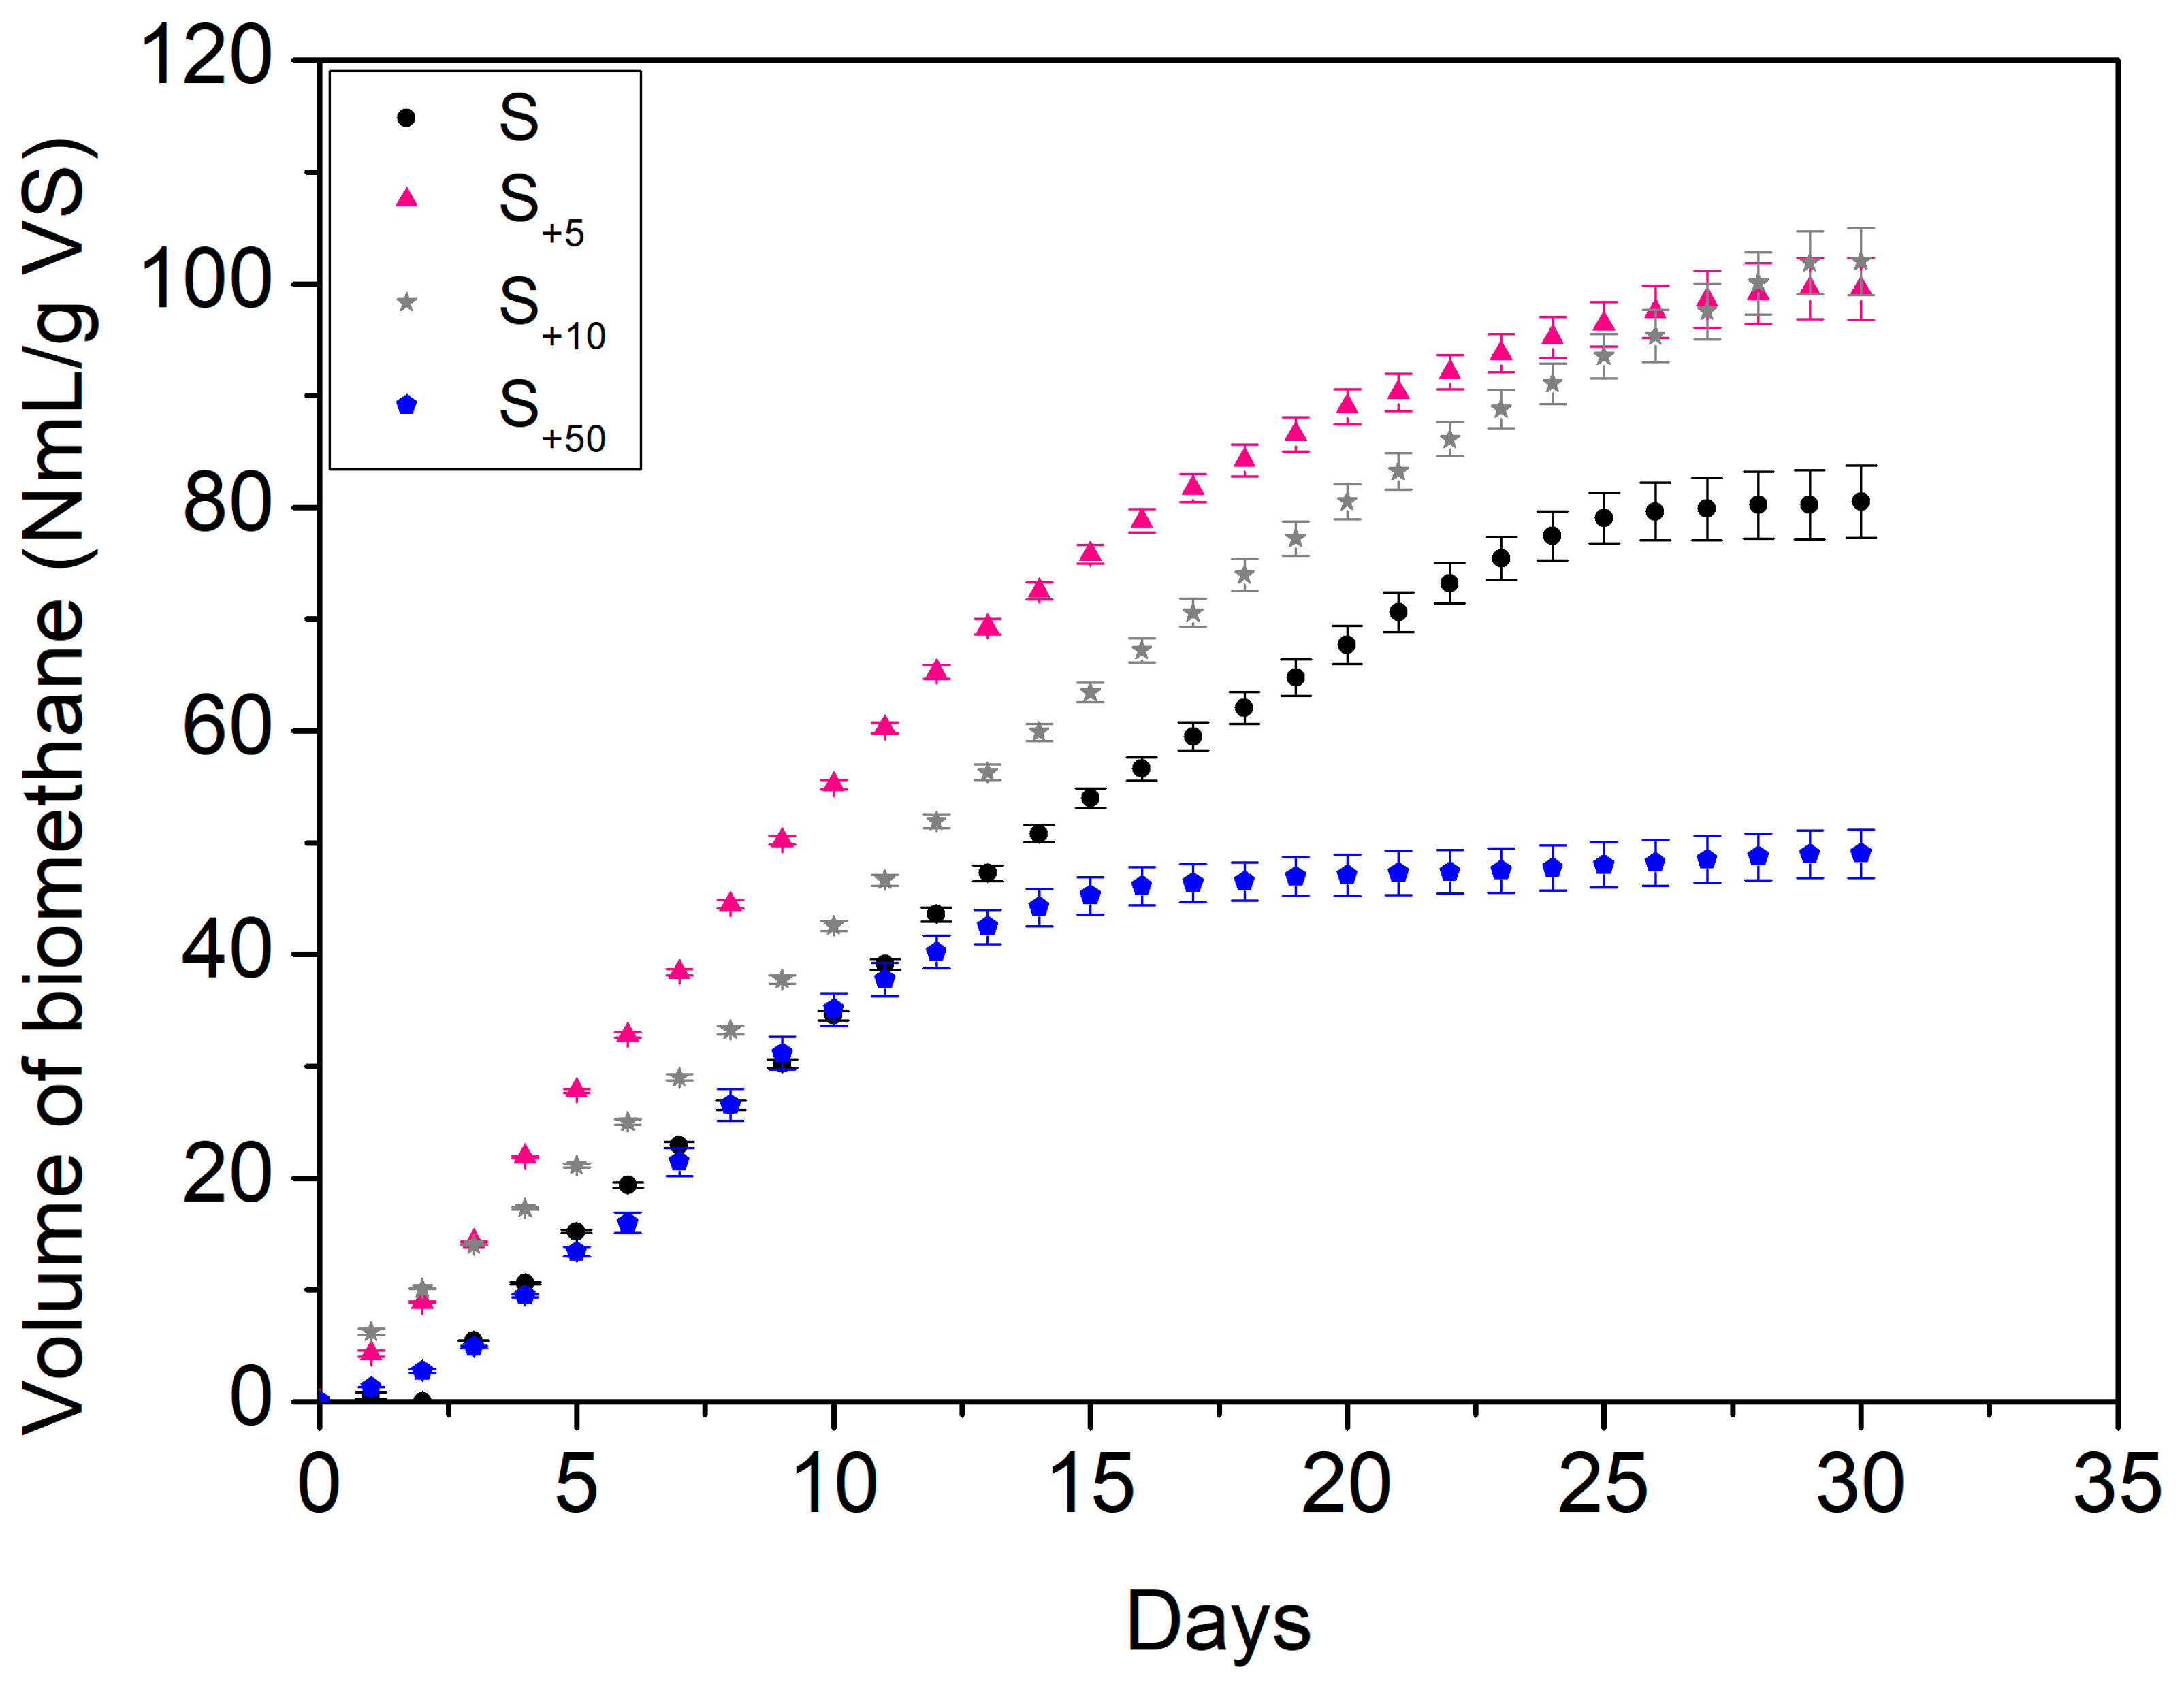
3.4. Anaerobic Digestion

Biogas production was influenced by Fe2O3 NPs. The experimental findings of biogas output were collected over a 30-day period.
Since the Sargassum spp. sample was very heterogeneous, and the BMP values were reported as a function of VS. The average values of BMP obtained at the end of the anaerobic digestion tests after 30 days (BMP30) are shown in Table 3.
The control sample (S) has a yield of 80.25 ± 3.21 NmL·g−1VS, in line with the characteristic range of Sargassum yield of 65–145 L·kg−1VS [19]. The theoretical yields of methane from lipids, proteins and carbohydrates are 1.014, 0.851 and 0.415 LCH4 g−1VS, respectively [19]. Therefore, lipids provide the highest theoretical yield, but their level in Sargassum is very low and it justifies the low yield, together with the low C/N value. Based on the content of lipids, proteins and carbohydrates (Table 2), the approximate value of the theoretical BMP was calculated by Equation (8):
B M P t = B M P C · m C + B M P P · m P + B M P L · m L m C + m P + m L
where BMPC, BMPP and BMPL are the theoretical BMP values of carbohydrates, proteins and lipids, respectively; mC, mP and mL are the masses of carbohydrates, proteins and lipids in the substrate, respectively.
The approximate theoretical BMP was 438 NmL·g−1VS. Therefore, the experimental BMP is just 18% of the theoretical value, consistent with previous literature [1].
The maximum total biogas yield of 101.90 ± 2.98 NmL·g−1VS (+26.97%) was achieved with the S+10 sample. S+5 and S+50 produced 99.57 ± 2.76 NmL·g−1VS (+24.07%) and 48.97 ± 2.32 NmL·g−1VS (−38.97%) of methane, respectively.
Average cumulative methane production values are given in Figure 4.
Low concentrations of NPs (5 mg·g−1S and 10 mg·g−1S) improved the biogas production compared to the control (S). Sample S showed an increasing trend up to the 25th day and then remained constant. Samples S+5 and S+10 showed a similar trend with a higher reaction rate for sample S+10. The addition of NPs in low concentration leads to a daily increase in biogas production compared to sample S. This behavior can be attributed to accelerated hydrolysis and enzymatic uptake activity [48]. The highest concentration, S+50, resulted in the inhibition of AD and no further methane production after 16 days. The behavior has also been observed by Ünşar et al. [18]. They reported that the methane potential of waste activated sludge (WAS) using 500 mg Fe2O3NPs/g TS inhibited the methanogenic consortium and caused decreased biogas production and specific methane production rate. Specifically, inhibition in that study, also confirmed by the present investigation, emerged after the 12th day of the long-term BMP test. They also reported that lower concentrations of Fe2O3 NPs, instead, slightly enhanced the methane production on the first days of the BMP test. The finding is also consistent with our results and with other outcomes of using Fe2O3 NPs on AD reported in the literature for short-term investigations.
The possible causes of the found behavior in methane production were identified by Wu et al. [49]. They stated that the attached Fe2O3 NPs on the cell surface or their internalization would directly cause cell physical deformation, perforation and membrane or internal content disorganization. Therefore, the increase in CH4 production in the early stages of experiments arises from the trace elements’ impact of Fe2O3 NPs on anaerobic microorganisms. In later stages, as a result of the increasing accumulation of Fe in the cells of anaerobic microorganisms, it exceeds the necessary trace concentration and causes cell death, thus stopping biogas production.
Therefore, the effect of NPs on AD was dosage-dependent. In proper concentration, the addition of Fe2O3-NPs improved AD and resulted in higher methane production and organic matter degradation. Instead, an excessive dosage of NPs hindered the overall process resulting in reductions in biogas production. Similar results were obtained in previous research by varying the dosages of Ag NPs, MgO NPs, nZVI and Fe2O3 NPs and they were attributed to the shift in the microbial community structure of the anaerobic digestion system and numbers of copies [15].
The prediction and the action mechanism of NPs on AD are challenges due to the variety of species of bacteria that are involved in the digestion systems. Few investigations have been reported in the literature on this topic [15], and none of them were focused on the AD of brown macroalgae; thus it is not possible to compare our findings with previous results.
The increase in methane production can be assigned to both the direct interspecies electron transfer (DIET) via Fe2O3 and the insolubility of Fe2O3 NPs [50]. The DIET may facilitate the methanogenesis by conductive materials used for electron transfer. Fe2O3 NPs are semi-conductive and act as electron conduits between the electron donors and acceptors, thus accelerating methane production from the reduced electron carriers and CO2, resembling the behavior of enzymes in catalytic reactions in a sequence of biochemical reactions [15]. The insolubility of Fe2O3 NPs prevents the release of toxic metal ions that are primarily responsible for toxicity to certain living organisms [51,52,53]. Nevertheless, high Fe2O3 NPs concentrations show an inhibitory effect.
Our results were consistent with novel literature related to Fe2O3 NPs [14,15,16,17,18].

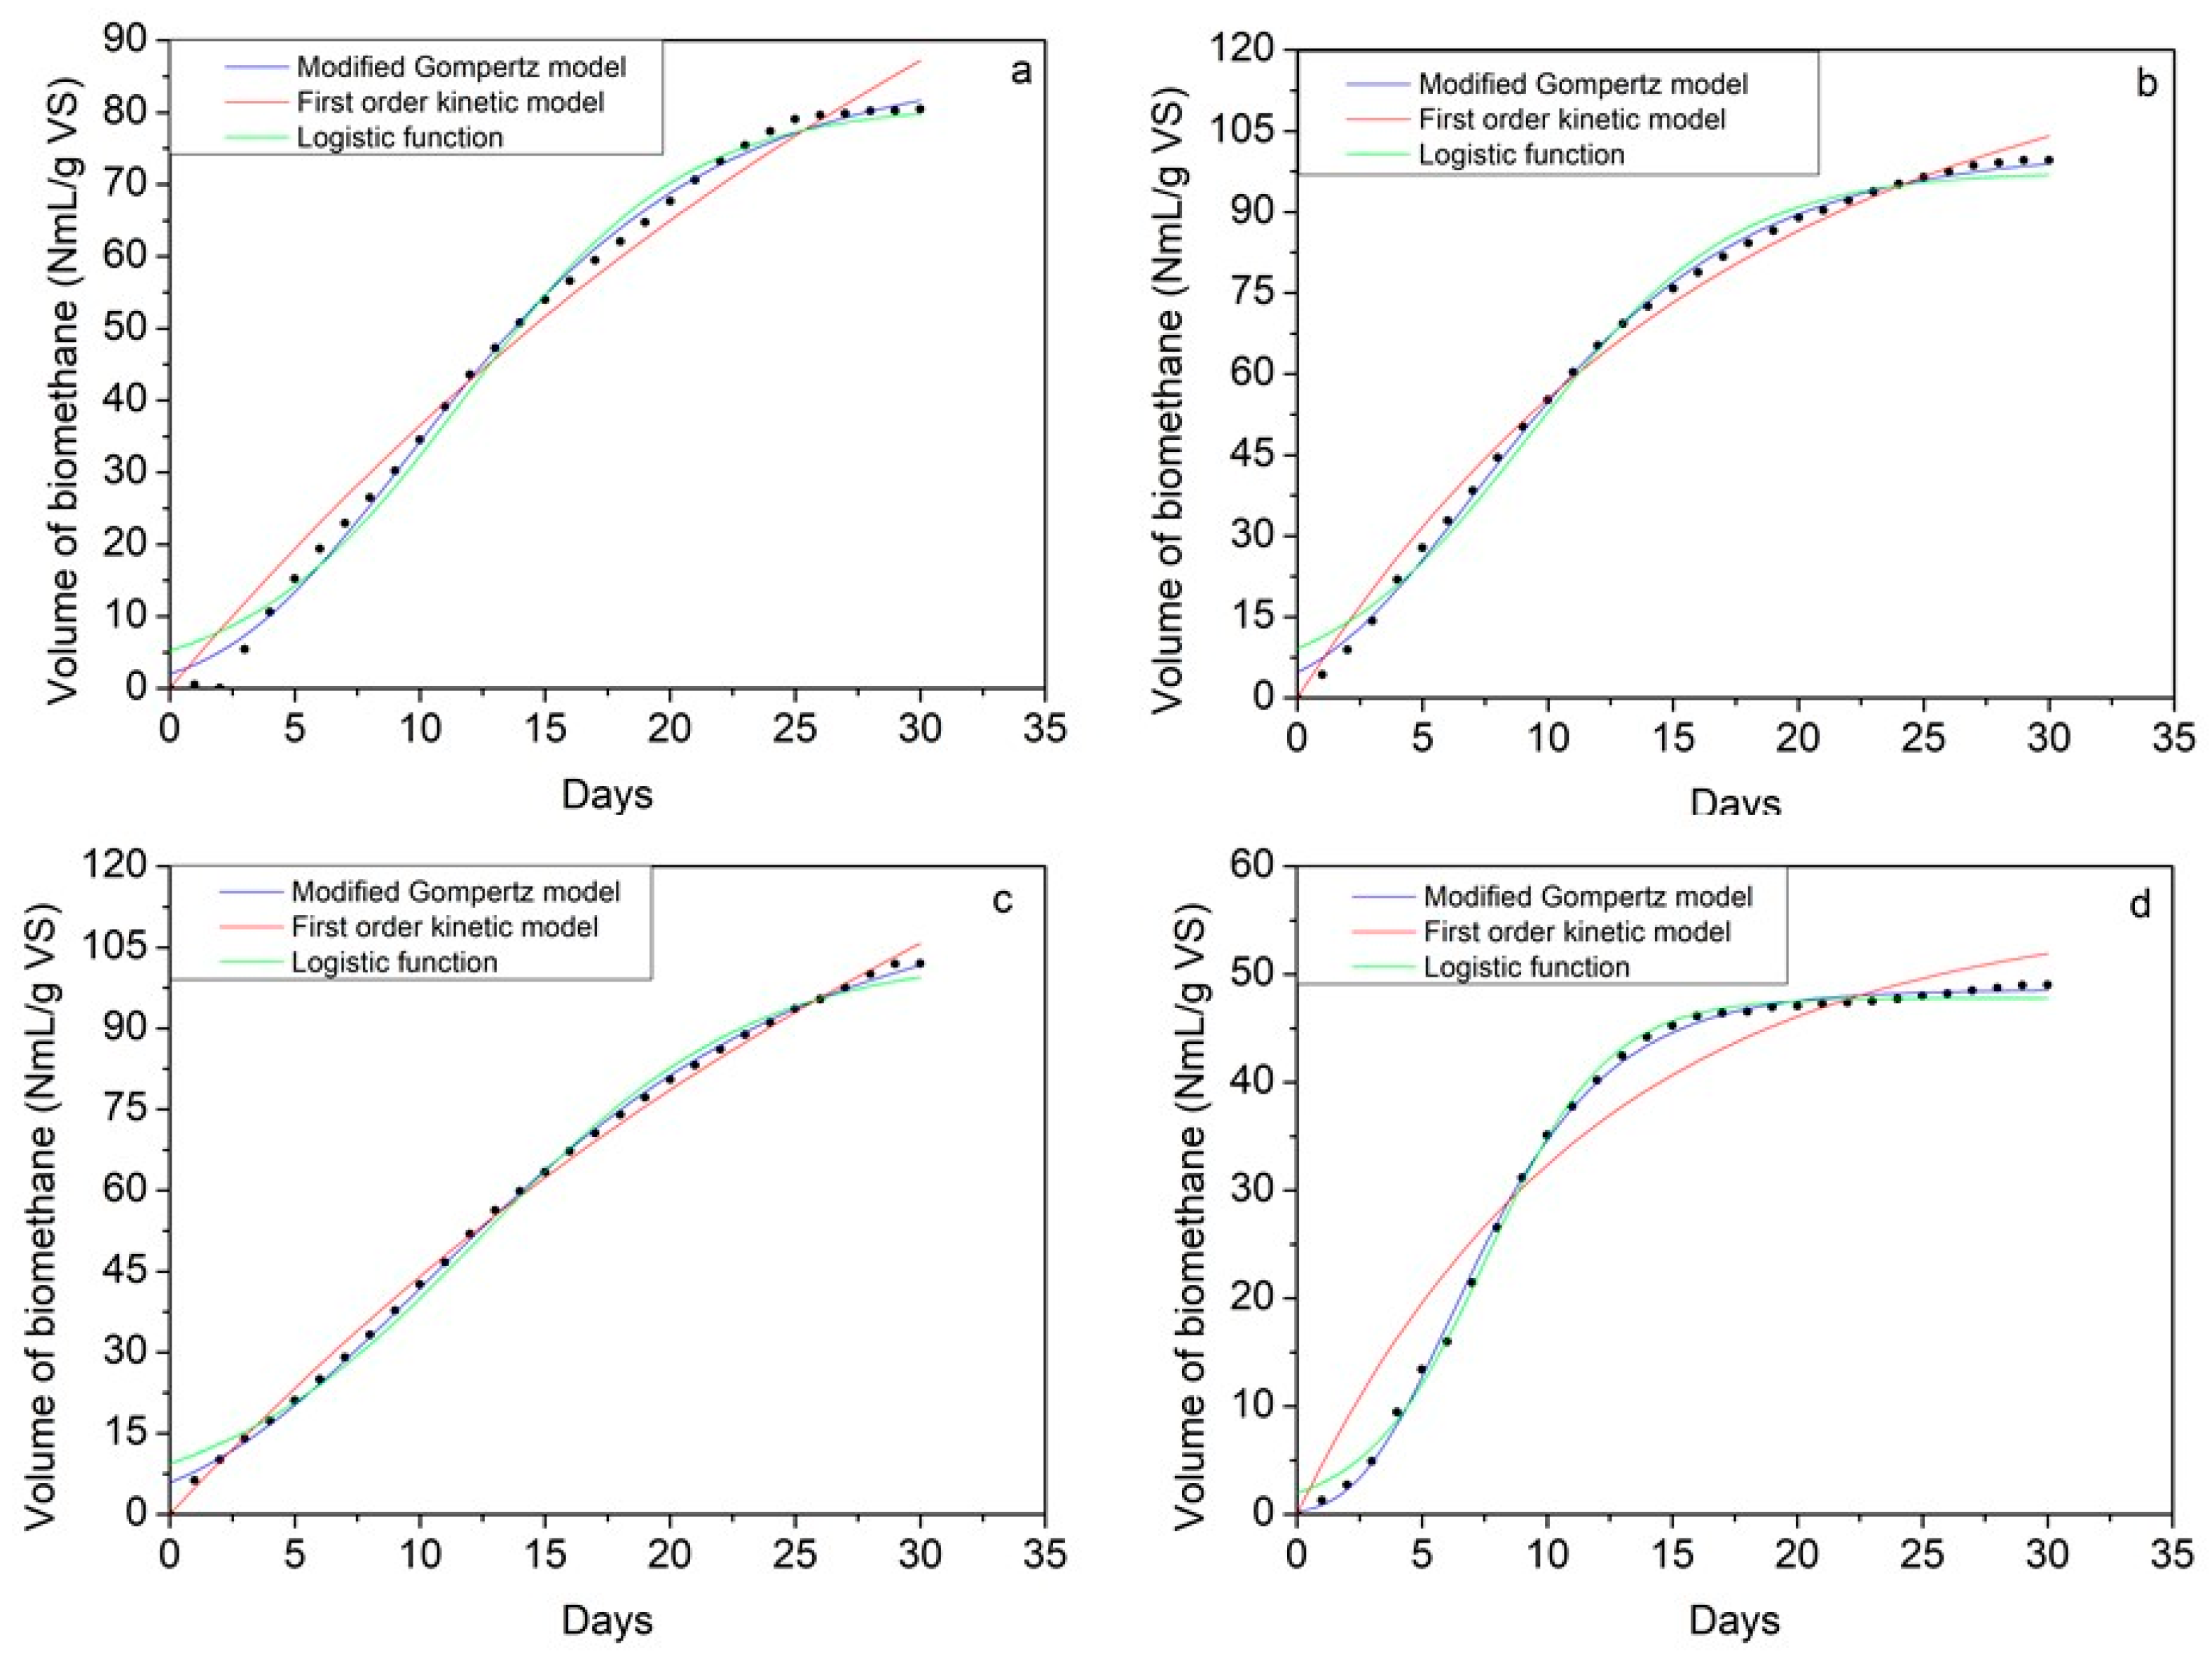
3.5. Mathematical Models

The three kinetic models were fitted on the experimental data based on the average cumulative production of net volume of methane during anaerobic digestion of each experimental group. Three main regions can be observed in the fitted curves reported in Figure 5: the lag phase region, the exponential phase region characterized by a sharp increase in the cumulative biogas yield and a plateau region, where biomethane production nearly stops. Each of the three kinetic models delivers specific and additional information [54]. The first-order kinetic model provides information about the hydrolysis rate constant. The modified Gompertz model describes the cell density during microbial growth periods in terms of exponential growth rates and lag phase. The logistic function model is appropriate to describe the initial exponential increase and a final stabilization at the highest production level [55]. Thus, all three kinetic models were used in this investigation to determine the cumulative biogas production potential, hydrolysis kinetics, lag phase duration, and maximum methane production.
All of the parameters estimated using the three fitted kinetic, specifically, the hydrolysis rate constant (first order, k), lag phase duration (m), maximum biogas production rate (u) and maximum biogas yield potential (A), are reported in Table 4.
All three kinetic models reasonably described the experimental data. The modified Gompertz model showed the most robust estimation, followed by the logistic function model, whereas the first-order kinetic model is less accurate in estimation.
The maximum predicted biomethane yield (A) derived from the modified Gompertz model and the logistic function model were close to the experimental data. The difference between the experimental A value and the A value obtained by the modified Gompertz model for systems S, S+5, S+10, S+50 were 8.1%, 1.7%, 10.3% and 0.9%, respectively. The differences using the logistic function model for systems S, S+5, S+10, S+50 were 0.9%, 2.1%, 1.5% and 2.38%, respectively. The first-order kinetic model, instead, failed in accurately fitting the biomethane yield with differences for systems S, S+5, S+10, S+50 equal to 106%, 27%, 100% and 14.8%, respectively. Similar findings were obtained by Li et al. [56].
The hydrolysis rate constants (k) of the different systems have been determined from the first-order model, and they are, for system S, S+5, S+10, S+50, equal to 0.021, 0.063, 0.022 and 0.082 (day−1). The first-order kinetic model assumes that hydrolysis is the rate-limiting step during the AD process of complex feedstocks. In this case, faster degradation and biogas production rates are associated with higher k values. In the present investigation, the highest k value was obtained for the system S+50, which showed the lowest degradation and biogas production. The explanation can be found by observing that the first-order model poorly fits that set of experimental data.
The parameter u (NmL·g−1VS·day−1) indicates the maximum biogas production rate that can be obtained in each system. The highest value, using Gompertz modified model, was achieved by system S+5. It was equal to 6.045 NmL·g−1VS·day−1, and it can be attributed to the attached Fe2O3 NPs on the cell surface or their internalization that directly causes cell physical deformation, perforation and membrane or internal content disorganization, thus increasing the specific methane production rate in the early stages [49].
The parameter m indicates the delay period. According to the modified Gompertz model, the period required to start the production of biomethane was 2.289 days for system S, whereas at low concentrations of NPs, this period was reduced to 0.768 for the sample S+5 and 0.829 for the sample S+10. This behavior can be attributed to the acceleration of hydrolysis due to the presence of NPs. Additionally, the amounts of NPs to VS were close, so their effect was similar. The sample at a high concentration of NPs (S+50) showed different behavior. In this case, the estimated delay time was 2.440 days, longer than the other systems containing Fe2O3 NPs. Furthermore, the system S+50 was characterized by a shorter effective biogas production period obtained by subtracting the lag phase duration from the period taken to achieve 90% of total biogas production, indicating a shorter AD period and an irreversible inhibition process [55]. It can be explained by the increasing accumulation of Fe in the cells of anaerobic microorganisms that causes cell death, thus prematurely stopping biogas production.

4. Conclusions

One of the most important problems of the anaerobic digestion (AD) of brown algae is the low biomethane yield. The use of nanoparticles (NPs) with proper concentration can improve the process due to their ability to enhance the performance of biogas production, shorten the lag phase, and improve process stability. The impact of maghemite-based NPs on the anaerobic digestion of brown macroalgae Sargassum spp. was investigated for the first time in this study. The biochemical methane potential (BMP) test was used to investigate the possible benefits of Fe2O3-NPs at three different concentrations on Sargassum macroalgae treatment. The effectiveness of NPs for enhancing methane production was dose-dependent. Coherently with previous studies on other biomasses, the addition of NPs influenced the process performace in the opposite way, showing a promoting effect at low concentrations (5–10 mg·g−1) and inhibition at the highest dosage (50 mg·g−1). The results showed that the highest biomethane yield was obtained by adding 10 mgNPs·g−1 with an increase of 26.97% compared to the control sample. Fe2O3 NPs, at low concentrations, improved AD by promoting direct interspecies electron transfer (DIET) and negligible metal ions release. Higher concentrations inhibited AD. Therefore, this work lays a foundation for an improved biogas yield by Fe2O3-NPs addition in AD of brown algae.

Author Contributions

Conceptualization, R.P. and C.G.L.; methodology, R.P. and P.F.; software, R.P.; validation, R.P. and S.C.; formal analysis, R.P. and S.C.; investigation, R.P.; data curation, R.P. and C.G.L.; writing—original draft preparation, R.P. and C.G.L.; writing—review and editing, S.C. and C.G.L. All authors have read and agreed to the published version of the manuscript.

Funding

This research received no external funding.

Data Availability Statement

No new data were created or analyzed in this study. Data sharing is not applicable to this article.

Conflicts of Interest

The authors declare no conflict of interest.

References

  1. Milledge, J.J.; Nielsen, B.V.; Maneein, S.; Harvey, P.J. A Brief Review of Anaerobic Digestion of Algae for BioEnergy. Energies 2019, 12, 1166. [Google Scholar] [CrossRef] [Green Version]
  2. Zhang, Y.; Xu, R.; Xiang, Y.; Lu, Y.; Jia, M.; Huang, J.; Xu, Z.; Cao, J.; Xiong, W.; Yang, Z. Addition of Nanoparticles Increases the Abundance of Mobile Genetic Elements and Changes Microbial Community in the Sludge Anaerobic Digestion System. J. Hazard Mater. 2021, 405, 124206. [Google Scholar] [CrossRef]
  3. Tsui, T.H.; Zhang, L.; Zhang, J.; Dai, Y.; Tong, Y.W. Methodological Framework for Wastewater Treatment Plants Delivering Expanded Service: Economic Tradeoffs and Technological Decisions. Sci. Total Environ. 2022, 823, 153616. [Google Scholar] [CrossRef] [PubMed]
  4. Tsui, T.H.; Zhang, L.; Zhang, J.; Dai, Y.; Tong, Y.W. Engineering Interface between Bioenergy Recovery and Biogas Desulfurization: Sustainability Interplays of Biochar Application. Renew. Sustain. Energy Rev. 2022, 157, 112053. [Google Scholar] [CrossRef]
  5. Jadhava, P.; Muhammad, N.; Bhuyar, P.; Krishnan, S.; Razak, A.S.A.; Zularisam, A.W.; Nasrullah, M. A Review on the Impact of Conductive Nanoparticles (CNPs) in Anaerobic Digestion: Applications and Limitations. Environ. Technol. Innov. 2021, 23, 101526. [Google Scholar] [CrossRef]
  6. Jadhav, P.; Nasrullah, M.; Zularisam, A.W.; Bhuyar, P.; Krishnan, S.; Mishra, P. Direct Interspecies Electron Transfer Performance through Nanoparticles (NPs) for Biogas Production in the Anaerobic Digestion Process. Int. J. Environ. Sci. Technol. 2022, 19, 10427–10439. [Google Scholar] [CrossRef]
  7. Kumar, S.S.; Ghosh, P.; Kataria, N.; Kumar, D.; Thakur, S.; Pathania, D.; Kumar, V.; Nasrullah, M.; Singh, L. The Role of Conductive Nanoparticles in Anaerobic Digestion: Mechanism, Current Status and Future Perspectives. Chemosphere 2021, 280, 130601. [Google Scholar] [CrossRef]
  8. Dehhaghi, M.; Tabatabaei, M.; Aghbashlo, M.; Kazemi Shariat Panahi, H.; Nizami, A.S. A State-of-the-Art Review on the Application of Nanomaterials for Enhancing Biogas Production. J. Environ. Manag. 2019, 251, 109597. [Google Scholar] [CrossRef]
  9. Ossinga, C.G. Application of Iron Oxide Nanoparticles for Biogas Yield Optimization from Winery Solid Waste and Sorghum Stover. Master’s Thesis, Chemical Engineering, Cape Peninsula University of Technology, Bellville, South Africa, 2020. [Google Scholar]
  10. Ugwu, S.N.; Enweremadu, C.C. Enhancement of Biogas Production Process from Biomass Wastes Using Iron-Based Additives: Types, Impacts, and Implications. Energy Sources Part A Recovery Util. Environ. Eff. 2020, 44, 4458–4480. [Google Scholar] [CrossRef]
  11. Abdelwahab, T.A.M.; Fodah, A.E.M. Utilization of Nanoparticles for Biogas Production Focusing on Process Stability and Effluent Quality. SN Appl. Sci. 2022, 4, 332. [Google Scholar] [CrossRef]
  12. Jadhav, P.; Khalid, Z.B.; Zularisam, A.W.; Krishnan, S.; Nasrullah, M. The Role of Iron-Based Nanoparticles (Fe-NPs) on Methanogenesis in Anaerobic Digestion (AD) Performance. Environ. Res 2022, 204, 112043. [Google Scholar] [CrossRef]
  13. Bharathi, P.; Dayana, R.; Rangaraju, M.; Varsha, V.; Subathra, M.; Gayathri; Sundramurthy, V.P. Biogas Production from Food Waste Using Nanocatalyst. J. Nanomater. 2022, 2022, 7529036. [Google Scholar] [CrossRef]
  14. Tetteh, E.K.; Rathilal, S. Application of Biomagnetic Nanoparticles for Biostimulation of Biogas Production from Wastewater Treatment. Mater. Today Proc. 2021, 45, 5214–5220. [Google Scholar] [CrossRef]
  15. Wang, T.; Zhang, D.; Dai, L.; Chen, Y.; Dai, X. Effects of Metal Nanoparticles on Methane Production from Waste-Activated Sludge and Microorganism Community Shift in Anaerobic Granular Sludge. Sci. Rep. 2016, 6, 25857. [Google Scholar] [CrossRef] [PubMed]
  16. Farghali, M.; Andriamanohiarisoamanana, F.J.; Ahmed, M.M.; Kotb, S.; Yamashiro, T.; Iwasaki, M.; Umetsu, K. Impacts of Iron Oxide and Titanium Dioxide Nanoparticles on Biogas Production: Hydrogen Sulfide Mitigation, Process Stability, and Prospective Challenges. J. Environ. Manag. 2019, 240, 160–167. [Google Scholar] [CrossRef] [PubMed]
  17. Rana, M.S.; Bhushan, S.; Prajapati, S.K. New Insights on Improved Growth and Biogas Production Potential of Chlorella Pyrenoidosa through Intermittent Iron Oxide Nanoparticle Supplementation. Sci. Rep. 2020, 10, 14119. [Google Scholar] [CrossRef]
  18. Kökdemir Ünşar, E.; Perendeci, N.A. What Kind of Effects Do Fe2O3 and Al2O3 Nanoparticles Have on Anaerobic Digestion, Inhibition or Enhancement? Chemosphere 2018, 211, 726–735. [Google Scholar] [CrossRef]
  19. Lopresto, C.G.; Paletta, R.; Filippelli, P.; Galluccio, L.; de la Rosa, C.; Amaro, E.; Jáuregui-Haza, U.; de Frias, J.A. Sargassum Invasion in the Caribbean: An Opportunity for Coastal Communities to Produce Bioenergy Based on Biorefinery—An Overview. Waste Biomass Valorization 2022, 13, 2769–2793. [Google Scholar] [CrossRef]
  20. El Nemr, A.; Hassaan, M.A.; Elkatory, M.R.; Ragab, S.; Pantaleo, A. Efficiency of Fe3O4 Nanoparticles with Different Pretreatments for Enhancing Biogas Yield of Macroalgae Ulva Intestinalis Linnaeus. Molecules 2021, 26, 5105. [Google Scholar] [CrossRef]
  21. Zaidi, A.A.; Khan, S.Z.; Shi, Y. Optimization of Nickel Nanoparticles Concentration for Biogas Enhancement from Green Algae Anaerobic Digestion. Mater. Today Proc. 2019, 39, 1025–1028. [Google Scholar] [CrossRef]
  22. Zaidi, A.A.; RuiZhe, F.; Shi, Y.; Khan, S.Z.; Mushtaq, K. Nanoparticles Augmentation on Biogas Yield from Microalgal Biomass Anaerobic Digestion. Int. J. Hydrogen Energy 2018, 43, 14202–14213. [Google Scholar] [CrossRef]
  23. Zaidi, A.A.; Khan, S.Z.; Naseer, M.N.; Almohammadi, H.; Asif, M.; Abdul Wahab, Y.; Islam, M.A.; Johan, M.R.; Hussin, H. Optimization of Cobalt Nanoparticles for Biogas Enhancement from Green Algae Using Response Surface Methodology. Period. Polytech. Chem. Eng. 2023, 67, 116–126. [Google Scholar] [CrossRef]
  24. Zaidi, A.A.; Feng, R.; Malik, A.; Khan, S.Z.; Shi, Y.; Bhutta, A.J.; Shah, A.H. Combining Microwave Pretreatment with Iron Oxide Nanoparticles Enhanced Biogas and Hydrogen Yield from Green Algae. Processes 2019, 7, 24. [Google Scholar] [CrossRef] [Green Version]
  25. Shi, Y.; Huang, K.; Feng, R.; Wang, R.; Liu, G.; Zaidi, A.A.; Zhang, K. Combined MgO Nanoparticle and Microwave Pre-Treatment on Biogas Increase from Enteromorpha during Anaerobic Digestion. IOP Conf. Ser. Earth Environ. Sci. 2020, 450, 012025. [Google Scholar] [CrossRef]
  26. Zaidi, A.A.; RuiZhe, F.; Malik, A.; Khan, S.Z.; Bhutta, A.J.; Shi, Y.; Mushtaq, K. Conjoint Effect of Microwave Irradiation and Metal Nanoparticles on Biogas Augmentation from Anaerobic Digestion of Green Algae. Int. J. Hydrogen Energy 2019, 44, 14661–14670. [Google Scholar] [CrossRef]
  27. Zaidi, A.A.; Khan, S.Z.; Almohamadi, H.; Mahmoud, E.R.I.; Naseer, M.N. Nanoparticles Synergistic Effect with Various Substrate Pretreatment and Their Comparison on Biogas Production from Algae Waste. Bull. Chem. React. Eng. Catal. 2021, 16, 374–382. [Google Scholar] [CrossRef]
  28. Ajay, C.M.; Mohan, S.; Dinesha, P.; Rosen, M.A. Review of Impact of Nanoparticle Additives on Anaerobic Digestion and Methane Generation. Fuel 2020, 277, 118234. [Google Scholar] [CrossRef]
  29. Liu, M.; Wei, Y.; Leng, X. Improving Biogas Production Using Additives in Anaerobic Digestion: A Review. J. Clean. Prod. 2021, 297, 126666. [Google Scholar] [CrossRef]
  30. Rosato, M.A. Manuale per Il Gestore Dell’impianto Di Biogas; Editoriale Delfino: Milano, Italy, 2015; ISBN 978-88-97323-41-9. [Google Scholar]
  31. Syaichurrozi, I.; Budiyono; Sumardiono, S. Predicting Kinetic Model of Biogas Production and Biodegradability Organic Materials: Biogas Production from Vinasse at Variation of COD/N Ratio. Bioresour. Technol. 2013, 149, 390–397. [Google Scholar] [CrossRef]
  32. Thompson, T.M.; Young, B.R.; Baroutian, S. Efficiency of Hydrothermal Pretreatment on the Anaerobic Digestion of Pelagic Sargassum for Biogas and Fertiliser Recovery. Fuel 2020, 279, 118527. [Google Scholar] [CrossRef]
  33. Wall, D.M.; Allen, E.; Straccialini, B.; O’Kiely, P.; Murphy, J.D. The Effect of Trace Element Addition to Mono-Digestion of Grass Silage at High Organic Loading Rates. Bioresour. Technol. 2014, 172, 349–355. [Google Scholar] [CrossRef]
  34. Schmidt, T.; McCabe, B.K.; Harris, P.W.; Lee, S. Effect of Trace Element Addition and Increasing Organic Loading Rates on the Anaerobic Digestion of Cattle Slaughterhouse Wastewater. Bioresour. Technol. 2018, 264, 51–57. [Google Scholar] [CrossRef]
  35. Tian, Y.; Zhang, H.; Huang, H.; Zheng, L.; Li, S.; Hao, H.; Yin, M.; Cao, Y. Process Analysis of Anaerobic Fermentation Exposure to Metal Mixtures. Int. J. Environ. Res. Public Health 2019, 16, 2458. [Google Scholar] [CrossRef] [PubMed] [Green Version]
  36. Alzate-Gaviria, L.; Domínguez-Maldonado, J.; Chablé-Villacís, R.; Olguin-Maciel, E.; Leal-Bautista, R.M.; Canché-Escamilla, G.; Caballero-Vázquez, A.; Hernández-Zepeda, C.; Barredo-Pool, F.A.; Tapia-Tussell, R. Presence of Polyphenols Complex Aromatic “Lignin” in Sargassum Spp. From Mexican Caribbean. J. Mar. Sci. Eng. 2021, 9, 6. [Google Scholar] [CrossRef]
  37. López-Sosa, L.B.; Alvarado-Flores, J.J.; Corral-Huacuz, J.C.; Aguilera-Mandujano, A.; Rodríguez-Martínez, R.E.; Guevara-Martínez, S.J.; Alcaraz-Vera, J.V.; Rutiaga-Quiñones, J.G.; Zárate-Medina, J.; Ávalos-Rodríguez, M.L.; et al. A Prospective Study of the Exploitation of Pelagic Sargassum Spp. As a Solid Biofuel Energy Source. Appl. Sci. 2020, 10, 8706. [Google Scholar] [CrossRef]
  38. Candamano, S.; Crea, F.; Coppola, L.; de Luca, P.; Coffetti, D. Influence of Acrylic Latex and Pre-Treated Hemp Fibers on Cement Based Mortar Properties. Constr. Build. Mater. 2021, 273, 121720. [Google Scholar] [CrossRef]
  39. Gunasekaran, S.; Anbalagan, G.; Pandi, S. Raman and Infrared Spectra of Carbonates of Calcite Structure. J. Raman Spectrosc. 2006, 37, 892–899. [Google Scholar] [CrossRef]
  40. Wang, Z.; Che, Y.; Li, J.; Wu, W.; Yan, B.; Zhang, Y.; Wang, X.; Yu, F.; Chen, G.; Zuo, X.; et al. Effects of Anaerobic Digestion Pretreatment on the Pyrolysis of Sargassum: Investigation by TG-FTIR and Py-GC/MS. Energy Convers. Manag. 2022, 267, 115934. [Google Scholar] [CrossRef]
  41. Davis, D.; Simister, R.; Campbell, S.; Marston, M.; Bose, S.; McQueen-Mason, S.J.; Gomez, L.D.; Gallimore, W.A.; Tonon, T. Biomass Composition of the Golden Tide Pelagic Seaweeds Sargassum Fluitans and S. Natans (Morphotypes I and VIII) to Inform Valorisation Pathways. Sci. Total Environ. 2021, 762, 143134. [Google Scholar] [CrossRef] [PubMed]
  42. Alvarado Flores, J.J.; Alcaraz Vera, J.V.; Ávalos Rodríguez, M.L.; Rutiaga Quiñones, J.G.; Valencia, J.E.; Guevara Martínez, S.J.; Ríos, E.T.; Zarraga, R.A. Kinetic, Thermodynamic, FT-IR, and Primary Constitution Analysis of Sargassum Spp from Mexico: Potential for Hydrogen Generation. Int. J. Hydrogen Energy 2022, 47, 30107–30127. [Google Scholar] [CrossRef]
  43. Kannan, S. FT-IR and EDS Analysis of the SeaweedsSargassum Wightii (Brown Algae) and Gracilaria Corticata (Red Algae). Int. J. Curr. Microbiol. Appl. Sci. 2014, 3, 341–351. [Google Scholar]
  44. Nakamoto, K. Infrared and Raman Spectra of Inorganic and Coordination Compounds; John Wiley and Sons: New York, NY, USA, 1986. [Google Scholar]
  45. Xyla, A.G.; Koutsoukos, P.G. Quantitative Analysis of Calcium Carbonate Polymorphs by Infrared Spectroscopy. J. Chem. Soc. Faraday Trans. 1 Phys. Chem. Condens. Phases 1989, 85, 3165–3172. [Google Scholar] [CrossRef]
  46. Shan, C.; Ma, Z.; Tong, M. Efficient Removal of Trace Antimony(III) through Adsorption by Hematite Modified Magnetic Nanoparticles. J. Hazard. Mater 2014, 268, 229–236. [Google Scholar] [CrossRef]
  47. Shokrollahi, H. A Review of the Magnetic Properties, Synthesis Methods and Applications of Maghemite. J. Magn. Magn. Mater. 2017, 426, 74–81. [Google Scholar] [CrossRef]
  48. Ali, A.; Mahar, R.B.; Soomro, R.A.; Sherazi, S.T.H. Fe3O4 Nanoparticles Facilitated Anaerobic Digestion of Organic Fraction of Municipal Solid Waste for Enhancement of Methane Production. Energy Sources Part A Recovery Util. Environ. Eff. 2017, 39, 1815–1822. [Google Scholar] [CrossRef]
  49. Wu, J.; Zhu, G.; Yu, R. Fates and Impacts of Nanomaterial Contaminants in Biological Wastewater Treatment System: A Review. Water Air Soil Pollut. 2018, 229, 9. [Google Scholar] [CrossRef]
  50. Abdelwahab, T.A.M.; Mohanty, M.K.; Sahoo, P.K.; Behera, D. Application of Nanoparticles for Biogas Production: Current Status and Perspectives. Energy Sources Part A Recovery Util. Environ. Eff. 2020, 1–13. [Google Scholar] [CrossRef]
  51. Xia, T.; Kovochich, M.; Liong, M.; Mädler, L.; Gilbert, B.; Shi, H.; Yeh, J.I.; Zink, J.I.; Nel, A.E. Comparison of the Mechanism of Toxicity of Zinc Oxide and Cerium Oxide Nanoparticles Based on Dissolution and Oxidative Stress Properties. ACS Nano 2008, 2, 2121–2134. [Google Scholar] [CrossRef] [Green Version]
  52. Brunner, T.J.; Wick, P.; Manser, P.; Spohn, P.; Grass, R.N.; Limbach, L.K.; Bruinink, A.; Stark, W.J. In Vitro Cytotoxicity of Oxide Nanoparticles: Comparison to Asbestos, Silica, and the Effect of Particle Solubility. Environ. Sci. Technol. 2006, 40, 4374–4381. [Google Scholar] [CrossRef]
  53. Franklin, N.M.; Rogers, N.J.; Apte, S.C.; Batley, G.E.; Gadd, G.E.; Casey, P.S. Comparative Toxicity of Nanoparticulate ZnO, Bulk ZnO, and ZnCl2 to a Freshwater Microalga (Pseudokirchneriella Subcapitata): The Importance of Particle Solubility. Environ. Sci. Technol. 2007, 41, 8484–8490. [Google Scholar] [CrossRef]
  54. Li, K.; Liu, R.; Sun, C. Comparison of Anaerobic Digestion Characteristics and Kinetics of Four Livestock Manures with Different Substrate Concentrations. Bioresour. Technol. 2015, 198, 133–140. [Google Scholar] [CrossRef] [PubMed]
  55. Pramanik, S.K.; Suja, F.B.; Porhemmat, M.; Pramanik, B.K. Performance and Kinetic Model of a Single-Stage Anaerobic Digestion System Operated at Different Successive Operating Stages for the Treatment of Food Waste. Processes 2019, 7, 600. [Google Scholar] [CrossRef] [Green Version]
  56. Li, C.; Champagne, P.; Anderson, B.C. Evaluating and Modeling Biogas Production from Municipal Fat, Oil, and Grease and Synthetic Kitchen Waste in Anaerobic Co-Digestions. Bioresour. Technol. 2011, 102, 9471–9480. [Google Scholar] [CrossRef] [PubMed]
Figure 1. Sargassum spp. in Punta Cana (Dominican Republic) during the summer season.
Processes 11 01016 g001
Figure 2. Characterization of Sargassum spp.: (a) TGA (%) and DTG (%·min−1) curves, (b) DSC (µV·mg−1) curve, (c) XRD patterns, (d) FT-IR spectra.
Processes 11 01016 g002
Figure 3. XRD patterns of Fe2O3 NPs.
Processes 11 01016 g003
Figure 4. Average production of cumulative net volume of methane (NmL·g−1VS) during anaerobic digestion without NPs (S) and with NPs addition (S+5, S+10, S+50).
Processes 11 01016 g004
Figure 5. Experimental data fitted by the modified Gompertz, the first-order kinetic model, and the logistic function model—(a) sample S, (b) sample S+5, (c) sample S+10, (d) sample S+50.
Processes 11 01016 g005
Table 1. Dosage of NPs at different measure units.
SampleOpen-Air Pre-Dried
Substrate
[mg NPs/g S]
Total Solids of
Substrate
[mg NPs/g TS]
Volatile Solids of
Substrate
[mg NPs/g VS]
S+556.614.4
S+101012.117.9
S+505060.689.4
Table 2. Proximate and elemental analysis of Sargassum spp.
CompoundContent
[%]
Carbohydrates51.9Percentage of open-air pre-dried sample
Lipids1.65
Proteins0.62
C19Percentage of open-air pre-dried sample
N2.4
Na1.22Percentage of total solids after oven drying
Mg0.76
Al0.013
K3.36
Ca1.93
Mn0.003
Fe<10−3
Ni0.001
Cu<10−4
Zn0.006
Ba<10−3
Pb0.003
B0.002
P0.009
As<10−4
Table 3. BMP30 of samples.
SampleBMP30 (NmL·g−1VS)Variation Compared to Control
S80.25 ± 3.21-
S+599.57 ± 2.76+24.07
S+10101.90 ± 2.98+26.97
S+5048.97 ± 2.32−38.97
Table 4. Estimated kinetic parameters for the three kinetic models (first order, modified Gompertz, logistic function).
SS+5S+10S+50
First-order kinetic
A (NmL·g−1VS)165.542126.443204.63456.221
k (day−1)0.0210.0630.0220.082
R20.9830.9920.9970.948
Modified Gompertz model
A (NmL·g−1VS)86.749101.217113.59548.517
u (NmL·g−1VS·day−1)4.4686.0454.5954.949
m (day)2.2890.7680.8292.440
R20.9960.9970.9980.998
Logistic function model
A (NmL·g−1VS)81.11197.483103.41247.792
u (NmL·g−1VS·day−1)11.7019.20312.3827.502
m (day)0.1100.1210.0930.207
R20.9890.9870.9920.997
Disclaimer/Publisher’s Note: The statements, opinions and data contained in all publications are solely those of the individual author(s) and contributor(s) and not of MDPI and/or the editor(s). MDPI and/or the editor(s) disclaim responsibility for any injury to people or property resulting from any ideas, methods, instructions or products referred to in the content.

