Article

A Green Approach of Utilising Banana Peel (Musa paradisiaca) as Adsorbent Precursor for an Anionic Dye Removal: Kinetic, Isotherm and Thermodynamics Analysis

by
Ain Aqilah Basirun
1,
Ahmad Razi Othman
2,
Nur Adeela Yasid
1,
Mohd Yunus Abd Shukor
1 and
Mohd Ezuan Khayat
1,*
1
Department of Biochemistry, Faculty of Biotechnology and Biomolecular Sciences, Universiti Putra Malaysia—UPM, Serdang 43400, Selangor, Malaysia
2
Department of Chemical and Process Engineering, Faculty of Engineering and Built Environment, Universiti Kebangsaan Malaysia—UKM, Bangi 43600, Selangor, Malaysia
*
Author to whom correspondence should be addressed.
Processes 2023, 11(6), 1611; https://doi.org/10.3390/pr11061611
Submission received: 27 April 2023 / Revised: 17 May 2023 / Accepted: 19 May 2023 / Published: 25 May 2023
(This article belongs to the Special Issue Process Intensification for Waste Valorization)

Abstract

:
Methods for removing pollutants include membrane isolation, ion exchange, precipitation, transformation, and biosorption. Adsorption is a cost-effective method of treating industrial wastewater and a common commercial method for concentrating valuable molecules or eliminating contaminants. Banana peel is one of the largest underutilized agricultural wastes in Malaysia. A novel method of using a low-cost biosorbent made from banana peel and Evans blue (EB) dye as a target is the target of this study. The optimal conditions for EB dye adsorption occurred at a dye concentration of 200 mg/L, adsorbent dosages between 10 and 20 g/L, temperature of 25 °C, incubation time of 180 min, and agitation speeds of 100 rpm. Statistical discriminatory analysis showed that the pseudo-second-order kinetic model and the Redlich–Petersen isotherm model were the best models. The maximum adsorption capacity based on Langmuir’s isotherm prediction was 58.51 mg g−1. A non–linear regression of the thermodynamic van’t Hoff plot based on a dimensionless equilibrium constant resulted in negative values for Gibb’s free energy and enthalpy, indicating that the adsorption process is spontaneous and exothermic.

1. Introduction

The complex makeup of textile wastewater, which includes both organic and inorganic pollutants and a rainbow of colors, makes it one of the most substantial sources of environmental contamination. Based on their chromophore structure, dyes can be categorized as acid, active, basic, dispersion, diazo, azo, and anthraquinone dyes [1]. Seventy percent of the yearly total of 900,000 metric tons of dyes are azo dyes [2]. The use of azo dyes has detrimental effects on both human and environmental health. Evans blue dye is a diazo dye because it contains two azo bonds in its molecular structure [3]. It is used a lot in the Batik textile industry in Southeast Asia, especially Malaysia, and it is a major source of pollution [4]. Biosorption in environmental engineering is a rapidly expanding industry for the remediation of pollution due to its low initial costs, straightforward design, high efficiency, and complete elimination of pollutants from aqueous solutions. Dye removal in water may also be accomplished through a process called biosorption [4,5,6].
Banana peel has become a common agricultural waste in Malaysia because of the abundance of sources during its season. The waste produced by people throwing away banana peels has caught the attention of eco-activists. Since the banana peel’s soft and spongy texture makes it an excellent adsorbent for many toxicants, including dyes, this by-product can be used to generate greater economic value while mitigating environmental harm including dyes [7,8,9,10,11,12]. Several studies for the removal of Evans blue using agricultural waste have been reported globally [13,14] but not banana peel. A novel method for the application of low-cost biosorbent, prepared from banana peels, for the removal of Evans blue (EB) dye, is the main aim of this work. The kinetics, isotherm and thermodynamics of adsorption will all be evaluated using nonlinear regression models, and the best models of kinetics and isotherms will be evaluated using error functions that have a penalty function for the number of parameters in the model.

2. Materials and Methods

Evans blue dye (EB) with a purity of 99.9% was sourced from Sigma Aldrich, St. Louis, MO, USA. A 500 mg L−1dye stock solution was prepared in distilled water.

2.1. Preparation of Banana Peel Biosorbent

The banana peel was freshly collected from roadside stalls in Serdang, Selangor. The peels were first washed with copious volumes of distilled water to discard any impurities. Drying of the husk was carried out at 110 °C for 24–48 h in a hot air oven. The determined weight of the banana peel was soaked for 24 h in 1M KOH solution to the ratio of 1:1 (w:v) [15]. A copious amount of distilled water was used to clean the husk, and then it was dried normally. A laboratory grinder ground it to a fine powder before it was washed in pure water and dried. A British standard sieve (BSS) with a mesh of 18 (1000) was used to find out the particle size of the ground biosorbent, and then the banana peel that had been treated with KOH was stored in airtight containers. The carbon, hydrogen, nitrogen, oxygen, and sulfur components of the banana peel were determined using a CHNS analyzer (Thermo Scientific-FlashSmart CHNS/O model, Thermo Fisher Scientific; Waltham, MA, USA).

2.2. Characterization of Banana Peel Biosorbent

Field-emission scanning electron microscopy (FESEM, LEO1455) was used to examine the biosorbent’s surface morphology, and Fourier transform infrared spectroscopy (Bruker Optics Korea Co., Ltd. VERTEX 80v) was utilized to determine the biosorbent’s surface functional groups. The determination of the point of zero charge pHpzc was carried out by contacting 0.5 g of the biosorbent to 0.1 M NaCl (50 mL). The pH adjustment from 2 to 12 was carried out using 0.1 M NaOH or 0.1 M HCl. After 24 h of equilibrium, the final pH was determined (pHf). The graph shows the relationship between pHi and pHf, where pH is found to be significant between both the initial and final pH (pHi–pHf) [16].

2.3. Batch Adsorption Study

Assessment of the effect of pH, the adsorbent dosage, initial dye, agitation speed, dye biosorbent contact time, and temperature was carried out in a batch format [17]. The amount of dye remaining in the solution was determined at 540 nm using a UV-vis spectrophotometer (Shimadzu™ UVmini-1240). At equilibrium, the parameter qe (mg/g) was estimated (Equation (1)) as:
q e = ( C 0 C e ) W V
where V is volume (L), and Ce and C0 (mg/L) are the equilibrium and initial starting concentrations, respectively, of the liquid-phase concentrations of adsorbate (mg/L), and W is the mass (g) of the adsorbent used.

2.4. Kinetics, Isotherm, and Thermodynamic Models

This strategy is analogous to that used in batch equilibrium analyses above. The concentration of the absorbent–absorbate solution was determined at various times. Equation (3) was used to calculate an estimate for the amount of adsorbed at time t, denoted by the symbol qt (mg g−1), which represents the amount of dye adsorbed (mg) per gram of adsorbent over time. Three of the most widely used kinetics models for solid–liquid systems were compared and contrasted. Assuming that the adsorption rate is proportional to the ratio of the adsorbed concentration to the number of accessible sites, Lagergren’s pseudo-first-order equation (PFO) was the first model tested [18]. The second was the pseudo-second-order model (PSO), which relates the adsorption rate and the difference between saturation concentrations [19], and the third was the Elovich model.

2.4.1. Pseudo-First-Order Kinetic Equation

The equation (Equation (2)) is as follows [20]:
q t = q e ( 1 e k 1 t )

2.4.2. Pseudo-Second-Order Kinetic Equation

The model is established on solid phase adsorption capacity [21] and Blanchard et al. [22] first proposed the nonlinear form (Equation (3)) expressed as:
q t = k t q e 2 t 1 + k 2   q e t  

2.4.3. Elovich Kinetic Model

The model has its origin in studies on carbon monoxide adsorption on manganese dioxide [23]. The nonlinear equation (Equation (4)) is expressed as follows:
q t = 1 β l n α β + 1 β l n t
where the extent of surface coverage (g mg−1) and the chemisorption activation energy is represented by β, and the initial sorption rate (mg g min−1) is represented as α.
Nonlinear regression, rather than linear regression, was used to analyze the biosorption isotherms, and the best model was evaluated with the help of a number of error function analyses (Table 1). A dimensionless equilibrium constant was estimated using the Langmuir equation for the thermodynamic calculations [24].

2.4.4. Thermodynamics Parameter Analysis

The Langmuir equation (Equation (5)) was utilized to find the dimensionless equilibrium constant between two phases, KL.
q e = q m L K L C e 1 + K L C e
The KL value from Langmuir was then converted to a dimensionless form KC using Equation (6) as follows [24]:
K C = 980.6 × 55.5 × 1000 × K L
The molecular weight of Evans blue is 980.6 g mol−1. 55.5 is the molarity of pure water, and the term of 980.6 × 55.5 × 1000 × KL will be dimensionless.
The constant KL has an issue in that it has a dimension, and calculation of thermodynamics requires a unitless or a dimensionless form of an equilibrium constant or KC as shown in Equation (7) where C° is the concentration of adsorbate (C° = 1 mol/L). KL (L/mol) is the Langmuir constant, and γ (dimensionless) is the activity coefficient of adsorbent in solution [24].
K C = K L ( L m o l ) × C ° ( m o l L ) γ
The adsorption thermodynamics parameters (Δ, ΔH°, and Δ) were determined according to the van’t Hoff equation. When the adsorption process reaches equilibrium, the free energy change (ΔG) approaches zero. Equation (8) is then converted to the standard Equation (9) for Δ (standard Gibbs energy change) computation. Equation (10) is the corresponding nonlinear form.
Δ G ° = R T l n K C
l n K C = Δ H ° R × 1 T + Δ S ° R
K C = e Δ S R Δ H R . 1 T
The universal gas constant, R is 0.00831 kJ/mol × K.
The connection among Δ, ΔH°, and Δ of an adsorption process is expressed as follows (Equation (11)):
Δ G = Δ H + Δ S

2.5. Statistical Analysis

Root-Mean-Square Error (RMSE) which has the same basis as the Euclidean distance, corrected Akaike Information Criterion (AICc), which introduces a correction for a smaller number of parameters or sample number, accuracy factor (AF), bias factor (BF), and adjusted coefficient of determination (R2) were used as statistical discriminatory tests for all models evaluated in this study. The nonlinear regression software CurveExpert 6.0 was used for all the parameter estimations.
The calculation of RMSE is shown in Equation (12), where n represents experimental data points Obi and Pdi are the experimental and predicted data, respectively, while p is parameter numbers.
R M S E = i = 1 n ( P d i O b i ) 2 n p
Since R2 ignores models’ parameter numbers, the adjusted R2 is commonly used as it has a penalty for the number of parameters. In Equations (13) and (14), the total variance of the y–variable is denoted by s y 2 while RMS is the Residual Mean Square.
A d j u s t e d ( R 2 ) = 1 R M S s Y 2
A d j u s t e d ( R 2 ) = 1 ( 1 R 2 ) ( n 1 ) ( n p 1 )
The corrected Akaike Information Criterion (AIC) or AICc [1] is calculated as follows (Equation (15)).
A I C c = 2 p + n ln ( R S S n ) + 2 ( p + 1 ) + 2 ( p + 1 ) ( p + 2 ) n p 2
Further error function analysis are the Accuracy Factor (AF) and Bias Factor (BF). (Equations (16) and (17)).
Bias factor = 10 ( i = 1 n log ( P d i / O b i ) n )
Accuracy   factor   = 10 ( i = 1 n log | ( P d i / O b i ) | n )

3. Results

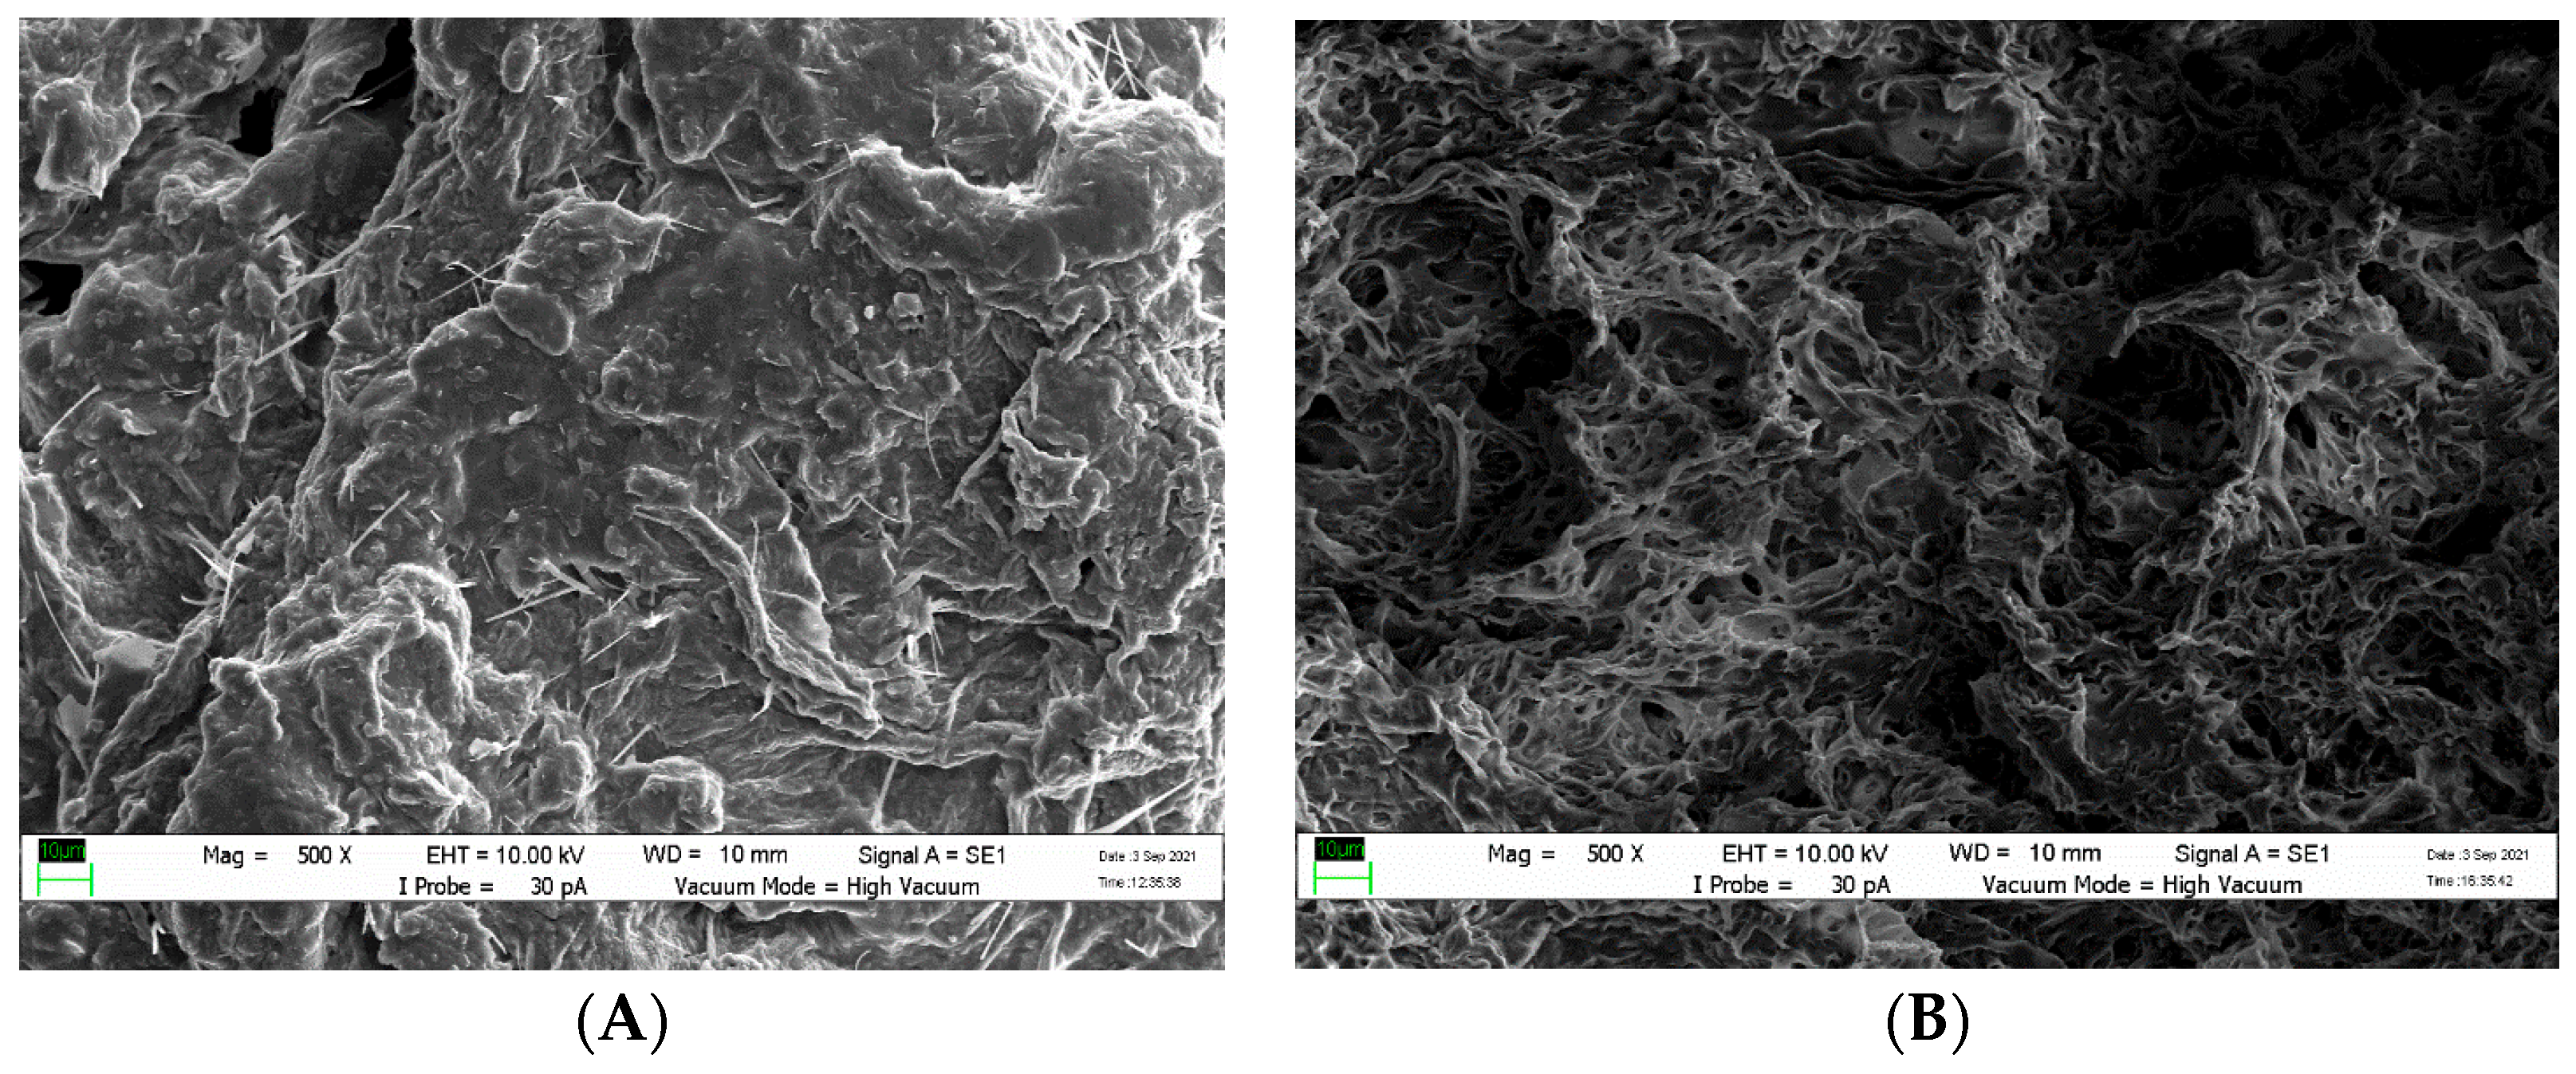
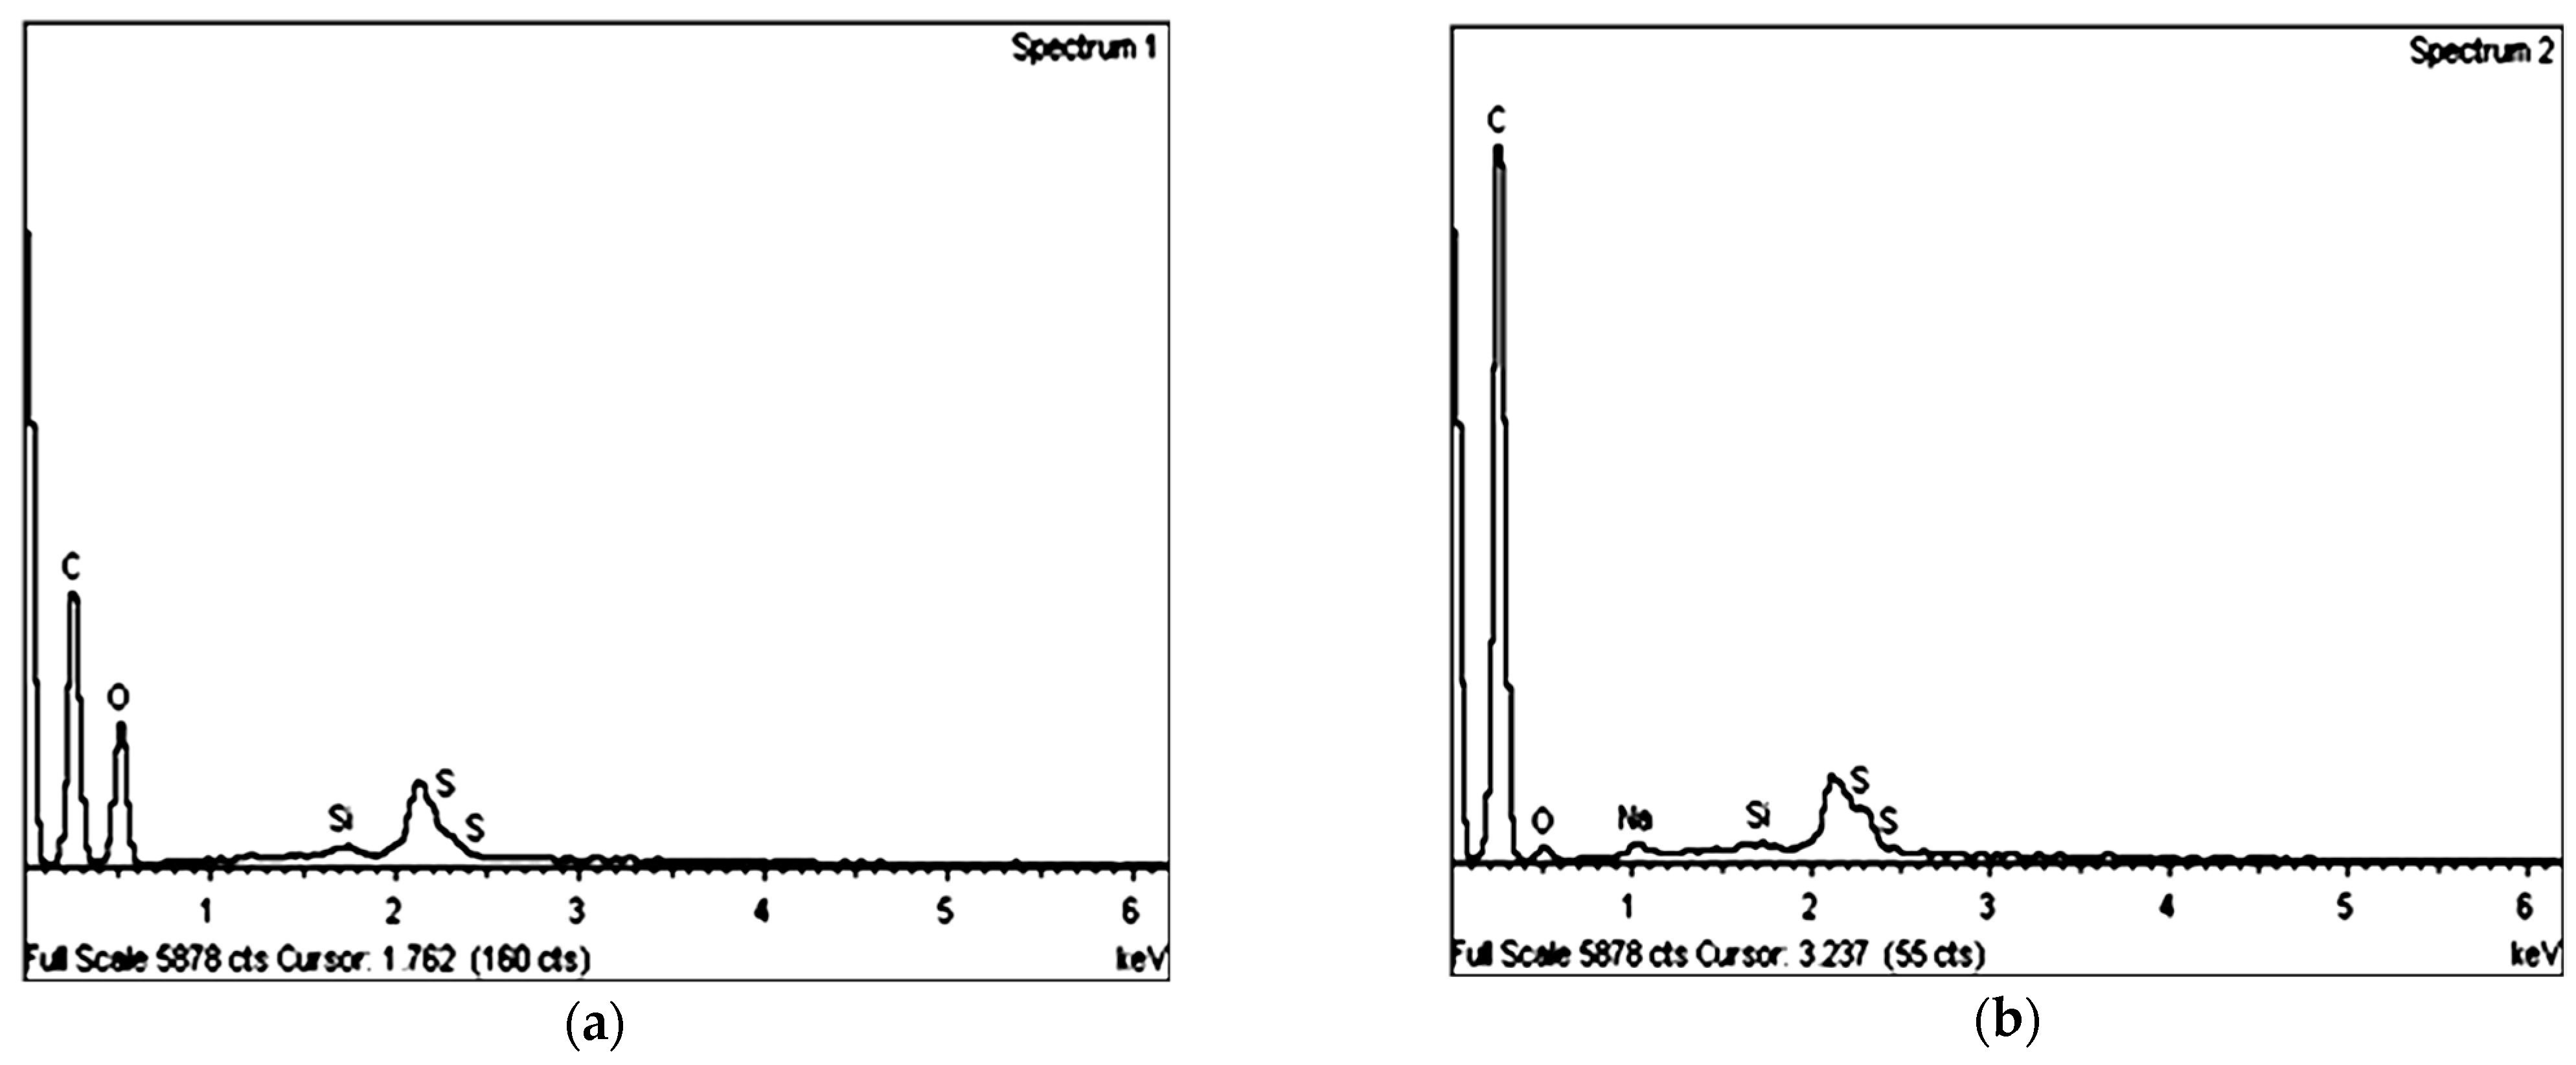
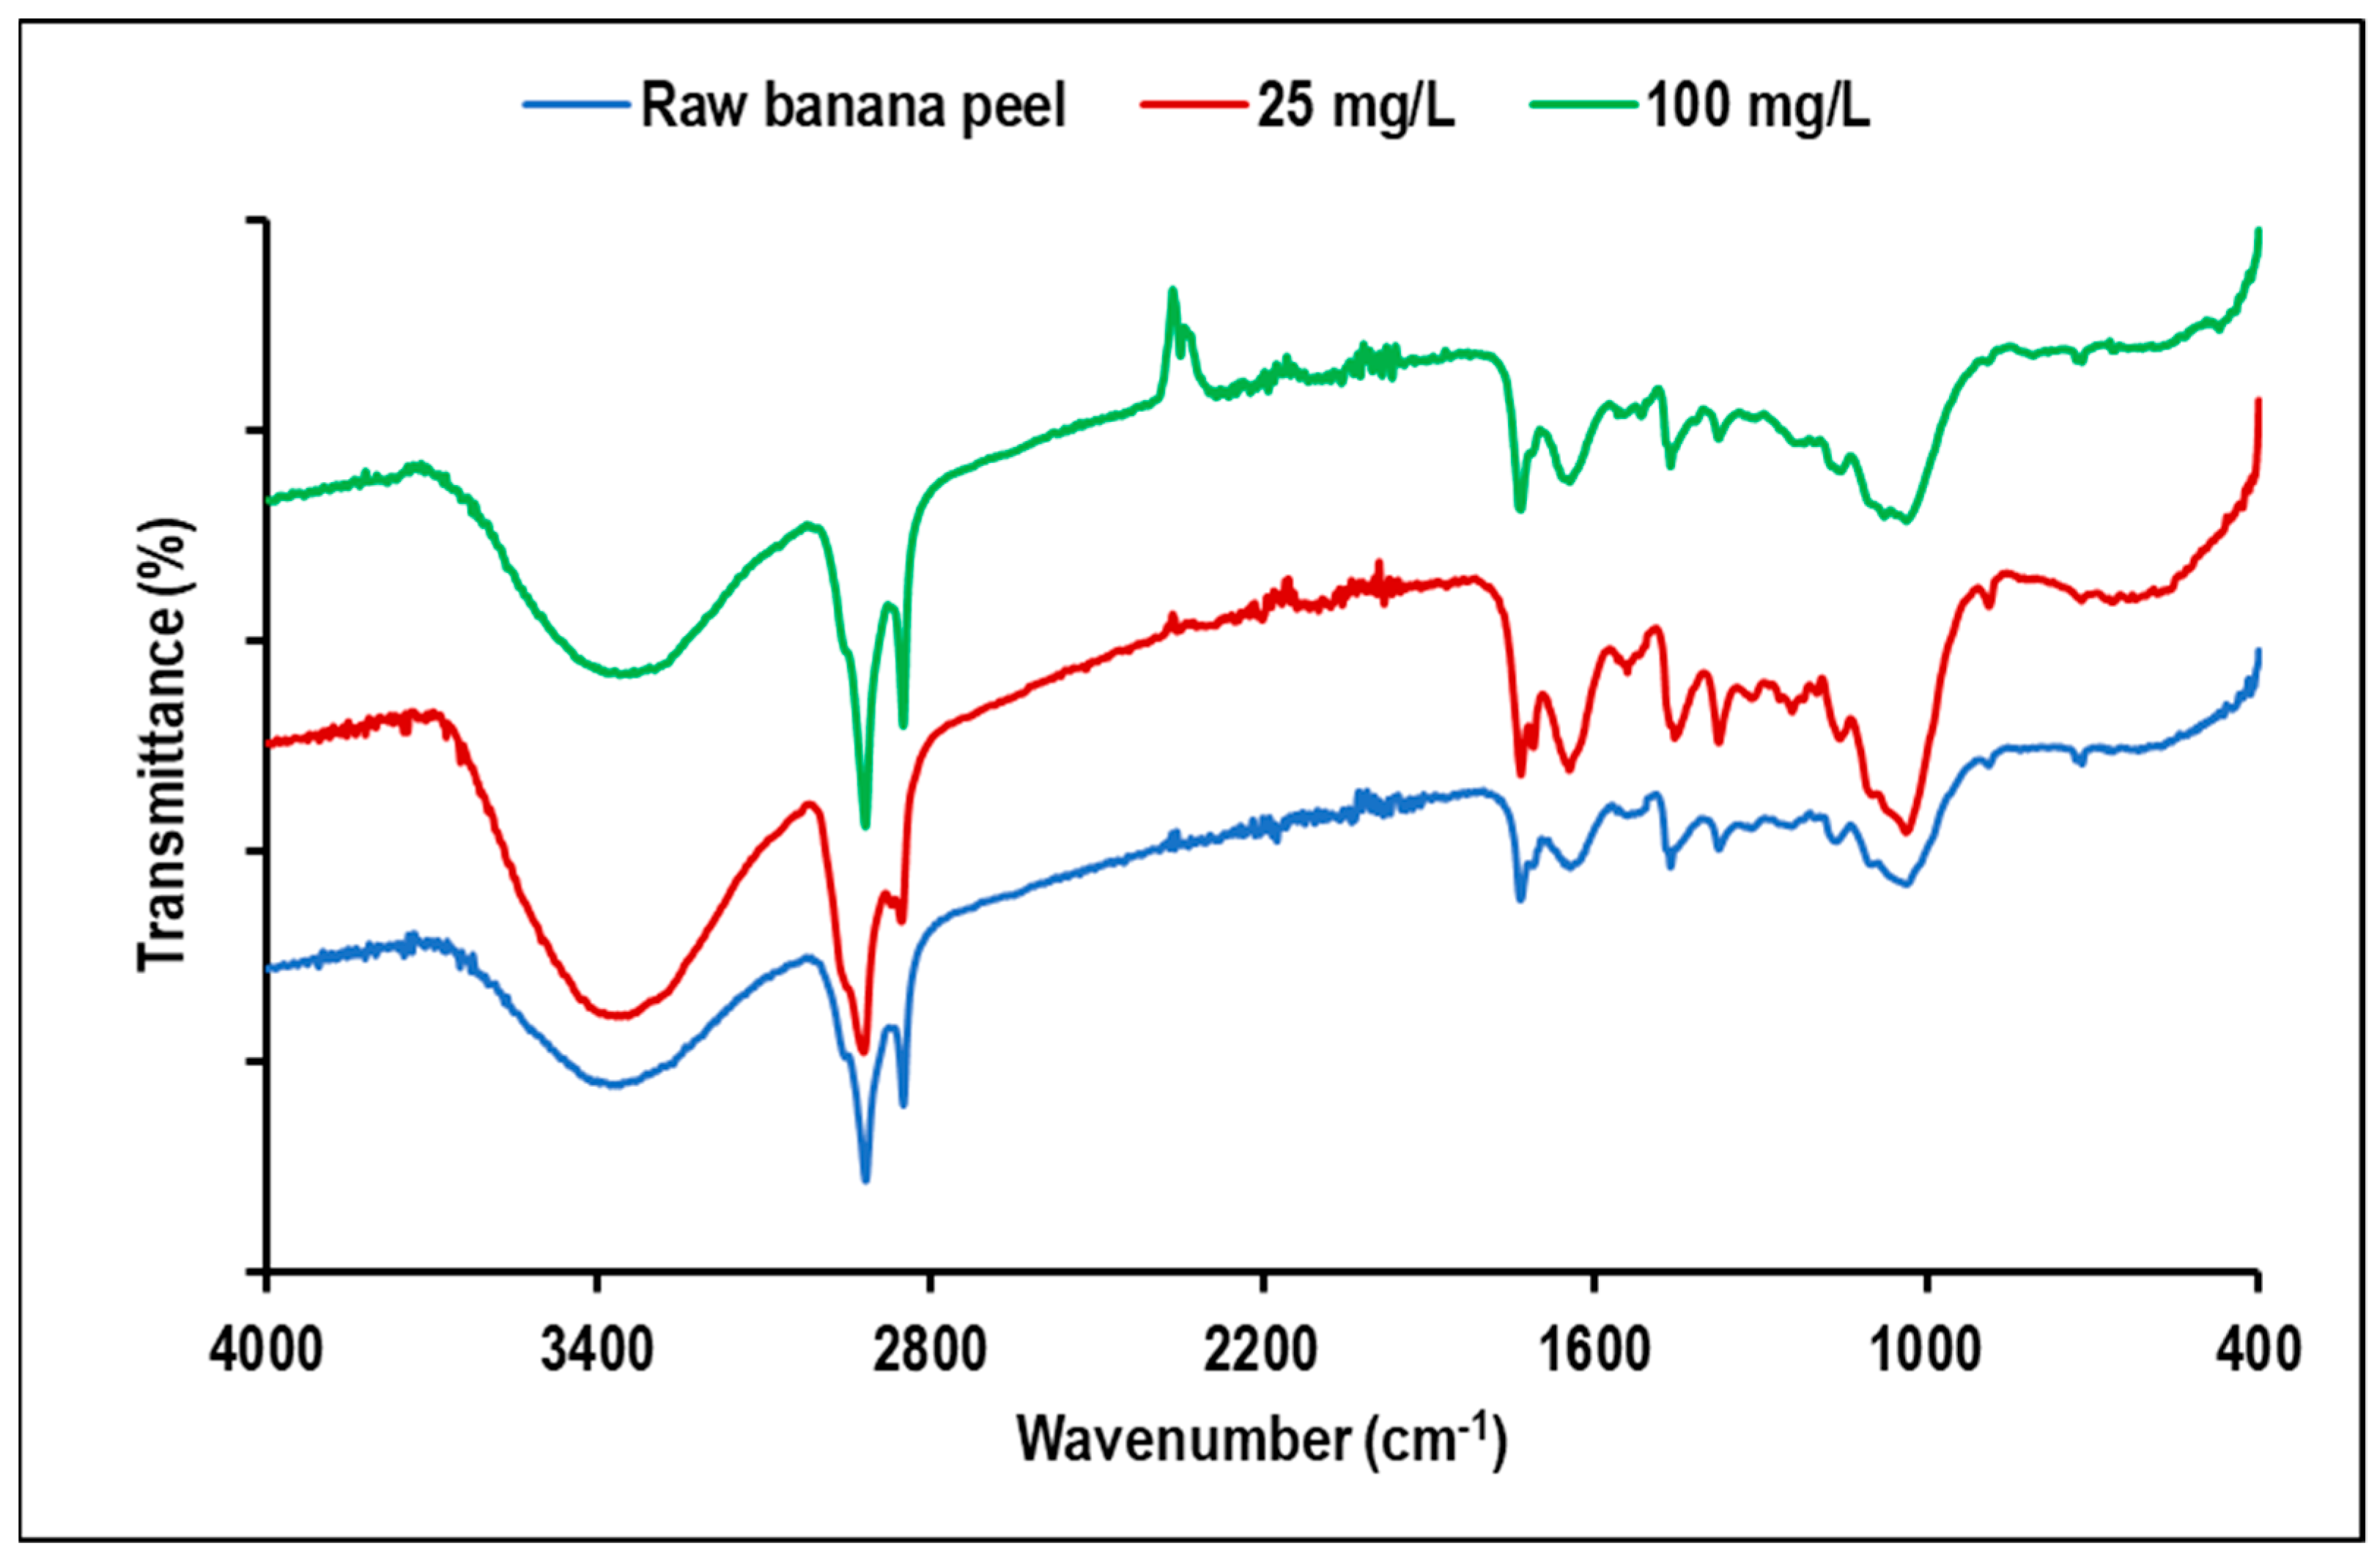
3.1. Banana Peel Biosorbent Characterisation

Treatment of Banana Peel with KOH

The treatment of banana peel with KOH shows the presence of more numerous networks of pores, as seen in the SEM image (Figure 1B), which can be interpreted as increasing the sorption capacity of the biosorbent [2,3]. Similar results are reported after base treatment, where new pores with an increase in mesopore coverage are reported for pine cones [2], palm shells [3], and palmyra palm fruit fibers [4].
Table 2 shows the proportion of C, O, S, and Fe components in banana peel green biosorbent before and after adsorption. Banana peel has a high carbon content, which makes it a good biosorbent when transformed into activated carbon for future adsorption studies [5]. EDX results (Table 2 and Figure 2) show the increase in the signal for the sulfur and sodium atoms after EB dye sorption, which is anticipated due to the presence of several sulfur and sodium atoms in the EB dye structure and commercial forms, respectively. The elemental analysis of banana peel for carbon, hydrogen, nitrogen, oxygen and sulfur resulted in values of 37.14, 7.24, 2.03, 53.59, and 0.0022%, respectively, which are near the range reported in several studies [6,7].
Figure 3 is an FTIR spectrum showing the existence of functional groups of interest on the banana peel surface. N–H (amine) stretching of amino acids and O–H (hydroxyl) stretching of phenols and alcohols coincide to create the strongest and broadest peak at 3393.8 cm−1 [8]. In addition, other prominent peaks, indicative of C–H stretching in alkanes, were detected in the region of 2850–3000 cm−1.
–COO symmetric stretching is shown by a peak at 1620.2 cm−1, C=O stretching in aldehydes and carboxylic acids is represented by a peak at 1736.9 cm−1, and O–H bending is shown by a peak at 1399.4 cm−1. C–O stretching of esters or ethers, N–H deformation of amines, and C–H stretching of alkenes and aromatics are all responsible for the bands observed between 1000 and 1350 cm−1 and 650 and 1000 cm−1, respectively. The hydroxyl and carboxylic groups in banana peel, likely from cellulose, and the amines in banana peel, likely from hemicellulose, are abundant, as shown by the FTIR spectra. Hydrogen bonds are formed between positively charged atoms on the surface of the dye and the positively charged atoms in the adsorbent’s functional groups, as in the case of banana peels [9]. Evans blue dye presence in the sample may be indicated through the C=C stretching vibration of the aromatic ring, as seen in the increased intensity of the peak at 1590–1580 cm−1 in the red and green spectra (25 and 100 mg/L, respectively) [10]. The Evans Blue dye’s nitrile (CN) group’s asymmetric stretching vibration is likely accountable for the peak at approximately 2355 cm−1 as reported by Shamim et al. [11].

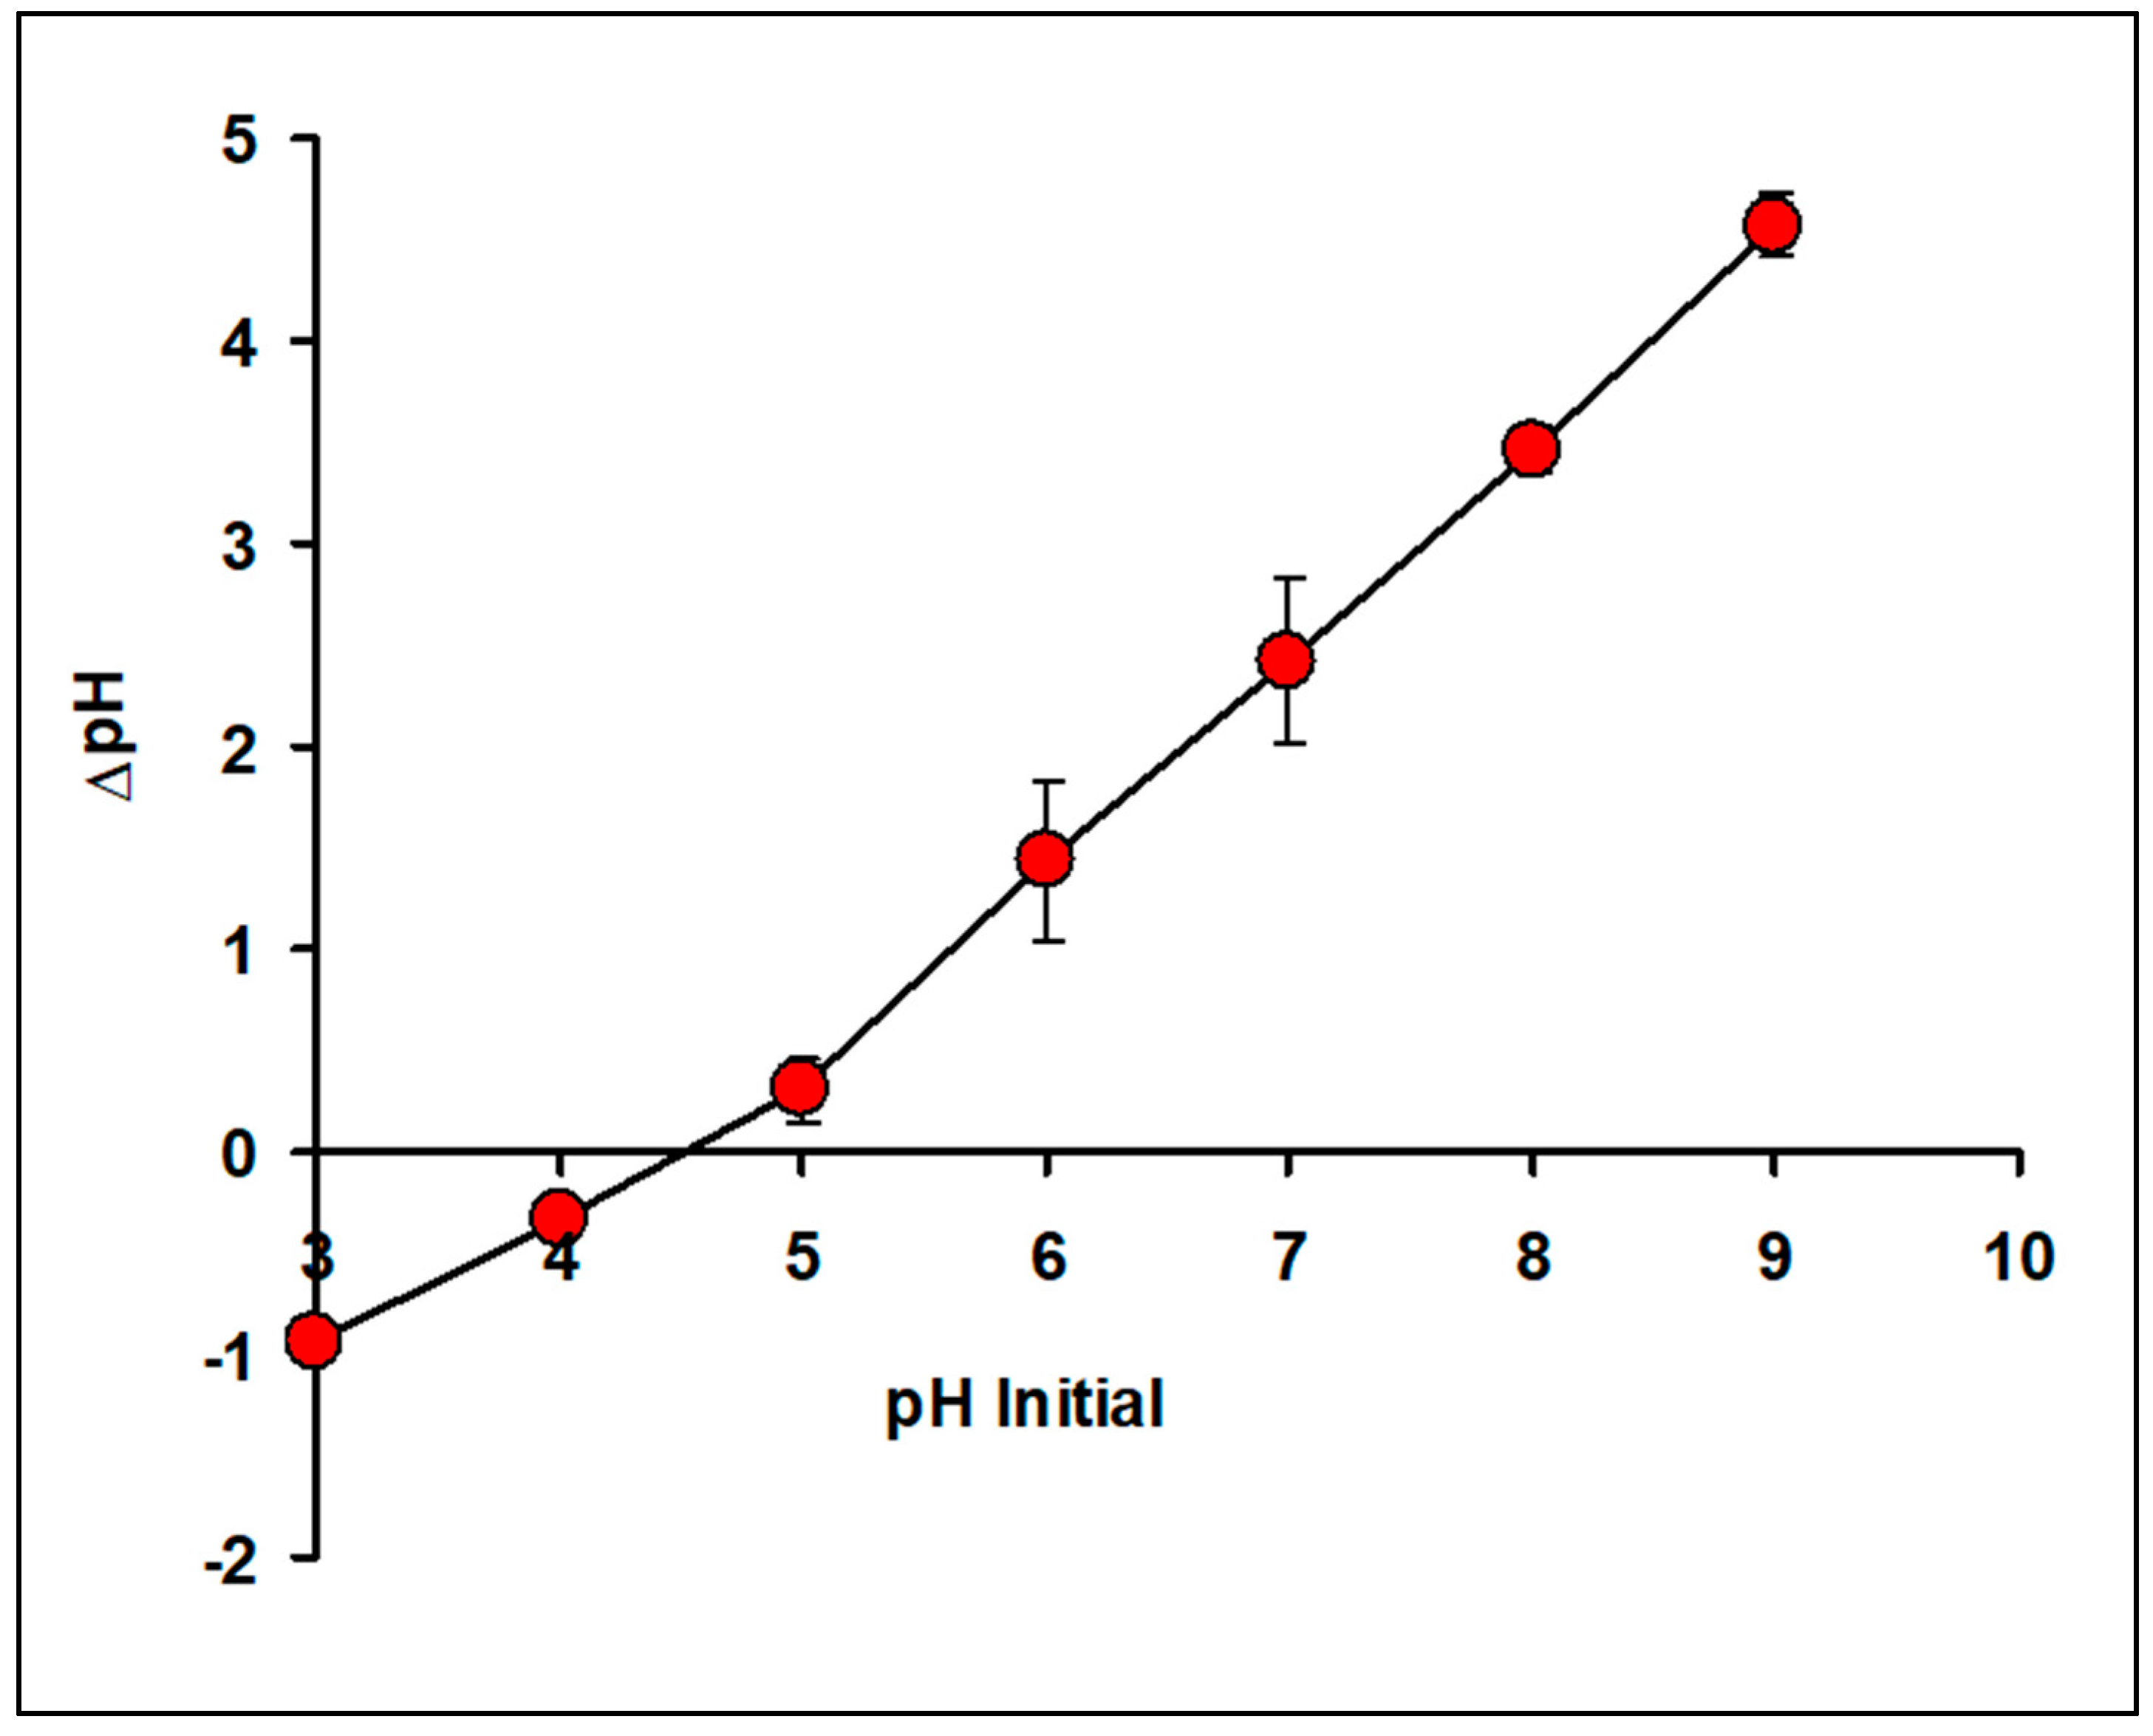
3.2. Point of Zero Charge Study

The present study shows that pHpzc of banana peel is at pH 4.51 as illustrated in Figure 4. The virgin banana peel had a pHpzc of 5.21. pHpzc is the condition where the solution’s surface charge density is equal to zero. When the pH of the surrounding environment is lower than the adsorbent’s PZC, the adsorbent’s surface tends to be positively charged, and when the adsorbent’s PZC is above the pH of the environment, the adsorbent’s surface charge will be negatively charged [8,12]. The present result is in accordance with previous studies utilizing several agricultural by-products as a low–cost biosorbent including banana peel, with values from 4.5 to 5.9 [13,14].

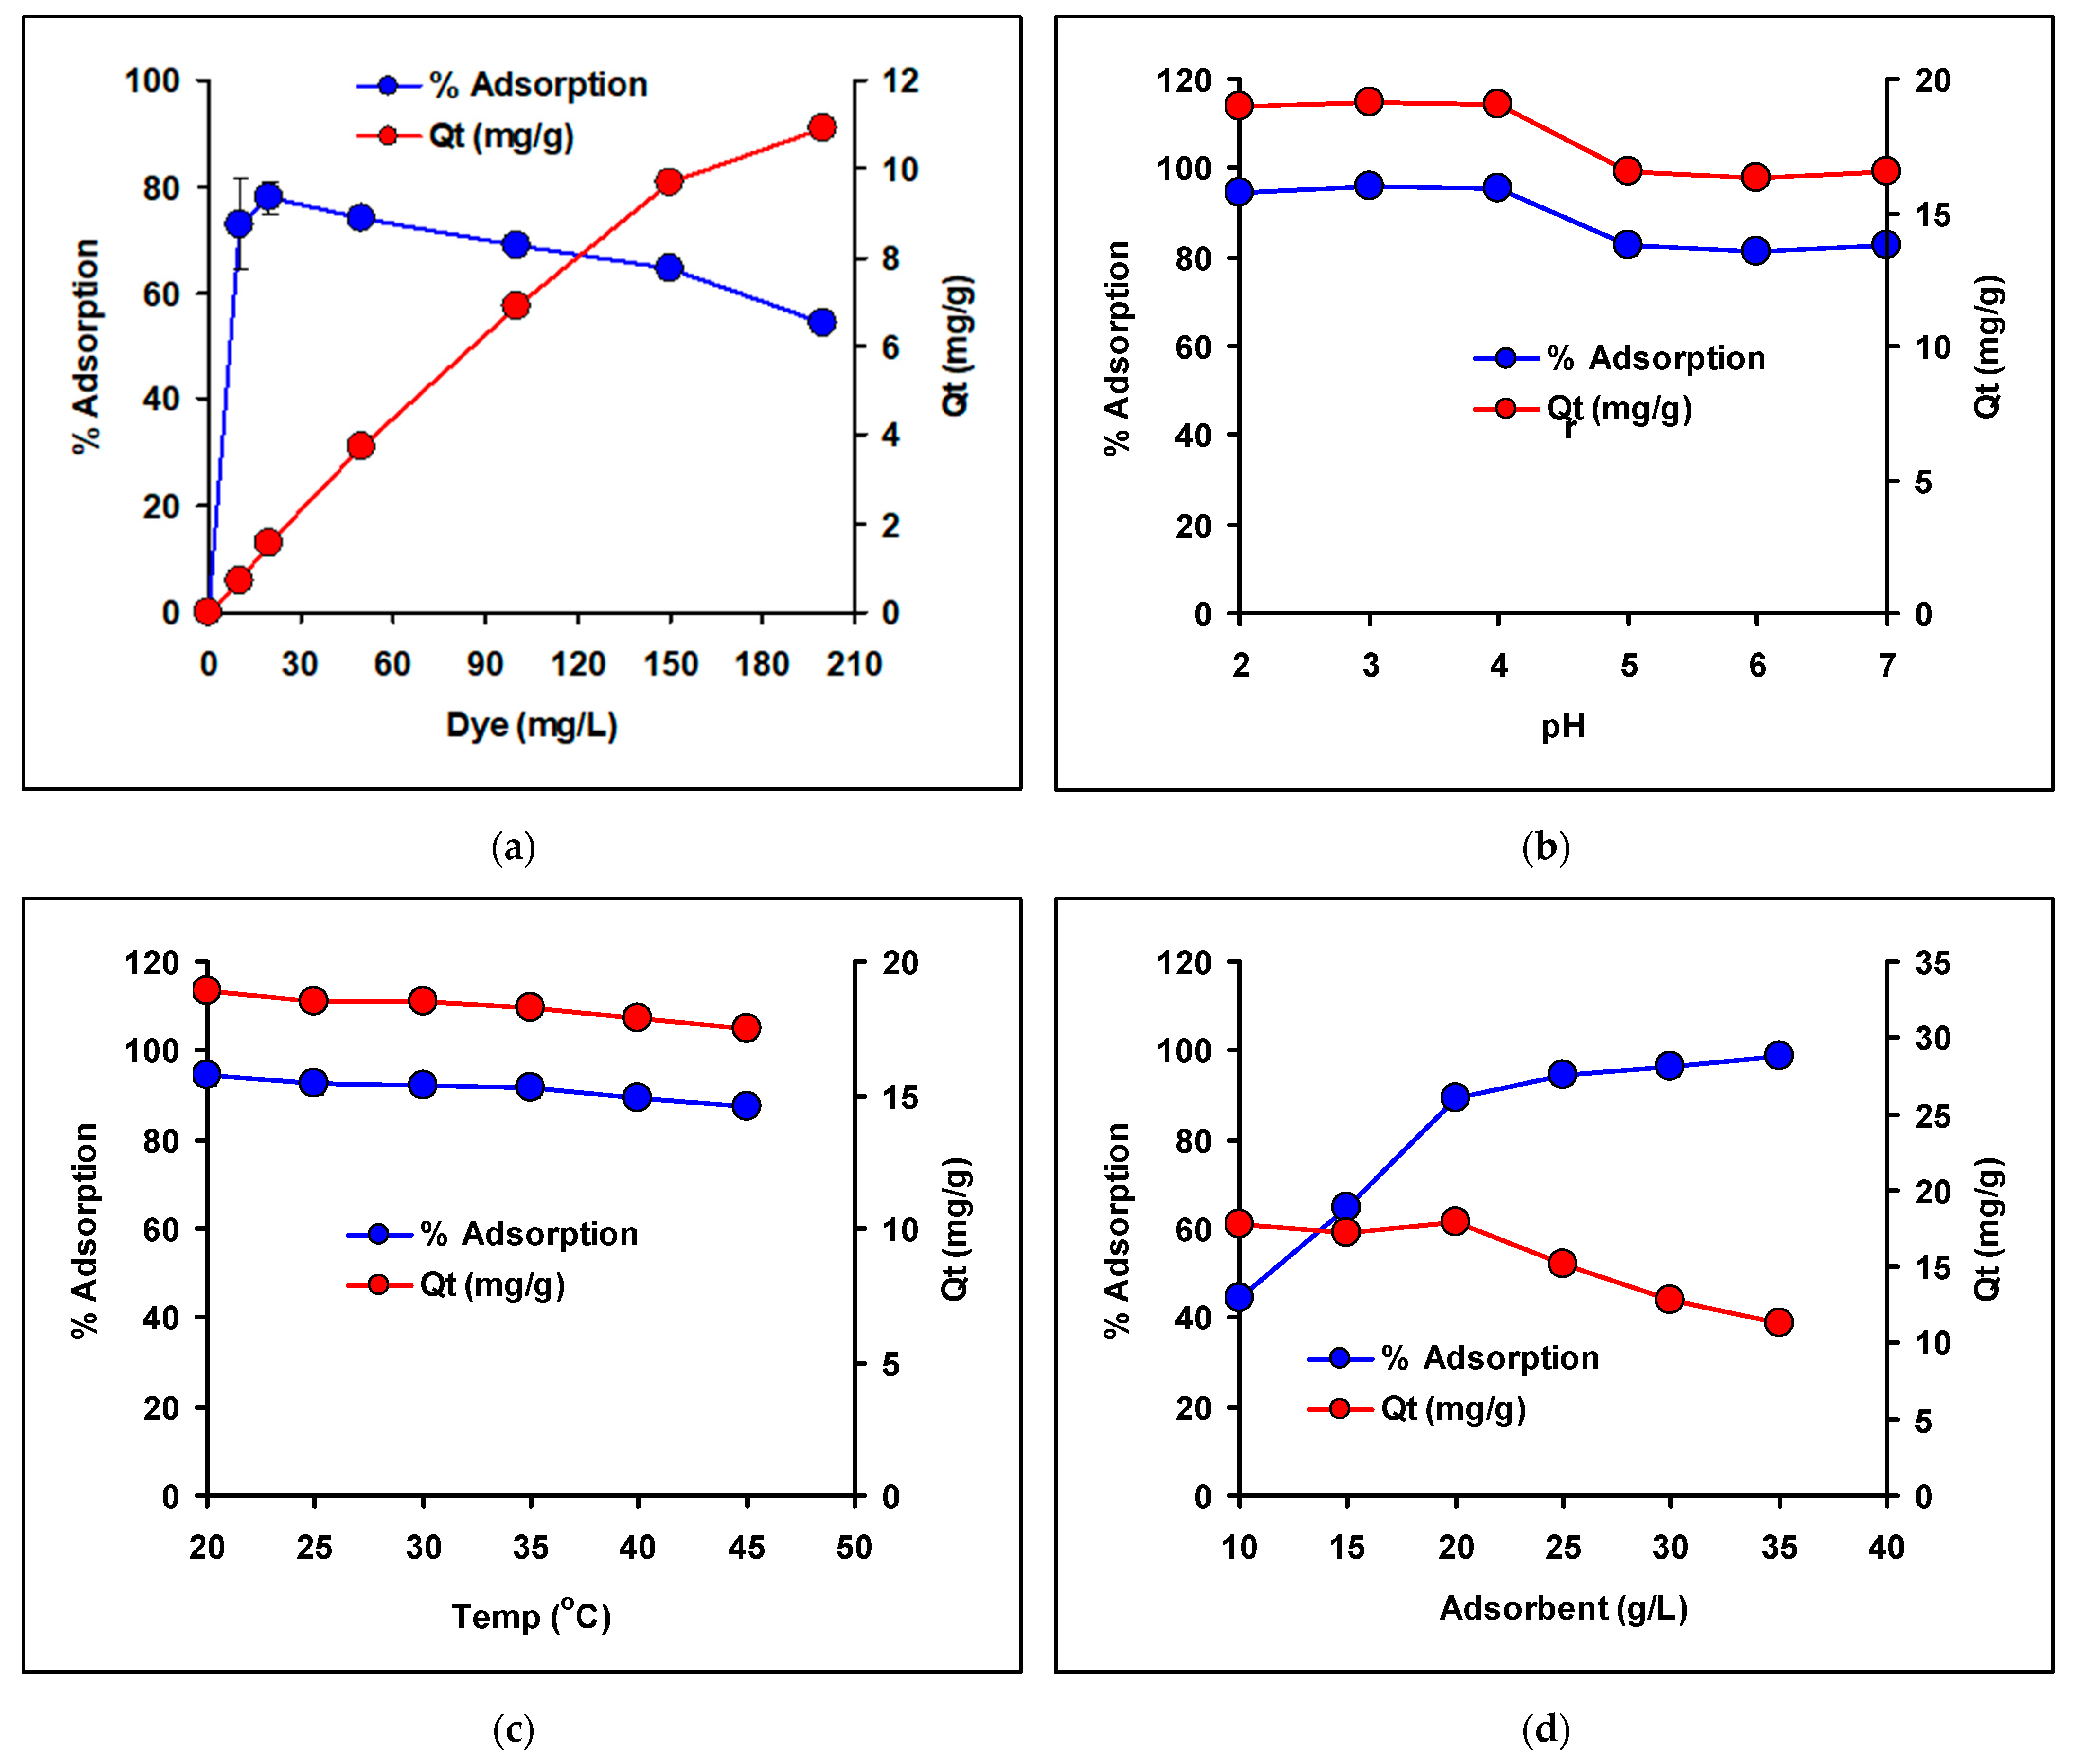
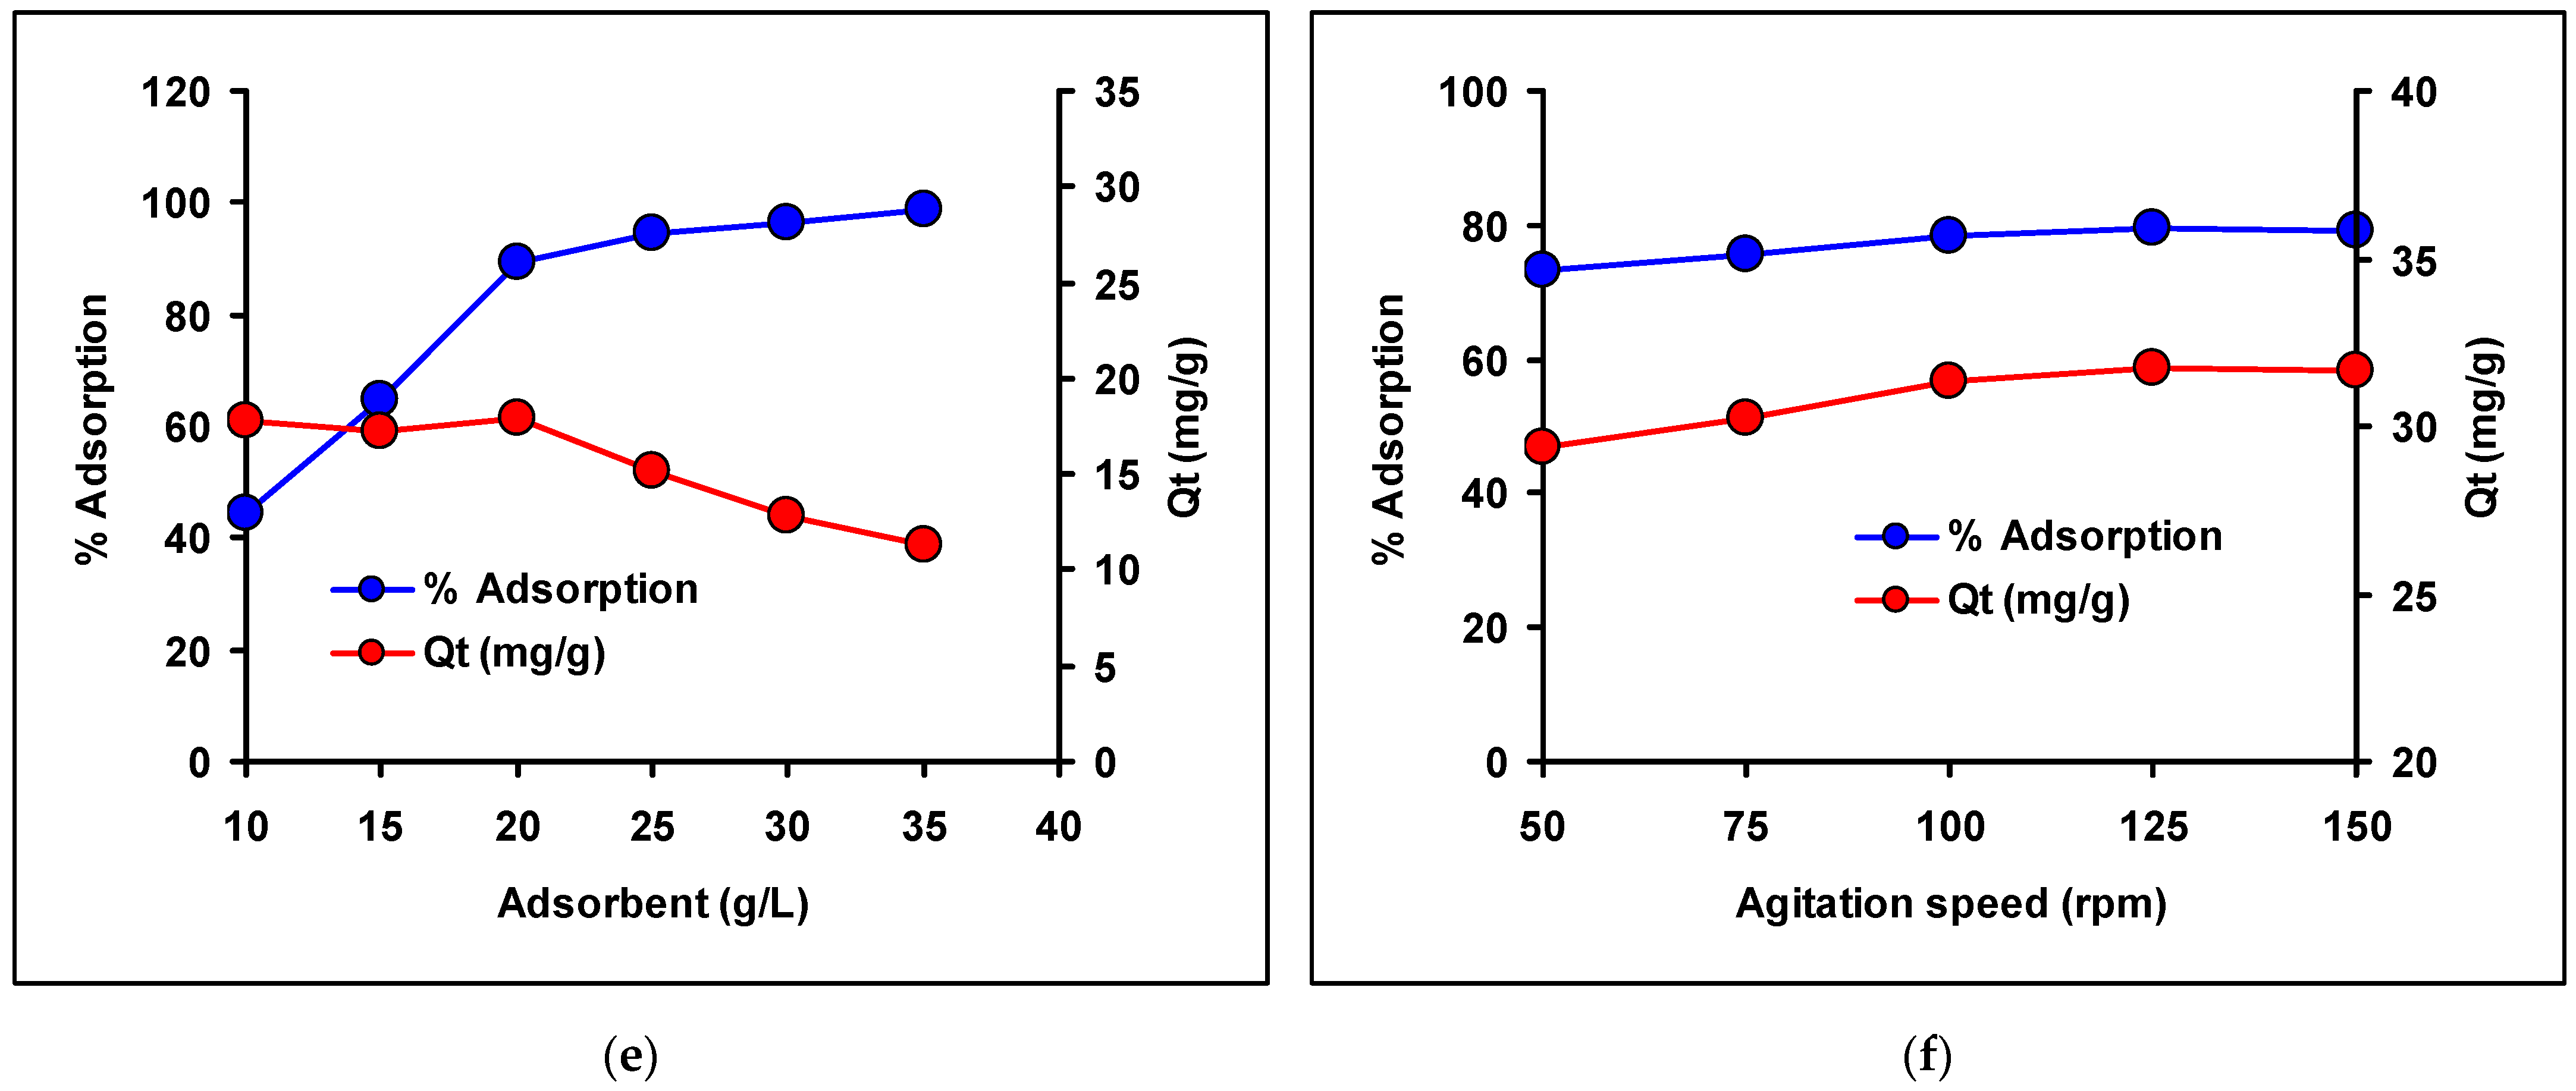
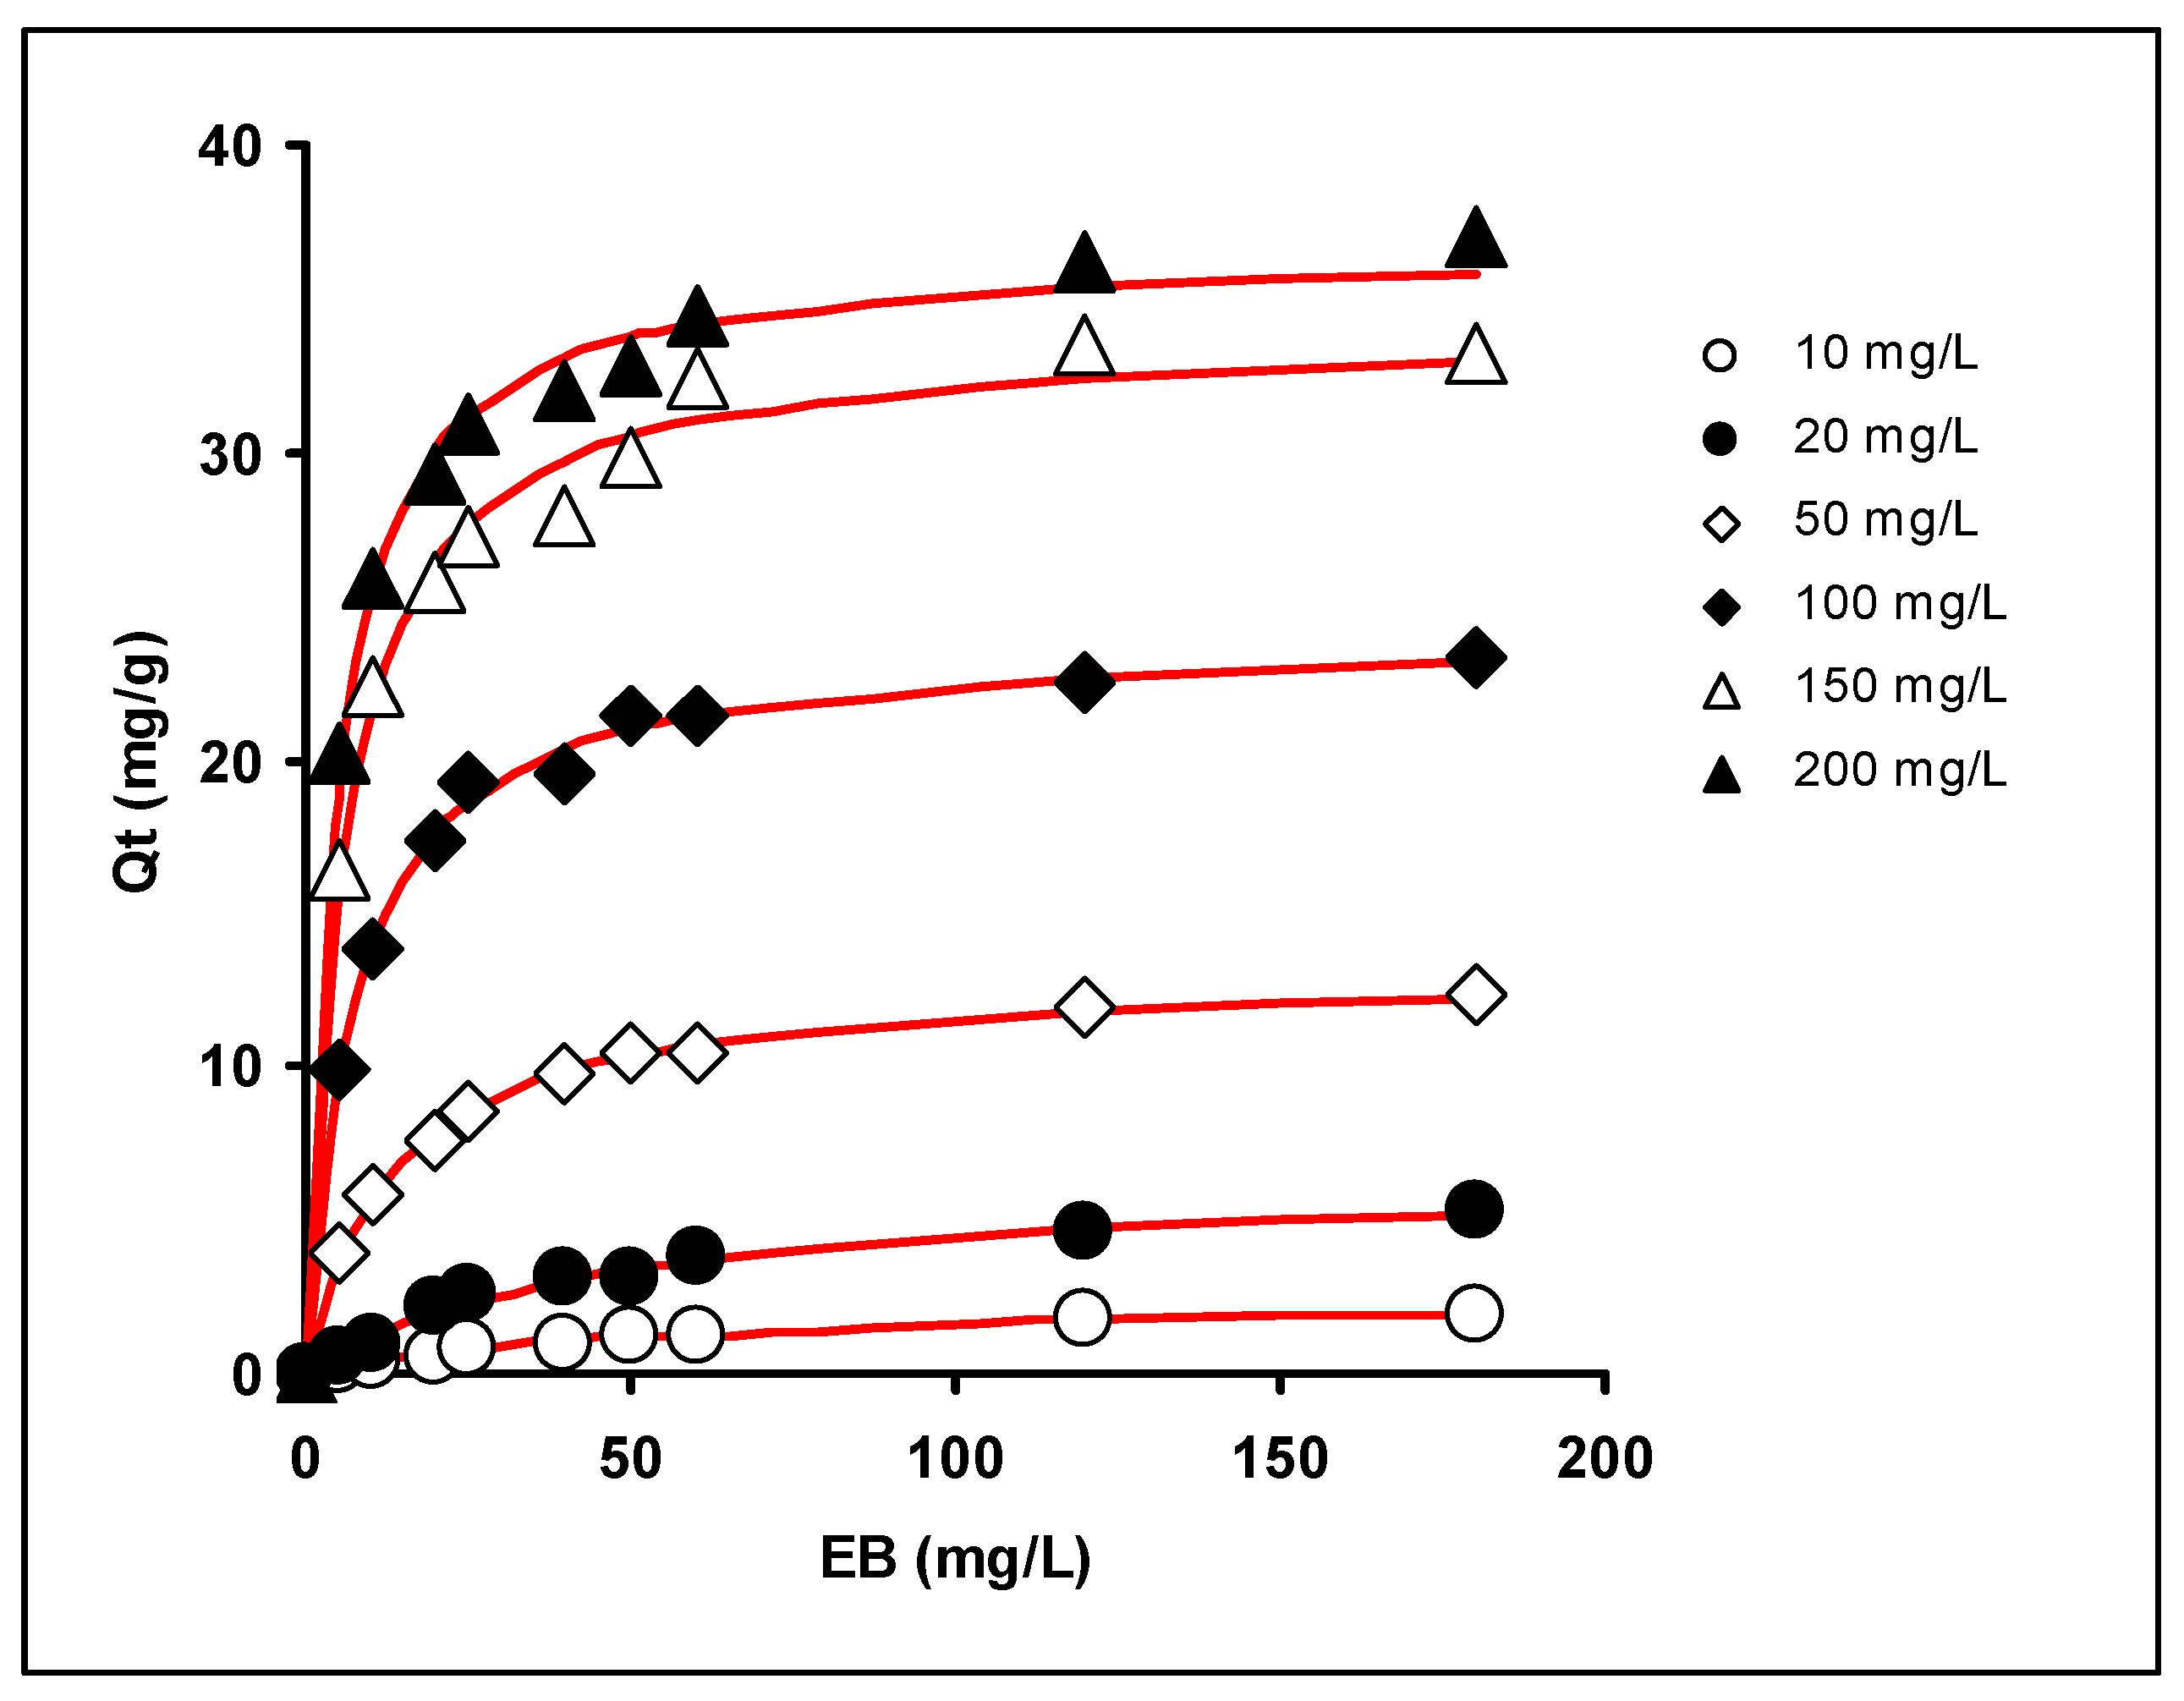
3.3. Batch Adsorption Optimisation

The effects of varying the pH, initial concentration, contact time, particle size, adsorbent dose, agitation speed, and adsorptions temperature on the sorption of EB dye were investigated in a batch format. Figure 5 displays the graphed effects of all the variables examined.
The effect of the initial dye concentration is crucial because a given mass of sorbent material may only adsorb a given amount of dye. Adsorbent–adsorbate solutions with a constant adsorbent dose and varying initial dye concentrations were mixed until equilibrium was reached over a range of times. At 10 mg/L, a maximum removal percentage of 81.5% was observed, but the maximum adsorption capacity per g of adsorbent (10.9 mg g−1) was achieved at the highest dye concentration (200 mg/L) tested (Figure 5a).
Figure 5b shows high maximum removal percentages of between 94 and 95% and maximum adsorption capacity of between 18.9 to 19.2 mg g−1, from pH 2 to 4, and lower levels of maximum removal percentages and maximum adsorption capacity at higher pHs. At lower pHs, the EB dyes are more positive due to the several amino groups becoming protonated, but the overall charge will be negative due to the negative pka values of the sulfonate group. Below the point of zero charge of the banana peel (4.51), it has a net negative charge [13,14], and further studies are needed to explain the relatively higher adsorption observed (about 13% higher) at these pHs.
Both the maximum percentage of adsorption and the adsorption capacity for EB dye removal decrease with increasing temperature, as shown in Figure 5c. In order to definitively determine the practicability and spontaneity of the adsorption process, the effect of temperature will be further explored via thermodynamics parameters.
The study of contact time shows an increase in the adsorption amount with an increase in the adsorbate concentration (Figure 5d). This is typical as increasing the dose allows more adsorption sites for a given fixed amount of dye utilized. Adsorption at various dye concentrations was rapid in the beginning and then gradually declined as adsorption progressed until equilibrium was attained at minutes 180 and above (Figure 5e).
Figure 5f depicts the study of the effect of agitation speed on the EB dye removal, which shows the highest removal percentage at speeds of 100 rpm and higher, with no significant differences (p > 0.05), as shown by ANOVA analysis. Adsorption capacity increased as the agitation speed was increased approaching a plateau at 100 rpm onwards. The dye was more easily adsorbed to the biosorbent bead because the liquid film thickness was reduced during agitation [15].

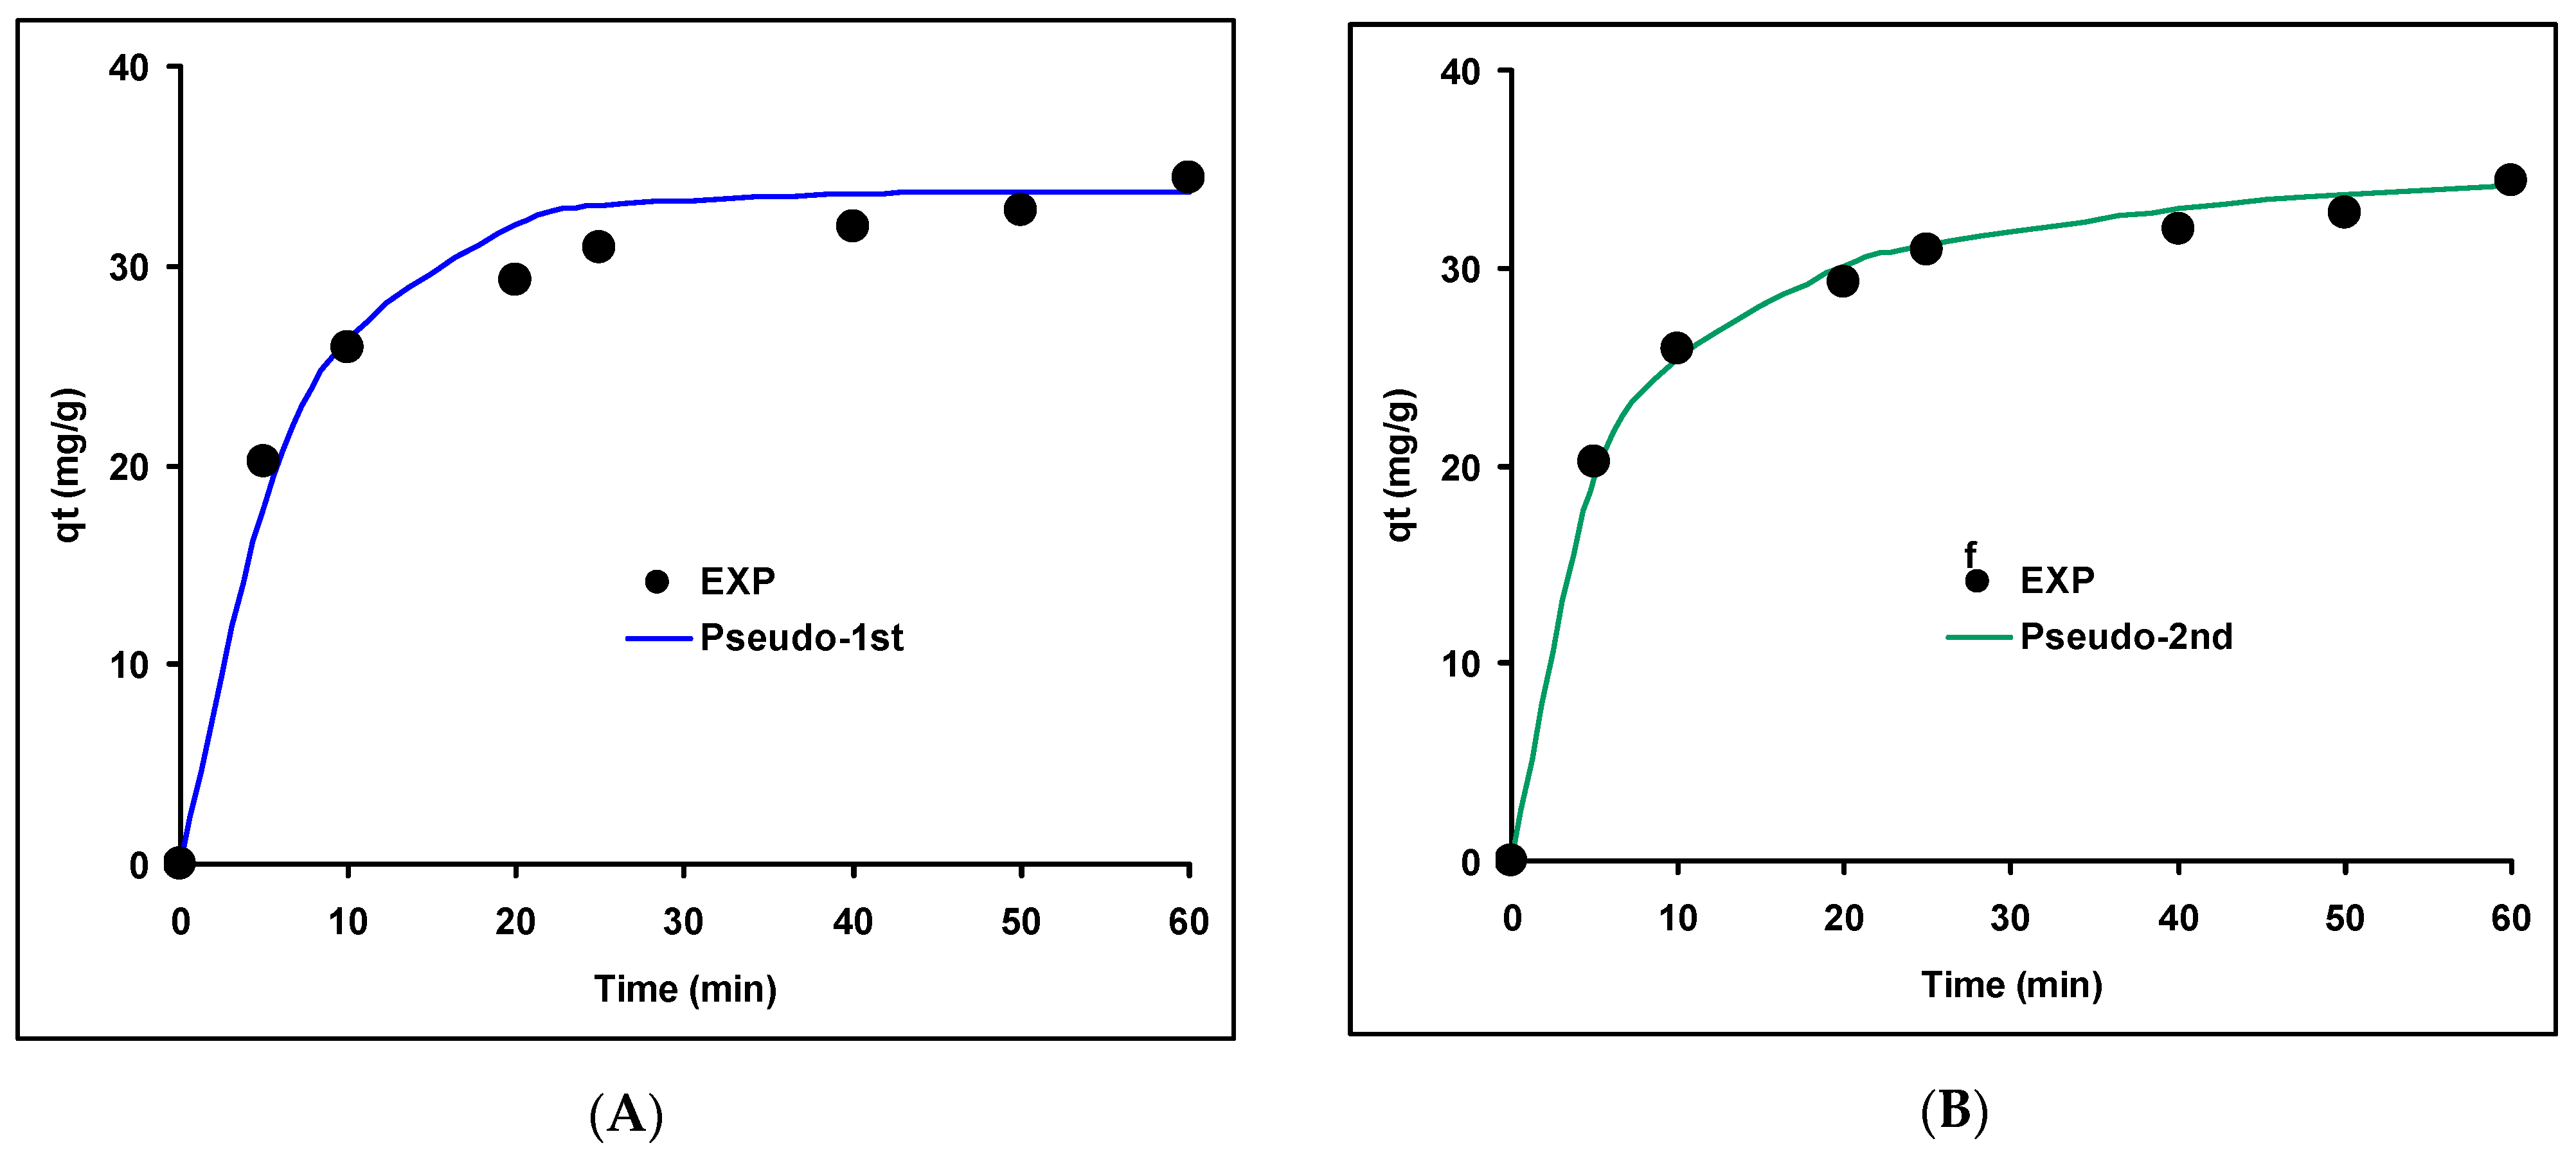
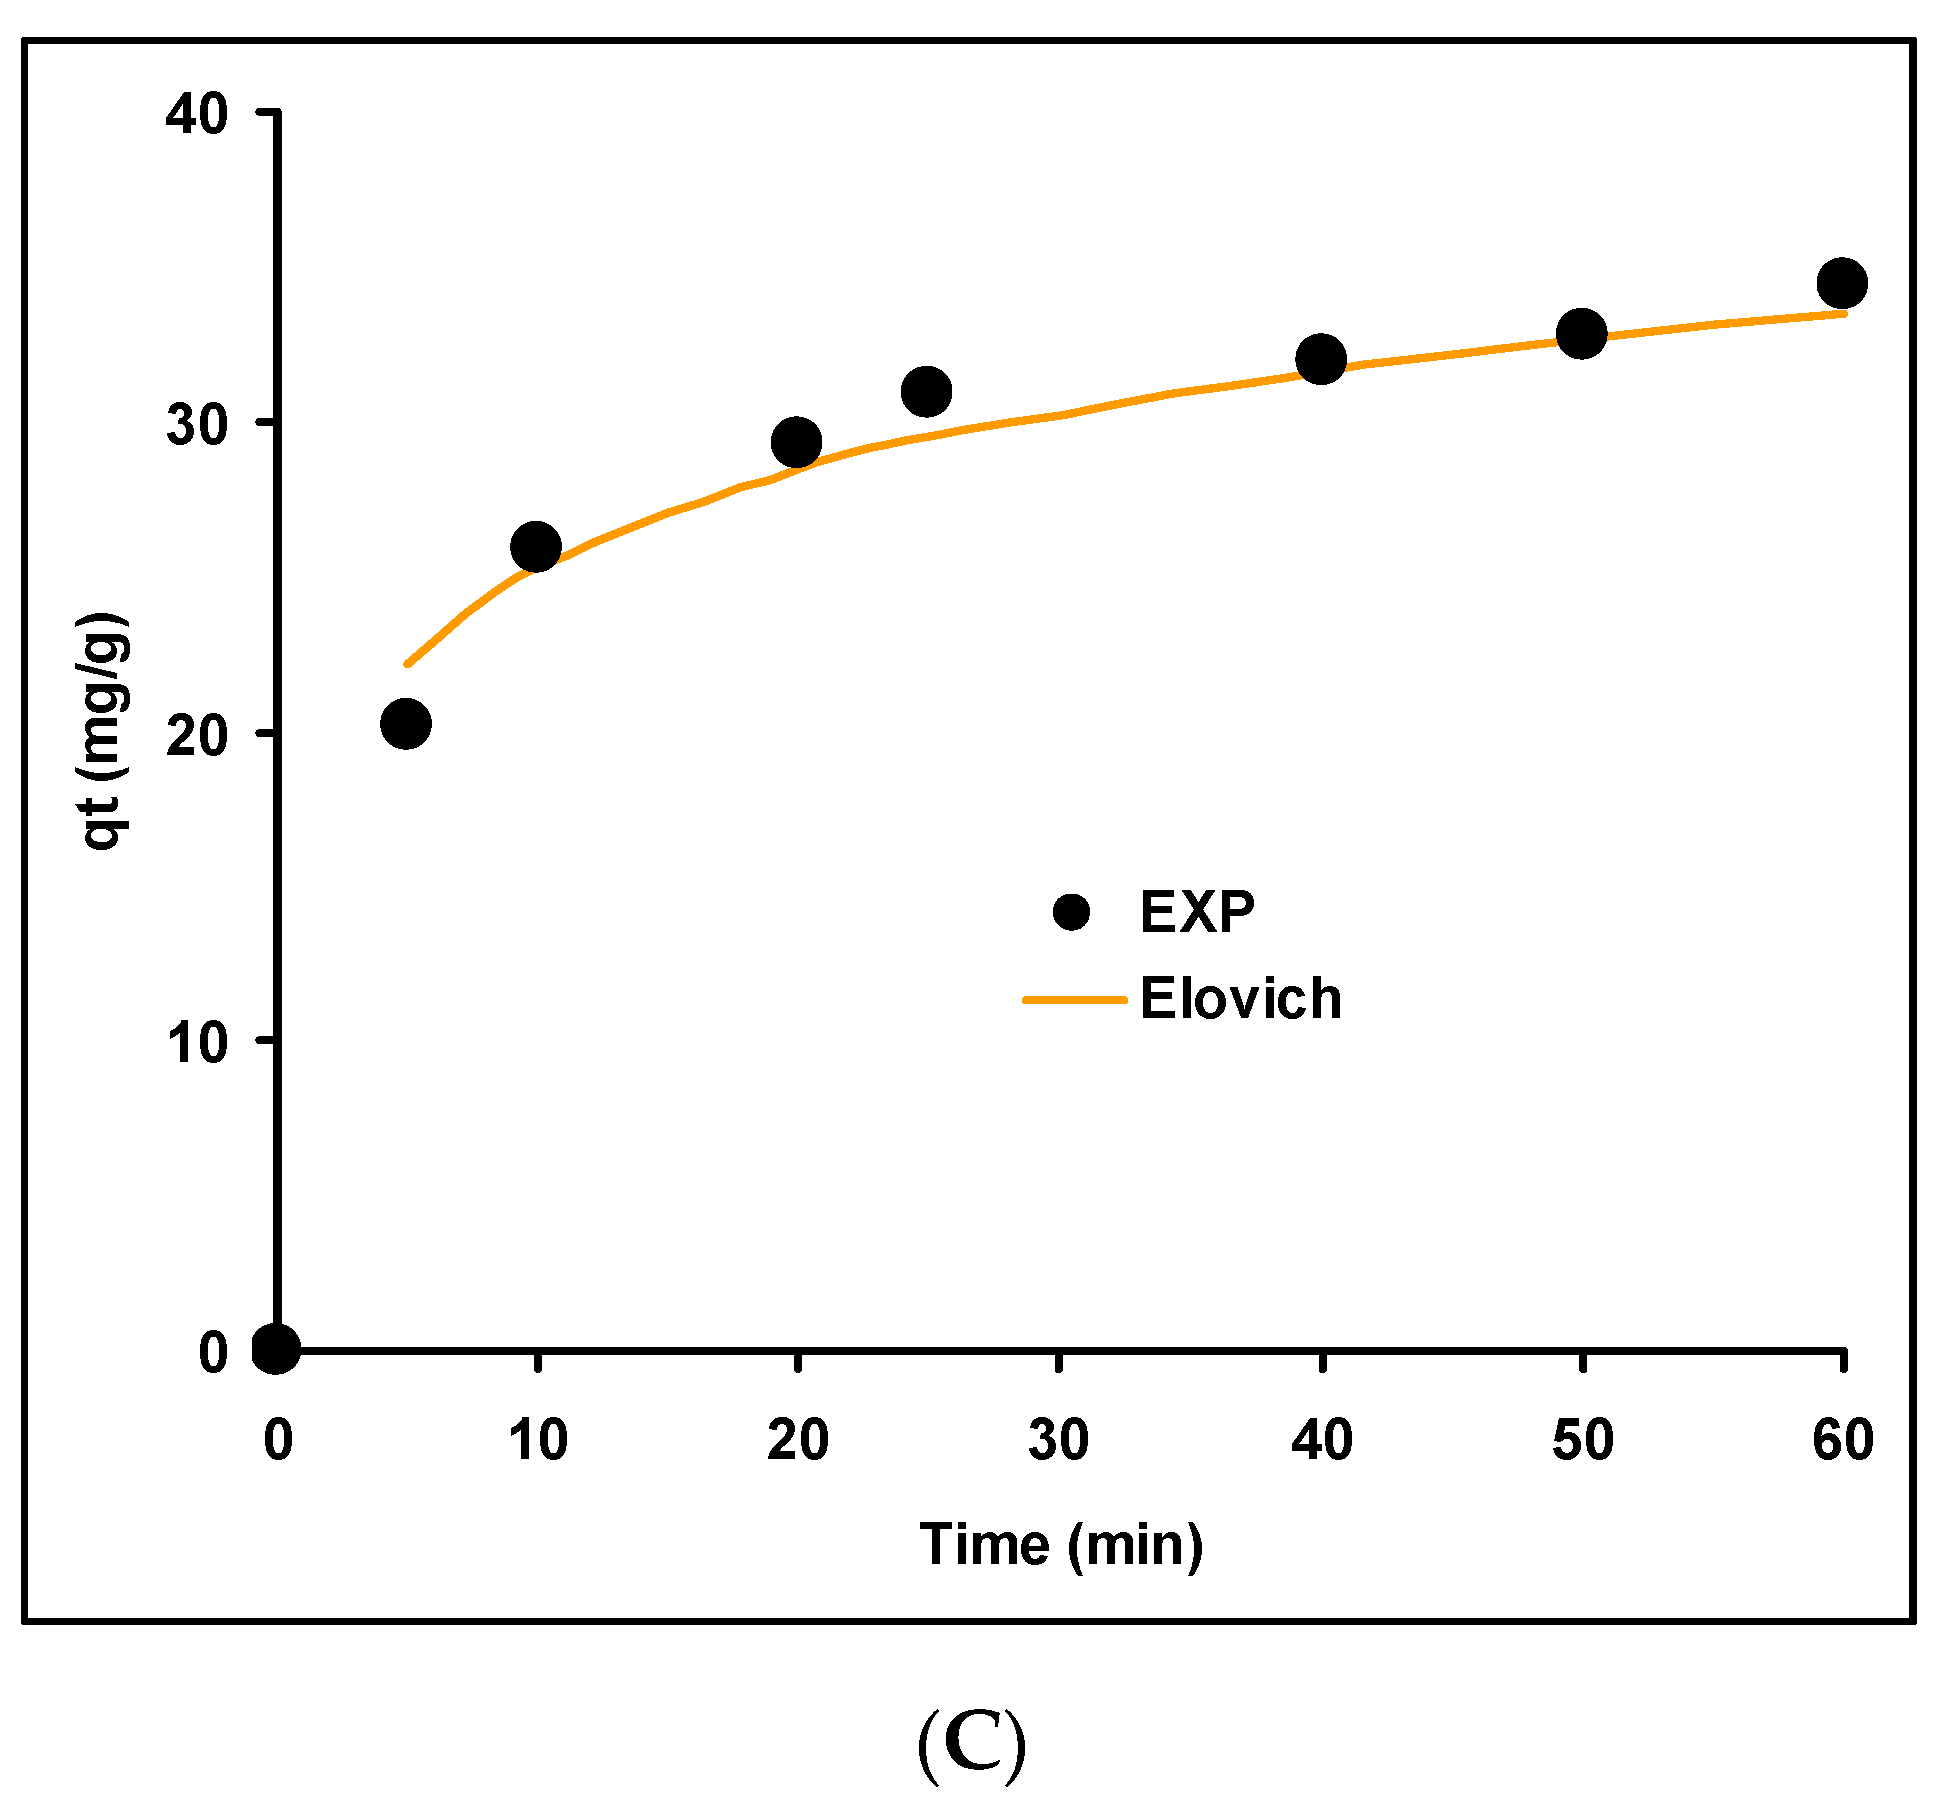
3.4. Determination of Kinetic Model for Batch Adsorption Studies

Pseudo-first-order (PFO), pseudo-second-order (PSO), and Elovich models were used for the kinetic analysis (Figure 6). The difficulty in assessing uncertainty, which is typically reported as a 95% confidence interval range, arises from the fact that linearizing nonlinear data disrupts the data’s error structure [16]. Since nonlinear regression is performed on the same abscissa as linear regression, it demonstrates more precise calculations and is thus preferred for fitting kinetic models.
The estimated parameters of each model were determined using nonlinear regression (Table 3). Considering the statistical indicators, pseudo-second-order is more accurate in describing the biosorption kinetic profiles than PFO and Elovich. The list of other error functions analysis shows the PSO model gave the best values with the lowest RMSE and AICc, adjusted R2 nearest to 1.0, and bias and accuracy factors near unity (Table 4). The current adsorption kinetics data fitted to the second-order pseudo-kinetics as the most preferred model, followed by PFO and then Elovich. As far as EB dye biosorption is concerned, two previous studies showed that the PSO model is the best in the biosorption study using aqai stalk and cupuassu shell [10,17].
Figure 7 displays the results of the PSO fitting to the data from a range of EB concentrations. The data show very good agreement with the PSO model, with all regressed lines having adjR2 values greater than 0.98.
It is generally agreed upon that one of the ways in which the rationality of the PFO and PSO equations can be approached is through the capability to match adsorption kinetic data. This is the case in spite of the fact that this criterion has very little to do with determining whether or not they have a strong physicochemical foundation. When the initial adsorbate concentration was increased, both the phenomenological rate constant, k1, and the phenomenological rate constant, k2, dropped. It was challenging to extrapolate relevant data and difficult to make inferences about the underlying physics and chemistry because of the high inter-measurement variation in k1 and k2. Even if the experimental circumstances that affected the adsorption kinetics were not properly controlled, the PFO and PSO equations can still be used to match the majority of the kinetic data. In many cases, the PFO equation predicted values for qe that were lower than the actual values found in the experiments. This anomaly was caused by a delay at the beginning of the adsorption process, which was most likely brought on by the presence of a boundary layer or resistance from the outside environment. PSO is sometimes linked with evidence of chemisorption, which is a typical misunderstanding regarding the adsorption process that followed the PSO equation [15,18,19].

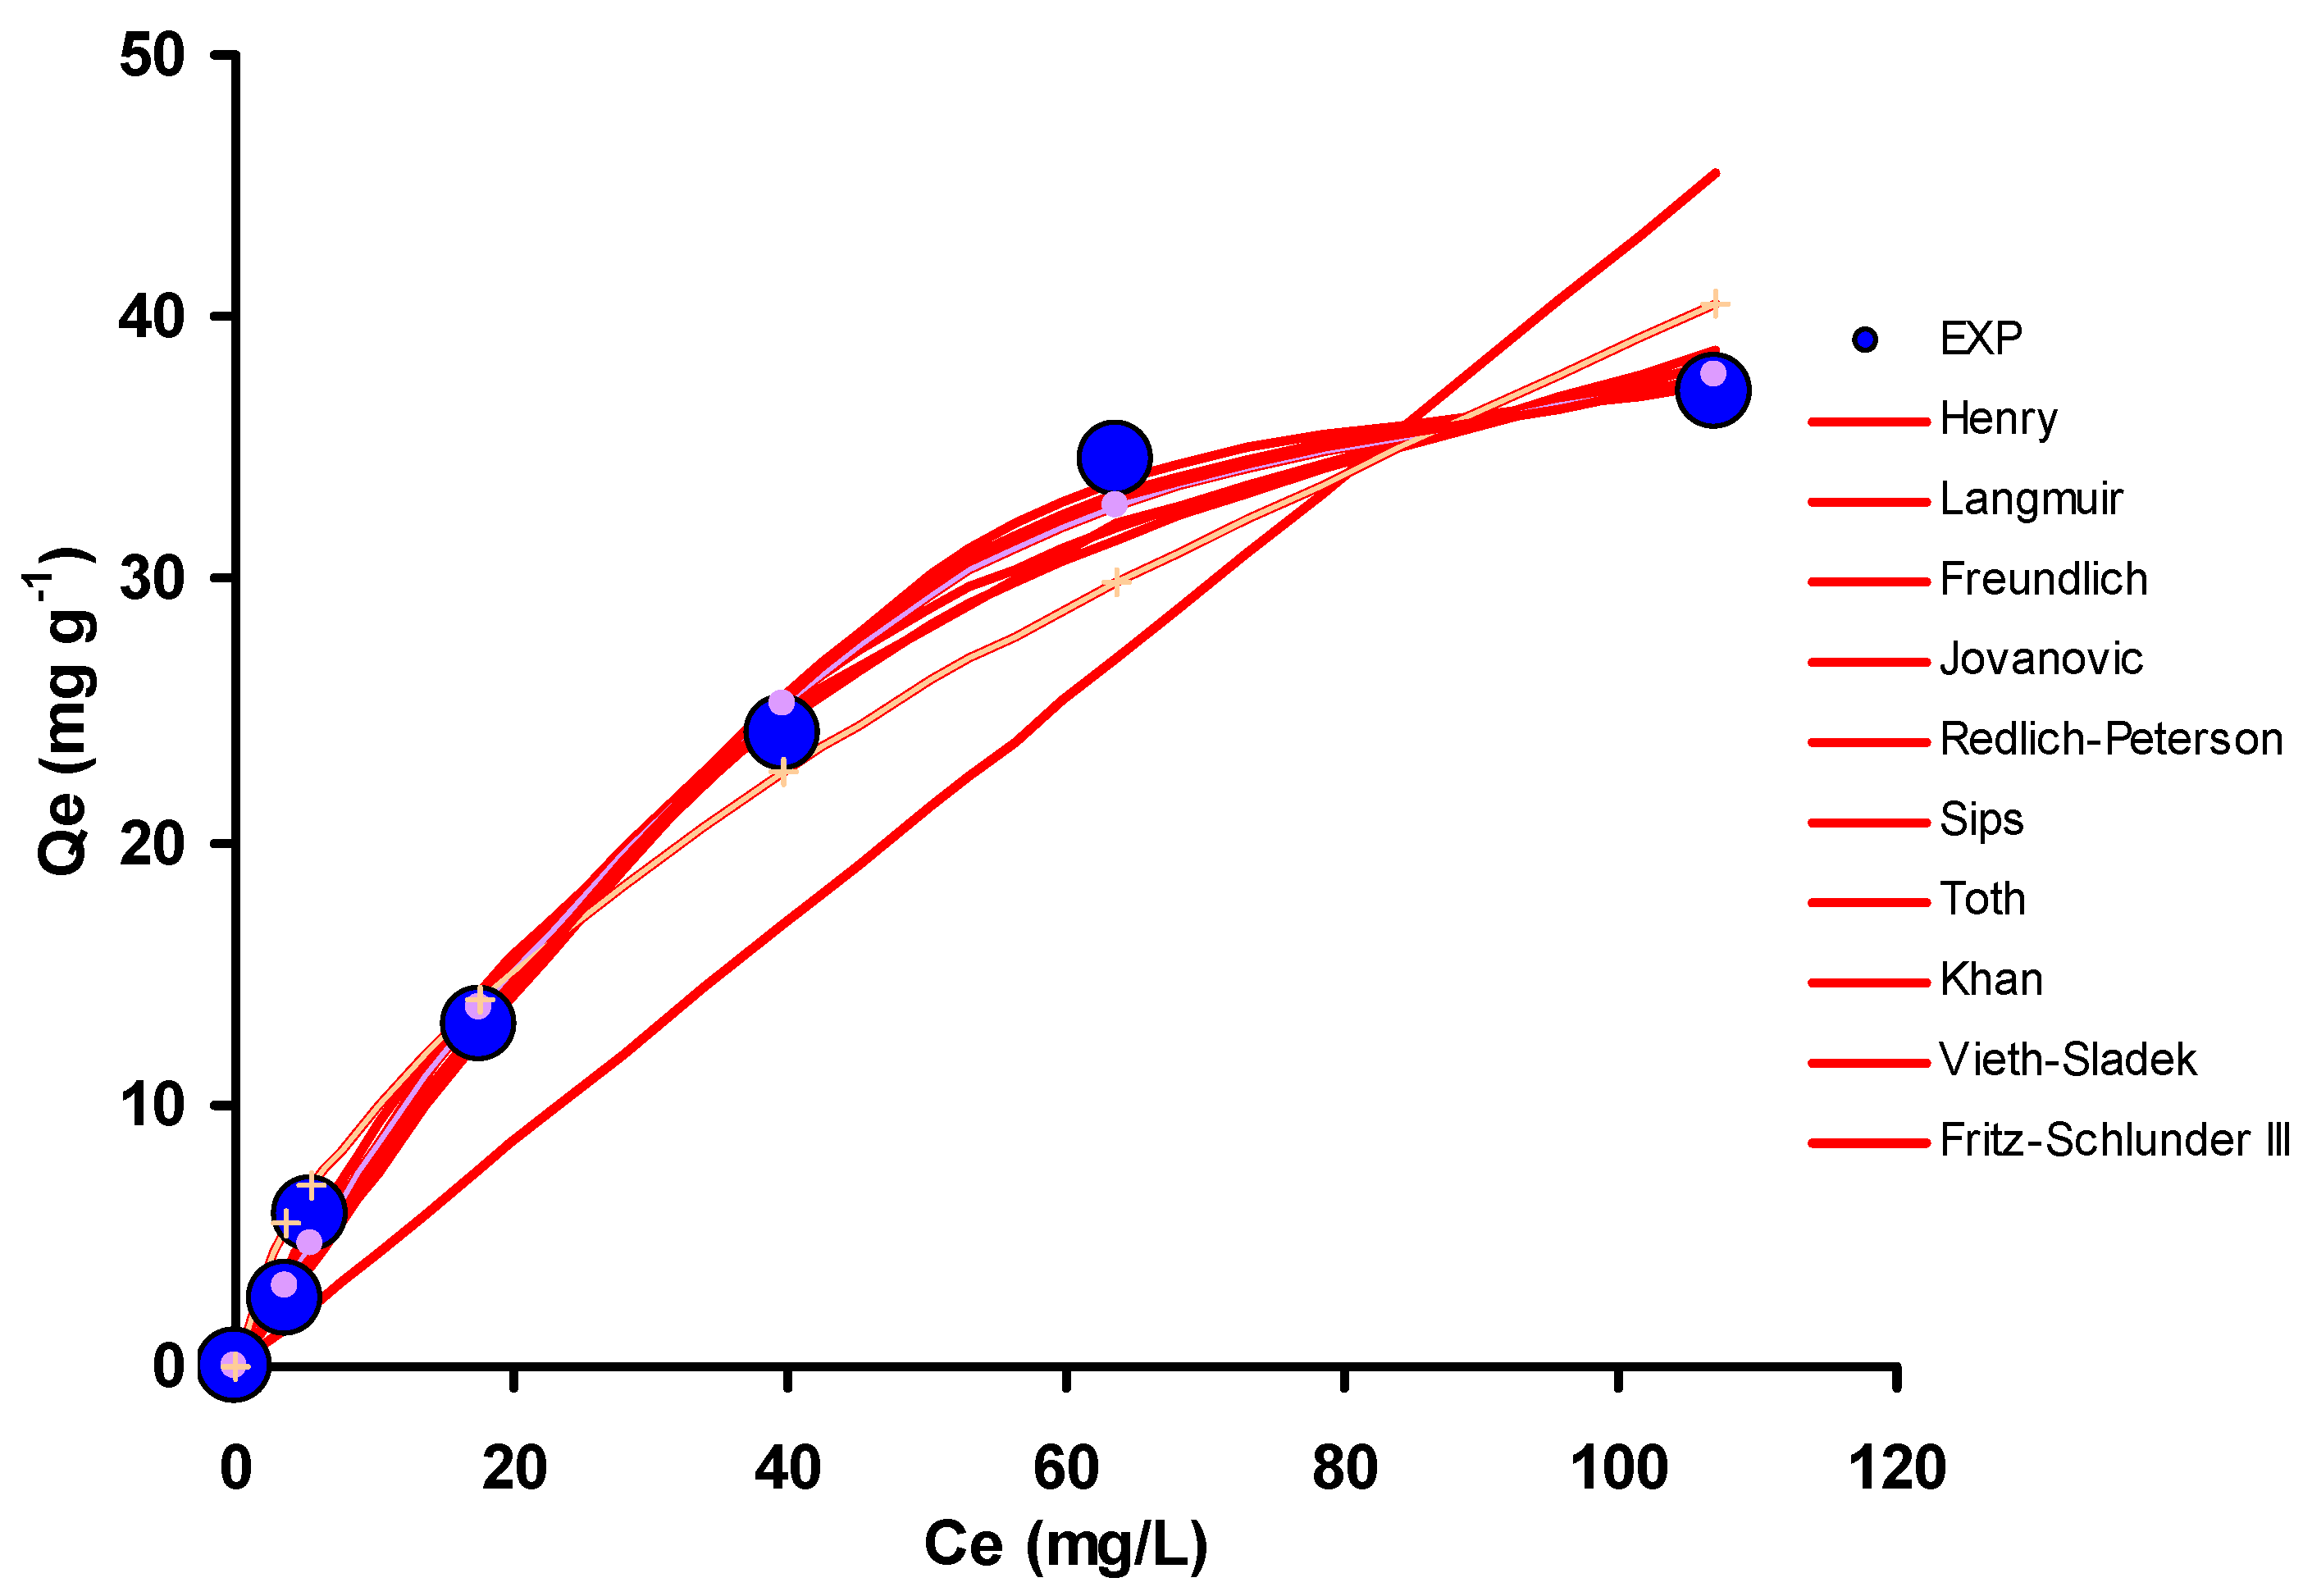
3.5. Adsorption Isotherm Model

All 10 isotherms models were fitted to the data (Figure 8). Based on Table 5, the Redlich–Petersen isotherm model was the best out of the 17 fitted isotherm models used in the current investigation with an adjusted R2 value of 0.99, lowest values for RMSE and AICc while values of accuracy factor (AF) and bias factor (BF) closest to unity.
Table 6 lists the top-ten isotherms’ best models, which exhibited adequate fitting. The best-fit adsorption data was Redlich–Peterson, however, it lacks the important parameter Qm or maximum adsorption capacity, which is very useful when comparing the efficiency with other studies. With this in mind, the mechanistic Langmuir model, which is the third-best model, was more useful. The second-best model, Jovanovic is semi-empirical, being a composite of the empirical Freundlich and mechanistic Langmuir. The Langmuir model predicted a maximum adsorption capacity of 58.506 mg g−1. Data on the use of agricultural waste for EB and selected other dyes removal are shown in Table 7. Very few reports are available on the use of agricultural waste as EB dye sorption. In one report, the use of shell waste from Theobroma grandiflorum is reported where the maximum adsorption capacity (qm) is 37.5 mg g−1, with the Avrami as the best kinetic model and the Sips isotherm as the best model [17]. In another report using the Aqai stalk, a maximum adsorption capacity (qm) of 46.6 mg g−1 was obtained with the Avrami as the best kinetic model, similar to Theobroma grandiflorum and with the Sips isotherm also as the best model [10]. At this point, banana peel is the best agricultural waste biosorbent so far. As far as EB dye is concerned, sorption work using other sorption materials is also limited in the literature despite EB dye being highly used in the textile industry [20,21,22,23].

3.5.1. Theory of Isotherms Studies

The isotherms express the dynamic equilibrium between the dye molecules on the adsorbent surface and in the aqueous phase that occurs during the adsorption process under isothermal conditions. Adsorption isotherms like these make it easy to determine how many adsorbents should be used [32]. The best explanation for the adsorbent–adsorbate interaction can be observed in many of the fitted isotherms, which are system dependent. There are a number of models for the adsorption equilibrium state. The best isotherm models often utilized and reported in the literature, such as the Langmuir and Freundlich models, are explained below.

Langmuir

The Langmuir isotherm states that adsorption occurs on a monolayer condition, which is the central theme of this model. For monolayer adsorption to occur, the isotherm supposes that almost all adsorption sites are identical and have energy that is the same and that the adsorbent is structurally homogeneous [33]. Because intermolecular forces decay exponentially with distance, this isotherm model expects the presence of the dye’s monolayer coverage at the adsorbent’s external surface. A constant monolayer adsorption capacity is predicted, and linear simplification is achieved in this model that covers the low and high solute concentrations in Henry’s model [15].
The parameter qmL (mg g−1) is the Langmuir isotherm’s maximum monolayer adsorption capacity and bL (L/mg) (together with qmL are the Langmuir model constants. To determine whether there is a favorable or unfavorable affinity between the sorbate and the sorbent, Weber and Chakravorti purported RL, a separation factor [34], where the equation is as follows.
R L = 1 1 + C e b L

Freundlich Isotherm

Adsorption is sometimes best illustrated by the empirical Freundlich isotherm model rather than the idealized monolayer Langmuir isotherm. Because affinities and adsorption heat are not generally equally distributed across a surface that is heterogeneous, this relationship can shed light on the phenomenon of multilayer adsorption [35,36].
In which nF is the Freundlich exponent, and the Freundlich isotherm constant is KF (l/g). 1/nF’s has a magnitude between 0 and 1, and this measures adsorption intensity or surface heterogeneity. The chemisorption process is anticipated to occur at values below 1, while a cooperative adsorption process is indicated for values above 1 [35,36].

The Jovanovic Isotherm Model

Similar to Langmuir, this model takes into account an adsorption surface assumption. This situation corresponds to the second approximation for localized monolayer adsorption without the presence of lateral interactions. In contrast to the popular Langmuir model, this model takes into account adsorbed species surface binding vibrations [37].
In the model, the maximal adsorption capacity (mg/g) is denoted by qmJ. Assumptions similar to those of the Langmuir isotherm were used by Jovanovic [37] in this model’s creation. The Jovanovic isotherm approximates lateral-interaction-free monolayer localized adsorption. It conforms to Langmuir isotherm instead of Henry’s law at very high concentrations [36]. For Jovanovic local behavior, this isotherm predicts a quasi-Gaussian function with a bias toward high adsorption energies. Jovanovic also develops further the equation that can predict multilayer adsorption (three parameters) [37].

Redlich–Peterson Isotherm Model

There are three parameters in this model, and they encompass characteristics of both the Freundlich and Langmuir models. Since this model is a hybrid, the adsorption mechanism does not strictly adhere to the principles of ideal monolayer adsorption [38]. The Redlich–Peterson model has many uses, and it can be applied to both heterogeneous and homogeneous systems.
Where aRP is the model constant of the Redlich–Peterson isotherm (mg/L−g), KRP is the Redlich–Peterson model isotherm constant (L/g), and bRP is the model exponent of the Redlich–Peterson that ranges from 0 to 1. At bRP = 0, the Redlich–Peterson equation is reduced to the single parameter Henry’s equation, and at bRP = 1, it is reduced to the monolayer Langmuir’s equation. The concentration dependence of the adsorption equilibrium is linear, and this holds true over a wide concentration range. The numerator enters the Henry zone at infinite dilution because it is based on the Langmuir isotherm model [39]. This isotherm model requires the barest minimum of steps to solve the equations. This strategy maximizes the concordance between the theoretical model and the experimental data [40].

Toth Isotherm Model

This isotherm model employs an empirically modified version of the Langmuir equation in an effort to reduce the gap between observed and predicted values. Because it can be used to represent both low and high adsorbate concentrations, the model is widely used in modeling adsorption systems that are heterogeneous. This isotherm model is based on the hypothesis that the energies of adsorption of most sites lie below the mean and peak values [41]. The nT value can indicate the surface variation’s degree. When nT approaches unity, it is transformed to the Langmuir isotherm equation, which is characteristic of adsorption on a homogenous surface. This means that the term nT can represent the adsorption system’s heterogeneity, where the system becomes heterogeneous when the nT value is not equal to unity [42]. Furthermore, an increase in temperature causes a quick increase in KT, as this is a result of the independent association between temperature and the parameter nT.
Since the equation of the Toth isotherm model can fit the data at both high and low concentrations, it is preferred over Sips’ model. Do [43] describes an isotherm model in which the slope is constant at zero loading but begins to decrease at a given loading at a rate much faster than that predicted by the Langmuir equation. This is due to the impact of heterogeneity, as measured by the term nT. A slower increase in the adsorbed amount vs. pressure is observed than predicted by the Langmuir equation because molecules are initially attracted to higher-energy sites but are eventually attracted to lower-energy sites as the adsorption process continues.

Henry Isotherm

When solutes are adsorbed onto a uniform adsorbent surface at a low enough concentration resulting in all of the solute molecules being separated from their nearest neighbors, the best-fit model under this condition is Henry. This is the most basic sort of adsorption isotherm since it indicates that the amount of adsorbate at the surface is exactly proportional to the adsorbate concentration. The equilibrium concentrations of the fluid and adsorbed phases are linearly connected in this isotherm.

Fritz–Schluender–III Isotherm

Fritz and Schluender propose a high number of coefficients isotherm which is an empirical expression. Due to these numerous coefficients, the model can fit a wide variety of adsorption data [44]. Fritz–Schluender-III reduces to the Freundlich model for large adsorbate concentrations but changes to the Langmuir model if nFS = 1.

Vieth–Sladek Isotherm

Vieth–Sladek developed a model with a special two-part component while working on a novel approach to diffusion rate estimation in solid adsorbents from transient adsorption. The Vieth–Sladek model consists of a linear segment (Henry’s law) and a nonlinear segment (the one most commonly encountered) (Langmuir isotherm). The model’s linear portion depicts the physisorption process by which molecules bind to the adsorbent’s porous surfaces’ specific sites, while the nonlinear portion graphically depicts this adsorption process [45].

Sips Isotherm Model

Combining the Langmuir and Freundlich isotherm models resulted in the Sips isotherm model, which allows the prediction of adsorption systems heterogeneity but at the same time avoids the limitations instigated by increasing adsorbate concentrations in the Freundlich model. Then, an expression is created that has a finite limit at high concentration. Due to its ability to effectively localize the adsorption without involving the adsorbate–adsorbate interaction, the Sips model is found in many applications [46]. At high adsorbate concentrations, the Langmuir model’s monolayer adsorption feature is predicted, while at low adsorbate concentrations, the Sips isotherm model reduces to the Freundlich model, suggesting that it deviates from Henry’s law. The equation’s settings are determined by real-world variables like pH, concentration, and temperature [47]. The Sips model suffers from the same problem as the Freundlich model: Both fail to accurately predict Henry’s law limit at low pressure (or concentration) [43].

Khan Isotherm

Khan et al. have developed a generalized equation to model the adsorption of compounds under very dilute conditions [48]. The fact that this isotherm includes both the Langmuir and Freundlich isotherms makes it particularly interesting. The isotherm model was developed for use with both binary and ternary systems. The Khan equation simplifies to the Langmuir isotherm for aK = 1 and to the Freundlich isotherm for large values of Ce [36].

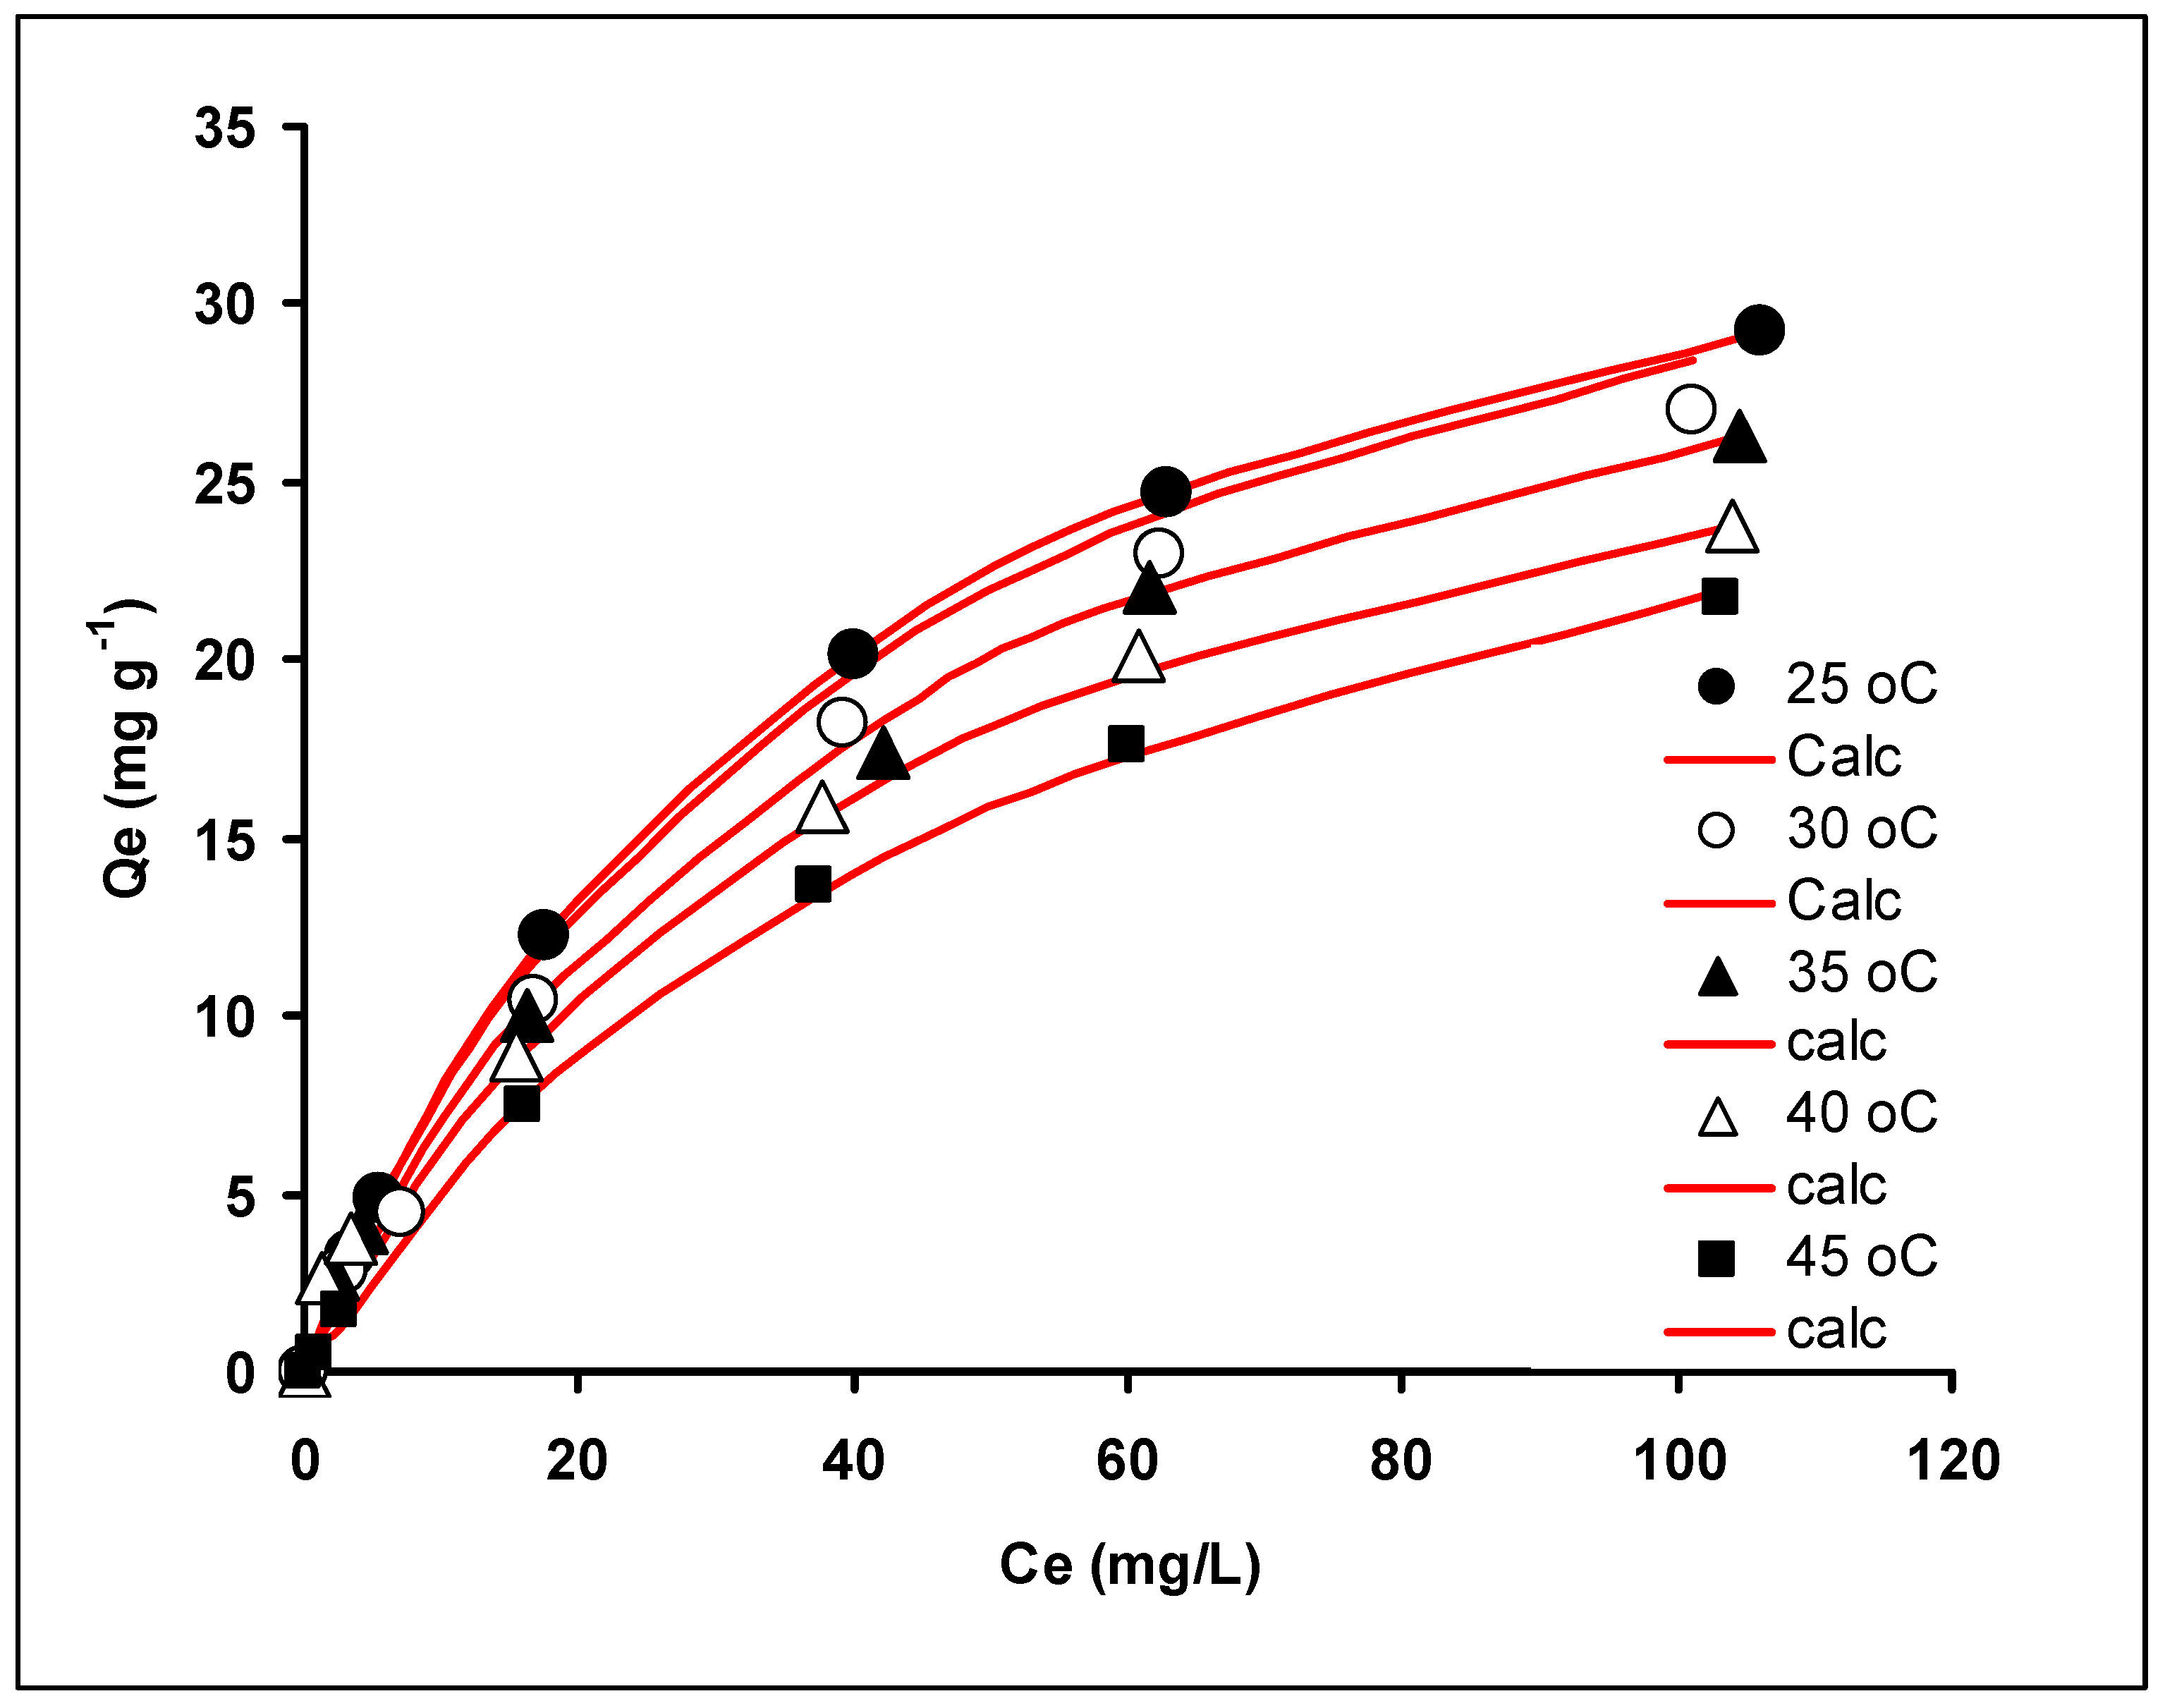
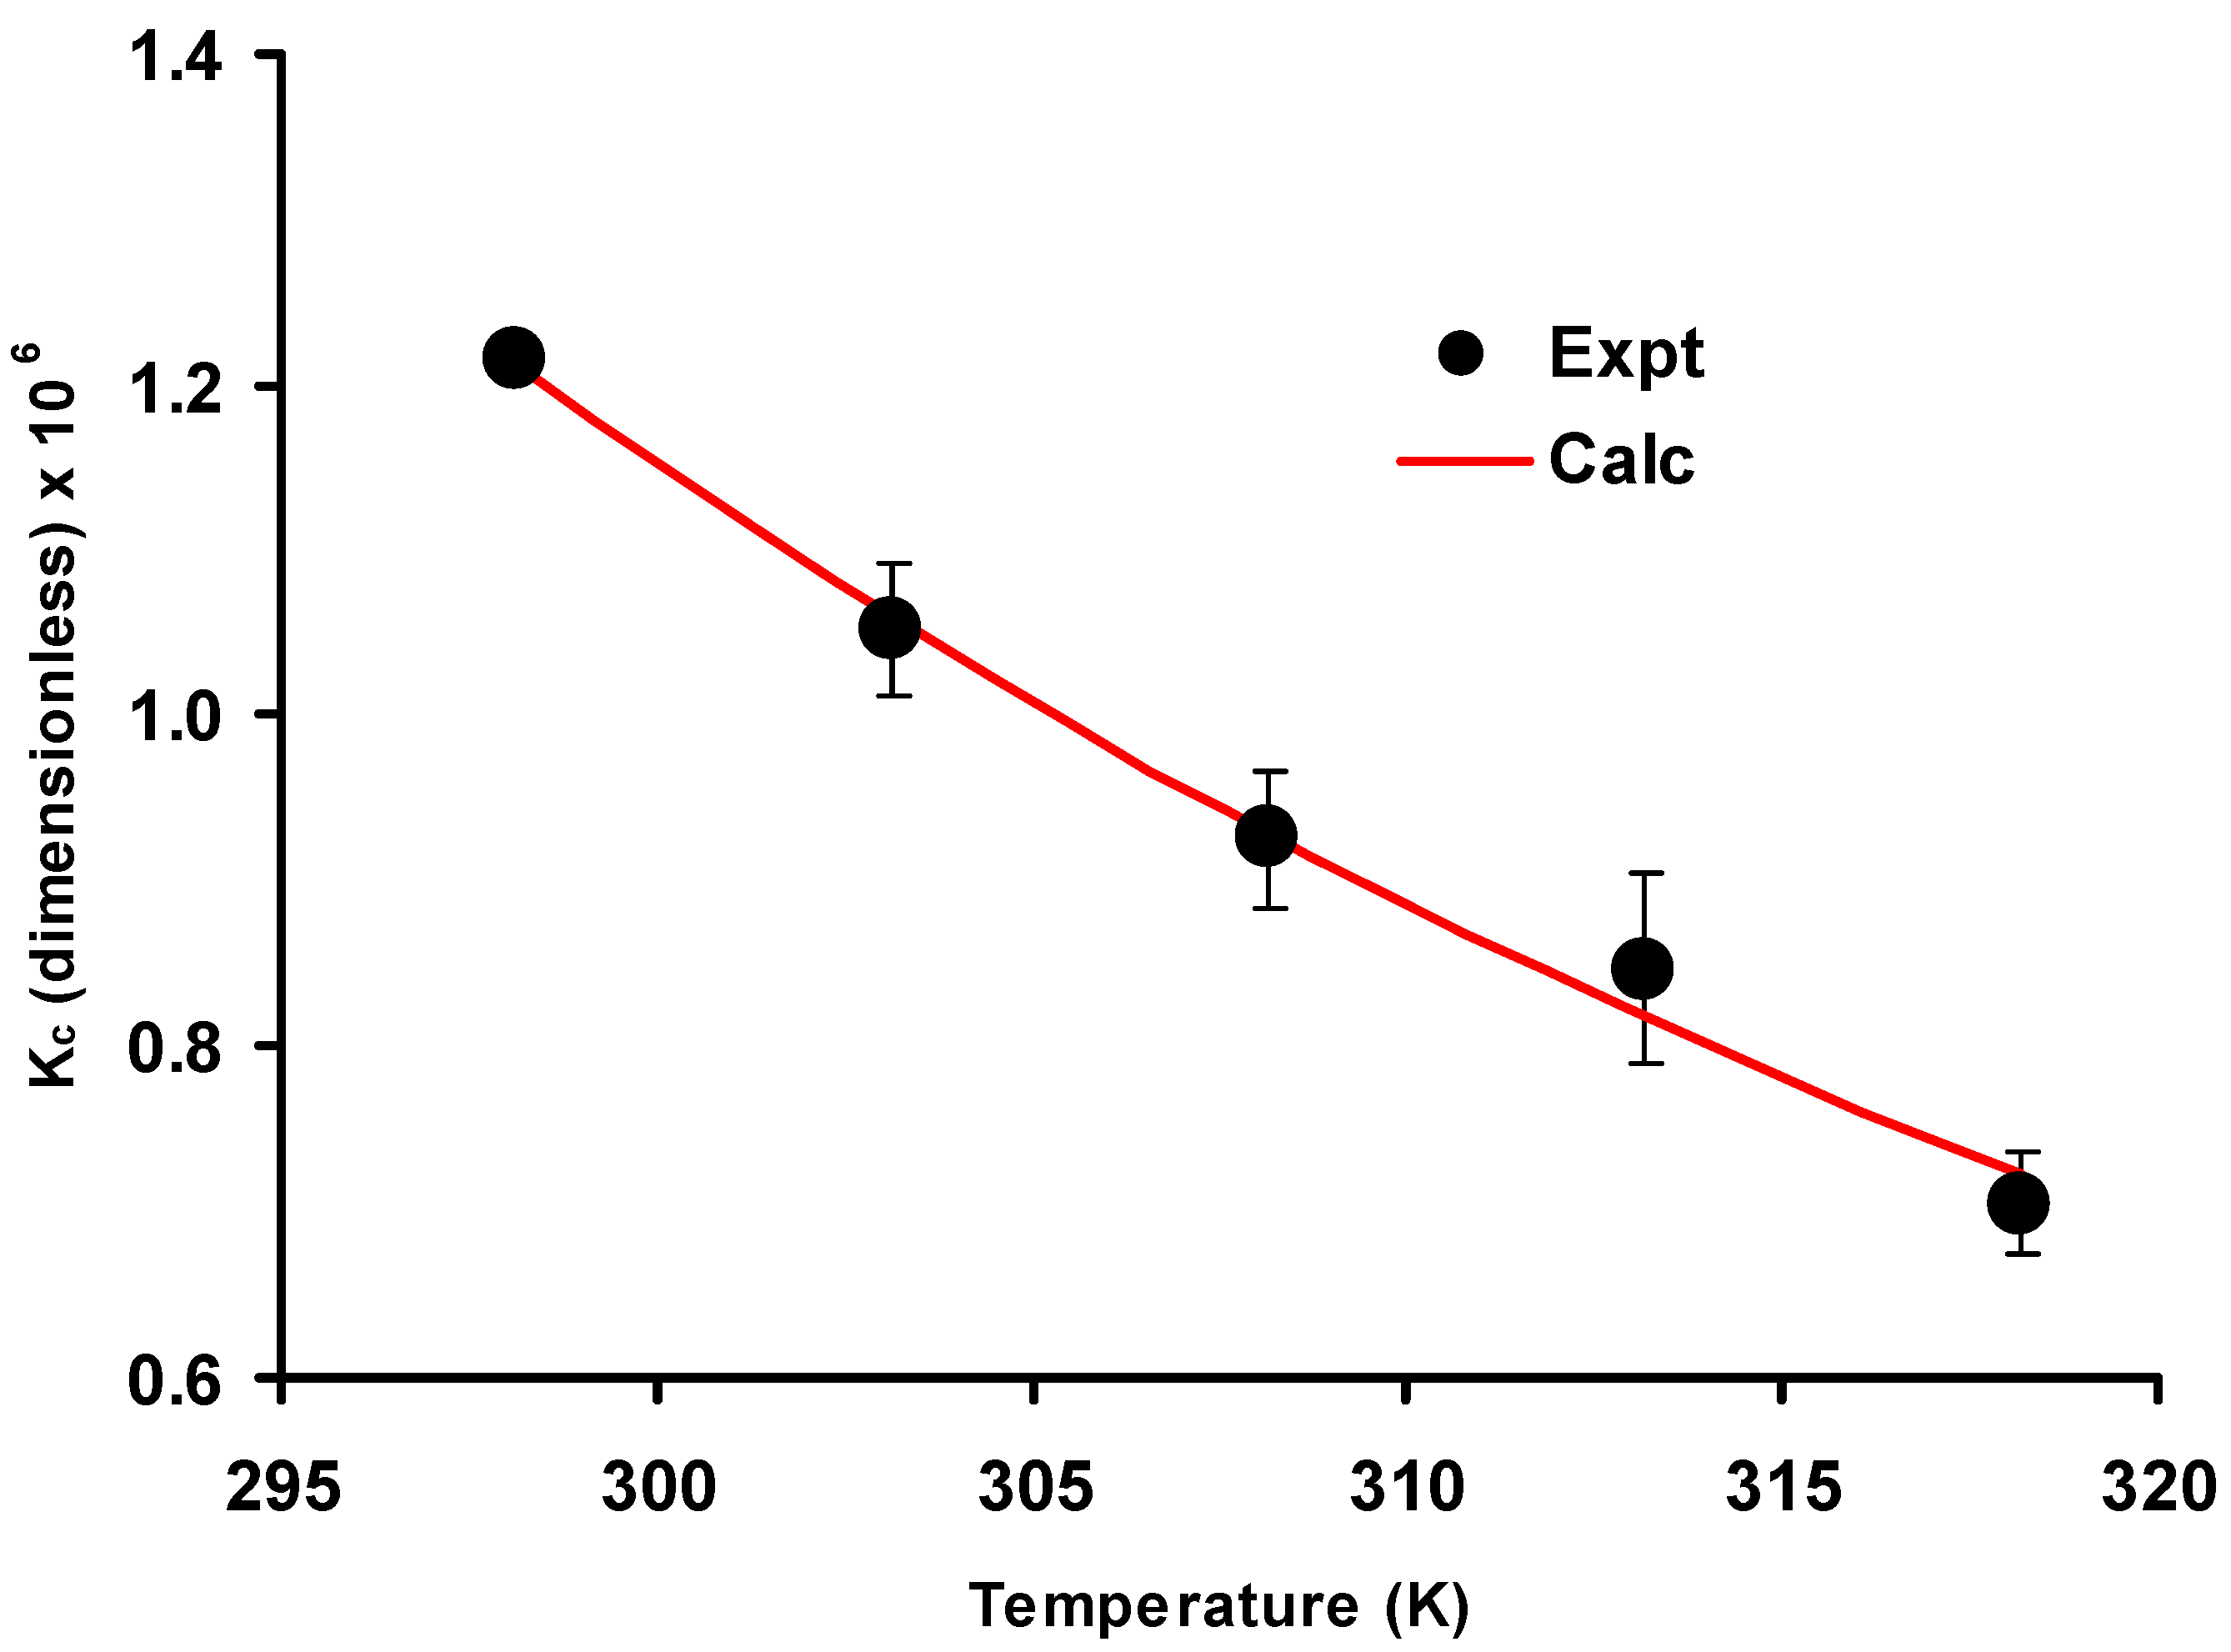
3.6. Thermodynamic Studies

Figure 9 depicts the plot of Langmuir isotherms of 200 mg/L EB dyes adsorbed by banana peel at various temperatures. As the temperature is increased from 25 to 45 °C, there appears to be a decrease in the maximum adsorption capacity of EB. This might be due to two possible reasons: A constant increase in widening sorption site on banana peel was unfavorable to an adsorbed dye molecule, and desorption phenomena produced by weak adsorption contact throughout the adsorption phase, which is commonly seen in physisorption [49,50]. Table 8 summarises the results for determining the parameters of thermodynamics. Based on the van’t Hoff plot in Figure 10, the standard Gibbs free energy (−Δ) negative values indicated that the process of EB dye adsorption onto banana peel biosorbent is spontaneous without or with low input of energy and heat [51]. The present study suggests that the adsorption process was likely a physisorption process. This is because, for chemisorption, the values range from −400 to −80 kJ/mol, and anything less than that is likely physisorption [52]. In addition, one of the hallmarks of physisorption is the dye is prone to desorption as the temperature of the system is increased [53,54,55,56,57], which was observed in this study.
In general, the van’t Hoff plot’s slope defines whether the system is endothermic (positive slope) or exothermic (negative slope). At high adsorbate concentrations, more than one layer of adsorbate can cover the adsorbent’s surface, and physisorption frequently occurs as a multilayer process when using plant-based biosorbents [58,59]. The Redlich–Petersen model predicts suboptimal conditions for monolayer adsorption, favoring instead a hybrid monolayer-multilayer structure. Adsorption may occur in either a monolayer or, more likely, a multilayer configuration at different adsorption sites. Chemical and physical adsorption can coexist in the same layer. Adsorption occurs physically for all subsequent layers after the initial one. Adsorption processes on a heterogeneous surface, such as a plant-based biosorbent, are typically physisorption [60].
The negative value of the conventional adsorption enthalpy (H° = −20.37 kJ/mol) is consistent with the exothermic nature of the adsorption reaction seen in the biosorption of many dyes by agricultural waste. Neither of the two studies conducted with agricultural wastes and discussed by Cardoso et al. [17] that dealt with EB dye included thermodynamic studies. Similarly, no thermodynamic studies were reported for the other sorbent materials used for EB dye removal [10,61].

4. Conclusions

Element analysis reveals the presence of nitrogen, oxygen, and carbon atoms in the amorphous structure of banana peel biosorbent, which is primarily composed of irregular and shapeless particles with sizes on the order of 1 mm. Banana peel EB dye adsorption was enhanced at acidic pH. The best kinetic and isotherm models, according to the data, were the pseudo-second-order and the Redlich–Petersen isotherm. Banana peel had a maximum EB biosorption capacity of 58.51 mg g−1, as determined using the Langmuir model. The reaction occurred spontaneously, exothermic in property, and involved physisorption. In light of these considerations, it seems plausible that banana peel could serve as a cheap biosorbent tool for the treatment of dye effluents, in particular, EB dye.

Author Contributions

Conceptualization, A.A.B., M.E.K. and M.Y.A.S.; methodology, A.A.B. and M.Y.A.S.; software, M.Y.A.S.; validation, M.Y.A.S.; formal analysis, M.E.K., A.A.B. and M.Y.A.S.; writing—original draft preparation, A.A.B.; writing—review and editing, M.Y.A.S.; supervision, N.A.Y., A.R.O. and M.Y.A.S.; funding acquisition, M.E.K. and M.Y.A.S. All authors have read and agreed to the published version of the manuscript.

Funding

This research is funded under the Fundamental Research Grant Scheme (FRGS/1/2019/STG05/UPM/02/7) by the Ministry of Higher Education (MOHE) Malaysia.

Data Availability Statement

Data availability Some or all data, models, or codes generated or used during the study are available from the corresponding author by request.

Conflicts of Interest

The authors declare they have no competing interests.

References

  1. Motulsky, H.J.; Ransnas, L.A. Fitting Curves to Data Using Nonlinear Regression: A Practical and Nonmathematical Review. FASEB J. 1987, 1, 365–374. [Google Scholar] [CrossRef]
  2. Ofomaja, A.E.; Naidoo, E.B. Biosorption of Copper from Aqueous Solution by Chemically Activated Pine Cone: A Kinetic Study. Chem. Eng. J. 2011, 175, 260–270. [Google Scholar] [CrossRef]
  3. Yuliusman; Nasruddin; Afdhol, M.K.; Amiliana, R.A.; Hanafi, A. Preparation of Activated Carbon from Palm Shells Using KOH and ZnCl2 as the Activating Agent. IOP Conf. Ser. Mater. Sci. Eng. 2017, 180, 012282. [Google Scholar] [CrossRef]
  4. Satchawan, S.; Phuengphai, P.; Ratanamanee, A.; Meethong, N. Kinetic and Equilibrium Studies of Fe(III) Sorption from an Aqueous Solution Using Palmyra Palm Fruit Fibres as a Biosorbent. Appl. Sci. 2022, 12, 10540. [Google Scholar] [CrossRef]
  5. Payus, C.M.; Refdin, M.A.; Zahari, N.Z.; Rimba, A.B.; Geetha, M.; Saroj, C.; Gasparatos, A.; Fukushi, K.; Alvin Oliver, P. Durian Husk Wastes as Low-Cost Adsorbent for Physical Pollutants Removal: Groundwater Supply. Mater. Today Proc. 2021, 42, 80–87. [Google Scholar] [CrossRef]
  6. Mohd Taib, R.; Abdullah, N.; Sulaiman, F.; Miskam, M. Characterization of Banana (Musa Spp.) Pseudo-Stem and Fruit-Bunch-Stem as a Potential Renewable Energy Resource. Int. J. Biol. Vet. Agric. Food Eng. 2014, 8, 712–716. [Google Scholar]
  7. Kabenge, I.; Omulo, G.; Banadda, N.; Seay, J.; Zziwa, A.; Kiggundu, N. Characterization of Banana Peels Wastes as Potential Slow Pyrolysis Feedstock. J. Sustain. Dev. 2018, 11, 14. [Google Scholar] [CrossRef]
  8. Ngabura, M.; Hussain, S.A.; Ghani, W.A.W.; Jami, M.S.; Tan, Y.P. Optimization and Activation of Renewable Durian Husk for Biosorption of Lead (II) from an Aqueous Medium. J. Chem. Technol. Biotechnol. 2019, 94, 1384–1396. [Google Scholar] [CrossRef]
  9. Mongioví, C.; Crini, G.; Gabrion, X.; Placet, V.; Blondeau-Patissier, V.; Krystianiak, A.; Durand, S.; Beaugrand, J.; Dorlando, A.; Rivard, C.; et al. Revealing the Adsorption Mechanism of Copper on Hemp-Based Materials through EDX, Nano-CT, XPS, FTIR, Raman, and XANES Characterization Techniques. Chem. Eng. J. Adv. 2022, 10, 100282. [Google Scholar] [CrossRef]
  10. Prola, L.D.T.; Acayanka, E.; Lima, E.C.; Bestetti, C.; Santos, W.O.; Pavan, F.A.; Dias, S.L.P.; Tarley, C.R.T. Application of Aqai Stalks as Biosorbent for the Removal of Evans Blue and Vilmafix Red RR-2B Dyes from Aqueous Solutions. Desalination Water Treat. 2013, 51, 4582–4592. [Google Scholar] [CrossRef]
  11. Shamim, M.; Dana, K. Efficient Removal of Evans Blue Dye by Zn–Al–NO3 Layered Double Hydroxide. Int. J. Environ. Sci. Technol. 2018, 15, 1275–1284. [Google Scholar] [CrossRef]
  12. Ahmad, M.A.; Ahmad, N.; Bello, O.S. Adsorptive Removal of Malachite Green Dye Using Durian Seed-Based Activated Carbon. Water. Air. Soil Pollut. 2014, 225, 2057. [Google Scholar] [CrossRef]
  13. Pathak, P.D.; Mandavgane, S.A. Preparation and Characterization of Raw and Carbon from Banana Peel by Microwave Activation: Application in Citric Acid Adsorption. J. Environ. Chem. Eng. 2015, 3, 2435–2447. [Google Scholar] [CrossRef]
  14. Mondal, N.K.; Kar, S. Potentiality of Banana Peel for Removal of Congo Red Dye from Aqueous Solution: Isotherm, Kinetics and Thermodynamics Studies. Appl. Water Sci. 2018, 8, 157. [Google Scholar] [CrossRef]
  15. Foo, K.Y.; Hameed, B.H. Insights into the Modeling of Adsorption Isotherm Systems. Chem. Eng. J. 2010, 156, 2–10. [Google Scholar] [CrossRef]
  16. Foo, K.Y.; Hameed, B.H. Textural Porosity, Surface Chemistry and Adsorptive Properties of Durian Shell Derived Activated Carbon Prepared by Microwave Assisted NaOH Activation. Chem. Eng. J. 2012, 187, 53–62. [Google Scholar] [CrossRef]
  17. Cardoso, N.F.; Lima, E.C.; Pinto, I.S.; Amavisca, C.V.; Royer, B.; Pinto, R.B.; Alencar, W.S.; Pereira, S.F.P. Application of Cupuassu Shell as Biosorbent for the Removal of Textile Dyes from Aqueous Solution. J. Environ. Manag. 2011, 92, 1237–1247. [Google Scholar] [CrossRef]
  18. Yaneva, Z.L.; Georgieva, N.V. Insights into Congo Red Adsorption on Agro-Industrial Materials—Spectral. Int. Rev. Chem. Eng. 2012, 4, 127–146. [Google Scholar]
  19. Hu, Q.; Pang, S.; Wang, D. In-Depth Insights into Mathematical Characteristics, Selection Criteria and Common Mistakes of Adsorption Kinetic Models: A Critical Review. Sep. Purif. Rev. 2021, 51, 281–299. [Google Scholar] [CrossRef]
  20. Mihara, Y.; Inoue, T.; Yokota, K. The Relation between Oxygen Uptake Rate and Biosorption of Activated Sludge against Chemical Substance. Yakugaku Zasshi 2005, 125, 225–229. [Google Scholar] [CrossRef]
  21. Saiah, F.B.D.; Su, B.-L.; Bettahar, N. Removal of Evans Blue by Using Nickel-Iron Layered Double Hydroxide (LDH) Nanoparticles: Effect of Hydrothermal Treatment Temperature on Textural Properties and Dye Adsorption. Macromol. Symp. 2008, 273, 125–134. [Google Scholar] [CrossRef]
  22. Zablocka-Godlewska, E.; Przystas, W.; Grabinska-Sota, E. Decolourization of Diazo Evans Blue by Two Strains of Pseudomonas fluorescens Isolated from Different Wastewater Treatment Plants. Water. Air. Soil Pollut. 2012, 223, 5259–5266. [Google Scholar] [CrossRef] [PubMed]
  23. Chandra, I.K.; Ju, Y.-H.; Ayucitra, A.; Ismadji, S. Evans Blue Removal from Wastewater by Rarasaponin-Bentonite. Int. J. Environ. Sci. Technol. 2013, 10, 359–370. [Google Scholar] [CrossRef]
  24. Halsey, G.D. The Role of Heterogeneity in Adsorption and Catalysis. Discuss. Faraday Soc. 1950, 8, 54–56. [Google Scholar] [CrossRef]
  25. Chandra, T.C.; Mirna, M.M.; Sudaryanto, Y.; Ismadji, S. Adsorption of Basic Dye onto Activated Carbon Prepared from Durian Shell: Studies of Adsorption Equilibrium and Kinetics. Chem. Eng. J. 2007, 127, 121–129. [Google Scholar] [CrossRef]
  26. Nuithitikul, K.; Srikhun, S.; Hirunpraditkoon, S. Kinetics and Equilibrium Adsorption of Basic Green 4 Dye on Activated Carbon Derived from Durian Peel: Effects of Pyrolysis and Post-Treatment Conditions. J. Taiwan Inst. Chem. Eng. 2010, 41, 591–598. [Google Scholar] [CrossRef]
  27. Gopalakrishnan, Y.; Al-Gheethi, A.; Abdul Malek, M.; Marisa Azlan, M.; Al-Sahari, M.; Radin Mohamed, R.M.S.; Alkhadher, S.; Noman, E. Removal of Basic Brown 16 from Aqueous Solution Using Durian Shell Adsorbent, Optimisation and Techno-Economic Analysis. Sustainability 2020, 12, 8928. [Google Scholar] [CrossRef]
  28. Sharmmah, D. Preparation, Characterization and Study of Equilibrium Adsorption of Activated Carbon Obtained Jute Sticks. In Abstracts of National Conference on Biological, Biochemical, Biomedical, Bioenergy, and Environmental Biotechnology; AIJR Books: Balrampur, India, 2021. [Google Scholar]
  29. Peláez-Cid, A.-A.; Herrera-González, A.-M.; Salazar-Villanueva, M.; Bautista-Hernández, A. Elimination of Textile Dyes Using Activated Carbons Prepared from Vegetable Residues and Their Characterization. J. Environ. Manag. 2016, 181, 269–278. [Google Scholar] [CrossRef] [PubMed]
  30. Belala, Z.; Jeguirim, M.; Belhachemi, M.; Addoun, F.; Trouvé, G. Biosorption of Copper from Aqueous Solutions by Date Stones and Palm-Trees Waste. Environ. Chem. Lett. 2011, 9, 65–69. [Google Scholar] [CrossRef]
  31. Jung, K.-W.; Choi, B.H.; Hwang, M.-J.; Jeong, T.-U.; Ahn, K.-H. Fabrication of Granular Activated Carbons Derived from Spent Coffee Grounds by Entrapment in Calcium Alginate Beads for Adsorption of Acid Orange 7 and Methylene Blue. Bioresour. Technol. 2016, 219, 185–195. [Google Scholar] [CrossRef]
  32. Hameed, B.H.; El-Khaiary, M.I. Sorption Kinetics and Isotherm Studies of a Cationic Dye Using Agricultural Waste: Broad Bean Peels. J. Hazard. Mater. 2008, 154, 639–648. [Google Scholar] [CrossRef]
  33. Langmuir, I. The Constitution and Fundamental Properties of Solids and Liquids. Part I. Solids. J. Am. Chem. Soc. 1916, 38, 2221–2295. [Google Scholar] [CrossRef]
  34. Weber, T.W.; Chakravorti, R.K. Pore and Solid Diffusion Models for Fixed-bed Adsorbers. AIChE J. 1974, 20, 228–238. [Google Scholar] [CrossRef]
  35. Freundlich, H. Over the Adsorption in Solution. Z. Phys. Chem. 1906, 57, 385–470. [Google Scholar]
  36. Sivarajasekar, N.; Baskar, R. Adsorption of Basic Red 9 onto Activated Carbon Derived from Immature Cotton Seeds: Isotherm Studies and Error Analysis. Desalination Water Treat. 2014, 52, 7743–7765. [Google Scholar] [CrossRef]
  37. Jovanović, D.S. Physical Adsorption of Gases—I: Isotherms for Monolayer and Multilayer Adsorption. Kolloid Z. Amp Z. Polym. 1969, 235, 1203–1213. [Google Scholar] [CrossRef]
  38. Redlich, O.; Peterson, D.L. A Useful Adsorption Isotherm. J. Phys. Chem. 1959, 63, 1024. [Google Scholar] [CrossRef]
  39. Ayawei, N.; Ebelegi, A.N.; Wankasi, D. Modelling and Interpretation of Adsorption Isotherms. J. Chem. 2017, 2017, e3039817. [Google Scholar] [CrossRef]
  40. Wong, Y.C.; Szeto, Y.S.; Cheung, A.; Mckay, G. Adsorption of Acid Dyes on Chitosan-Equilibrium Isotherm Analyses. Process Biochem. 2004, 39, 695–704. [Google Scholar] [CrossRef]
  41. Toth, J. State Equations of the Solid-Gas Interface Layers. Acta Chim. Acad. Sci. Hung. 1971, 69, 311–328. [Google Scholar]
  42. Podder, M.S.; Majumder, C.B. Investigation on Elimination of As(III) and As(V) from Wastewater Using Bacterial Biofilm Supported on Sawdust/MnFe2O4 Composite. Water Conserv. Sci. Eng. 2016, 1, 21–48. [Google Scholar] [CrossRef]
  43. Do, D. Adsorption Analysis: Equilibria and Kinetics; Imperial College Press: London, UK, 1998; Volume 2. [Google Scholar]
  44. Fritz, W.; Schluender, E.-U. Simultaneous Adsorption Equilibria of Organic Solutes in Dilute Aqueous Solutions on Activated Carbon. Chem. Eng. Sci. 1974, 29, 1279–1282. [Google Scholar] [CrossRef]
  45. Vieth, W.R.; Sladek, K.J. A Model for Diffusion in a Glassy Polymer. J. Colloid Sci. 1965, 20, 1014–1033. [Google Scholar] [CrossRef]
  46. Saadi, Z.; Saadi, R.; Fazaeli, R. Fixed-Bed Adsorption Dynamics of Pb(II) Adsorption from Aqueous Solution Using Nanostructured γ-Alumina. J. Nanostruct. Chem. 2013, 3, 48. [Google Scholar] [CrossRef]
  47. Pérez-Marín, A.B.; Zapata, V.M.; Ortuño, J.F.; Aguilar, M.; Sáez, J.; Lloréns, M. Removal of Cadmium from Aqueous Solutions by Adsorption onto Orange Waste. J. Hazard. Mater. 2007, 139, 122–131. [Google Scholar] [CrossRef]
  48. Khan, A.R.; Ataullah, R.; Al-Haddad, A. Equilibrium Adsorption Studies of Some Aromatic Pollutants from Dilute Aqueous Solutions on Activated Carbon at Different Temperatures. J. Colloid Interface Sci. 1997, 194, 154–165. [Google Scholar] [CrossRef]
  49. Lima, E.C.; Hosseini-Bandegharaei, A.; Moreno-Piraján, J.C.; Anastopoulos, I. A Critical Review of the Estimation of the Thermodynamic Parameters on Adsorption Equilibria. Wrong Use of Equilibrium Constant in the Van’t Hoof Equation for Calculation of Thermodynamic Parameters of Adsorption. J. Mol. Liq. 2019, 273, 425–434. [Google Scholar] [CrossRef]
  50. Zhou, X.; Zhou, X. The Unit Problem in the Thermodynamic Calculation of Adsorption Using the Langmuir Equation. Chem. Eng. Commun. 2014, 201, 1459–1467. [Google Scholar] [CrossRef]
  51. Tran, H.N.; You, S.-J.; Chao, H.-P. Thermodynamic Parameters of Cadmium Adsorption onto Orange Peel Calculated from Various Methods: A Comparison Study. J. Environ. Chem. Eng. 2016, 4, 2671–2682. [Google Scholar] [CrossRef]
  52. Saha, P.; Chowdhury, S. Insight Into Adsorption Thermodynamics. Thermodynamics 2011, 16, 349–364. [Google Scholar] [CrossRef]
  53. Ashjaran, A.; Yazdanshenas, M.; Rashidi, A.; Khajavi, R.; Rezaee, A. Biosorption Thermodynamic and Kinetic of Direct Dye from Aqueous Solutions on Bacterial Cellulose. Afr. J. Microbiol. Res. 2012, 6, 1270–1278. [Google Scholar] [CrossRef]
  54. Sadaf, S.; Bhatti, H.N.; Ali, S.; Rehman, K. Removal of Indosol Turquoise FBL Dye from Aqueous Solution by Bagasse, a Low Cost Agricultural Waste: Batch and Column Study. Desalination Water Treat. 2014, 52, 184–198. [Google Scholar] [CrossRef]
  55. Rashidi, H.; Nik Sulaiman, N.M.; Hashim, N.; Hassan, C.; Davazdah Emami, S. Simulated Textile (Batik) Wastewater Pre-Treatment through Application of a Baffle Separation Tank. Desalination Water Treat. 2015, 57, 151–160. [Google Scholar] [CrossRef]
  56. Karaman, C.; Karaman, O.; Show, P.-L.; Karimi-Maleh, H.; Zare, N. Congo Red Dye Removal from Aqueous Environment by Cationic Surfactant Modified-Biomass Derived Carbon: Equilibrium, Kinetic, and Thermodynamic Modeling, and Forecasting via Artificial Neural Network Approach. Chemosphere 2022, 290, 133346. [Google Scholar] [CrossRef]
  57. Noli, F.; Kapashi, E.; Pashalidis, I.; Margellou, A.; Karfaridis, D. The Effect of Chemical and Thermal Modifications on the Biosorption of Uranium in Aqueous Solutions Using Winery Wastes. J. Mol. Liq. 2022, 351, 118665. [Google Scholar] [CrossRef]
  58. Mallakpour, S.; Tabesh, F. Green and Plant-Based Adsorbent from Tragacanth Gum and Carboxyl-Functionalized Carbon Nanotube Hydrogel Bionanocomposite for the Super Removal of Methylene Blue Dye. Int. J. Biol. Macromol. 2021, 166, 722–729. [Google Scholar] [CrossRef]
  59. Narayanasamy, S.; Sundaram, V.; Sundaram, T.; Vo, D.-V.N. Biosorptive Ascendency of Plant Based Biosorbents in Removing Hexavalent Chromium from Aqueous Solutions—Insights into Isotherm and Kinetic Studies. Environ. Res. 2022, 210, 112902. [Google Scholar] [CrossRef]
  60. Lima, E.C.; Gomes, A.A.; Tran, H.N. Comparison of the Nonlinear and Linear Forms of the van’t Hoff Equation for Calculation of Adsorption Thermodynamic Parameters (∆S° and ∆H°). J. Mol. Liq. 2020, 311, 113315. [Google Scholar] [CrossRef]
  61. Kefif, F.; Ezziane, K.; Bahmani, A.; Bettahar, N.; Mayouf, S. Evans Blue Dye Removal from Contaminated Water on Calcined and Uncalcined CuAlCO3 Layered Double Hydroxide Materials Prepared by Coprecipitation. Bull. Mater. Sci. 2019, 42, 14. [Google Scholar] [CrossRef]
Figure 1. Raw (A) and KOH-treated (B) banana peel.
Processes 11 01611 g001
Figure 2. EDX spectrum before (a) and after (b) EB adsorption.
Processes 11 01611 g002
Figure 3. Comparison of FTIR spectrum of the banana peel before and after treatment for EB dye with concentration of 25 and 100 mg/L.
Processes 11 01611 g003
Figure 4. The plot of ΔpH against the initial pH of banana peel adsorbent surface in determining the point of zero charge of the adsorbent. Error bars represent mean ± standard error (n = 3).
Processes 11 01611 g004
Figure 5. Effect of EB dye concentration (a), pH (b), temperature (c), adsorbent dosage (d), incubation time, (e) and agitation speed (f) on the biosorption of EB dye on banana peel biosorbent. Error bars represent mean ± standard error (n = 3).
Processes 11 01611 g005aProcesses 11 01611 g005b
Figure 6. Kinetics of 200 mg/L EB dye adsorption on banana peel (0.25 g) pH 4.0, 100 rpm, as modeled using the pseudo–first-order (A), pseudo-second-order (B), and Elovich (C) models.
Processes 11 01611 g006aProcesses 11 01611 g006b
Figure 7. Experimental data versus calculated data (red line) on pseudo-second-order kinetic analysis of EB dye adsorption study.
Processes 11 01611 g007
Figure 8. The summary plot of experimental data and all the selected isotherms models fitted for the EB dye adsorption onto the banana peel biosorbent.
Processes 11 01611 g008
Figure 9. Langmuir equilibrium adsorption isotherms at various temperatures for EB dyes by banana peel biosorbent.
Processes 11 01611 g009
Figure 10. Langmuir equilibrium adsorption isotherms at various temperatures for EB dyes by banana peel biosorbent.
Processes 11 01611 g010
Table 1. Isotherm models utilized in this study.
ModelFormula
1.
 
Henry’s law q e = H C e
2.
 
Langmuir isotherm q e = q m L b L C e 1 + b L C e
3.
 
Freundlich isotherm q e = K F C e 1 n F
4.
 
Jovanovic isotherm q e = K s q m S C e 1 n S 1 + K s C e 1 n S
5.
 
Redlich–Peterson isotherms q e = K R P C e 1 + α R P C e β R P
6.
 
Toth isotherm q e = q m T C e ( K T + C e n T ) n T
7.
 
Khan isotherm q e = q m K b K C e ( 1 + b K C e ) a K
8.
 
Vieth–Sladek isotherm q e = q m V S b V S C e ( 1 + b V S C e ) n V S
9.
 
Sips q e = K s q m S C e 1 n S 1 + K s C e 1 n S
10.
 
Fritz–Schluender–III isotherm q e = q m F S K F S C e 1 + q m F S C e n F S
Table 2. SEM–EDX of elements content in banana peel.
Before Adsorption
SpectrumCOSFeTotal (%)
Spectrum 154.7645.110.13 100.00
Spectrum 254.6645.100.130.11100.00
Spectrum 354.7945.21 100.00
After Adsorption
SpectrumCOSFeTotal (%)
Spectrum 156.6442.620.55 100.00
Spectrum 255.6943.930.280.10100.00
Spectrum 355.2944.290.42 100.00
Table 3. The kinetic parameters of adsorption EB dye (200 mg/L) onto banana peel adsorbent (0.5 g).
Model 95% Confidence Interval
Pseudo–1st-order
qe (mg/g)33.69631.606 to 35.786
k value0.1530.101 to 0.204
Pseudo–2nd-order
qe (mg/g)36.71135.564 to 37.858
k value0.0060.005 to 0.008
Elovich
a (mg g min−1)118.824−16.385 to 254.032
b (g mg−1)0.220.177 to 0.262
Table 4. Error function analysis of the adsorption of EB dye (200 mg/L) onto banana peel adsorbent (0.5 g).
ModelRMSEadR2AICcBICHQCAFBF
Pseudo-1st-order2.1600.95926.4015.9914.751.0551.003
Pseudo-2nd-order0.8500.9939.61−0.80−2.041.0211.001
Elovich1.1900.98715.685.274.031.0301.001
Table 5. Error functions analysis of 10 selected isotherm models of adsorption study.
ModelpSSEMSERMSER2adR2AICcBICHQCBFAF
Henry1219.59336.606.050.870.84533.1233.1226.070.711.50
Langmuir214.57212.911.710.990.98423.1323.139.021.041.10
Freundlich245.14529.033.000.960.94731.0531.0516.941.131.20
Jovano29.769231.951.400.990.98920.3320.336.231.021.09
Red-Pet25.992121.201.091.000.99416.9116.912.800.951.07
Sips311.98163.001.730.990.98337.7637.769.600.971.09
Toth37.82731.961.400.990.98934.7834.786.620.941.08
Khan36.583161.651.281.000.99133.5733.575.411.001.09
Vieth-S36.580841.651.281.000.99133.5733.575.411.001.09
Fritz-336.393071.601.261.000.99133.3733.375.200.961.08
Table 6. The top-ten isotherm best models which exhibited adequate fitting.
ModelParameterUnitValue95% CI
Redlich–PetersonKRPL mg−11.99930.6760 to 3.3226
βRP 0.0001−0.0005 to 0.0007
αRPL g−10.73730.5348 to 0.9399
JovanovicqmJmg g−141.74335.525 to 47.960
KJ0.0230.015 to 0.031
Langmuir isothermqmLmg g−158.50642.587 to 74.426
bLL mg−10.0180.008 to 0.029
Freundlich isotherm #KF(mg g−1·L mg−1)1/n2.6080.340 to 4.876
nF(L mg−1)1.7041.110 to 2.298
qmF *mg g−140.48
Henry’s lawHL mg−10.4250.313 to 0.537
Fritz–Schluender–III isothermqmSFmg g−10.0002−0.001 to 0.0014
KFSL m g−13880.7−19,078.8 to 26,840.4
nFS 1.860.63199 to 3.08
SipsqmSmg g−149.6326.447 to 72.813
KS0.013−0.005 to 0.031
nS0.8360.398 to 1.273
Khan isothermqmKmg g−18022.1Too large &
bK0.0001−0.018 to 0.018
aK78.5−12,432.5 to 12,589.5
Toth isothermqmTmg g−139.39930.397 to 48.401
KT0.00001−0.00012 to 0.00014
nT2.912−0.772 to 6.595
Note: * Isotherm with ln term should not be plotted using data that starts from the origin (0,0). # Estimation of maximum adsorption capacity (mg g−1) based on Halsey [24]. & 95% confidence intervals denoted by “too large” indicated the values obtained are not accurate.
Table 7. Adsorption of selected dyes, including EB using agricultural wastes.
BiosorbentDyesAdsorption CapacityRegressionBest
Isotherm
Best
Kinetic
Thermodynamic ParametersRef.
Shell waste from Theobroma grandiflorumEvans blue37.5 mg g−1 SipsAvrami [17]
Aqai stalkEvans blue46.6 mg g−1 SipsAvrami [10]
Modified Durian shellMethylene blue 410.85 mg/gNonlinearLangmuirPseudo-2ndΔH°: −1.865 (kJ/mol)
ΔS°: 5.683
(J/molK)
ΔG°: (kJ/mol)
303 K: −0.319
313 K: −0.096
323 K: −0.024
R2: 0.99
Exothermic
[16]
49.05 mg/gNonlinearLangmuirPseudo-1st[25]
Basic green 4250 mg/gNonlinearPseudo-2nd[26]
Basic brown 1677.6%[27]
Durian seedMethyl red92.52%
372.46 mg/g
LinearFreundlichPseudo-2ndΔH°: 3.83 (kJ/mol)
ΔS°: 22.84
(J/molK)
ΔG°: (kJ/mol)
303 K: 13.74
318 K: 14.34
333 K: 14.72
Endothermic
[12]
Remazol brilliant blue reactive95.17%
357.14 mg/g
LinearFreundlichPseudo-2ndΔH°: 11.98 (kJ/mol)
ΔS°: 17.16
(J/molK)
ΔG°: (kJ/mol)
303 K: 13.08
318 K: 14.16
333 K: 14.16
Endothermic
[12]
Durian shellBasic brown77.6%[27]
Jute stickMethylene blue142.87 mg/g Langmuir[28]
Prickly pear peelMethylene blue260 mg/gNonlinearFreundlich Pseudo-2ndΔH°: 9.66 (kJ/mol)
ΔS°: 82.64
(J/K)
ΔG°: (kJ/mol)
293 K: −33.96
303 K: −34.54
313 K: −35.62
R2: 0.993
Exothermic
[29]
Palm shell waste basedMethylene blue163.3 mg/g Langmuir
Freundlich
[30]
Spent coffee ground986.8 mg/g Sips [31]
Theobroma grandiflorum shellReactive red 192
Direct blue 53
64.1 mg/g
37.5 mg/g
NonlinearSipsAvrami[17]
Table 8. Thermodynamics parameters calculated from the nonlinear plot of van’t Hoff and the dimensionless Langmuir constant.
°CT(K)KLKCΔ (kJ/mol)95% C.I.Δ (kJ/mol)95% C.I.Δ
(kJ/(mol.K))
95% C.I.
25293.150.0251,215,024−34.71−34.72 to −34.70−23.37 48.15
30303.150.0241,153,014−35.05−34.72 to −34.70
35313.150.0211,026,570−35.31−35.84 to −34.78−22.94 to −17.7985.80 to 97.16
40323.150.020987,813−35.72−36.55 to −34.89
45333.150.018857,009−35.99−36.48 to −35.51
Disclaimer/Publisher’s Note: The statements, opinions and data contained in all publications are solely those of the individual author(s) and contributor(s) and not of MDPI and/or the editor(s). MDPI and/or the editor(s) disclaim responsibility for any injury to people or property resulting from any ideas, methods, instructions or products referred to in the content.

