1. Introduction
Based on national data on oil production and consumption in the BP World Energy Statistics Yearbook, the consumption of all energy fuels is increasing. Many fuels are growing faster than their recent historical average, especially gas. This highlights the importance of the rational development and effective use of energy. Petrochemical and chemical industries play a vital role in a country’s economic development and people’s daily lives. Given the significant energy use in chemical production, it is crucial to adopt energy-saving measures [
1] to reduce energy consumption and achieve desired energy-saving goals. Maximizing the use of renewable energy and improving energy efficiency are key strategies for achieving energy-saving goals.
In the process of system synthesis [
2], the objective of energy saving is to match cold and hot streams through heat transfer network synthesis, which involves maximizing heat recovery, minimizing cold and hot utility usage, and optimizing both capital and operational costs. To achieve this, the primary approach is thermodynamic analysis, which has emerged as the predominant method for heat transfer network synthesis.
Thermodynamic analysis primarily focuses on maximizing energy efficiency and achieving optimal economic performance by minimizing energy consumption. This involves identifying the most efficient ways to utilize energy resources while reducing waste and optimizing energy systems for maximum performance and efficiency.
In 1956, Rant [
3] introduced the concept of “exergy,” which unifies the quantity and quality of energy based on the first and second laws of thermodynamics. In the 1980s, Ahern [
4] and Kotas [
5] proposed the exergy method for analyzing energy degradation in systems. To address economic issues in actual production processes, Evans and Tribus integrated the exergy method with economics, leading to the concept of “eco-exergy.” This method provides a more comprehensive analysis of complex energy systems and is widely used in energy-related fields. In 2021, Atashafrooza [
6] analyzed the impacts of solid nanoparticles and magnetic force on the entropy generation rates in three-dimensional forced convection over an inclined step with the presence of Brownian movement. In 2023, Sajedi et al. [
7] studied in detail the effects of radiative parameters such as optical thickness and scattering albedo on the rate of entropy production. While the principle of minimum entropy production can be used to evaluate heat transfer performance, there is currently no principle available for evaluating the rate or efficiency of heat transfer.
The concept of “entransy” has been proposed as a new physical quantity to describe the total heat transfer ability of a system or object, as well as the irreversibility of heat transfer processes [
8]. This has led to the development of a new analysis tool for heat transfer processes, which has been applied to various fields, including chemical processes and heat exchangers. In 2011, entransy transfer efficiency was defined by Hu and Guo [
9] to analyze heat transfer in heat exchangers. Wu [
10] and colleagues analyzed the entransy transfer efficiency of three simple chemical processes in 2013 and determined the process with the largest entransy transfer efficiency. In 2017, Xia [
11] and colleagues proposed a method to determine the energy target of a heat transfer network based on entransy, which showed that the maximum heat transfer efficiency can indicate the most reasonable utilization of heat in a heat transfer network.
2. Effective Energy Analysis Method in Heat Transfer Network
Heat transfer network synthesis follows some rules to match cold and hot fluids, takes maximum heat recovery as the goal by determining the optimal heat transfer network structure of the whole system, and reduces the amount of public works and operating costs as to reduce the energy consumption [
12] of chemical process production plants. The synthesis of heat transfer networks has been studied by a large number of experts and scholars. Thermodynamic analysis is based on the first law of thermodynamics and the second law of thermodynamics and is used to achieve the effective use of energy to achieve the highest energy efficiency or maximum economic benefits.
2.1. Pinch Analysis Method
Based on the idea of exergy analysis, the pinch analysis method studies the loss of energy in heat transfer networks, aiming at maximum energy recovery so that the amount of public works used for heating and cooling is the smallest [
13,
14], achieving the purpose of reducing energy consumption and saving cost. As a result, the utility quantity used for heating and cooling is minimized, and the purposes of reducing energy consumption and saving cost are achieved.
The pinch analysis was proposed by Linnhoff and Hindmarsh in 1983 [
15]. The key to pinch analysis is to determine the position of pinch. It can be seen from the temperature enthalpy diagram that the whole heat transfer network is divided into two independent parts at the pinch point and below the pinch point, which should follow three basic principles: the position of the pinch point cannot pass through the heat flux; only the heat load value of the cold utility is the pinch point. According to the determined energy target, the maximum heat recovery heat transfer network is obtained by matching the cold and hot fluids. Considering the relationship between operation cost, investment cost, heat exchanger area, and pinch position, the designed heat transfer network is relaxed to determine the optimal heat transfer network structure. Therefore, the general steps of heat transfer network synthesis using pinch analysis are as follows:
- (1)
Obtain temperature, flow rate, and heat capacity data through a complete process and establish mass and heat balance equations;
- (2)
Establish mass and heat balance equations according to the system and extract fluids data;
- (3)
Select a ΔTmin, to determine the energy target and pinch temperature by means of a combination curve method (enthalpy diagram) or a problem table method;
- (4)
Draw out the grid diagram, start from the clip point to match the top of the clip point and the bottom of the clip point, follow the basic criteria and matching criteria of the clip point, and obtain the maximum heat recovery network that meets the energy target;
- (5)
Process change analysis, taking into account the operating conditions of the device to achieve the goal of reducing energy or to establish an optimal heat transfer network;
- (6)
Differentiate between the new and previous targets resulting from the zonalization of the device;
- (7)
Analyze the energy requirements of the network by combining energy with cogeneration systems (CHP), heat pumps, refrigeration systems, etc., to meet heating, cooling, and electricity needs;
- (8)
Network relaxation from maximum energy recovery or minimum energy demand (MER) design.
The pinch analysis method has the characteristics that the design result is close to the actual situation, the process is simple and easy to understand, the drawing of the combination curve can directly reflect the amount of public works, and the designer can flexibly make the design scheme for the bottleneck position. Energy utilization and recovery are analyzed in the process industry system, especially in the energy-saving transformation of the existing process.
2.2. Entropy Analysis
The entropy analysis method is based on the second law of thermodynamics to study the ideal work of hot current to cold current T
0 ambient temperature. By calculating the entropy change, the ideal work, and the loss work of each fluids in the system, the second law efficiency of thermodynamics is determined to evaluate the energy utilization of the heat transfer network [
16].
Suppose there are
Nh hot and
Nc cold streams in the heat transfer network; from the starting temperature
Tin to the end temperature
Tout, the entropy of the cold and hot fluids changes [
17] as follows:
Cp (heat capacity) = m (mass flow rate) × cp (constant pressure specific heat).
The ideal work of fluids is:
The ΔH is enthalpy change and the T0 is ambient temperature.
The second law efficiency of heat transfer network is as follows:
Take ΔTmin = 10−20 K, select different heat transfer temperature differences, repeat the above steps, obtain the entropy efficiency under different temperature differences from formula (5), evaluate the change of the entropy efficiency with the heat transfer temperature difference in the heat transfer network, and determine the maximum heat recovery network.
The entropy analysis method can make up for the deficiency that the energy balance method cannot solve the irreversible effective energy loss, and it can determine the maximum loss work of the system to further formulate the measures to improve the energy utilization ratio. However, entropy itself is not a kind of actual energy; it cannot calculate the loss of energy clearly, and it is easy for an “entropy paradox“ [
18] to appear. At the same time, it cannot obtain the effective energy of discharging system fluids. As a result, the entropy analysis of irreversible effective energy loss is not comprehensive [
19].
2.3. Exergy Method
The exergy method combines the first law of thermodynamics with the second law of thermodynamics; thus, an efficient use of heat T0 in a system at ambient temperature is studied.
By calculating the heat supply of hot fluids, the heat gain of cold fluids, and the loss of process, the efficiency of heat transfer network is further calculated to evaluate the energy utilization, and the high energy consumption equipment in the system is found to help put forward the energy-saving scheme [
20].
There are
Nh hot and
Nc cold streams in the fake heat transfer network; from the inlet temperature
Tin to the outlet temperature
Tout, the heat of the cold and hot fluids in the whole system is [
21]:
Exergy loss in the heat transfer network represents the irreversibility of the process.
For the accurate solution of the exergy loss in the heat transfer process, the equilibrium combination curve of cold and hot current and cold and hot utility is made. The exergy loss in the heat transfer process is as follows [
22]:
Therefore, the efficiency of the whole heat transfer network can be obtained according to the exact exergy loss obtained.
TH = f(Q), TC= f(Q).
To determine the weakness of energy use in the process, the loss rate of exergy should be calculated.
The usual process is as follows: take Δ
Tmin = 10−20K [
23], select different heat transfer temperature differences, repeat the above steps, obtain the efficiency of heat transfer under different temperature differences from Formula (10), evaluate the change of heat transfer efficiency with heat transfer temperature differences in the heat transfer network, and determine the maximum heat recovery network. However, this method cannot obtain the optimal heat transfer network through matching between fluids.
2.4. Entransy Analysis
Entransy is a new and accurate method for the energy-saving optimization of the heat transfer process. Its calculation formula is as follows:
Suppose there are
Nh hot and
Nc cold streams in the heat transfer network, and the entransy of cold and hot streams in the system is:
CP (heat capacity) = m (mass flow rate) × cp(constant pressure specific heat)
The entransy dissipation in the whole heat transfer process is:
The efficiency of entransy transfer is:
A method for determining the energy target of entransy includes the following steps [
24]:
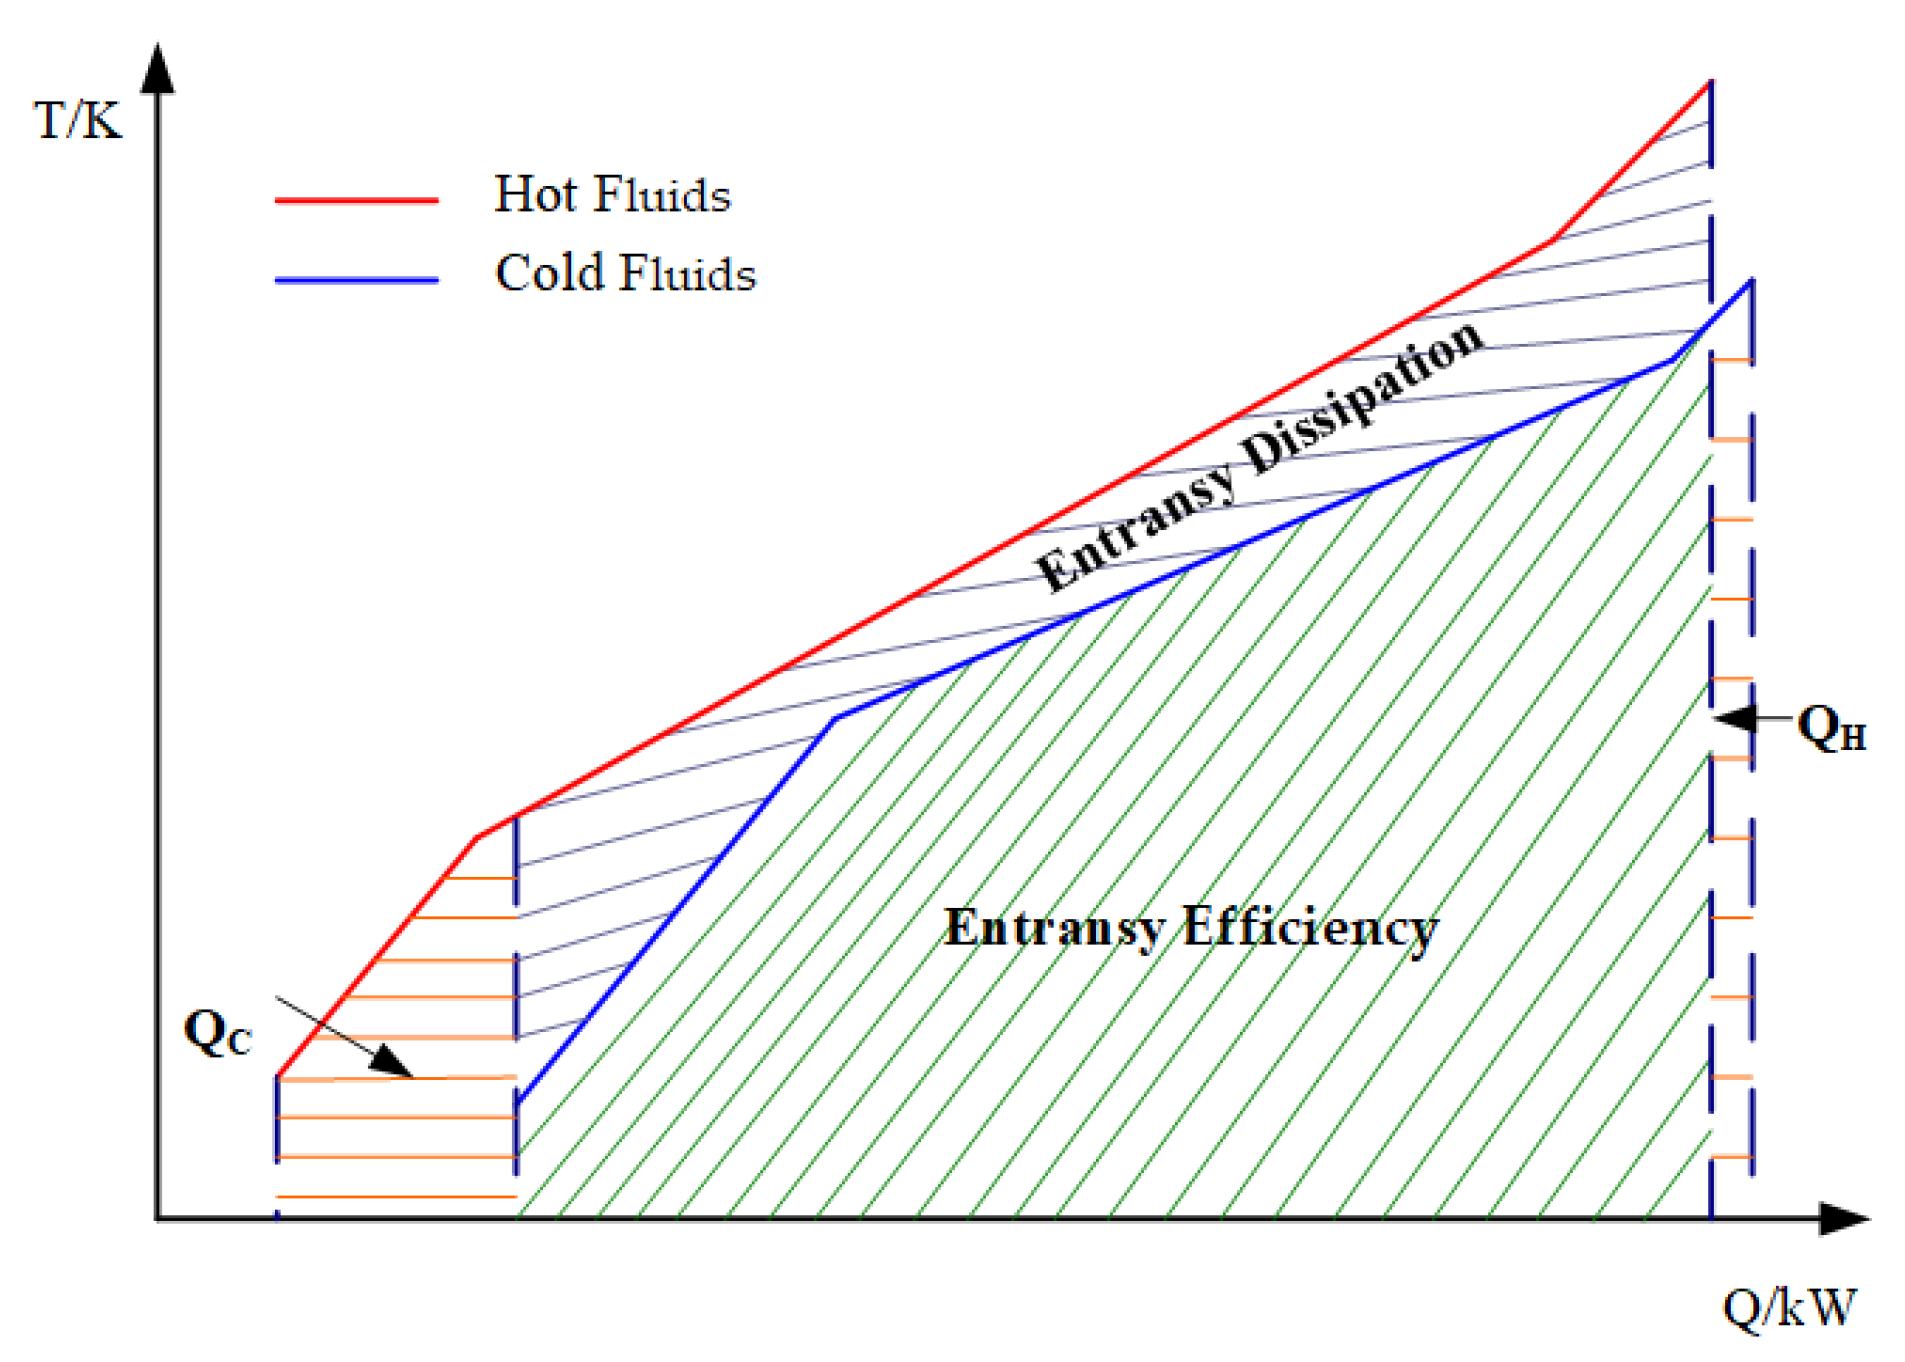
- (1)
Draw the combination curve of cold and heat balance by extracting fluids, as shown in
Figure 1.
- (2)
Calculate the entransy and the entransy transfer efficiency of the system.
- (3)
Determine the energy target of the heat transfer network based on entransy.
Figure 1.
Balance combination curve.
Figure 1.
Balance combination curve.
Under different heat transfer temperature differences, the entransy point is found by translating the combined curve of heat and cold. Taking the entransy product point as the center, it is divided into two parts, and the heat transfer network matching of each part is drawn, respectively. Finally, the heat transfer network is integrated into the optimal heat transfer network to achieve the highest entransy transfer efficiency and the optimal entransy quantity.
3. Analysis of Epichlorohydrin Device Based on Entransy Analysis
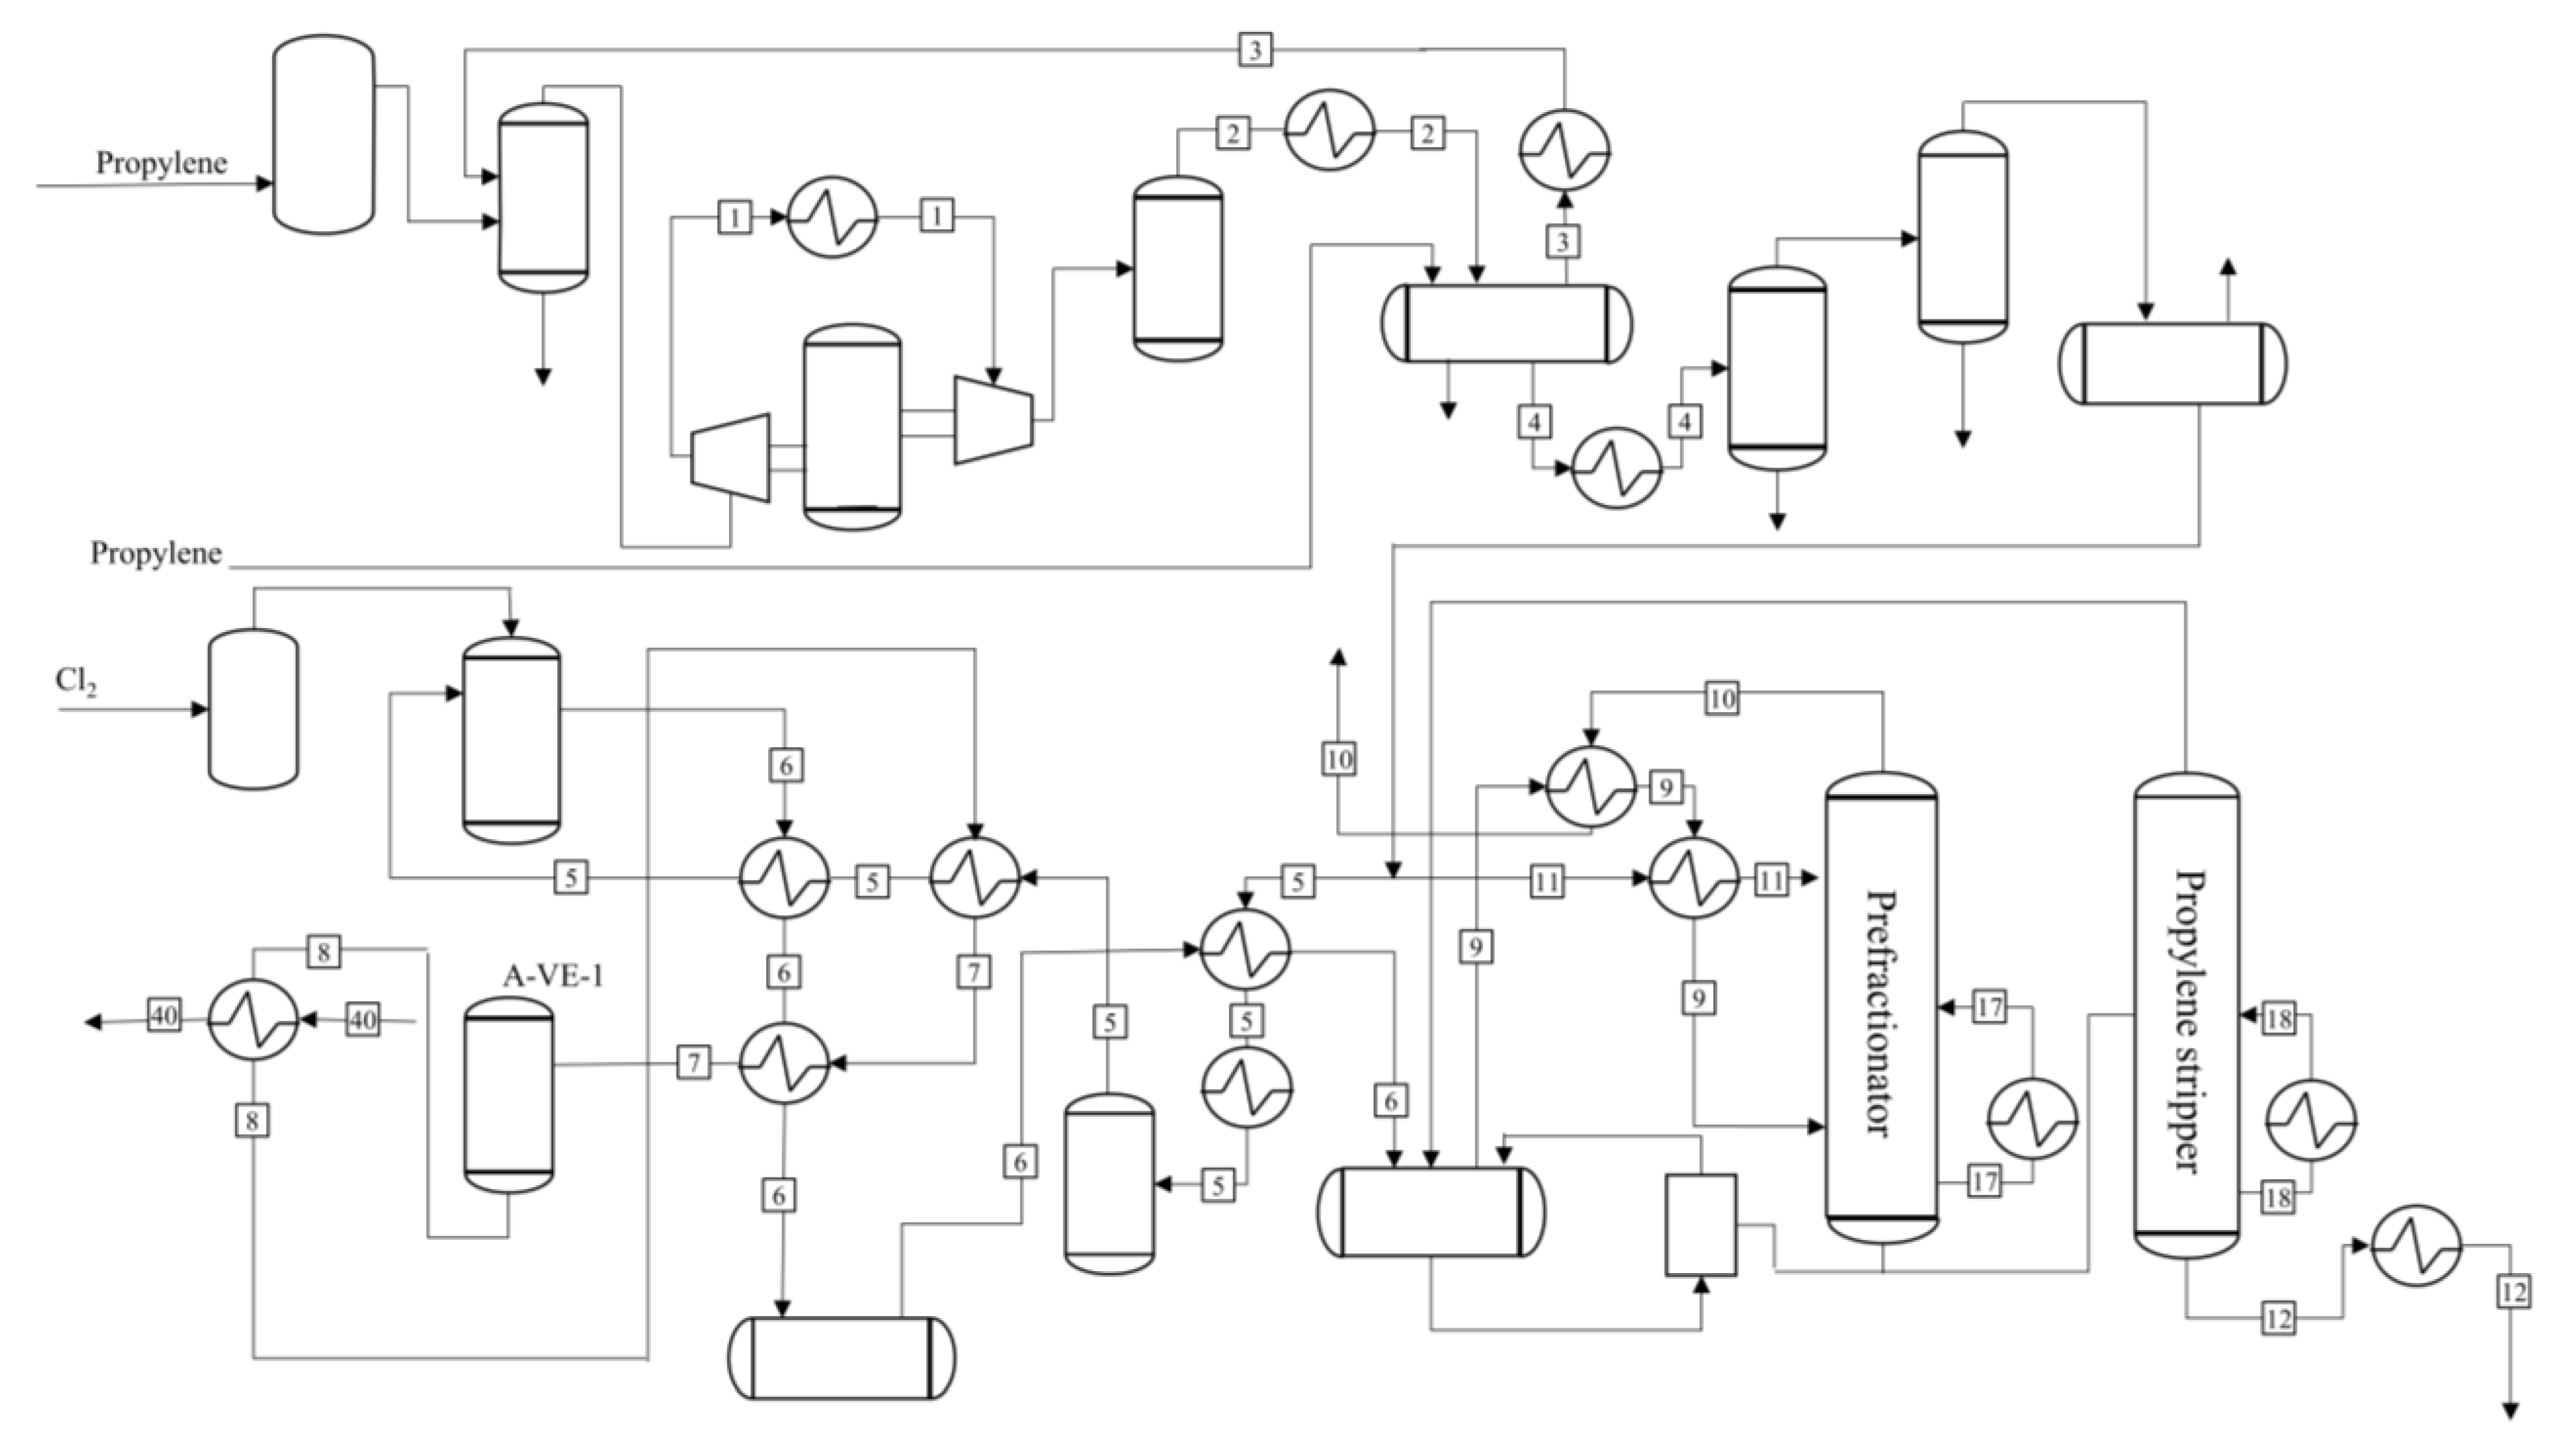
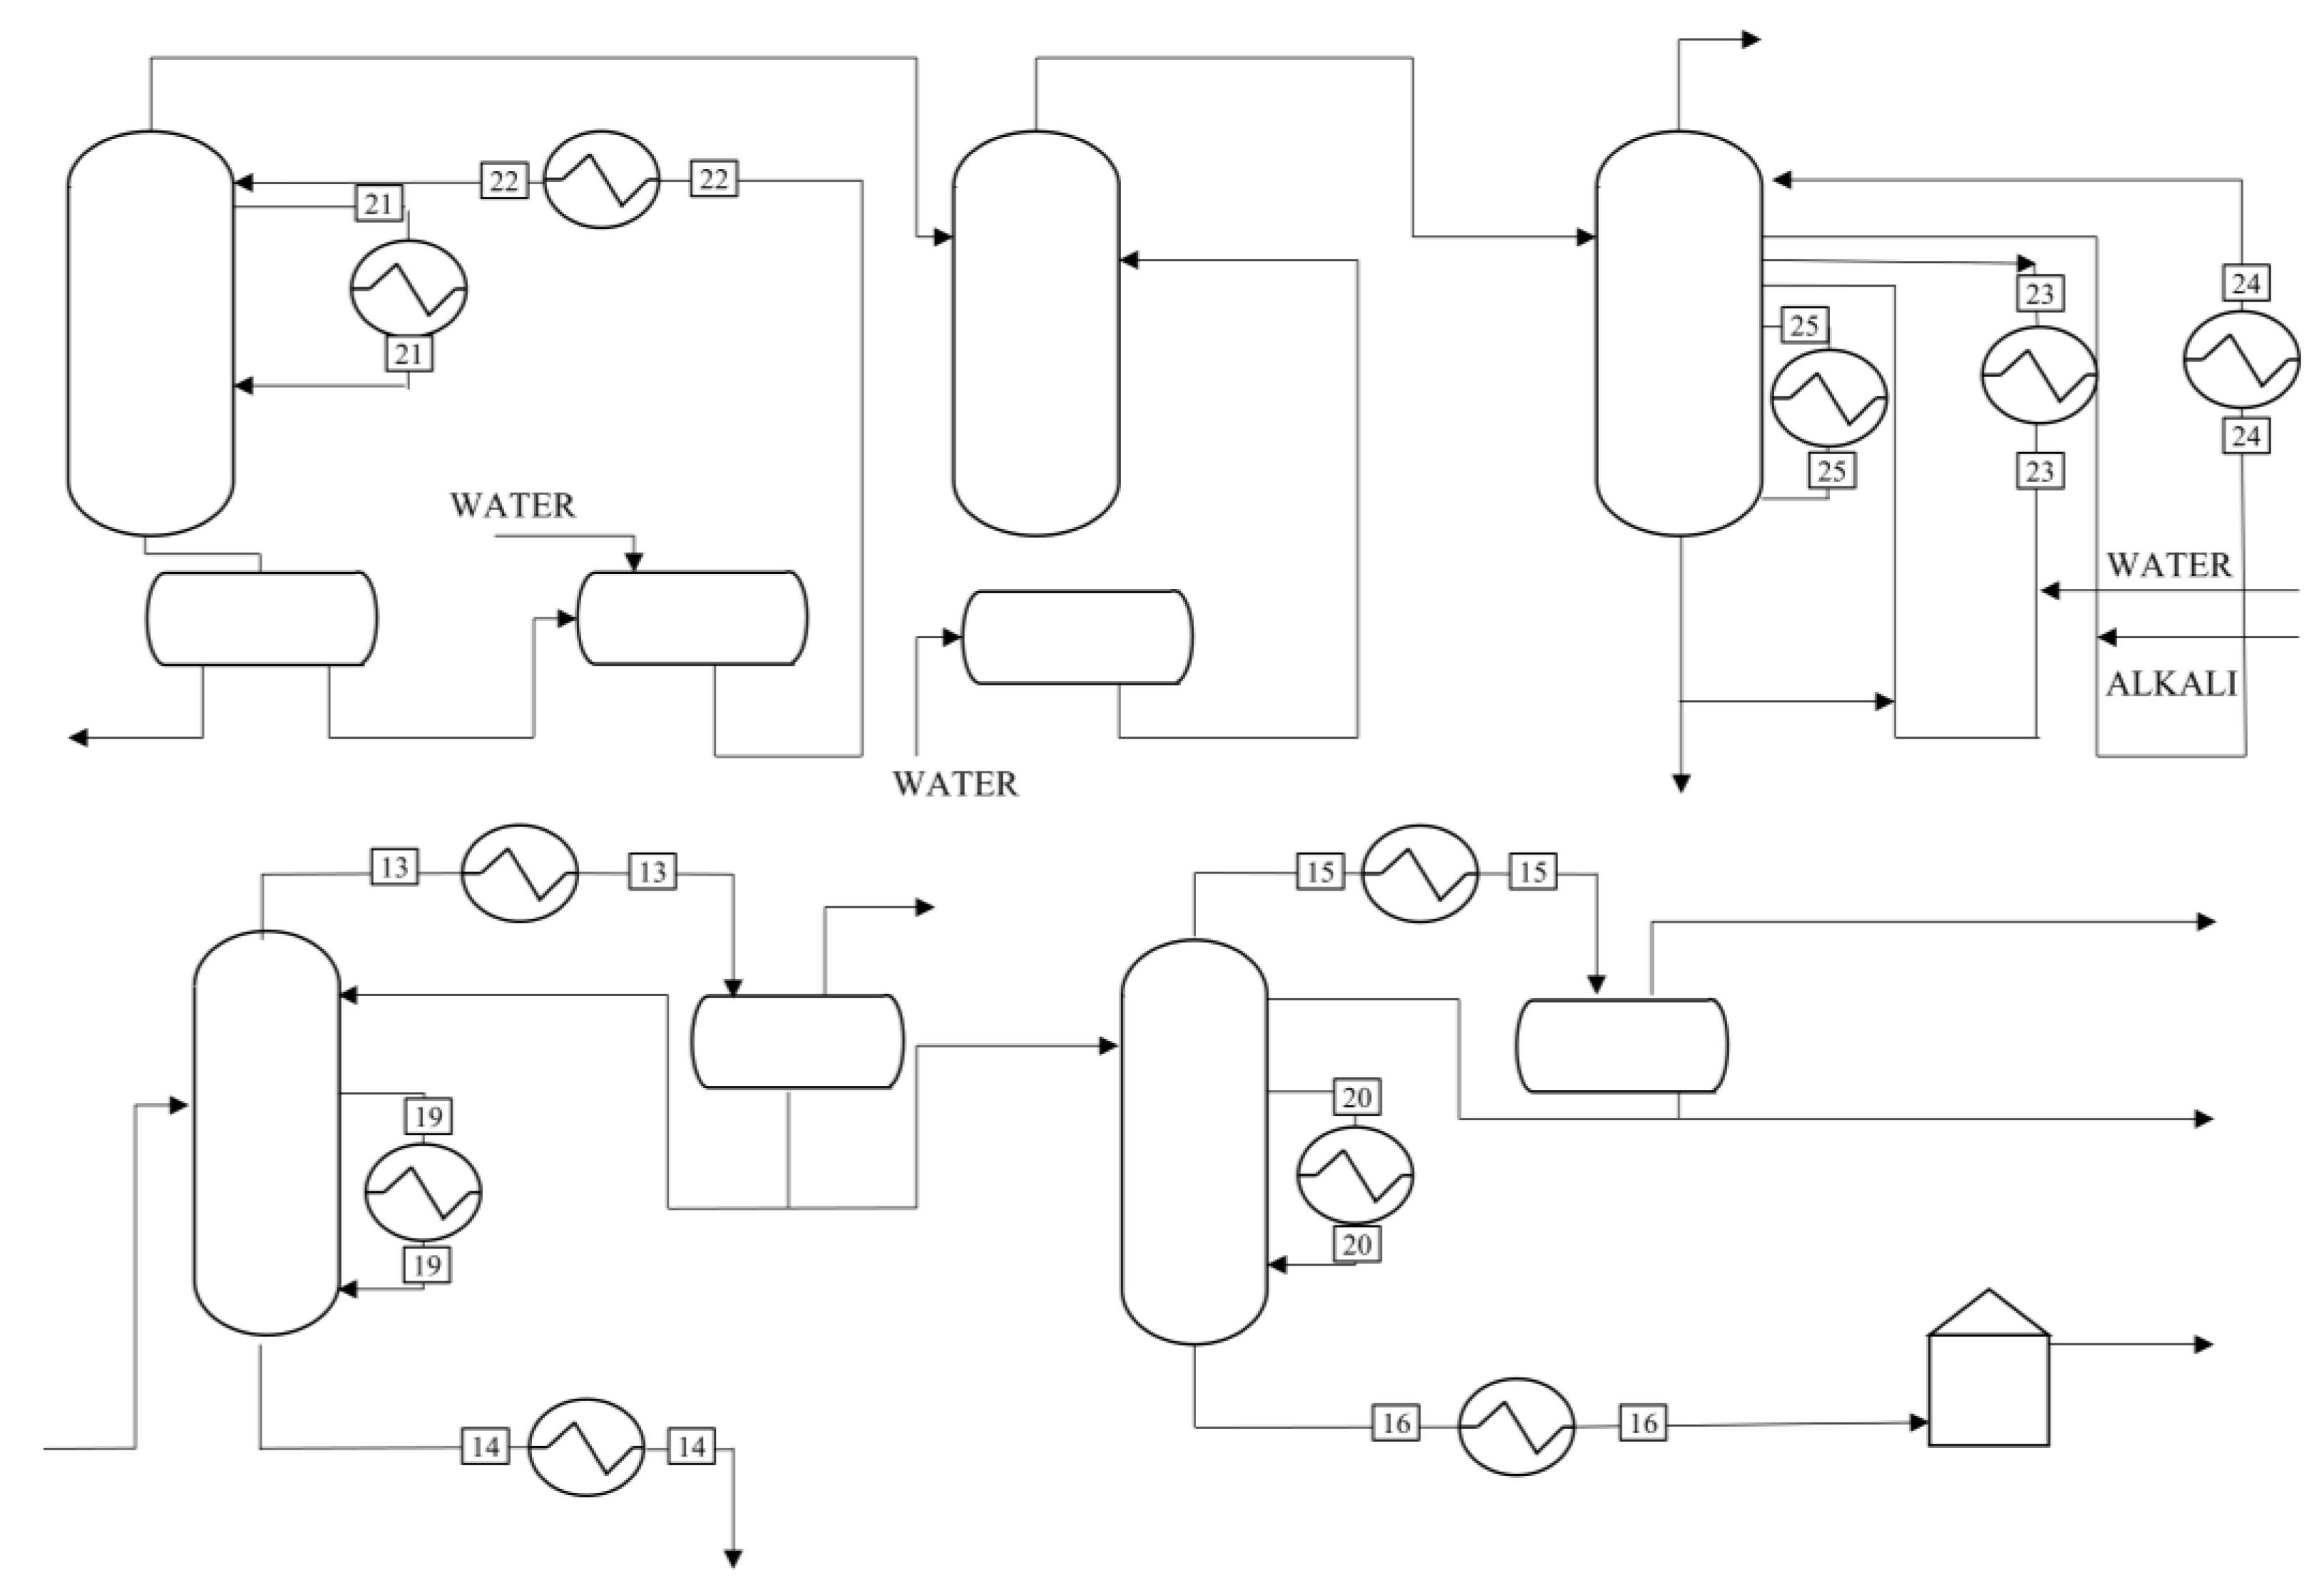
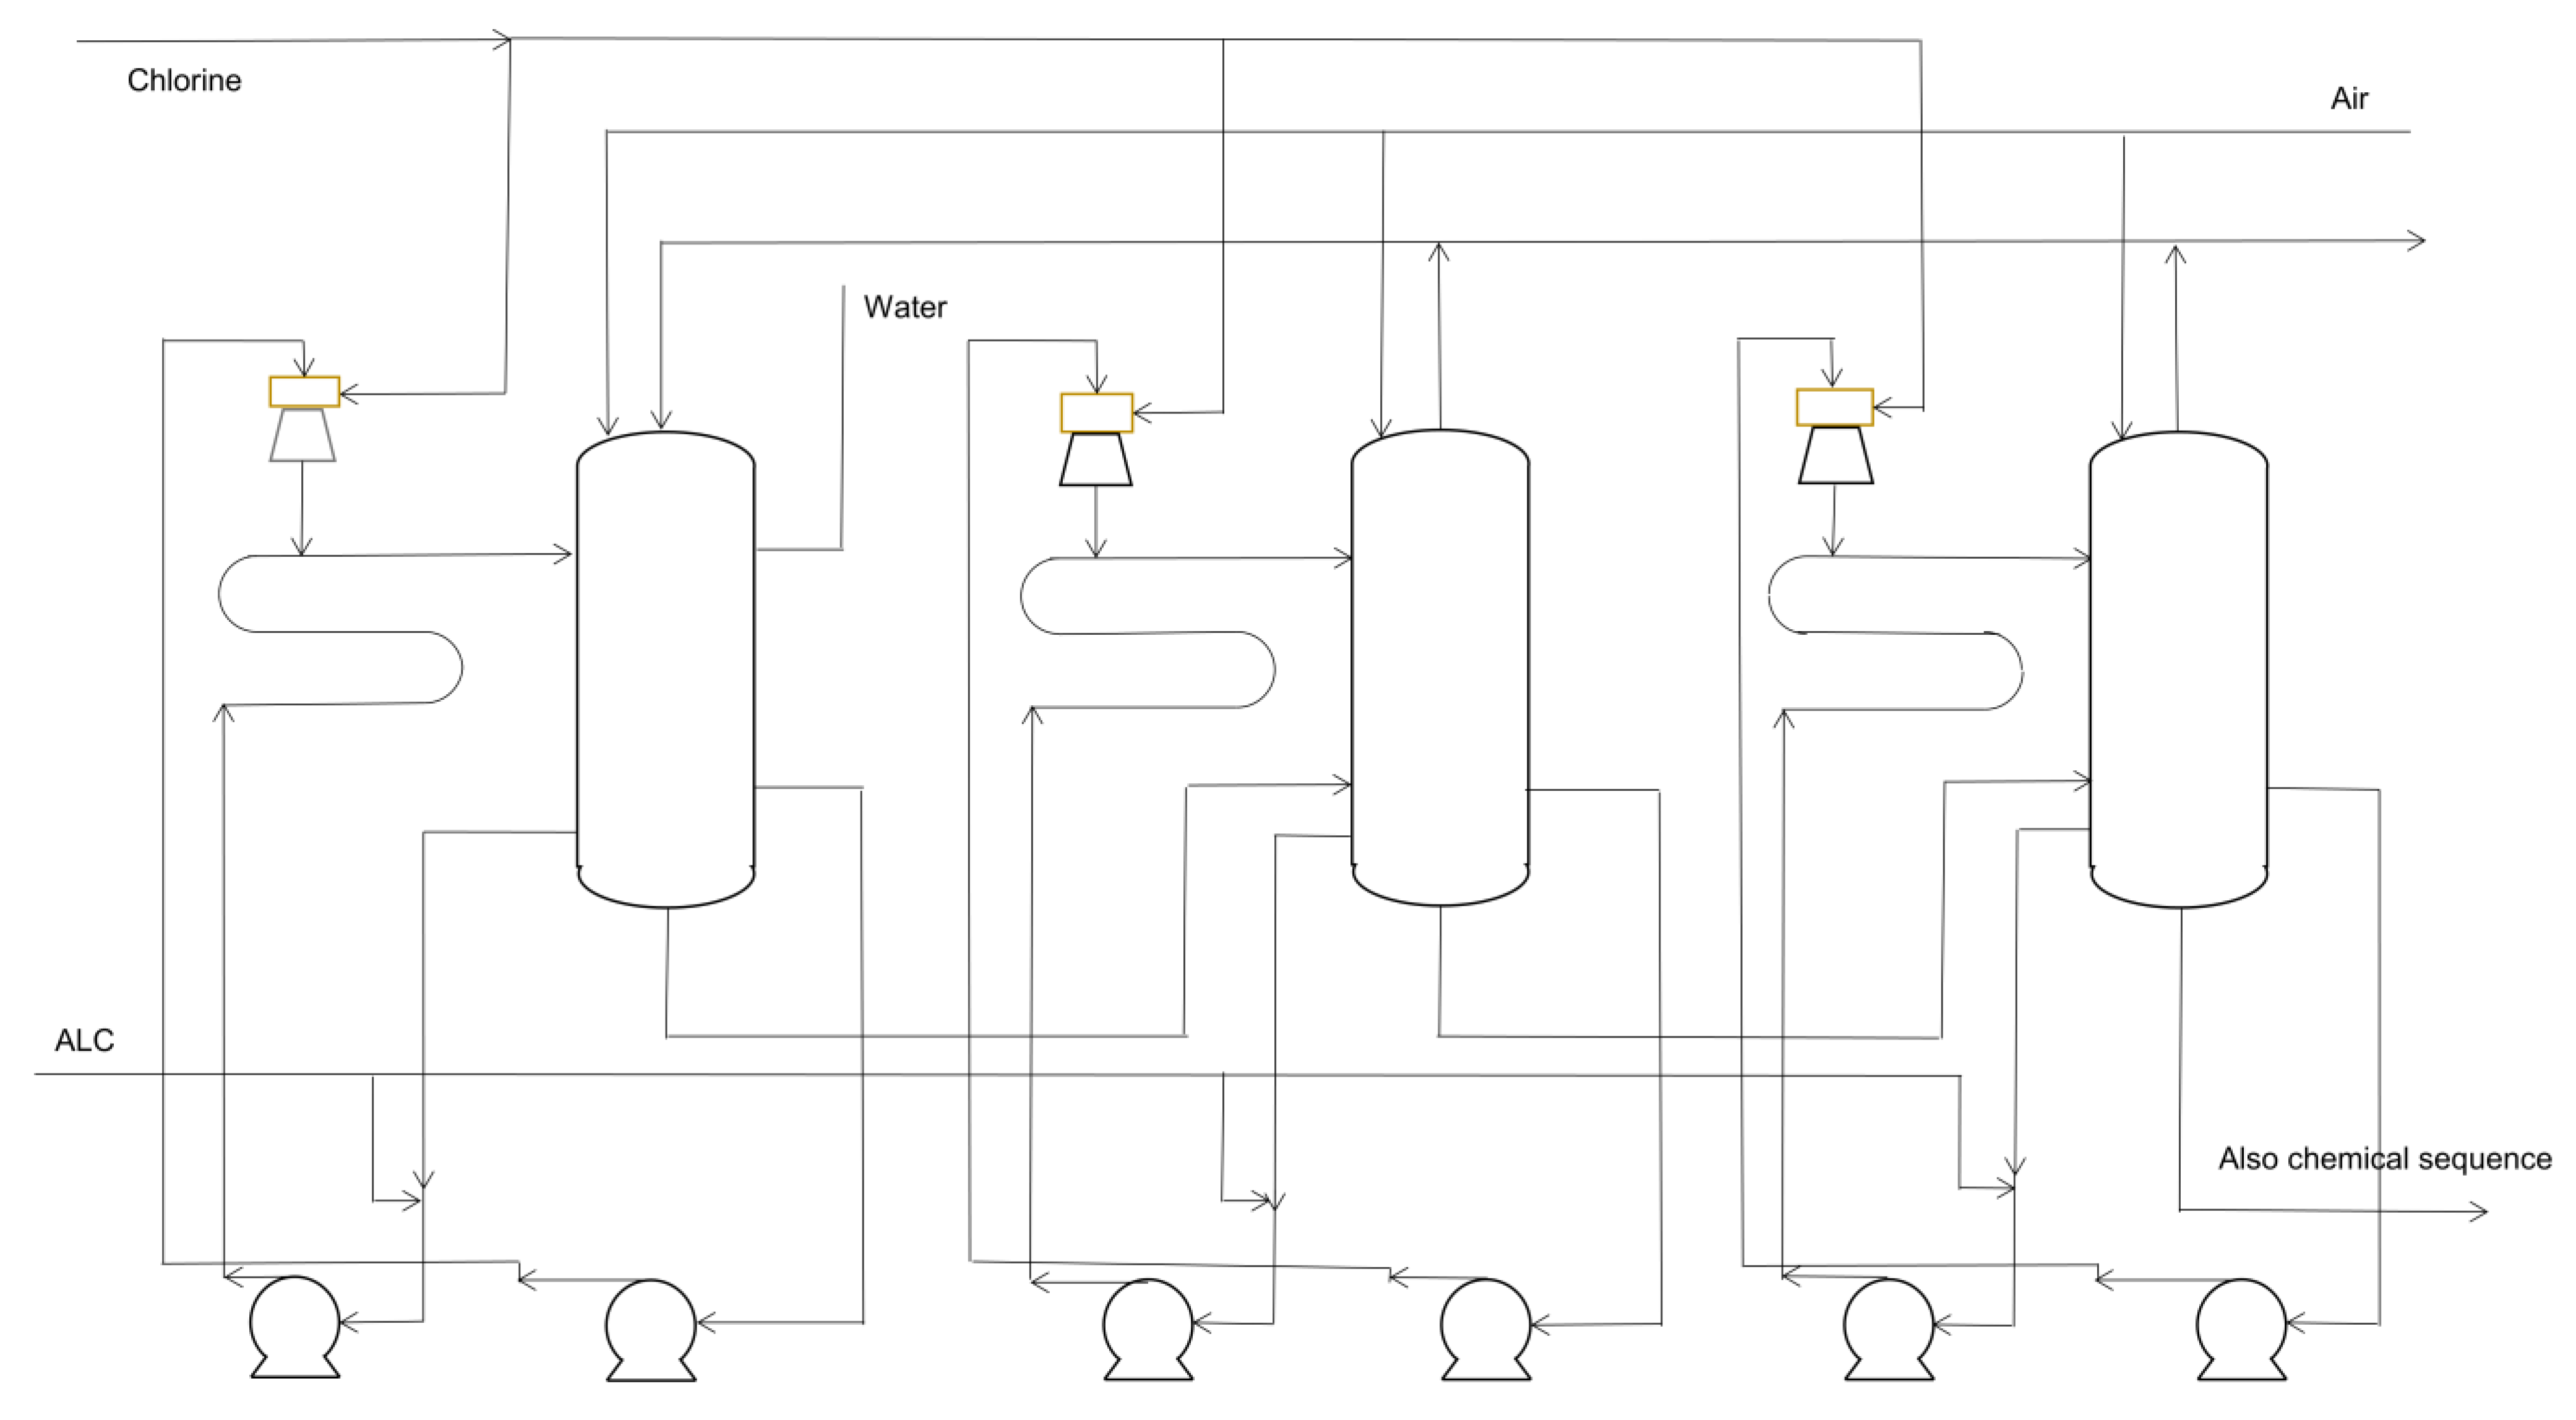
3.1. Brief Description of the Process of the Epichlorohydrin Plant
Epichlorohydrin is mainly produced by high temperature chlorination with propylene and chlorine as raw materials. The product is epichlorohydrin, and the by-product D-D mixture (mainly 1,2-dichloropropane, 1,3-dichloropropene) can be used in the preparation of pesticides. The separated 1,2-dichloropropane and 1,3-dichloropropene can be used as raw materials for organic synthesis. The process consists of three parts: chloropropene, chlorolization, and epoxy. The process involves four processes, as shown in
Figure 2,
Figure 3,
Figure 4 and
Figure 5.
3.2. Extraction of Fluids Data
By using Aspen Plus to simulate the process flow of the epichlorohydrin plant, the process fluid data of cooling and hot fluids were extracted from it, as shown in
Table 1 below.
3.3. Entransy Analysis of Existing Heat Transfer Networks Based on Entransy Volume
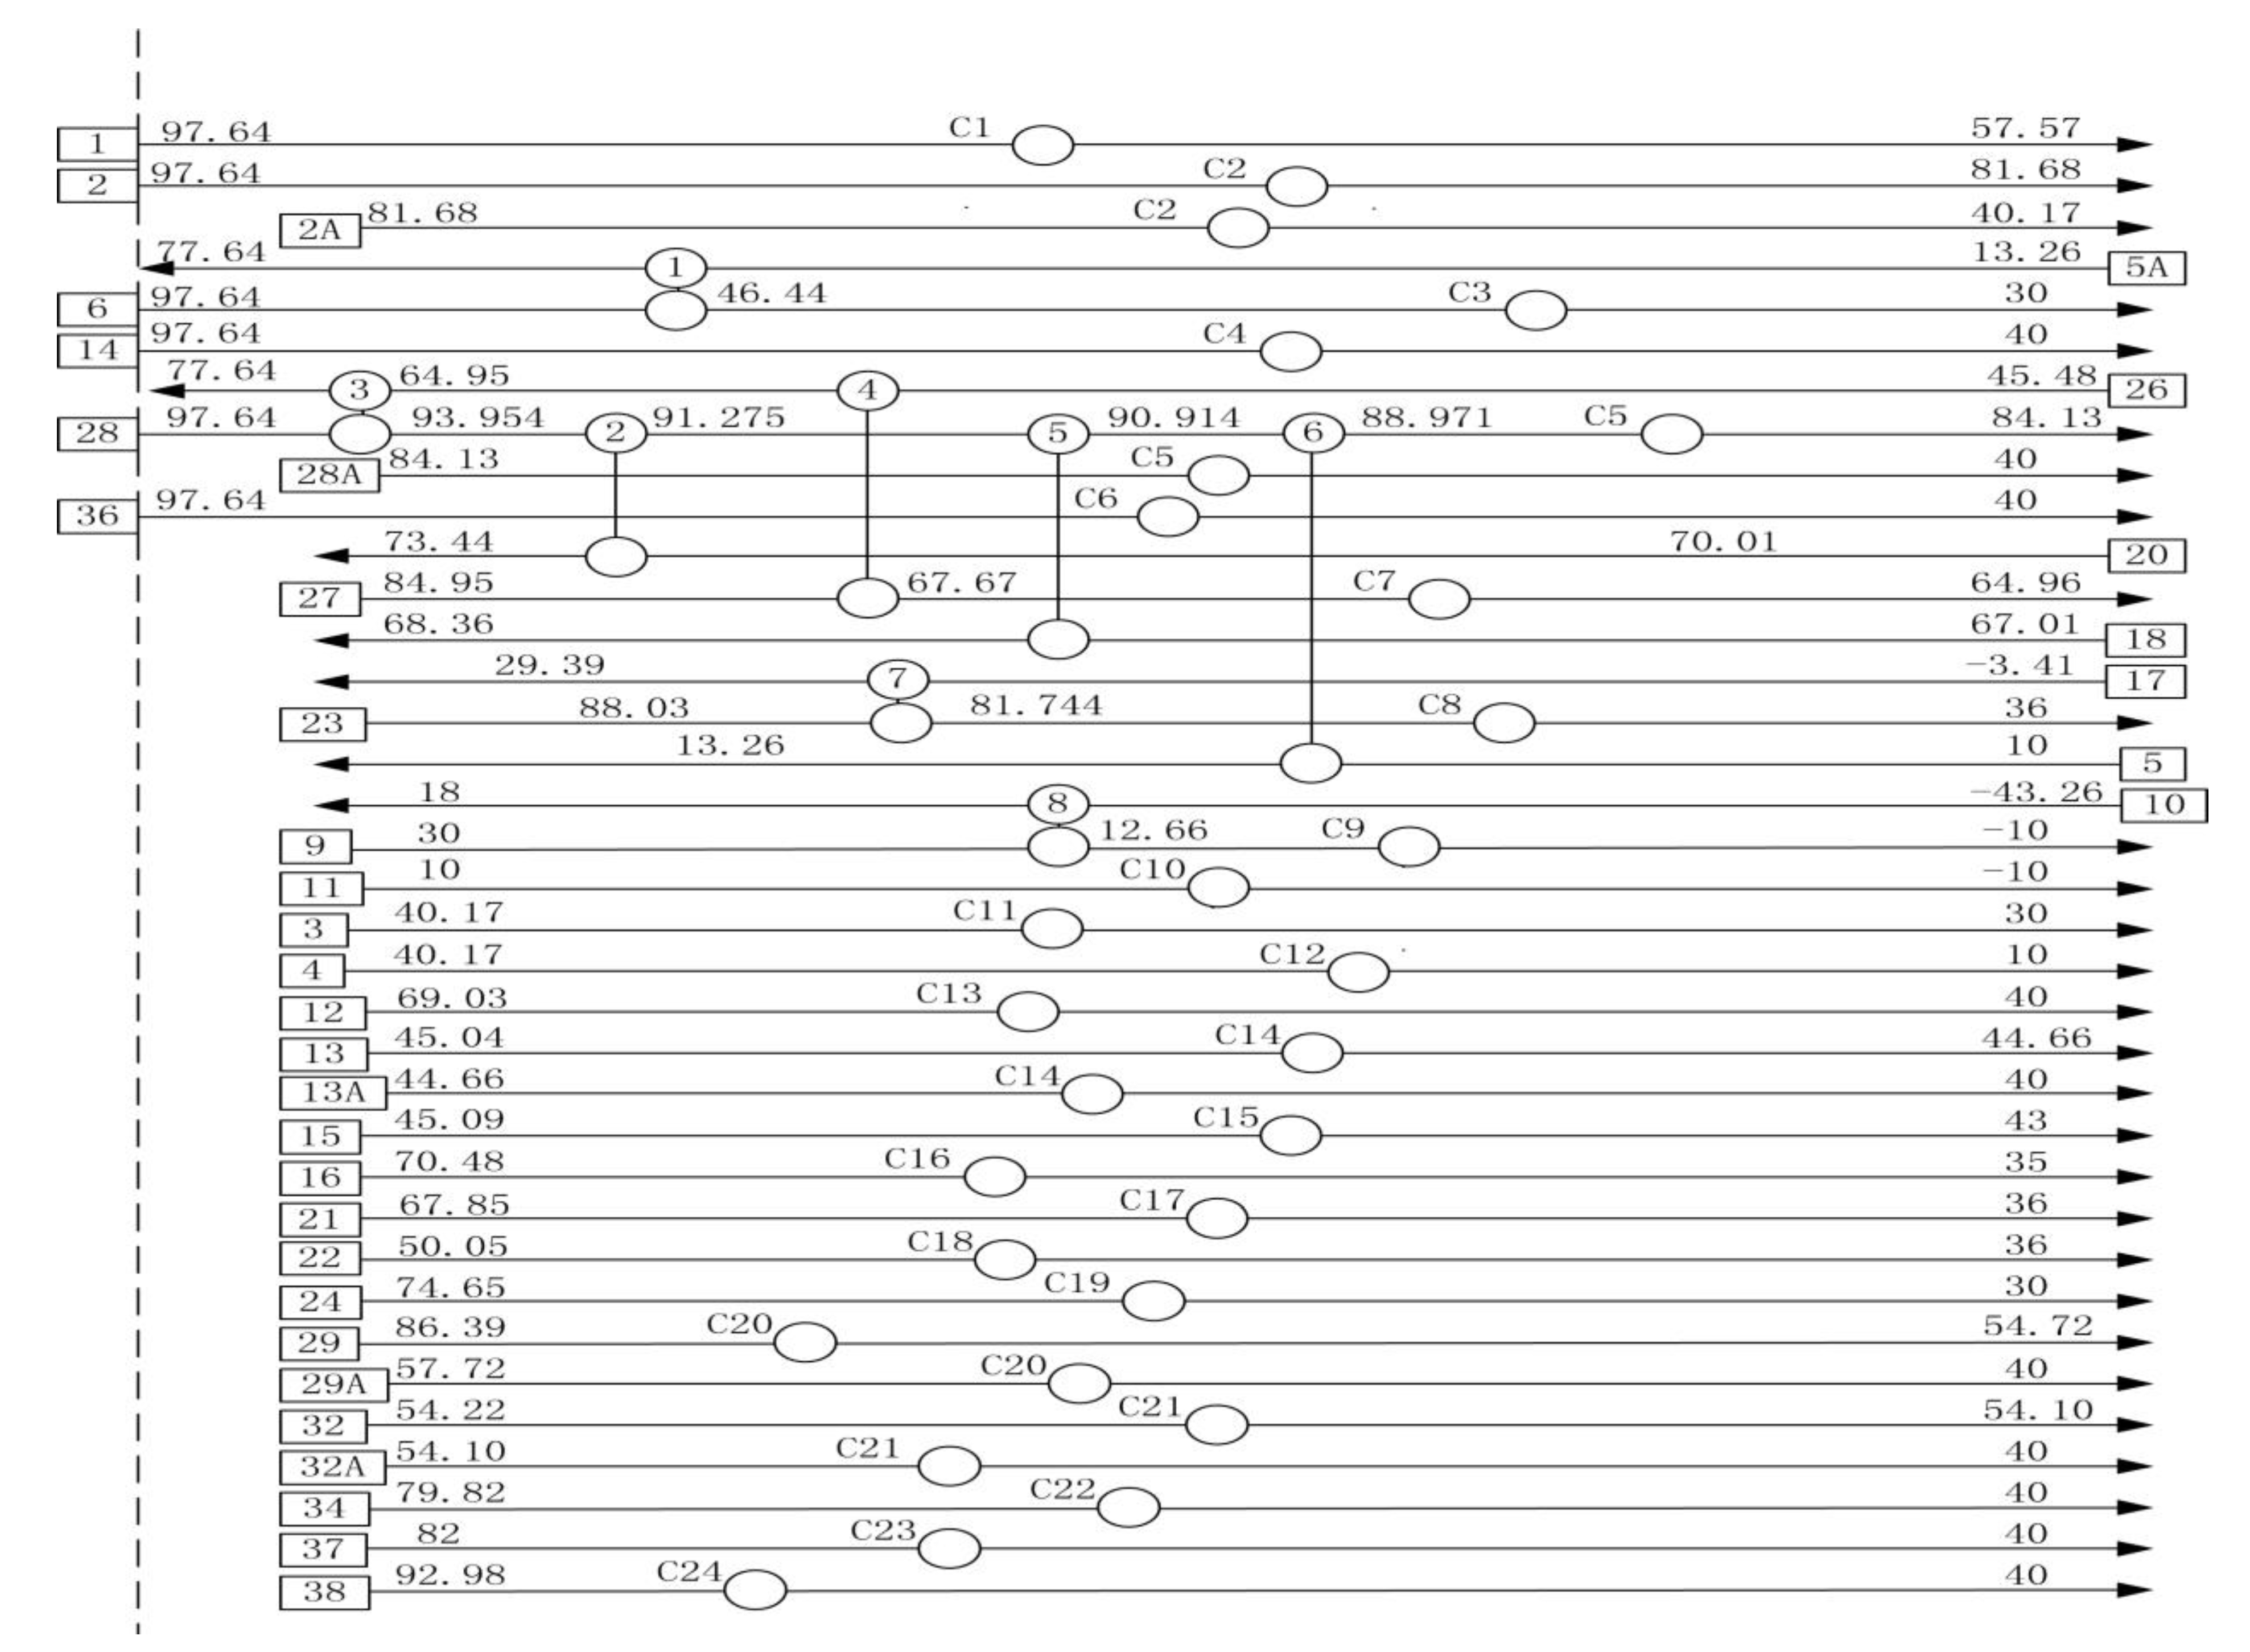
According to the data in
Table 1, the heat transfer network T-Q of the initial epichlorohydrin device was drawn, as shown in
Figure 6. At the same time, each fire volume was calculated as shown in
Table 2.
3.4. Analysis and Design of Heat Transfer Network Based on Entransy
The entransy analysis of cold and hot utilities was carried out to find the part with the largest dissipation rate of entransy. As can be seen from
Table 3 and
Table 4, H6, C14, C15, and C16, the largest entransy dissipation rate was 17.52%, 11.64%, 10.26%, and 27.30%, respectively. Therefore, the energy utilization efficiency can be improved by reducing the fire dissipation of these four utilities.
The empirical value ΔT
min = 10 K was selected to integrate the cold and hot fluids in
Table 1 and draw the combination curve of the cold and hot fluid balance (see
Figure 7). Through calculation, the entransy data after each design were obtained as shown in
Table 5 below. The entransy point temperature was 365.64 K. By comparing with the existing device, it can be seen that the total utility project consumption was saved by 19.41%.
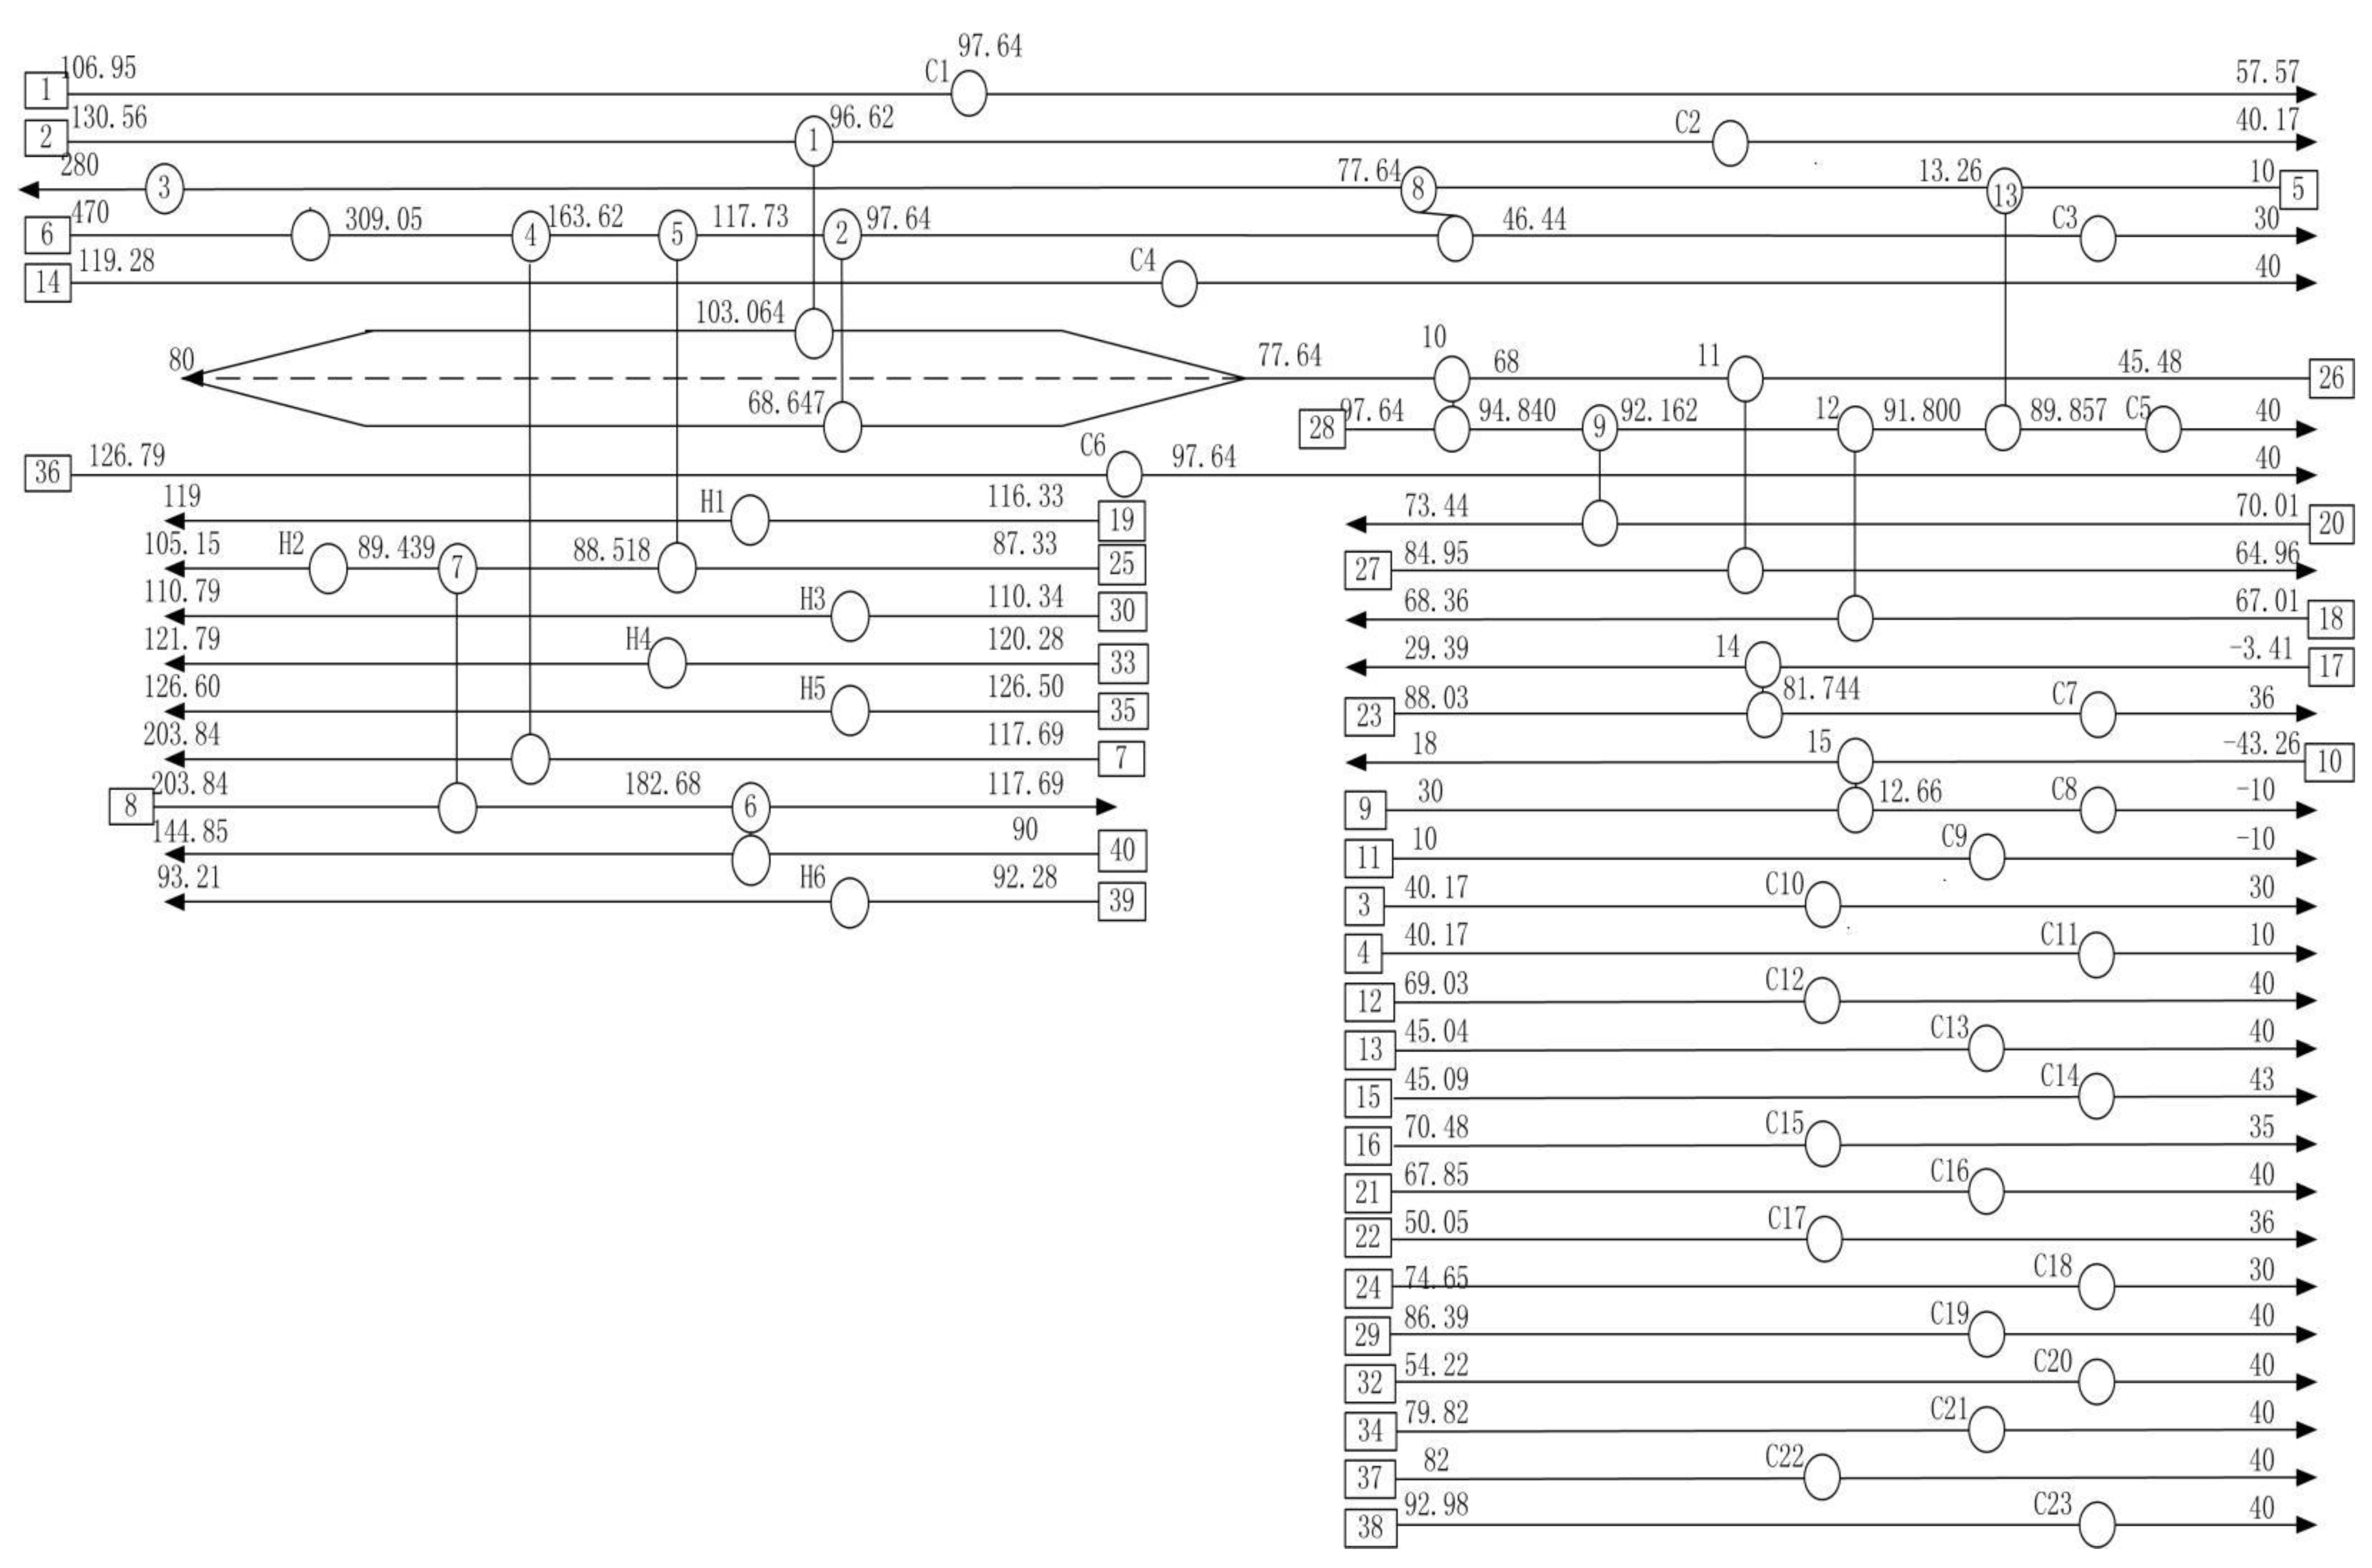
3.5. Maximum Entransy Transfer Efficiency Heat Transfer Network
The heat transfer network of the epichlorohydrin unit can be divided from the high and low heat potential energy at the entransy point [
25]. The high heat potential energy region consists of six hot streams and nine cold streams, and the low heat potential energy region consists of thirty hot streams and eight cold streams. A maximum entransy transfer efficiency heat transfer network was obtained, as shown in
Figure 8.
According to
Figure 8, the operating parameters of the heater and cooler involved are listed in
Table 6 and
Table 7.
Through the design of the heat transfer network based on entransy, compared to the heat transfer network of existing devices, although a certain number of heat exchangers were added, the investment cost of heat exchangers increased by CNY 1.2652 million, but the entransy of cold and heat utilities was greatly reduced, which can save CNY 4.183 million per year. Through calculation, it takes only 0.30 years to return the cost. Therefore, the maximum entransy transfer efficiency heat transfer network designed by the epichlorohydrin unit saved the operating cost of public works and has remarkable energy saving potential and economic benefit, which has a good application prospect.
4. Energy Saving Analysis of Devices Based on Pinch Analysis
The pinch technology was applied to the heat transfer network design of the epichlorohydrin plant. For the epichlorohydrin plant, the maximum heat recovery network was designed based on the pinch technology, as shown in
Figure 9.
Based on the logistic data of the extraction device, a cold and heat combination curve was created using a temperature difference of 20 °C. Using this curve, the minimum cold utility was found to be 17,881.95 kW, while the minimum hot utility was 8633.33 kW. Compared to the existing utilities, the combination of cold and hot utilities resulted in potential energy savings of 26.92 kW for the hot utilities and 15.10 kW for the cold utilities.
Based on the pinch point design principle, the maximum heat recovery network was obtained and subsequently optimized, as illustrated in
Figure 10. The proposed scheme exhibited a thermal utility consumption of 8633.33 kW and a cold utility consumption of 17,881.95 kW. The heat transfer network resulted in savings of 3180.65 kW in cooling utilities. The energy savings for hot and cold utilities was 26.92 and 15.10, respectively, and the investment payback period was estimated to be 0.16 years.
5. Entropy Analysis
On the basis of cold and hot fluid data, the ambient temperature was T
0 = 298.15K, the pressure was 0.1013 MPa, and the combined curve of cold and hot was drawn by orgin8, as shown in
Figure 6.
The entropy of hot fluids changed to 90.41 kW · K
−1, the ideal work of hot fluids was 5163.72 kW; the entropy of cold fluids changed to 63.62 kW · K
−1, and the ideal work of cold fluids was 4038.30 kW; the entropy of the external heating utility was 32.11 kW · K
−1, and the ideal work was 2255.22 kW; the entropy of the cold utility changed to 63.63 kW · K
−1, and the ideal work was 2178.60 kW; then, the efficiency of the second law of thermodynamics [
26] was 78.21%.
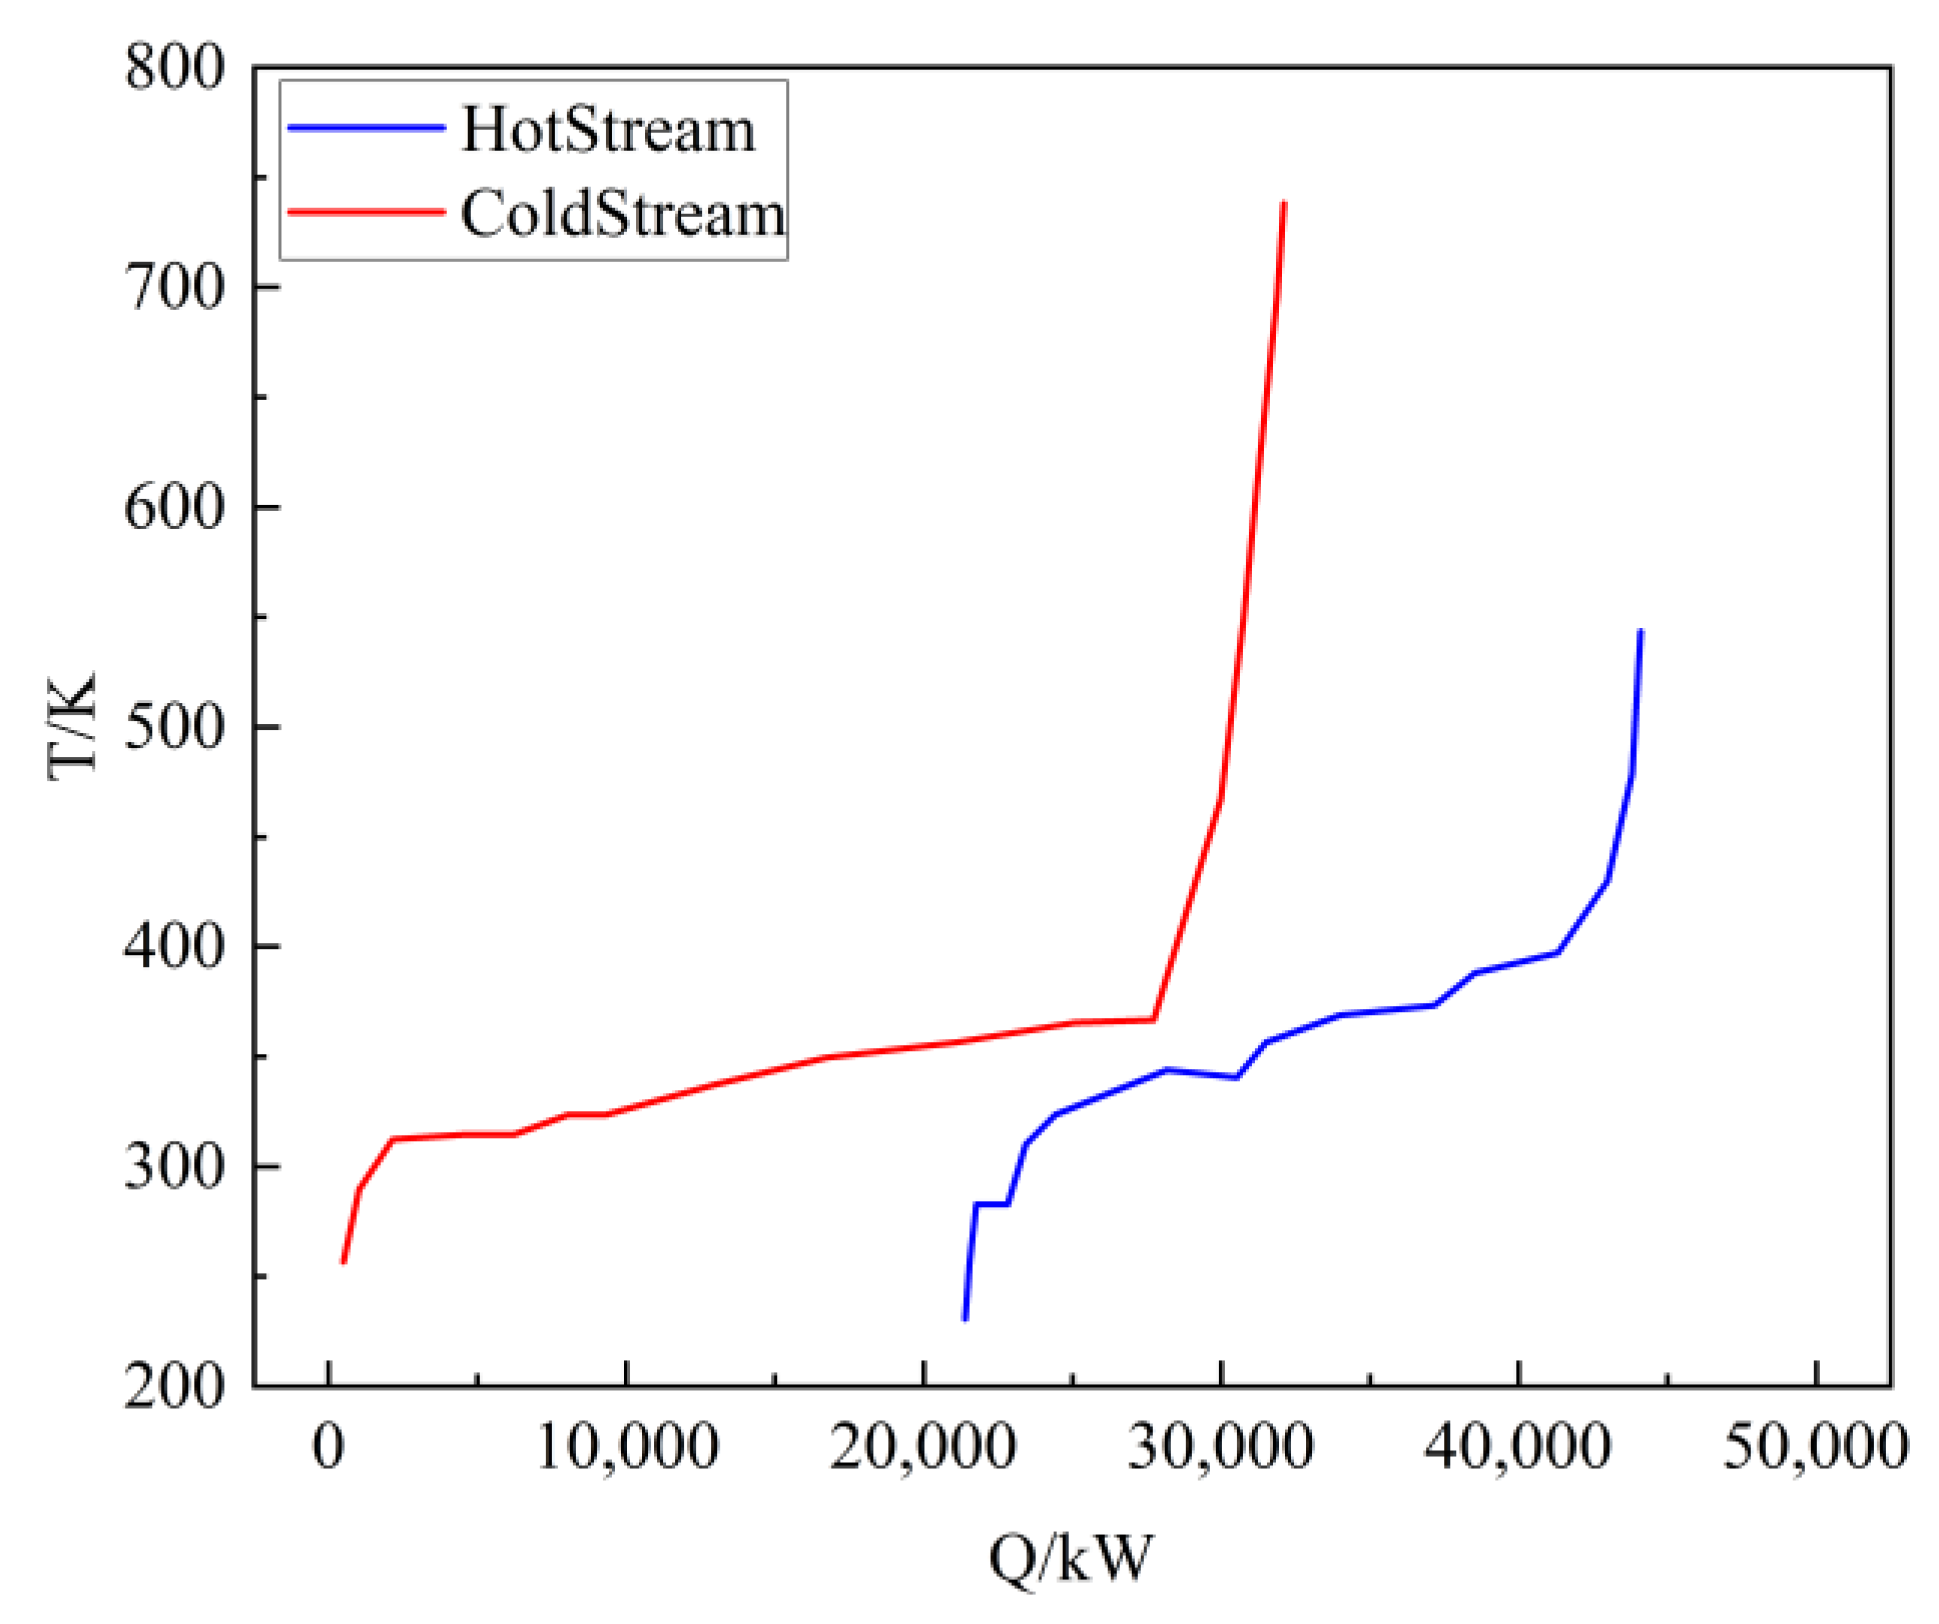
6. Energy-Saving Analysis of the Device Based on the Exergy Analytical Method
On the basis of the cold and hot fluid data, the ambient temperature was T
0 = 298.15 K, the pressure was 0.1013 MPa, and the curve of cold and hot is shown in
Figure 11.
The supply of hot fluids was 5163.72 kW, the requirement of cold fluids was 4028.30 kW, the external heating utility was 2255.22 kW, the cooling utility was 2178.60 kW, the loss was 1970.8 kW, the efficiency was 61.83, and the loss rate was 38.17.
In order to reduce the amount of public works, it is necessary to analyze the hot and cold public works and find the parts with the largest loss rate. As can be seen from
Table 8 and
Table 9, the H4, H5, H6, H8, C2, C14, C15, and C16 damage rates were 16.06%, 11.62%, 54.18%, 19.85%, 15.00%, 15.82%, 10.87%, and 42.13%, respectively. Therefore, the energy utilization efficiency can be improved from reducing the loss of the eight public works.
7. Comparison of Energy Saving in Four Strategies
ΔT
min = 10K, 15K, 20K were used to process the epichlorohydrin, according to the results of the pinch analysis method, entransy analysis method, exergy analysis method, and entropy analysis method (see
Table 10,
Table 11,
Table 12 and
Table 13).
- (1)
It can be seen from the calculation results in
Table 10 and
Table 11 that both the pinch analysis and entransy product analysis can analyze the energy use of heat transfer networks. When the minimum heat transfer temperature difference ΔT
min = 10K, 15K, and 20K, for the pinch analysis, the balance combination curve was drawn by processing the cold and hot fluids data. Under different heat transfer temperature differences, the amount of cold and hot utilities was different. Compared to existing devices, utility savings were 22.80%, 21.50%, and19.35%, respectively. The larger the minimum heat transfer temperature difference, the larger the utility consumption. For the entransy product analysis method, the entransy product transfer efficiency was obtained through the relationship between the heat and cold balance combination curve data and each entransy product quantity. Finally, the entransy product recovery was smaller and smaller, the entransy product dissipation was larger and larger, and the entransy product transfer efficiency was 42.81, 42.13, and 42.00, respectively. From the point of view of the energy saving effect, the energy saving effect of the pinch analysis method and the entransy product analysis method was close. However, the pinch analysis method cannot determine the thermal efficiency of the heat transfer network and cannot better evaluate the energy saving situation, and the entransy product analysis method can evaluate the heat utilization of the heat transfer network through the entransy product transfer efficiency. It is more suitable for describing the energy saving analysis of the system.
From the point of view of economic analysis, for the pinch analysis, the investment cost of equipment increased by CNY 562,800, the operating cost of public works can save CNY 3.4823 million per year, and the investment payback period is 0.16 years. For the entransy product analysis, the investment cost of equipment increased by CNY 1.2652 million, the operating cost of public works can save CNY 4.183 million per year, and the investment payback period is 0.30 years. From the point of view of the payback period, the payback period of the pinch analysis method was lower, but in the long run, the operating cost of the entransy product analysis method was lower than that of pinch analysis method. According to calculations, the entransy product analysis approach had a substantially bigger economic advantage than the pinch analysis method even after just one year.
- (2)
It can be seen from the calculation results in
Table 11 and
Table 12 that both the entransy product analysis method and the exergy analysis method can analyze the energy use of the heat transfer network.
When the minimum heat transfer temperature difference ΔTmin = 10 K, 15 K, and 20 K, for the exergy analysis method, the exergy loss of the process was further calculated by calculating the supply exergy of the hot fluids, the required exergy of the cold fluids, and the exergy loss of the cold and hot public works, that is, the exergy loss increased and the exergy efficiency became smaller and smaller, which were 61.01%, 59.28%, and 57.27%, respectively, and the savings of public works were 16.59%, 14.86%, and 12.02%, respectively, indicating that the heat quality of the hot fluids became lower, the irreversibility became greater, and the thermodynamic perfection became lower.
For the entransy product analysis method, the entransy product transfer efficiency was obtained through the relationship between the heat and cold balance combination curve data and each entransy product quantity. Finally, the entransy product transfer efficiency describes the utilization of the system entransy product, that is, the entransy product recovery was smaller and smaller, and the entransy product dissipation was larger and smaller, 42.81%, 42.13%, and 42.00%, respectively. At the same time, the energy saving effect became worse and worse, and the savings of public works entransy product was 19.41%, 18.01%, and 15.70% respectively.
- (3)
It can be seen from the calculation results in
Table 11 and
Table 13 that both entropy analysis and entransy product analysis can analyze the energy use of heat transfer networks.
By varying the value of ΔTmin (the minimum temperature difference) to 10 K, 15 K, and 20 K, the second law of thermodynamics showed an increasing efficiency of 88.02%, 93.52%, and 99.49%, respectively. However, it is worth noting that such increases in efficiency violate the principle of minimum entropy production. Therefore, the entropy analysis method may not be suitable for optimizing the energy efficiency of this particular device.
With the change of ΔTmin = 10 K, 15 K, and 20 K, the entransy product transfer efficiency was 42.81%, 42.13%, and 41.00% and the energy savings effect was 19.41%, 18.01%, and 15.70%, respectively. The worse the entransy product utilization effect was, the more heat loss there was, which accords with the basic principle that the greater the heat transfer temperature difference, the lower the energy utilization efficiency. Therefore, the entransy product analysis method is more suitable for the energy savings effect of the device than the entropy analysis method.
To sum up, the above three methods can analyze the efficiency of the heat transfer network and help to guide the further formulation of energy saving measures. From the analysis results, the entransy product analysis method has good applicability.
8. Conclusions
This paper presents a comparison of several analytical methods applied to the data analysis of an epichlorohydrin plant in an enterprise. The methods compared are pinch analysis, entropy analysis, crucible analysis, and entransy product analysis. The following conclusions were drawn from the data analysis:
The results of the pinch analysis and entransy product analysis are similar. However, the pinch analysis method cannot determine the thermal efficiency of a heat transfer network as the standard for evaluating energy savings, while the entransy product analysis method can establish the heat transfer network and evaluate the heat utilization of the heat transfer network through the entransy product transfer efficiency.
The ΔTmin= efficiency obtained by 10 K, 15 K, and 20 K was 61.01%, 59.28%, and 57.27%, respectively, and the savings efficiency of public works was 16.59%, 14.86%, and 12.02%, respectively. The efficiency of the entransy product obtained by the entransy product analysis was 42.81%, 42.13%, and 42.00%, respectively, and the savings of the entransy product of public works was 19.41%, 18.01%, and 15.0%, respectively. Although both methods can reasonably analyze the energy utilization efficiency of the whole heat transfer network and each part, the entransy product analysis method can reflect the actual system more accurately.
The ΔTmin= thermodynamic efficiency obtained by entropy analysis under different heat transfer temperature differences was 88.02%, 93.52%, and 99.49%, respectively. This result violates the principle of minimum entropy production and is not suitable for the energy utilization analysis of the device. The calculation of the ideal work and thermodynamic efficiency of cold and hot fluids in the entropy analysis method is affected by ambient temperature, while the entransy volume and transfer efficiency of each fluid calculated by entransy product analysis are independent of ambient temperature and have no variability.
The entransy analysis method, which combines the first and second laws of thermodynamics, is employed in heat exchange network synthesis to supplement the pinch analysis method’s limitations in determining heat transfer efficiency. Moreover, it addresses the issue of the entropy analysis method and exergy analysis method not matching the heat exchange network due to reference state selection. In the heat exchange network, entransy dissipation occurs, and entransy transfer efficiency can serve as a basis for evaluating the heat utilization effect.


