Article

The Paradox of Nuclear Power Plants (NPPs) between High-Efficiency Energy and Waste Management Concerns in the Context of Disasters Worldwide

by
Laura Elly Naghi
1,
Narcis Sebastian Păvălașcu
2 and
Manuela Rozalia Gabor
3,*
1
Faculty of Finance and Banking, Department of Finance, Bucharest University of Economic Studies, 010374 Bucharest, Romania
2
IOSUD–Doctoral School, “George Emil Palade” University of Medicine, Pharmacy, Sciences and Technology of Targu Mures, 540142 Tîrgu Mureș, Romania
3
Department ED1—Economic Sciences, Faculty of Economics and Law, “George Emil Palade” University of Medicine, Pharmacy, Sciences and Technology of Targu Mures, 540142 Tîrgu Mureș, Romania
*
Author to whom correspondence should be addressed.
Processes 2023, 11(3), 953; https://doi.org/10.3390/pr11030953
Submission received: 17 February 2023 / Revised: 15 March 2023 / Accepted: 16 March 2023 / Published: 20 March 2023
(This article belongs to the Special Issue Circular Economy and Efficient Use of Resources (Volume II))

Abstract

:
With the uncertainty concerning the future use of natural resources due to depletion and lack of access caused by the pandemic and recent political events that led to increased prices, nuclear energy may become an alternative efficient energy. NPPs raise serious concerns, including waste management, and any case of an NPP accident has the potential to disrupt the positive impact of energy production in terms of circular economies. Our research analyzed the impact of nuclear incidents as examples of disasters worldwide to decide whether any of the different forms of insurance coverage could be useful in future events. By using 2533 historical records of incidents from 1901 to June 2022, we set out to find the best predictor of damage causes and further observe whether the validation of current forms of insurance may be possible. The disaster subtype and declaration represent the best predictor of the total damage value (adjusted or not) for all types of disasters, including nuclear. The results are important inputs for underwriters working in insurance, including in radioactive waste management, which must consider historical data in order to tailor future contracts, adjusting the cost and coverage to the type of disaster. Our results highlight that with an increase of only one event involving a nuclear source, the total adjusted damages will increase by USD 1,821,087.09 thousand, representing 75% of the damage costs of the rest of the disaster subtypes. The results are useful for public entities to evaluate nuclear energy as a new solution and can help further adapt existing policies to include better responses for waste prevention, reuse and recycling.

1. Introduction

Among several alternative energy sources (such as solar, wind, wave or geothermal energy) currently being analyzed and implemented in different countries, nuclear energy is seen as the quickest and most efficient solution for national energy independence and carbon footprint reduction, according to governments. The increased electric energy demand after the introduction of the greenhouse emission limitations, mainly CO2, has caused currently increasing interest in nuclear power station construction [1]. Nuclear energy is not without controversies if we refer to European or Asian countries [2] that refused to develop such energy projects in their countries, but in 2019, nuclear power plants (NPPs) supplied 2657 TWh of electricity, about 10% of the world’s total consumption [3]. On the other hand, the impressive quantities of energy created by a limited number of locations and the advantage of compatibility with national electricity grids are two of the most important competitive advantages of nuclear projects. Nevertheless, nuclear energy generates significant apprehension among security experts, environment protectors and even large parts of the population. Because of the heavy media coverage of nuclear exposure or the malfunction of nuclear plants, each time an incident occurred, concerns were raised, and, hence, governments imposed rules for identifying and implementing risk management solutions that would take care of the financial losses generated by those incidents. As a result, compensation and provision schemes [4,5] for nuclear damages were developed around the world, in the form of either a public-funded solution or an insurance transfer solution. From an insurance point of view, when it comes to nuclear safety, the focus of the insured should be on preventive actions, meaning a reduction in the frequency of nuclear plant incidents [6], or reduction measures, such as the reduction in the financial losses incurred after the event.
In an era where electricity represents the core of all human activity and life, it is impossible to evaluate how we would manage a lack of energy or its restriction—or it was unthinkable before the political risk scenario in the southeastern part of Europe became a reality.
There are several factors that affect the production of the world’s energy. The retail market is still a significant but inefficient energy consumer. The infrastructure of the energy sector has reached its maximum functional limit, which is causing supplementary expenses for networks to operate at the minimum required level of security. The European objective of an Energy Union based on low oil and gas prices [7] was delayed by the pandemic period and, recently, by the war in Ukraine. Searching for alternatives in Central Asia, building a Mediterranean corridor or importing liquefied natural gas from the US would seem to be alternatives to be implemented as soon as possible to cope with the current situation. Measures for harmonizing the transfer of electricity across national systems of transportation are already in place—an improvement that had been desired for some time. There is still a need for the evolution of national grids and new storage facilities so that the market integration of the renewable energy market is possible. This is also due to the fact that the number of producers will surely increase, and consumers will also demand the possibility to contribute to the grid with their own production capacity. All around the world, small steps are taken in terms of transparency toward the end user concerning the structure of energy prices, the regulation of tariffs, the competitiveness of electricity providers and renewable support schemes.
Nuclear energy is used or planned to be used in 40 countries globally, yet the contribution of nuclear energy to sustainable development remains an area of contention [8]. Campaigns against the use of nuclear energy are frequent due to public misapprehensions [8,9,10]. The Fukushima effect [11,12] is still dividing economies around the world: on the one hand, the USA, Canada, China and France are still supporters of this type of energy, at least for the period until renewable energy sources have a higher weight in the world energy market; on the other hand, Germany and Switzerland have taken a phase-out approach [13,14]. Major disasters in NPPs (Three Mile Island in Pennsylvania in 1979 and Chernobyl in 1986) have influenced the development of nuclear power engineering not only in the aforementioned countries but also in most other countries availing of such technologies [1]. Nevertheless, cautionary measures are taken in the development of new NPPs and the enforcement of security measures for existing plants [15,16]. In countries with nuclear power, radioactive waste constitutes a very small proportion of the total industrial hazardous waste generated [3]. Radioactive waste management is a demanding problem that is raising tensions and misunderstanding among the general public, experts, and policy makers in a number of countries [9,12]. The aim of this research is to economically analyze the costs of nuclear incidents/accidents compared to the large range of general incidents over the last century based on historical [2,11,17] data to highlight the different forms of insurance coverage that could be useful in future events. For analysis purposes, we used 2533 registrations of incidents that occurred between 1901 and June 2022 collected from the EM-DAT CRED [18] database and subjected the data to complex statistical methods [19] to identify the best predictor of damage causes.
Despite the limited data concerning nuclear events, our main objectives are:
  • To validate whether there is a direct relationship between the value of losses caused by nuclear events, the insured amount and the incident location;
  • To observe whether there is a connection between the value of losses and the maximum limits of coverage established in the US vs. the international market.
In recent years, in any database, the split between direct and indirect losses and between nuclear plant and third-party liability has been thoroughly analyzed for the Fukushima incident and only estimated for previous incidents [11,12]. Catastrophic risk modeling has been an integral part of the insurance industry over the last decade, given the occurrence of a growing number of catastrophic events worldwide [17]. The systematic management of plant risk is crucial for enhancing the safety of NPPs [20].
All these details justify and represent the main reason (and one of the practical contributions and novelties of this paper) that financial losses (property losses) were analyzed together with other losses (number of injuries and number of deaths) so that an empirical evaluation of coverage for property versus third-party liability losses would be possible, even though there are no explicit amounts paid distinctly for these two types of losses. Both the theoretical and practical contributions of the paper are based on a complex research framework addressing the relationship between nuclear energy and the associated risks from three important perspectives: (1) the risk in terms of the cost of damages from nuclear incidents in the worldwide context of disasters; (2) risks in terms of human and social costs, as well as short-term post-event risks and long-term post-nuclear-incident risks [21], (3) risks in terms of radioactive waste management (RAWM) and population health effects of nuclear incidents.

2. Literature Review

2.1. Theoretical Background of Nuclear Incidents, Nuclear Energy and Radioactive Waste Management (RAWM)

Energy supply and consumption play vital roles in the transition toward a sustainable society [8]. During the last several years, important questions have emerged related to the increased use of nuclear energy worldwide and to the need to store high-level radioactive waste [22,23] from nuclear energy plants [24]. Nuclear power can replace fossil fuels and will have a decisive impact on the approach to conventional energy [25]—the new trend in energy decisions—and is regarded as a green investment [26].
The relationship between energy consumption and economic growth using different models has been analyzed by several authors [27,28,29], who concluded a converging trend in the short run for the industrial sector and a lack of a clear causal relationship in the countries analyzed; all the papers stressed the need for caution in the evaluation of national energy sector policies [27,28]. Sovacol [29] analyzed the link between NPPs and renewable electricity technologies according to six criteria: cost; fuel availability; land degradation; water use; climate change; and safety/security [29]. Nuclear energy has a large potential impact on carbon abatement costs [30].
For decades, European countries were considered dependent on gas imports, underlining the obligation to invest more in the EU energy sector [7]. The latest developments show that stringent action is still needed. Nuclear energy has distinctive merits [31], such as sustainable resources, low costs and no greenhouse gases. The rapid rise in nuclear energy use outside the EU (China, India, etc.) also means that the EU needs to maintain its global leadership and excellence in the technology and safety domains [32]. Even though the academic community and businesses have worried about the importance of the renewable energy sector since the 1990s [29], only recent projects were prioritized on the level of the international energy market; in this regard, European companies have taken the leading position in the terms of international patented ideas [7]. The international literature includes studies on the perceived risk and perceived costs concerning RAWM among the population [1,26] but lacked an analysis of the disaster risk associated with NPPs. In Russia, trust in nuclear energy is, on the contrary, very high, with two-thirds of the population supporting its continued development [33].
According to the World Nuclear Association (WNA), nuclear power is the only large-scale energy-producing technology that takes full responsibility for all its waste and fully accounts for these costs in the product [3].
There are several papers showing that, from the safety perspective, the substitution of nuclear power plants with wind generation results in a small decrease in the overall core damage frequency in the given system [34].
At the same time, the clean transport of energy, waste management, radiophobia and the safety of nuclear energy [31] represent the main points in the energy strategies of Europe and the US [7,35]. Often, studies modeled the cost of nuclear waste management very simply or neglected it entirely [30]. The investigation of waste management methods is limited to European countries [25], especially for RWM. The production level of nuclear energy has increased over the years, having a positive impact on the reduction in CO2 emissions but also bringing about challenges in nuclear waste management and the exposure associated with radioactive leaks/accidents [36]. Radwaste management in present practices for coastal NPPs has very low local and global impacts on health and the environment [37].
The main concern regarding nuclear incidents is radioactive waste, especially the radiological properties of the waste [38]. The safe disposal of radioactive nuclear waste is currently an urgent and challenging issue [23]. Many countries, including the United States, Sweden, Switzerland, Finland, Germany, Canada, Belgium, France and Japan, have initiated radioactive waste management programs [23]. According to the International Atomic Energy Agency (IAEA), nuclear waste must be processed to ensure that it is safe for disposal [38], and this implies another important cost (especially for the treatment processes necessary to reduce the volume of radioactive waste) and also the problem of insurance coverage provided by compensation schemes worldwide. Used nuclear fuel may be treated as a resource or simply as waste [3], but there are opinions regarding the economic advantages of building NPPs, and there are only real concerns regarding high-level radioactive waste (HLW) [3].
Even though the number of incidents is significantly limited as compared with other industries that generate massive losses from accidents, the public is still reluctant to adopt nuclear energy [8,9,26], remembering the Chernobyl accident in 1986 [39] or the Fukushima incident in 2011 [11,12]. Certain economies are considering whether the efficiency and profitability of nuclear energy outweigh the negative impact and losses [13] generated by the two largest events, Chernobyl and Fukushima (March 2011): the cost of the two events is equal to nearly five times that of the other 173 events [19]. Society approval represents a critical and decisive stage in the process of radioactive waste management [26]. Additionally, Barron and Hill [30] show the importance of using discount rates that may underestimate the cost of nuclear waste management and therefore overestimate the value of nuclear energy as a low-carbon energy technology [30]. There are authors recommending integrated nuclear waste management for eventual accident waste. Risk, waste management and social issues of sustainability were mentioned relatively less frequently than the environmental, governance and economic aspects of sustainability [8].

2.2. Compensation Schemes and Provisions for Nuclear Incidents and Radioactive Waste

According to the international literature, the estimates of nuclear power plant safety are usually based on probabilistic safety analyses [40,41,42,43] or probabilistic risk assessment (PRA) [44,45] by comparing the accident risks of present and future nuclear power plants with accident risks due to other energy sources [40,41,42,43]. It was estimated that the NPPs in Eastern Europe dominate the estimated risk pattern and contribute at least 40–50% to the average risk in Western Europe. Recently, for the estimation of NPPs, safety specialists used a new method for Multi-Hazards Risk Aggregation (MHRA) [46], spatial analysis [47] or the system dynamics method [48] or applied a risk matrix with the AHP method [49].
The risk assessment of NPPs usually consists of constructing a set of scenarios of the occurrence and development of possible accidents, followed by an evaluation of the frequency and severity of the consequences of each one [45,47,50]. A group of authors [20] developed the Accident Sequence Precursor methodology, which may systematically contribute to identifying plant risk significance as well as to enhancing the safety of nuclear power plants.
As a means to cope with massive losses, compensation schemes for nuclear damage were developed in the 1960s based on a set of principles that allowed a combined payment from the nuclear plant owner and public funds (especially for indirect effects on the population) [1,51]. There are mainly two systems of compensation at the international level—the American and the international approach: the main difference resides in the liability limit on the coverage of losses. The initial Price–Anderson Act applied a 1:10 two-tier compensation system (one-tenth covered by the nuclear plant, and the state would cover almost 10 times more from public funds). Over the years, revisions led to a new financing scheme, where both tiers are financed by all licensed American nuclear operators. The last revision of the Price–Anderson Act was approved in 2005 as part of the Energy Policy Act of 2005, and amendments were expected in 2022 after Congress approval; however, the compensation coverage of the Act was extended until the end of 2025. Since 2008, the US system must also comply with the rules of the International Atomic Energy Agency—meaning that nuclear operators must participate in risk-pooling programs to cover the costs of US incidents. Trebilcock and Winter, in 1997, sternly criticized the approaches to the coverage and liability of nuclear incidents, as the conventions for compensating victims of nuclear incidents were obsolete, and the frequency of updates was too small [52].
There are several differences between the two types of compensation regimes; for instance, the American system offers better compensation because the total loss amounts are raised based on retrospective premiums. According to the international regime, the nuclear operator is held exclusively liable for suffered losses. The American regime excludes public financing, whereas the international approach is to increase public funding, a decision taken after the major incidents in Ukraine and, later, in Japan. A pooling of all nuclear operators was proposed several times in the US as a complementary solution to classic nuclear insurance pools [53]: this solution would offer the possibility of coverage up to tens of billions of USD or Special Drawing Rights (SDR) (for example, in the US, the liability limit of the operator is USD 13.4 billion) [54]. In some countries, the liability of the operator is not limited per se (such as Austria, Cuba, Estonia, Finland, Germany and Japan) for damages suffered within the country. Those countries established a limit of liability of SDR 125 million [54] based on the provisions of the international conventions active in the member states, as can be seen in Table 1. Such liability conventions include the Brussels Convention Supplementary (BSC) in 1963, the Paris Convention in 1960 and the Convention on Supplementary Compensation for Nuclear Damage in 1997 (CSC), which are sets of rules providing a pre-determined formula for the liability limit. Regarding the safety of NPPs, the IAEA organized the Convention on Nuclear Safety (CNS) in 1994 with the main aim to commit contracting parties to maintain a high level of safety [38,55].
The question of the economic assessment of nuclear incidents [56] is important in order to understand which liability convention provides better tailored coverage for nuclear operators, as the social costs of a nuclear incident can rise to unimaginable levels, and existing limits in the insurance industry can decrease the efficiency of this risk management technique. The efficiency of insurance coverage is also undermined by political risks, such as terrorist attacks after September 11 [51] and the Russian war in Ukraine, as the probability of available compensation sources is increasing. In the long run, nuclear energy may become effective from a liability point of view if social costs are fully covered by nuclear operators (as internal costs) in the case of an incident.
The concept of compensation, mentioned by the international conventions, comprises different types of liability: (1) strict liability (the victim of a nuclear incident does not have to prove a fault committed by the operator) of the nuclear operator; (2) exclusive liability (the operator is the only party that can be sued in case of a liability claim); (3) compulsory insurance, (4) jurisdiction of court. The traditional conventions stipulate a prescription period of 10 years from the date of the incident, unless the insurance contract provides otherwise.

2.2.1. The American Scheme of Compensation

The American approach to nuclear claims (based on the Price–Anderson Act) divides the loss coverage between the private operator and the government program if an Extraordinary Nuclear Occurrence is established by the Nuclear Regulatory Commission. In such an instance, the strict liability of the operator is decided, without the possibility of exercising tort law, except for the cases of wars, terrorist attacks and workers’ compensation claims. Public funding implies the contribution of all American nuclear operators that are licensed by the Nuclear Commission, which can amount to USD 300 million.
In terms of costs, the American regime of compensation expresses the importance of on-site cleanup rather the third-party liability coverage of the nuclear operator. The insurance coverage must first be used for the decontamination of the nuclear site and for the stabilization of the reactor, as waste management must be taken into consideration by the cleaning crew. For these types of operations, the Commission establishes a minimum insurance amount of USD 1.06 billion/reactor station site [51]—known as the “property rule”.
Traditional insurance companies do not offer coverage for damage caused by a nuclear accident, even though the exposure caused by the civil use of nuclear energy is regarded as high-cost and low-frequency. Therefore, the only solution for this case is the nuclear insurance pool, which increases the underwriting capacity of small and medium insurance companies up to the sum of all contributions of the pool’s members. One main advantage of such pools is that reinsurance companies can provide financial support, which in turn increases the appetite of insurers to cover a much larger part of the nuclear risk. Most nuclear pools operate in national markets; slightly more than 30 nuclear entities are known at the international level (they include around 300 insurance companies) to cover third-party liability and damage to the nuclear plant itself.
Any licensed nuclear operator must prove the existence of a minimum liability insurance policy upon opening the plant. In the USA, the policy is not an insurance contract per se, but a contractual bond by which the nuclear operator will be obliged to pay the retrospective premiums in case of a nuclear incident. If the operator fails to pay the premiums, the national pool must offer coverage, which will later be recovered from the nuclear operator (the sum corresponding to the third-party liability). The property insurance coverage is accessible by a mutual insurance company, as an alternative to nuclear pools, with a maximum limit of USD 2.75 billion.

2.2.2. The European Scheme of Compensation

In Europe, there is no distinction between third-party liability and property protection, as the coverage is not set up to a certain limit. European nuclear operators created a mutual insurance company that offers coverage for property damage and business interruption, not only related to nuclear plants. The European Mutual Association for Nuclear Insurance (EMANI) is a mutual insurance association that covers more than 100 nuclear sites for its member states (including the US), with the purpose of reducing insurance premiums for the members. The coverage offered by EMANI is different from the protection offered by nuclear pools, as it does not cover third-party liability losses; the levels of compensation are, nevertheless, lower than in the case of the US [51]. In order to get coverage for third-party liability losses, European Liability Insurance for the Nuclear Industry (ELINI) was created in 2002 for cases of terrorism with a 30-year prescription period. According to data for 2021, ELINI covered losses of up to EUR 264,830,835 for one single member, a significant increase in the maximum capacity if compared to EUR 10,485 million in 2006 [51,57]. Taking into consideration the diversification of the coverage of losses caused by nuclear incidents at the international level, as seen above, the two international schemes for compensation and the provisions for radioactive waste, we undertook to test the following hypotheses (established intuitively due the lack of research results in the field):
H1: 
There are significant differences between locations in terms of the disaster category/subtype and damage level.
H2: 
The damage levels and human losses from radiation/nuclear accidents are significant in the total damages registered worldwide.
H3: 
There are differences between the US and the rest of the world in terms of damage levels.
H4: 
The disaster subtype is one of the best predictors of damage levels.
For the validation of the above-mentioned research hypotheses, we applied inferential statistical methods [19], regression models and other quantitative methods, detailed in the following section. The research objectives were established based on the availability of insurance coverage for losses generated by different disasters, including nuclear events.

3. Materials and Methods

The set of data originates from the EM-DAT database [18], which consists of over 22,000 important disasters in the world starting from 1900 until today. The Emergency Events Database (EM-DAT) was created in 1988 with the initial support of the World Health Organization and the Belgian Government and centralizes data from different sources, such as non-governmental organizations, research institutes, UN agencies and the insurance industry. The declared objective of EM-DAT is to enable decision making for disaster preparedness, as well as provide an objective basis for vulnerability assessment and priority setting.
The variables used in this research are from available historical data [2,11,17], with a total of 2533 records extracted from the EM-DAT CRED database (The International Disaster Database—Center for Research of Epidemiology of Disaster, UC Louvain, Belgium) [18] for the period from 1901 to June 2022 for both disaster groups and disaster subgroups, Technological and Complex Disasters:
  • Categorical variables:
    Disaster group and disaster subgroup with the same categories and code: (1) Technological and (2) Complex Disasters;
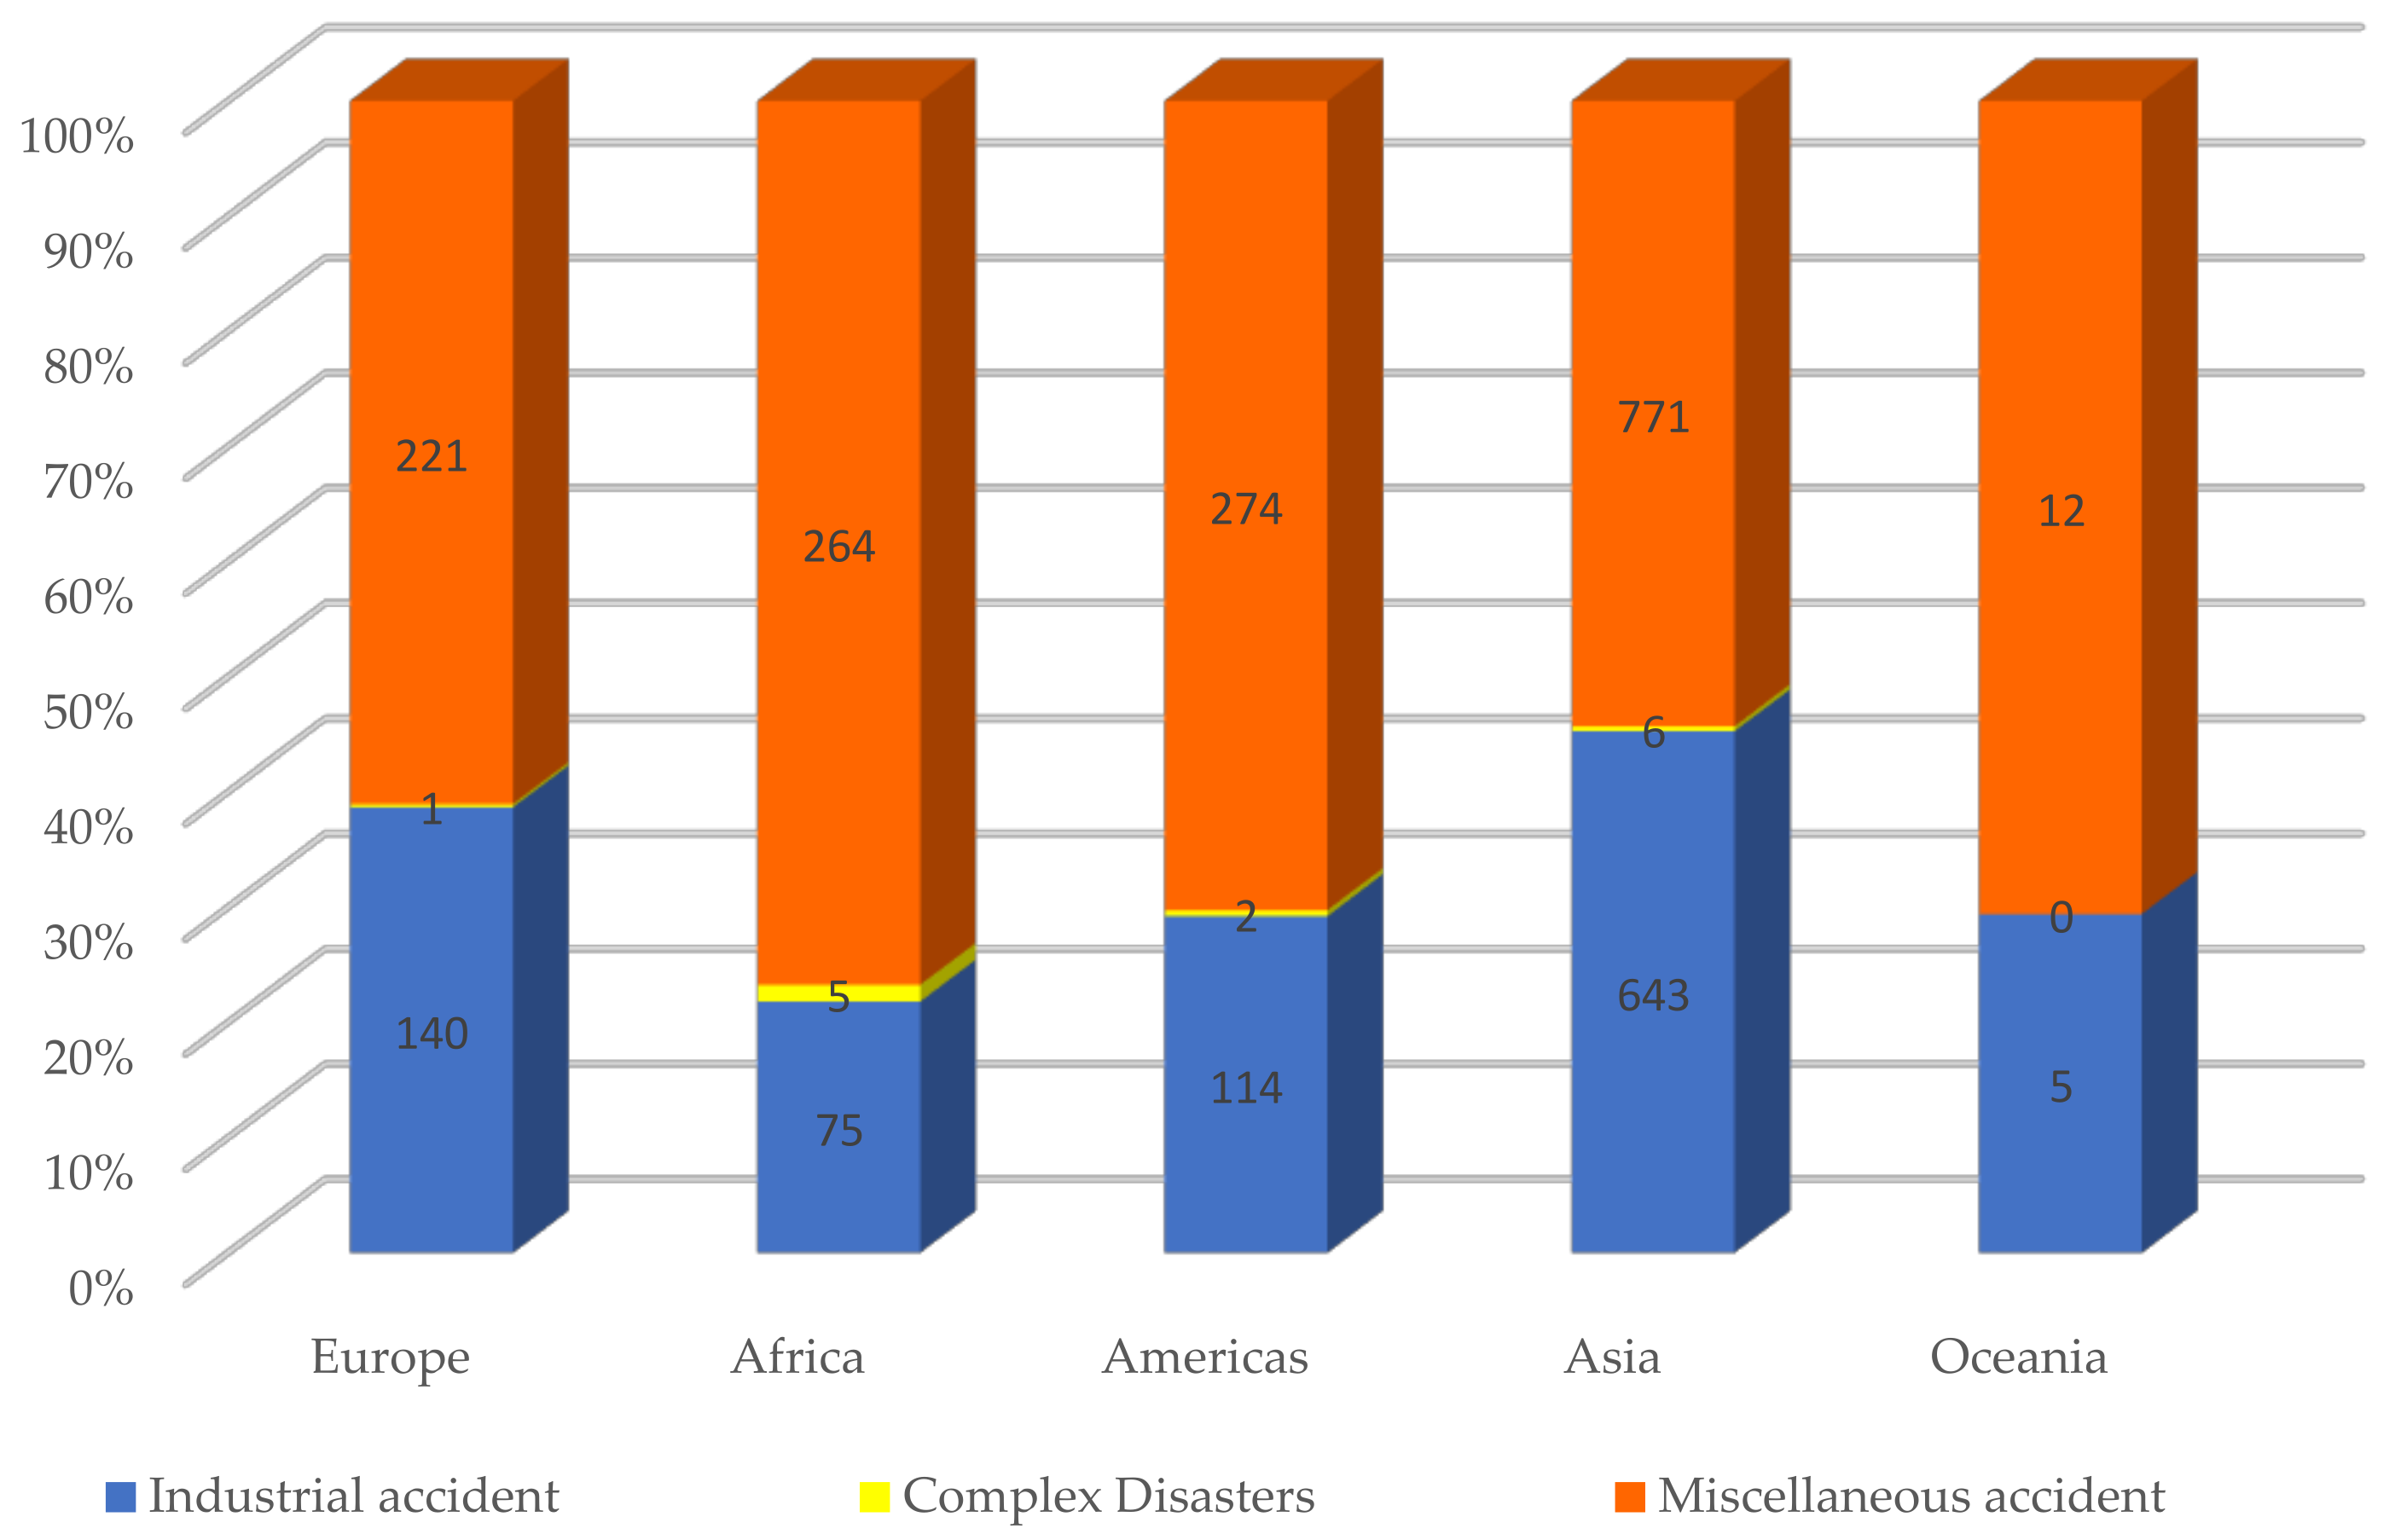
    Disaster type: (1) Industrial accident, (2) Complex Disasters and (3) Miscellaneous accident;
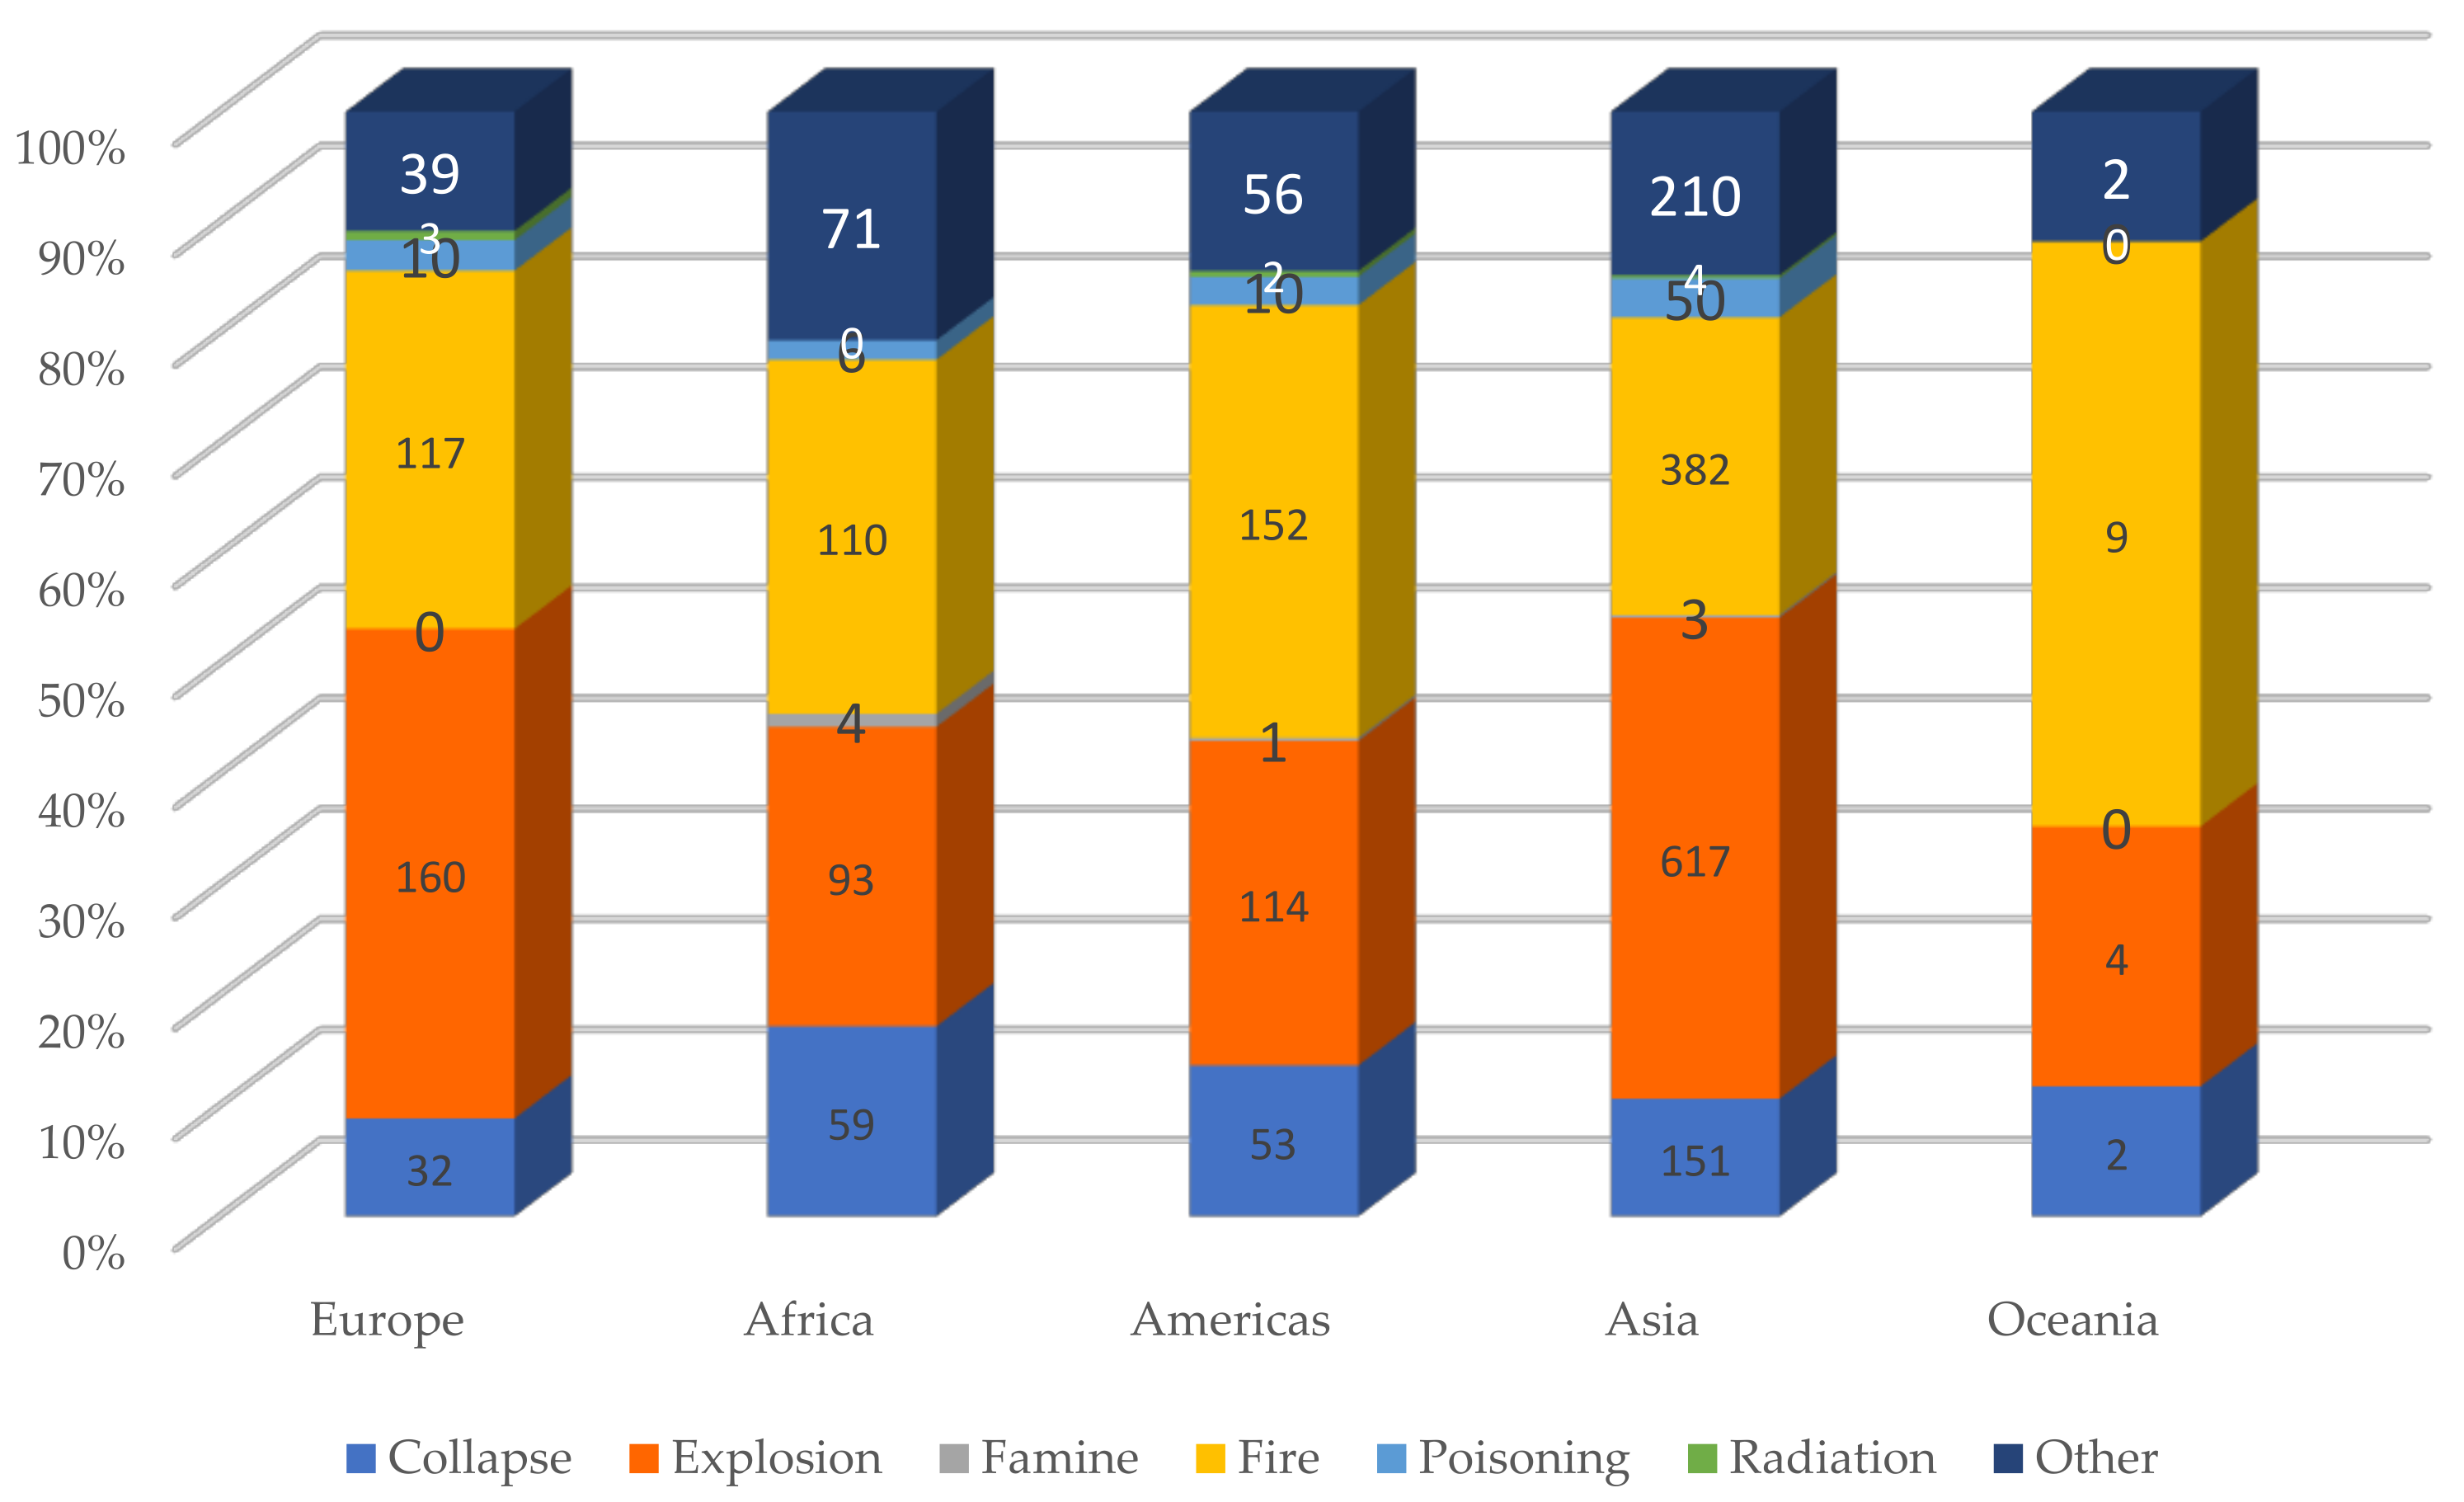
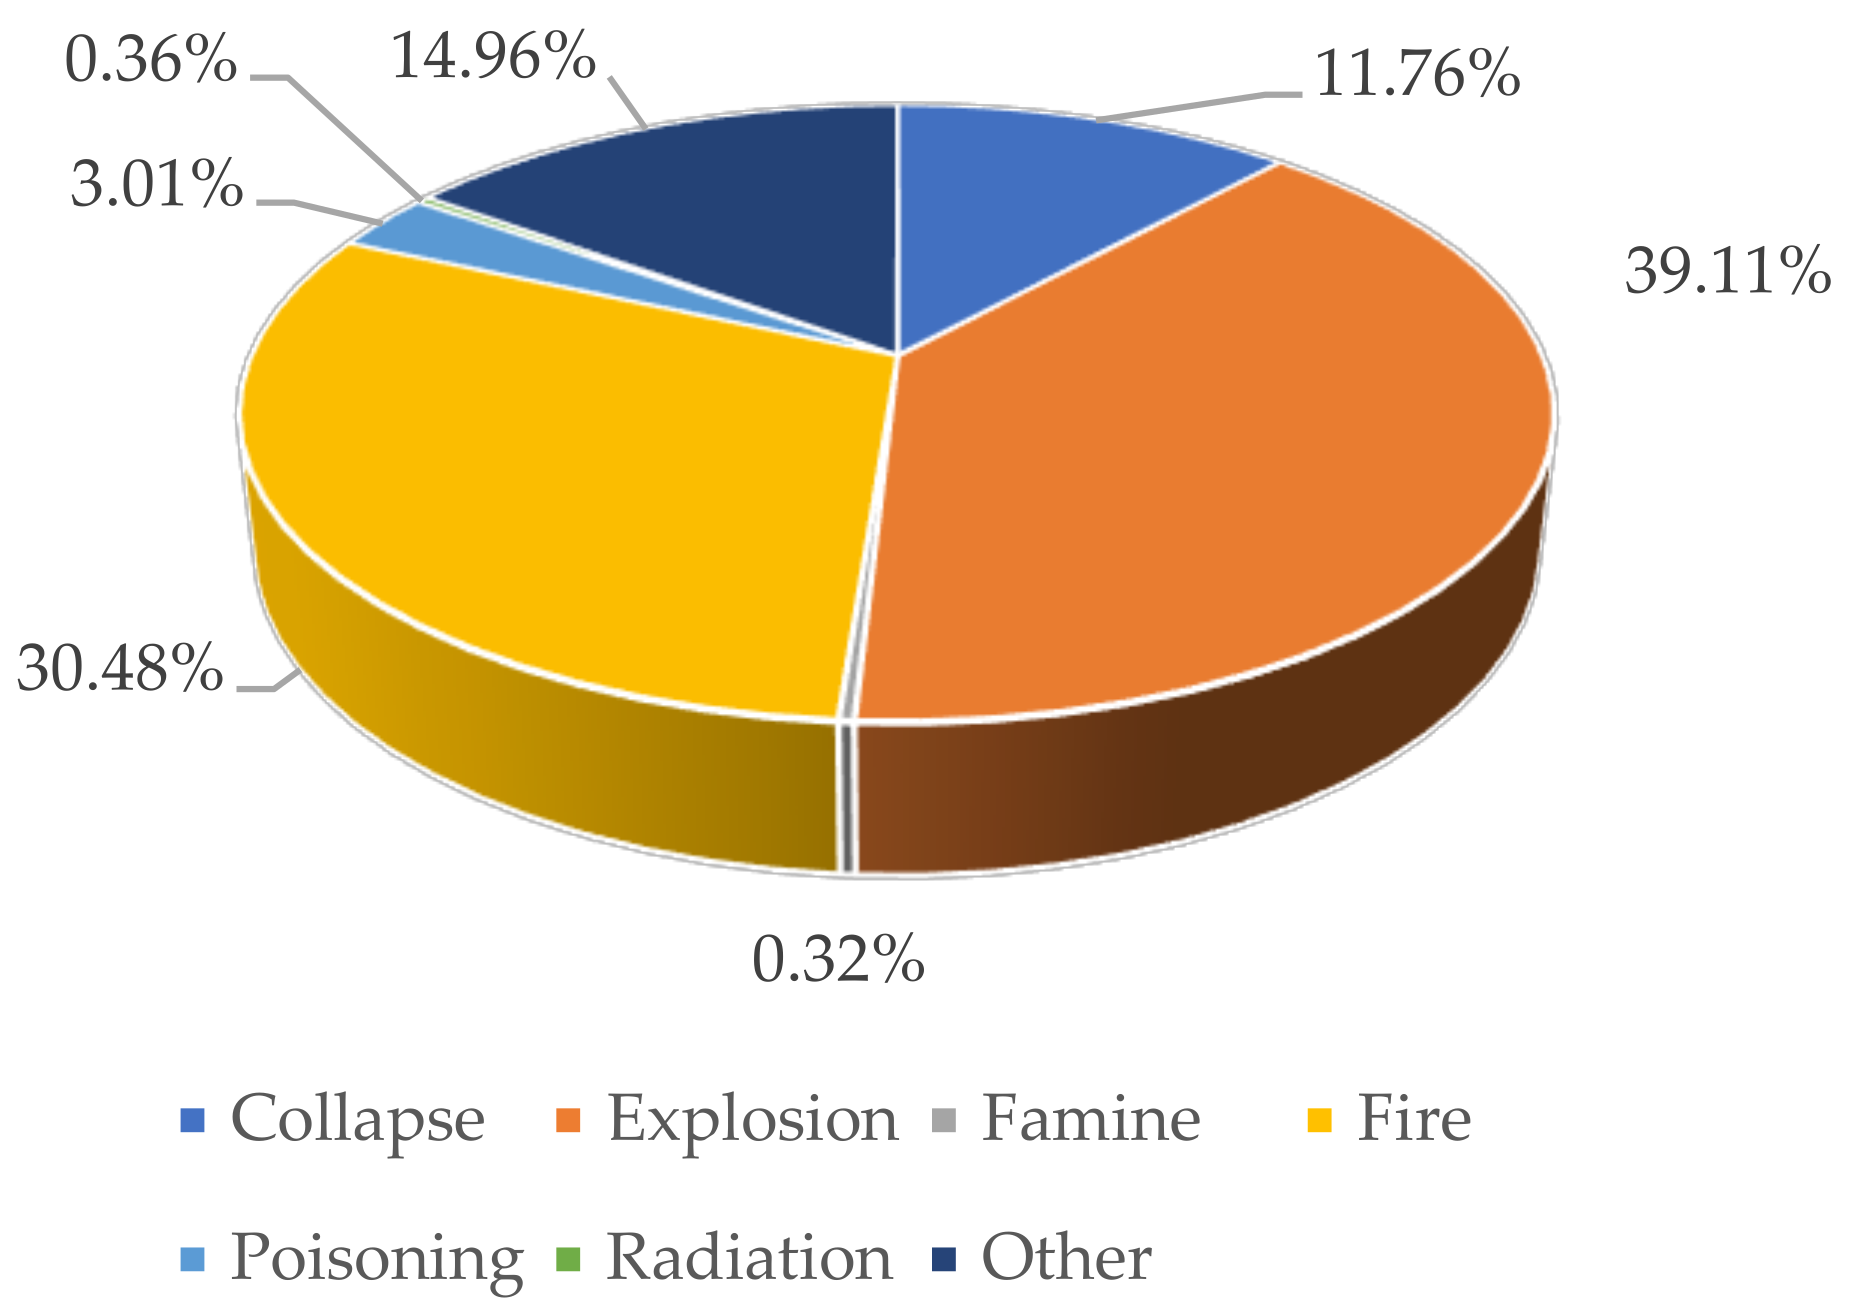
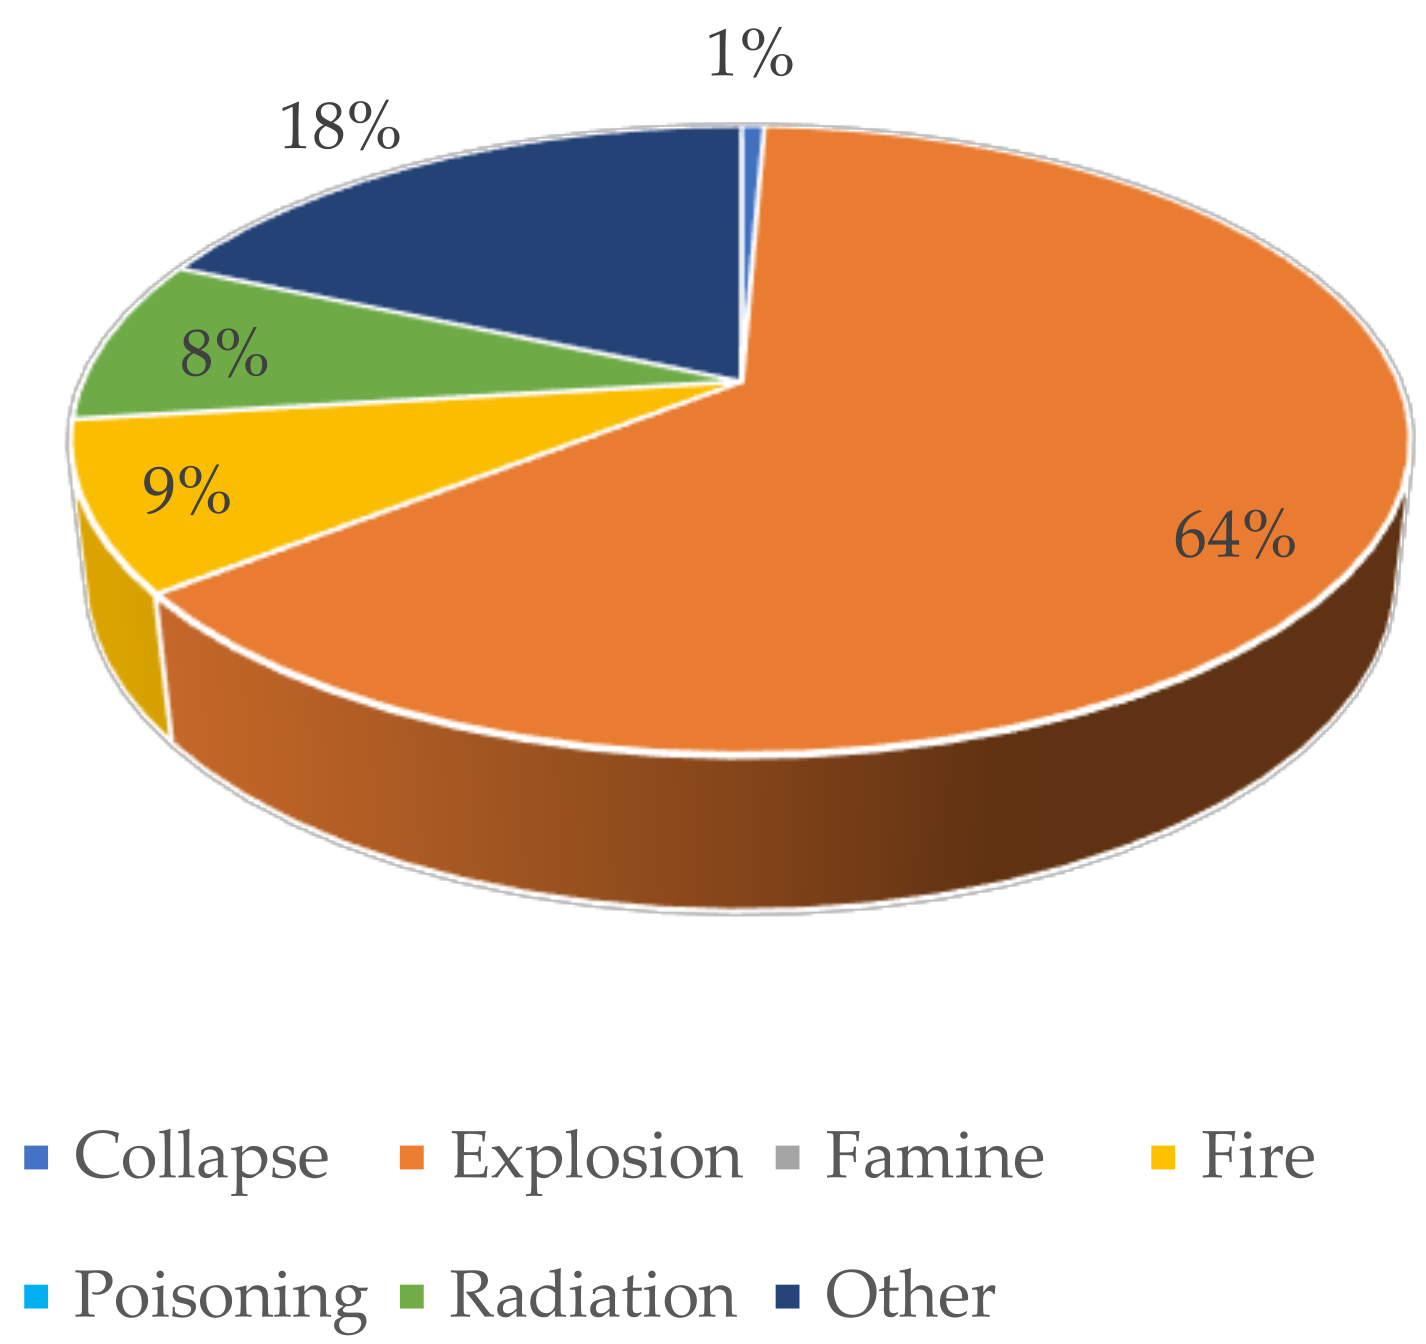
    Disaster subtype: (1) Collapse, (2) Explosion, (3) Famine, (4) Fire, (5) Poisoning, (6) Radiation and (7) Other;
    Other categorical variables: event name, country, region, continent (the variables received the following codes in SPSS: 1—Europe; 2—Africa; 3—Americas; 4—Asia; 5—Oceania), appeal (code 1 for yes; code 0 for no), declaration (code 1 for yes; code 0 for no), the US/rest of the world/continents (the variables received the following codes in SPSS: 1 for the US and 2 for the rest of the world).
  • Continuous variables: Total number of deaths, number of injured persons, number of affected persons, number of homeless persons, total number of affected persons, total damages (000 USD), total adjusted damages (‘000 USD) and CPI (Consumer Price Index).
In order to describe the data, we used descriptive statistics: for continuous variables, absolute and relative frequencies were used, and for categorical variables, the mean ± standard deviation (minimum-maximum) was used (Table 2).
In order to ensure a better granularity of the results, the database was split according to the location, disaster type and disaster subtype, and the indicators of descriptive statistics were calculated according to these sub-samples, too.
The first hypothesis of the research (H1 = There are significant differences between locations in terms of the disaster category/subtype and the damage level) was tested using inferential statistics. In order to test whether there are statistically significance differences according to the location of the event/disaster and the disaster type/subtype, we applied the chi-square bivariate test and One-way ANOVA in combination with descriptive statistics and box plots.
To verify the second research hypothesis (H2 = The damage levels and human losses from radiation/nuclear accidents are significant in the total damages registered worldwide), we performed a structural analysis by using relative frequencies and graphical representations with bar charts and pie charts, as well as descriptive statistics together with One-way ANOVA.
The third research hypothesis (H3 = There are differences between the US and the rest of the world in terms of damage levels) was also verified by using inferential statistics to test whether there are statistically significant differences according to the location (continent) of the disaster based disaster level indicators. We applied One-way ANOVA, Student’s t-test and the chi-square bivariate test together with descriptive statistics.
To validate the fourth research hypothesis (H4 = The disaster subtype is one of the best predictors of damage levels) and to determine the causal relationship between total damages (‘000 USD), total adjusted damages (‘000 USD), the total number of affected persons, number of homeless persons, disaster group, disaster type, disaster subtype, continent, appeal and declaration, we applied a multilinear regression model with the Enter method and a collinearity diagnosis using total damages (‘000 USD) (Model 1) and total adjusted damages (‘000 USD) (Model 2) as dependent variables and all of the other continuous variables as independent variables of the models. We developed a specific model for nuclear incidents (Model 3) similar to Model 1 and Model 2 with the same independent variables and total adjusted damages (‘000 USD) as the dependent variable.
We centralized the descriptive statistical indicators for the continuous variables, as presented in Table 2, according to the disaster subtype, and the results are presented as the mean ± standard deviation (minimum-maximum).
An evolution of the total number of disasters in terms of frequency is represented in Figure 1, showing the frequencies of the total number of disasters between 1900 and June 2022, while in Figure 2, we detail the distribution of all disaster subtypes per location.
For graphical representations of data/results, the SPSS 23.0 software (licensed) and Microsoft Excel were used, and a threshold of p-value < 0.05 was considered statistically significant. All these results are presented in detail in the next section.

4. Results

For the validation of the first research hypothesis (H1 = There are significant differences between locations in terms of the disaster category/subtype and damage level), we started with the results of descriptive statistics from Table 2, and we observed that nuclear incidents (radiation) represent the main category of disaster in terms of total adjusted damages (‘000 USD). The distributions of the disaster type and disaster subtype according to the location are presented in Figure 2 and Figure 3.
Further, we applied complex statistical methods to test whether there are statistically significant differences between locations of events in terms of the disaster level. The results of the chi-square bivariate test (p-value < 0.05) presented in Table 3 indicate that there are statistically significant differences among locations of events. Practically, Asia remains the continent with the biggest number of all types of disasters, 1420 of the total number of 2533 (56.06%), with 643 industrial accidents and 771 miscellaneous accidents. From the total number of nine nuclear accidents, four events were located in Asia, three were in Europe and two were registered in the Americas (radiation).
Figure 4 presents a visualization of the differences between the mean values of the total number of affected persons according to the location of the disaster. In terms of the number of affected persons, radiation surpasses the other disaster subtypes—collapse, explosion, poisoning and others—being exceeded only by famine on two continents, Africa and Asia.
Moreover, we intended to test whether there are statistically significant differences between the mean values of disaster indicators for different locations of disasters. The results of the One-way ANOVA test indicated that there were no statistically significant differences in disaster indicators according to the continent where the event occurs (Table 4), except for the disaster subtype (p = 0.053). These results confirm the second research hypothesis regarding the position and the impact of nuclear events on worldwide damages.
The results for the validation of the second research hypothesis (H2 = The damage levels and human losses from radiation/nuclear accidents are significant in the total damages registered worldwide) can be seen in Figure 5. We used the logarithmic scale for the values in order to ensure a uniform comparison of the data. It can be noticed that, even for a limited number of nine nuclear incidents, the economic and social impacts are similar in value to those of the rest of the disasters, especially for the number of affected persons, number of homeless persons, total affected persons, total damages (‘000 USD) and total adjusted damages (‘000 USD). Detailed impacts are presented in Figure 6 and Figure 7.
Concerning the specific disaster subtype radiation, the descriptive statistics indicate a total of nine incidents between 1957 and 2006 as follows: 1 in Brazil (1987), 1 in the USA (1979), 2 in China (2005 and 2006), 2 in Japan (1991 and 1999) and 3 in the Soviet Union (1957, 1985 and 1986).
Figure 6 and Figure 7 illustrate the weight of nuclear incidents in the total number of incidents. The two pie charts support the aim of the paper and research hypothesis H2: The damage levels and human losses from radiation/nuclear accidents are significant in the total damages registered worldwide according to the subtype of the disaster.
Nuclear incidents (radiation) represent only 0.36% of the total number of disasters in the analyzed period (Figure 6), but the impact (in terms of persons affected and total damages) is important, as can be seen in Figure 7. The annual impact of nuclear incidents was consistent: 61.25% for the number of homeless persons, 58.93% for total affected, 99.6% for total damages and the same percent for total adjusted damages. So, if we extrapolate and multiply by the total number of nuclear incidents, the impact becomes more important and justifies the present analysis. Additionally, we examined whether there are differences among subtypes of disasters (radiation/nuclear and all the other subtypes), and we statistically tested all visible differences from Figure 5 using One-way ANOVA (the results are summarized in Table 5). The results confirmed that there were differences between disaster subtypes (including radiation) for all disaster levels with p-value = 0.000. Practically, these results confirm the observable differences in Figure 4 and Figure 5.
For the third research hypothesis (H3 = There are differences between the US and the rest of the world in terms of damage levels), we used inferential statistics (One-way ANOVA, Student’s t-test and the chi-square bivariate test) to determine whether there are statistically significant differences between the US and the rest of the world in terms of disaster level indicators from the analysis. Because of the methodological differences in loss compensation in the US compared with the rest of the world, we split the database according to these dichotomic variables and applied the independent Student’s t-test to analyze whether there are significant differences between mean values of the disaster economic indicators for the two regions (US/rest of the world). The results are presented in Table 6 and indicate statistically significant differences (p-value < 0.05) between the US and the rest of the world only for (p-value < 0.05) total damages (‘000 USD) and total adjusted damages (‘000 USD).
The results in Table 7 indicate statistically significant differences (p-value < 0.05) between the US and the rest of the world for the disaster type, disaster subtype and declaration.
Based on the above results and according to the aim and objectives of this research, we applied different regression models to test the last research hypothesis (H4 = The disaster subtype is one of the best predictors of damage levels). We applied regression models with the Enter method to analyze the causal relationship between the total damages (Model 1)/total adjusted damages (Model 2) as dependent variables and the location of the event, disaster subtype, appeal and declaration as independent variables of the models. We constructed three models and decided to use only the statistically significant models with p < 0.05 for ANOVA and R ≅ 0.700. Because nuclear disasters are technological disasters according to the disaster subgroup and because of the sufficiency of data only for this group of disasters, we limited the regression modeling to this subgroup of disasters (Model 3 for nuclear events only). All statistics for these models are presented below (Table 8, Table 9 and Table 10). For the categorical variable “continent”, included in the models as an independent variable, the statistical software used (SPSS) allows the codification as follows: code 1 for Europe, code 2 for Africa, code 3 for Americas, code 4 for Asia and code 5 for Oceania. The results were then interpreted accordingly to determine whether the continent is a good predictor in one of the three models.
The values of the determinant coefficient R2 indicate that only around 50% of the variance in the dependent variable for all three models is explained by the independent variables, but the regression models are statistically significant (only for Model 1, p-value = 0.059 ≅ 0.05, according to Table 9).
The results in Table 10 indicate that only the disaster subtype and declaration are good predictors of total damages (‘000 USD) and total adjusted damages (‘000 USD) for all disaster events registered between 1900 and 2022 but also for total adjusted damages (‘000 USD) for the specific disaster subgroup Technological (p-value < 0.100).
So, according to the data in Table 10, the models’ equations are (Equation (1) for Model 1, Equation (2) for Model 2 and Equation (3) for Model 3):
Total damages (‘000 USD) = −765,599.935 − 1,599,292.472 Disaster Type + 1,607,841.310 Disaster subtype −
156,461.735 Continent + 4,591,482.982 Appeal + 9,621,794.993 Declaration
Total adjusted damages (‘000 USD) = −1,158,303.099 − 2,378,530.385 Disaster Type + 2,426,867.565 Disaster
subtype − 265,597.392 Continent + 6,944,480.257 Appeal + 11,910,570.530 Declaration
Total adjusted damages (‘000 USD) nuclear = −1,544,446.643 − 1,290,727.859 Continent + 4,901,334.990
Appeal + 14,205,136.041 Declaration + 1,821,087.090 Disaster subtype
Only two variables have statistically significant contributions to explaining the causality of the final effects on total damages (‘000 USD) and total adjusted damages (‘000 USD) for all three models. The most important contributions are (from the most important to the least important contributions):
  • For Models 1 and Model 2, the declaration, the disaster subtype, the disaster type and appeal;
  • For Model 3 (nuclear incidents), the declaration, the disaster subtype, the disaster type, continent and appeal.
To understand how much influence the independent variables have on the dependent one, total damages or total damage adjusted, we can look at the regression coefficients from Equations (1) to (3):
  • Equation (1): With an increase of 1 unit code of the disaster subtype (1—collapse, 2—explosion, 3—famine, 4—fire, 5—poisoning, 6—radiation, 7—other), the total damages (‘000 USD) increase by 1,607,841.310 (‘000 USD); with an increase of 1 unit code of the declaration (0—no, 1—yes), the total damages (‘000 USD) increase by 9,621,794.993 (‘000 USD).
  • Equation (2): With an increase of 1 unit code of the disaster subtype (1—collapse, 2—explosion, 3—famine, 4—fire, 5—poisoning, 6—radiation, 7—other), the total adjusted damages (‘000 USD) increase by 2,426,867.565 (‘000 USD); with an increase of 1 unit code of the declaration (0—no, 1—yes), the total adjusted damages (‘000 USD) increase by 11,910,570.530 (‘000 USD).
  • Equation (3): With an increase of 1 unit code of the disaster subtype (1—collapse, 2—explosion, 3—famine, 4—fire, 5—poisoning, 6—radiation, 7—other), the total adjusted damages (‘000 USD) increase by 1,821,087.090 (‘000 USD); with an increase of 1 unit code of the declaration (0—no, 1—yes), the total adjusted damages (‘000 USD) increase by 14,205,136.041 (‘000 USD).

5. Discussion

From an economic point of view, the nuclear liability regime is rather simple, no matter the approach (American or European), whereas, from a legal point of view, nuclear plants must identify measures to maximize prevention by internalizing their costs—such as compliance with safety regulations. Without the full exposure of the total potential cost (both direct and indirect, in terms of property and third-party liability), operators will find ways to exempt themselves from the actual coverage of the losses incurred and would require subsidies from their governments. This is the rationale of the US regime for holding the nuclear operator fully liable in case of an incident caused by their activity. As in other catastrophic cases, the government’s intervention would only diminish the focus of nuclear operators by taking care of all the claims arising from their activity. Even though there are differences in the compensation systems applicable at the national level, depending on the location of the disaster, the risk-based system of public funds (financed by risk-based premiums paid by operators) is the only feasible solution in the long run.
According to the strict liability rule, the amount of compensation must be equal to the real losses to the victim caused by the nuclear operator, which sometimes may become problematic, as the total assets of the operator might prove to be insufficient for the coverage, hence the requirement for a minimum compulsory insurance policy. In addition, the extra protection offered by the supplementary compensation regime would offer certain coverage. The most important issue is related to the estimates of the costs of a nuclear incident, and a difficulty arises when establishing an accurate probability of occurrence. The international forums present different scales of estimates—between USD 10 and 100 billion (for example, the Fukushima costs were estimated at USD 34.02 billion, including decommissioning and damage compensation costs).
Taking into consideration the financial limit of the individual operator’s liability, the supplementary layer of compensation offered by nuclear pools could be used as an excuse for lowering compliance with safety measures; nevertheless, this is not the situation, as the contribution paid to the pool depends on the loss history of the operator so that any misbehavior will be sanctioned in the following contribution to the pool. The increase or decrease in premiums paid by nuclear operators to mutual insurance companies is highly dependent on the location, type of reactor, capacity, reactor performance and past statistics of the operator.
The historical data on nuclear incidents and also concerns for the advanced age of NPPs in Europe, which determines waste management situations, increased international efforts to design and implement practical solution projects that would improve radioactive waste governance. These efforts are supported by public institutions (governments, non-governmental organizations), local communities and academic experts as viable, and efficient decisions must be taken for the arising scenario of nuclear waste. Coping with community needs and expectations and increasing society’s awareness of radioactive waste management at the national or regional level are some of the objectives of projects undergoing approval. Based on the ambiguous effects of such a project, the continuous interaction of all stakeholders is the primary solution to waste management; there is definitely a need for networking between local authorities (processes), institutions (procedures, notifications) and society in general.
At the international level, based on mutual agreements among countries, precautionary measures must be implemented as early as the design of a new NPP in order to ensure that waste management does not become a financial burden for future generations. The old NPPs in the US are considered hotspots under revision by the international community, as contagion risk is high, and large groups of the population would suffer in case of a waste management incident. The insurance industry is focused on accurately estimating the maximum possible loss in case of such incidents and further modifying the tariff quota for future insurance policies. On the other hand, the international forms of loss coverage are focused on better estimating the long-term effects of nuclear incidents (take a look at the long-term health compensation requests arising from 11 September 2001 from those who were present at the scene after the actual event took place).
As seen in the research described above, the main determinants of the total damage are the disaster type, disaster subtype, declaration and location. Differences in the type of funding implemented at the worldwide level are statistically significant in the relationship between the total damages and the factors used in the models. There is no universal solution and no unitary approach to cover the damages incurred by nuclear power plants (NPPs) that could be used by all countries; this is the reason that the results of the regression models are statistically significant. Each financing approach has its own benefits, and interest in becoming members of nuclear pools and mutual insurers, no matter the location of the NPPs, is one method to fill this gap.
Concerning the statistical analysis, it is important to remark upon the differences among the disaster subtypes and locations based on the results of descriptive statistics according to the disaster subtype and the distribution of the disaster subtype per location. Our results confirm that, in recent decades, there has been an exponential increase in the number of events due to various causes [58].
To determine whether these results are statistically significant, especially for nuclear disasters, according to the aim and research objectives of this paper, we applied a series of statistical methods, with the following main research results (summarized in Table 11 for each research hypothesis):
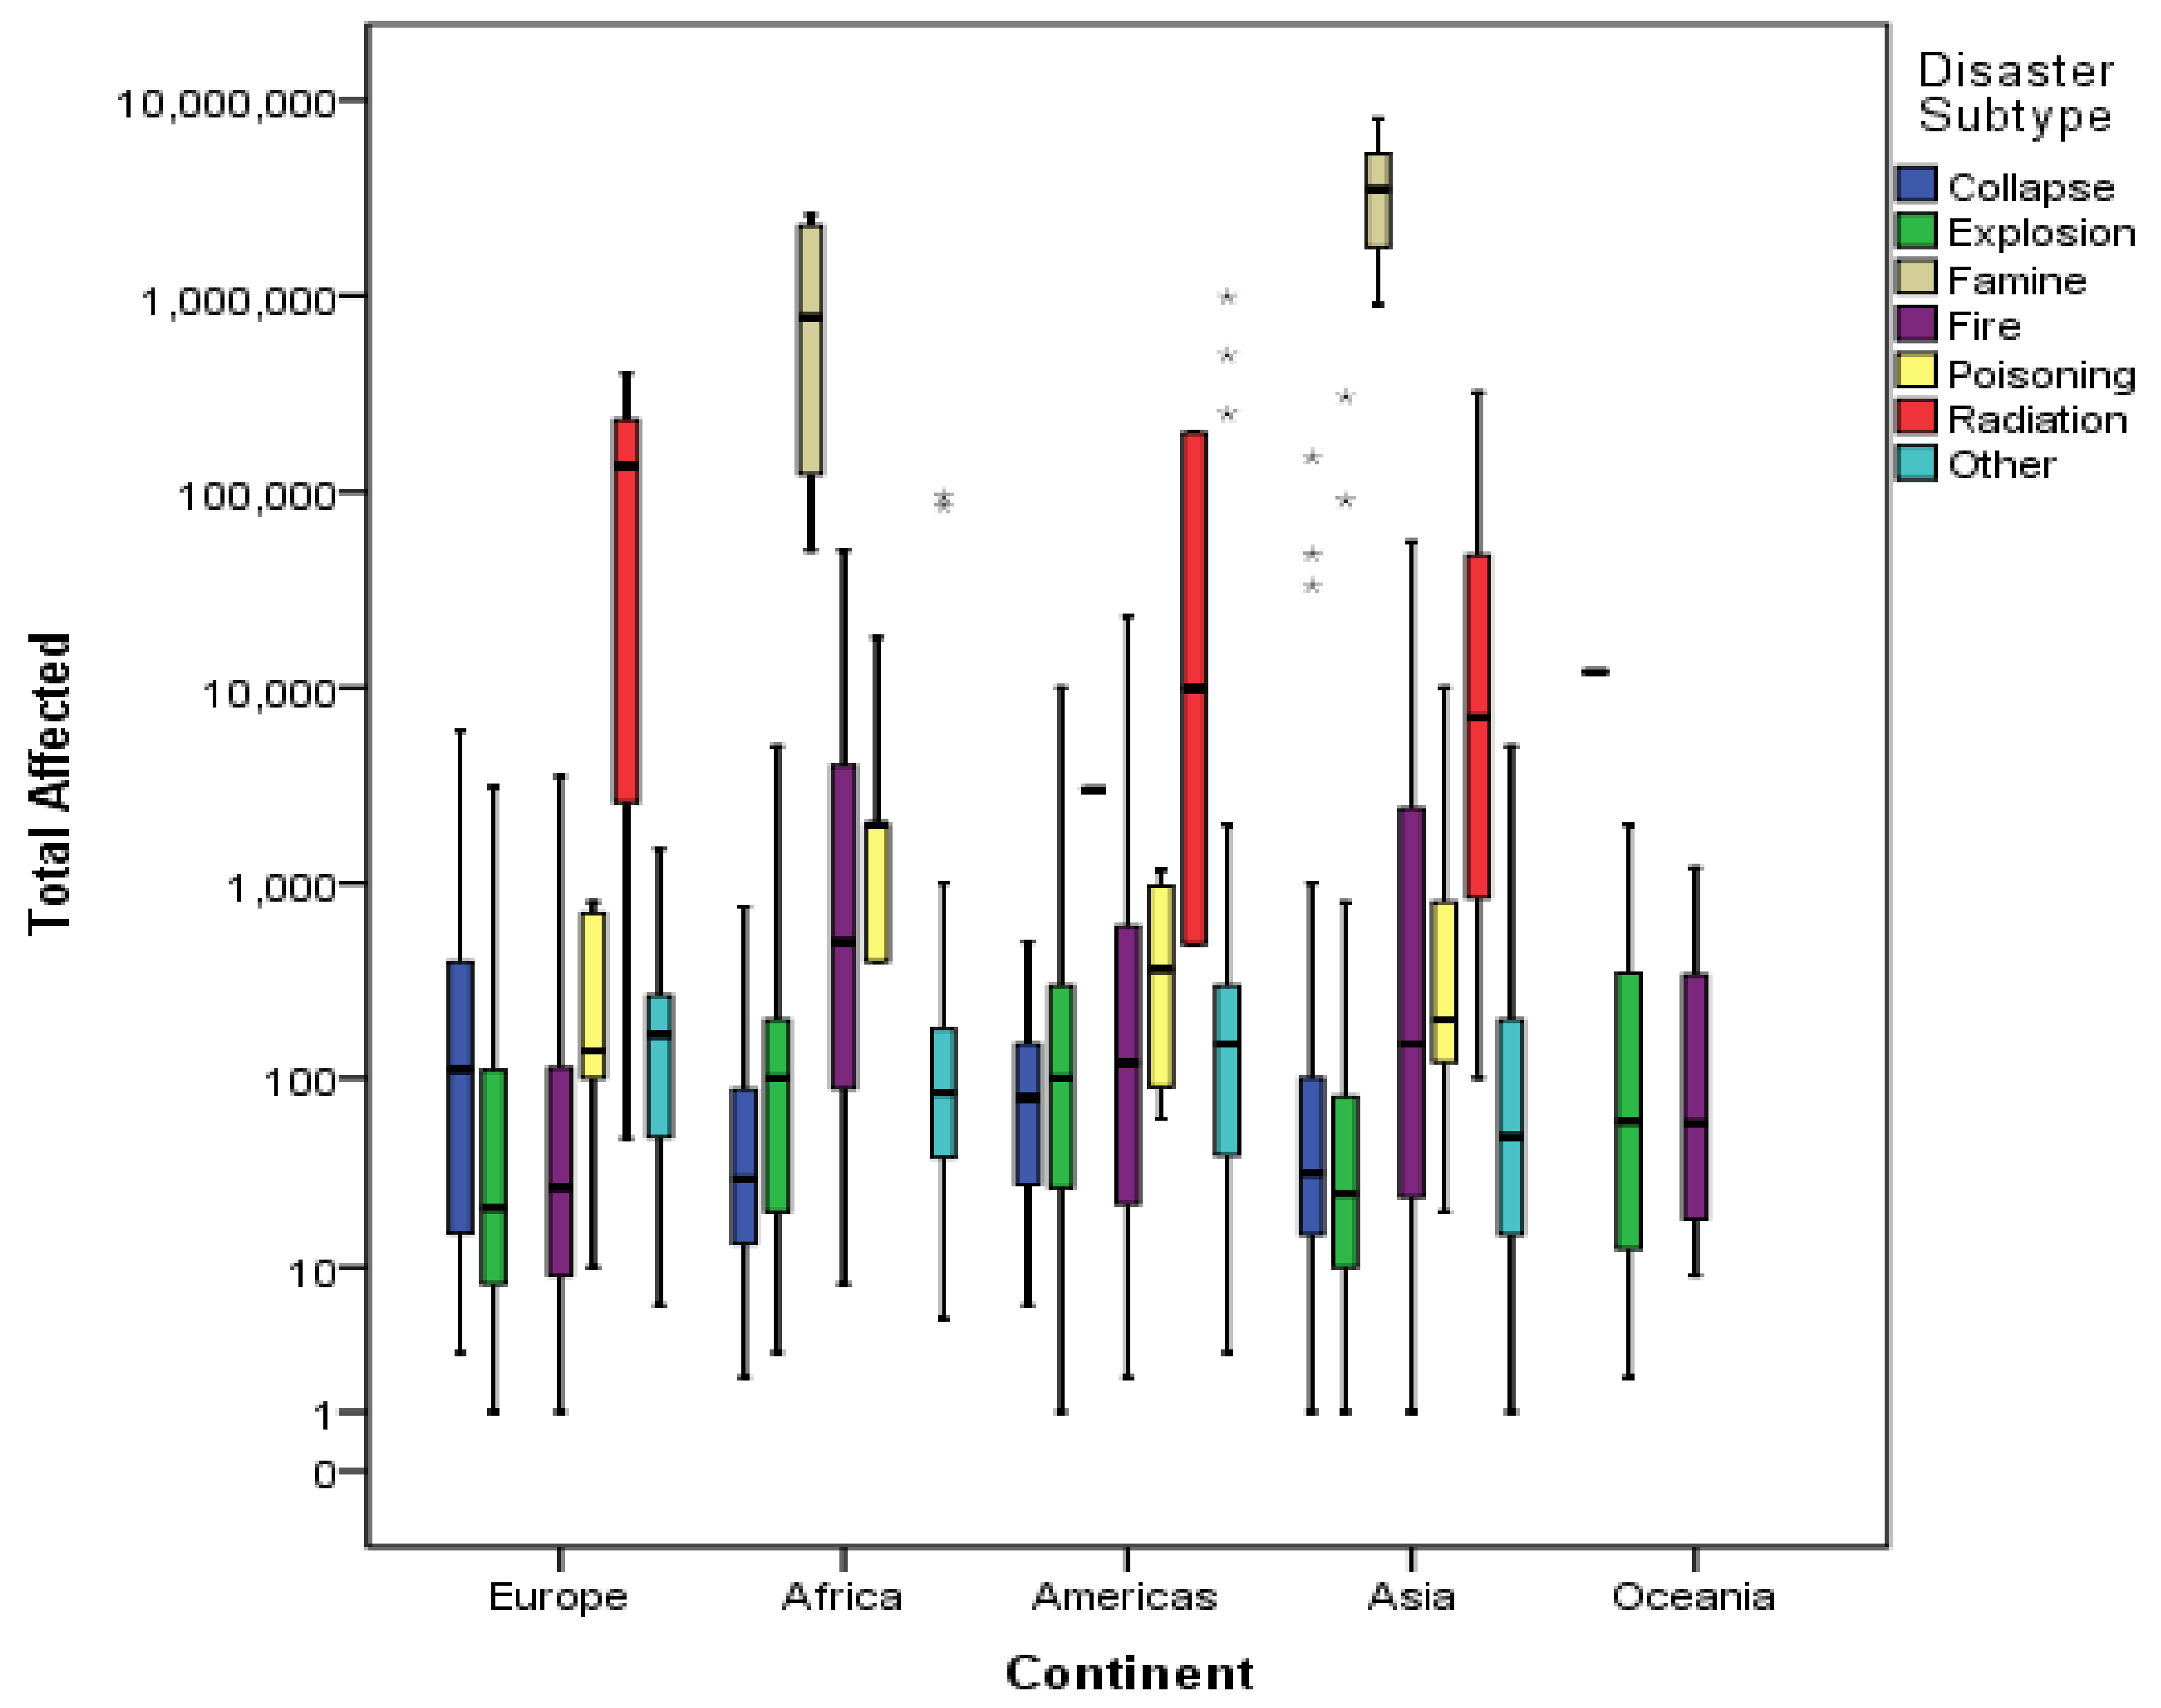
  • The chi-square bivariate test emphasizes that there are statistically significant differences between locations (continents) of disasters in terms of the disaster subtype and disaster type (p-value = 0.000) and partially confirms hypothesis H1;
  • One-way ANOVA for disaster grouping by continent shows that there are no statistically significant differences in the mean values of the main disaster indicators, except for the disaster subtype, and therefore partially confirms hypothesis H1.
  • One-way ANOVA for grouping by disaster subtype stresses the statistically significant differences in all disaster indicators and, together with the results of descriptive statistics, confirms research hypothesis H2.
  • By comparing the US with the rest of the world, through Student’s t-test, for all disaster indicators (the continuous variables only), we found that there are statistically significant differences only for total damages (‘000 USD) and total adjusted damages (‘000 USD), and therefore, research hypothesis H3 is partially confirmed.
  • By comparing the US with the rest of the world, through the chi-square bivariate test, for all the categorical variables linked to the disaster level, we found that there are statistically significant differences only for the disaster type, disaster subtype and declaration, and therefore, research hypothesis H3 is partially confirmed.
  • The regression models with the Enter method verified the best predictors for total damages (Model 1) and total adjusted damages (Model 2), taking into consideration all types of disasters. For nuclear disasters, the regression model tested total adjusted damages as the dependent variable in Model 3; according to the results, the best predictors are the declaration and the disaster subtype, with research hypothesis H4 being confirmed.
Regarding the limitations of the research, (1) in the case of Constantini [27] or Pukala [35], access to the series of data in the nuclear operator’s history of incidents and in the international databases of nuclear pools is somewhat limited, and therefore, it is difficult to ensure the consistency of the results; (2) further efforts and follow-up should be carried out in order to eliminate certain biases of the research.
For future research, the authors intend to extend the database by taking into consideration indexes referring directly to nuclear waste management costs, which are obviously higher than previously assumed [30], cost estimations (lifecycle cost analyses) and an early assessment of waste management [59]. Due to the accelerated pace at which technological solutions are adopted for risk management (insurance industry), digital instrument and control systems are being deployed in nuclear power plants (NPPs) for both existing and advanced reactor designs [60], and a new trend in risk assessment for NPPs from a cyber risk assessment perspective is indicated.

6. Conclusions

Nuclear energy remains one of the most efficient ways to provide the necessary production quantities for an economy, despite the obvious risks (in the short term but also in the long term) associated with the operation of a nuclear plant. Recent academic papers extensively address radioactive waste management in the case of NPPs in the context of a circular economy, the energy crisis, the lifecycle of nuclear energy, the population’s fear of nuclear accidents in NPPs or the real and presumed benefits of nuclear energy. Regarding radioactive waste management, IAEA assists member states in establishing a proper safety framework for the management of radioactive waste and spent fuel [38], including waste minimization. As a feasible alternative energy for any country, nuclear energy may still be the solution to reduce costs to the population or industries and also to improve the carbon footprint of energy. There are countries that are reluctant to implement such a solution, even though there are limited costs associated with the production and transportation of energy by a nuclear plant.
Through our approach to the paradox of NPPs between high-efficiency energy and radioactive waste management concerns in the context of disasters worldwide, we emphasize the statistical differences by the location of the disaster and the disaster subtype, including radiation near the collapse, explosion, famine, fire, poisoning and other disasters during the last 100 years (1901–June 2022). Using big data (2533 registrations from EM-DAT CRED), together with inferential statistics, we found the best predictors of total damages (‘000 USD) and total adjusted damages (‘000 USD) overall for all types of disasters, including nuclear. Practically, the disaster subtype and declaration are the best predictors, showing that with an increase of 1 unit code of the disaster subtype (1—collapse, 2—explosion, 3—famine, 4—fire, 5—poisoning, 6—radiation, 7—other), the total adjusted damages (‘000 USD) rise by 1,821,087.090 (‘000 USD), and with an increase of 1 unit code of the declaration (0—no, 1—yes), the total adjusted damages (‘000 USD) increase by 14,205,136.041 (‘000 USD). These values of the regression coefficient practically suggest that nuclear disasters represent 75% of disasters worldwide in terms of total damages and total adjusted damages. In this context, the availability of nuclear energy is still questionable. Therefore, used nuclear fuel may be treated as a resource or simply as waste [3], but there are opinions regarding the economic advantages of building nuclear power plants (NPPs) and the consumption of nuclear energy, such as:
  • The amount of waste generated by nuclear power is very small relative to other thermal electricity generation technologies [3];
  • Nuclear waste is neither particularly hazardous nor hard to manage relative to other toxic industrial wastes [3,37];
  • It can lead to the rapid expansion of renewable technologies [29].
Regarding the disadvantages of nuclear energy, the main concerns are linked to:
  • Radioactive waste classified as HLW is a concern [3], but the majority of waste produced by NPPs is classified as low-level waste (LLW) and very-low-level waste (VLLW);
  • Greenhouse gas emissions associated with the nuclear lifecycle are notable, and reactors and waste storage sites can degrade land and the natural environment [29];
  • The models of Wheatley et al. [19] suggest that there is currently a 50% chance that a Fukushima event (or larger) occurs every 60–150 years [19];
  • Modern nuclear reactors are prone to accidents [29].
Despite the controversy of this subject, steps have been taken over the years to improve the security of this process toward third parties in the form of coverage offered either by governments or private entities. Starting in the 1960s, several nuclear damage compensation schemes were implemented around the world, each providing benefits and having limitations. This article presents the key elements of the US vs. European approaches to nuclear loss coverage, expressing the importance of understanding the prescription period, strict liability, retrospective premiums, liability limits and the distinction between direct losses and indirect losses (decommissioning). The year 2017 was the year with the largest unsecured loss as a result of natural disasters in history, reaching USD 180 billion. Protection schemes to cover the financial protection deficit have the same goal—to be a strategic response solution by providing the funds needed for natural disaster recovery. From an organizational point of view, there are considerable differences: governance; the number of covered risks; risk solution; method of financing; or combinations of these [61].
This work is based on a quantitative analysis of losses incurred over a period of 121 years caused by different disaster-type events around the world—in terms of incurred losses, insured losses, number of deaths, number of affected persons, number of homeless persons, total affected persons, total damages and total adjusted damages. The series of statistical methods applied supported (1) the significant impact of nuclear events on total disaster damages and the differences and (2) the statistically significant differences between two types of compensations, the US and the rest of the world, which reasonably justify the different approaches to insuring nuclear plants in case of a disaster in the US versus the rest of the world. The objective of the analysis was to evaluate whether nuclear incidents were sufficiently documented in order to establish the sufficiency of the currently existing protection schemes (including insurance solutions) for the producers of energy and for the population.
This article presents a statistical analysis of past damages incurred in nuclear plants and researches the extent of insurance benefits in this regard for a better understanding of alternatives to be found if an incident occurs, and there is a deficit in covering nuclear losses—as prevention is better than reduction as a risk management technique. As far as the concept of risk management is concerned, it is internationally recognized that, in the insurance industry, broad principles should be embedded into a risk management framework that cover the strategy, organizational structure, policies and procedures related to the management of implicit risks [62].
The main limitation of this research is linked to the important number of missing values from the EM-DAT CRED database, making it impossible to find the best predictors through the regression model for NPPs. Moreover, missing values from historical data made it impossible to perform a specific comparison of the United States with the rest of the world according to local conventions for compensation coverage.
Our results emphasize important aspects of general incidents (including nuclear disasters) and reveal that declaration, the disaster type and the disaster subtype are the best predictors of total damages. These results, which are statistically significant, are important inputs for the evaluation of cost and insurance coverage for different types of disasters and, more specifically, for nuclear disasters. Despite these rare incidents, nuclear energy is still one of the most important forms of energy that can be used as long as compliance with production and transportation security and waste management is met (see the most recent situation with the Zaporije nuclear plant in September 2022). Our results highlight not only the associated risks of radioactive waste management but also the long-time consequences of NPP incidents.

Author Contributions

Conceptualization, L.E.N., N.S.P. and M.R.G.; methodology, M.R.G.; software, M.R.G.; validation, L.E.N., N.S.P. and M.R.G.; formal analysis, M.R.G.; investigation, L.E.N. and N.S.P.; resources, L.E.N. and N.S.P.; data curation, M.R.G.; writing—original draft preparation, L.E.N., N.S.P. and M.R.G.; writing—review and editing, L.E.N., N.S.P. and M.R.G.; visualization, L.E.N., N.S.P. and M.R.G.; supervision, L.E.N. All authors have read and agreed to the published version of the manuscript.

Funding

This research received no external funding.

Data Availability Statement

Not available.

Conflicts of Interest

The authors declare no conflict of interest.

References

  1. Pavlova-Marciniak, I. Nuclear power engineering development in Poland—New challenges. Prz. Elektrotechniczny 2009, 85, 216–219. [Google Scholar]
  2. Suh, J.W.; Sohn, S.Y.; Lee, B.K. Patent clustering and network analyses to explore nuclear waste management technologies. Energy Policy 2020, 146, 111794. [Google Scholar] [CrossRef]
  3. World Nuclear Association. Radioactive Waste Management (Update January 2022). Available online: https://world-nuclear.org/information-library/nuclear-fuel-cycle/nuclear-wastes/radioactive-waste-management.aspx (accessed on 9 March 2023).
  4. Kremser, H. Constitutional provisions—Peaceful use of nuclear energy and management of radioactive waste. ATW Int. J. Nucl. Power 1996, 41, 309–311. [Google Scholar]
  5. Winter, U. Glockle, W. Provisions for nuclear damage the existing safety philosophy. ATW Int. Z. Fuer Kernenerg. 2001, 46, 17–24. [Google Scholar]
  6. Păvălașcu, N.; Gabor, M.R. Disaster risk management: Management framework and technical process of settling disaster damage claims. Acta Marisiensis. Seria Oeconomica 2020, 14, 1–12. [Google Scholar] [CrossRef]
  7. European Commission. A Framework Strategy for a Resilient Energy Union with a Forward-Looking Climate Change Policy. 2015. Available online: https://www.eea.europa.eu/policy-documents/com-2015-80-final (accessed on 28 August 2022).
  8. Gralla, F.; John, B.; Abson, D.J.; Møller, A.P.; Bickel, M.; Lang, D.J.; von Wehrden, H. The role of sustainability in nuclear energy plans-What do national energy strategies tell us? Energy Res. Soc. Sci. 2016, 22, 94–106. [Google Scholar] [CrossRef]
  9. Trontl, K.; Pevec, D.; Matijevic, M. Radioactive waste management in Croatia—public opinion, legal framework, and policy. Energy Policy 2020, 146, 111804. [Google Scholar] [CrossRef]
  10. Kyne, D. Public Exposure to US Commercial Nuclear Power Plants Induced Disasters. Int. J. Disaster Risk Sci. 2015, 6, 238–249. [Google Scholar] [CrossRef] [Green Version]
  11. Lipscy, P.Y.; Kushida, K.E.; Incerti, T. The Fukushima Disaster and Japan’s Nuclear Plant Vulnerability in Comparative Perspective. Environ. Sci. Technol. 2013, 47, 6082–6088. [Google Scholar] [CrossRef]
  12. Milosevic, Z.; Veskovic, M.; Markovic, S.B. Using natural disasters to instigate radical policy changes—the effect of Fukushima nuclear power plant accident on nuclear energy policies. Acta Geogr. Slov. Geogr. Zb. 2013, 53, 182–189. [Google Scholar]
  13. Follert, F.; Gleißner, W.; Möst, D. What Can Politics Learn from Management Decisions? A Case Study of Germany’s Exit from Nuclear Energy after Fukushima. Energies 2021, 14, 3730. [Google Scholar]
  14. Hubbard, C. Fukushima and Beyond: Nuclear Power in a Low-Carbon World; Routledge: New York, NY, USA, 2014. [Google Scholar]
  15. Kosai, S.; Yamasue, E. Recommendation to ASEAN nuclear development based on lessons learnt from the Fukushima nuclear accident. Energy Policy 2019, 129, 628–635. [Google Scholar] [CrossRef]
  16. Ming, Z.; Yingxin, L.; Shaoje, O.; Hui, S.; Chunxue, L. Nuclear energy in the Post-Fukushima Era: Research on the developments of the Chinese and worldwide nuclear power industries. Renew. Sustain. Energy Rev. 2016, 58, 147–156. [Google Scholar] [CrossRef] [Green Version]
  17. Radu, N.; Naghi, L.E. Catastrophic risk modelling—residential and nonresidential exposure. J. Financ. Stud. 2020, 8, 96–112. [Google Scholar]
  18. EM-DAT The International Disaster Database—Center for Research of Epidemiology of Disaster, UCLouvain 2022. Available online: https://public.emdat.be/ (accessed on 20 June 2022).
  19. Wheatley, S.; Sovacool, B.; Sornette, D. Of Disasters and Dragon Kings: A Statistical Analysisof Nuclear Power Incidents and Accidents. Risk Anal. 2017, 37, 99–115. [Google Scholar] [CrossRef] [PubMed]
  20. Jang, S.; Park, S.; Jae, M. Development of an Accident Sequence Precursor Methodology and its Application to Significant Accident Precursors. 13th International Conference on Probabilistic Safety Assessment and Management (PSAM). Nucl. Eng. Technol. 2017, 49, 313–326. [Google Scholar] [CrossRef]
  21. Ogawa, T.; Minato, K.; Nishihara, K. Nuclear energy and waste management—pyroprocess for system symbiosis. In Proceedings of the 7th International Symposium on Molten Salts Chemistry and Technology/Workshop on Nuclear Energy and Nuclear Wastes, Dresden, Germany, 15 January 2007; Volume 360, pp. 12–15. [Google Scholar]
  22. Matyaba, T.; Keche, P.; Tandlich, R. Radioactive Waste Management in South Africa. In Proceedings of the 1st Euro-Mediterranean Conference for Environmental Integration (EMCEI), Recent Advances in Environmental Science from the Euro-Mediterranean and Surrounding Regions, 1 & 2, Sousse, Tunisia, 22–25 November 2018; pp. 1009–1012. [Google Scholar]
  23. Zhang, M.; Takeda, M.; Watanabe, Y. Nuclear Energy and the Management of High-Level Radioactive Waste in Japan. J. Hydrol. Eng. 2009, 14, 1208–1213. [Google Scholar] [CrossRef]
  24. Powell, R.R.; Robinson, M.G.; Pankratius, W. Toward a global understanding of nuclear-energy and radioactive-waste management. Int. J. Sci. Educ. 1994, 16, 253–263. [Google Scholar] [CrossRef]
  25. Alwaeli, M.; Mannheim, V. Investigation into the Current State of Nuclear Energy and Nuclear Waste Management-A State-of-the-Art Review. Energies 2022, 15, 4275. [Google Scholar] [CrossRef]
  26. Puscasu, G.M. Radioactive waste management: Societal challenges in the era of green nuclear energy. In Proceedings of the 16th International Conference on Business Excellence (ICBE)—New Challenges of the Century—Digital Economy and the Green Revolution, August, International Conference on Business Excellence, Bucharest, Romania, 24–26 March 2022; Volume 16, pp. 1205–1218. [Google Scholar]
  27. Costantini, V.; Martini, C. The causality between energy consumption and economic growth: A multi-sectoral analysis using non-stationary cointegrated panel data. Energy Econ. 2010, 32, 591–60328. [Google Scholar] [CrossRef] [Green Version]
  28. Chovancová, J.; Vavrek, R. Decoupling Analysis of Energy Consumption and Economic Growth of V4 Countries. Probl. Ekorozw. Probl. Sustain. Dev. 2019, 14, 159–165. [Google Scholar]
  29. Sovacool, B.K. A Critical Evaluation of Nuclear Power and Renewable Electricity in Asia. J. Contemp. Asia 2010, 40, 369–400. [Google Scholar] [CrossRef]
  30. Barron, R.W.; Hill, M.C. A wedge or a weight? Critically examining nuclear power’s viability as a low carbon energy source from an intergenerational perspective. Energy Res. Soc. Sci. 2019, 50, 7–17. [Google Scholar] [CrossRef]
  31. Bacher, P. Nuclear energy: Obstacles and promises. Comptes Rendus Geosci. 2003, 335, 603–610. [Google Scholar] [CrossRef]
  32. Zueehetti, M.; Alberghi, C.; Testoni, R. Environmental and safety studies for advanced nuclear energy systems, in the frame of a sustainable European Union energy programme. In Proceedings of the 20th International MESAEP Symposium on Environmental Pollution and its Impact on Life in the Mediterranean Region, Athens, Greece, 26–27 October 2022; Volume 31, pp. 8461–8467. [Google Scholar]
  33. Kasperski, T.; Stsiapanau, A. Trust, distrust and radioactive waste management in contemporary Russia. J. Risk Res. 2022, 25, 648–665. [Google Scholar] [CrossRef]
  34. Volkanovski, A.; Gjorgiev, B. Renewable sources impact on power system reliability and nuclear safety. In Proceedings of the European Safety and Reliability Conference (ESREL), Safety and Reliability: Methodology and Application, Zurich, Switzerland, 7–10 September 2015; pp. 57–63. [Google Scholar]
  35. Pukala, R.; Kirillova, N.; Dorozhkin, A. Insurance instruments in estimating the cost energy assets with renewable energy sources. Energies 2021, 14, 3672. [Google Scholar] [CrossRef]
  36. European Commission. Overview of the European Energy System. 2021. Available online: https://www.eea.europa.eu/data-and-maps/indicators/overview-of-the-european-energy-system-3 (accessed on 16 August 2022).
  37. Liu, J.; Wei, F.X. Waste Management Strategy for the Nuclear Energy Cycle: Evidence from Coastal Nuclear Power Plants. J. Coast. Res. 2019, 94, 73–77. [Google Scholar] [CrossRef]
  38. The International Atomic Energy Agency. Available online: https://www.iaea.org/topics/processing (accessed on 9 March 2023).
  39. Shestopalov, V.; Shybetskyi, I. Ukraine: Experience of Radioactive Waste (RAW) Management and Contaminated Site Clean-up. Radioactive Waste Management and Contaminated Site Clean-up: Processes, Technologies and International Experience; Elsevier: Amsterdam, The Netherlands, 2013; Volume 48, pp. 386–414. [Google Scholar]
  40. Strupczewski, A. Accident risks in nuclear-power plants. In Proceedings of the 9th International Energy Conference (Energex 2002), Cracow, Poland, 19–24 May 2002; Volume 75, pp. 81–88. [Google Scholar]
  41. Slaper, H.; Blaauboer, R.O.; Eggink, G.J. A Risk Assessment Method for Accidental Releases from Nuclear Power Plants in Europe. 1994, RIVM Rapport 743030002. Available online: https://www.rivm.nl/bibliotheek/rapporten/743030002.html (accessed on 9 March 2023).
  42. Slaper, H.; Blaauboer, R.O. Probabilistic risk assessment for accidental releases from nuclear power plants in Europe—Methods and results. In International Symposium on Environmental Impact of Radioactive Releases; Environmental impact of radioactive releases; International Atomic Energy Agency: Vienna, Austria, 1995; pp. 449–458. [Google Scholar]
  43. Slaper, H.; Blaauboer, R. A probabilistic risk assessment for accidental releases from nuclear power plants in Europe. International Conference on Mapping Environmental Risks and Risk Comparison (RISK 97) Aug. RIVM 1998, 61, 209–215. [Google Scholar]
  44. Satoh, N.; Kumamoto, H.; Ohta, N. Risk Assessment for Project Plan Collapse. In Proceedings of the 8th International Conference on Innovation and Management, Stockholm, Sweden, 23–25 July 2021; p. 518. [Google Scholar]
  45. Satoh, N. Scenario Management and Risk Assessment for Project Plan. In Proceedings of the 5th IIAI International Congress on Advanced Applied Informatics (IIAI–AAI), Kanazawa, Japan, 2–8 July 2016; pp. 764–769. [Google Scholar]
  46. Bani-Mustafa, T.; Zeng, Z.G.; Vasseur, D. A new framework for multi-hazards risk aggregation. Saf. Sci. 2020, 121, 283–302. [Google Scholar] [CrossRef]
  47. Chang, N.B.; Chang, D.Q. Long-term risk assessment of possible accidental release of nuclear power plants in complex terrains with respect to synoptic weather patterns. Front. Earth Sci. 2010, 4, 205–228. [Google Scholar] [CrossRef]
  48. Woo, T.H.; Kim, Y.I. Dynamical risk assessment of electricity generation increasing in nuclear power plants. J. Energy Inst. 2012, 85, 7–13. [Google Scholar] [CrossRef]
  49. Ok, C.I.; Kim, C.L.; Lee, S.K. Prioritization of radiological accident scenarios during decommissioning of nuclear power plants by risk matrix and AHP method. Ann. Nucl. Energy 2022, 175, 109239. [Google Scholar] [CrossRef]
  50. Islamov, R.T.; Derevyankin, A.A.; Islamov, D.R. Risk assessment of nuclear power plants. At. Energy 2011, 109, 375–379. [Google Scholar] [CrossRef]
  51. Faure, M.G.; Vanden Borre, T. Compensating Nuclear Damage: A Comparative Economic Analysis of the U.S. and International Liability Schemes (November 24, 2008). William & Mary Environmental Law and Policy Review, Vol. 33. 2008. Available online: https://ssrn.com/abstract=1317704 (accessed on 10 September 2022).
  52. Michael, T.; Winter, R.A. The Economics of Nuclear Accident Law, International Review of Law and Economics; Elsevier: Amsterdam, The Netherlands, 1997; Volume 17, pp. 215–243. Available online: https://ideas.repec.org/a/eee/irlaec/v17y1997i2p215-243.html (accessed on 10 September 2022).
  53. Norbert, P. International Pooling of Operators’ Funds: An Option to Increase the Amount of Financial Security to Cover Nuclear Liability? Nuclear Law Bulletin, OECD Publishing: Berlin, Germany, 2012; Volume 2007, pp. 37–55. Available online: https://ideas.repec.org/a/oec/neakaa/5k9gvsb1rwq1.html (accessed on 10 September 2022).
  54. OECD, Nuclear Energy Agency, CPPC. Table on Nuclear Liability Amounts before and after the Entry into Force of the 2004 Protocol (Non-Official) (Updated June 2022); OECD Publishing: Paris, France; Available online: https://www.oecd-nea.org/jcms/pl_49308/cppc-table-on-nuclear-liability-amounts-before-and-after-the-entry-into-force-of-the-2004-protocol-non-official-updated-june-2022 (accessed on 29 September 2022).
  55. Convention on Nuclear Safety. Available online: https://www.iaea.org/topics/nuclear-safety-conventions/convention-nuclear-safety (accessed on 10 March 2023).
  56. Duqueroy, P.; Miry, C.; Seltner, P. Lightning risk assessment evaluation on French nuclear power plants. In Proceedings of the International Conference on Lightning Protection (ICLP), Shanghai, China, 11–18 October 2014; pp. 91–96. [Google Scholar]
  57. ELINI 2021 Annual Report, April 2022. Available online: https://elini.net/wp-content/uploads/ELINI-Annual-Report-2021.pdf (accessed on 10 September 2022).
  58. Păvălașcu, N.; Gabor, M.R. A Case Study on the Particularities and Sustainability of the Concepts of TQM, Quality Control, and Risk Management in the Corporate Insurance Industry: Loss and the Incidence of Catastrophic Risks. Proceedings 2020, 63, 3. [Google Scholar] [CrossRef]
  59. Drace, Z.; Ojovan, M.I.; Samanta, S.K. Challenges in Planning of Integrated Nuclear Waste Management. Sustainability 2022, 14, 14204. [Google Scholar] [CrossRef]
  60. Zhang, F.; Kelly, K. Overview and Recommendations for Cyber Risk Assessment in Nuclear Power Plants. Nucl. Technol. 2023, 209, 488–502. [Google Scholar] [CrossRef]
  61. Naghi, L.E.; Mihai, R.; Radu, N. Comparative analysis of different financial protection schemes against natural disasters. In Proceedings of the 6th SWS International Scientific Conferences on social sciences, Albena, Bulgaria, 26 August–1 September 2019; pp. 275–280. [Google Scholar]
  62. Radu, N.; Naghi, L.E. International evolution of catastrophic risks frequencies. J. Financ. Stud. 2019, 4, 70–84. Available online: https://revista.isfin.ro/wp-content/uploads/2019/05/5.4_Nicoleta-Radu_RO.pdf (accessed on 2 September 2019).
Figure 1. The number of disasters (all types) for analyzed period of 1900–June 2022 (source: authors’ work based on EM-DAT CRED database [18]).
Processes 11 00953 g001
Figure 2. Distribution of disaster type according to the continent.
Processes 11 00953 g002
Figure 3. Distribution of disaster subtype according to the continent.
Processes 11 00953 g003
Figure 4. Box plots of total number of affected persons according to the disaster subtype and the continent where the disaster occurs. (Note: * = extremely cases).
Processes 11 00953 g004
Figure 5. Comparative structure according to disaster subtype for period of 1900–June 2022 (source: authors’ work based on EM-DAT CRED database [18]).
Processes 11 00953 g005
Figure 6. Structure of number of events according to disaster subtype (source: authors’ work based on EM-DAT CRED database [18]).
Processes 11 00953 g006
Figure 7. Structure of total adjusted damages according to disaster subtype (source: authors’ work based on EM-DAT CRED database [18]).
Processes 11 00953 g007
Table 1. Overview of nuclear liability conventions.
ApproachConvention
International Atomic
Energy Agency
Vienna Convention on Civil Liability for Nuclear Damage, 1997
Joint Protocol Relating to the Application of the Vienna Convention and the Paris Convention, 1988
Convention on Nuclear Safety (CNS), 1994
Convention on Supplementary Compensation for Nuclear Damage, 1997
Nuclear Energy AgencyParis Convention on Third Party Liability in the Field of Nuclear Energy
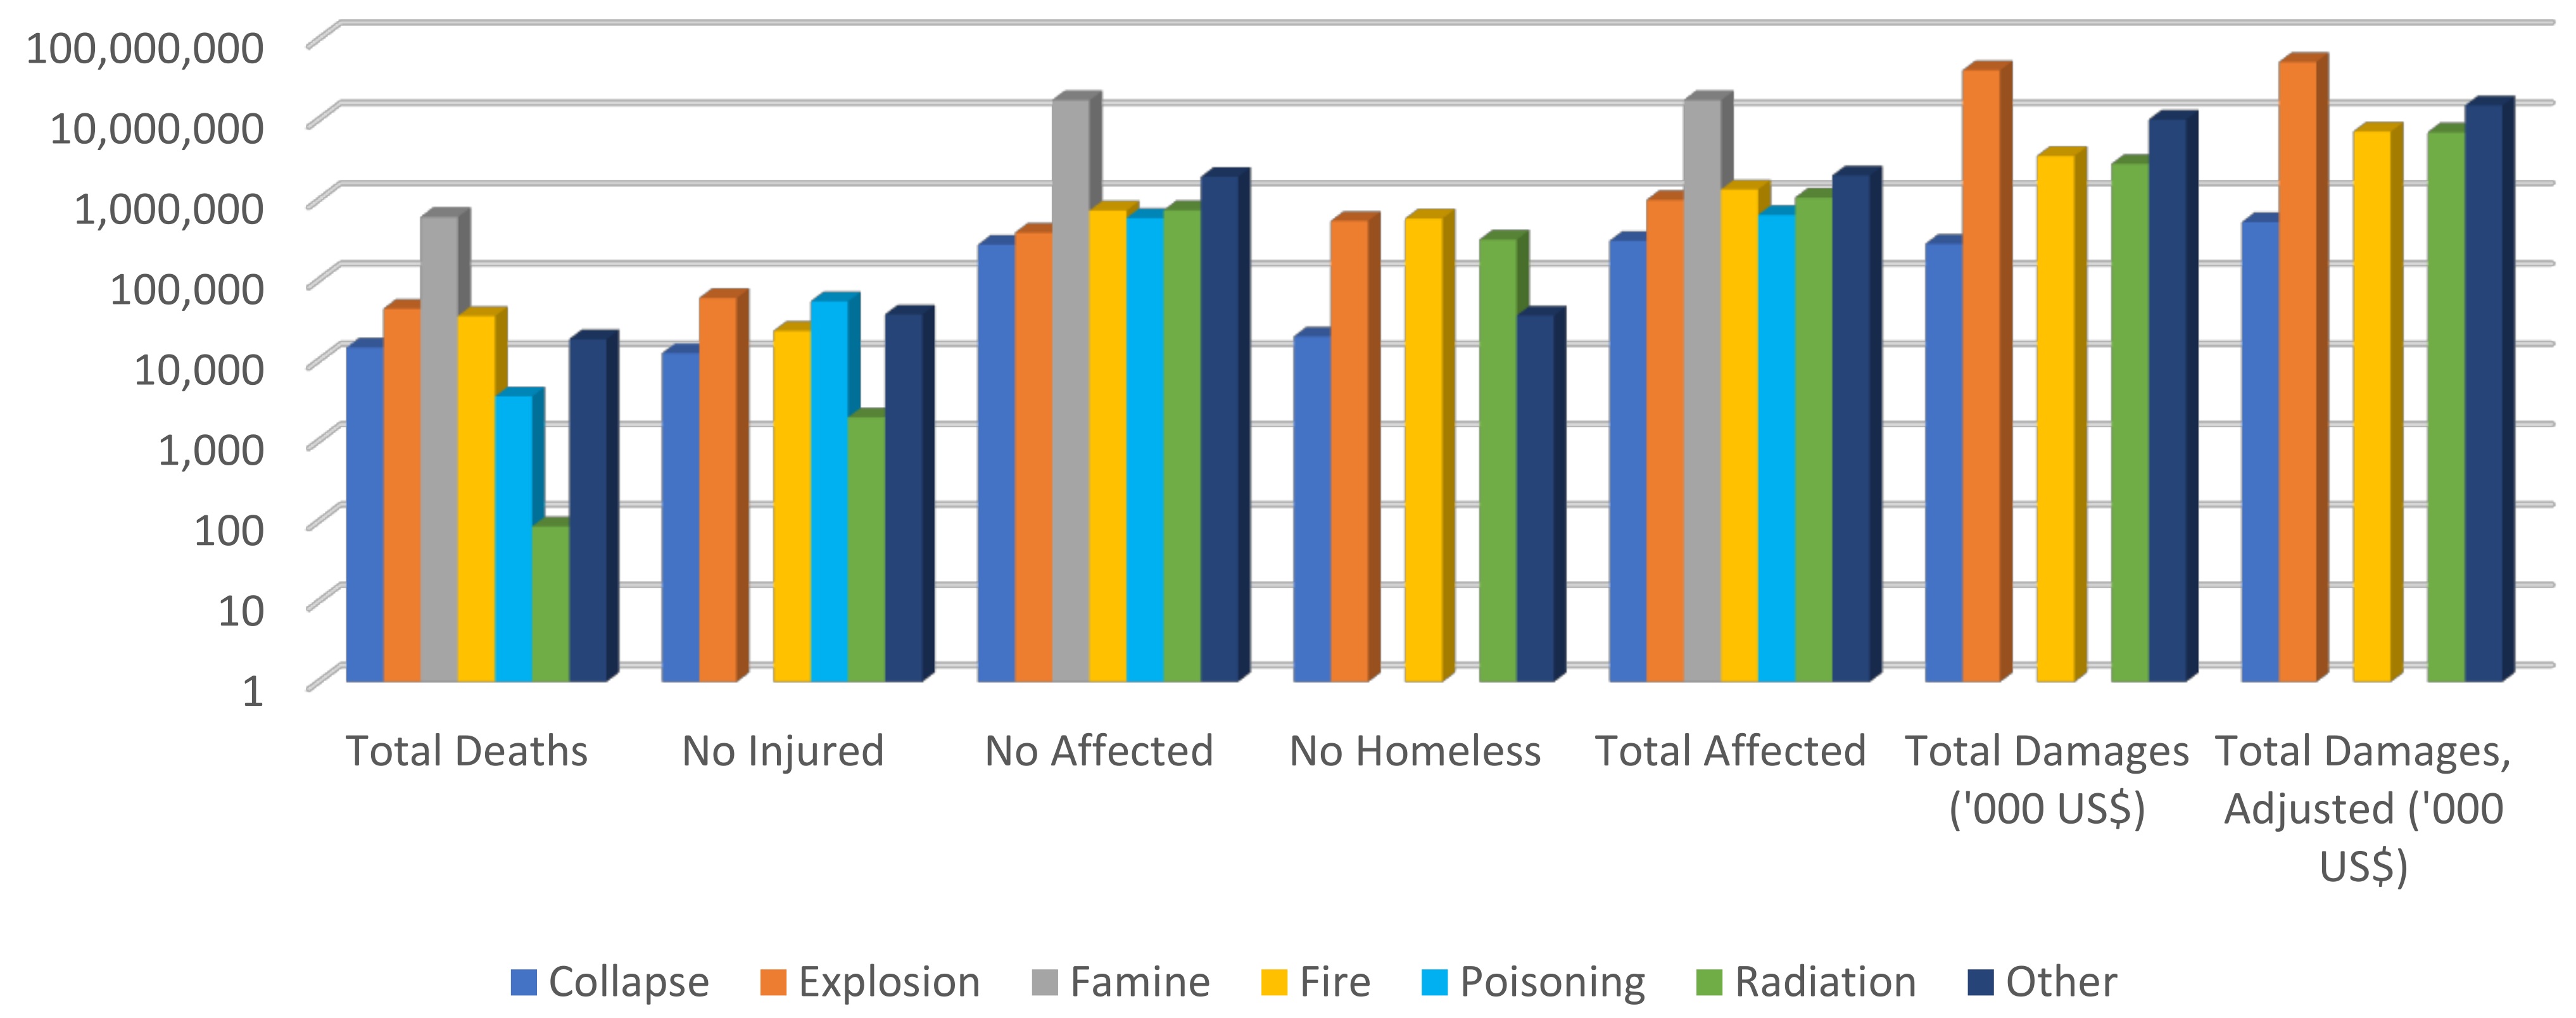
(Source: authors’ work based on [3,38,51,55]).
Table 2. Descriptive statistics of the research data according to disaster subtype.
Disaster Subtype
Variables
CollapseExplosionFamineFirePoisoningRadiationOther
Total number of deaths50.62 ± 113.278
(1–1335)
46.5 ± 122.743
(1–2700)
610,000 ± 061.74 ± 216.8
(1–3800)
71.56 ± 100.538 (1–459)14.33 ± 12.226
(1–31)
56.97 ± 185.791
(1–2236)
Number of injured persons75.9 ± 126.952
(1–922)
114.55 ± 400.862
(1–6000)
-66.24 ± 168.849
(1–2350)
1183.52 ± 3330.27 (3–20,000)326.33 ± 365.659 (29–935)212.89 ± 433.542 (1–3000)
Number of affected persons12,024.39 ± 31,927.709
(1–150,000)
3859.23 ± 10,505.776
(1–90,000)
2,169,125 ± 2,679,863.613 (3000–8,000,000)4573.82 ± 8788.39 (2–55,000)37,130 ± 136,864.901 (100–550,000)148,448.6 ± 164,384.553 (243–400,000)49,680.0 3± 178,638.005 (1–990,000)
Number of
homeless persons
1811.73 ± 2337.276 (33–8000)21,000.19 ± 67,286.046
(1–300,000)
-4684.41 ± 7423.07 (36–50,000)-320,000 ± 018,150 ± 25,243.712 (300–36,000)
Total number of affected persons1697.04 ± 12,018.252
(1–150,000)
1722.66 ± 15,720.201
(1–306,000)
2,169,125 ± 2,679,863.613 (3000–8,000,000)2419.52 ± 6386.777 (1–55,563)10,631.51 ± 70,322.038 (3–550,000)133,025.13 ± 160,464.692 (49–400,935)9354.84 ± 77,683.436 (1–990,000)
Total damages
(‘000 USD)
47,300.0 ± 74,753.542
(1000–199,000)
85,5016.13 ± 3,553,558.690 (4–20,000,000)-25,870.74 ± 154,531.785 (20–1,750,000)-2,800,000 ± 04,982,203.5 ± 7,040,242.906 (4000–9,960,407)
Total adjusted damages (‘000 USD)88,134.83 ± 131,051.696 (15,064–353,864)1,081,114.17 ± 4,180,843.241 (8–24,853,277)-52,490.54 ± 217,720.45 (156–1,792,034)-6,922,056 ± 07,511,286 ± 10,597,272.151 (17,883–15,004,689)
Table 3. The results of chi-square bivariate test.
ValuedfAsymptotic Significance
(2-Sided)
H0 = There are statistically significant differences according to the location (continent) of the event in terms of the disaster subtype
Pearson chi-square94.922240.000
Likelihood Ratio94.335240.000
Linear-by-Linear Association0.23710.626
N of Valid Cases2526
H0 = There are statistically significant differences according to the location (continent) of the event in terms of the disaster type
Pearson chi-square87.17180.000
Likelihood Ratio89.52580.000
Linear-by-Linear Association28.60510.000
N of Valid Cases2533
(Source: authors’ calculations).
Table 4. The results of One-way ANOVA test for groups by location of the event.
Sum of SquaresdfMean SquareFSig.
Total number of deaths Between Groups64,520,692,859.568416,130,173,214.8921.3970.232
Within Groups25,292,708,274,910.445219111,543,910,668.604
Total25,357,228,967,770.0102195
Number of injured personsBetween Groups1,391,283.1634347,820.7910.6430.632
Within Groups681,789,186.7871261540,673.423
Total683,180,469.9491265
Number of affected personsBetween Groups267,296,880,706.215466,824,220,176.5540.2610.903
Within Groups90,459,855,513,103.970353256,260,213,918.142
Total90,727,152,393,810.190357
Number of homeless personsBetween Groups5,217,023,649.13641,304,255,912.2840.9450.440
Within Groups220,842,650,144.5011601,380,266,563.403
Total226,059,673,793.636164
Total number of affected personsBetween Groups58,677,897,866.174414,669,474,466.5440.2560.906
Within Groups92,153,679,626,400.160160857,309,502,255.224
Total92,212,357,524,266.3301612
Total damages (‘000 USD)Between Groups9,612,988,355,616.15842,403,247,088,904.0400.6340.639
Within Groups712,194,202,776,898.0001883,788,267,036,047.330
Total721,807,191,132,514.100192
Total adjusted damages (‘000 USD)Between Groups25,120,556,308,314.01046,280,139,077,078.5031.0700.373
Within Groups1,097,873,302,445,750.2001875,870,980,226,982.622
Total1,122,993,858,754,064.200191
Disaster SubtypeBetween Groups33.51648.3792.3370.053
Within Groups9039.60925213.586
Total9073.1252525
(Source: authors’ calculations).
Table 5. The results of One-way ANOVA test for grouping by disaster subtype.
Sum of SquaresdfMean SquareFSig.
Total number of deathsBetween Groups371,865,783,749.186661,977,630,624.8642,390,447.0190.000
Within Groups56,702,816.284218725,927.214
Total371,922,486,565.4702193
Number of injured personsBetween Groups54,039,659.467510,807,931.89321.6450.000
Within Groups629,140,810.4831260499,318.104
Total683,180,469.9491265
Number of affected personsBetween Groups36,502,729,848,564.04066,083,788,308,094.00740.5440.000
Within Groups51,919,211,603,237.200346150,055,524,864.847
Total88,421,941,451,801.250352
Number of homeless personsBetween Groups103,525,844,301.224425,881,461,075.30633.7950.000
Within Groups122,533,829,492.412160765,836,434.328
Total226,059,673,793.636164
Total number of affected personsBetween Groups37,463,494,982,074.47066,243,915,830,345.745191.3890.000
Within Groups52,231,439,169,125.360160132,624,259,318.629
Total89,694,934,151,199.8301607
Total damages (‘000 USD)Between Groups75,484,790,639,018.160418,871,197,659,754.5405.4890.000
Within Groups646,322,400,493,496.0001883,437,885,109,007.958
Total721,807,191,132,514.100192
Total adjusted damages (‘000 USD)Between Groups182,719,755,237,918.880445,679,938,809,479.7209.0850.000
Within Groups940,274,103,516,145.2001875,028,203,762,118.424
Total1,122,993,858,754,064.100191
Table 6. The results of Student’s t-test group comparison between US and rest of the world.
Levene’s Test for Equality of Variancest-Test for Equality of Means
FSig.tdfSig.
(2-Tailed)
Mean
Difference
Std. Error Difference95% Confidence Interval of the Difference
LowerUpper
Total number of deathsEVA0.8400.360−0.46021940.645−2974.5736460.248−15,643.4169694.269
EVNA −1.1051870.0570.269−2974.5732692.002−8254.2182305.072
Number of injured personsEVA0.1760.6750.12512640.9017.17257.604−105.839120.183
EVNA 0.197530.5570.8447.17236.458−64.44878.792
Number of affected personsEVA0.5430.462−0.3593560.720−26,013.39872,398.872−168,396.639116,369.842
EVNA −0.683301.9040.495−26,013.39838,106.698−101,001.76948,974.973
Number of homeless personsEVA2.3110.130−1.0601630.291−8683.0858195.097−24,865.3257499.155
EVNA −2.525150.2280.013−8683.0853439.305−15,478.743−1887.427
Total number of affected personsEVA0.3670.545−0.31616110.752−5318.07416,825.467−38,320.17827,684.029
EVNA −0.6081136.3520.544−5318.0748753.260−22,492.44111,856.292
Total damages (‘000 USD)EVA3.9270.0491.1551910.249401,166.992347,270.595−283,811.0561,086,145.041
EVNA 0.76442.1320.449401,166.992525,052.360−658,333.0731,460,667.057
Total adjusted damages (‘000 USD)EVA4.2800.0401.2341900.219535,820.418434,362.448−320,971.7521,392,612.589
EVNA 0.81942.2160.417535,820.418653,907.626−783,618.7831,855,259.620
(Source: authors’ calculations; Note: EVA = equal variances assumed; EVNA = equal variances not assumed).
Table 7. The results for chi-square bivariate test for group of comparison US/rest of the world.
Value of Pearson Chi-SquaredfAsymptotic Significance (2-Sided)
H0 = There are statistically significant differences between the US and the rest of the world in terms of:
 • Disaster group0.01310.908
 • Disaster subgroup0.01310.908
 • Disaster type17.10220.000
 • Disaster subtype24.61960.000
 • Appeal 0.99710.318
 • Declaration 9.94710.002
(Source: authors’ calculations).
Table 8. Model summaries.
ModelRR SquareAdjusted R SquareStd. Error of the Estimate
1 a0.724 a0.5240.3414,047,209.747
2 b0.742 a0.5510.3785,093,846.304
3 c0.695 a0.4830.3355,264,136.497
a Dependent variable: total damages (‘000 USD); predictors: (Constant), declaration, continent, appeal, disaster subtype, disaster type; b dependent variable: total adjusted damages (‘000 USD); predictors: (Constant), declaration, continent, appeal, disaster subtype, disaster type; c dependent variable: total adjusted damages (‘000 USD); predictors: (Constant), disaster subtype, continent, declaration, appeal.
Table 9. ANOVA results for the regression models.
ModelSum of SquaresdfMean SquareFSig.
1 aRegression234,565,791,325,801.560546,913,158,265,160.3102.8640.059 a
Residual212,938,787,528,879.2001316,379,906,732,990.707
Total447,504,578,854,680.75018
2 bRegression413,179,160,458,444.940582,635,832,091,688.9803.1850.043 b
Residual337,314,512,212,823.3001325,947,270,170,217.180
Total750,493,672,671,268.20018
3 cRegression362,537,809,912,356.060490,634,452,478,089.0203.2710.043 c
Residual387,955,862,758,912.2001427,711,133,054,208.010
Total750,493,672,671,268.20018
a Dependent variable: total damages (‘000 USD); predictors: (Constant), declaration, continent, appeal, disaster subtype, disaster type; b dependent variable: total adjusted damages (‘000 USD); predictors: (Constant), declaration, continent, appeal, disaster subtype, disaster type; c dependent variable: total adjusted damages (‘000 USD); predictors: (Constant), disaster subtype, continent, declaration, appeal.
Table 10. The regression coefficients for each model.
ModelIndependent
Variables
Unstandardized CoefficientsStandardized CoefficientstSig.
BStd. ErrorBeta
1 a(Constant)−765,599.9353,690,346.570 −0.2070.839
Disaster type−1,599,292.4721,352,732.039−0.325−1.1820.258
Disaster subtype1,607,841.310839,698.1040.4591.9150.078
Continent−156,461.7351,034,431.161−0.036−0.1510.882
Appeal4,591,482.9824,828,538.0940.2110.9510.359
Declaration9,621,794.9933,486,900.2240.6082.7590.016
2 b(Constant)−1,158,303.0994,644,695.831 −0.2490.807
Disaster type−2,378,530.3851,702,557.943−0.374−1.3970.186
Disaster subtype2,426,867.5651,056,849.8670.5352.2960.039
Continent−265,597.3921,301,942.245−0.047−0.2040.842
Appeal6,944,480.2576,077,231.5910.2471.1430.274
Declaration11,910,570.5304,388,636.8460.5822.7140.018
3 a(Constant)−1,544,446.6434,791,463.929 −0.3220.752
Continent−1,290,727.8591,111,408.569−0.230−1.1610.265
Appeal4,901,334.9906,095,827.6790.1740.8040.435
Declaration14,205,136.0414,205,754.2530.6943.3780.005
Disaster Subtype1,821,087.090996,018.0380.4021.8280.089
a Dependent variable: total damages (‘000 USD); predictors: (Constant), declaration, continent, appeal, disaster subtype, disaster type; b dependent variable: total adjusted damages (‘000 USD); predictors: (Constant), declaration, continent, appeal, disaster subtype, disaster type; c dependent variable: total adjusted damages (‘000 USD); predictors: (Constant), disaster subtype, continent, declaration, appeal.
Table 11. Summary of research hypotheses, statistical methods and conclusions.
Research HypothesisStatistical Methods UsedConclusions
H1: There are significant differences between locations in terms of the disaster category/subtype and damage level.• Descriptive statistics
• Box plots
• Chi-square bivariate test
• One-way ANOVA
Hypothesis H1 is partially confirmed (only for disaster type and disaster subtype)
H2: The damage levels and human losses from radiation/nuclear accidents are significant in the total damages registered worldwide.• Descriptive statistics
• One-way ANOVA
Hypothesis H2 is confirmed
H3: There are differences between the US and the rest of the world in terms of damage levels.• Descriptive statistics
• Independent Student’s t-test
• Chi-square bivariate test
Hypothesis H3 is partially confirmed for total damages, total adjusted damages, disaster type, disaster subtype and declaration.
H4: The disaster subtype is one of the best predictors of damage levels.• Multilinear regression with collinearity diagnosis with total damages and total adjusted damages as dependent variablesHypothesis H4 is confirmed; the disaster subtype together with the declaration are the best predictors for total damages and total adjusted damages, both overall and specifically nuclear disasters.
Disclaimer/Publisher’s Note: The statements, opinions and data contained in all publications are solely those of the individual author(s) and contributor(s) and not of MDPI and/or the editor(s). MDPI and/or the editor(s) disclaim responsibility for any injury to people or property resulting from any ideas, methods, instructions or products referred to in the content.

