1. Introduction
Industry 4.0 is the fourth industrial revolution that rapidly contains automated machines and technologies to perform industry-related tasks. Industry 4.0 enhances the efficiency and productivity range of products. Various risks and challenges occurred in industry 4.0, which enormously reduced the production range [
1]. Cyber security risks also occur in industries that lead to the loss of a huge amount of data due to attacks. Malware and ransomware are the major cyber-security risks that cause attacks due to malfunctions in software [
2]. Insufficient security policies also cause severe damage and attack possibilities in industry 4.0. Cyber security risk prediction and prevention are crucial tasks to perform in industry 4.0. The cyber security analysis-based method is mostly used for risk prediction in industry 4.0 [
3]. A reference architecture model is used here to detect threats and risks based on certain functions and operations. A monitoring system is implemented in every industry that gathers information that is relevant to production and risks [
4]. The monitoring system reduces the latency in cyber-attack risk prediction, enhancing industries’ efficiency ratio. Information and communication technologies (ICT) are used in industry 4.0, providing various services and functionalities during the manufacturing process [
5].
Various methods and techniques are used to address cyber-security risks which occurred in industry 4.0. The Artificial Intelligence (AI) technology-based detection method is commonly used for the cyber-security detection processes. The Artificial Neural Network (ANN) algorithm detects the threats which contain abnormal risks in a process [
6]. The feature selection method in ANN extracts the important features and patterns relevant to risks and problems [
7]. Third-party attacks and risks are predicted by the feature selection method, reducing the early detection latency. ANN also identifies the actual cause of threats and the location of risks, which are presented in industry 4.0 [
8]. The Industrial Internet of Things (IIoT) network is used in industries that provide certain services for the product improvement process. The IIoT-based detection method is also used for the risk detection process [
9]. IIoT analyzes the datasets which are presented in the database, which produce feasible information for the further risk detection process. IIoT identifies the risks which occur during interaction and communication processes. IIoT improves risk detection accuracy, enhancing industries’ performance and production levels [
10].
Machine learning (ML) techniques and methods are most commonly used for prediction and detection processes. ML is mainly used to achieve high accuracy in the detection process. ML is used in the cyber risk detection process for industry 4.0 [
11]. ML-based methods are used in the cyber-security risk prediction process. Convolutional neural network (CNN) is used as a detection method that detects the malfunctions and risks which occur during interaction and production processes. CNN improves the overall production and feasibility range of industries, enhancing efficiency among other organizations [
6,
12]. An adaptive deep learning (ADL) algorithm is also used for the cyber risk detection process. The ADL algorithm detects industries’ network traffic and data flow that provides relevant data for further processes. ADL reduces both the computation cost and time consumption ratio in the computation process, which increases the accuracy of the detection process [
13]. A deep neural network (DNN) model is used for the optimization process. Principle component analysis (PCA) is implemented in the DNN model that analyses the data which is eliminated by certain operations. PCA detects the original data required for the optimization process and provides feasible solutions to solve optimization problems in industries [
14,
15]. However, these methods are consumed with difficulties while handling the threat intelligence because several intermediate attacks reduce the system efficiency and cause security related issues. The security related cyber risks are overcome by applying the fuzzy harmony search. The contributions of this article are highlighted below:
- (1)
Designing a risk detection technique for smart industrial communication networks to prevent cyber threats for uninterrupted production outcomes.
- (2)
Incorporating the fuzzy harmony search process for analyzing, classifying, and detecting mimicking operations for maximizing production-based objectives.
- (3)
Performing a dataset-based analysis for validating the proposed techniques’ process flow based on harmony search optimization.
- (4)
Performing a comparative analysis using specific methods for proving the proposed techniques’ consistency with the other existing methods.
2. Related Works
Pearce et al. [
16] proposed a smart input–output module for mitigating cyber–physical attacks. The proposed scheme is mostly used in industrial control systems. The actual goal of the proposed scheme is to identify the dangers which are mitigated in industries. The proposed scheme secures real-time applications from cyber-attacks, enhancing the systems’ reliability range. The smart I/O module reduces both complexity and difficulties in connectivity. The proposed scheme improves the efficacy and performance range of industries. Ahmadi-Assalemi et al. [
17] designed a super learner ensemble for anomaly detection in the industrial control system (ICS). Artificial intelligence (AI) is used that collects the necessary data, which reduces the latency in the data collection process. The proposed method also identifies the cyber risks which are presented in ICS. Cyber risks reduce the workflow and production rate of industries. Experimental results show that the designed method achieves high accuracy in anomaly detection. Wang et al. [
18] developed a lightweight approach for the network intrusion detection process in industrial cyber–physical systems (CPS). A deep learning algorithm named deep convolutional neural network (CNN) is implemented in the proposed approach. CNN is mainly used here to improve performance and to increase the speed of the anomaly detection process. Knowledge distillation (KD) is also used to train the data for the detection process. The proposed approach maximizes the accuracy of intrusion detection, improving CPS’s effectiveness. Rosado et al. [
19] introduced a new methodology for analyzing risks in information systems using meta-pattern and adaptability (MARISMA). The introduced MARISMA method is commonly used to address the risks in cyber–physical systems (CPS). A risk analysis technique is used here that analyzes the risks based on characteristics and behaviors. The introduced method reduces the latency in detection, which enhances the performance and efficiency level of CPS. When compared with other methods, the introduced MARISMA increases the accuracy of the risk detection process. Traganos et al. [
20] proposed a reference architecture named the HORSE framework for cyber–physical systems (CPS) in smart manufacturing industries. Important characteristics and features are detected from the database, producing feasible information for further processes. The reference architecture acts as a safety detection method that identifies the cyber-attacks’ risks that occurred during production.
The proposed HORSE framework improves smart industries’ overall production and manufacturing range. Farrugia et al. [
21] developed a real-time prescriptive solution for explainable cyber-fraud detection. Machine learning (ML) algorithms are used here to detect the actual cyber-fraud located in an application. The actual behaviors of frauds and intrusions are examined, which provides feasible data for the detection process. The proposed method reduces both the time and energy consumption ratio in the computation process. The proposed method achieves high accuracy in cyber-fraud detection, which maximizes the efficiency and flexibility level of the systems. Leong et al. [
22] designed a cyber risk cost management method for Internet of Things (IoT) devices-based health insurance. The proposed method’s main aim is to ensure users’ safety and security to obtain proper insurance. Cyber risks and problems are detected by this method, which reduces the complexity and difficulties ratio in cost management systems. The proposed method improves the performance and energy-efficiency range of IoT-linked health insurance systems. Pinto et al. [
23] proposed a data-driven anomaly detection method for cyber–physical production systems (CPPS). The proposed method detects the attacks which are presented in the edge layer of CPPS. An artificial intelligence-based model is used here to tackle the attacks occurring during manufacturing and production processes. Experimental results show that the proposed method increases the accuracy of anomaly detection, enhancing the systems’ effectiveness and performance level. Zängerle et al. [
24] developed an enterprise-level cyber risk prediction method. The actual goal of the proposed method is to address the risks and problems which cause severe damage to the production and manufacturing systems. The proposed method predicts the sparse data availability which is required for various processes. Unwanted threats and cyber risks are detected here, reducing the overall complexity of certain tasks. The developed method maximizes the efficiency and feasibility range of the systems. Pantano et al. [
25] introduced a human cyber–physical system approach for lean automaton. An industrial 4.0 reference architecture is used here that addresses human integration and operation in a system. The main aim of the introduced approach is to improve flexibility and reduce the complexity ratio of the systems. Human mistakes and malfunctions are detected here, reducing production system errors. Compared with other approaches, the introduced approach enhances the performance and effectiveness level of the systems. Latino et al. [
26] proposed a reference framework for cyber-security in the food and beverage industries. A thematic analysis is used here that identifies the important datasets which are required to perform a certain task in industry. The reference framework detects cyber threats, problems, and challenges. Both time and energy consumption ranges in the computation are reduced. The proposed framework improves both the flexibility and robustness range of the food and beverage industries. Miehle et al. [
27] designed a stochastic Petri net approach for smart factories. The designed method is an information network analysis that analyzes the information based on certain conditions. The threats and problems which occur during manufacturing are detected using the Petri net approach. The proposed approach reduces the IT network complexity in smart industries. The proposed approach increases the accuracy of attack detection, enhancing smart factories’ performance. Shahin et al. [
28] presented a fully convolutional neural network (FCN) approach for cyber-attack detection and classification processes in smart manufacturing systems. Industrial Internet of Things (IIoT) devices are commonly used in manufacturing systems, which leads to various problems. Intelligence tools are used here to detect the threats and attacks from the manufacturing systems. Experimental results show that the proposed FCN approach achieves high accuracy in attack detection, which reduces the latency in further processes. Jbair et al. [
29] introduced a structured threat modeling approach for industrial cyber–physical systems (CPS). The main aim of the proposed approach is to identify the threats which occurred due to smart manufacturing systems. The introduced method is end-to-end modeling which detects the threats based on characteristics and functions. The exact impacts and ability of threats are also identified, reducing the computation process’s complexity. The introduced method increases the safety and security ratio of CPS from attackers.
The so far discussed methods rely on external data observed from the ground devices and inputs from the previous performance as discussed in [
16,
19]. The methods in [
18,
20,
21] address the aforementioned issues for handling shortcomings using classification. In classification, the complexity of handling adverse impacts is suppressed in the later methods [
24,
27]. However, risk assessment relies on predicted and observed outcomes for identifying different halts and their precise reason. The proposed technique relies on this information for reducing the halts due to interrupts coping with the production plan. The adaptability of balancing the performance and risk mitigation to be maintained, is accomplished by the proposed technique.
3. Explicit Risk Detection and Assessment Technique
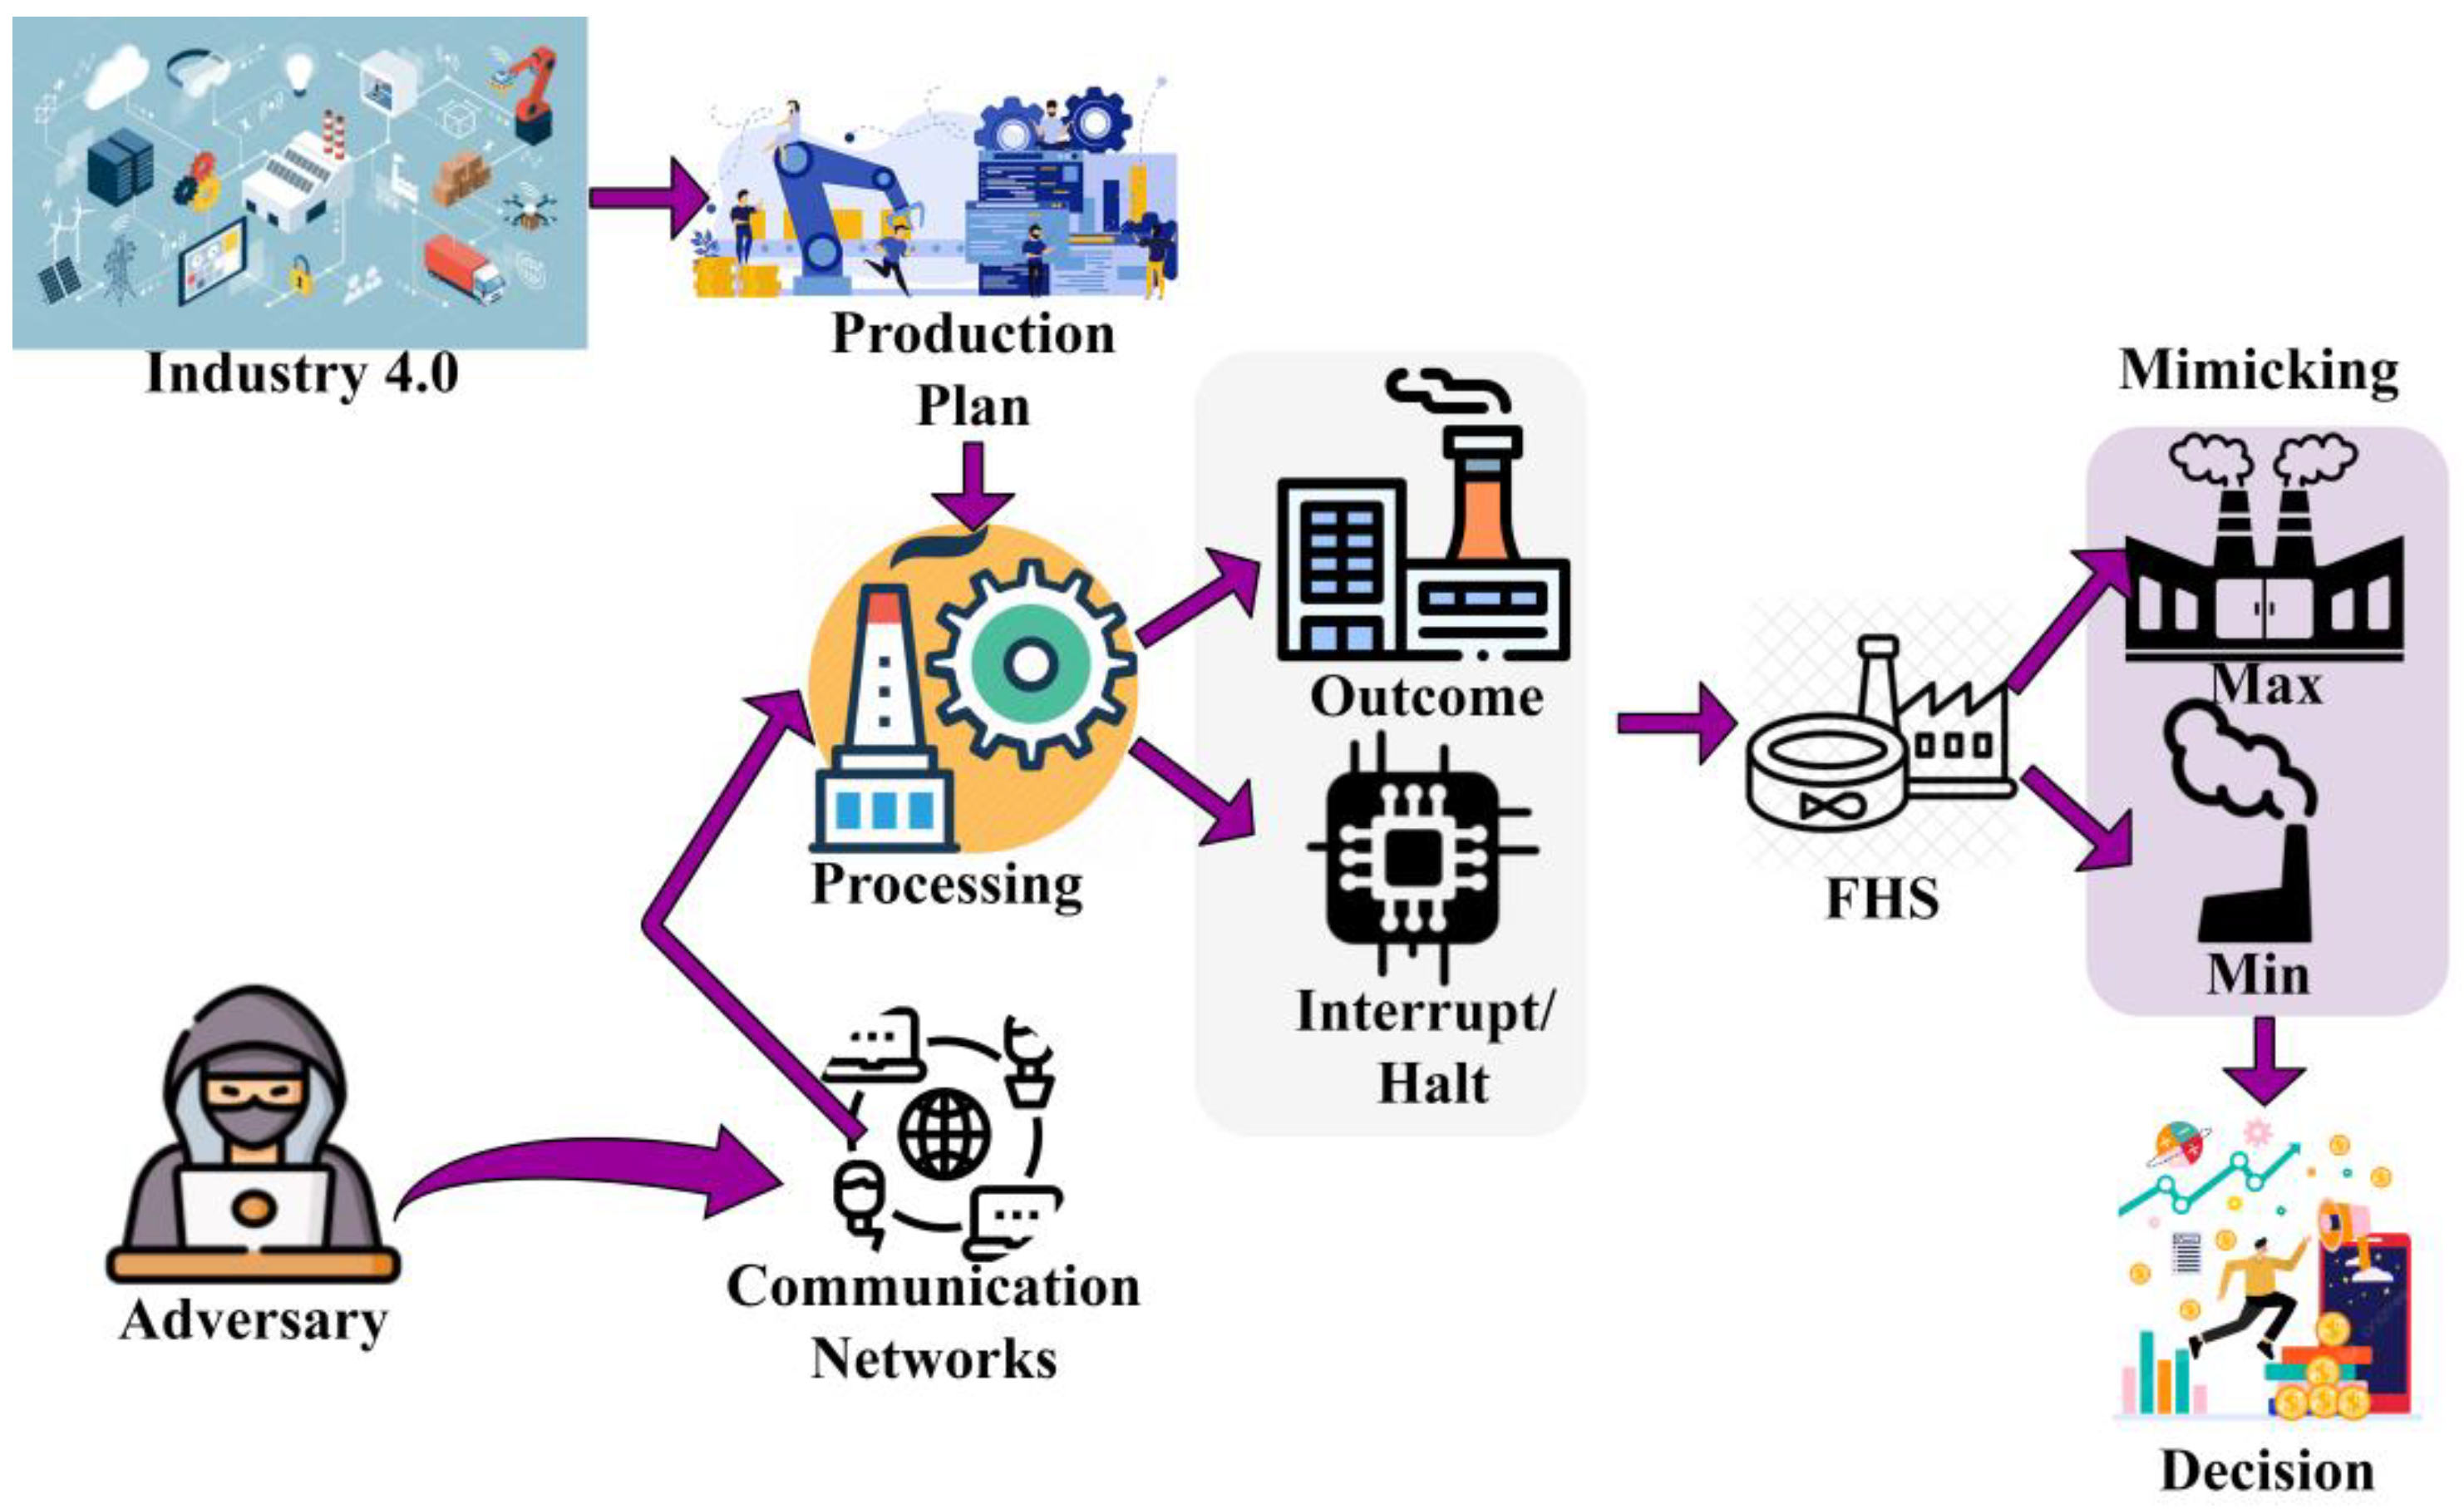
The proposed ERDA technique is introduced to detect and mitigate cyber risk in industrial operations to improve security. The different technologies in wireless communication networks remotely accessed and regulated through processing units in the industry depend on better accuracy for their operations and planned outcomes. Both data processing and production monitoring integrations comprise security threats due to the remote operability and wireless nature exposed through cyber risk detection. Some common wireless communication networks based on industry 4.0 house technologies that are used for performing external and internal operations which is a prominent factor in which the adversary/risk can be thwarted through a fuzzy harmony search algorithm (FHS). ERDAT is one such technique used for classifying the processing unit.
Figure 1 presents the proposed techniques’ illustration.
The process of ERDAT in wireless communication networks assisted industry 4.0 in acquiring a prediction plan and adversary detection to prevent its impact. Production monitoring and data processing in the industrial unit through communication networks are processed. The prediction plan is used for classifying the processing between risk and scheduled production. The classification output is used for identifying the process interruption or halting and production outcome by the correlation analysis from the stored industrial data. The process of explicit risk detection and the computation technique is used to prevent adversaries, where the prediction plan is initially processed. The input prediction plan in industry 4.0 is represented in Equations (1) and (2).
where,
where,
and
means the production outcome and process interruption/halt in the wireless communication networks for the mimicking operations based on
and
. If
and
are the minimum and maximum profitable outcome and process interruption or halting at different time
intervals. This mimicking operation
is performed through the harmony search algorithm
for gaining profitable outcomes and identifying the cyber risks. The variable
used to denote the amount of processing performed in a single industrial unit. Then,
and
and hence, the harmony search algorithm is a relatively fuzzy optimization inspired by industry 4.0 wireless communication networks. The
process Equations (3)–(5) identify cyber risk and prevent its impacts on the search domain.
Equations (3) and (4) computes the initial cyber security is detected and mitigated for all
instances. This sequence of instances represents a complete industrial data processing and production monitoring based on
and
operations in different time intervals through a fuzzy harmony search algorithm. Here
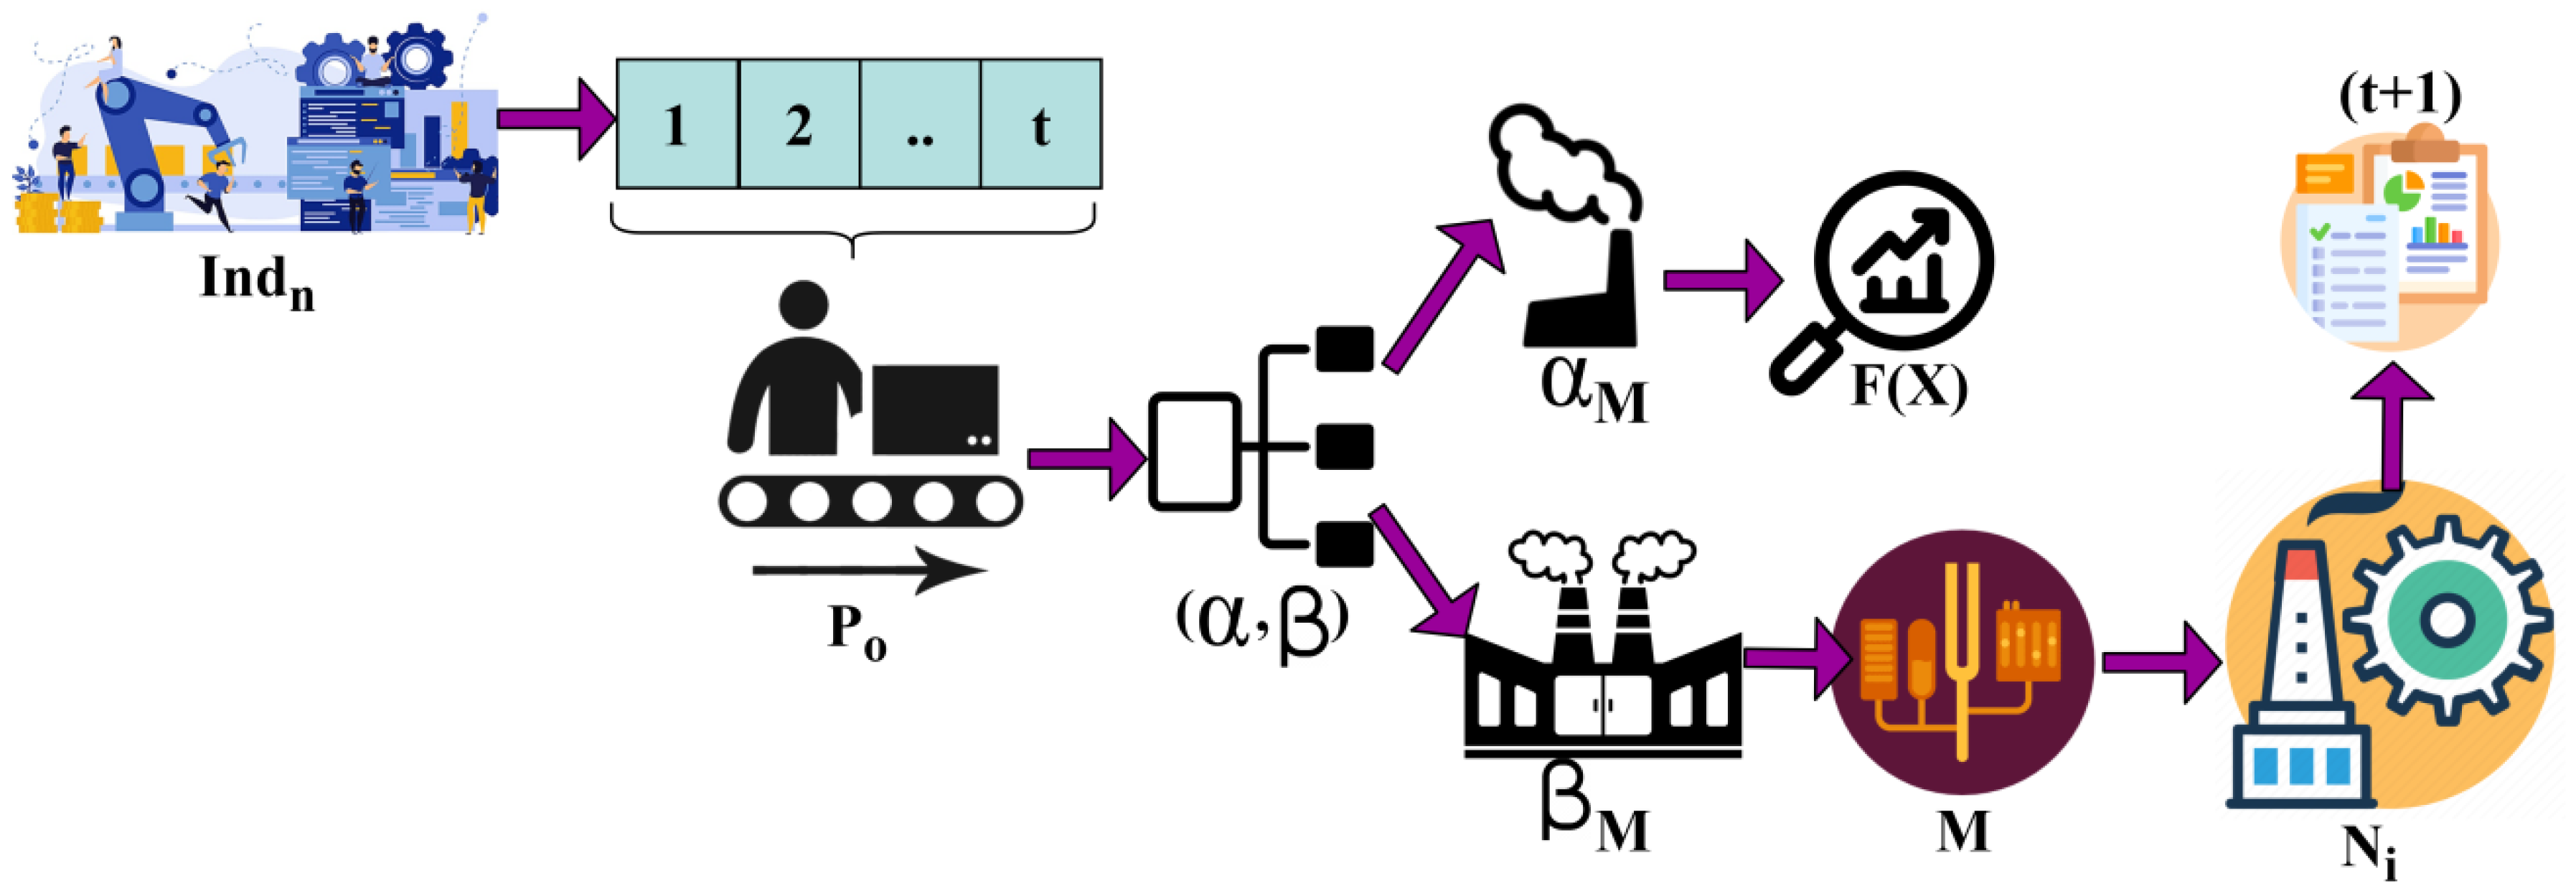
is the overall industrial data and production analysis. The mimicking operation is illustrated in
Figure 2.
The production output is classified
such that
and
are used for assessment. In the
outcomes,
is alone mimicked for
. The
, the generated output is pursued
for identifying any risks in the previous
. This analysis is not pursued under
for
whereas
pursues
for classification (
Figure 2). Processing is classified as production outcome and interruption/halting to reduce the adversary impact present in communication networks. Adversary impact is due to the cyber impacting risk identified in the industrial processing unit while observing production output in any instance. Therefore, the normalization of data processing and production monitoring follows a high-objective function
and is expressed as
where,
Based on the Equations (7) and (8), the variable
and
represents the admitted plan for performing a mimicking operation based on production outcomes and interrupt/halt occurrence identification. The production factors such as process interruption
and production outcome
relies on the minimum and maximum mimicking occurrences of
and
. From the mimicking occurrence in the industry 4.0, wireless communication networks for the high objective function based on production outcome are computed. The variable
is used to denote the adversary impact in the communication networks and also for the process of cyber risk detection. Now, the source mitigation in industry 4.0 admits the above factors for detecting the cyber impacting risk and is computed as
The cyber-impacting risks
are detected after performing the harmony search algorithm. From this instance, two factors, production outcome and process interruption/halt, are extracted for further process classification. Equation (10) is used to evaluate the scheduled production outcome
and risk occurrence
measure for profitable output and is represented as
where the variable
and
are the maximum and minimum objective outputs of
as identified. The log normalization of scheduled production outcome identifies the overlapping functions in source mitigation as in Equation (11)
This log normalization process is performed for continuing the fuzzy operation and cyber risk occurrence detection along with the various technology and time intervals. The classification process is based on
and
using fuzzy optimization. This industrial processing unit classification helps to differentiate the outcome interrupt and halted schedules for all either
, or
, or both processes. The risk occurrence estimation from the previous intervals is diagrammatically presented in
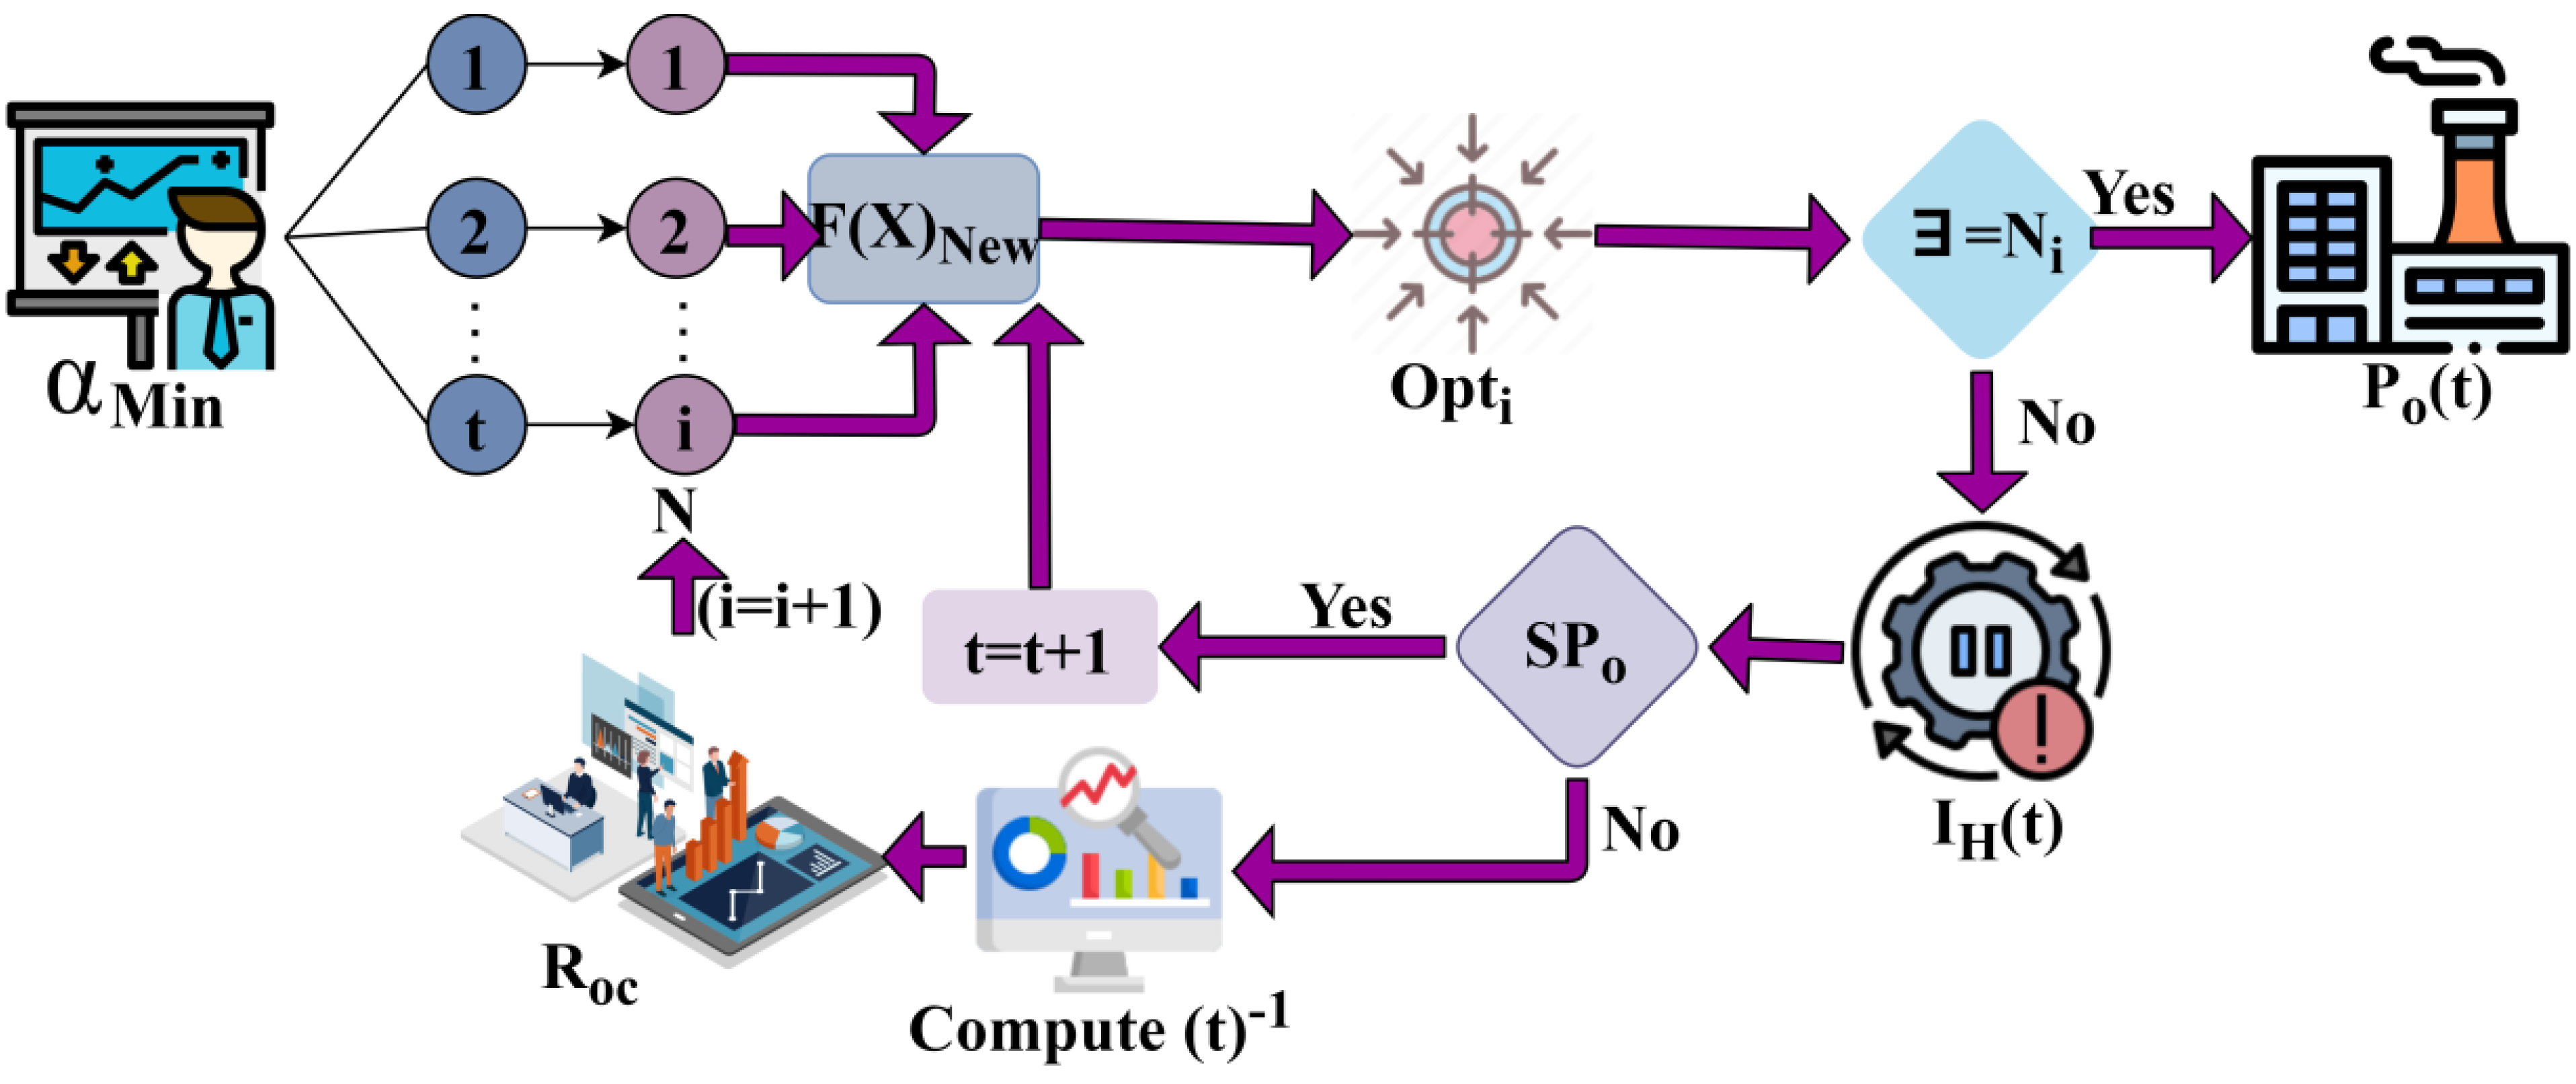
Figure 3.
The risk occurrence estimation is performed by mapping
and
for evaluating
. This is different from the previous occurrences,
analysis. If the case fails, then
in the specific
is estimated. This requires
checking under
and
constraints from which
is identified. If
is identified under any
then the process is halted and is considered a risk (Refer to
Figure 3). In this processing classification, the threshold is identified at each processing level followed by has. The prediction plan and communication networks are determined as per Equations (12) and (13), either satisfying production outcomes or risk interrupts, respectively.
In Equation (12), assume the mimicking operation set
is sequentially analyzed using the objective function based on scheduled production outcomes. The variable
is the initial training set identifying its impact at a different time interval. Similarly, the first production outcome and training sets are given as
In Equation (14), the fuzzy optimization detects the maximum or minimum objective output of the processing and is performed such that
is evaluated for the mimics operation
. The minimum interruption moves to maximum interruption, whereas the maximum production outcome moves to a minimum, and a fuzzy threshold is identified. This mimicking operation output helps to distinguish the overlapping processes in an industry based on
instance to perform possible classification. Based on Equations (13) and (14), the differences between both the scheduled production outcome and process interruption/halt vary at each time of processing because the objective of the proposed technique lies between these two factors. In this process, these two factors are constant for improving risk detection in industry 4.0. Due to the importance of the two factors, the available processing is converted into fuzzy factors in this condition. Therefore, the fuzzy operation is performed, which functionally adjusts the outcome and risk factors, and the number of processing iterations is considered as the input for FHS. In this case, this consideration is used for performing fuzzy operations because the mimicking values differ when the FHS starts functioning. The fuzzy operation based on two factors is defined by Equations (15) and (16), where the final production outcome and process interruption/halt change their measures in the range [0,1].
where
is the harmony search performing mimicking operations and
is the rules and regulations of fuzzy optimization corresponding to targeted objective output. The variable
is the first output based on rule 1 corresponds to the harmony search algorithm. The variable
is the disconnected risk-identified communication source for rules and regulations corresponding to HSA.
In Equation (15),
is the threshold ratio identified from the processing and
is the number of rules and regulations followed by the fuzzy operation corresponding to risk detection. Therefore,
is the first threshold identified network along with rules corresponding to mediate acceptable range. The variable
is the disconnected communication source network in industry 4.0 corresponding to risk detection. The harmony search process is represented in
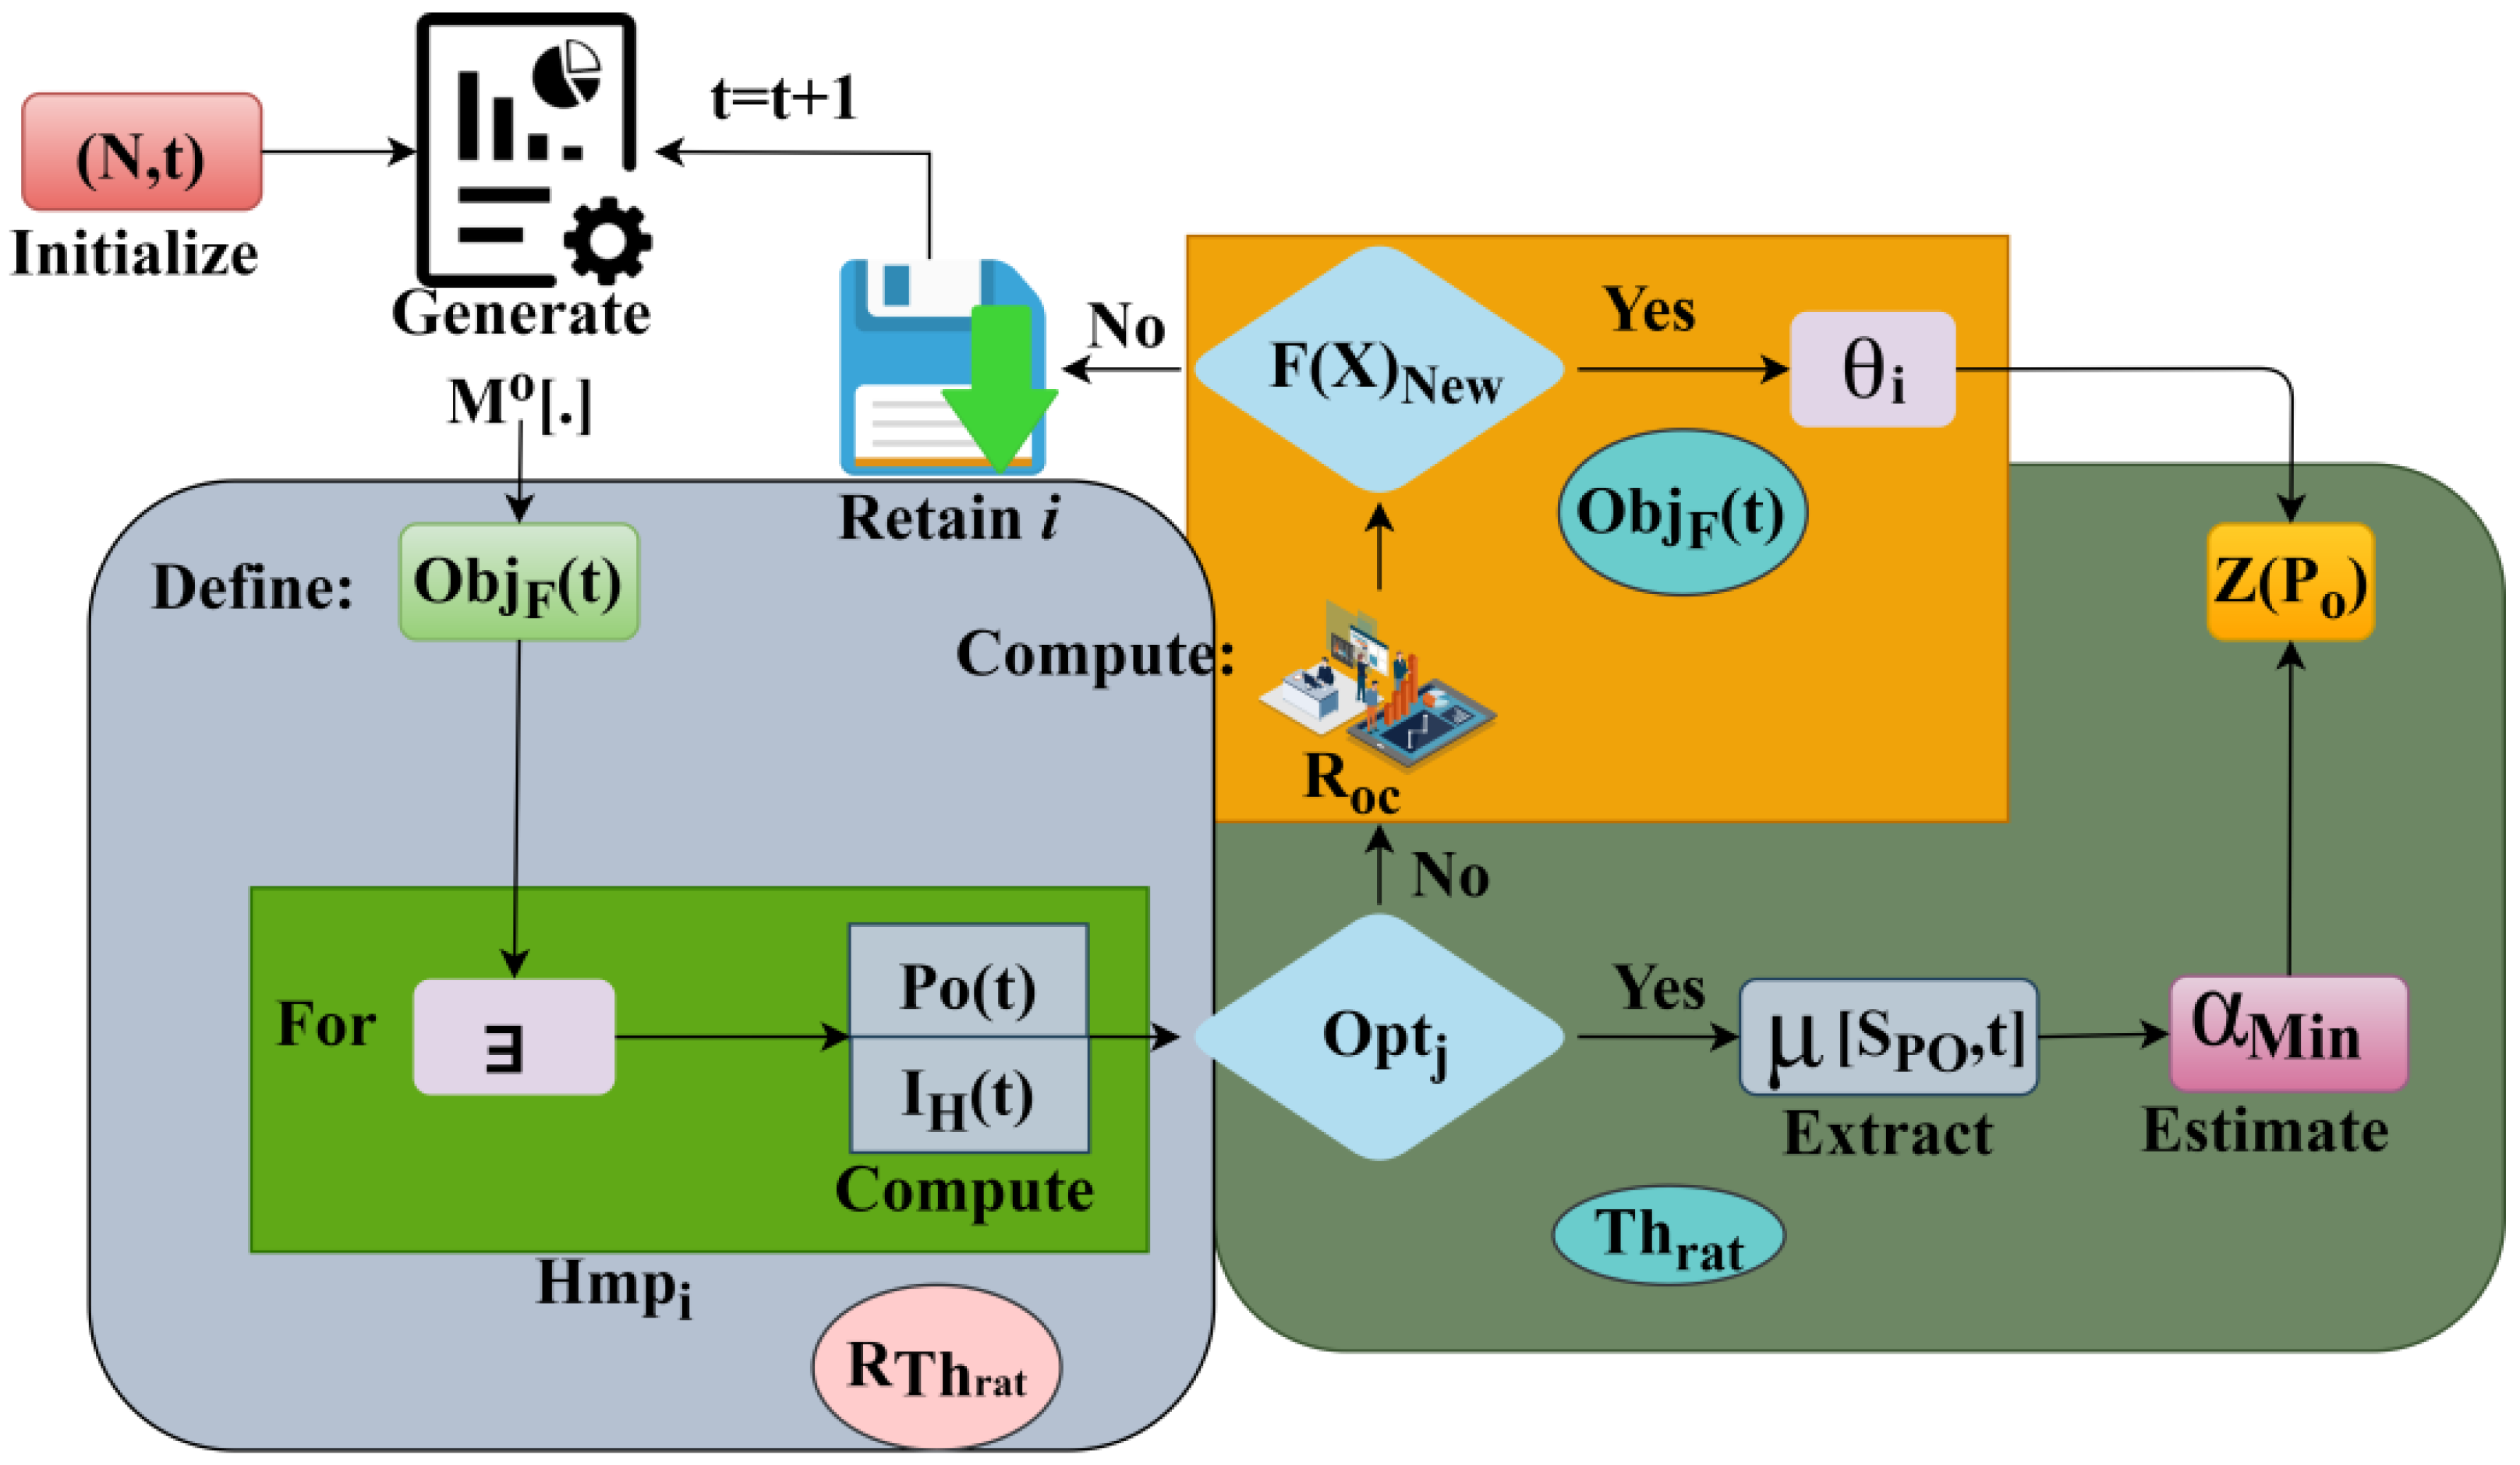
Figure 4.
The initialization is performed using
for retaining
and
estimation. It is to be noted that the above is performed under
for the
used. Considering the
under
the
is used for training
. Depending on the
requirement the
is computed
. This is required for
pursued out of which the least is used for
(
Figure 4). Fuzzy optimization is performed based on the mimicking operation, which helps to easily identify the processing interruption and halt occurrence. The factors of process interruption and production outcome are calculated to be changed using fuzzy optimization since these factors address controlling the exploitation and exploration of the harmony search domain. The min and max changes in outcome and risk in industry 4.0 are identified using the HSA algorithm, and this process is important to tune the fuzzy optimized solution. The FHS can be useful in adjusting the mimicking crossing/failing rate behind the threshold for identifying risk and disconnecting that source by the algorithm to find the optimal output. Therefore, the variations in these factors are identified to achieve a better decision. The improved harmony search algorithm (IHS) is generated to gain new production outcomes that enhance the precision and convergence rate of the fuzzy harmony search algorithm. To compute the control performances of security threats in wireless communication networks, a new source is generated with the mediated acceptable limit that ranges from
. Each fuzzy threshold consists of minimum and maximum mimicking occurrence for respective production outcome and risk.
This defines the possible objective output; the riskless and profitable outcome was successfully decided on to join them for generating various fuzzy operations for the mimicking of occurrences of outcome and risk. Based on the article, the recommended values for the available factors from 0 to infinity, in this condition, the range
to
and
to
were used for better outputs using the fuzzy optimization. The fuzzy harmony search for performing mimicking operations relies on
and
or
for a better decision. The case of
satisfies riskless industrial processing. From the above,
is identified as the threshold occurring instances. With the use of the fuzzy harmony search technique and ERDAT, the high objective function is required to detect and mitigate cyber risk detection. This process classification helps the wireless communication industry 4.0 to reduce data analysis time and production monitoring time while increasing cyber risk detection and profitable outcome in the industries. Based on the prediction plan and rules, the fuzzy threshold occurrence is identified to improve for FHS with a large number of profitable outcomes. This proposed technique reduces maximum interrupt span and halted schedules. Therefore, the stored industry information is handled for further prediction planning for the next source processing. In this case,
is considered for identifying the cyber risk and preventing its impact on the industry. The mimicking crossing and failing behind the threshold is identified for minimizing overlapping processes based on accumulated and extracted factors from industry 4.0. The dataset from [
30] is used for assessing the proposed techniques’ performance. Precisely, the operations of a gas turbine control system are recorded and presented for analysis using a hardware-in-the-loop emulator.
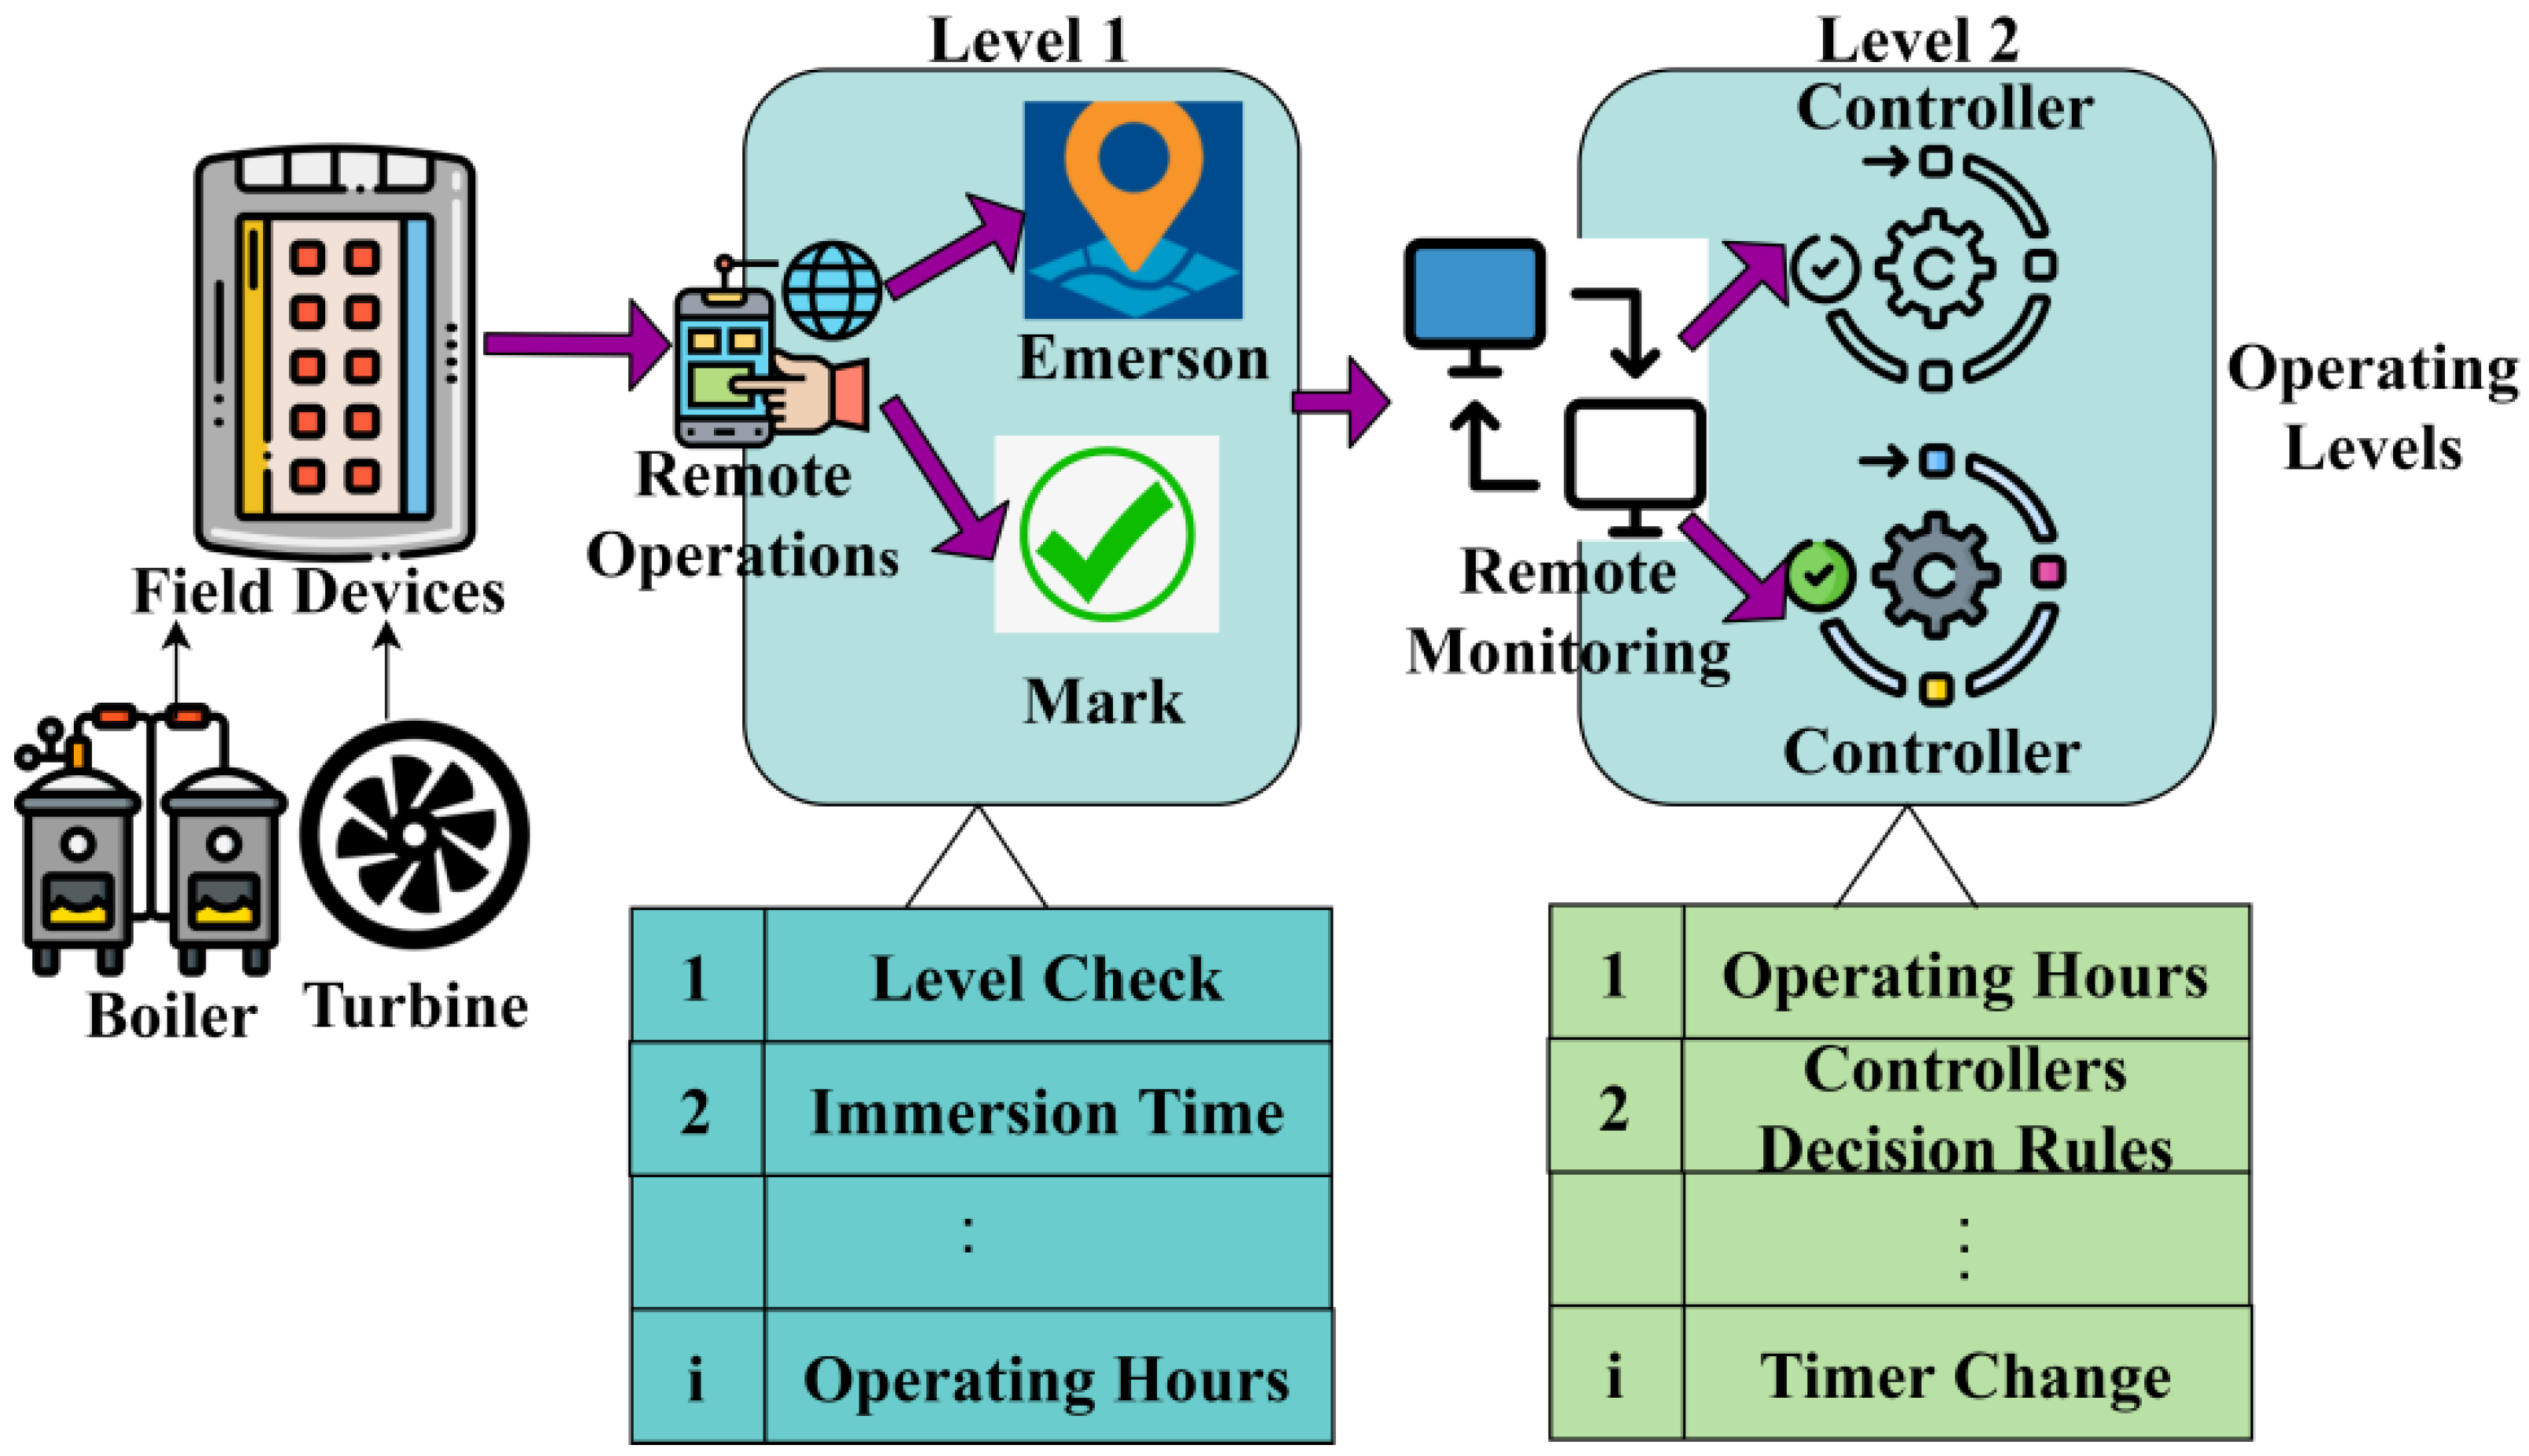
Figure 5 presents the overview of the control system process with the rules associated.
The component overview is presented in
Figure 5 from the given dataset, along with the rules and operations. It includes Io devices, PLC controller’s emersions marks level indicators, etc. The rules associated with different levels that are associated with the operations are presented. The rules are modified based on the operations and their outcome. In this process, 114 rules are used for operating the gas turbine for a continuous 2 h (
Figure 5). The production outcome and risk mitigation are computed for improving the wireless communication industry processing accuracy at different time intervals. The fuzzy threshold is identified at the time of mimicking operation based on data processing and production monitoring instances in industry 4.0. Therefore, the accumulated industrial data processing is not prolonged for risk detection and mitigation. Further prediction planning is used to forecast risk occurrence and mediate an acceptable range of mimicking occurrences between the risk and scheduled production outcomes at
. Cyber risk detection is maximized for optimal decisions without increasing the halted schedules and detection time. The remaining processes maximize interrupt span based on outcome and risk for preventing overlapping sources in smart industries. The changes in particular communication production and risk are moved to new communication using FSA. Hence, the maximum production outcome and minimum interruption are achieved for better decisions, thereby reducing risk detection. Then the overall working process of the fuzzy harmony search based cyber risk identification processing steps are described in
Table 1.
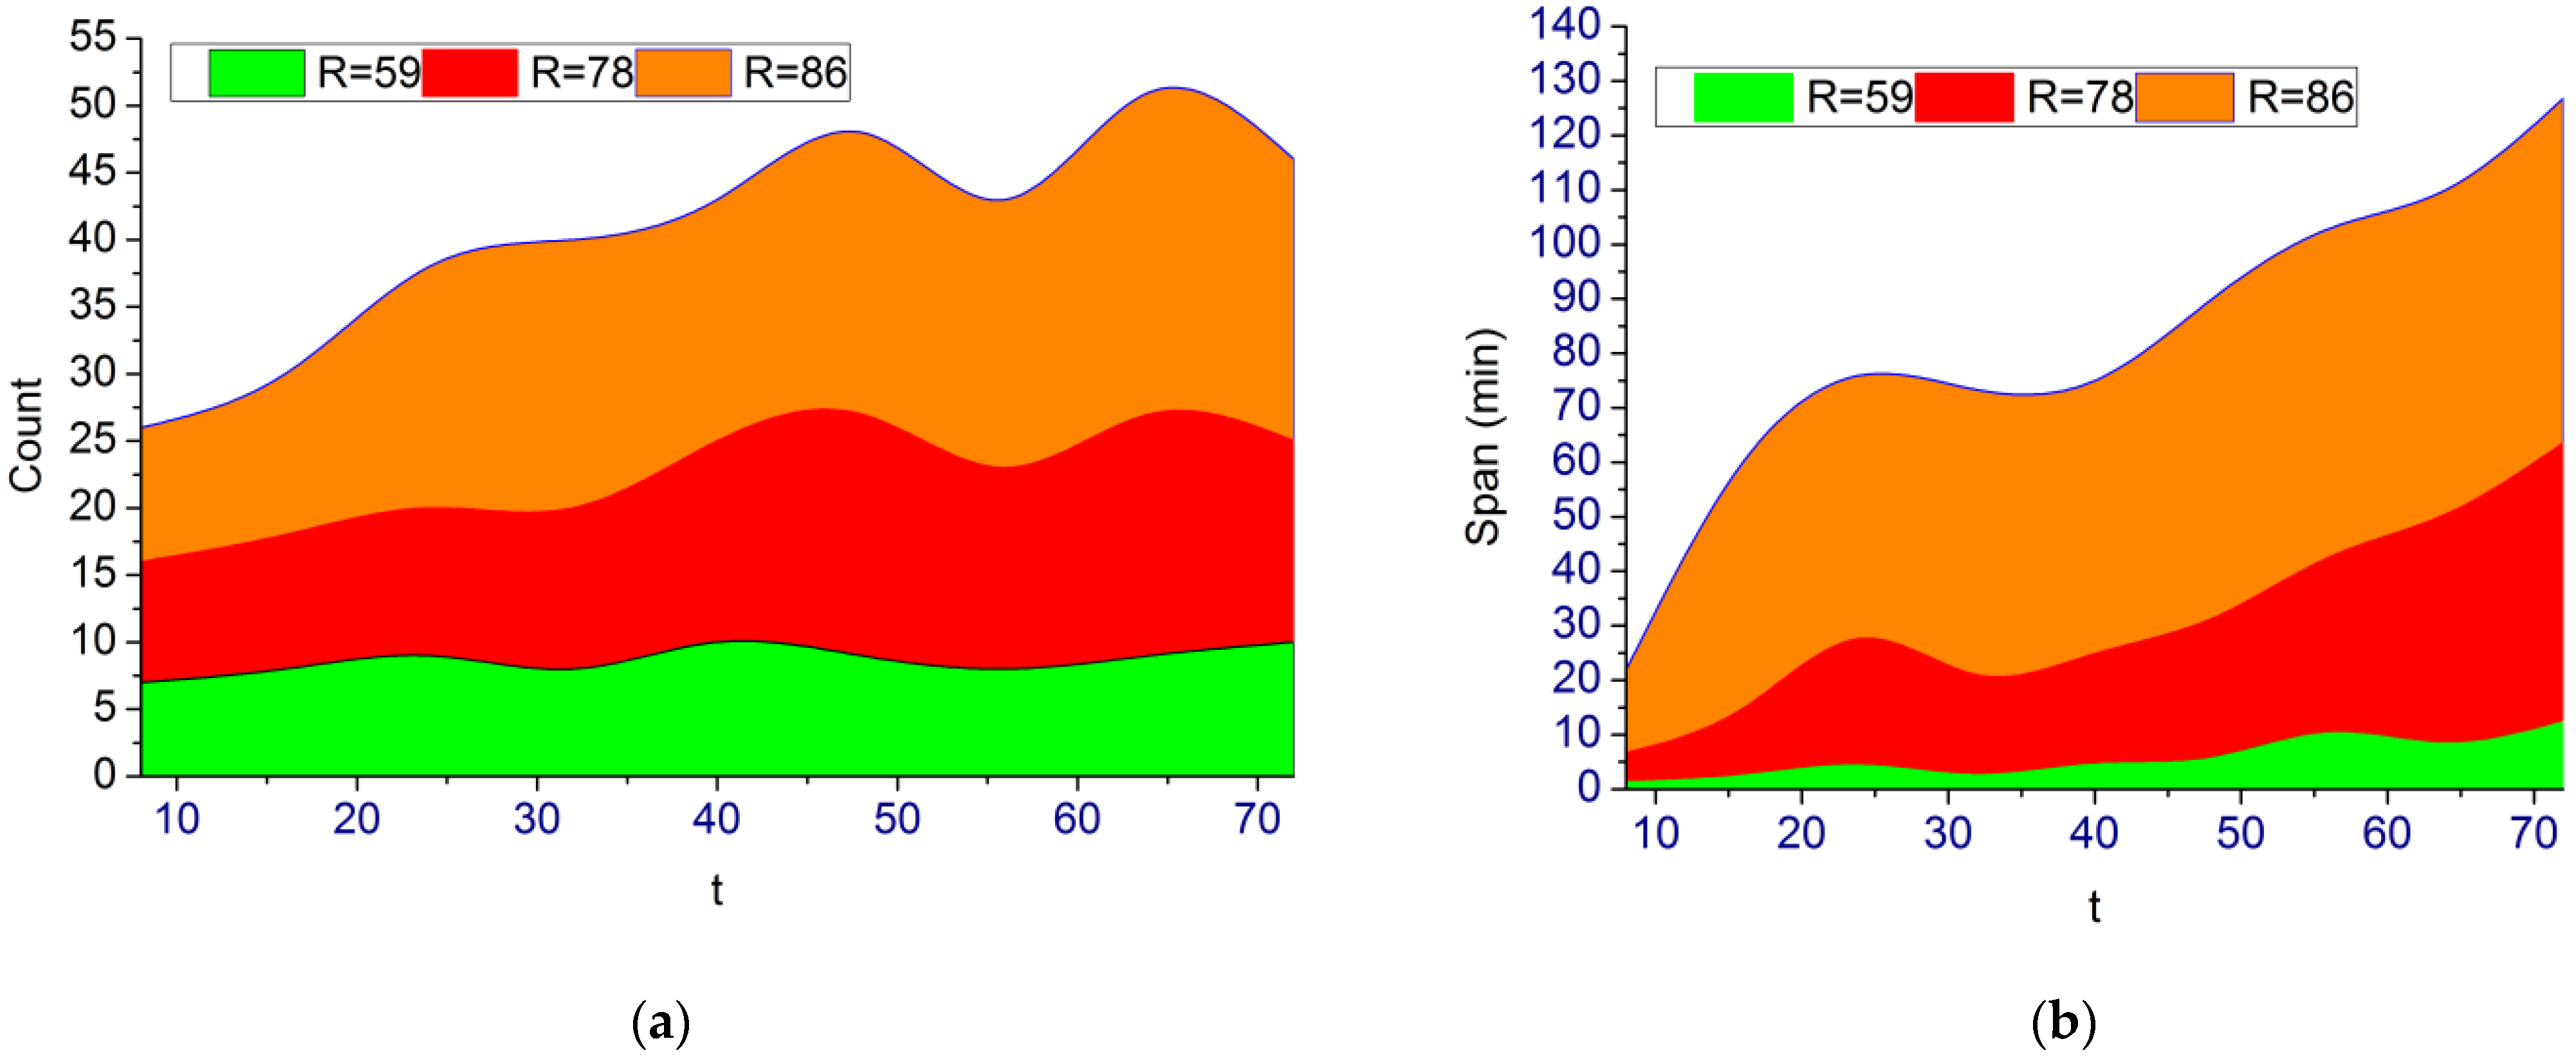
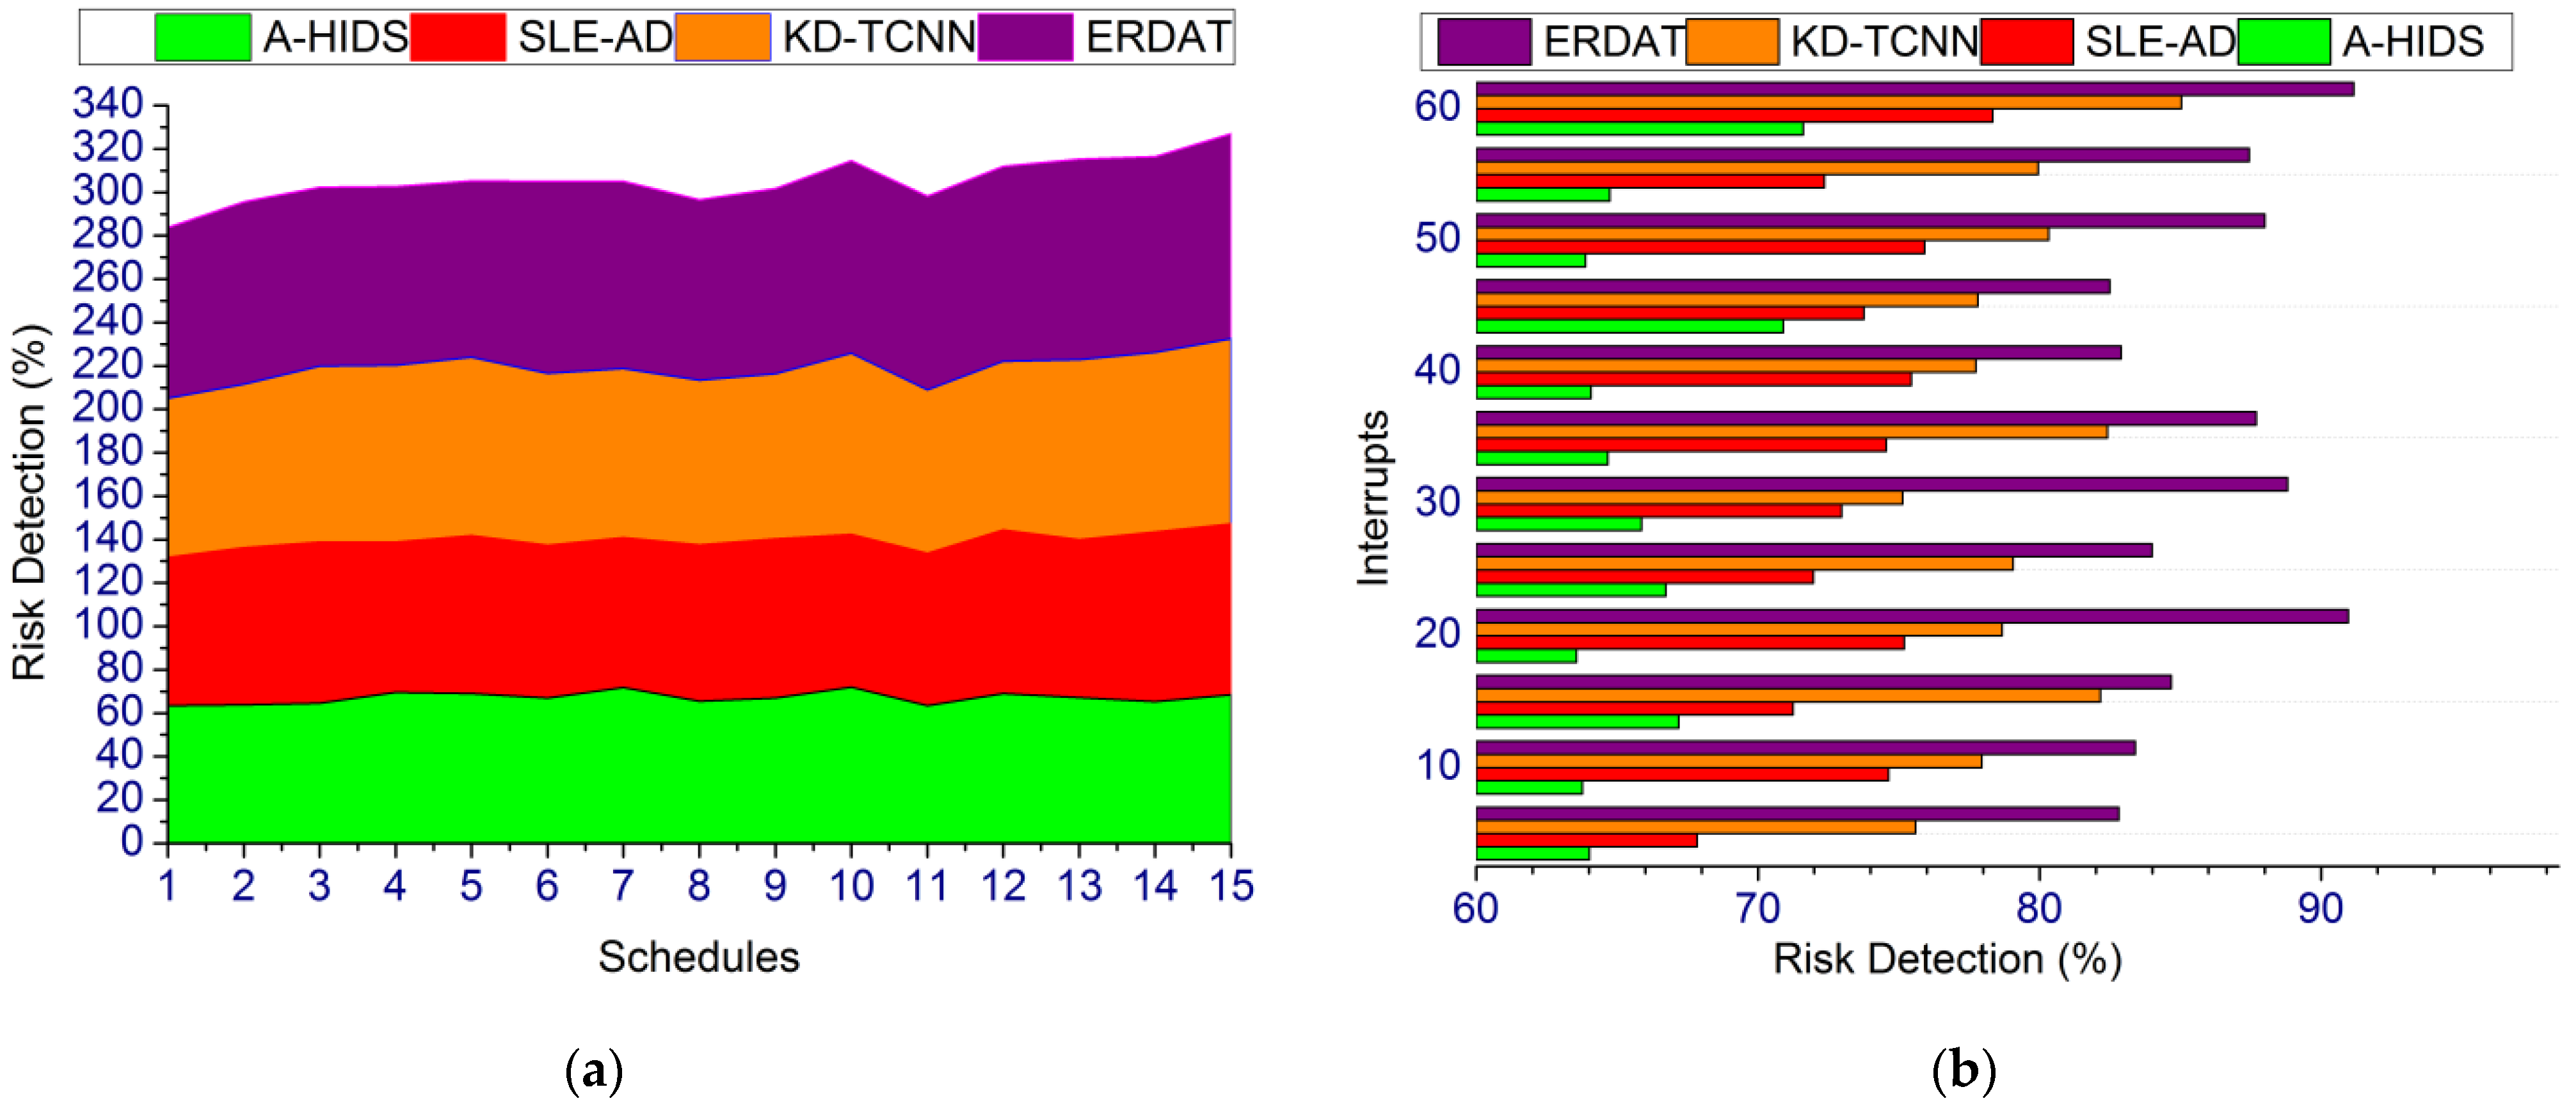
The first analysis is for the actual risk counts detected and the rule estimation, as given in
Figure 6.
Based on the provided data, the
is varied for estimating the count and span. As the
increases,
and
varies for which the detection is performed. Therefore the
is performed for maximum halts under varying
. In the
process the
for the varying
and
is analyzed in
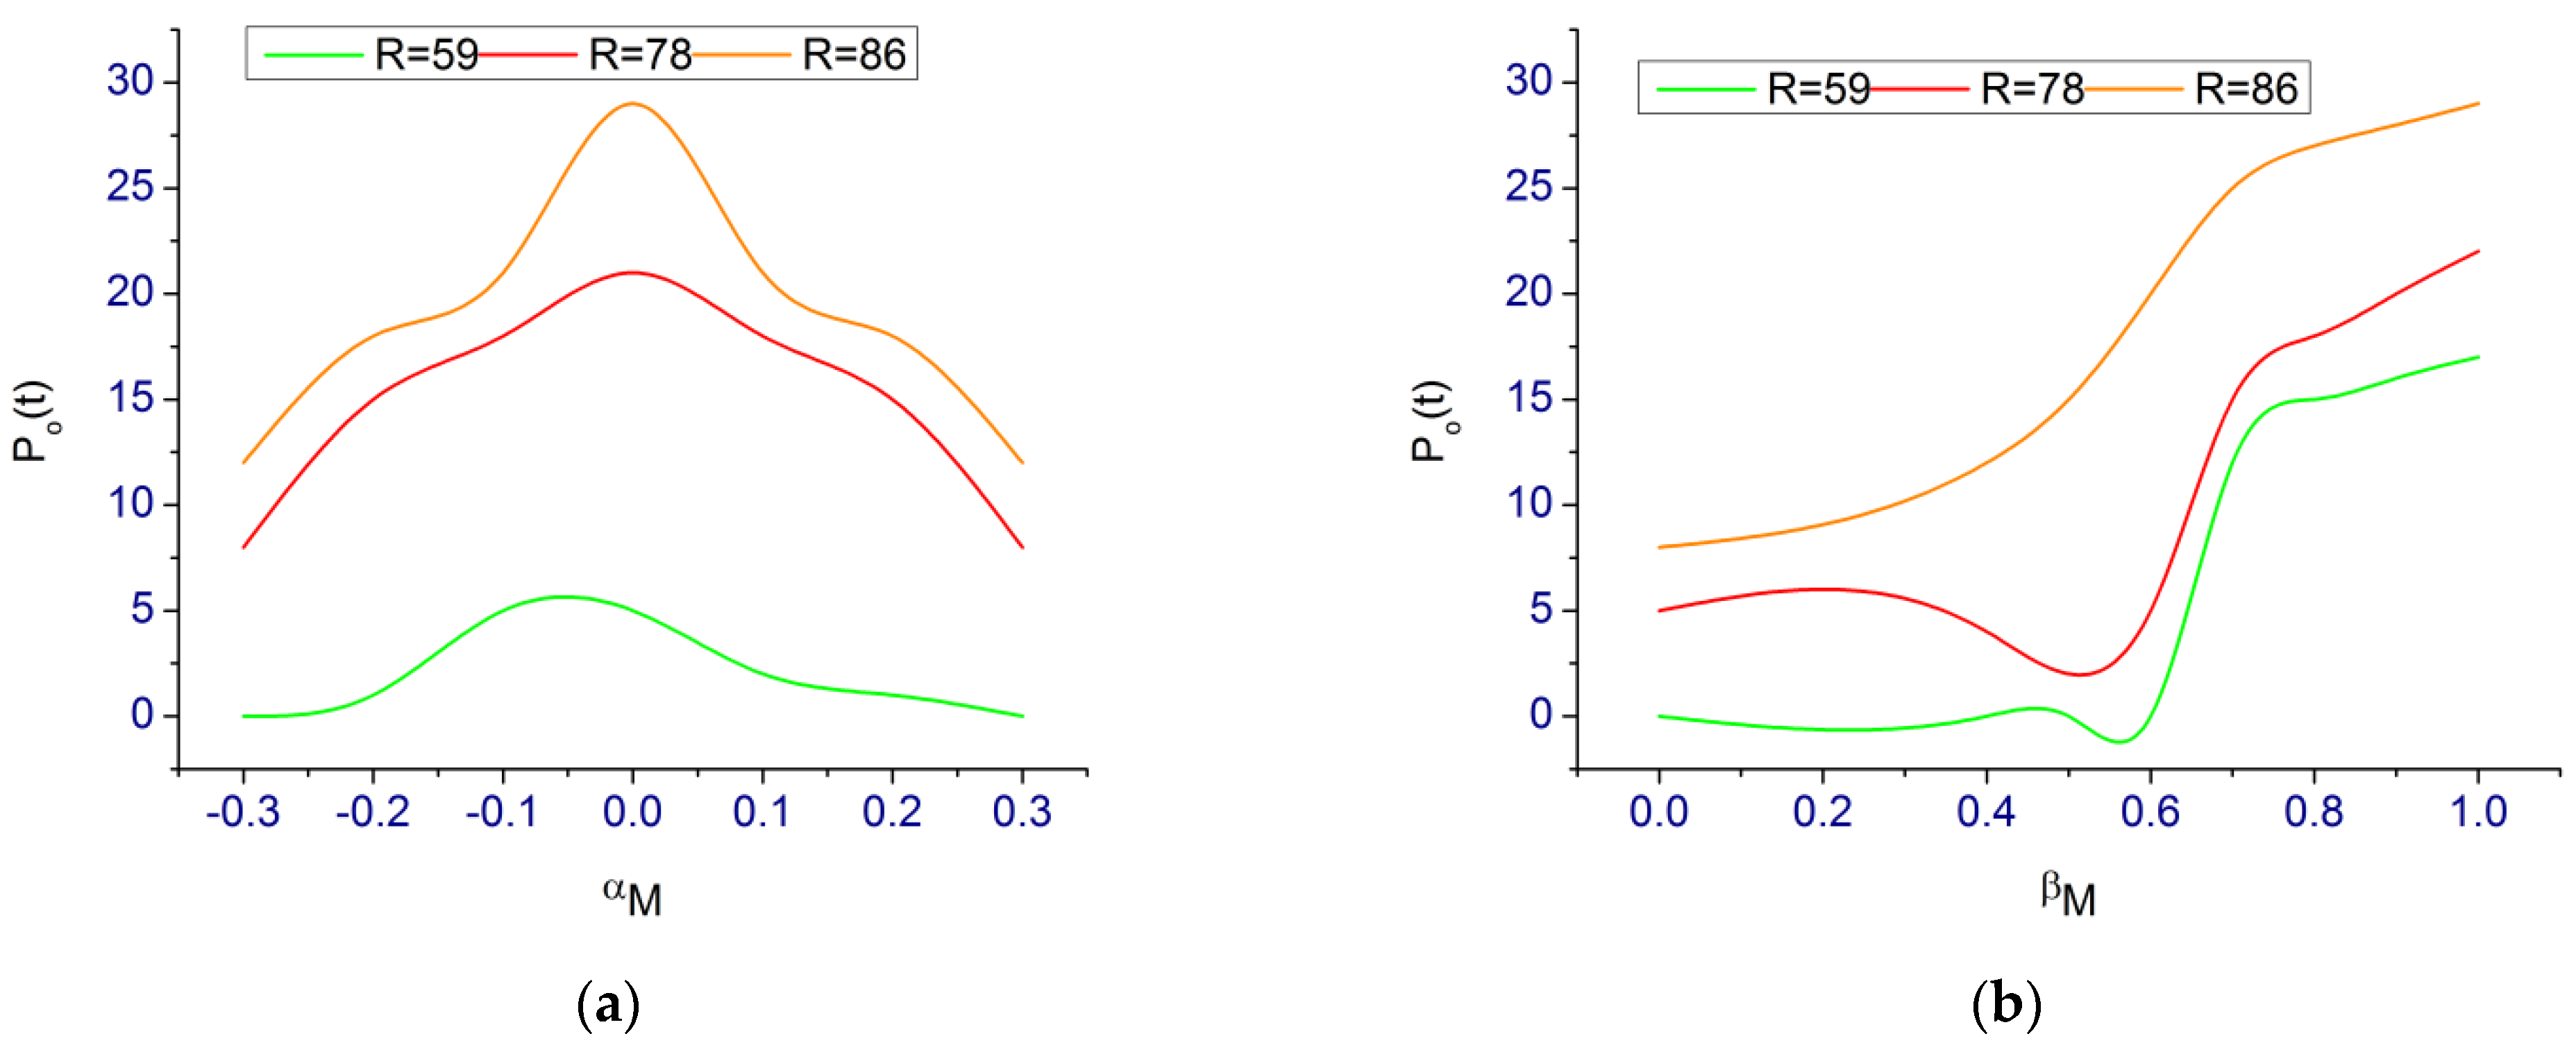
Figure 7.
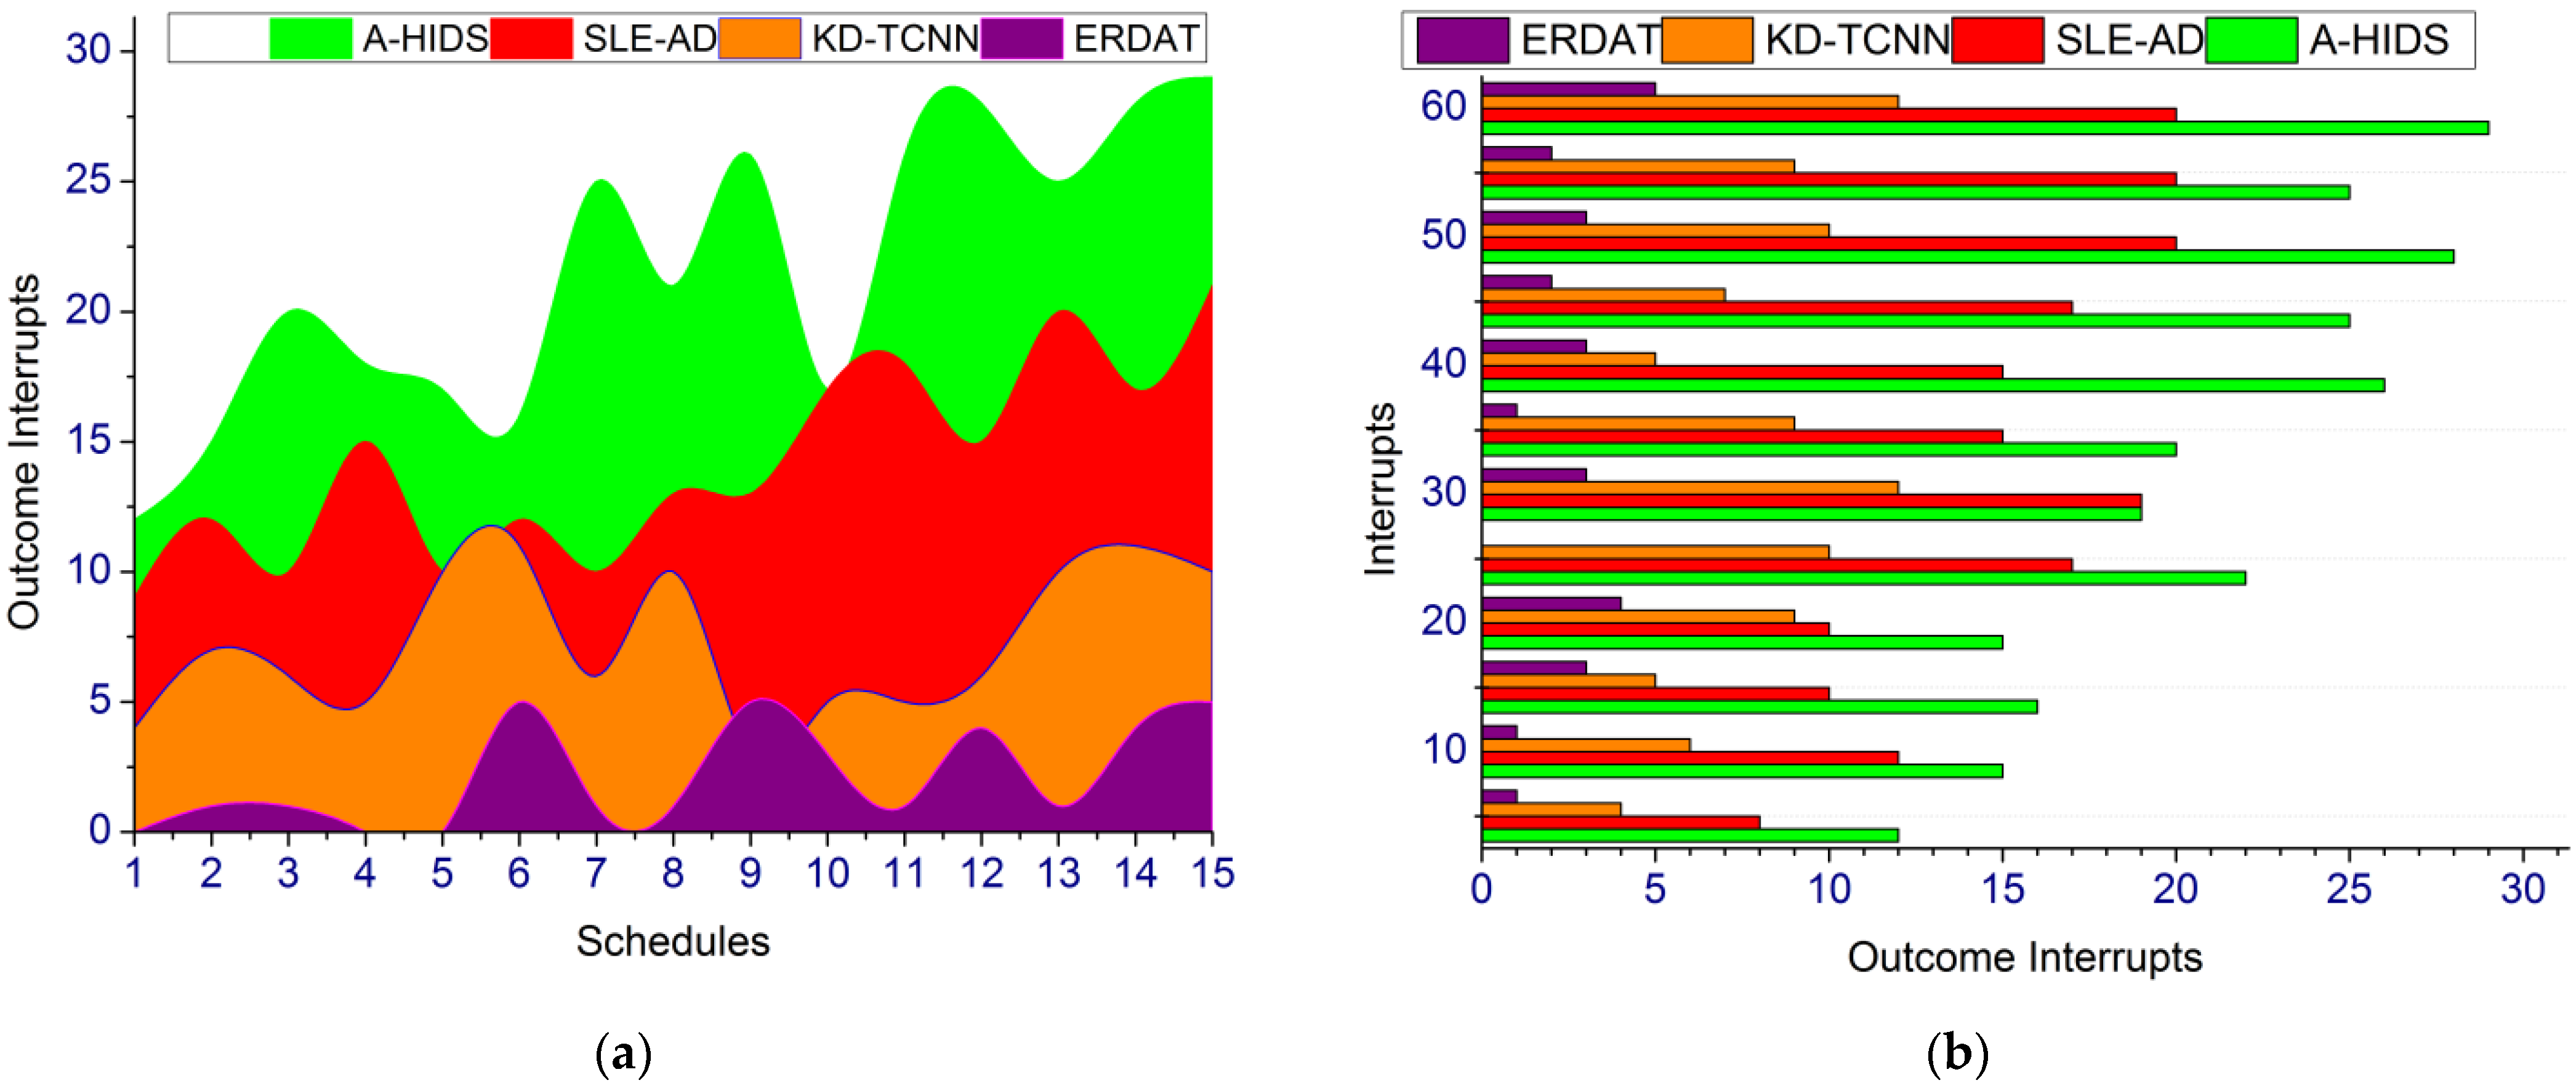
The analysis is performed for
under the varying
(Range: −0.4 to +0.3) and
(Range: −0.4 to 1) in
Figure 7. This is determined using the
wherein
classifications are performed using
. In the varying processes (level 1 and level 2), if
then
is retained and therefore the
and
as in Equation (7) is obtained. It satisfies the maximum conditions in the HAS due to which risks are thwarted (
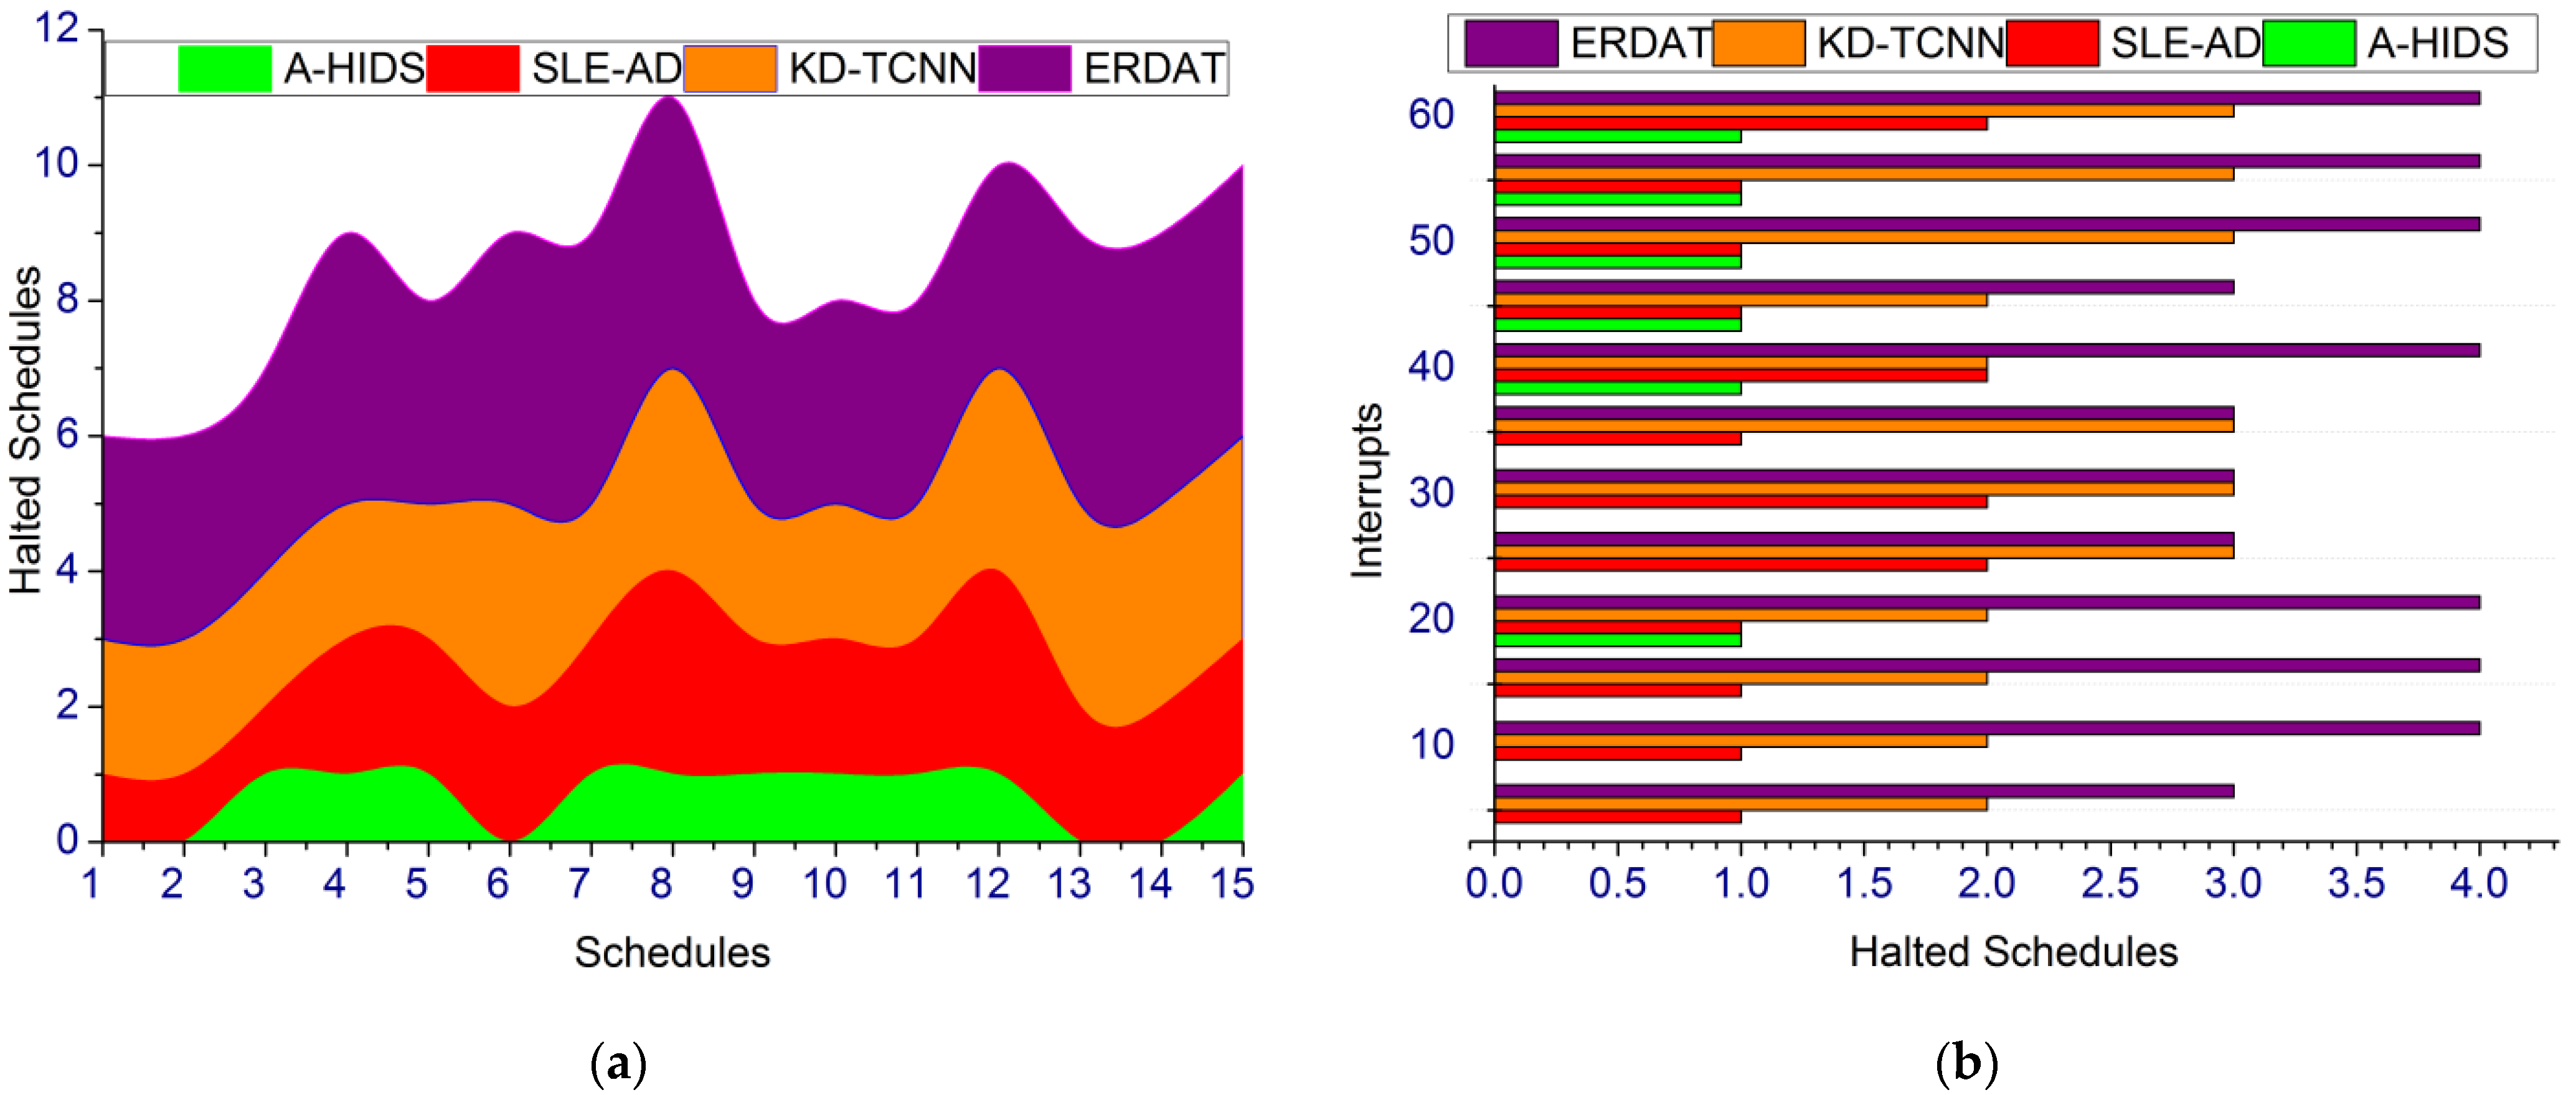
Figure 7). In the final analyses, the High
and
are analyzed for different risk factors, as presented in
Table 2.
The risk is focused on Io devices or controllers
or the monitoring systems
. Based on the risk factor,
is initialized that is handled under
and
. If the
is high then
is less, however, the variations are less for different operation levels. Therefore
maximum is achieved as high compared to
. At some time instance such as
the n
is also high. This indicates fewer outages for the varying processes. Based on the
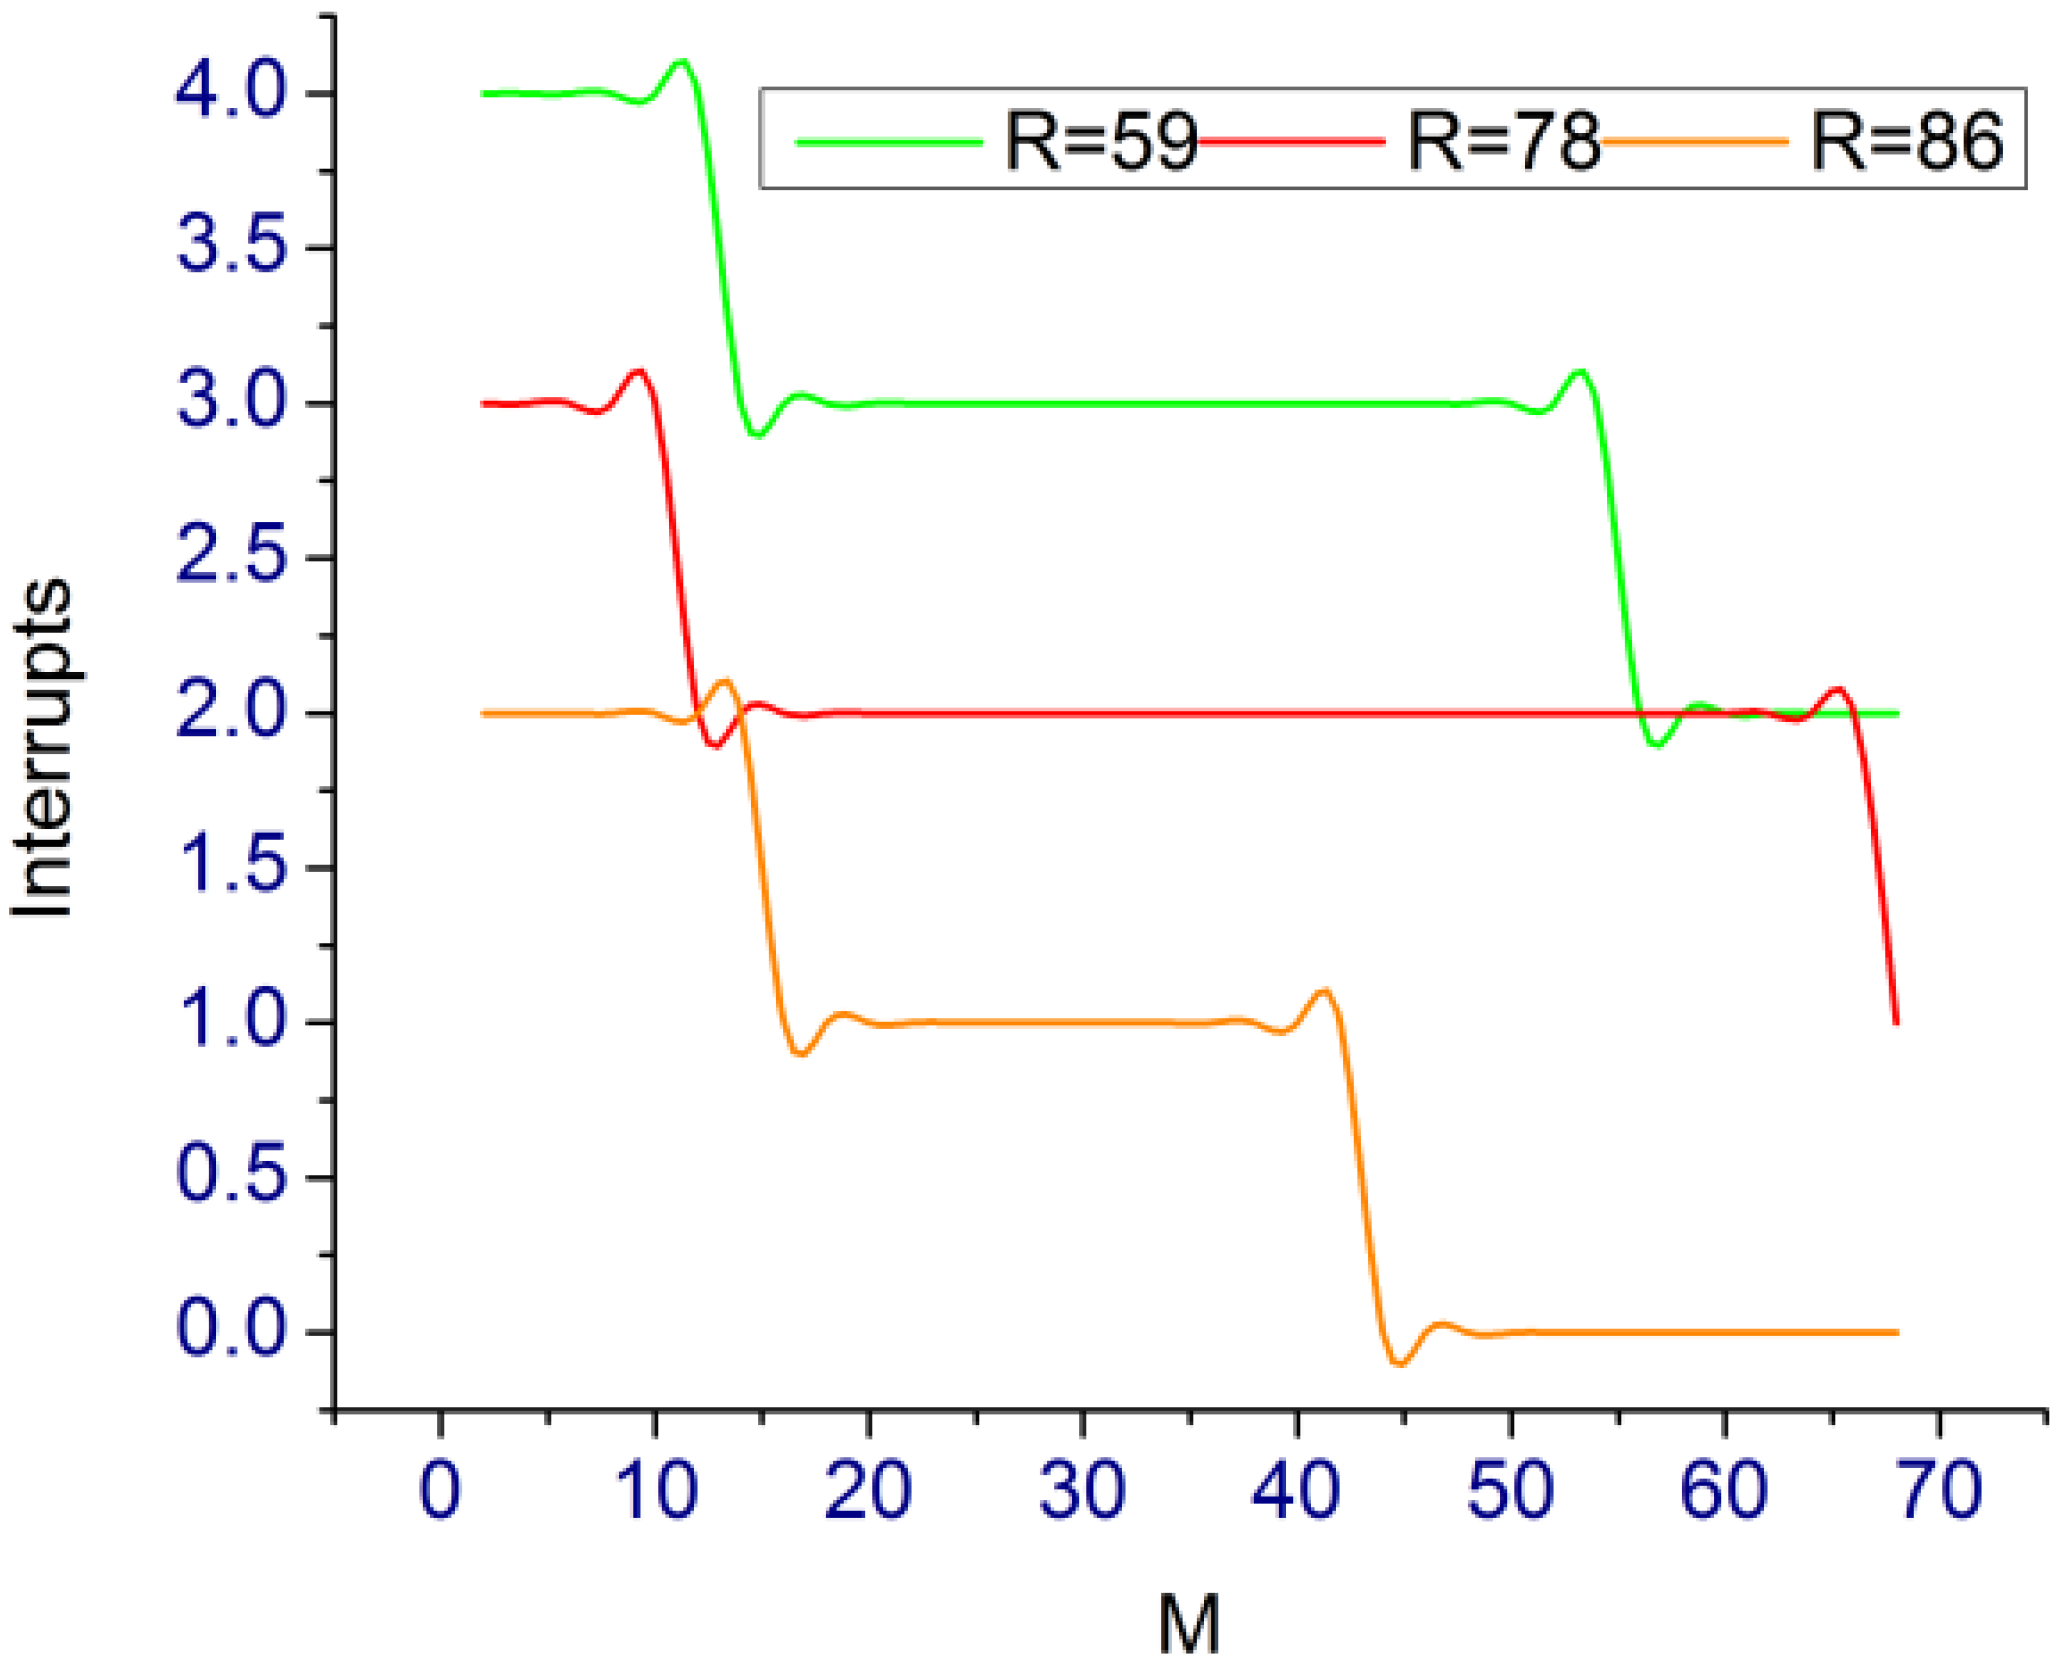
, the interrupt analyses are presented in
Figure 8.
The interrupt reduces as the
increases; out of 114, 68 are mimic classifying
and
. This classification provides
for further interval analysis such that
identifies the risks (
Figure 8). According to the discussions, the steps for conducting the T-test is given as follows.
t-Test Analysis
Initially, industrial processes are analyzed with the help of the industrial wireless communication process. The cyber risk related data is collected with the help of the communication process. During the analysis, the fuzzy harmonic approach is utilized to evaluate the industrial performance to detect the risk factor. The collected risk related information is prepared and analyzed using statistical methods. Define Hypotheses: Define the null hypothesis and alternative hypothesis. The null hypothesis is that there is no significant difference in the effectiveness of the fuzzy harmonic approach and existing risk detection methods. The alternative hypothesis is that the fuzzy harmonic approach is significantly better than existing risk detection methods.
Calculate T-value: Calculate the T-value using the following formula:
In Equation (16) X1 and X2 are the means of the two groups being compared, S1 and S2 are the standard deviations of the two groups, and n1 and n2 are the sample sizes of the two groups. Then degrees of freedom have been determined (df) using the following formula:
Determine the critical value of T using a T-table or statistical software. This is based on the desired significance level (usually 0.05 or 0.01) and the degrees of freedom. Compare T-value and Critical Value: Compare the calculated T-value with the critical value. If the calculated T-value is greater than the critical value, then the null hypothesis can be rejected, and the alternative hypothesis is accepted. This means that the fuzzy harmonic approach is significantly better than existing risk detection methods.
Interpret Results: Interpret the results and draw conclusions about the effectiveness of the fuzzy harmonic approach for cyber risk detection in industrial wireless communication.


