1. Introduction
The design of refrigerants, fine compounds, evaporative crystallization, and chemical reactions all require knowledge of enthalpy of evaporation, which is a basic component of chemical research. A portion of the real enthalpy of evaporation data for organic compounds has been gathered by experimental techniques including the calorimetry method [
1] and the vapor pressure method [
2]. Yet, given the volume and diversity of substances used in business and research, these data are insufficient. With the demands of production and scientific research, new compounds are often encountered for which the enthalpy of evaporation data has not yet been determined. Methodologies that are trustworthy and precise are needed to forecast the enthalpy of evaporation for unidentified substances.
The four primary techniques for forecasting the enthalpy of evaporation of organic compounds are Correspondence State (CS), Population Contribution (PC), Topological Space (TS), and artificial neural network (ANN). The CS technique, which is popular because it can accurately capture significant atom-to-atom bonding interactions, predicts the enthalpy of evaporation using a set of atom-centered parameters and a global energy term. Based on the idea of molecular interaction energies derived from molecular orbital theory, the PC technique is a statistical mechanical approach that directly predicts enthalpy of evaporation from molecular characteristics. The TS technique, which forecasts evaporation enthalpies using topological indices and relationships, is appropriate for big molecules with intricate connectivity patterns. The ANN approach, which has enhanced accuracy and the capacity to handle massive datasets, employs a network of trained neurons to estimate enthalpies of evaporation based on molecule structure.
In conclusion, the Correspondence State technique, the Population Contribution method, the Topological Space method, and the Artificial Neural Network method are the main approaches used to forecast the enthalpy of evaporation of organic molecules. The Van der Waals equation of state and a Correspondence State equation with two or three parameters are used in the Correspondence State approach [
3,
4,
5], a mathematical technique to simulate the properties of actual gases. Although it has been utilized in several studies, its use is restricted because of its poor prediction accuracy and the need for understanding the substance’s key properties. The topological structure of molecules is described in greater detail by Topological Space techniques [
6,
7], which improves the accuracy of predictions of physical attributes. Using chemical structure description codes, artificial neural network methods [
8,
9] have also grown in favor for their capacity to predict compound attributes. These techniques, though, are difficult and inappropriate for routine calculations.
The Group Contribution Method is regarded as the most adaptable and largely reliable approach for calculating physical attributes. With the advantages of quick estimation and suitability for everyday use, this method uses groups as the fundamental unit of contribution and derives or regresses a small number of group parameters from a large amount of physically available experimental data to predict the properties of unknown compounds. Since it was first proposed in 1923, the Group Contribution Method has undergone continuous development and improvement. Researchers have improved equations’ structural correction terms, multiplied the number of groups, and increased the complexity of models, significantly advancing our ability to predict compounds’ basic properties. Some of the methods developed for predicting the enthalpy of evaporation include the Monofunctional Group Parameter Method [
10], the Bifunctional Group Parameter Method [
11], the CSGC Method [
12], the C. Yu Method [
13], the Tertiary Functional Group Contribution Method [
14], and the Second-Order Group Contribution Method [
15].
All the aforementioned strategies for collective contributions, however, suffer from a limitation. While having a significant capacity for prediction, the group contribution technique with complex equations has a narrow range of applications and is challenging to divide into smaller groups. The group contribution approach with a straightforward equation provides a broad range of predictions but a somewhat limited predictive power. Moreover, several group contribution techniques have various group splitting options. The group division of some Group Contribution Methods is very complicated, and there are hundreds of groups. It is not easy to ensure that users can quickly and accurately disassemble the molecular structure without reference to the specific group structure. This means that the step of breaking down the molecules can take up a lot of valuable time for new users. In order to meet the needs of scientific research, a new method with a large prediction range, high precision, and simple operation is urgently needed.
In this paper, building on previous work [
16,
17], we develop an elemental and chemical bond-based model to predict the enthalpy of evaporation of organic compounds at their normal boiling points (EBH method). The EBH method employs a new approach to group splitting, which significantly reduces the difficulty of group splitting. Moreover, the new method accounts for silicon-containing groups, thus effectively predicting silicon-containing organic compounds. This method entails fewer model parameters, yet its prediction ability is reliable, with a notable improvement in its prediction range.
2. EBH Method
2.1. Methodology
According to the theory of molecular structure, the most minor component of a material is a molecule, which may exist independently and preserve the generally stable physical and chemical properties of that substance, the elements and the bonds that hold them together chemically make up molecules. Hence, the elements and chemical bonds that make up a molecule are what determine the thermodynamic properties of the molecule, such as enthalpy, entropy, and free energy. J. Hou et al. [
18] published. “Topology of two-dimensional C60 domains” in the British journal
Nature, which proved elements and chemical bonds really exist in the molecular. This paper also describes “the observation of images of a single C60 molecule that can distinguish chemical bonds using scanning tunneling microscopy”.
This demonstrated that the elemental and chemical bonding approach proposed by S. Xiang et al. is theoretically feasible. After nearly 20 years of development, researchers have proposed methods to predict the boiling points [
19], critical properties [
16] of organic compounds, and constructed the G
E-EOS model [
20] using the elemental and chemical bonding method as the primary research method. In summary, the elemental and chemical bonding method has been repeatedly proven to be a reliable and accurate method for group contribution.
The EBH method uses elements and chemical bonds as the main contributing groups, where chemically bonded groups are divided into two categories depending on whether the bond is located on a ring. The method simplifies the way in which groups are split and reduces the number of groups. In the face of the surge of new substances in modern chemistry, the 42 groups in the group library of the elemental and chemical bonding method can be used to synthesize almost all organic compounds and thus estimate the enthalpy of evaporation for all types of organic compounds.
Typically, the basic substance data for organic compounds contain ten elements such as C, H, O, and N, 25 non-cyclic chemical bonds such as C-C, C-H, and O-H, and one special chemical bond which is the benzene ring, and six chemical bonds located on rings such as the ring C-C, ring C-O, and ring C-H can be accurately estimated using this method. The difficulty of the group splitting process for organic compounds is reduced due to the small number of groups in this method. The group splitting in this thesis is the same as the study by J. Li [
16]. Furthermore, the EBH method has three main advantages over existing methods in terms of group splitting, as follows:
(1) The method singles out the benzene ring as a unique chemical bond and improves the accuracy of predicting the enthalpy of evaporation of compounds containing benzene rings, as the chemical bonds in benzene rings are different from the normal C-C and C=C bonds. However, existing methods for estimating the enthalpy of evaporation do not usually distinguish the benzene ring from C-C and C=C.
(2) The method improves the accuracy of predicting the enthalpy of evaporation for compounds containing a chemical bond on a ring versus those that do not. Based on the available experimental data, it can be seen that chemical bonds on rings and chemical bonds not on rings (e.g., carbon single bonds located on the main chain versus those attached to the benzene ring) contribute differently to the heat of evaporation of organic compounds, so a distinction needs to be made between them to predict data on the properties of compounds more accurately.
(3) The group libraries of the Joback [
21], Gani [
22], B-P [
23], and Joback correction [
24] methods used in the past do not involve silicon-containing groups and therefore cannot predict the enthalpy of evaporation of silicon-containing compounds. However, the present way takes complete account of the significance of studying the element silicon and its chemical bonding by including it in the range of separable groups. This allows the estimation of evaporation enthalpy data for silicon-containing compounds. This initiative provides for a more comprehensive class of predictable organic compounds.
Therefore, this paper is now based on the elemental and chemical bonding method to develop a model for predicting the enthalpy of evaporation of organic compounds at normal boiling points.
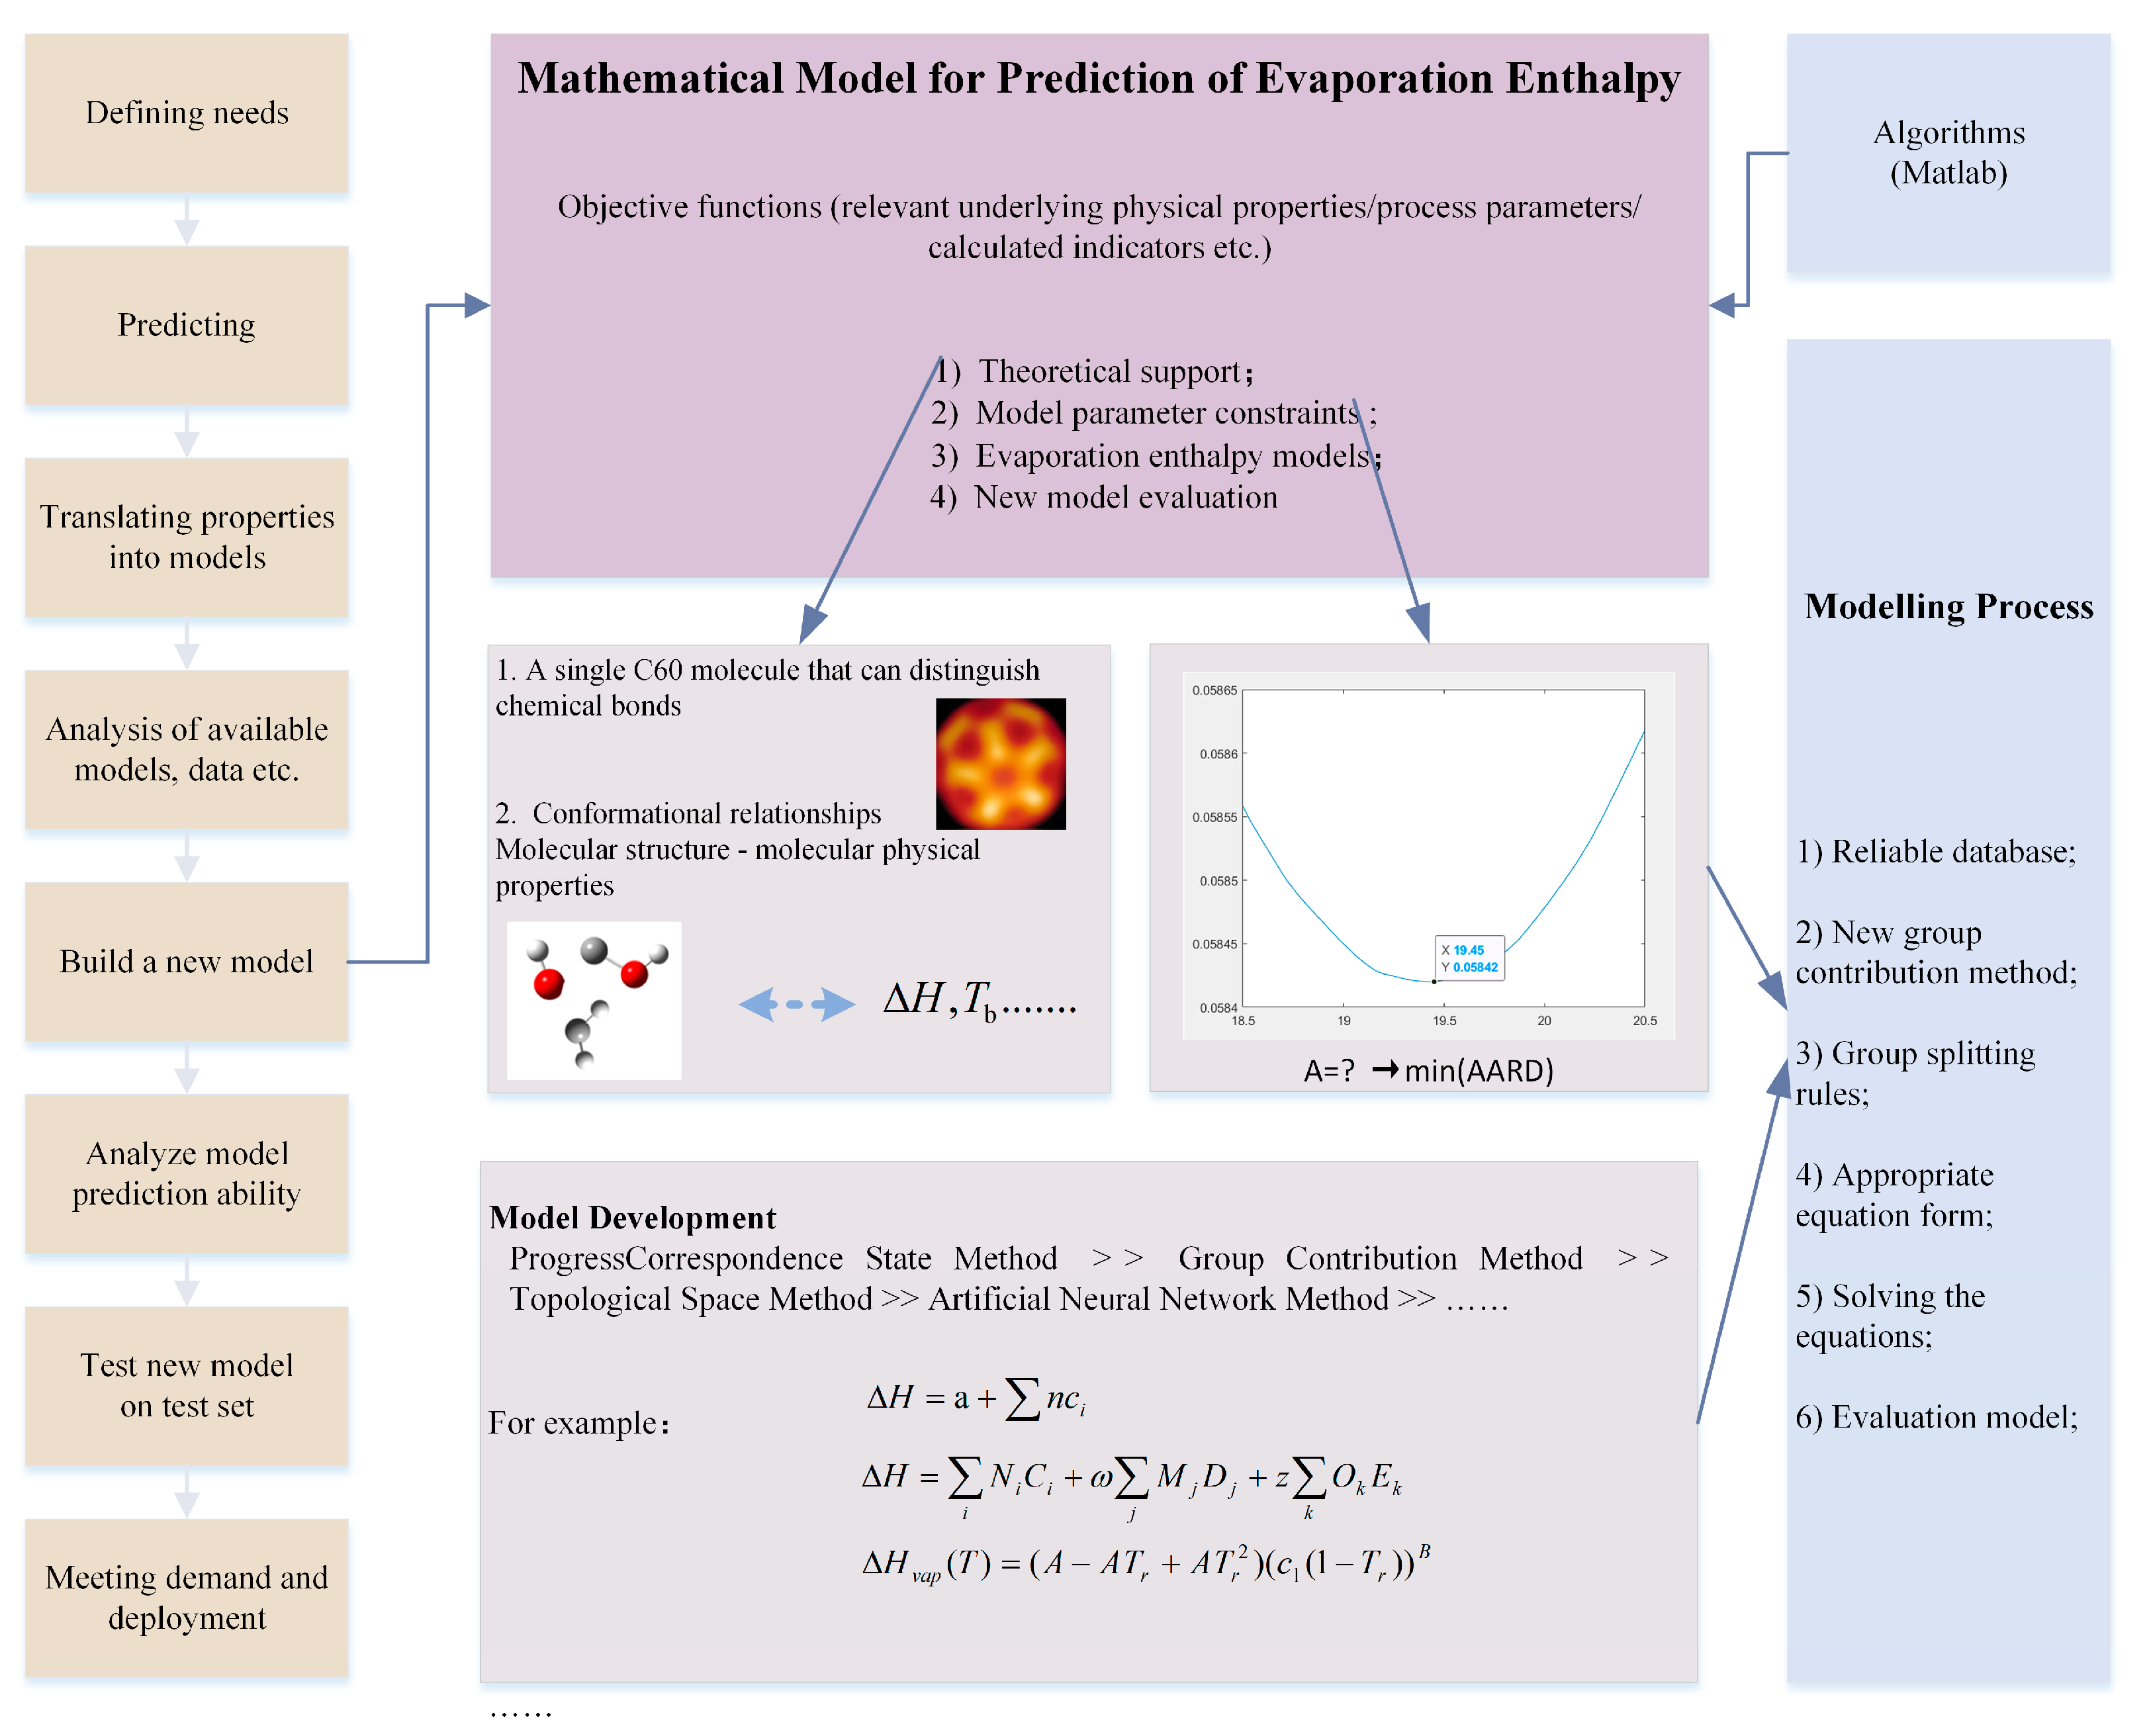
Figure 1 shows a block diagram of the design of an evaporation enthalpy prediction model. For a problem of predicting the fundamental physical properties of organic compounds, it is first necessary to define the research needs, set the temperature range to which the model applies, the type of organic compounds, etc. Next, the model and experimental data required to calculate the enthalpy of evaporation are studied and analyzed, on the basis of which a new mathematical model is developed. The model includes feasibility equations, constraints, process parameters, calculation indicators, etc. Finally, the optimization model is solved using a specific mathematical algorithm to obtain a design solution that optimizes the specified objective function. For this model, the objective function is to minimize the prediction error of the equation when the value of the group contribution and the process parameters reach a specific set of values.
2.2. Model Development
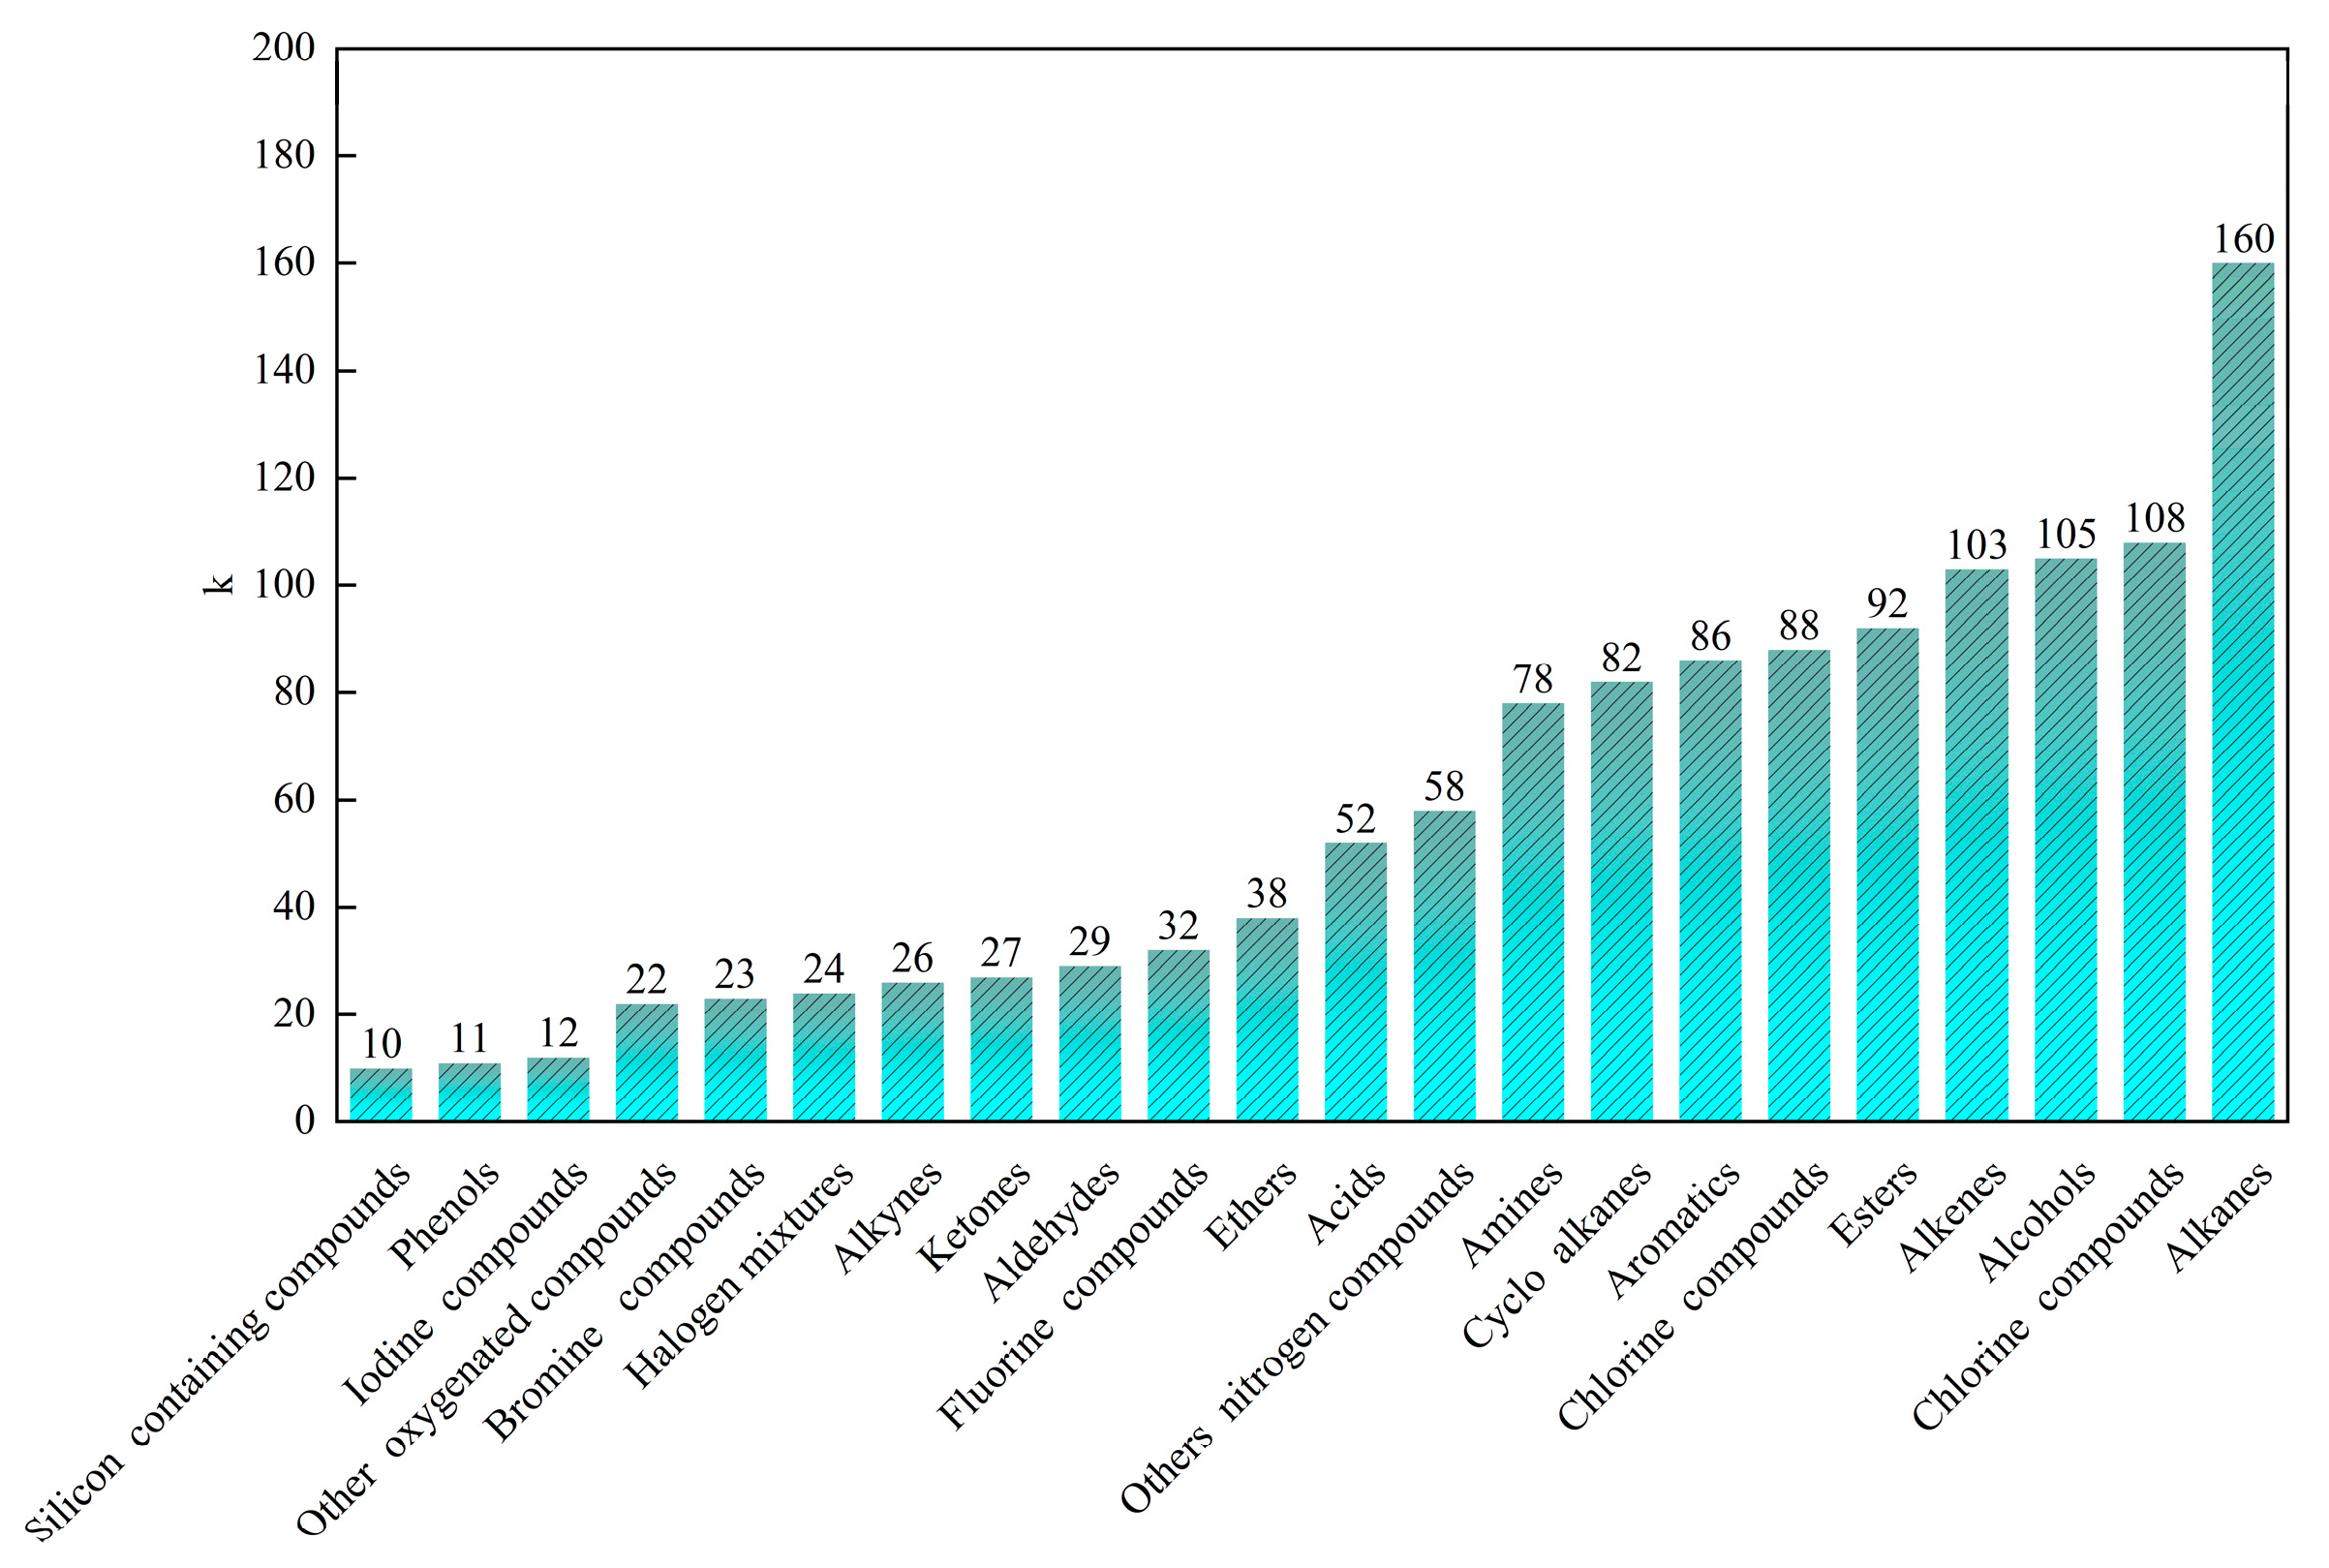
The development of Group Contribution Methods has been very rapid. The complex Group Contribution Method has seen the emergence of third-order group contribution values as well as a variety of correction parameters And improved accuracy but is more cumbersome to use. Based on a comparison and summary of previous related equations, Equation (1) is determined by reference to the Joback method. In practice, the user only needs to know the molecular structure and normal boiling point of an organic compound in order to calculate its enthalpy of evaporation data. The equation is simple in form and involves 43 unknown parameters. Moreover, in this paper, the equation was fitted by regression using measured evaporation enthalpy data for 1266 organic species from the literature [
25] by random selection. It is evident that the number of data points involved in the regression is much larger than the number of unknown parameters in the relevant equation, so the equation is well-extrapolated. The organic compounds used in the regression equation were classified into 22 categories, the detailed data of which are shown in
Figure 2. The organic species that make up most of these are alkenes, alcohols, sulfur-containing compounds, and alkanes.
In the initial stage of model development, we first collected a large amount of reliable molecular structure information and basic physical properties of organic compounds, such as normal boiling point, molecular weight, CAS number, etc. The molecular structures of all compounds were then decomposed according to this paper’s unique group splitting approach. Subsequent coding was performed using the Matlab software. The regression fit to Equation (1) was achieved by importing the molecular structure information of a large number of processed organic compounds into the coding program and setting the relevant program parameters. Equation (2) was obtained, where a = 19.45. The contribution values of each group received from the regression are shown in
Table 1. The final set of group contribution values and process parameters selected maximized the predictive power of the model relative to the other sets of parameters that were regressed simultaneously.
In order to further analyze the consistency between literature and predicted data, the organics are classified, and the predicted data are analyzed and processed in this paper. The average absolute relative deviation percentage (AARD) of the predicted evaporation enthalpy data was calculated for each category and all organics involved in the regression. This indicator is the key indicator in this study. Of course, several other critical statistical indicators were also calculated. For example, the percentage absolute relative deviation (ARD), the absolute deviation (AD), and the average absolute deviation (AAD). These indicators are defined by Equations (3)–(6) below. The final detailed analysis data for each indicator is shown in
Table 2.
Based on the error analysis results obtained above, the method was effective in predicting the enthalpy of evaporation for a wide range of organic compounds, with an average absolute relative deviation of 5.84%. For most classes of organic compounds, the prediction of evaporation enthalpies by this method is relatively reliable. In particular, the AARD was below 5% for silicon-containing compounds, alkanes, sulfur compounds, iodine compounds, cycloalkanes, and alkenes. The AARD for the vast majority of organic compounds remains within 8%.
Figure 3 shows how the predicted enthalpies of evaporation data obtained by the EBH method for 1266 organic compounds agree with the experimental data. As shown in the
Figure 3a, most of the data points for the new method are on the linear equation line. This indicates that the predicted data better agrees with the experimental data. Moreover, in
Figure 4, the error increases as the magnitude of the enthalpy of vaporization increases. In conclusion, the model is relatively satisfactory. This is because Equation (2) itself is straightforward in form and does not possess a complex mathematical form, not even using second-order group parameters, third-order group parameters, etc. The fact that such an equation can achieve such prediction results indicates that the method of predicting thermodynamic properties of organic compounds based on elements and chemical bonds is reliable and worthy of further study.
2.3. Model Reliability Validation
In order to check the reliability of the model, in this paper, 16 additional organics were selected from the literature [
25] that were not involved in the regression fitting process to validate and evaluate Equation (2). These 16 organics belonged to different kinds. In this paper, the predictive power of Equation (2) for each class of organic compounds is reflected by calculating the indicator values. The detailed evaluation data of the enthalpy of evaporation for each of these organic compounds are shown in
Table 3.
The evaluation results show that for most types of organics, the calculation errors are within the requirements. In particular, the results for esters, aldehydes, aromatics, phenols, amines, alkanes, and chlorine compounds were very accurate, with an AARD of less than 1%. The method also achieved good prediction results for most other organics. The maximum ARD is 5.76%, the minimum ARD is 0.10%, and the AARD is 2.15%. As shown in
Figure 3, the experimental values of the enthalpy of evaporation for the organics not involved in the equation fitting remained almost in high agreement with the predicted values. Therefore, the fitted sets of contribution values and unknown parameter values are trustworthy.
3. Comparative Analysis of Different Methods
In order to provide a more thorough comparison between the proposed EBH method and existing methods for predicting evaporation enthalpy of organic compounds, a number of widely used Group Contribution Methods were gathered for evaluation, including the Joback method, the B-P method, and the Gani method. Following the original literature, each method is evaluated using the prescribed steps. Experimental data on the enthalpies of evaporation of organic compounds were obtained from literature sources [
25] and utilized during this evaluation period.
In accordance with the available literature, the Joback method employs 41 groups including those containing halogens and a variety of groups containing the elements C, N, O, and S on the ring and not on the ring, respectively. The enthalpy of evaporation of a compound at normal boiling point is calculated by the Joback method using Equation (7), which is simple in form and incorporates only first-order groups and their corresponding contribution values. The B-P method presents 73 group contributions, as seen in Equation (8), which can cover a variety of organic compounds. The group contribution of the B-P method includes a certain number of alkanes, aromatics, and other substituents. The Gani method equation, shown in Equation (9), is more complex in form and employs a three-level calculation process with 125 first-order, 112 second-order, and 22 third-order groups. This method introduces molecular structure information, which improves the reliability of the prediction. Additionally, the notable number of groups in the Gani method extends the range of molecular characterization.
The present study evaluates the predictive power of three methods, namely the Joback method, the B-P method, and the Gani method, using the following procedures. Firstly, the Joback method is applied to identify the organic compounds that can be split based on the range of group libraries of the Joback method. The organic compounds are tn dided into respective molecular structures using the corresponding group splitting methods. Based on the obtained group contribution values, the enthalpy of evaporation of organic compounds is calculated using Equation (2). A comprehensive statistical analysis is conducted to compare the experimental and predicted data. The evaluation results are tabulated in
Table 4,
Table 5 and
Table 6. The state of agreement between the predicted and experimental data is shown in
Figure 4.
The EBH method is followed and compared with the three commonly used methods above. Several vital indicators are listed as a basis for comparison. For example, application range, percentage of average relative deviation, the percentage value of maximum absolute relative deviation, and number of ARD values greater than 50%. The specific data analyzed are shown in
Table 7.
It can be seen from the comparison results that THE estimation range of the EBH method is the widest, AARD is 5.84%, absolute error is 50.32, and there is only one data point with a relative error over 50%. The Joback method has a wide prediction range and low prediction accuracy, and the relative error of individual data points is large. At the same time, there are as many as 8 data points with a relative error of more than 50%. The low prediction range of B-P and Gani methods is due to the lack of certain groups and the inability to characterize all organic compounds in the database. As a third-order Group Contribution Method, the Gani method has the most accurate prediction ability in terms of prediction ability. The AARD of the B-P method is slightly lower than that of the EBH method, perhaps because the training set of 307 data points is only used in fitting the equation, leading to the ineffectiveness of group contribution value in predicting some complex organic compounds.
4. Results and Discussion
The results of this study show that the EBH method for predicting the enthalpy of evaporation is a relatively simple and efficient method that provides a reasonable degree of accuracy in its predictions. Our comparison with three other prediction methods suggests that the EBH method can meet the needs of scientific research to a certain extent. However, further research is needed to improve the accuracy of the predictions, particularly for organic compounds with more complex structures. Additionally, it should be noted that while the EBH method is relatively simple, it requires a significant amount of experimental data for accurate predictions, and may not be suitable for all applications. Overall, the EBH method provides a valuable alternative for predicting the enthalpy of evaporation in a wide range of organic compounds.
Firstly, the EBH method can accurately and extensively predict silica-containing compounds, which is the most prominent advantage over the other methods. The accuracy of the method’s predictions is high, with an AARD of 2.71%. The prediction range covers almost all organic compounds containing elemental silicon. Of the three methods, only the Gani method can predict a fraction of the silicon-containing compounds, and its prediction accuracy is slightly lower than that of the EBH method. The Gani method is limited in its ability to characterize silicon-containing compounds due to the lack of a comprehensive range of silicon-containing groups, such as >(SiH)−, >SiH2, −SiH3, etc.
Secondly, the EBH method has a relatively high prediction accuracy, with an AARD value of 5.84%. The error is slightly higher than that of the third-order Group Contribution Method, but overall, the new method greatly improves the prediction range and accuracy. Compared with the B-P method, the EBH method has little difference in error. Because the B-P method lacks the groups required for certain kinds of compounds, it does not apply to all compounds in our database. The B-P method lacks the contribution of sulfonyl groups, diazo groups, and some polycyclic aromatic groups. However, the group library of the EBH method is relatively complete, and it is relatively accurate in predicting the enthalpy data of silicon-containing compounds, sulfur compounds, alkanes, iodine compounds, cyclo alkanes, alkenes, and aromatics.
Finally, by comparing the ease of group splitting and the number of groups, it is easy to see that the Gani method and the B-P method have some more complex group structures and a far greater number of groups than the EBH method. The formulae for both methods are also more complex. As a result, the bulk splitting of organics takes up more time and effort for the user. However, the EBH method has only 42 groups, which are not only easy to disassemble but also very easy to remember. It is easy for the user to accurately disassemble the molecular structure of an organic compound without reference to the structure of the groups. The simplicity and ease of use of the EBH method are ensured to a great extent.
Surprisingly, when the EBH method was used to predict the enthalpy of evaporation for halogen mixtures and fluorinated compounds, the AARD values for these substances were 13.05% and 13.94%. This is not an ideal prediction result. The analysis of the study revealed the following main reasons for the accuracy of the prediction results. Firstly, as fluorine is too electronegative, it tends to form C-F bonds with high binding energy and strong stability. Therefore, the new method is not suitable for predicting the enthalpy of evaporation of fluorine-containing compounds. Secondly, as the method cannot distinguish between cis and trans isomers, it produces some intermediate values in the regression of the group contribution values. Therefore, the true molecular structure cannot be perfectly realized, resulting in a more significant error in the calculation of a class of organic compounds containing isomers.
In the following study, we will fully recognize the shortcomings of the present method itself and try to improve it. Efforts will be made to improve the prediction accuracy and speed up the regression equation by increasing the complexity of the equation, adding correction parameters for the structure of the relevant groups, and using some optimization algorithms [
26] to improve the programming process of regression fitting equations.
5. Conclusions
The new method proposed in this study for predicting the enthalpy of evaporation of organic compounds at normal boiling points, based on the elemental and chemical bonding method, was demonstrated to be effective. By developing a new equation based on the Joback method, the EBH method achieves an AARD of 5.84%, making it a more accurate and efficient alternative to other evaporation enthalpy prediction methods. The results show that the EBH method can accurately predict silicon-containing compounds and has a broader range of predictions, with an easier and faster method of grouping. However, to build even more accurate models, increasing the complexity of the equations and adding correction factors for the structure of relevant groups should be a top priority. Overall, the EBH method is a reliable and superior method for predicting the enthalpy of evaporation data for organic compounds, with potential for further development and improvement.
Author Contributions
Formal analysis, Investigation, W.M. and X.L.; Conceptualization, Methodology, Software, Writing—review and editing, S.X. and L.X.; Formal analysis, Validation, Visualization, Writing—original draft, Y.P.; Resources, Supervision, Validation, Project administration, B.N. All authors have read and agreed to the published version of the manuscript.
Funding
This research was funded by the National Natural Science Foundation of China, grant number 22178190 and 22008129.
Data Availability Statement
The data presented in this study are available from the corresponding author upon request.
Conflicts of Interest
The authors declare no conflict of interest.
Nomenclature
| AAD | Average absolute deviation |
| AARD | Average relative deviation |
| AD | Absolute deviation |
| ADmax | Maximum absolute deviation |
| ARD | Relative deviation |
| ARDmax | Maximum relative deviation |
| ANN | Artificial neural network |
| EBH model parameter |
| CS | Correspondence state |
| EBH | Prediction model of evaporation enthalpy based on elements and chemical bonds |
| TS | Topological space |
| Boiling point, K |
| Number of group |
| Number of components |
| PC | Population contribution |
| Meta contribution value of group |
| Model prediction value of evaporation enthalpy at boiling point |
| Experimental value of enthalpy of vaporization at boiling point |
References
- Chickos, J.S.; Acree, W.E. Enthalpies of vaporization of organic and organometallic compounds 1880–2002. J. Phys. Chem. Ref. Data. 2003, 32, 519–878. [Google Scholar] [CrossRef] [Green Version]
- Krasnykh, E.L.; Druzhinina, Y.A.; Portnova, S.V.; Smirnova, Y.A. Vapor pressure and enthalpy of vaporization of trimethylolpropane and carboxylic acids esters. Fluid Phase Equilib. 2018, 462, 111–117. [Google Scholar] [CrossRef]
- Cachadina, I.; Mulero, A. Vaporization enthalpy: Corresponding-states correlations versus DIPPR database. J. Phys. Chem. Ref. Data 2007, 36, 1133–1139. [Google Scholar] [CrossRef]
- Velasco, S.; Román, F.L.; White, J.A. Prediction of the enthalpy of vaporization of metals and metalloids. Fluid Phase Equilib. 2006, 244, 11–15. [Google Scholar] [CrossRef]
- Román, F.L.; White, J.A.; Velasco, S.; Mulero, A. On the universal behavior of some thermodynamic properties along the whole liquid-vapor coexistence curve. J. Chem. Phys. 2005, 123, 124512. [Google Scholar] [CrossRef] [PubMed]
- Wei, W.Y.; Han, J.Y.; Xu, W. Group vector space method for estimating enthalpy of vaporization of organic compounds at the normal boiling point. J. Chem. Inf. Comput. Sci. 2004, 44, 1436–1439. [Google Scholar] [CrossRef]
- Wei, W.Y.; Kong, H.N.; Xu, W.; Han, J.Y. A group topological space approach to the estimation of enthalpy of evaporation and boiling point. CIESC J. 2006, 57, 710–714. [Google Scholar] [CrossRef]
- Mohammadi, A.H.; Richon, D. New predictive methods for estimating the vaporization enthalpies of hydrocarbons and petroleum fractions. Ind. Eng. Chem. Res. 2007, 46, 2665–2671. [Google Scholar] [CrossRef]
- Zhokhova, N.; Palyulin, V.; Baskin, I.; Zefirov, A.; Zefirov, N. Fragment descriptors in the QSPR method: Their use for calculating the enthalpies of vaporization of organic substances. Russ. J. Phys. Chem. 2007, 81, 9–12. [Google Scholar] [CrossRef]
- Hoshino, D.; Nagahama, K.; Hirata, M. Prediction of the entropy of vaporization at the normal boiling point by the group contribution method. Ind. Eng. Chem. Fundam. 1983, 22, 430–433. [Google Scholar] [CrossRef]
- Ma, P.S.; Xu, W.; Liu, Y.S. Estimation of the enthalpy of evaporation at the boiling point by the functional group method. Petrochem. Technol. 1992, 21, 613–617. [Google Scholar]
- Li, P.; Ma, P.S.; Zhu, C. The group correspondence state method (CSGC) is used to estimate the enthalpy of evaporation of pure substances at different temperatures. Nat. Gas. Ind. 1995, 20, 50–53. [Google Scholar]
- Yu, C.F.; Liu, G.J. Calculation of the group contribution to the enthalpy of evaporation of a liquid at normal boiling point. CIESC J. 2001, 52, 530–536. [Google Scholar] [CrossRef]
- Marrero, J.; Gani, R. Group-contribution based estimation of pure component properties. Fluid Phase Equilib. 2001, 183, 183–208. [Google Scholar] [CrossRef]
- Dalmazzone, D.; Salmon, A.; Guella, S. A second order group contribution method for the prediction of critical temperatures and enthalpies of vaporization of organic compounds. Fluid Phase Equilib. 2006, 242, 29–42. [Google Scholar] [CrossRef]
- Li, J.; Xia, L.; Xiang, S.G. A new method based on elements and chemical bonds for organic compounds critical properties estimation. Fluid Phase Equilib. 2016, 417, 1–6. [Google Scholar] [CrossRef]
- Jing, Y.J.; Xiang, S.G. A new method for estimating critical pressure of organic compounds-elements and chemical bonds contribution method. Petrochem. Technol. 2004, 33, 636–641. [Google Scholar] [CrossRef]
- Hou, J.G.; Yang, J.L.; Wang, H.Q. Topology of two-dimensional C60 domains. Nature 2001, 409, 304–305. [Google Scholar] [CrossRef]
- Xia, L.; Xiang, S.G.; Jia, X.P. Estimating the normal boiling point of organic compounds based on elements and chemical bonds. Comput. Aided Chem. Eng. 2009, 27, 363–368. [Google Scholar] [CrossRef]
- Liu, H.D.; Li, X.; Wang, Y.; Sun, X.Y.; Zhao, W.Y.; Xia, L.; Xiang, S.G. Elements and Chemical Bonds Contribution Estimation of Activity Coefficients in Nonideal Liquid Mixtures. Processes 2022, 10, 2141. [Google Scholar] [CrossRef]
- Joback, K.G.; Reid, R.C. Estimation of pure-component properties from group-contributions. Chem. Eng. Commun. 1987, 57, 233–243. [Google Scholar] [CrossRef]
- Kolská, Z.; Růžička, V.; Gani, R. Estimation of the enthalpy of vaporization and the entropy of vaporization for pure organic compounds at 298.15 K and at normal boiling temperature by a group contribution method. Ind. Eng. Chem. Res. 2005, 44, 8436–8454. [Google Scholar] [CrossRef]
- Basařová, P.; Svoboda, V. Prediction of the enthalpy of vaporization by the group contribution method. Fluid Phase Equilib. 1995, 105, 27–47. [Google Scholar] [CrossRef]
- Soheil, A.; Kamyar, M.; Habib, G. Estimation of the enthalpy of vaporization at normal boiling temperature of organic compounds by a new group contribution method. Fluid Phase Equilib. 2018, 473, 166–174. [Google Scholar] [CrossRef]
- Yaws, K. Handbook of Thermodynamic and Physical Properties of Chemical Compounds, 2nd ed.; Gulf Professional Publishing: Houston, TX, USA, 2005. [Google Scholar]
- Xia, L.; Ling, J.Y.; Xu, Z. Application of sequential quadratic programming based on active set method in cleaner production. Clean Technol. Environ. Policy 2022, 24, 413–422. [Google Scholar] [CrossRef]
| Disclaimer/Publisher’s Note: The statements, opinions and data contained in all publications are solely those of the individual author(s) and contributor(s) and not of MDPI and/or the editor(s). MDPI and/or the editor(s) disclaim responsibility for any injury to people or property resulting from any ideas, methods, instructions or products referred to in the content. |
© 2023 by the authors. Licensee MDPI, Basel, Switzerland. This article is an open access article distributed under the terms and conditions of the Creative Commons Attribution (CC BY) license (https://creativecommons.org/licenses/by/4.0/).


