1. Introduction
Water distribution networks are exposed to many factors that produce leaks, such as corrosion, wear, poor installation, or adverse environmental conditions. Corrective and predictive maintenance can reduce the occurrence of leak events. A study by the Organization for Economic Co-operation and Development (OECD) [
1,
2] showed that the global volumetric percentage of water lost due to leaks is close to 21%. Among the different countries in the study, Mexico experiences a more critical situation since this percentage ascends to approximately 40%. This is why leaks must be promptly detected and repaired to minimize their negative associated economic cost and environmental pollution. This problem increases because most water distribution systems have their pipes underground, making it more complex and sometimes impossible to identify the leak, which increases their lifetime [
3]. However, in some nodes, knowledge of the hydraulic variables during the system’s operation, such as pressure head and flow rate, can be used to identify abnormal operating conditions associated with the leak. Furthermore, implementing intelligent systems that perform constant real-time monitoring and prognosis of the operating conditions of the hydraulic system can complement online leak detection, isolation, and diagnosis.
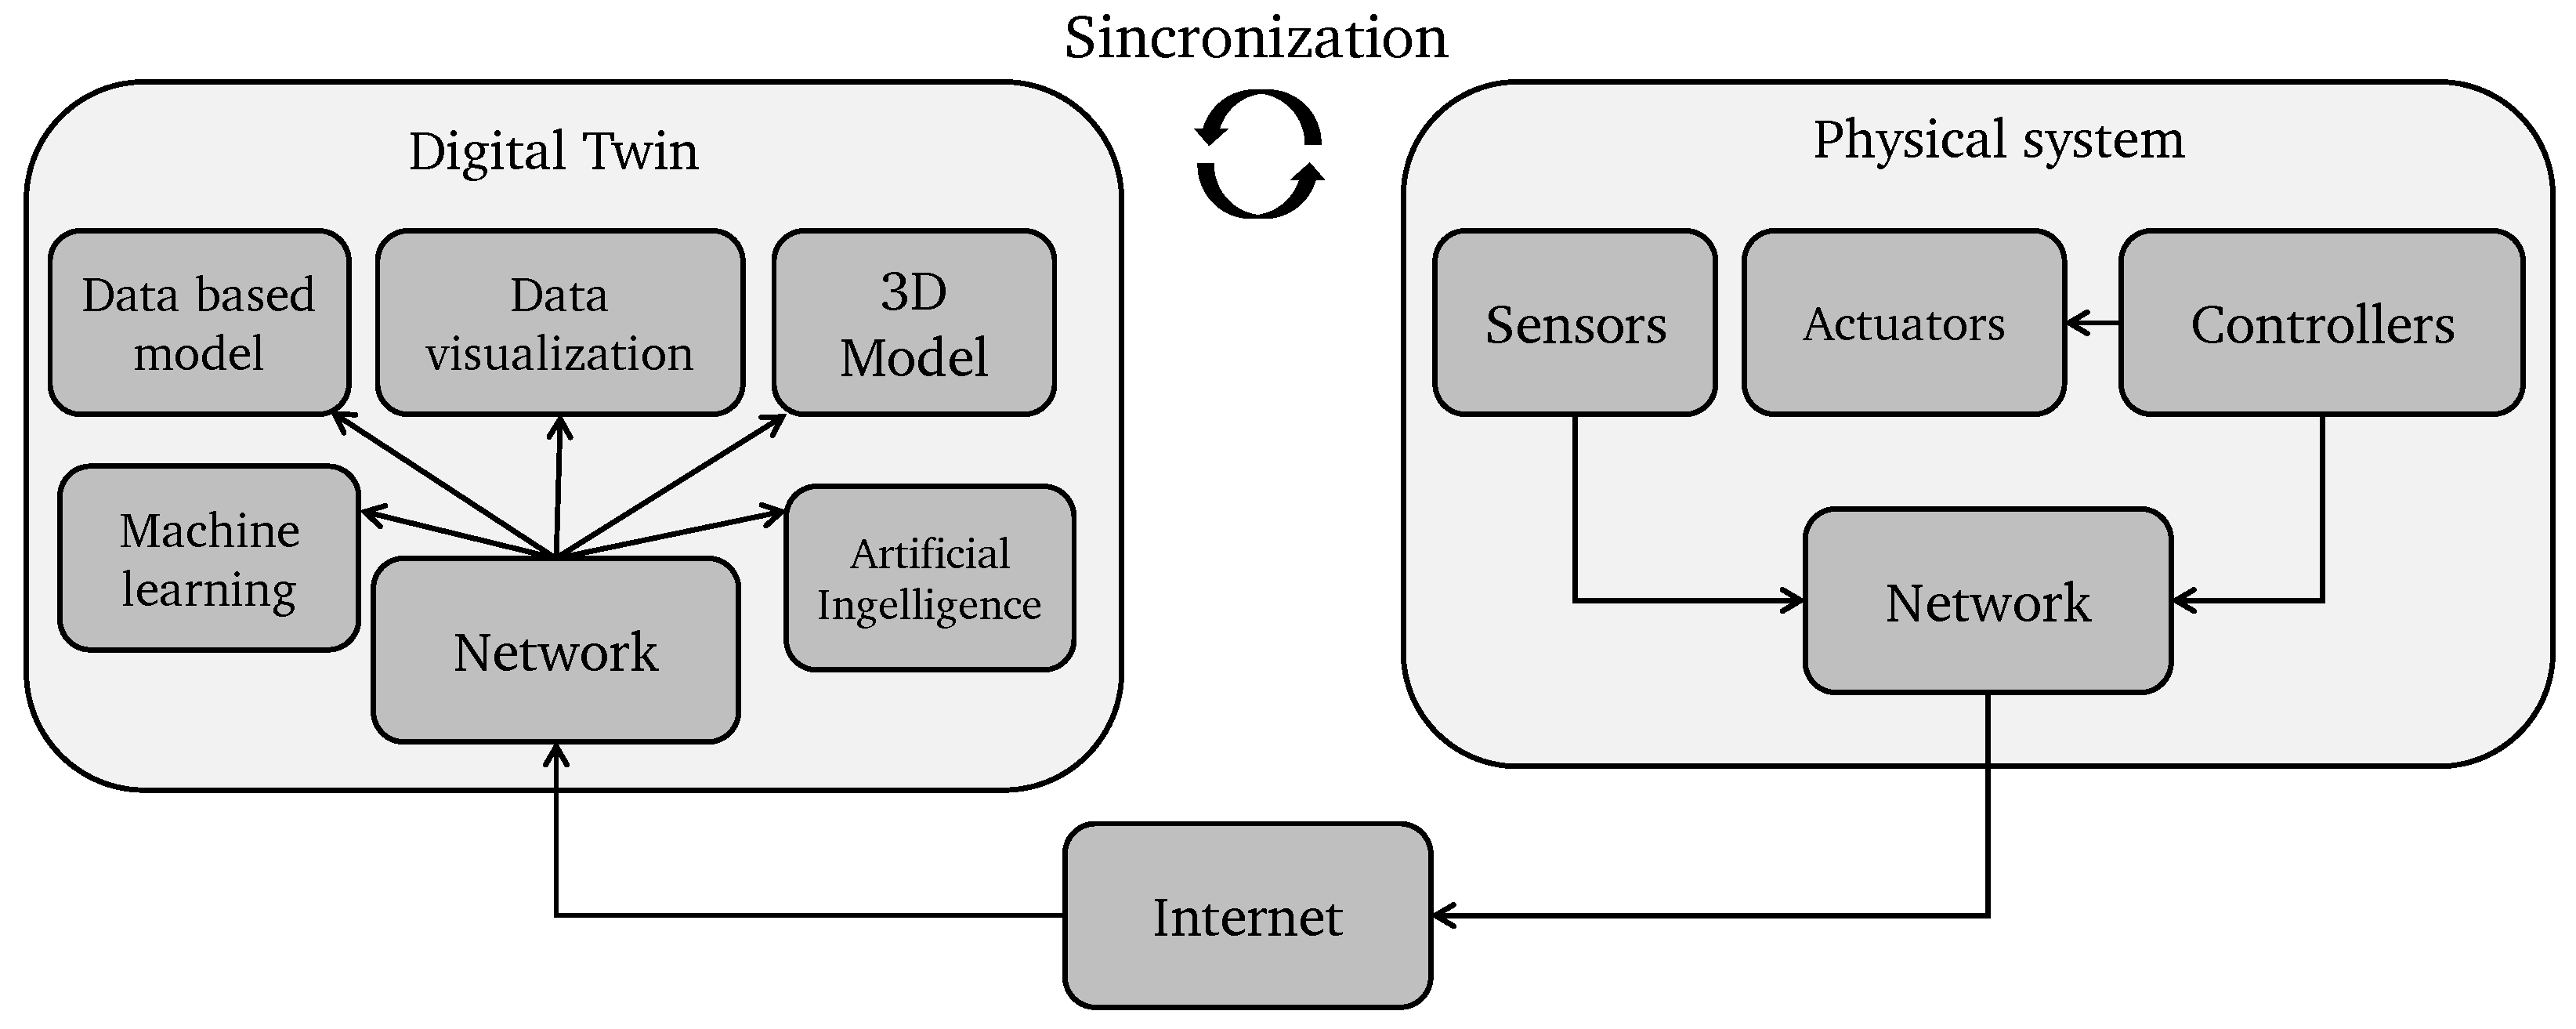
In recent years, intelligent systems have been developed that integrate physical and virtual environments into cyber-physical systems. This trend has been significantly propelled by technological advancements like the Internet of Things (IoT) and the continuous enhancement of intelligent sensors and actuators. These systems are known as an intelligent water distribution network (IWDN) [
4], and their purpose is to monitor hydraulic demand and interact with valves to respond to specific water demand requirements efficiently. An IWDN has also been used to monitor quality parameters by including sensors, a communication network, and computing technologies to construct software models that manage data transfer and execute data analysis algorithms [
5]. The work performed by [
6] explored an evolution of the traditional methods in water quality monitoring by including an alarm-emitting capacity if the measured parameters were not under specific ranges. Similarly, the author in [
7] applied the IoT to monitor and control hydraulic and quality variables in a district-metered area of Guanajuato in Mexico. From a safety point of view, in [
8] an IoT-based system was designed to manage a water distribution network with the capability to respond and alert the user concerning abnormal operating conditions such as leaks and even cyber-attacks. Similarly, in [
9,
10], it was demonstrated how an IoT-based system integrated with cloud computing could solve problems related to risk management of a potable water treatment plant. The authors in [
11] developed an IoT system for intelligent water management to provide a constant water supply in places where tanks, motors, and pumps are scarce.
Recently, the authors of [
12] introduced a novel approach involving the use of a new class of IWDN known as a digital twin, which can be seen as a virtual replica of a physical WDN, used for real-time monitoring, simulation, and analysis to enhance performance and decision-making. As part of their research, the authors successfully developed and implemented a digital twin model for the district-metered area of Valencia, Spain, whose main characteristics are fidelity in the representation of the physical system, low latency, remote control, precise simulation of any desired operating condition, reliable sensors, and real-time monitoring of the operating conditions and water consumption. By following this approach, in [
13], a digital twin was designed for the water distribution system of Lisbon in Portugal. These macro implementations demonstrated the practice of
digital twins, which provided valuable information concerning the users’ consumption habits, which change according to the hour of the day and the year’s season. In [
14], a digital twin of the city of Lakewood, California, was used to analyze its feasibility in risk management during emergencies by studying changes in the consumption patterns during the COVID-19 pandemic period. All previous investigations demonstrate how real-life implementations of
digital twins on water distribution networks are a growing interest in academia and industry. Nonetheless, to the authors’ knowledge, no reported practical implementations of
digital twins are dedicated to implementing online remote leak diagnosis.
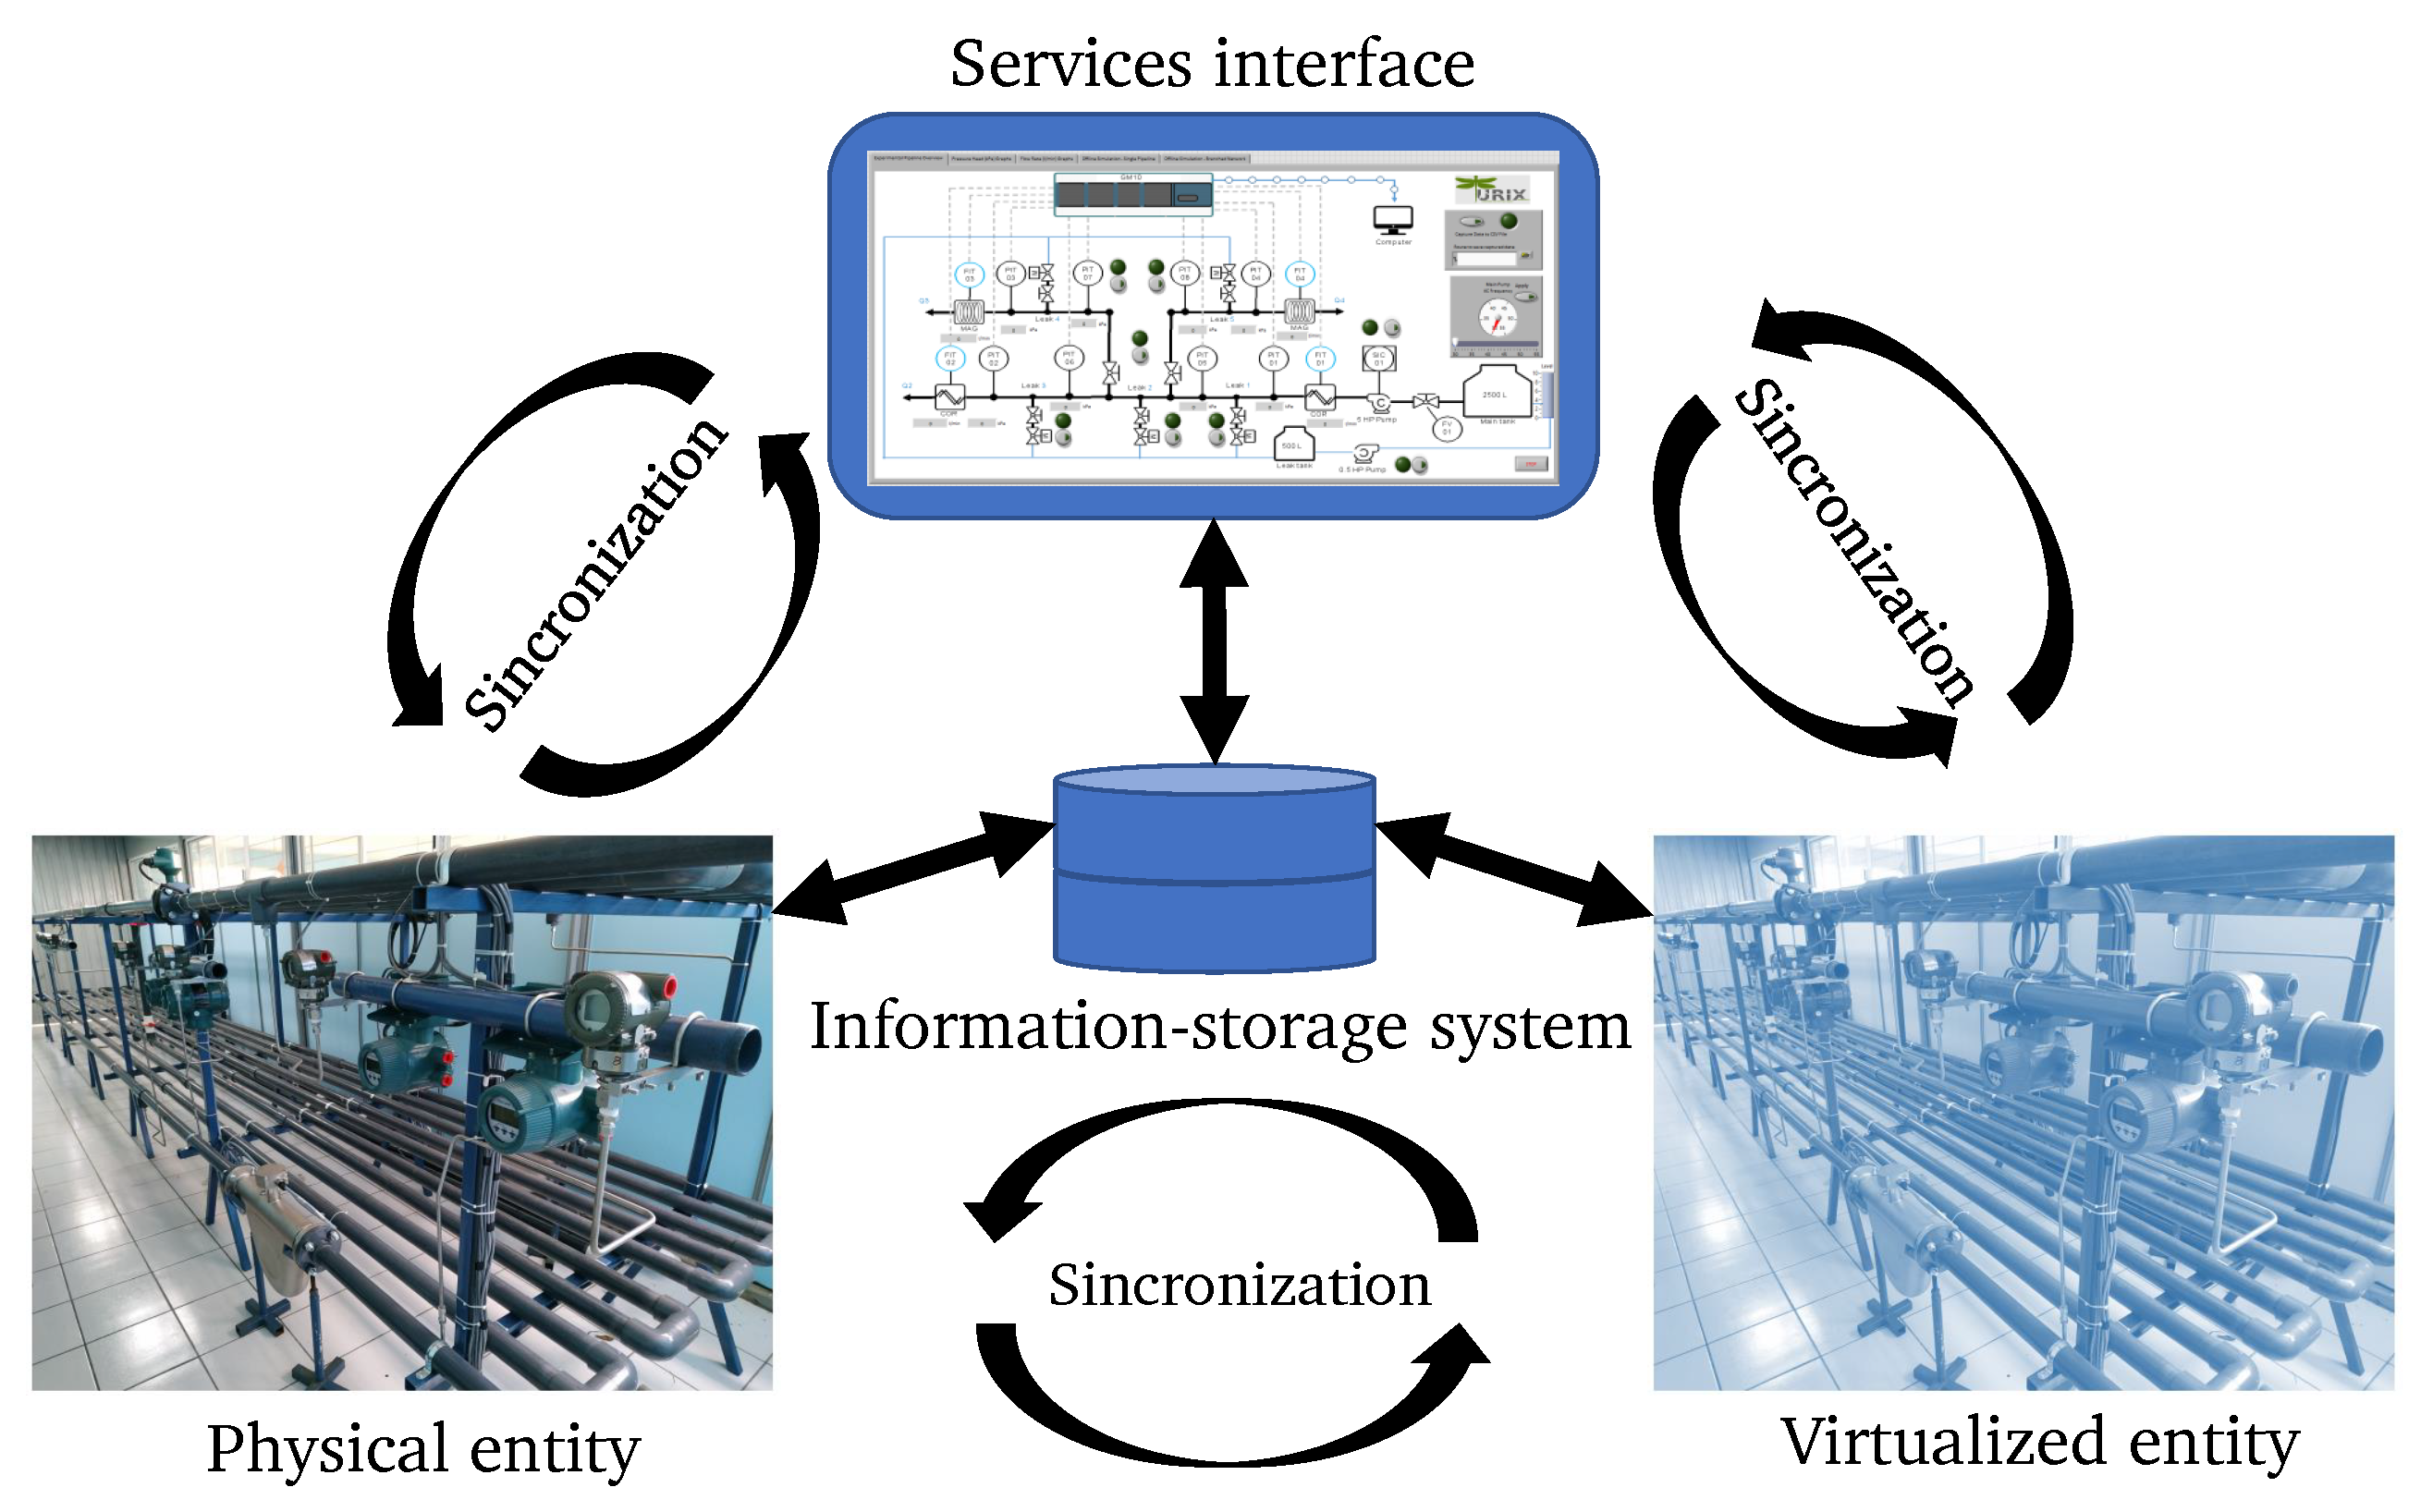
The main contribution presented in this paper is the implementation of adigital twin of an experimental hydraulic system dedicated to diagnosing single- and multi-leak events using a genetic algorithm (GA) and IoT technologies. The proposed system integrates (1) online measurements obtained from the installed pressure head and flow rate meters, (2) a finely tuned EPANET hydraulic model of the WDN that reliably estimates the hydraulic variables at nodes, and (3) a virtual interface that integrates the remote monitoring of the online measurements and the GA-based leak diagnosis algorithm. A remote operator interface was also designed, where remote controls allow for reconfiguration of the system remotely. The digital twin integrates both the physical and the virtualized environment. The experimental implementation of the digital twin demonstrated satisfactory results in remote monitoring and control and the diagnosis of multi-leak events.
This paper is structured as follows:
Section 2 discusses the general structure of the digital twin and its main elements.
Section 3 presents the specific study case, the modeling of the system, the proposed architecture, and the telecommunications design between all the involved environments.
Section 3.3 presents the proposed leak diagnosis methodology and its results, and finally,
Section 4 draws some conclusions and future work proposals.
3. Description of the Hydraulic System
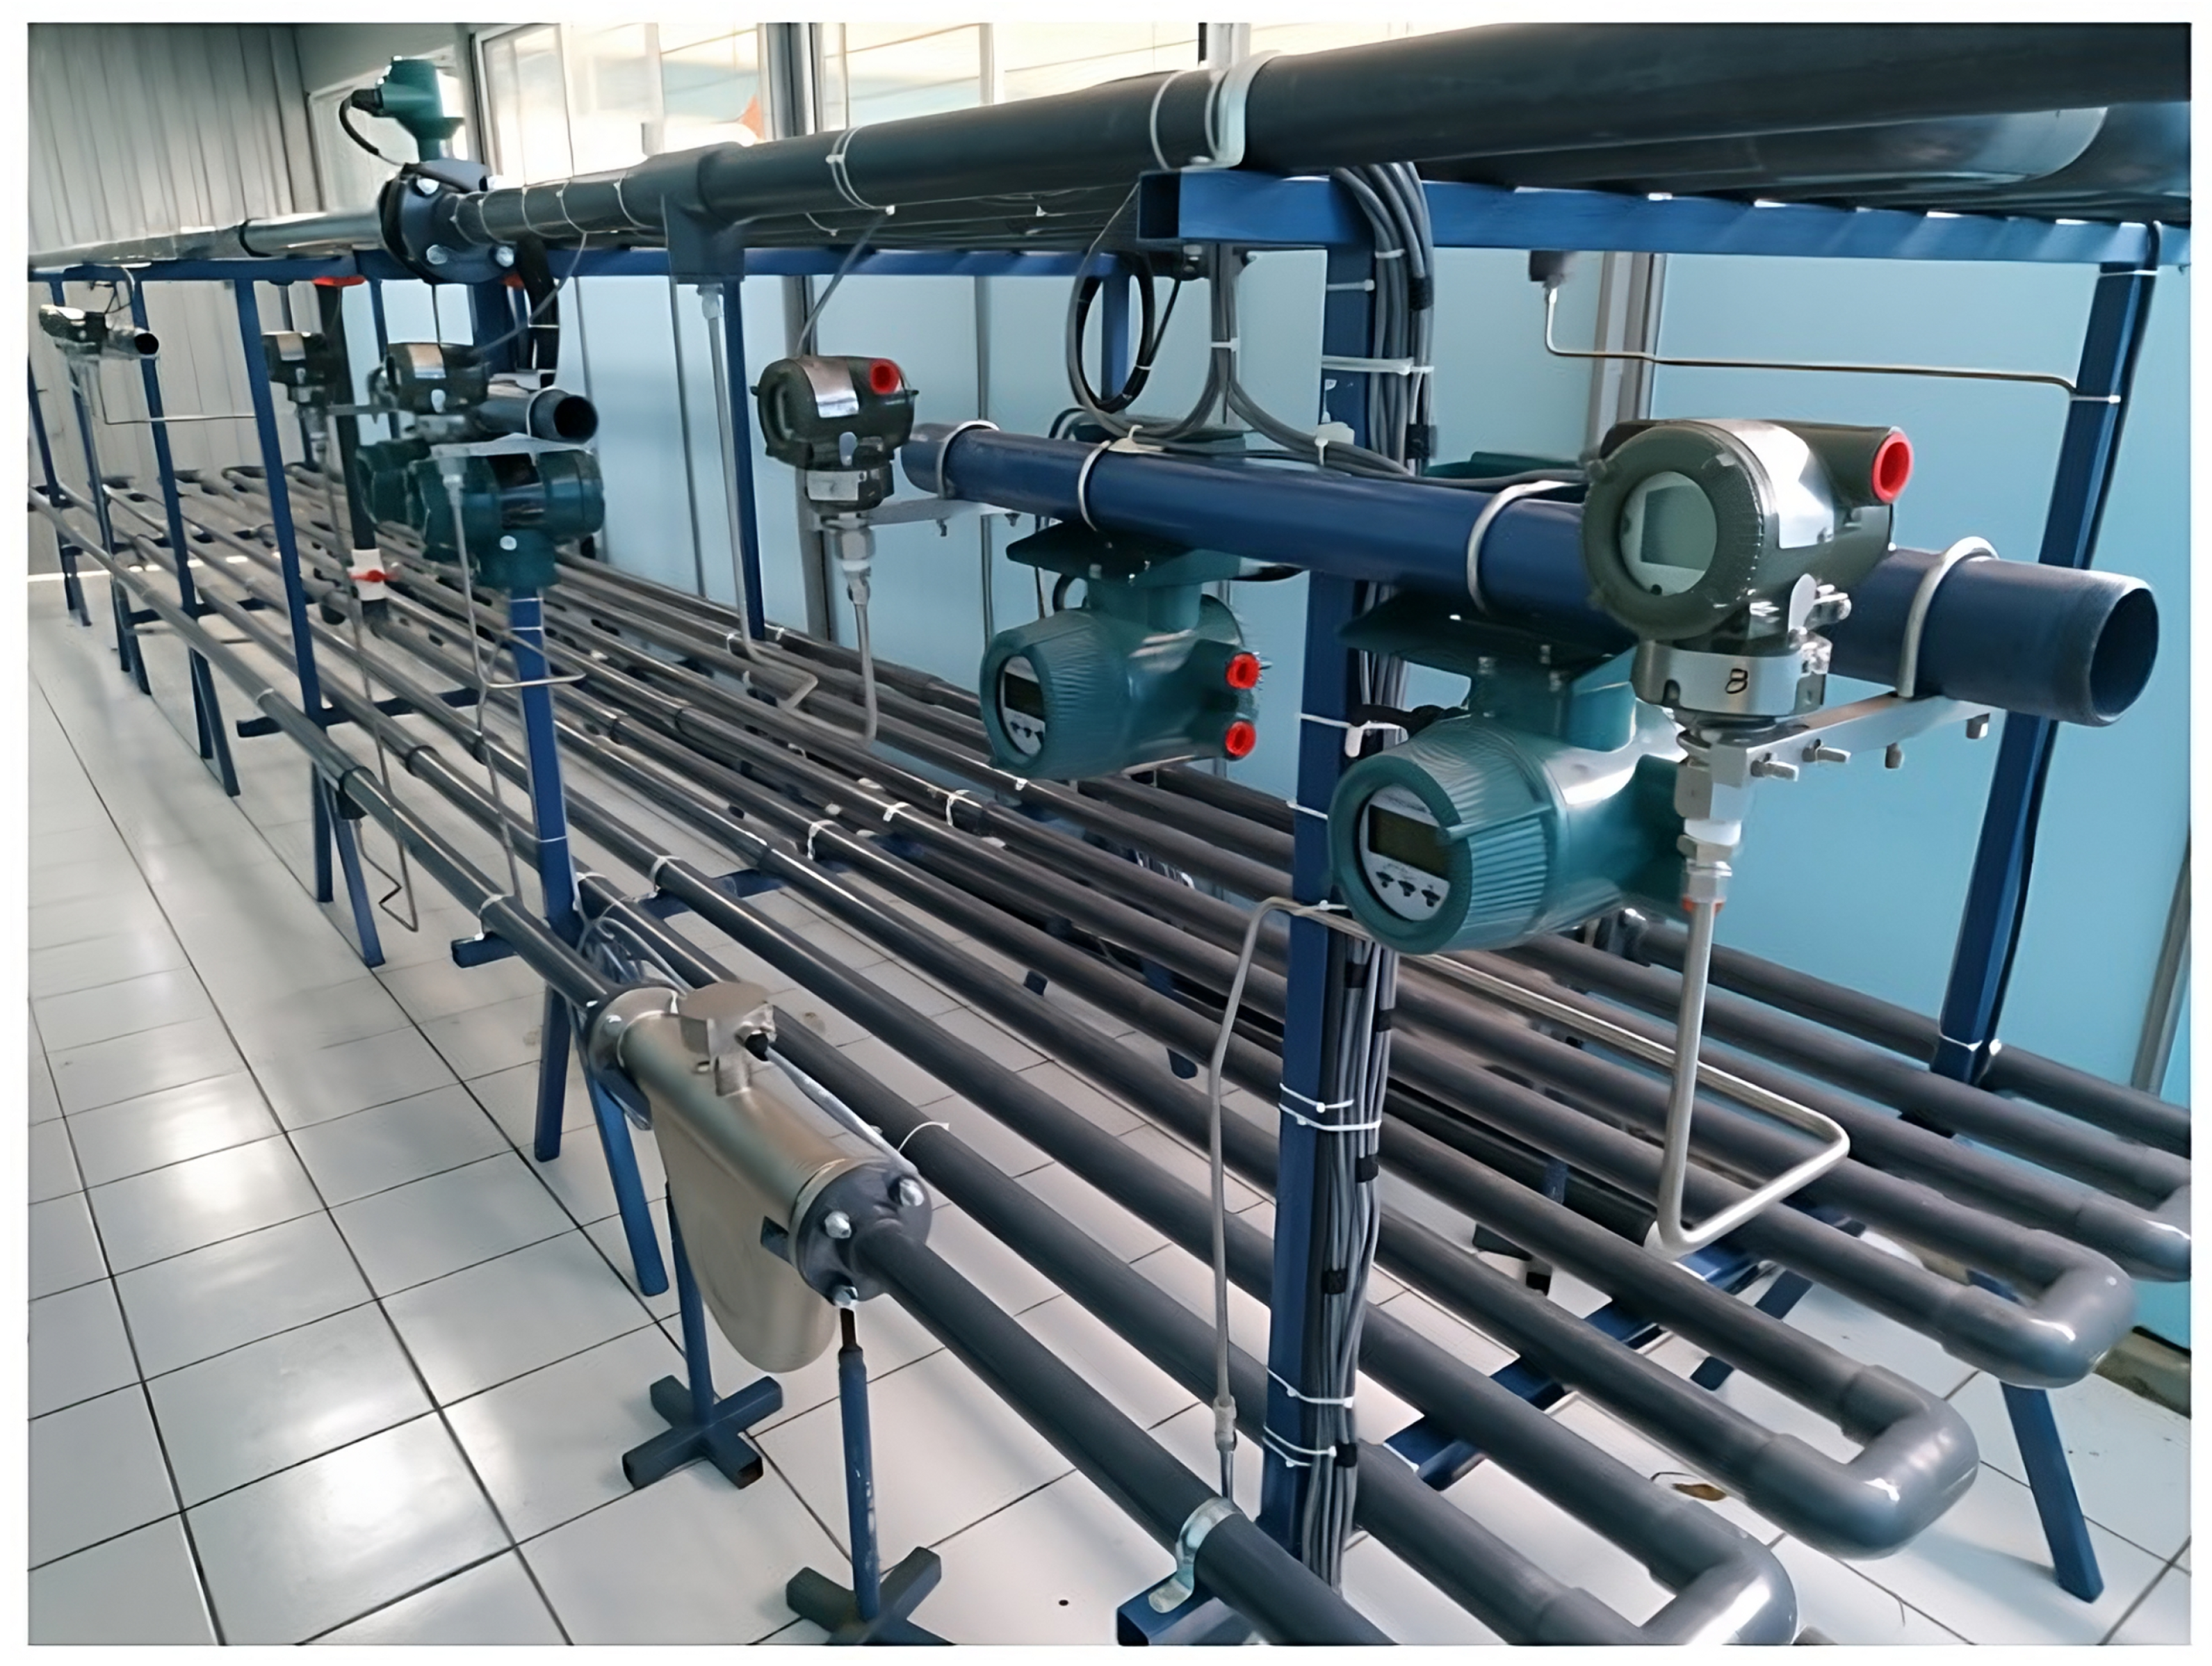
The digital twin was physically and virtually applied to an experimental pilot plant at the Hydroinformatics Laboratory at Instituto Tecnológico de Tuxtla Gutiérrez (see
Figure 3). This experimental WDN is oriented to experimental tasks such as testing and validating control algorithms, leak diagnosis, and sensor placement techniques.
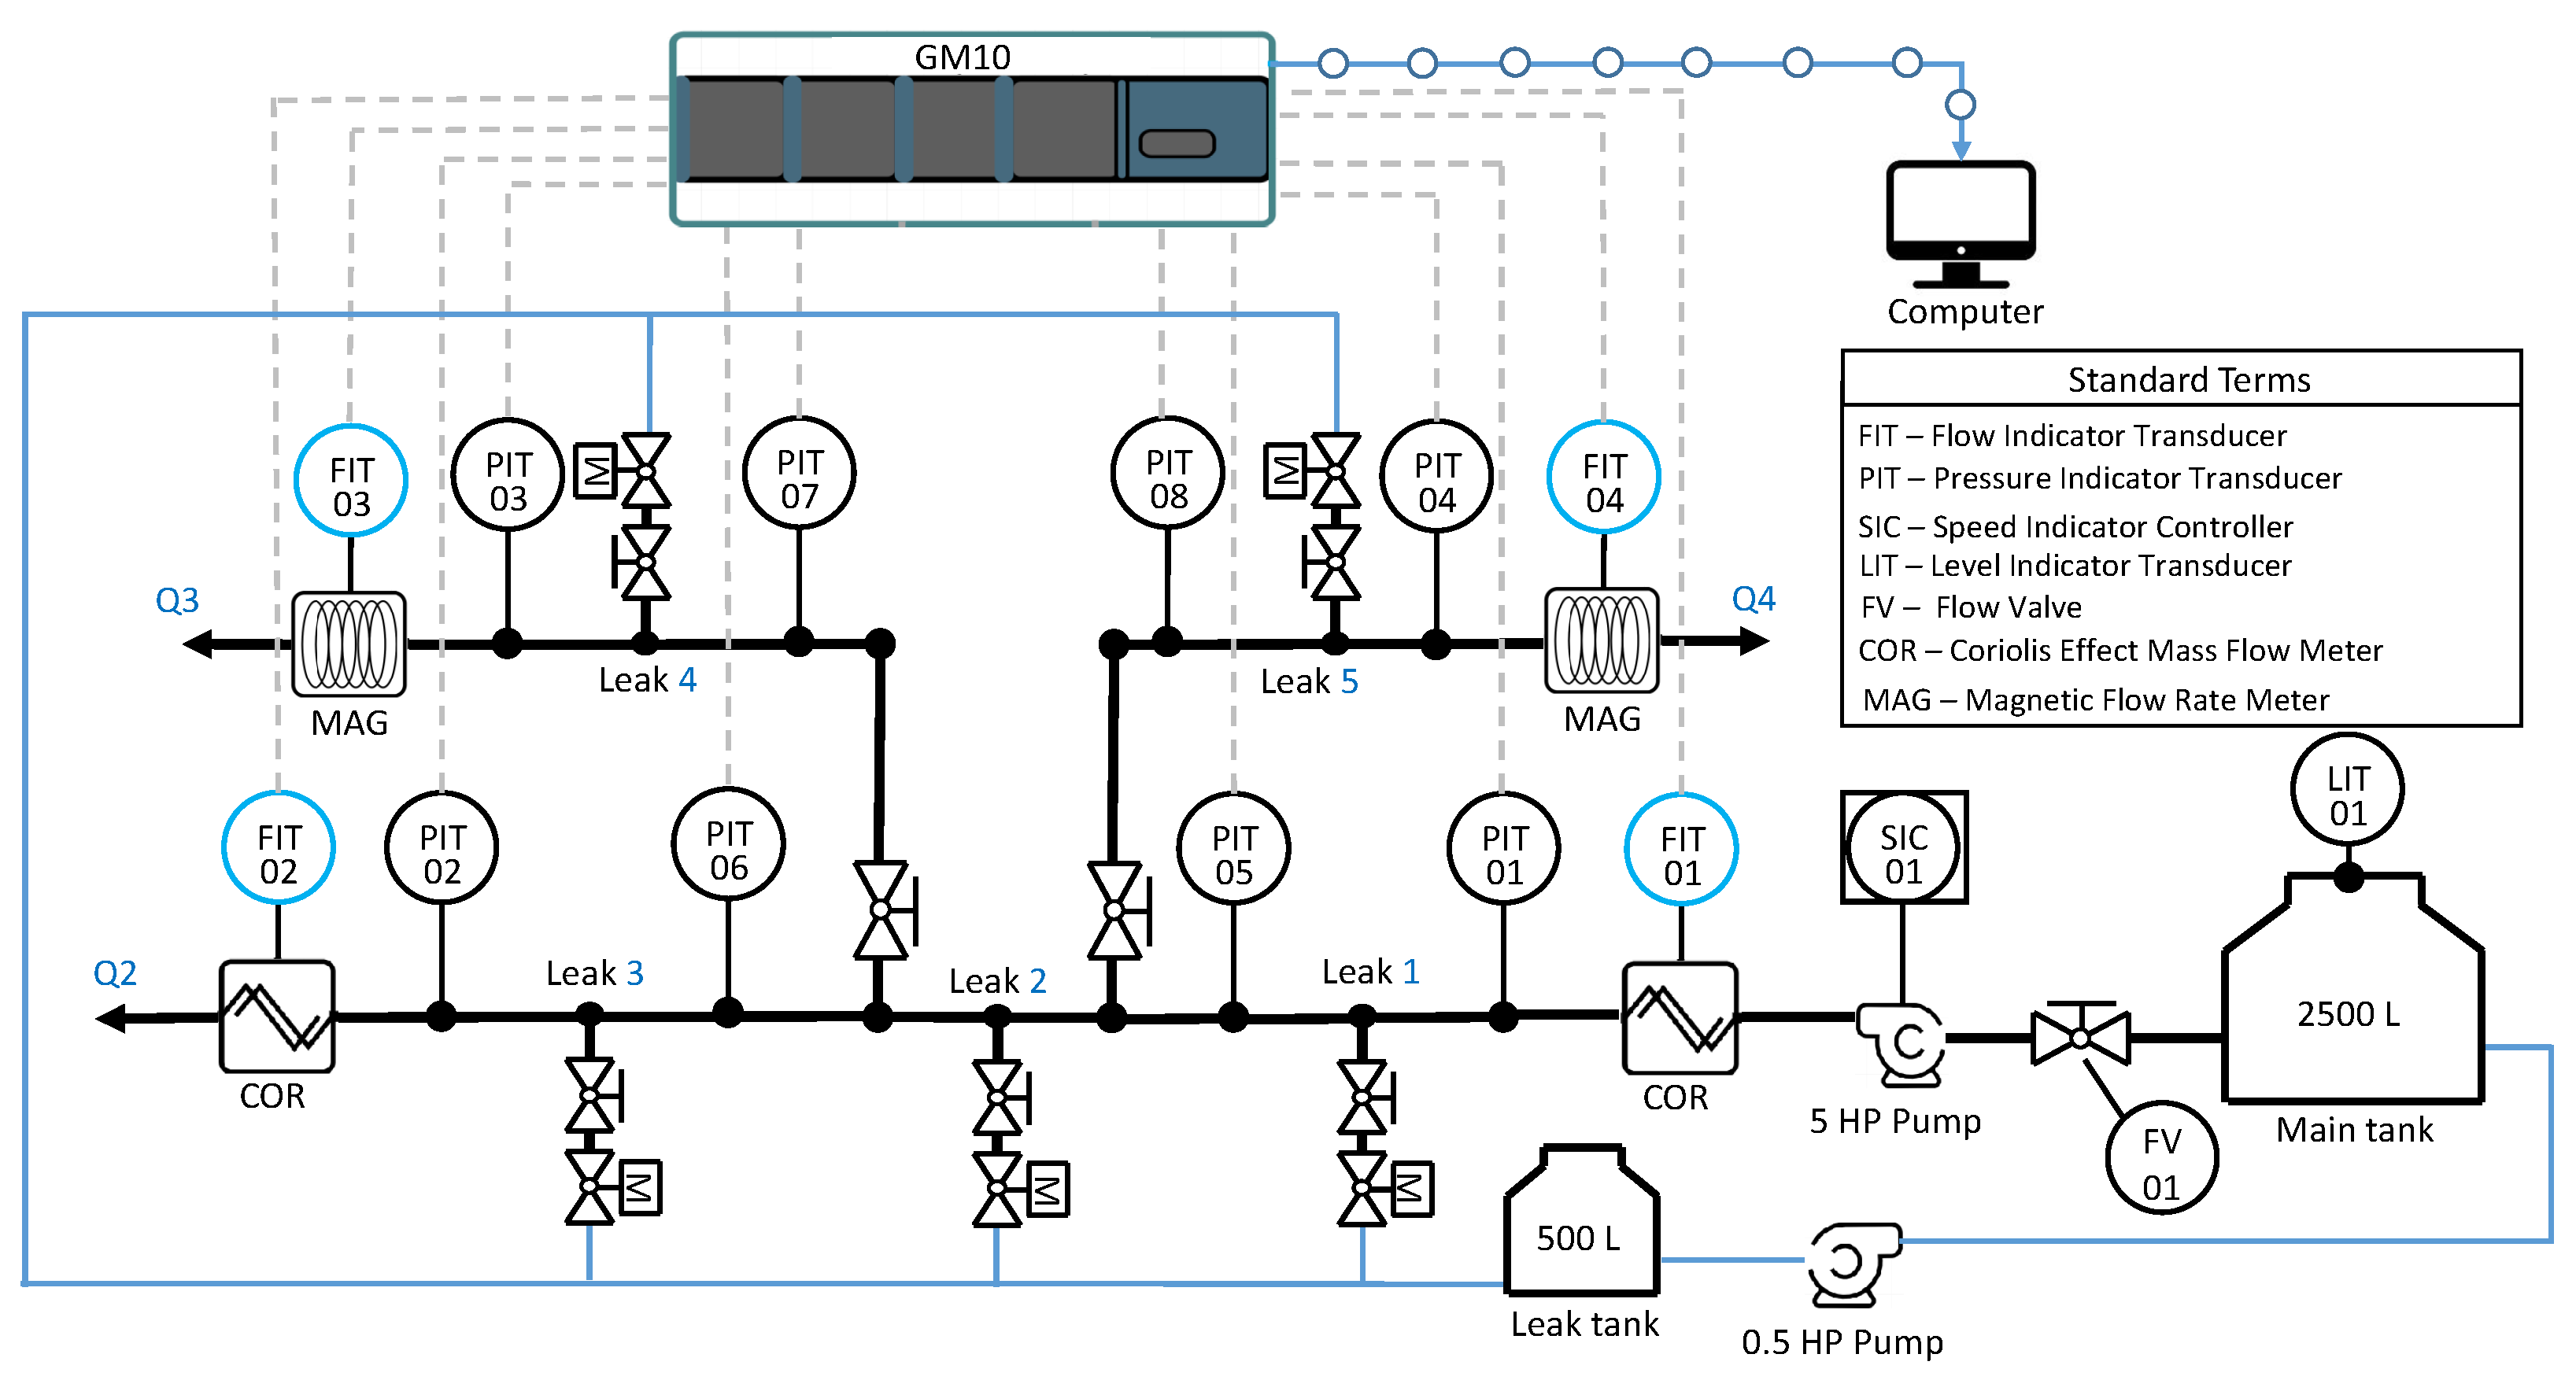
The plant is equipped with industrial instrumentation as shown on the P&ID chart given in
Figure 4. The system has five electronic valves that can be remotely operated to emulate leak events, eight pressure head meters (labeled PIT-01 to PIT-08), two magnetic flow rate meters (labeled FIT-03 and FIT-04), two Coriolis-effect mass-flow meters (labeled FIT-01 and FIT-02), and one ultrasonic water-level meter installed in the storage tank (labeled LIT-01). The data acquisition is performed by a Yokogawa GM10 data-logging system connected via Ethernet with a desktop computer that uses a MATLAB-based interface to read the measurements obtained from the data-logger. A 5 hp centrifugal pump supplies the water from a main storage tank of 2500
. The pump’s rotational speed is regulated with a Micromaster 440 frequency converter that supports a maximum frequency of 60 Hz. To guarantee the water supply, the pump frequency must be maintained over 30 Hz. Water leaked from the experiments is stored in a secondary tank with a capacity of 500
and then recirculated to the main tank using a 0.5 hp secondary pump.
3.1. System Modeling
An adequate hydraulic model was developed to guarantee that the estimated hydraulic variables remained reliable under different operating conditions. The hydraulic simulator EPANET was chosen for this task because of its ability to conduct simulations that closely mimic the steady-state behavior of the system while also being lightweight enough for implementation in real-time online applications. The hydraulic model is constructed as a text file with an
.inp extension, in which parameters of the topology of the system are declared, such as the location of the junction nodes of the system, the length of pipe between the junction nodes, pipe diameter, and node elevation, among others, as proposed in [
16]. This text file is imported from EPANET to MATLAB 2023a
® using the EPANET-MATLAB Toolkit provided by OpenWater Analytics [
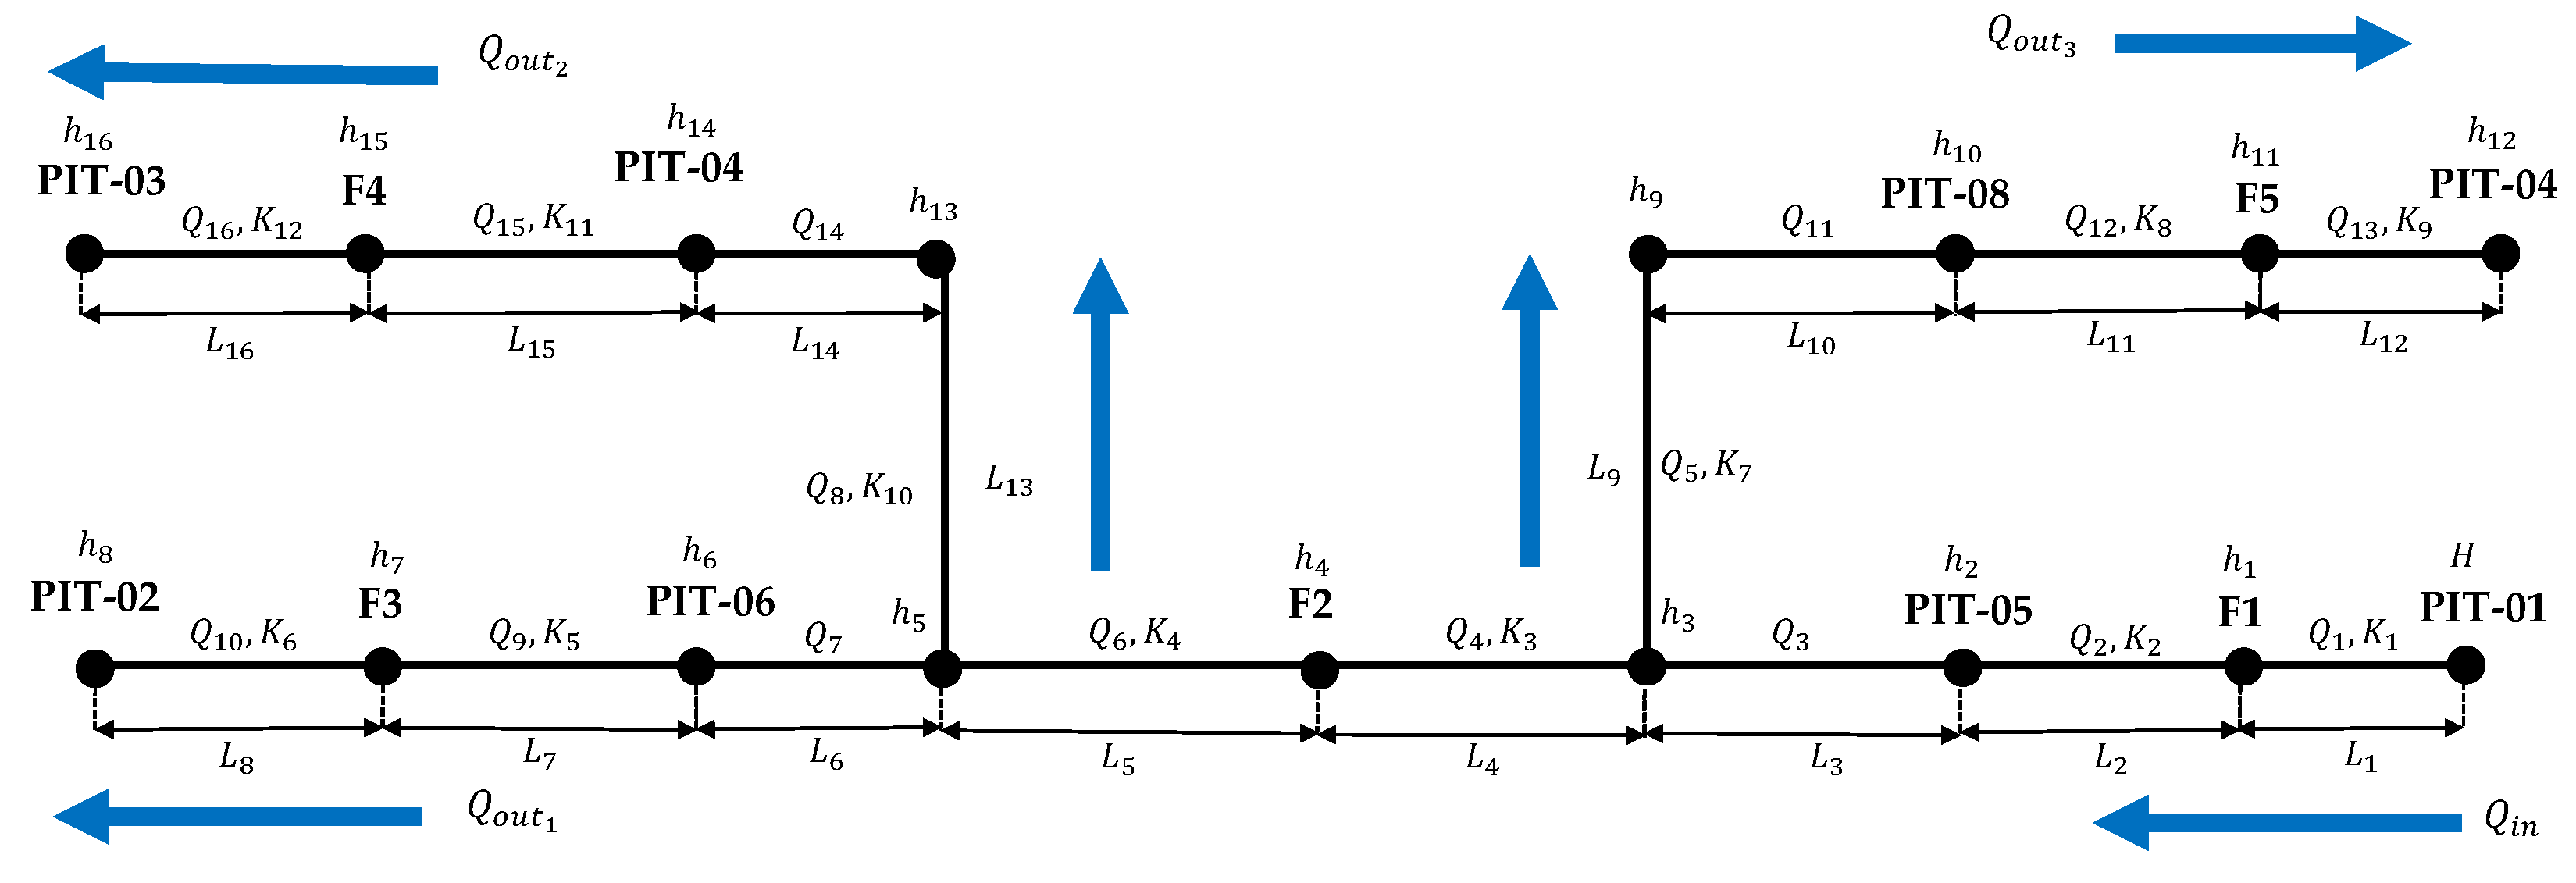
17]. This toolkit interfaces the hydraulic simulation functionalities in a coding environment, which allows the simulation of various input and consumption conditions and interfaces the model with real-world sensor readings. For simplicity, the pipeline system was discretized in pipe segments as shown in
Figure 5 whose beginning and ending nodes correspond to the location of elements such as pressure meters, leak valves, or T-type fittings. The parameters corresponding to the roughness coefficient (
) and the minor head-loss coefficient (
K) in the pipes are estimated by the mean of a genetic algorithm as reported in our previous work in [
18].
Table 1 summarizes the physical parameters for each pipe segment.
3.2. Digital Twin Data Communication
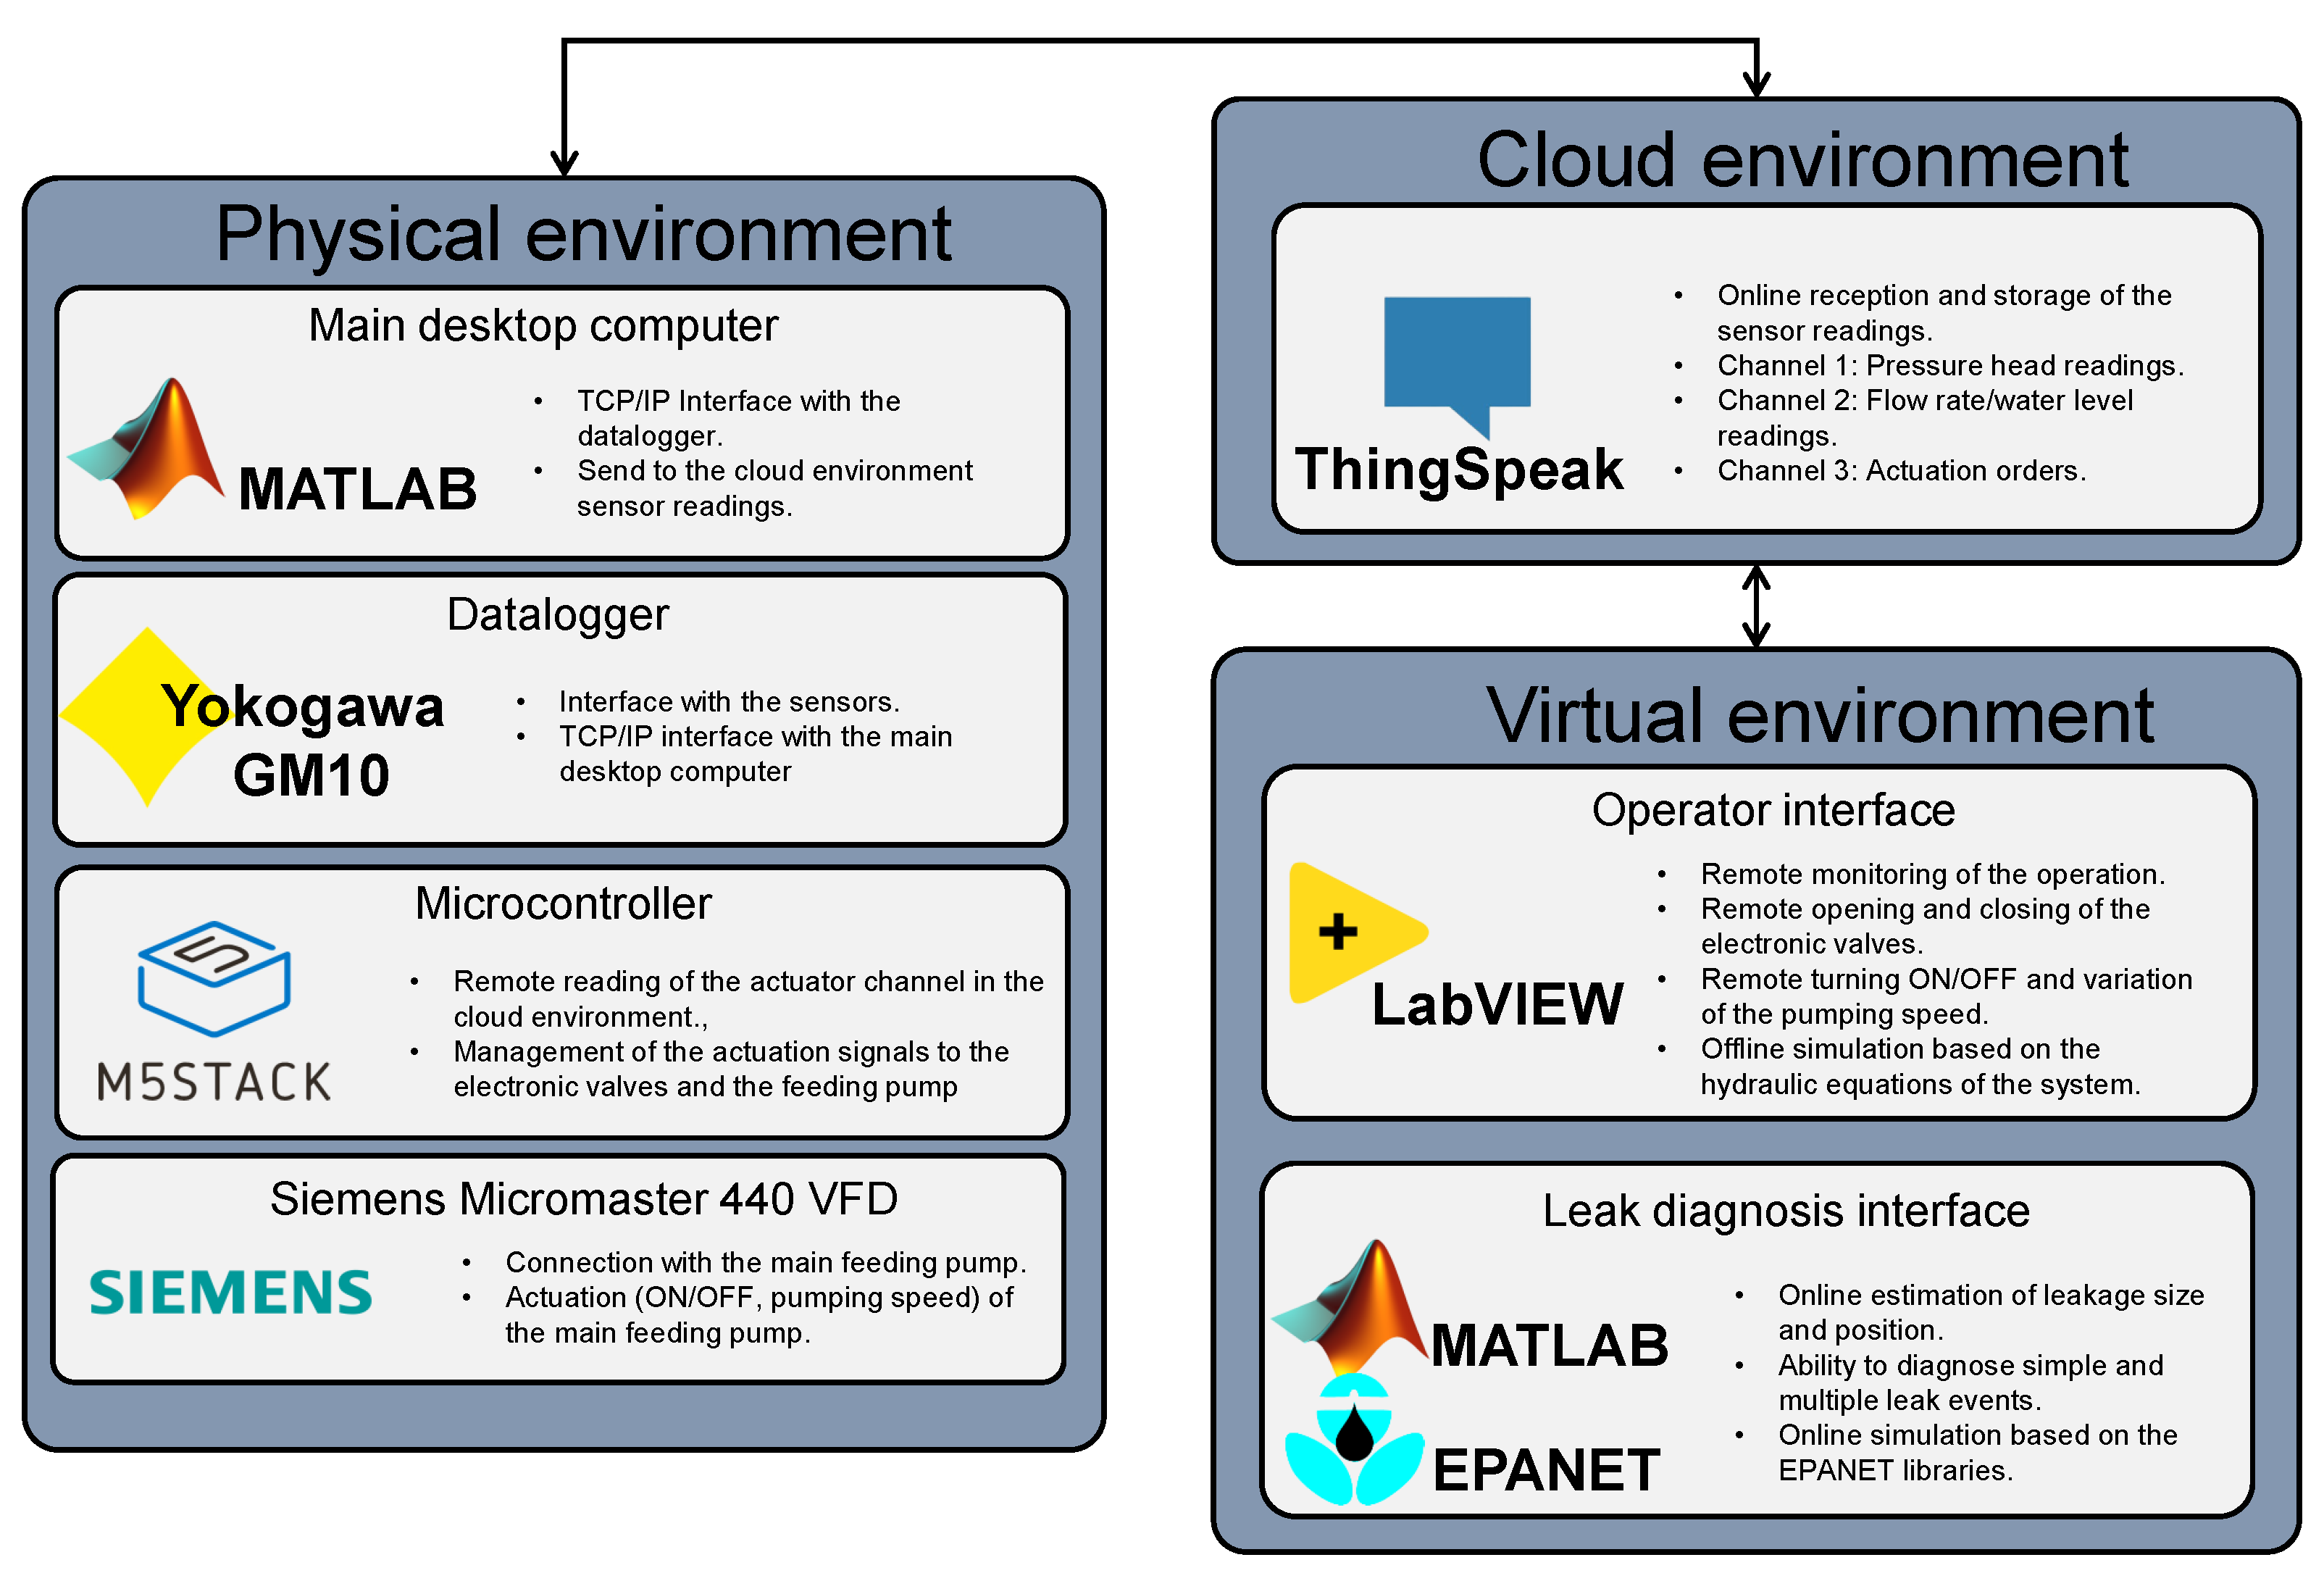
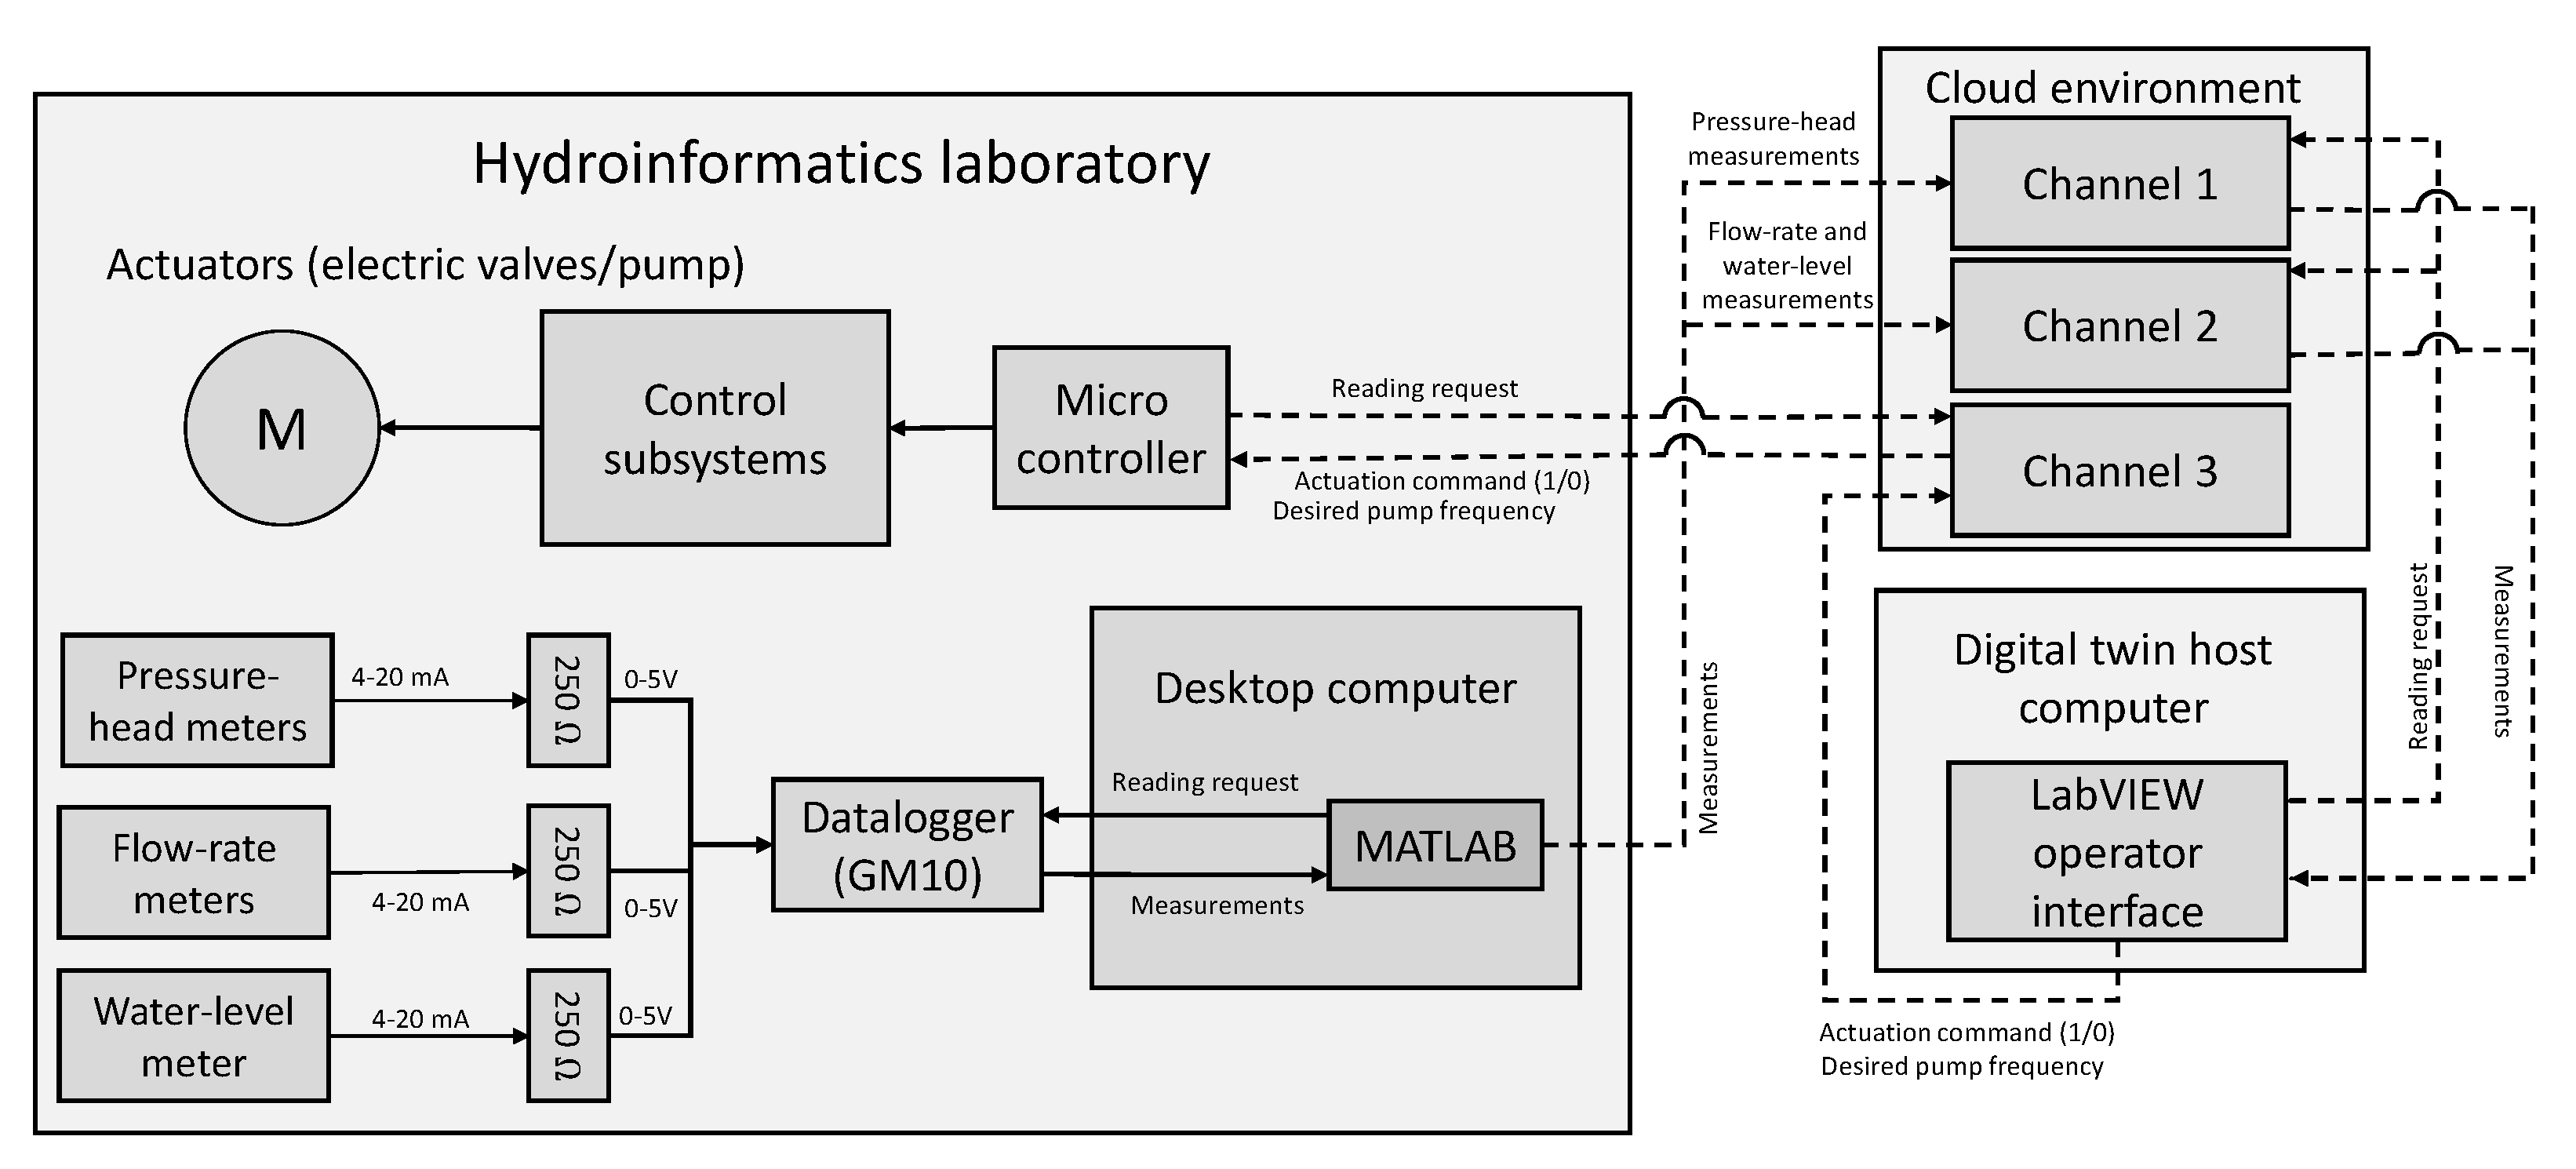
Figure 6 shows the proposed architecture for the digital twin, which integrates three elements: the physical system, the virtualized interfaces for monitoring and diagnosis tasks, and the online cloud-based platform for data communication between the two systems.
The measured data are sent to a cloud environment via Wi-Fi using a MATLAB
® application that connects with the GM10 and reads the measurements at the register addresses for each sensor. ThingSpeak was selected as the cloud-based storage platform. A cloud
channel is an environment containing eight
fields where each field can store historical measurements. The eight fields in the first channel store the measurements of the eight pressure head meters, and the first five fields in the second channel are used to store four flow rates and the water-level lectures. A third channel is used for the remote control of the actuators, with the first five fields associated with the open/closed electric valves, the sixth field associated with the on/off state of the pump, and the seventh field used to regulate the pumping speed.
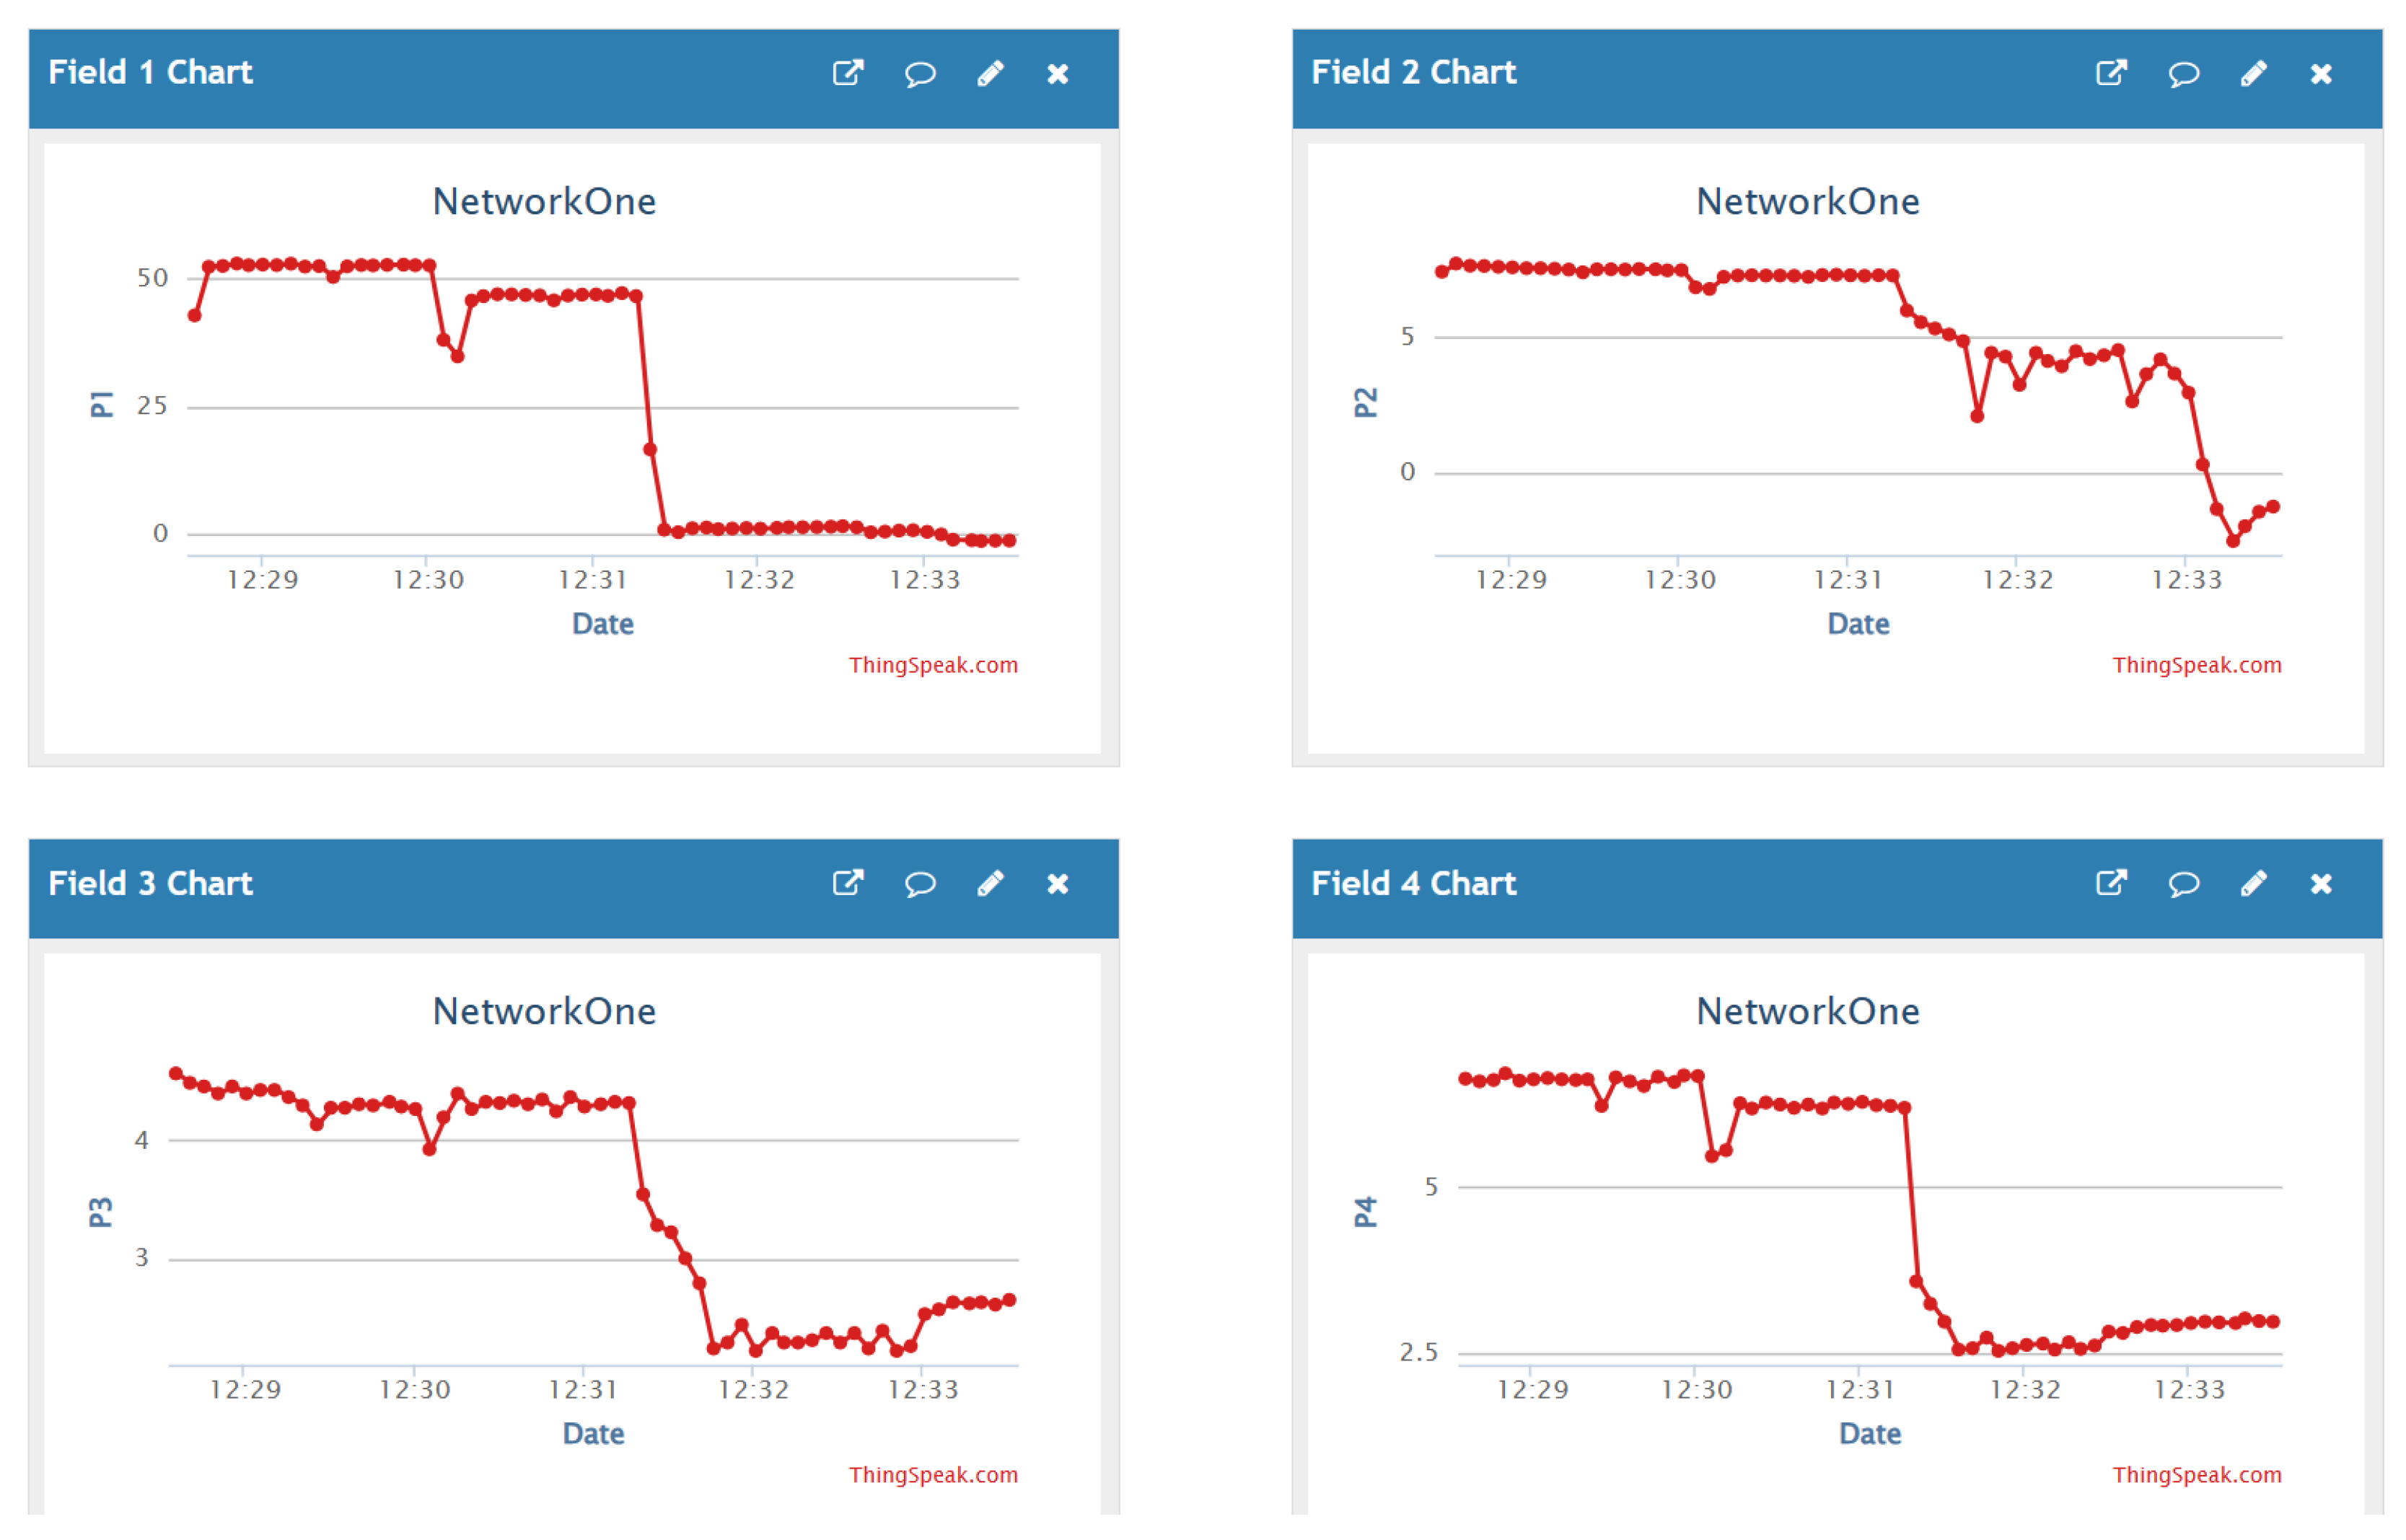
Figure 7 shows an example of real-time monitoring at the cloud interface of some pressure heads. Due to the latency in the telecommunications between the laboratory environment and the cloud environment, the average sampling rate is about 5 s to 15 s. This sampling rate is acceptable for this application since hydraulic systems typically have slow dynamics, and real-world implementations have lower sampling rates. All data are stored with a time mark for each variable and available for download as a
.csv file.
The cloud environment comprises two interfaces: the operator and the diagnosis interfaces. Both were designed in different environments and with different objectives and applications in mind:
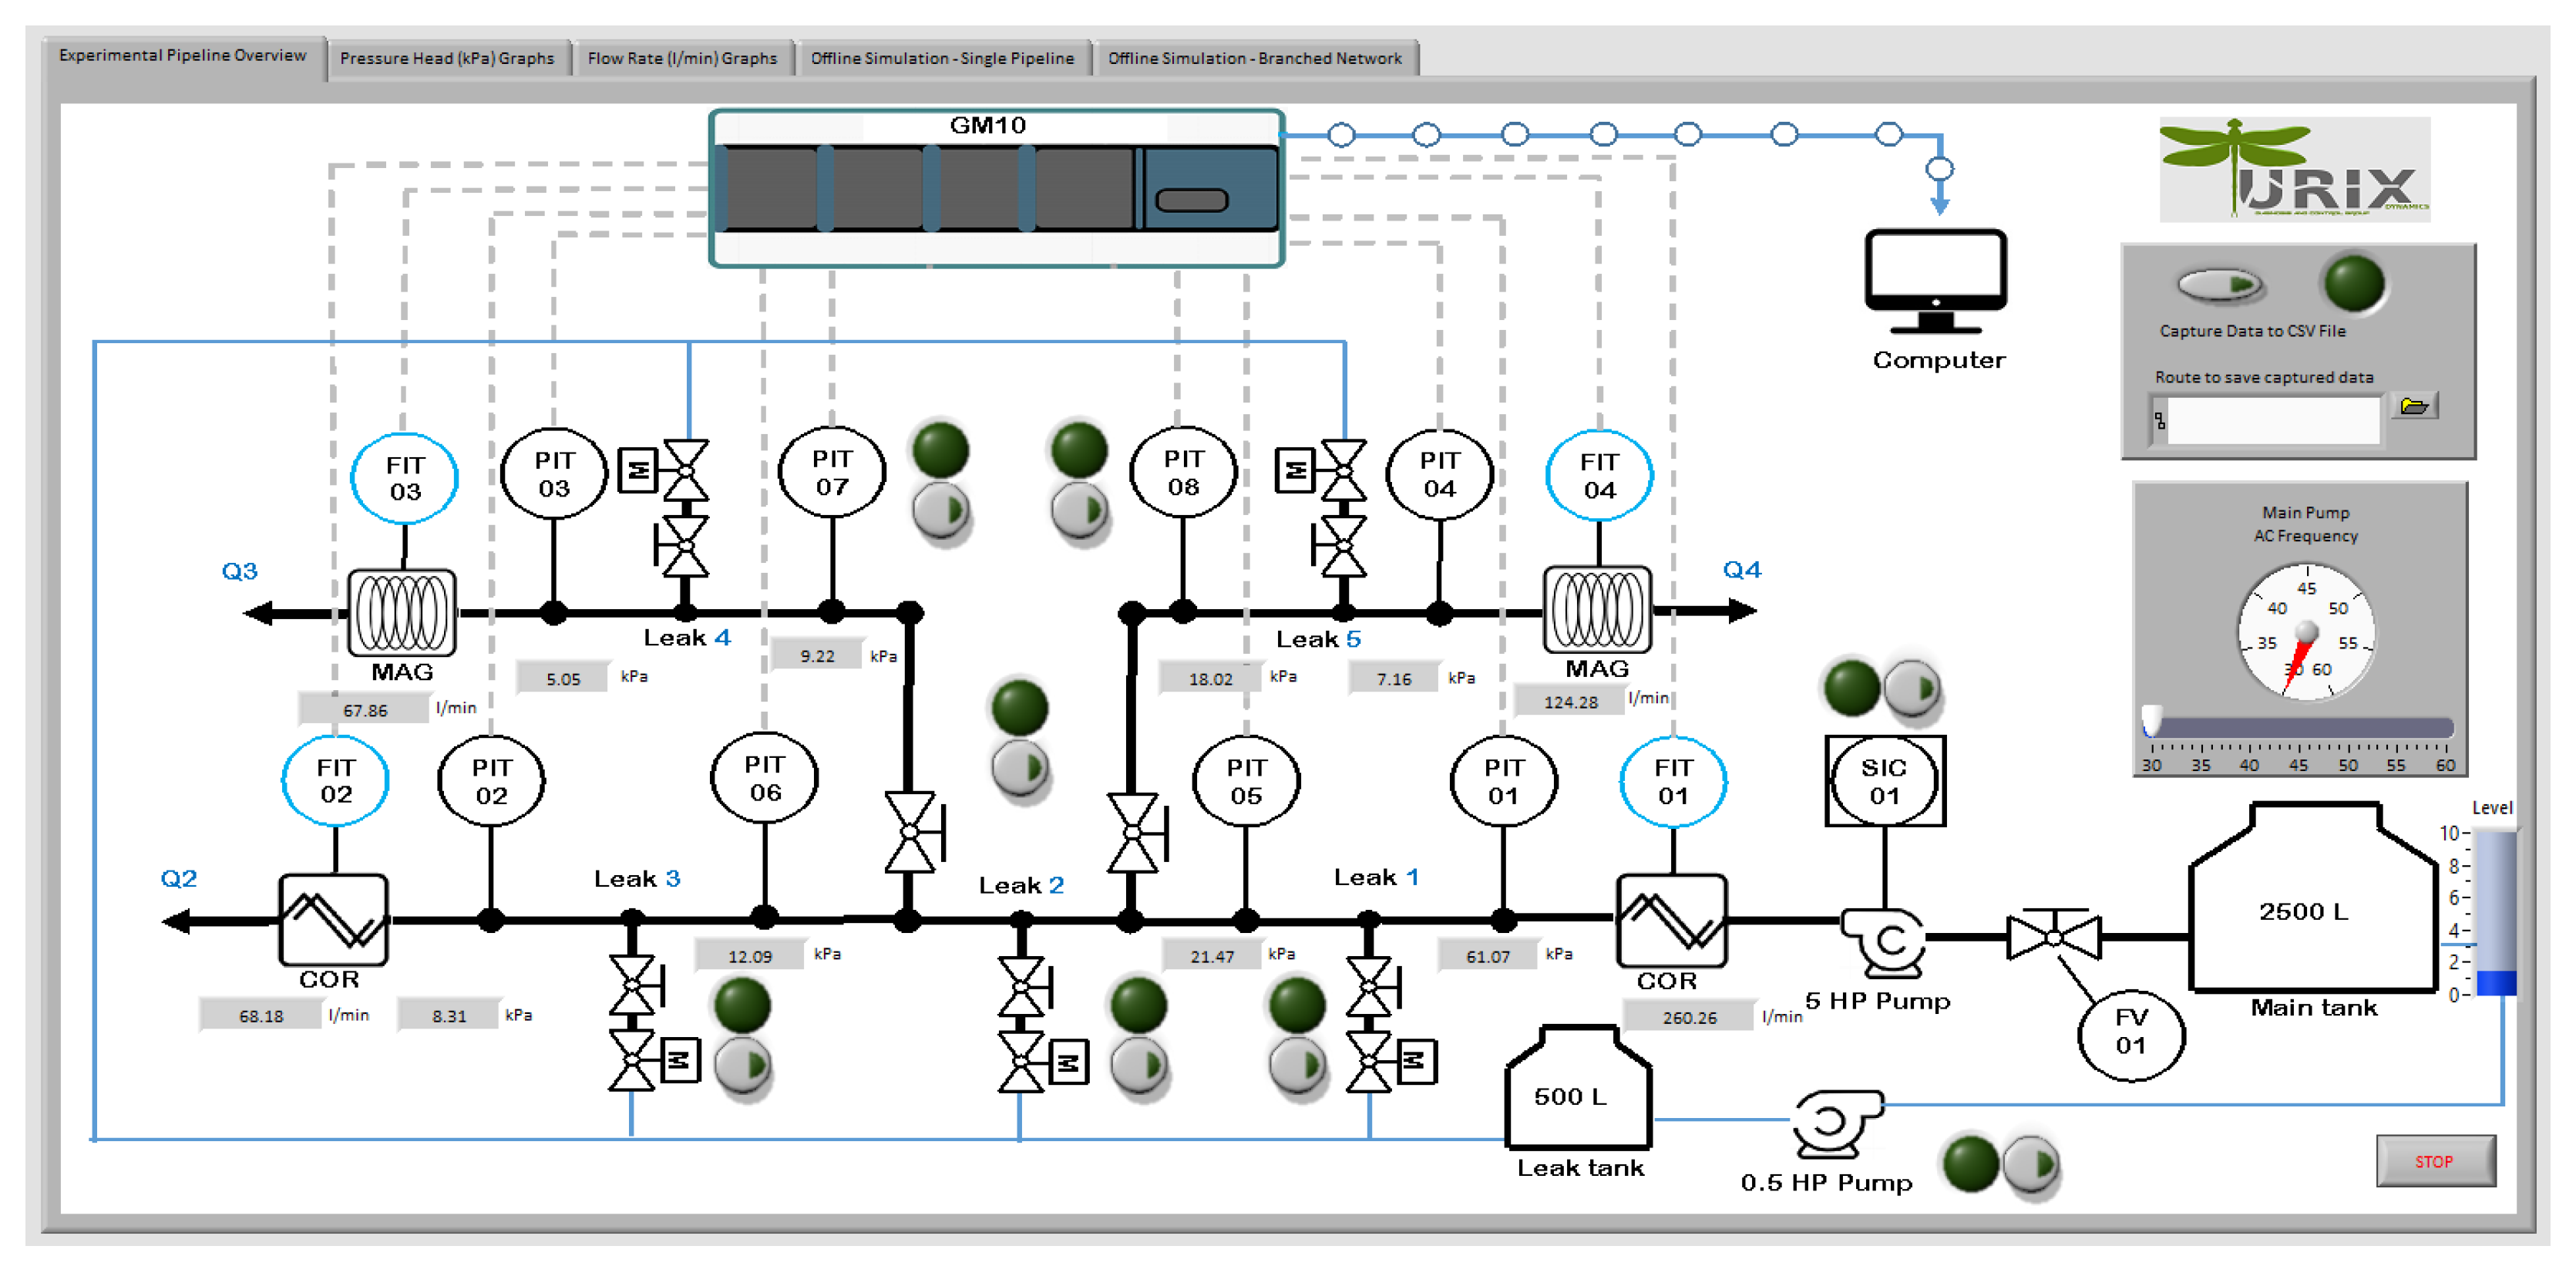
The operator interface (see
Figure 8) was designed in LabVIEW 2021
®, whose purpose is to control and monitor the WDN remotely. This interface includes remote controls for the electronic valves, the main feeding pump, and the operation frequency of the speed controller.
The diagnosis interface was implemented in MATLAB
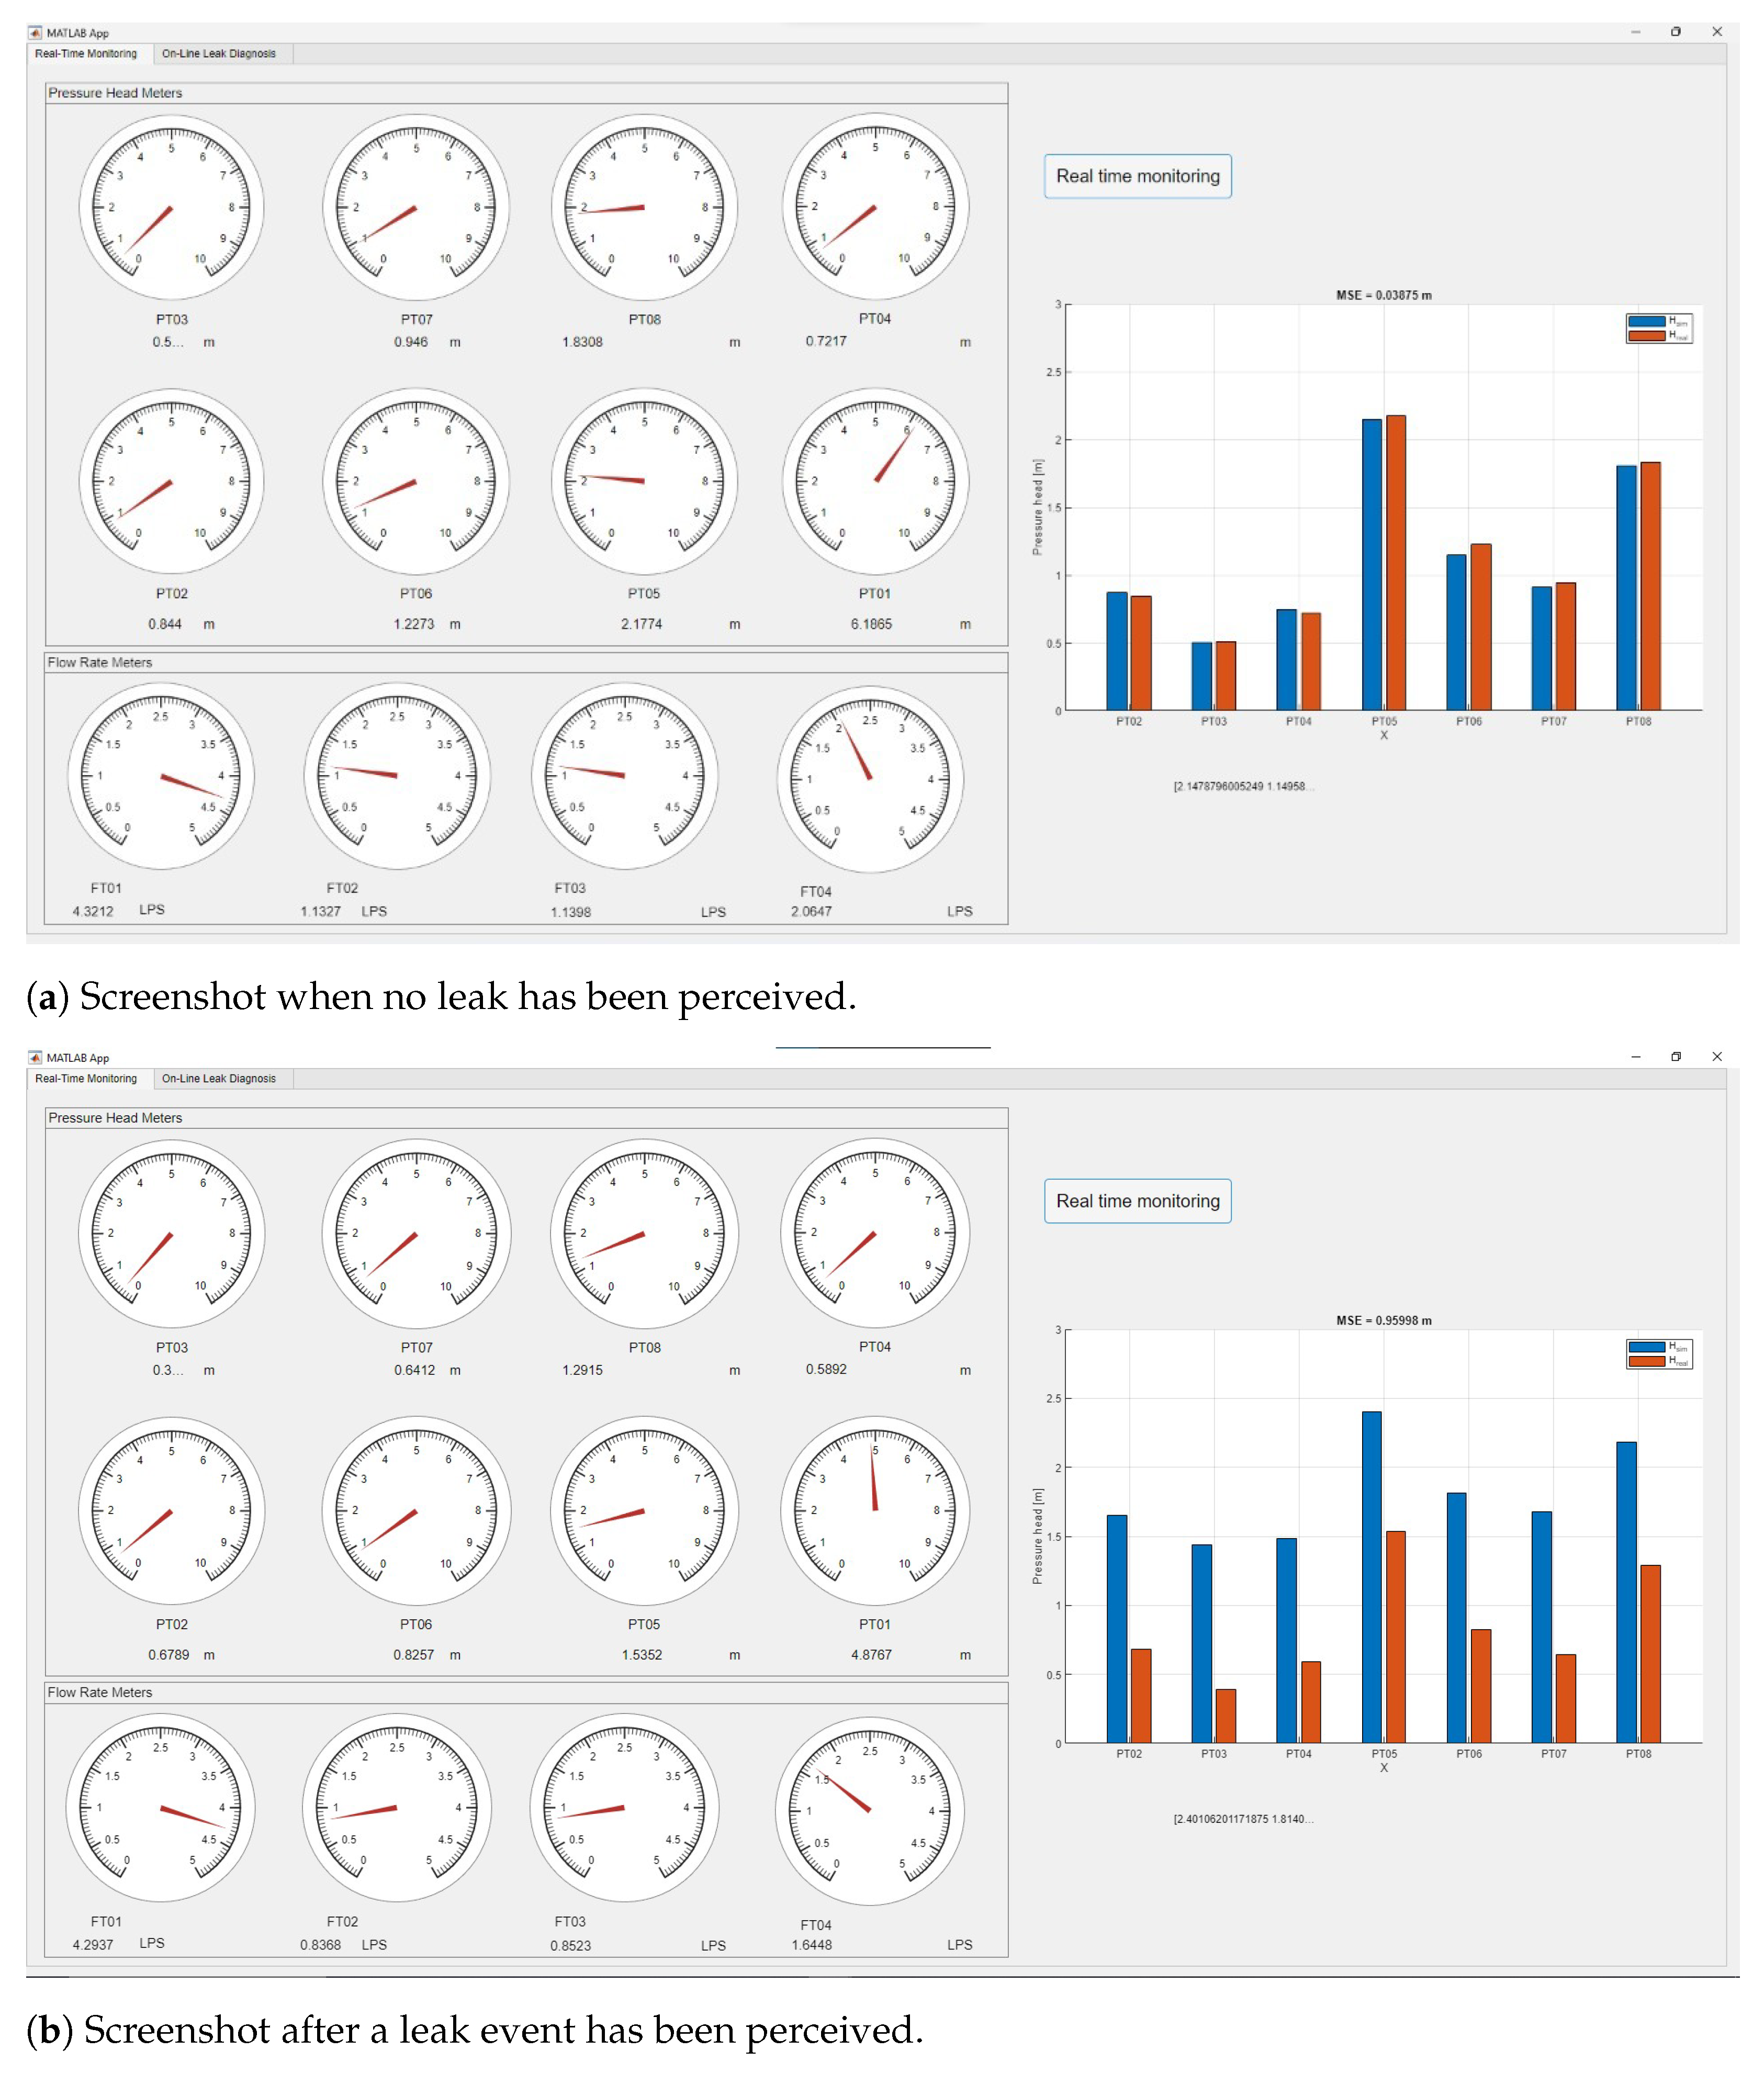
® to perform the online leak diagnosis. As shown in
Figure 9, simulated pressure heads at nodes with sensors are graphically compared with measured values at the same locations. Once a leak occurs, a mismatch between the simulated and sensor readings is perceived. The operation of the leak diagnosis algorithm will be discussed more thoroughly in
Section 3.3.
Both of the interfaces rely on a low-latency telecommunications scheme.
Figure 10 shows schematically the telecommunications between the digital twin environments. The installed pressure head, flow rate, and water-level data are read. A desktop computer runs a MATLAB script that interfaces with the
datalogger using the Modbus TCP/IP protocol. Once all the readings at a given time step are available, they are sent to the cloud environment using ThingSpeak-related commands in the same MATLAB script.
The user can also interact with the remote controls implemented in the operator interface to open/close the leak valves and regulate the operating AC frequency of the main feeding pump. The on/off control orders are written in binary form (1/0) in the first six fields of the third cloud channel (five for the leak valves and one for the pump). For the case of the leak valves, a control subsystem with an embedded M5Tough microcontroller based on the ESP32 chip with Wi-Fi is used to control the open/closed state of the valves.
3.3. Leak Diagnosis Algorithm
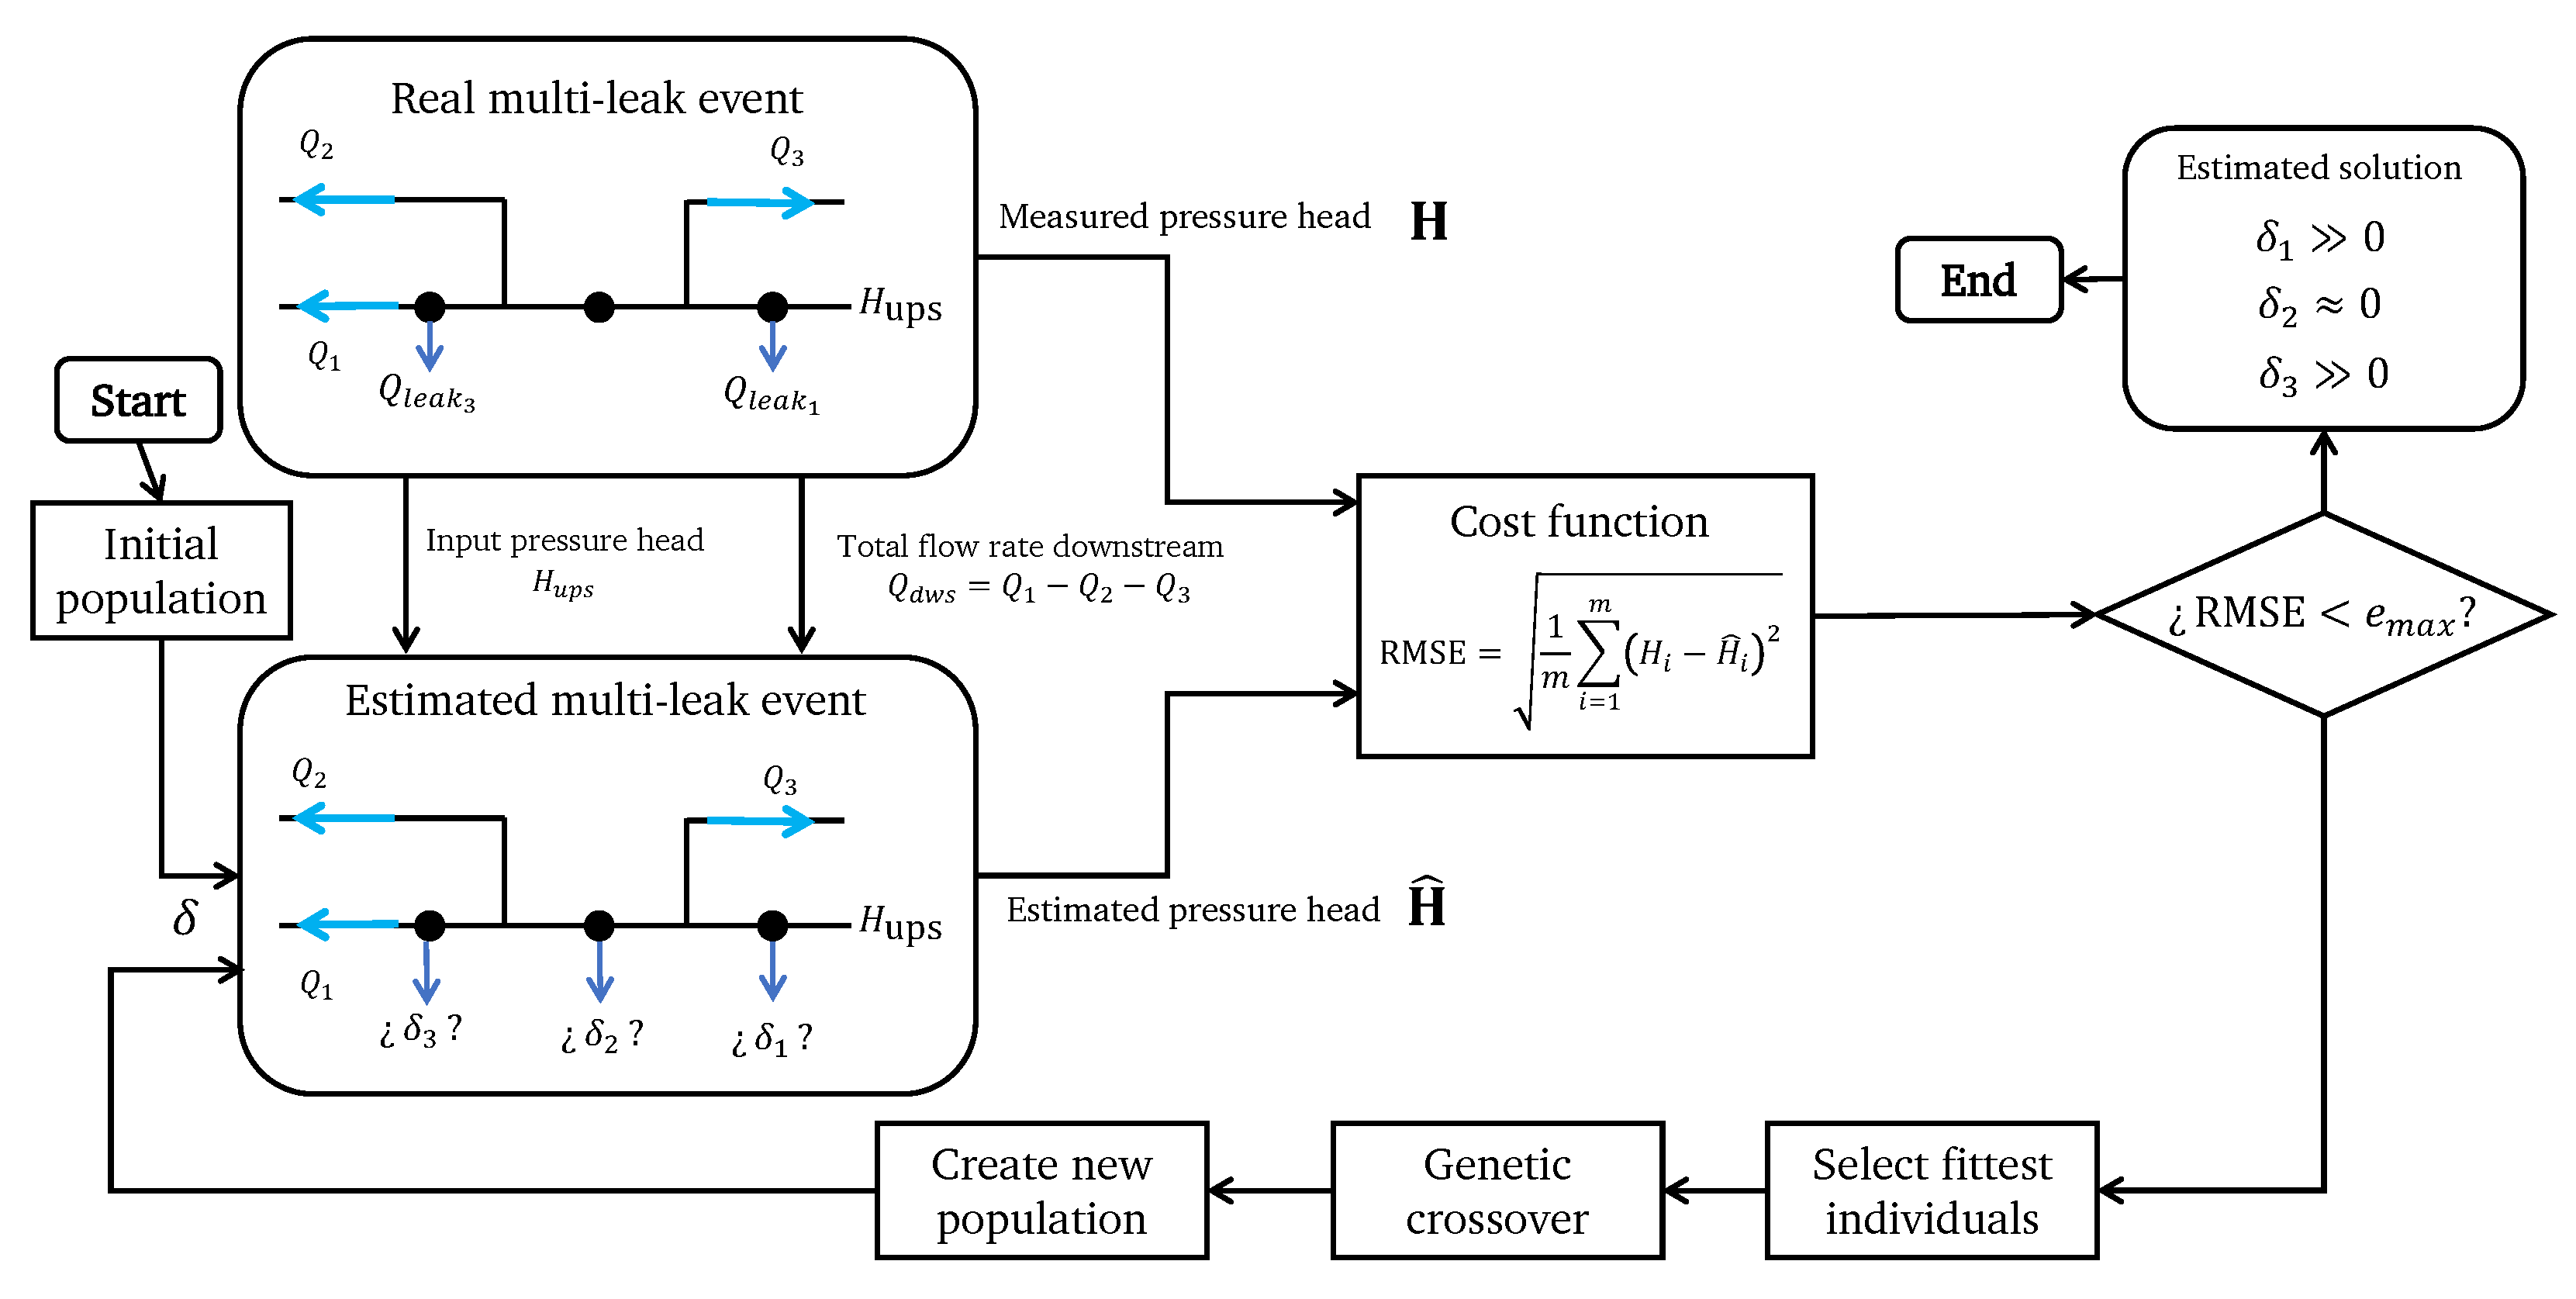
The leak diagnosis methodology integrated into the proposed digital twin is based on the heuristic method of the genetic algorithm, as illustrated in
Figure 11. The process begins by creating an initial population of proposed solutions called chromosomes, which can contain one or multiple genes to be calibrated. Each gene is a specific variable in the optimization problem. The fitness of every individual in the population is tested using a cost function. Those chromosomes that yield the lowest cost are selected as the best-performing individuals in the population and are used to create a new population by recombining their genes during a genetic cross-over stage. The newer generations are expected to perform better than the latter since they were created using only the genes that made up the best-performing individuals. The process continues during a defined number of generations or until the increase in the fitness of the individuals between two consecutive generations is no longer noticeable.
For our application, the pressure head and flow rate measurements are received online in the MATLAB interface that integrates the real-time measurements with the calibrated EPANET model to program the GE. A hydraulic simulation is performed considering the pressure head at upstream
and the flow rate at downstream
as the initial conditions taken from the sensor readings.
Figure 9a presents a real-time comparison between the sensor readings (blue columns) and the hydraulic model estimations (orange columns) at specific nodes with sensors, where it can be seen that they present a low error. Flow rate
is also monitored upstream, and thus the balance
is computed. Note that the flow balance should be as close to zero as possible without leaks, although a small deviation can be expected due to measurement noise. This deviance should be carefully characterized under leak-free conditions to avoid false alarms. Two main indicators perceive a leak event: the balance
and a change in the hydraulic variables such as the measured and simulated pressure head values no longer presenting a low-error fit, as can be visualized in the leak diagnosis interface as presented in
Figure 9b.
Once the leak is detected, the GA process begins by calibrating the magnitude of the leak and its location. The magnitude can be easily obtained by computing the difference between upstream and downstream flow rates. However, in a multiple leak event scenario, the value depends on the flow balance of all active leaks. Therefore, individual outflow in each leak node needs to be computed. The system is subdivided into pipe segments to achieve this goal. Because the leaks can occur in any number and combination of nodes, a smaller set of candidate nodes is pre-selected where the leaks are suspected to be occurring. This candidate selection needs to be thoroughly performed, considering aspects such as the junction age and its historical leak occurrences. This is formulated as an optimization problem by considering the GA.
![Processes 11 03009 i001]()
Using the GA, an optimization process occurs once a leak event has been perceived. A vector, represented as
, is created, where each element
corresponds to the calibrated outflow value in the
i-th candidate node. The proposed solutions will be structured in the following manner:
with
n being the number of selected candidate nodes where the leaks can occur,
the calibrated outflow for the first candidate node,
the calibrated outflow for the second candidate node, and so on. Adequate lower (
) and upper (
) bounds are selected for the GA-driven search to create these
values, following the restrictions
After the initial population is created, the fitness of each candidate is tested by evaluating the error between the measured and estimated pressure heads after the multi-leak event as follows:
The values in a given solution vector are set in the EPANET model as the actual outflow in their corresponding nodes. The latest readings for , and are also set as the initial conditions in the EPANET model, and a steady-state hydraulic simulation is performed.
From the simulation, the following is obtained:
where
m is the number of nodes with sensors and
is the estimation of the pressure head at the
i-th node with sensor. Similarly, a vector containing the measured pressure head at the same nodes is constructed as follows:
The fitness is evaluated in terms of the root of the mean squared error (RMSE):
The fitness of all individuals in the generation is tested, and those that provide the lowest RMSE are selected for the genetic crossover stage. A new generation of proposed solutions is created, and the algorithm returns to step 1.
After the optimization process has finished, it is expected that the calibrated values corresponding to the nodes with actual leaks will be calibrated significantly greater than zero. In contrast, those corresponding to nodes where the leak event is not happening will be estimated with a value close to zero.
For any multi-leak scenario, the input pressure head and the total combined flow rate downstream are fed to the hydraulic simulator and the initial values population. After the hydraulic simulation is computed, the fitness of each element is calculated. If any computed RMSE is less than a pre-set tolerance value , the search finishes, and the solution vector is selected as the estimated multi-leak scenario. Otherwise, the GA continues, and the fittest individuals in the population are selected, such that the genetic crossover takes place and a new generation is created to continue with the search. After the GA-based search is performed, the values corresponding to the nodes without leaks are expected to be calibrated closely to zero. In contrast, the nodes with actual leaks will be calibrated with outflows significantly greater than zero. After the outflows are calibrated, the nodes with the greater leaked flow rates are selected as the leaky nodes and presented graphically to the user.
3.4. Experimental Validation
The experimental demonstration of the proposed leak diagnosis method was performed by considering that leaks take place only in the main pipeline section of the system since it was observed that inducing an outflow at this location causes a much more noticeable pressure head drop than leaks occurring in the branches. Since three leak valves are installed in the main pipeline section of the system, different multi-leak scenarios were proposed and tested: the scenario for a combined leak event considering two simultaneous leaks occurring in valves 1 and 2, the scenario considering that leaks take place in valves 1 and 3, and finally, the scenario with two simultaneous leaks in valves 2 and 3.
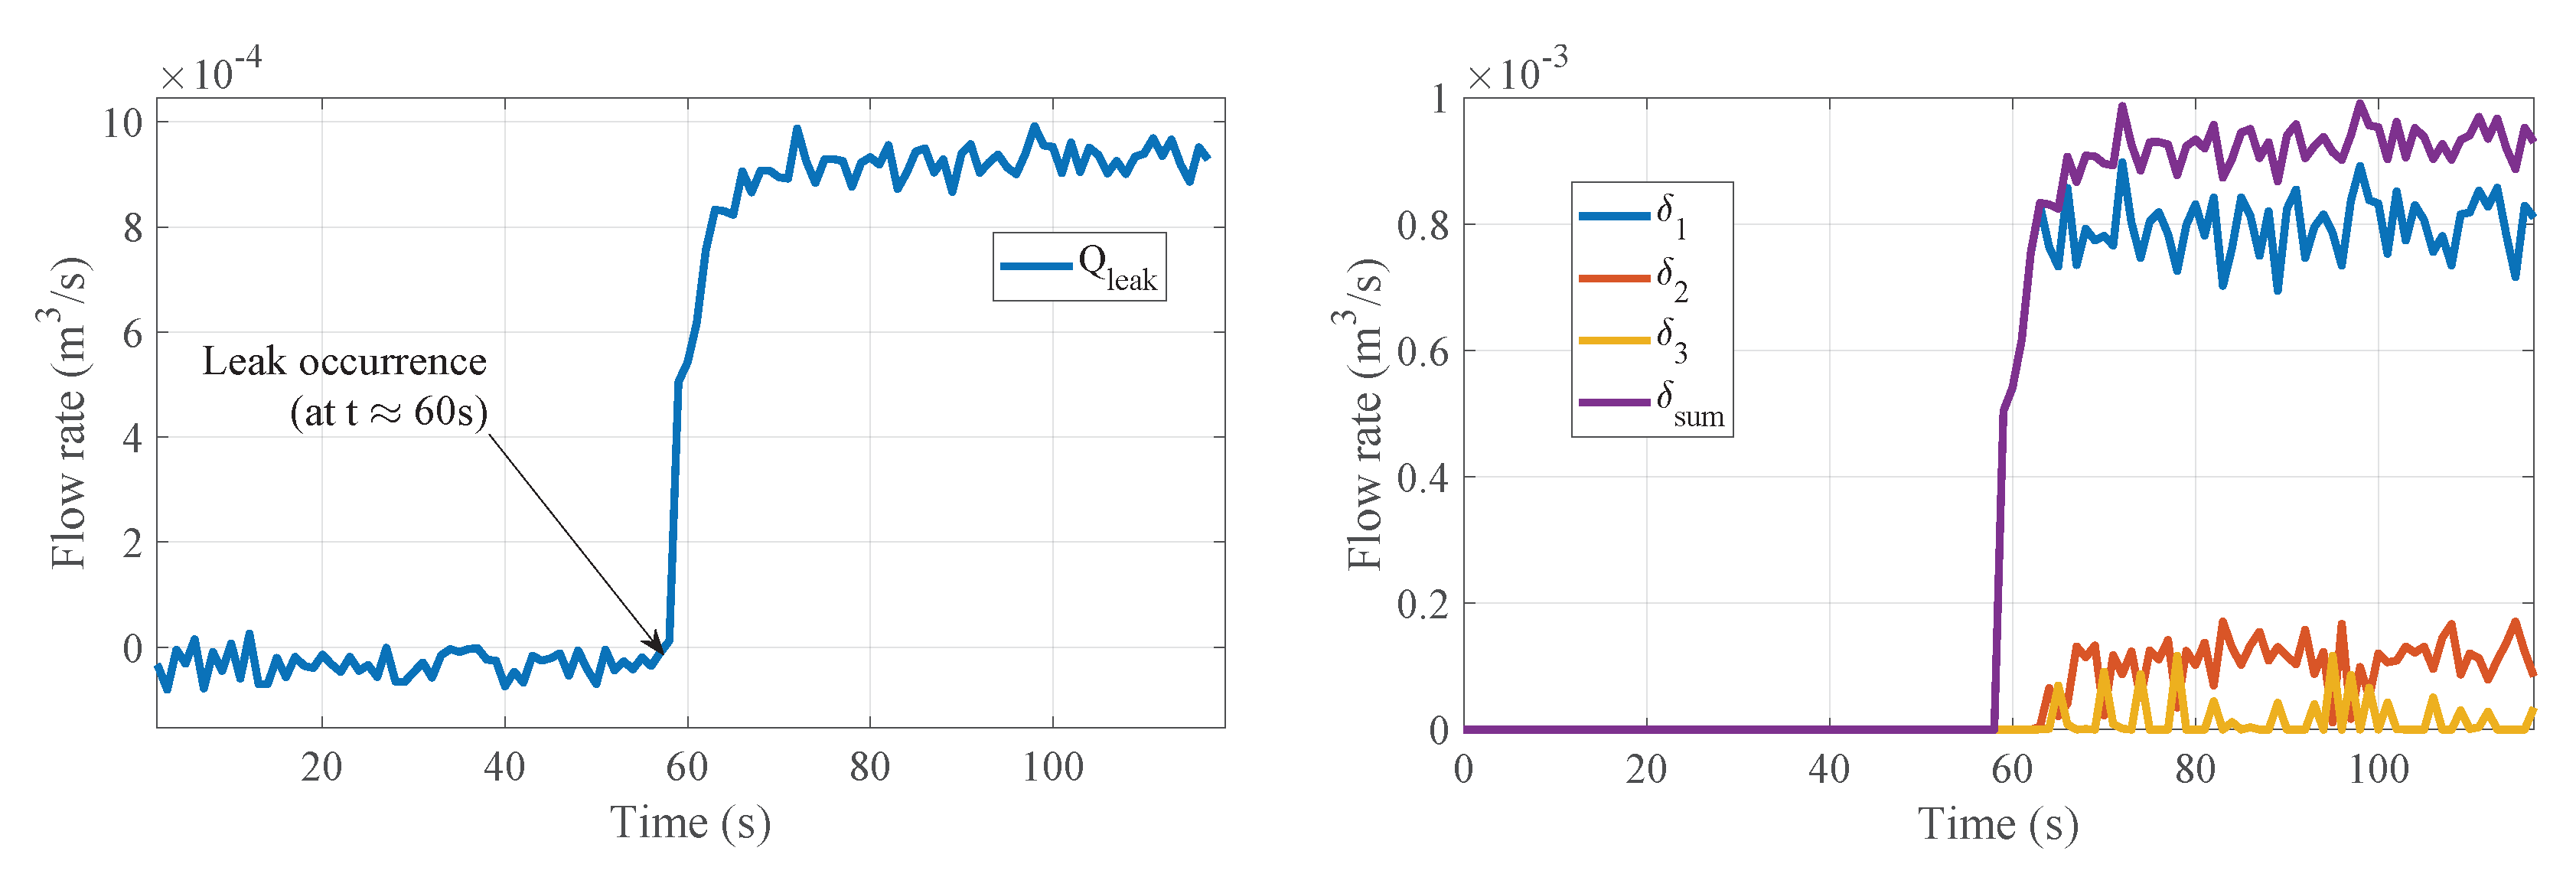
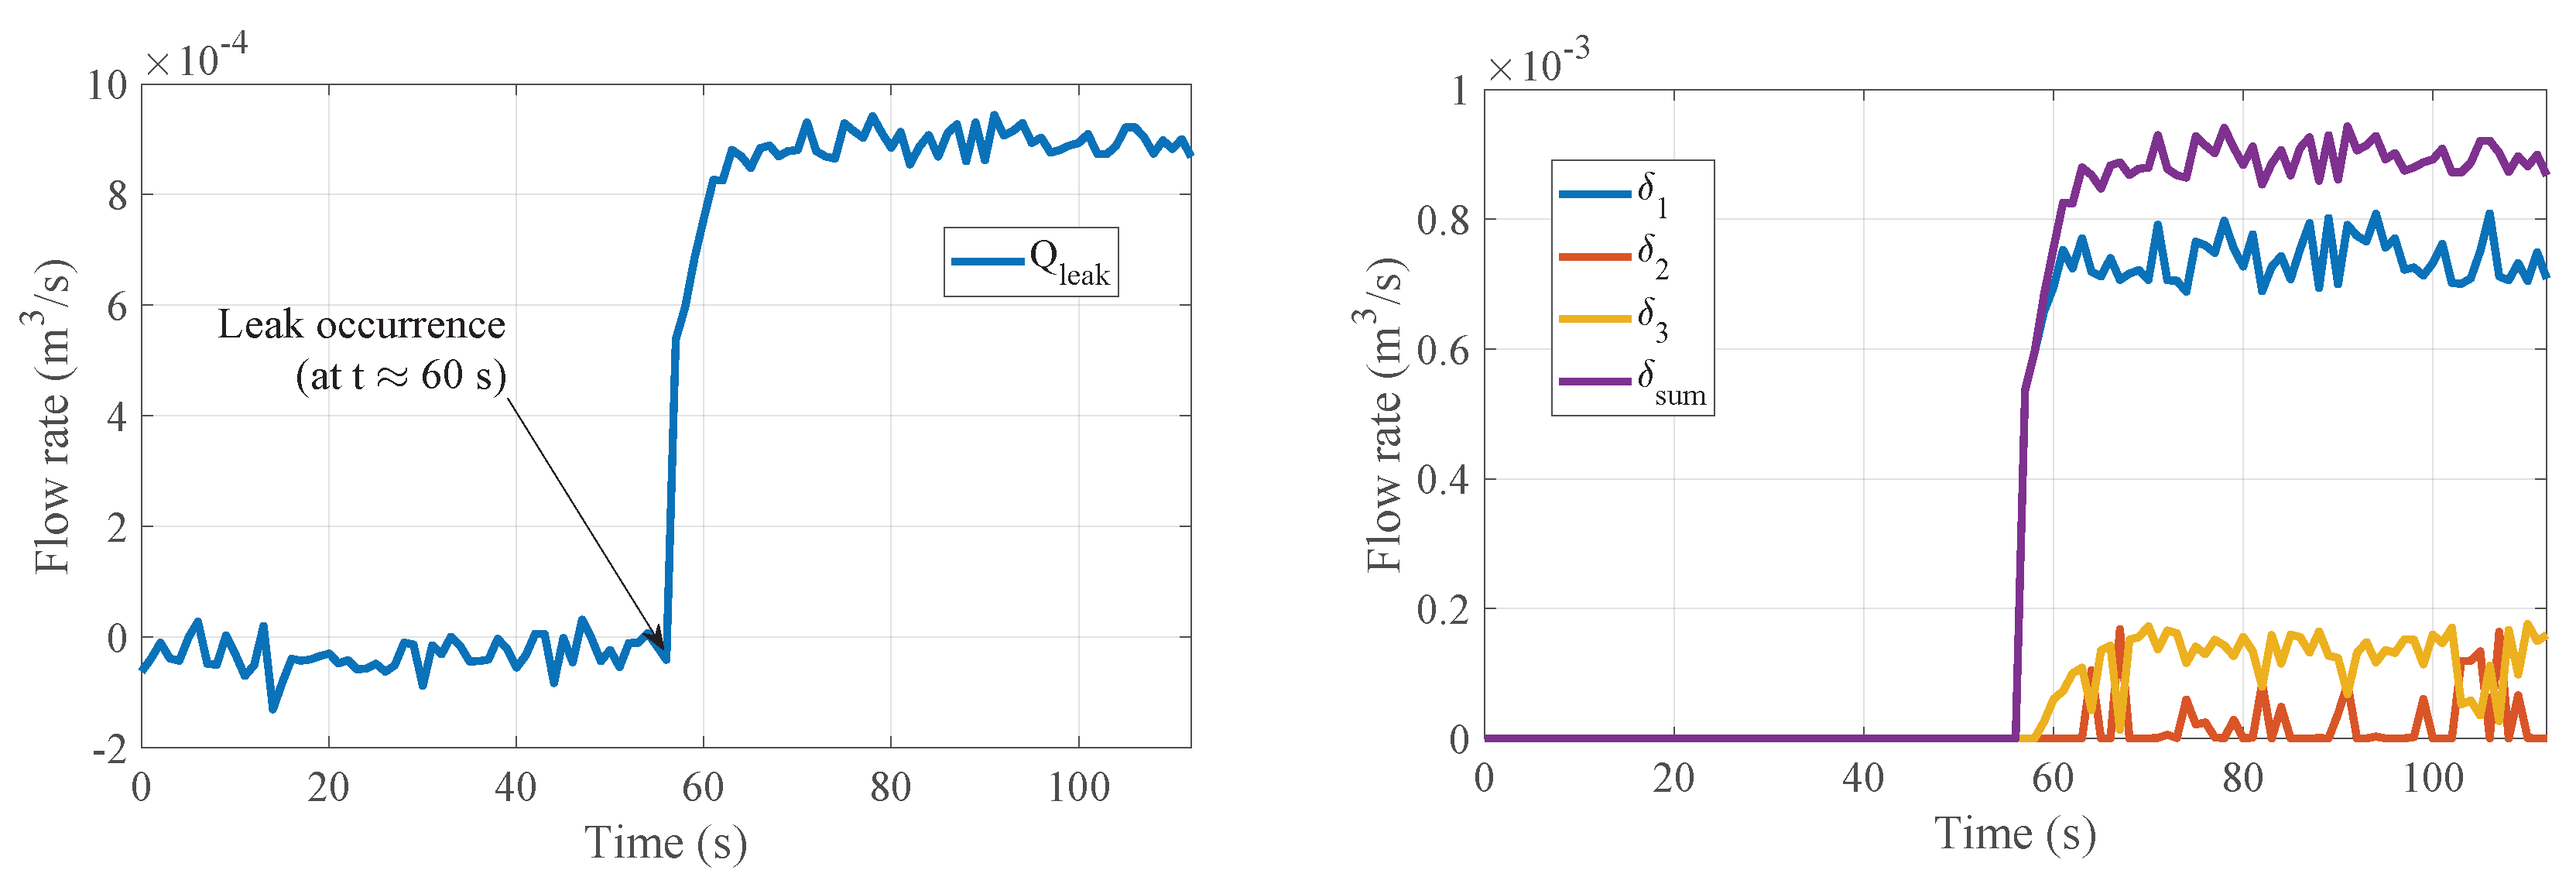
Figure 12 shows the diagnosis results for scenario
. Both leak valves are opened at
[
]. Once the leak is perceived, the
values are calibrated. It can be seen in
Figure 12 how the values corresponding to
and
are significantly greater than
, which in turn remains close to zero for the duration of the experiment. This demonstrates that, as expected, the leaks are located at positions 1 and 2.
Multiple tests were performed to demonstrate that the proposed methodology remains valid under repeated experiments.
Table 2 summarizes the obtained results for the three tests conducted for scenario
. It can be seen how the calibrated
and
values are greater (of various orders of magnitude) than
for all cases.
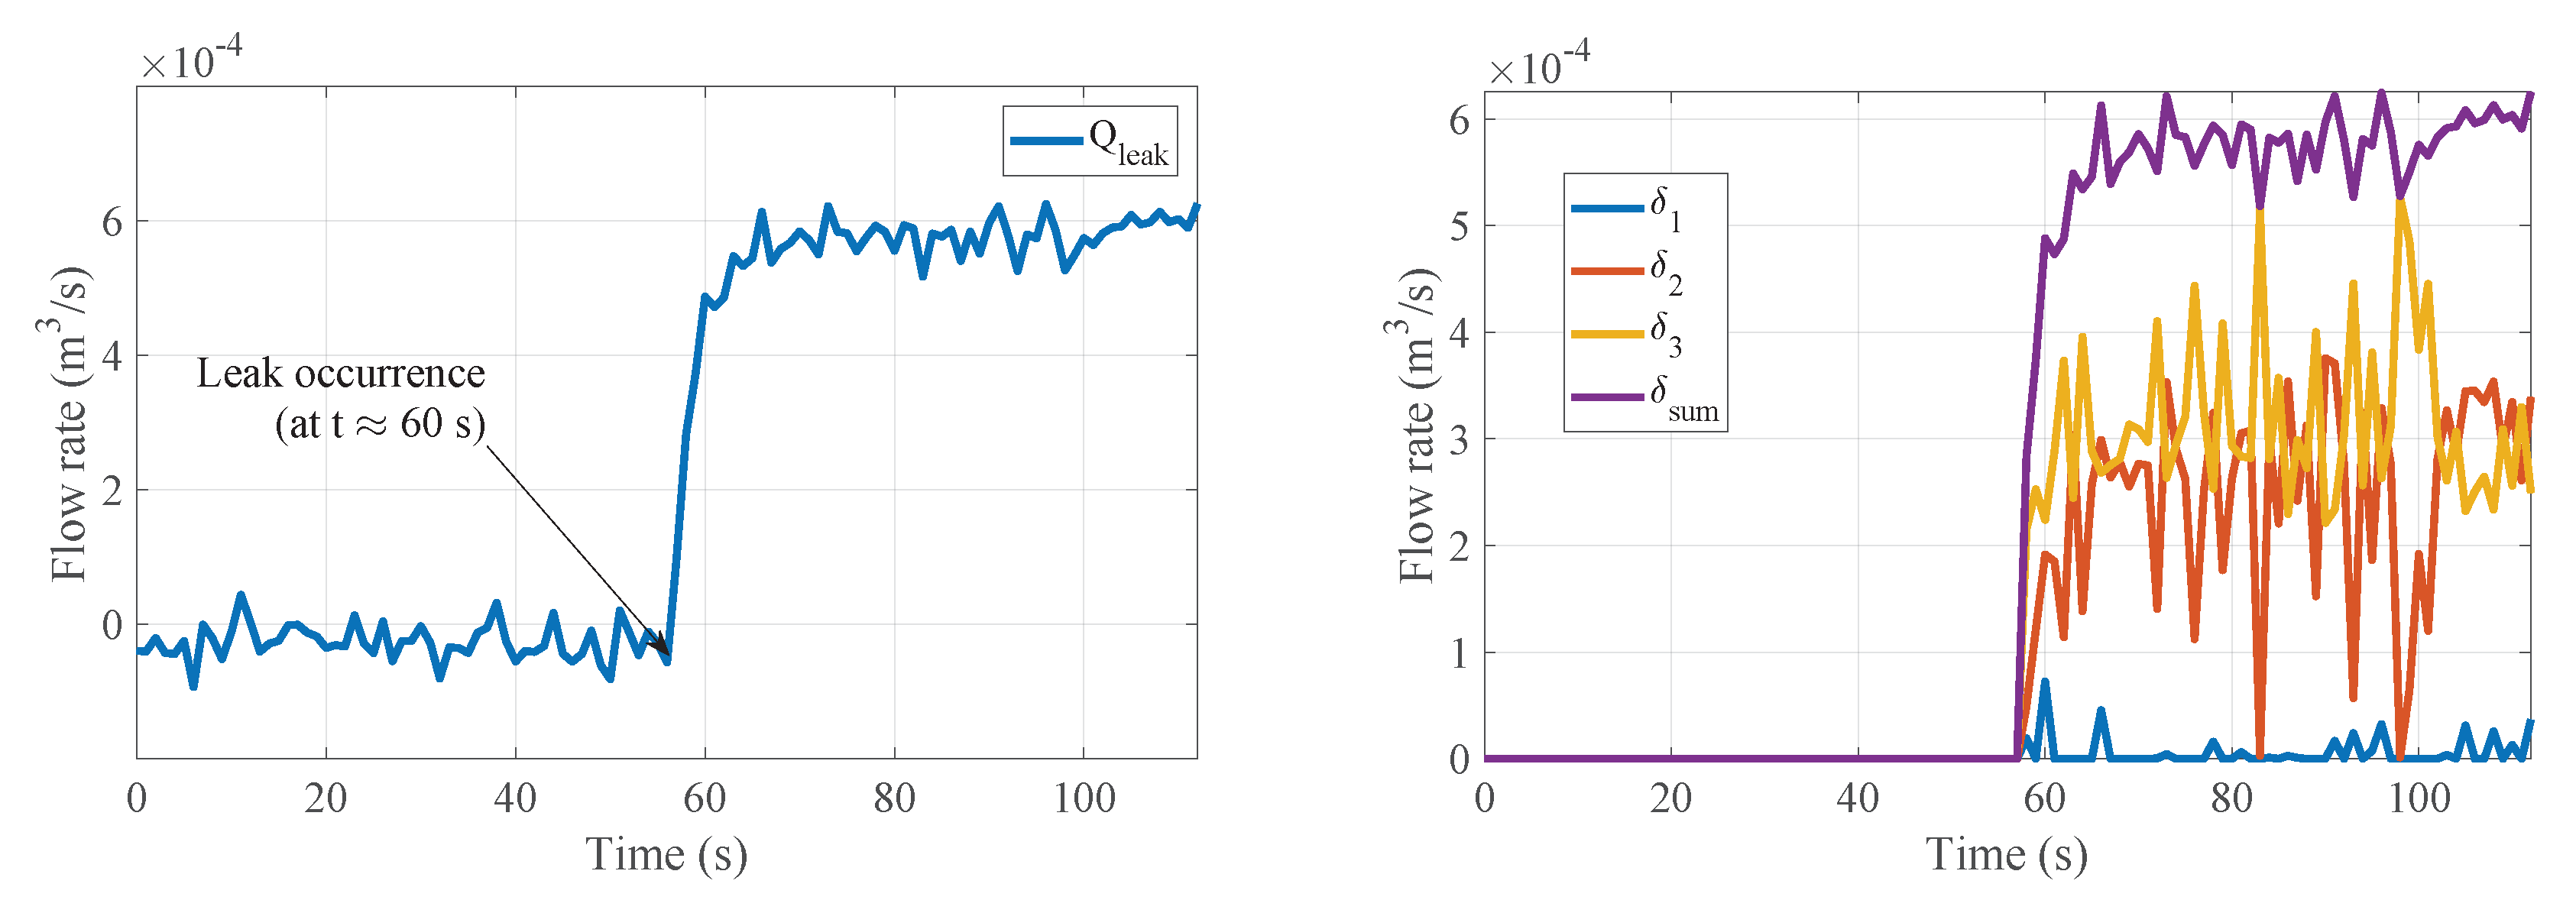
Similar validation tests were conducted for multi-leak scenarios
and
, obtaining satisfactory results in all tests in the isolation of the correct leak events and in quantifying the leaked outflow. Results can be consulted in
Figure 13 and
Figure 14 as well as in
Table 3 and
Table 4. Notice how for scenario
the calibrated
value will be significantly smaller than
and
, whereas for scenario
,
is, as would be expected, the lowest-calibrated value.


 ,
, 


