Article

Clean Energy from Poplar and Plastic Mix Valorisation in a Gas Turbine with CO2 Capture Process

1
Energy Generation and Use Department, Faculty of Power Engineering, National University of Science and Technology Politehnica Bucharest, 313 Splaiul Independentei, 060042 Bucharest, Romania
2
Academy of Romanian Scientists, Ilfov 3, 050044 Bucharest, Romania
*
Authors to whom correspondence should be addressed.
Processes 2023, 11(10), 2922; https://doi.org/10.3390/pr11102922
Submission received: 10 September 2023 / Revised: 1 October 2023 / Accepted: 2 October 2023 / Published: 7 October 2023

Abstract

:
The objective of this paper is to explore the utilisation of plastic waste via the gasification process to produce electricity with low carbon dioxide emissions. Worldwide, plastic production has increased, reaching 390 million tons in 2021, compared to 1.5 million tons in 1950. It is known that plastic incineration generates approximately 400 million tons of CO2 annually, and consequently, new solutions for more efficient plastic reuse in terms of emissions generated are still expected. One method is to use plastic waste in a gasifier unit and the syngas generated in a gas turbine for electricity production. The co-gasification process (plastic waste with biomass) was analysed in different ratios. Gasification was carried out with air for an equivalent ratio (ER) between 0.10 and 0.45. The volume concentration of CO2 in syngas ranged from 2 to 12%, with the highest value obtained when the poplar content in the mix was 95%. In this study, the option of pre- and post-combustion integration of the chemical absorption process (CAP) was investigated. As a result, CO2 emissions decreased by 90% compared to the case without CO2 capture. The integration of the capture process reduced global efficiency by 5.5–6.1 percentage points in a post-combustion case, depending on the plastic content in the mix.

1. Introduction

The pyrolysis and gasification processes are thermal treatment methods that take place in successive stages, beginning with drying, progressing to subsequent devolatilisation and gasification of coke, and finishing with partial oxidation [1]. There is no clear distinction between these phases from the studies carried out so far, so they can be run simultaneously over specific temperature ranges in real processes [2]. The process of devolatilisation must be carried out in the absence of oxygen in the temperature range of 350 to 850 °C [3]. Depending on the heating rate, the stationary time in the chemical reaction area, and the feed content, the resulting gasification products can be classified as follows: (a) solids and mainly coke; (b) liquids consisting of heavy hydrocarbons, water, different types of oils and tar; and (c) gaseous components, such as H2, CO, CO2, CxHy, and H2O [4]. After that, secondary reactions may occur, in which the resulting volatiles participate in the formation of the various products [5,6].
After the pyrolysis process, the gasification process takes place. Using a gasification agent (steam, air, or oxygen) allows the conversion of larger molecules into stable gases, such as CO, CO2, CxHy, and H2; water; tar; and ash [7,8]. The gasification process takes place at higher temperatures, between 650 and 1200 °C [9]. Following the two processes of pyrolysis and gasification, the resulting product is a synthetic gas with a temperature of no more than 1000 °C and a composition based on gases such as CO, H2, CO2, CxHy, and other inert gases generated according to the gasification agent used [10]. Synthesis gas can be utilised in different types of energy installations, such as internal combustion engines and thermal engines, with gas turbines being most known for electricity generation [11,12]. In addition, several processes can be integrated to improve the quality of synthesis gas, such as a water gas shift reactor (WGS) used for the conversion of carbon monoxide into hydrogen or carbon dioxide capture processes [13].
The mixture’s compound plays a crucial role in determining the composition of the synthesis gas and determining the optimal process parameters [14]. The gasification agent also plays a significant role in setting operational parameters [15]. In this study, the gasification agent used was air, in which case the optimal equivalent ratio (ER) was established.
Given the sharp increase in plastic waste resulting from anthropogenic activities, sustainable reduction has become a global goal. This waste can be recovered by gasifying it to produce a synthesis gas with improved properties (e.g., H2/CO ratio) [16].
Regarding the methods of chemical recycling plastic waste, the most studied methods are gasification (production of energy) and pyrolysis (production of fuels and chemicals) [17]. Various studies of the gasification of plastic waste have been carried out, depending on the operating temperature of the gasifier, the type of oxidising agent used, and the type of reactor [18]. For example, for a mixture of plastic waste (PVC, PE, PMMA, PET, PS, and PP), subjecting the plastic to a gasification temperature between 700 and 900 C with an oxidising agent (air) resulted in the production of syngas consisting mostly of H2 up to 28%, CO up to 19%, CO2 up to 6%, CH4 up to 11%, and N2 up to 46% [19]. The biomass gasification process has been studied much more in the last decade compared to the study of plastic waste gasification, as it has a much higher potential to replace the use of fossil fuels for energy production [20,21].
CO2 capture technologies have been developed in recent decades to reduce CO2 emissions from various industries; they can contribute significantly to the decarbonisation of the environment [22,23]. Depending on the mode of integration and process, they can be integrated pre-, oxy-, or post-combustion [24]. There are several methods of separating CO2 from a gas stream, such as absorption, adsorption, cryogenics, membranes, and chemical looping combustion [24]. The most developed and mature technology that can be integrated on an industrial scale is chemical adsorption-based amine technology [25].
The present study analysed the mix of plastic (PP) and wood biomass poplar (P) in various proportions in the gasification process. The syngas was used as fuel in a gas turbine with an installed power of 5 MW for electricity production. For flue gas decarbonisation, the CO2 capture process was integrated using chemical absorption based on MEA 30 wt.% in two variants: pre- and post-combustion. Given that part of the raw material is wood biomass poplar (CO2-neutral), and CO2 capture technology is integrated, energy with negative CO2 emissions is produced.

2. Methods

2.1. Gasification Process Description

The gasification process uses a gasification agent to transform different solid components from the feed-in gaseous compounds; in this case, air was used as a gasification agent. The equations presented below describe the stages that occur during the gasification process [26].
C + 1 2 O 2 C O   ( 111   M J / k m o l )
C + 1 2 O 2 C O 2   ( 283   M J / k m o l )
H 2 + 1 2 O 2 H 2 O   ( 242   M J / k m o l )
C + H 2 O C O + H 2   ( w a t e r   g a s   r e a c t i o n , + 131   M J / k m o l )
C + C O 2 2 C O   ( b o u d o u a r d   r e a c t i o n , + 172   M J / k m o l )
C + 2 H 2 C H 4   ( m e t h a n a t i o n   r e a c t i o n , 75   M J / k m o l )
C O + H 2 O C O 2 + H 2   ( w a t e r   g a s   s h i f t   r e a c t i o n , 41   M J / k m o l )
C H 4 + H 2 O C O + 3 H 2   ( s t e a m   m e t h a n e   r e f o r min   g   r e a c t i o n , 206   M J / k m o l )
In the current study, a mix of plastic (PP) and wood poplar was used. The feedstock composition in dry basis (db) for each case is presented in Table 1 [27,28]. Equation (9) was used to calculate the lower heating value (LHV) in kJ/kg.
L H V = ( 81.3 × C + 243 × H + 15 × N 25.3 × O + 45.6 × S ) × 4.184   ( k J / k g )
The cases studied are as follows:
  • Case 1. P–PP mix gasification without CO2 capture process;
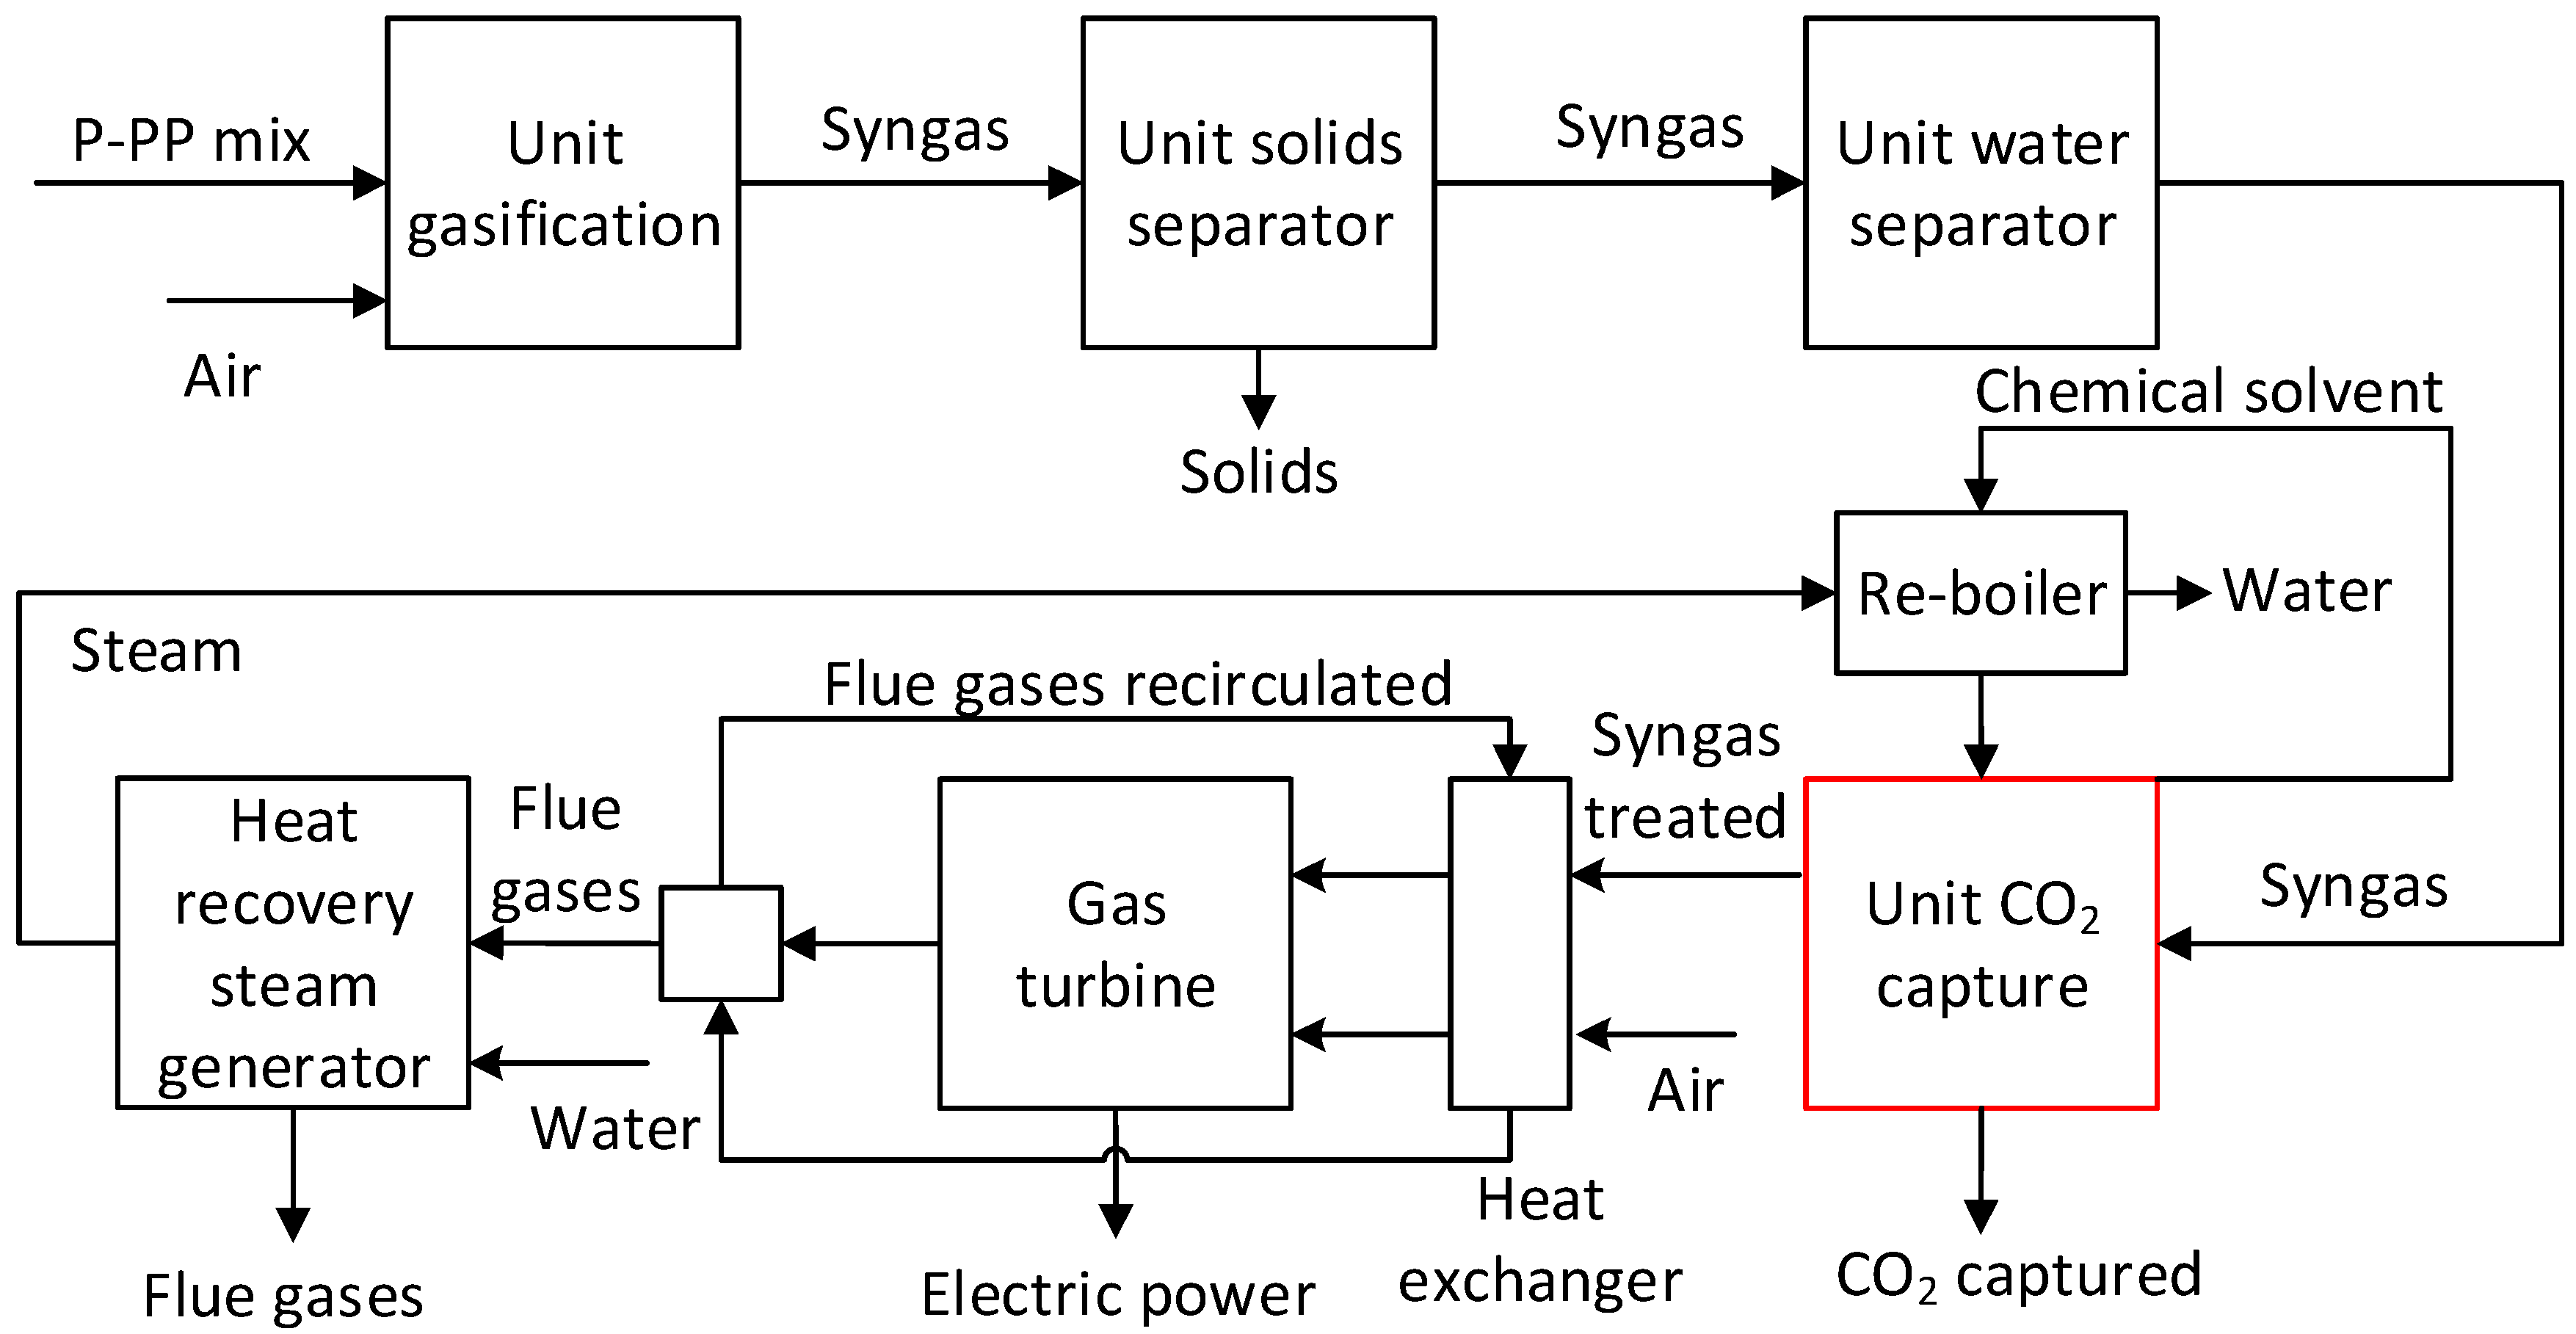
  • Case 2. P–PP mix gasification with pre-combustion CO2 capture process;
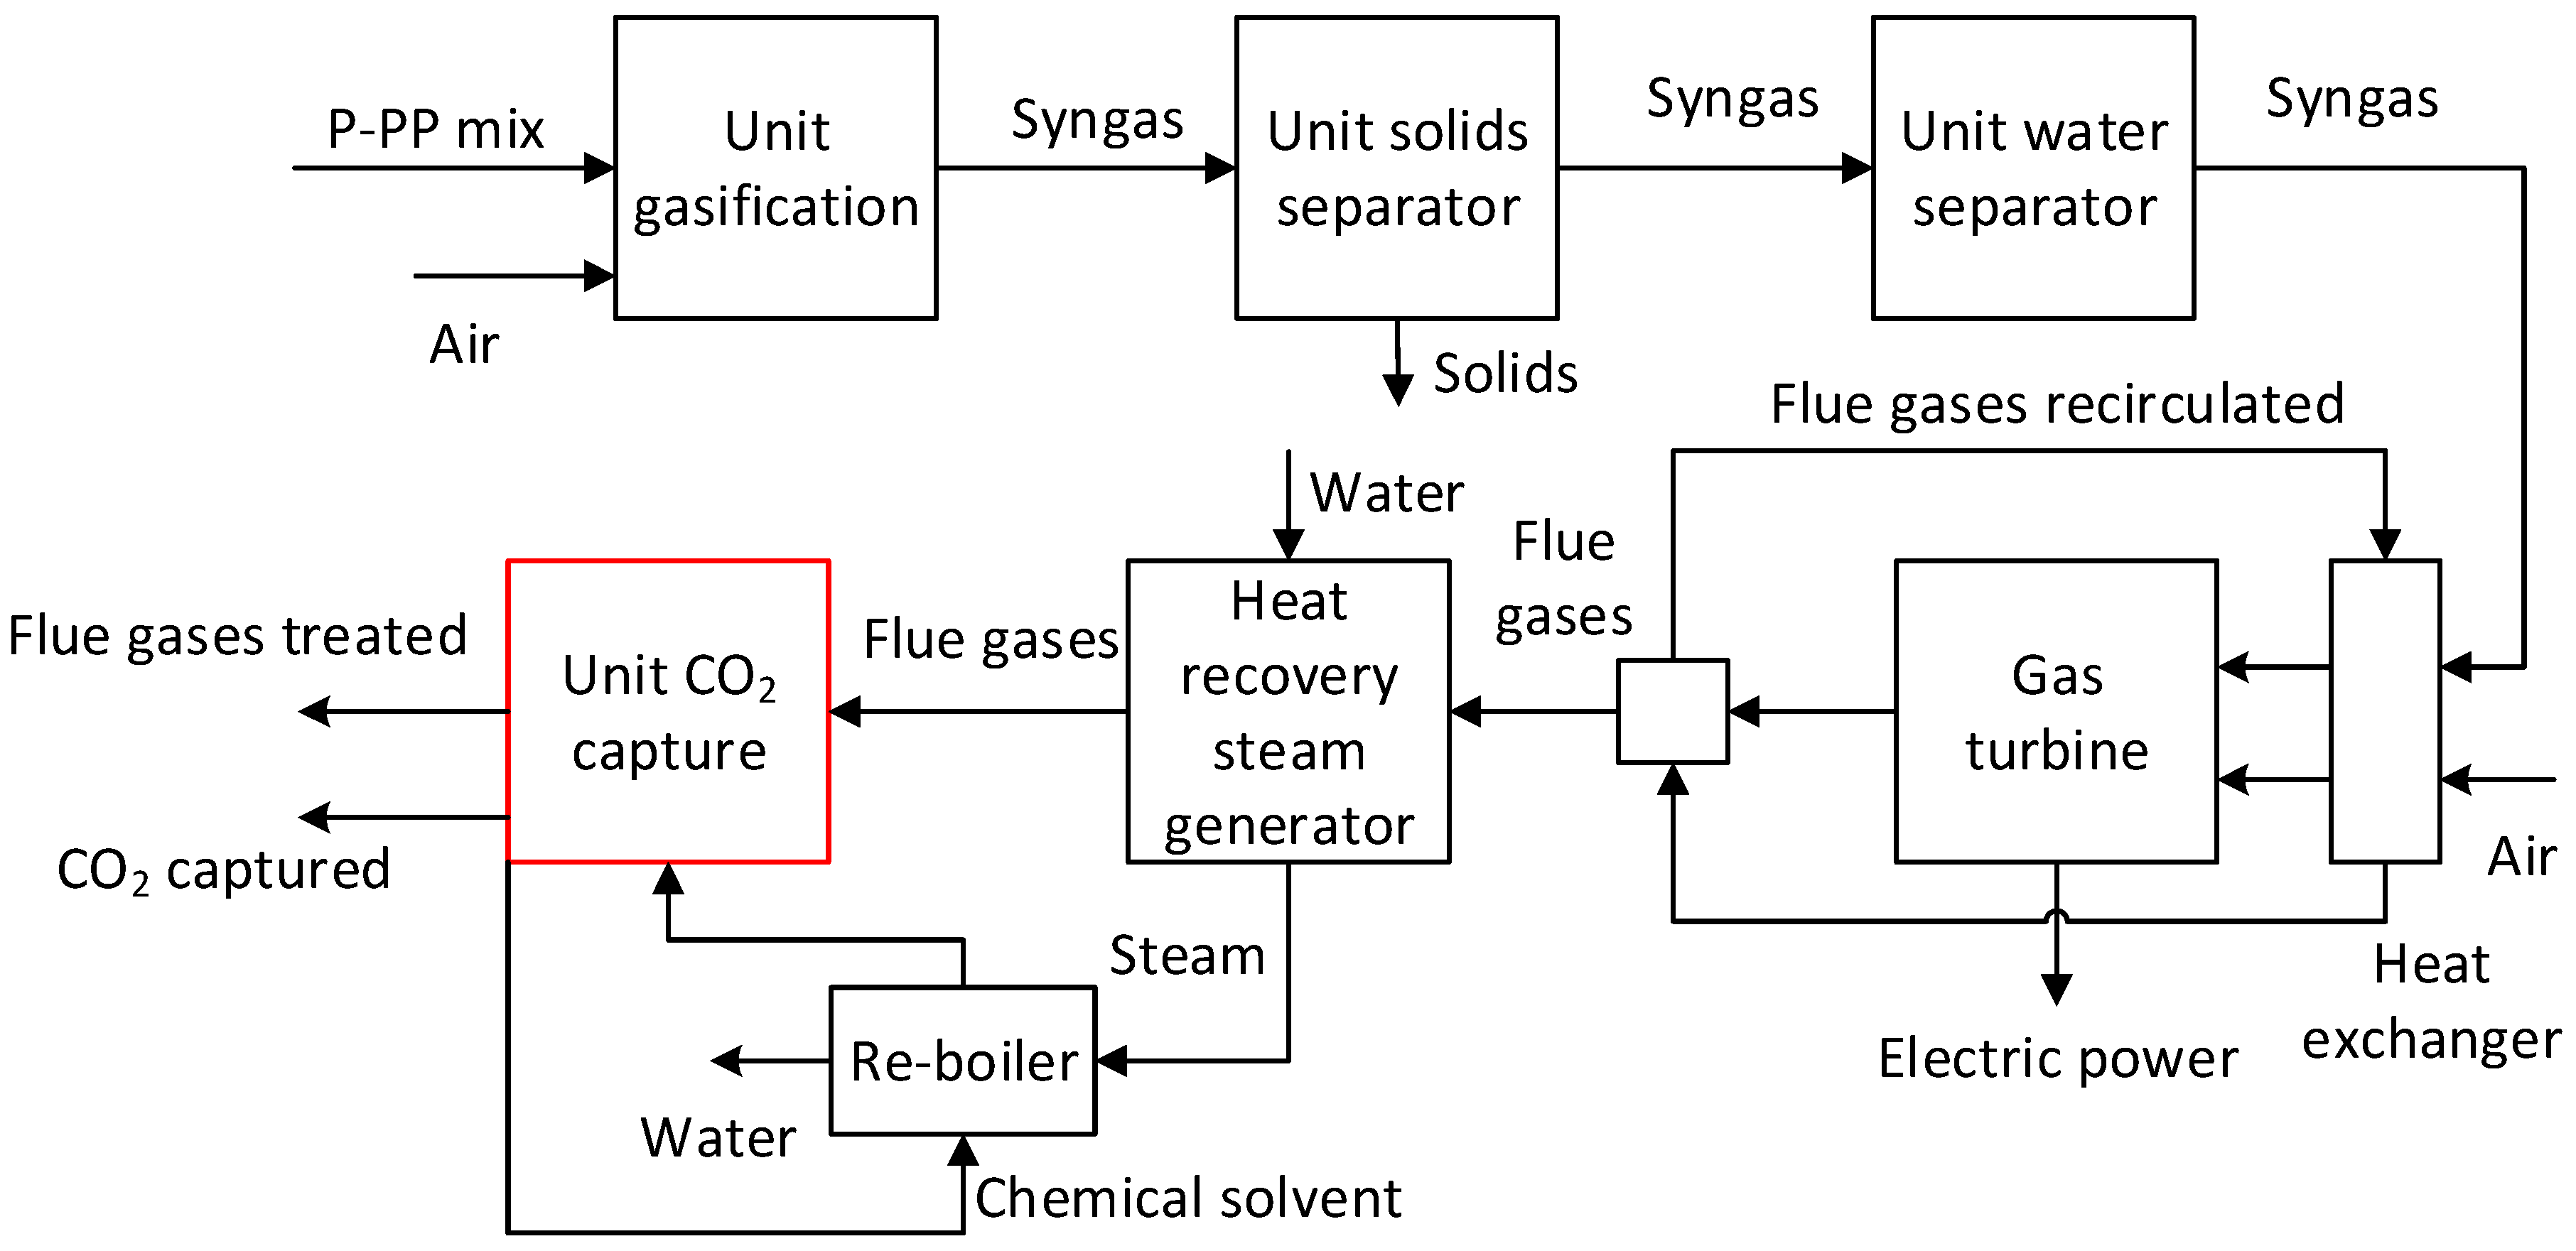
  • Case 3. P–PP mix gasification with post-combustion CO2 capture process.
The difference between pre- and post-combustion integration of CO2 capture technology by chemical absorption is that in pre-combustion integration, CO2 is separated from the syngas before it is used in the power generation process; CO2 is separated from the flue gas after the syngas is used in the power generation process in the case of post-combustion integration.
For all three cases, the a–f cases are considered, in which the poplar and plastic content of the feedstock mix varies: (a) P 95% + PP 5%; (b) 90% + PP 10%; (c) P 85% + PP 15%; (d) P 80% + PP 20%; (e) P 75% + PP 25%; and (f) P 70% + PP 30%.
All described processes were simulated in the ChemCAD software to determine the energy and mass balances and technical effects of CO2 capture process integration.
The composition of the synthetic gas was determined after different stages: after the gasification unit, after the solid separator unit, and after the water separator facility. The illustrative chart of the gasification process is presented in Figure 1, and the essential information on the process simulation is shown in Table 2.
For establishing the optimum ER (Equation (10)), the cold gas efficiency (CGE) was calculated based on Equation (11). B s and B f represent the syngas and the feedstock flow, in kg/h, while L H V s and L H V f represent the LHV, in kJ/kg, for syngas and feedstock.
E R = B r e a l _ a i r B s t o i c h i o m e t r i c _ a i r k g r e a l _ a i r h k g s t o i c h i o m e t r i c _ a i r h
where the B r e a l _ a i r and B s t o i c h i o m e t r i c _ a i r represent the real and the stoichiometric air flow, in kg/h.
C G E = B s × L H V s B f × L H V f × 100 [ % ]

2.2. Syngas Decarbonisation

To improve the quality of the synthetic gas, the CAP was integrated pre- and post-combustion. In the pre-combustion variant, the CAP for removing the CO2 was integrated after the gasification process and the water separation unit. In the post-combustion variant, the CO2 capture process was integrated after the syngas combustion. The results were obtained in the ChemCAD tool using the Peng Robinson model for the calculation of thermodynamic properties and Amines package [29,30]. Figure 2 shows the chemical absorption process that is used for both pre- and post-combustion CO2 separation [31,32]. Ethanolamine (MEA) in a weight concentration of 30% was used as an alkanolamine solution for CO2 removal. The efficiency of CO2 removal was considered 90%, and the lean loading solvent (γlean) was considered 0.21 kmolCO2/kmolMEA in all cases analysed [33,34].
The CO2 capture process is characterised by the L/G ratio, which is the ratio of the flow rate of chemical solvent used to the flow rate of the syngas/flue gas [35,36]. It is also characterised by the amount of specific heat energy required in the chemical solvent regeneration process [37]. Equation (12) was used to calculate the heat duty:
H e a t _ d u t y = P t h e r m a l _ C O 2 c a p t u r e B C O 2 _ c a p t u r e d [ G J / t C O 2 ]
where P t h e r m a l _ C O 2 c a p t u r e represents the heat required in the regeneration process, in MJ/h, and B C O 2 _ c a p t u r e d represents the CO2 flow captured, in kg/h.
In this study, the heat required in the regeneration process was produced by cooling the flue gas at the gas turbine outlet from 540 °C to 120 °C. The available heat flow recovered from flue gas to obtain steam (p = 5 bar and T = 424.25 K) was 9209 MJ/h. However, the net heat flow used directly in the solvent regeneration was lower than the heat flow available, 434–776 MJ/h for pre-combustion and 5318–6102 MJ/h for the post-combustion case. Therefore, the heat available after the solvent regeneration was used to heat the air and the syngas before the combustion chamber.

2.3. Syngas Conversion in Electricity

A type SGT-100 gas turbine, which can be used in simple or combined cycles, with a power of 5 MW, was used to valorise the produced syngas. Its characteristics are shown in Table 3 [38]. The schematic diagrams for the three cases analysed are shown in Figure 3, Figure 4 and Figure 5. The net plant efficiency was determined in 2 variants: (a) including the gas turbine only and considering as input the chemical heat from syngas ( L H V s ), Equation (13); (b) for the whole process including the gasification process, and considering as input the chemical heat of mix feedstock flow ( L H V f ), Equation (14). Equation (15) was used to calculate the CO2 emission factor.
η G T = P G T P c o m p B s × L H V s + Q e x _ c a p t u r e × 100 [ % ]
η G G T = P G T P c o m p B f × L H V f + Q e x _ c a p t u r e × 100 [ % ]
where P G T   represents the gas turbine power, in MW; P c o m p represents the compressor power, in MW; and Q e x _ c a p t u r e represents the required heat recovered from the flue gas, in MW.
f C O 2 = M C O 2 E g [ k g CO 2 / MWh ]
where M C O 2   represents the CO2 amount generated, in kg/year, and E g represents the electricity produced, in MWh/year.

3. Results and Discussion

3.1. Influence of ER on the Gasification Process

The quantity of air injected into the gasifier unit has a significant impact on the reaction products. Thus, the influence of the ER on the syngas content produced, the LHV of the syngas, and the CGE was analysed for all mix cases considered.
In Table 4, the syngas composition is shown for gasification, solid separation, and water separation units for Case 1a.
The H2 and CO concentrations in the syngas increased up to an ER value of 0.35 and showed a decreasing trend after a higher ER. Consequently, the efficiency of the syngas has the best value for this ER after the gasification process, even though the LHV of the syngas decreases as the ER increases (Figure 6).
Considering that the same interpretations of the results were obtained for the syngas composition for the other mix cases analysed (Case 1b–f), the results presented in Table 4 are for Case 1a only.
The LHV ranges from 3900 to 8500 kJ/kg depending on the ER and the feedstock mix used in the gasification process. It is observed that LHV decreases with the introduction of more air into the gasification reactor due to the lower concentration of H2 in the syngas produced, even if the CO concentration is increasing (Figure 7). Increasing the content of plastic in the mix has a positive impact on the LHV value (with a percentage increase between 1 and 5%), and the highest LHV value is obtained at a plastic content in the mix of 30% regardless of the ER.
Figure 8 shows the CGE variation. The best results are obtained at the ER of 0.35. For this ratio, the CGE is between 81.3 and 82%. The CGE value starts to decrease after an ER of 0.35 due to the more drastic reduction in LHV (LHV at an ER of 0.4 is 14% lower than LHV at an ER of 0.35), even though the syngas flow rate is higher. Case 1f showed the best values in terms of CGE, as in the LHV case.
H2/CO is the ratio of the number of moles of hydrogen to the number of moles of carbon monoxide in the syngas, with values of up to 0.73 for Case 1f. In this case, the H2 concentration value is the highest, and the CO concentration value is the lowest. On the other hand, the CO2 concentration decreases as the concentration of plastic increases in the mixture. Considering that the CGE was obtained at an ER of 0.35, the optimal ER is considered in the following analyses. Table 5 shows the results obtained after the gasification process for all the mix cases analysed for the ER of 3.5.

3.2. Energetic Valorisation of Syngas in a Gas Turbine

The syngas was used to produce electricity in a gas turbine with a power of 5 MW for all the mix cases studied (a–f), after the gasification process and syngas treatment (removal of solid particles, water). The flue gas temperature was about 1200 °C at the turbine inlet and about 540 °C at the outlet. The ratio between the flow rate required for combustion and the flow rate of the syngas was between 4.28 and 4.55 kgair/kgsyngas. Thus, to have the same gas turbine power, with increasing plastic content in the mix, the required syngas flow rate is lower due to better LHV and CGE in this case (1f). Therefore, as an example, the net plant efficiency is the highest in Case 1f, 41.06% or 33.7%, with the lowest emission factor of 907.44 kgCO2/MWh (Table 6).
Table 7 and Table 8 show the results obtained for the L/G ratio and the quantity of heat energy needed to regenerate the solvent. The capture efficiency in both cases (Cases 2 and 3) was 90%. The L/G ratio did not exceed 1 kgsolvent/kgsyngas or kgsolvent/kgflue_gases, and the specific heat duty varied between 2.521 and 2.636 GJ/tCO2.
Considering that the CO2 concentration in the synthetic gas decreased as the plastic content increased in the feedstock, the L/G ratio decreased (Figure 9). The specific heat required for solvent regeneration is approximately the same for all cases. Thus, the plastic PP content in the feedstock mix does not influence the heat consumption for solvent regeneration. As can be seen in Figure 10, the LHV has increased from 5269 to 5532 kJ/kg in Case 1 to 5687–5778 kJ/kg in Case 2.
The amount of solvent is significantly lower in the pre-combustion case (Case 2) than in the post-combustion case (Case 3) for the same CO2 capture efficiency (90%) due to a lower amount of CO2 in the stream. The L/G ratio for cases a–f decreases with increasing plastic concentration in the mix for both cases studied (Figure 11). Specific heat duty does not differ significantly, regardless of how the CO2 capture process is integrated. For example, an amount of 2.521 GJ/tCO2 is needed in Case 2a, and an amount of 2.614 is needed in Case 2b, with an increase of 3.69%. Specific heat duty increases with increasing plastic content in the mix (Figure 12).
The water consumption for the CO2 capture process varies between 3442.72 and 6241.96 kgH2O/year in Case 2. The lowest water consumption value corresponds to Case 2f when the plastic content in the mix is 30% due to the lower amount of CO2 captured per year because less feedstock mix is needed to produce the same power. In Case 2, the water consumption is significantly lower than that in Case 3 (42,099.81–47,332.05 kgH2O/year) due to the lower gas stream flow treated in the CO2 capture unit. In both cases, the water footprint is approximately 3 kgH2O/tCO2_captured.
The results obtained for the energy valorisation of syngas in a gas turbine, Cases 2 and 3, are also presented in Table 7 and Table 8. Due to the higher LHV obtained from syngas in Case 2, after the gasification process and the capture process, the amount of syngas needed to have a power of 5 MW is lower than that in Case 1, by 3.85–7.28% depending on the plastic content in the mix.
After the integration of the CO2 capture process, the net plant efficiency decreases due to the use of part of the energy produced in the regeneration process of the chemical solvent. In Case 2, the net plant efficiency penalty ( η G G T ) is between 1.13 and 2.05%, and in Case 3, the η G G T is between 16.42 and 18.22%. The significant difference in the cycle efficiency penalty between the two cases analysed (Cases 2 and 3) is due to the amount of CO2 that is removed from the treated gas stream; in Case 3, this amount is much higher. Figure 13 shows the comparative net plant efficiency ( η G T   and η G G T ) for the three cases studied in cases a–f.
Figure 14 shows the CO2 emission factor for the three cases in cases a–f. For Case 2, a CO2 emission factor varying between 837.13 and 889.28 kgCO2/MWh was obtained, with values 7.74–12.51% lower than those in Case 1 because the syngas CO2 content is negligible as compared with the post-combustion case. As for the CO2 emission factor in Case 3, it decreases by about 90% compared to Case 1 due to the high amount of CO2 content captured from the flue gas. In Case 3, the main disadvantage is the quantity of heat energy necessary in the solvent regeneration process, which is much higher than that in Case 2 due to the more considerable CO2 gas stream flow treated.

3.3. Negative CO2 Emissions

Biomass, a renewable energy source, is considered CO2-neutral due to the CO2 absorption in the growth process (photosynthesis process). Therefore, the CO2 emissions generated during gasification and combustion processes according to poplar utilisation are not considered in the CO2 emission factor determination. Thus, the CO2 emission factors for all three cases studied were recalculated, taking into account only the CO2 emissions generated from plastic use. The recalculated CO2 emission factor was determined using Equation (16), and the results are shown in Figure 15.
f C O 2 _ r e c = f C O 2 p l a s t i c f C O 2 c a p t u r e [ k g C O 2 M W h ]
where f C O 2 p l a s t i c represents the CO2 emission factor for plastic, in kgCO2/MWh, and f C O 2 c a p t u r e represents the CO2 emission factor for poplar, in kgCO2/MWh.
As compared to the initial assessment when all CO2 emissions were taken into consideration, in Case 1, without CO2 capture technology, the CO2 emission factor was lower, 89.47% for a 95% poplar content in the mix and 51.08% for a 70% poplar content in the mix. Further, with a decrease in the poplar content in the mix, the CO2 emissions increased because more plastic was used. In Case 2, a negative CO2 emission of −6 kgCO2/MWh was obtained only when 95% poplar was used in the mix. In Case 3, when post-combustion CAP was integrated, for a poplar content in the mix between 75 and 95%, the CO2 emission factor was negative and varied between −84.94 and −716.16 kgCO2/MWh. However, for 70% poplar content in the mix, the CO2 emissions slightly increased, being positive.

4. Conclusions

The optimal ER considered was 0.35 for all cases studied. The proportion of PP in the feedstock mix varied between 5 and 30 wt.%. Considering that the CO2 content ranged between 2.8 and 11.5% in syngas, the CAP integration’s influence on the gas turbine energy system was studied. Monoethanolamine was used in a mass concentration of 30%, and the CO2 capture efficiency considered was 90%. As expected, an increase in the LHV of the mixture was observed after the pre-combustion CO2 capture process integration, as the proportion of plastic increased. The LHV varies between 5269 and 5532 kJ/kg (without CO2 capture process) and between 5687 and 5778 kJ/kg (with pre-combustion CO2 capture process). Also, an increase in the H2/CO ratio from 0.63 to 0.73 was observed with an increase in the plastic mass content in the mixture. The net plant efficiency was around 41%, with a CO2 emission factor between 907.44 and 1016.55 kgCO2/MWh without the CO2 capture process according to the PP content in the mix feed. With the integration of the pre-combustion capture process, the net plant efficiency ( η G G T ) decreases by 1.13–2.05%, and the CO2 emission factor decreases by 7.74–12.51%. When post-combustion capture is integrated, net plant efficiency ( η G G T ) decreases by 16.42–18.22%, and the CO2 emission factor decreases by about 90%.

Author Contributions

Conceptualisation, N.S. and C.D.; methodology, N.S. and C.D.; software, N.S. and C.D.; validation, N.S. and C.D.; formal analysis, N.S. and C.D.; investigation, N.S. and C.D.; resources, N.S. and C.D.; data curation, N.S. and C.D.; writing—original draft preparation, N.S. and C.D.; writing—review and editing, N.S. and C.D.; visualisation, N.S. and C.D.; supervision, N.S. and C.D.; project administration, N.S. and C.D.; funding acquisition, N.S. and C.D. All authors have read and agreed to the published version of the manuscript.

Funding

This work was supported by EU Horizon 2020 (InNoPlastic), GA No. 10100061, and by the UEFISCDI within the National Project number 106PTE/2022. Additionally, the results presented in this article have been funded by the Ministry of Investments and European Projects through the Human Capital Sectoral Operational Program 2014–2020, Contract No. 62461/03.06.2022, SMIS code 153735.

Data Availability Statement

Not applicable.

Acknowledgments

N.S. acknowledges the Academy of Romanian Scientists.

Conflicts of Interest

The authors declare no conflict of interest.

References

  1. Antal, M.J.; Grønli, M. The art, science, and technology of charcoal production. Ind. Eng. Chem. Res. 2003, 42, 1619–1640. [Google Scholar] [CrossRef]
  2. Varhegyi, G.; Antal, M.J., Jr.; Szekely, T.; Szabo, P. Kinetics of the thermal decomposition of cellulose, hemicellulose, and sugarcane bagasse. Energy Fuels 1989, 3, 329–335. [Google Scholar] [CrossRef]
  3. Vasile, C.; Brebu, M.A. Thermal valorisation of biomass and of synthetic polymer waste. Upgrading of pyrolysis oils. Cellul. Chem. Technol. 2006, 40, 489–512. [Google Scholar]
  4. Abnisa, F.; Daud, W.M.A.W. A review on co-pyrolysis of biomass: An optional technique to obtain a high-grade pyrolysis oil. Energy Convers. Manag. 2014, 87, 71–85. [Google Scholar] [CrossRef]
  5. Couhert, C.; Commandre, J.M.; Salvador, S. Is it possible to predict gas yields of any biomass after rapid pyrolysis at high temperature from its composition in cellulose, hemicellulose and lignin? Fuel 2009, 88, 408–417. [Google Scholar] [CrossRef]
  6. Brown, R.C. The Role of Pyrolysis and Gasification in a Carbon Negative Economy. Processes 2021, 9, 882. [Google Scholar] [CrossRef]
  7. Kumar, R. A review on the modelling of hydrothermal liquefaction of biomass and waste feedstocks. Energy Nexus 2022, 5, 100042. [Google Scholar] [CrossRef]
  8. Jalili, M.; Ghasempour, R.; Ahmadi, M.H.; Chitsaz, A.; Holagh, S.G. An integrated CCHP system based on biomass and natural gas co-firing: Exergetic and thermo-economic assessments in the framework of energy nexus. Energy Nexus 2022, 5, 100016. [Google Scholar] [CrossRef]
  9. Glushkov, D.; Nyashina, G.; Shvets, A.; Pereira, A.; Ramanathan, A. Current Status of the Pyrolysis and Gasification Mechanism of Biomass. Energies 2021, 14, 7541. [Google Scholar] [CrossRef]
  10. Ciuffi, B.; Chiaramonti, D.; Rizzo, A.M.; Frediani, M.; Rosi, L. A critical review of SCWG in the context of available gasification technologies for plastic waste. Appl. Sci. 2020, 10, 6307. [Google Scholar] [CrossRef]
  11. Maitlo, G.; Ali, I.; Mangi, K.H.; Ali, S.; Maitlo, H.A.; Unar, I.N.; Pirzada, A.M. Thermochemical Conversion of Biomass for Syngas Production: Current Status and Future Trends. Sustainability 2022, 14, 2596. [Google Scholar] [CrossRef]
  12. Segneri, V.; Ferrasse, J.H.; Trinca, A.; Vilardi, G. An Overview of Waste Gasification and Syngas Upgrading Processes. Energies 2022, 15, 6391. [Google Scholar] [CrossRef]
  13. Sarafraz, M.M.; Safaei, M.R.; Jafarian, M.; Goodarzi, M.; Arjomandi, M. High Quality Syngas Production with Supercritical Biomass Gasification Integrated with a Water–Gas Shift Reactor. Energies 2019, 12, 2591. [Google Scholar] [CrossRef]
  14. Al-Zareer, M.; Dincer, I.; Rosen, M.A. Influence of Selected Gasification Parameters on Syngas Composition from Biomass Gasification. ASME. J. Energy Resour. Technol. 2018, 140, 041803. [Google Scholar] [CrossRef]
  15. Gallucci, F.; Liberatore, R.; Sapegno, L.; Volponi, E.; Venturini, P.; Rispoli, F.; Paris, E.; Carnevale, M.; Colantoni, A. Influence of Oxidant Agent on Syngas Composition: Gasification of Hazelnut Shells through an Updraft Reactor. Energies 2020, 13, 102. [Google Scholar] [CrossRef]
  16. Block, C.; Ephraim, A.; Weiss-Hortala, E.; Minh, D.P.; Nzihou, A.; Vandecasteele, C. Co-pyrogasification of plastics and biomass, a review. Waste Biomass Valor. 2019, 10, 483–509. [Google Scholar] [CrossRef]
  17. Shah, H.H.; Amin, M.; Iqbal, A.; Nadeem, I.; Kalin, M.; Soomar, A.M.; Galal, A.M. A review on gasification and pyrolysis of waste plastics. Front. Chem. 2023, 10, 960894. [Google Scholar] [CrossRef]
  18. Salaudeen, S.A.; Arku, P.; Dutta, A. Gasification of Plastic Solid Waste and Competitive Technologies. In Plastics to Energy; William Andrew Publishing: Norwich, NY, USA, 2019; pp. 269–293. [Google Scholar] [CrossRef]
  19. Cho, M.H.; Mun, T.Y.; Kim, J.S. Air gasification of mixed plastic wastes using calcined dolomite and activated carbon in a two-stage gasifier to reduce tar. Energy 2013, 53, 299–305. [Google Scholar] [CrossRef]
  20. Mishra, S.; Upadhyay, R.K. Review on biomass gasification: Gasifiers, gasifying mediums, and operational parameters. Mater. Sci. Energy Technol. 2021, 4, 329–340. [Google Scholar] [CrossRef]
  21. Zhang, Y.; Wan, L.; Guan, J.; Xiong, Q.A.; Zhang, S.; Jin, X. A review on biomass gasification: Effect of main parameters on char generation and reaction. Energy Fuels 2020, 34, 13438–13455. [Google Scholar] [CrossRef]
  22. Peres, C.B.; Resende, P.M.R.; Nunes, L.J.R.; Morais, L.C.D. Advances in Carbon Capture and Use (CCU) Technologies: A Comprehensive Review and CO2 Mitigation Potential Analysis. Clean Technol. 2022, 4, 1193–1207. [Google Scholar] [CrossRef]
  23. Ji, C.; Yuan, S.; Huffman, M.; El-Halwagi, M.M.; Wang, Q. Post-combustion carbon capture for tank to propeller via process modeling and simulation. J. CO2 Util. 2021, 51, 101655. [Google Scholar] [CrossRef]
  24. Vaz Jr, S.; de Souza, A.P.R.; Baeta, B.E.L. Technologies for carbon dioxide capture: A review applied to energy sectors. Clean. Eng. Technol. 2022, 8, 100456. [Google Scholar] [CrossRef]
  25. Ooi, Z.L.; Tan, P.Y.; Tan, L.S.; Yeap, S.P. Amine-based solvent for CO2 absorption and its impact on carbon steel corrosion: A perspective review. Chin. J. Chem. Eng. 2020, 28, 1357–1367. [Google Scholar] [CrossRef]
  26. Khonde, R.; Hedaoo, S.; Deshmukh, S. Prediction of product gas composition from biomass gasification by the method of Gibbs free energy minimization. Energy Sources Part A Recovery Util. Environ. Eff. 2021, 43, 371–380. [Google Scholar] [CrossRef]
  27. Sannigrahi, P.; Ragauskas, A.J.; Tuskan, G.A. Poplar as a feedstock for biofuels: A review of compositional characteristics. Biofuels Bioprod Bioref. 2010, 4, 209–226. [Google Scholar] [CrossRef]
  28. Yao, D.; Yang, H.; Chen, H.; Williams, P.T. Co-precipitation, impregnation and so-gel preparation of Ni catalysts for pyrolysis-catalytic steam reforming of waste plastics. Appl. Catal. B 2018, 239, 565–577. [Google Scholar] [CrossRef]
  29. Esmaeili, A.; Liu, Z.; Xiang, Y.; Yun, J.; Shao, L. Assessment of carbon dioxide separation by amine solutions using electrolyte non-random two-liquid and Peng-Robinson models: Carbon dioxide absorption efficiency. J. Constr. Mater. 2021, 2, 3–10. [Google Scholar] [CrossRef]
  30. Ababneh, H.; AlNouss, A.; Al-Muhtaseb, S.A. Carbon Capture from Post-Combustion Flue Gas Using a State-Of-The-Art, Anti-Sublimation, Solid–Vapor Separation Unit. Processes 2022, 10, 2406. [Google Scholar] [CrossRef]
  31. Khan, U.; Ogbaga, C.C.; Abiodun, O.A.O.; Adeleke, A.A.; Ikubanni, P.P.; Okoye, P.U.; Okolie, J.A. Assessing Absorption-Based CO2 Capture: Research Progress and Techno-Economic Assessment Overview. Carbon Capture Sci. Technol. 2023, 8, 100125. [Google Scholar] [CrossRef]
  32. Sifat, N.S.; Haseli, Y. A Critical Review of CO2 Capture Technologies and Prospects for Clean Power Generation. Energies 2019, 12, 4143. [Google Scholar] [CrossRef]
  33. Slavu, N.; Badea, A.; Dinca, C. Technical and Economical Assessment of CO2 Capture-Based Ammonia Aqueous. Processes 2022, 10, 859. [Google Scholar] [CrossRef]
  34. Dubey, A.; Arora, A. Advancements in carbon capture technologies: A review. J. Clean. Prod. 2022, 373, 133932. [Google Scholar] [CrossRef]
  35. Pascu, A.; Stoica, L.; Dinca, C.; Badea, A. The Package Type Influence on the Performance of the CO2 Capture Process by Chemical Absorption. UPB Sci. Bull. Ser. C 2016, 78, 259–270. Available online: https://www.scientificbulletin.upb.ro/rev_docs_arhiva/full409_910116.pdf (accessed on 6 June 2023).
  36. Peu, S.D.; Das, A.; Hossain, M.S.; Akanda, M.A.M.; Akanda, M.M.H.; Rahman, M.; Miah, M.N.; Das, B.K.; Islam, A.R.M.T.; Salah, M.M. A Comprehensive Review on Recent Advancements in Absorption-Based Post Combustion Carbon Capture Technologies to Obtain a Sustainable Energy Sector with Clean Environment. Sustainability 2023, 15, 5827. [Google Scholar] [CrossRef]
  37. Rajiman, V.; Hairul, N.A.H.; Shariff, A.M. Effect of CO2 Concentration and Liquid to Gas Ratio on CO2 Absorption from Simulated Biogas Using Monoethanolamine Solution. IOP Conf. Ser. Mater. Sci. Eng. 2020, 991, 012133. [Google Scholar] [CrossRef]
  38. SGT-100|Industrial Gas Turbine|Gas Turbines|Manufacturer|Siemens Energy Global. Available online: https://www.siemens-energy.com/global/en/offerings/power-generation/gas-turbines/sgt-100.html (accessed on 12 July 2023).
Figure 1. Diagram of the gasification process.
Processes 11 02922 g001
Figure 2. CO2 capture process.
Processes 11 02922 g002
Figure 3. Diagram of the syngas conversion in electricity without CO2 capture process (Case 1).
Processes 11 02922 g003
Figure 4. Diagram of the syngas conversion in electricity with pre-combustion CO2 capture process (Case 2).
Processes 11 02922 g004
Figure 5. Diagram of the syngas conversion in electricity with post-combustion CO2 capture process (Case 3).
Processes 11 02922 g005
Figure 6. LHV and CGE variation according to ER for Case 1a.
Processes 11 02922 g006
Figure 7. LHV variation according to ER.
Processes 11 02922 g007
Figure 8. CGE variation according to ER.
Processes 11 02922 g008
Figure 9. L/G ratio variation according to PP content in the mix for Case 2.
Processes 11 02922 g009
Figure 10. LHV according to PP content in the mix for Cases 1 and 2.
Processes 11 02922 g010
Figure 11. Variation in the L/G ratio according to PP content in the mix for Cases 2 and 3.
Processes 11 02922 g011
Figure 12. Variation in the heat duty according to PP content in the mix for Cases 2 and 3.
Processes 11 02922 g012
Figure 13. Net plant efficiency depending on the mix used ( η G T (a))/( η G G T —(b)).
Processes 11 02922 g013
Figure 14. CO2 emission factor depending on the mix used.
Processes 11 02922 g014
Figure 15. CO2 emission factor depending on the mix used (poplar CO2 neutral).
Processes 11 02922 g015
Table 1. Main data for feedstock composition db *.
CompositionBiomassPlasticMix of Poplar with Plastic (Polypropylene) P–PP, wt.%
P **PP ***95–5
a
90–10
b
85–15
c
80–20
d
75–25
e
70–30
f
C—Carbon, wt.%50.0283.7451.7153.3955.0856.7658.4560.14
H—Hydrogen, wt.%6.2813.716.657.027.397.778.148.51
O—Oxygen, wt.%42.170.9840.1138.0535.9933.9331.8729.81
N—Nitrogen, wt.%0.190.020.180.170.160.160.150.14
S—Sulphur, wt.%0.020.080.020.030.030.030.040.04
A—Ash, wt.%1.321.471.331.341.351.351.351.36
LHV, MJ/kg18.9542.3420.1221.2922.4623.6324.8025.97
* db—dry basis; ** P—poplar; *** PP—polypropylene.
Table 2. Main data for gasification process simulation.
Process TypeAdiabatic
Oxidising agentAir
P–PP flow mix, kg/h1
Temperature, °C600–1200
Pressure, bar1.013
ER, -0.1; 0.15; 0.2; 0.25; 0.3; 0.35; 0.4; 0.45
Table 3. Main characteristics of gas turbine.
TypeSGT-100
Power, MW5
Speed, rpm17,384
Pressure ratio, -14
Flue gas temperature at the gas turbine inlet, °C~544
Flue gas flow, kg/sup to 19.5
Table 4. Syngas composition after gasification, solid separation, and water separation units for Case 1a.
ER0.10.150.20.250.30.350.40.45
Syngas composition after gasification unit, mol fraction
H20.16770.17610.17810.17720.17460.16720.12940.0942
CH40.02060.01350.00960.00720.00550.00210.00000.0000
N20.19870.26810.32620.37570.41830.45340.48470.5141
CO0.08510.13190.17470.21270.24630.26700.25260.2357
CO20.06570.06270.05780.05210.04640.04070.03730.0377
H2O0.15440.12410.10140.08390.06990.06600.09270.1153
H2S0.00010.00010.00010.00010.00010.00010.00000.0000
Char0.30260.21880.14780.08730.03530.00000.00000.0000
SiO20.00520.00470.00430.00390.00370.00340.00320.0030
Syngas composition after solid separator unit, mol fraction
H20.24230.22670.21010.19500.18170.16780.12980.0945
CH40.02970.01740.01130.00790.00570.00210.00000.0000
N20.28700.34530.38480.41340.43520.45500.48630.5157
CO0.12300.16990.20600.23410.25630.26790.25340.2364
CO20.09490.08080.06810.05730.04830.04090.03740.0378
H2O0.22300.15980.11960.09230.07280.06620.09300.1156
H2S0.00010.00010.00010.00010.00010.00010.00000.0000
Syngas composition after solid separator unit, mol fraction
H20.31190.26990.23860.21480.19590.17970.14310.1068
CH40.03820.02070.01290.00870.00620.00230.00000.0000
N20.36940.41090.43700.45540.46940.48720.53620.5831
CO0.15830.20220.23400.25790.27640.28690.27940.2673
CO20.12210.09620.07740.06320.05210.04380.04130.0427
H2S0.00010.00010.00010.00010.00010.00010.00010.0001
Table 5. Results of gasification process for ER = 0.35—Case 1.
Case1a1b1c1d1e1f
ER, -0.350.350.350.350.350.35
Gas temperature, °C404040404040
Syngas flow 3.103.253.403.553.703.85
LHV, kJ/kg526953335391544354905532
H2/CO, -0.630.650.670.690.710.73
CGE, %81.3081.4781.6381.7781.8981.98
Syngas composition, mole %
H217.9718.4218.8319.2119.5519.87
CH40.230.250.280.300.320.34
N248.7249.0349.2949.5349.7449.94
CO28.6928.4128.1427.8827.6327.38
CO24.383.883.453.082.752.46
H2S0.010.010.010.010.010.01
Table 6. Results of syngas use in a gas turbine—Case 1.
Case1a1b1c1d1e1f
Gas turbine power, MW555555
Syngas flow, kg/h4226.194166.874122.224079.094046.164011.36
Air flow, kg/h18,105.7318,166.4418,181.2918,213.9518,214.2018,243.19
Combustion chamber temperature, °C1202.881201.251201.681201.061201.891201.19
Flue gas temperature at the gas turbine outlet, °C543.71542.15541.99541.20541.38540.62
Flue gas flow, kg/h22,331.9422,333.3222,303.5222,293.0522,260.3822,254.56
ηGT, %41.0141.0441.0441.0541.0541.06
ηGGT, %33.3433.4433.5133.5733.6133.66
CO2 emission factor, kgCO2/MWh1016.55989.18965.43943.92924.98907.44
Flue gas composition, wt.%
H20.020.020.020.020.020.02
O213.0313.1013.1213.1613.1713.21
N272.9573.1673.3373.4973.6273.75
CO211.5511.2210.9710.7210.5210.32
H2O2.452.502.562.612.662.70
Table 7. Results of syngas use in a gas turbine—Case 2.
Case2a2b2c2d2e2f
Gas turbine power, MW555555
Syngas flow, kg/h3918.413906.343889.383880.253868.403856.88
Air flow, kg/h18,374.0518,359.4618,371.1918,357.3018,357.2618,363.23
Combustion chamber temperature, °C1201.211201.801201.121201.611201.501201.02
Flue gas temperature at the gas turbine outlet, °C539.97540.18539.57539.75539.54539.11
Flue gas flow, kg/h22,292.4722,265.8122,260.5822,237.5722,225.0822,220.13
L/G, kgsolvent/kgsyngas0.640.570.510.460.420.38
Heat duty, GJ/tCO22.5212.5282.5362.5432.5512.559
Heat flow used for solvent regeneration, MJ/h776683610542485434
Water consumption for CO2 capture, kg/year6241.965480.064882.464327.743863.263442.72
ηGT, %39.8940.0340.1640.2640.3540.44
ηGGT, %32.732.832.9633.0833.1933.28
Efficiency penalty, %2.051.871.631.471.281.13
CO2 emission factor, kgCO2/MWh889.28878.06866.01856.04845.93837.13
Flue gas composition, wt.%
H20.020.020.020.020.020.02
O213.3213.32133.313.3213.3213.33
N274.0074.0774.1474.2074.2774.32
CO210.1910.079.939.839.729.61
H2O2.462.522.572.632.672.72
Table 8. Results of syngas use in a gas turbine—Case 3.
Case3a3b3c3d3e3f
Gas turbine power, MW555555
Syngas flow, kg/h4226.194166.874122.224079.094046.164011.36
Air flow, kg/h18,105.7318,166.4418,181.2918,213.9518,214.2018,243.19
Combustion chamber temperature, °C1202.881201.251201.681201.061201.891201.19
Flue gas temperature at the gas turbine outlet, °C543.71542.15541.99541.20541.38540.62
Flue gas flow, kg/h21,849.0921,863.2421,840.6621,837.3521,811.3221,812.57
L/G, kgsolvent/kgflue_gases0.930.910.890.870.860.84
Heat duty, GJ/tCO22.6142.6192.6242.6282.6322.636
Heat flow used for solvent regeneration, MJ/h610259305807569255805317
Water consumption for CO2 capture, kg/year47,332.0545,925.1344,893.4243,926.5642,998.8942,099.81
ηGT, %32.1932.4032.5432.6832.8133.13
ηGGT, %27.2727.4727.6227.7527.8828.14
Efficiency penalty, %18.2217.8617.5817.3317.0616.42
CO2 emission factor, kgCO2/MWh96.6395.4191.7388.4987.8887.33
Flue gas composition, wt.%
H20.020.020.020.020.020.02
O213.3213.3813.4013.4413.4413.47
N274.5674.7374.8875.0275.1475.24
CO21.121.111.061.031.021.01
H2O10.9310.7210.5810.4510.3310.20
Disclaimer/Publisher’s Note: The statements, opinions and data contained in all publications are solely those of the individual author(s) and contributor(s) and not of MDPI and/or the editor(s). MDPI and/or the editor(s) disclaim responsibility for any injury to people or property resulting from any ideas, methods, instructions or products referred to in the content.

