Article

Proppant Migration Law Considering Complex Fractures

1
School of Petroleum Engineering, Northeast Petroleum University, Daqing 163318, China
2
Petroleum Engineering Research Institute, Petrochina Dagang Oilfield Company, Tianjin 300280, China
3
College of Environment, Liaoning University, Shenyang 110036, China
*
Author to whom correspondence should be addressed.
Processes 2023, 11(10), 2921; https://doi.org/10.3390/pr11102921
Submission received: 1 September 2023 / Revised: 29 September 2023 / Accepted: 3 October 2023 / Published: 7 October 2023

Abstract

:
The placement of proppant within fractures is critical to the effectiveness of hydraulic fracturing. To elucidate the migration and placement patterns of proppant within multi-branched fractures during hydraulic fracturing, we conducted simulation experiments under both single-fracture and multi-branched-fracture conditions, varying injection rates and proppant sizes. The results of the research indicate that increasing the injection rate effectively increases the magnitude of vortex formation at the leading edge of sandbars and the drag forces acting on the proppant particles, resulting in increased particle migration distances. However, effective proppant packing near the wellbore entrance is not achieved at higher injection rates, leaving the fractures susceptible to closure under in situ stress, thereby reducing overall fracture conductivity. In addition, increasing the proppant size results in higher settling velocities and weakens the vortex’s ability to entrain the proppant particles. This results in shorter proppant placement distances, and the proppant cannot effectively reach the distant branched fractures. In addition, the diversionary effect of the branched fractures gradually reduces the flow rate in the distant branches, resulting in poorer proppant placement efficiency. Based on these findings, we recommend an approach that initially increases injection rates while reducing proppant size to ensure proppant placement in distant wellbore fractures and branched fracture networks. Subsequently, larger proppants can be used to effectively fill fractures close to the wellbore.

1. Introduction

Oil and gas resources are primary global energy sources for which demand and extraction volumes are increasing [1,2,3,4,5,6]. As the depth at which oil and gas are extracted has increased, deep-seated hydrocarbon reservoirs have exhibited characteristics such as tightness and low permeability, severely limiting enhancements in oil and gas production [7,8,9,10,11]. To address this challenge, volumetric fracturing technology has emerged as an effective method to increase oil and gas production and facilitate the efficient development of low-permeability hydrocarbon reservoirs [12,13,14]. Through volumetric fracturing, efficient extraction from low-permeability oil and gas formations is achieved by fracturing the reservoir, enhancing the fracture complexity, and increasing both the seepage area and the flow conducting capacity [15,16,17,18,19]. However, increases in in situ stresses can induce the closure of intricate fracture networks formed through volumetric fracturing, leading to reduced oil and gas production [20,21,22,23,24]. To overcome these limitations, proppants have been applied to prevent the closure of reservoir fractures to maintain their conductivity [25,26,27,28,29].
Proppant particles are deposited in fractures to form sandbanks, which provide high-conductivity flow channels for reservoir fluids (including oil, gas, and water) [30,31]. The placement of the formed sandbanks determines the shape, volume, conductivity, and life of the fractures [32,33,34]. Therefore, a clear understanding of the migration rules and sandbank placement effects of proppant in fractures is crucial for improving the enhancement effect of fracturing. Kern et al. [30] pioneered the use of a vertical slot designed with two parallel organic glass plates to study the migration of particles in low-viscosity fluids. The results showed that particles in low-concentration liquids quickly settled and formed sandbanks. Similarly, Wen [35] evaluated the settling and migration rules of proppant in fractures using a self-developed fracture simulation device. The results showed that an increase in the fracture flow velocity and the fracturing fluid viscosity reduced the settling speed and increased the horizontal migration speed of the proppant. Additionally, increasing the ratio of the proppant particle size to the fracture width and sand ratio reduced both the settling speed and the horizontal migration speed of the proppants, thereby affecting the proppant transport range and placement range. Zhao [36] investigated the effects of fluid viscosity, injection speed, fluid filtration, injected proppant concentration, and particle size on proppant distribution in fractures using numerical simulations. The results showed that the transport distance of proppants increased with increasing injection speed, fluid viscosity, and injected proppant concentration and decreased with increasing particle size. Zhang [37] employed a CFD-DEM coupling model to systematically investigate the migration and placement patterns of multi-sized proppants in vertical and horizontal well fractures. The results indicate that a proppant sandbank first forms near the wellbore in a fracture, and the large proppant particles are more likely to accumulate near the wellbore while the small particles are transported deeper into the fracture. Xu [38] conducted an analysis of the placement patterns of different-sized proppants within complex fractures under varying fracturing fluid flow rates and viscosities. The results revealed a 10.7% reduction in the proppant transport distance within complex fractures. It is important to note that most of the studies were based on single-fracture structures and did not account for the complexity of fractures. In cases involving complex fractures, the majority of research relies on DEM simulations. However, in the context of complex fractures, the predominant approach in studies is to employ the Discrete Element Method (DEM) for numerical simulations. Nonetheless, given the substantial computational demands associated with the Discrete Element Method, the resulting numerical models frequently feature relatively small dimensions, potentially limiting their ability to accurately depict proppant migration patterns.
To overcome these limitations, we analyzed the migration rules of proppants using a self-developed visualized fracture system and compared the effects of proppant particle size and injection displacement to the migration rules and placement effects of proppants under single- and multi-branch-fracture conditions. The experimental results provide support for optimizing the volumetric fracturing parameters.

2. Experiment

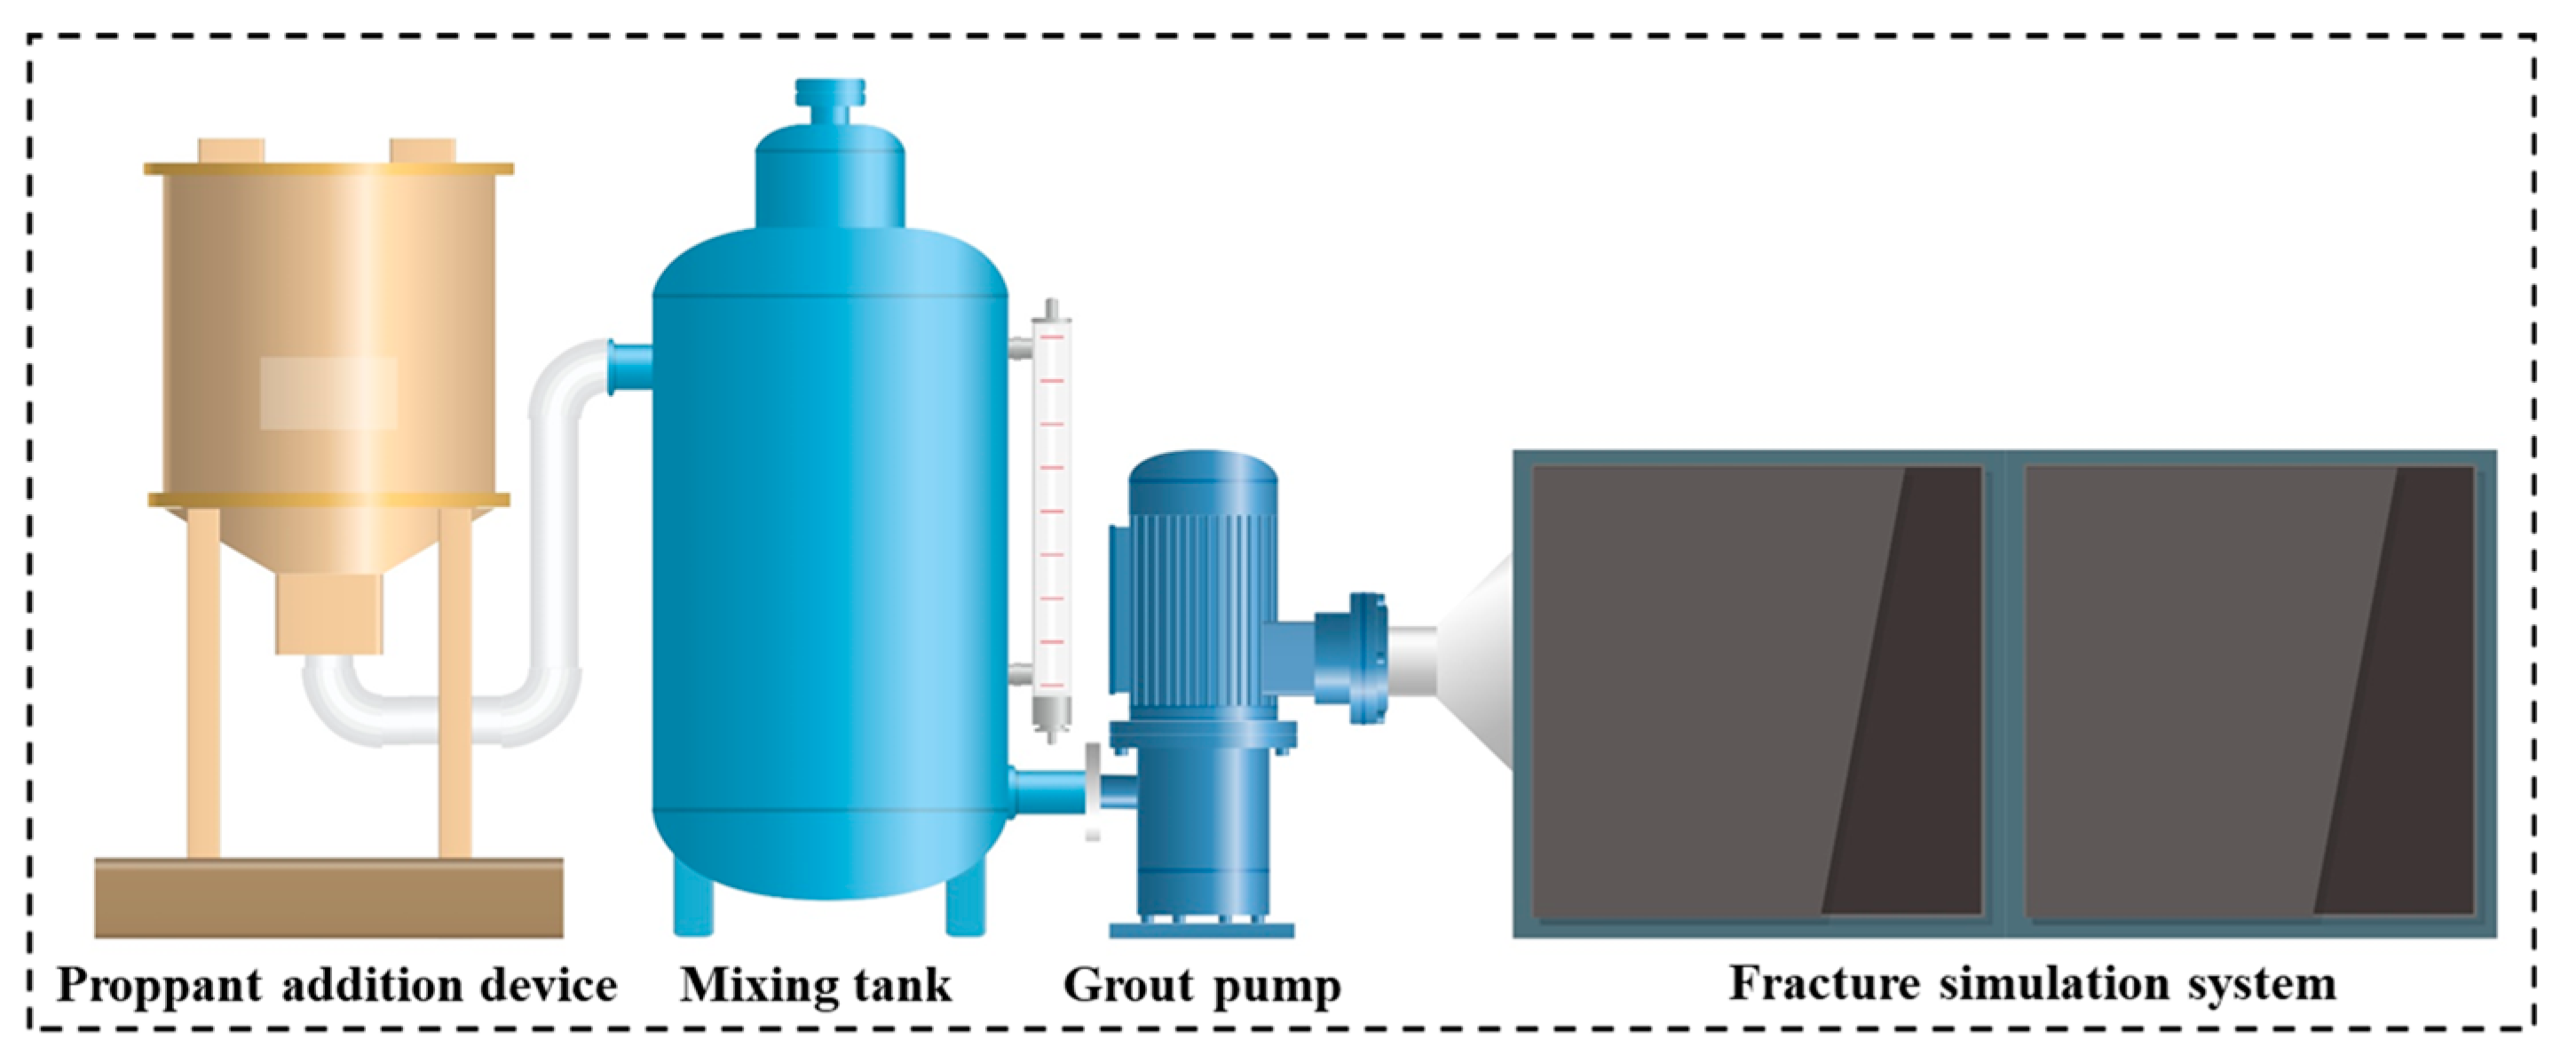
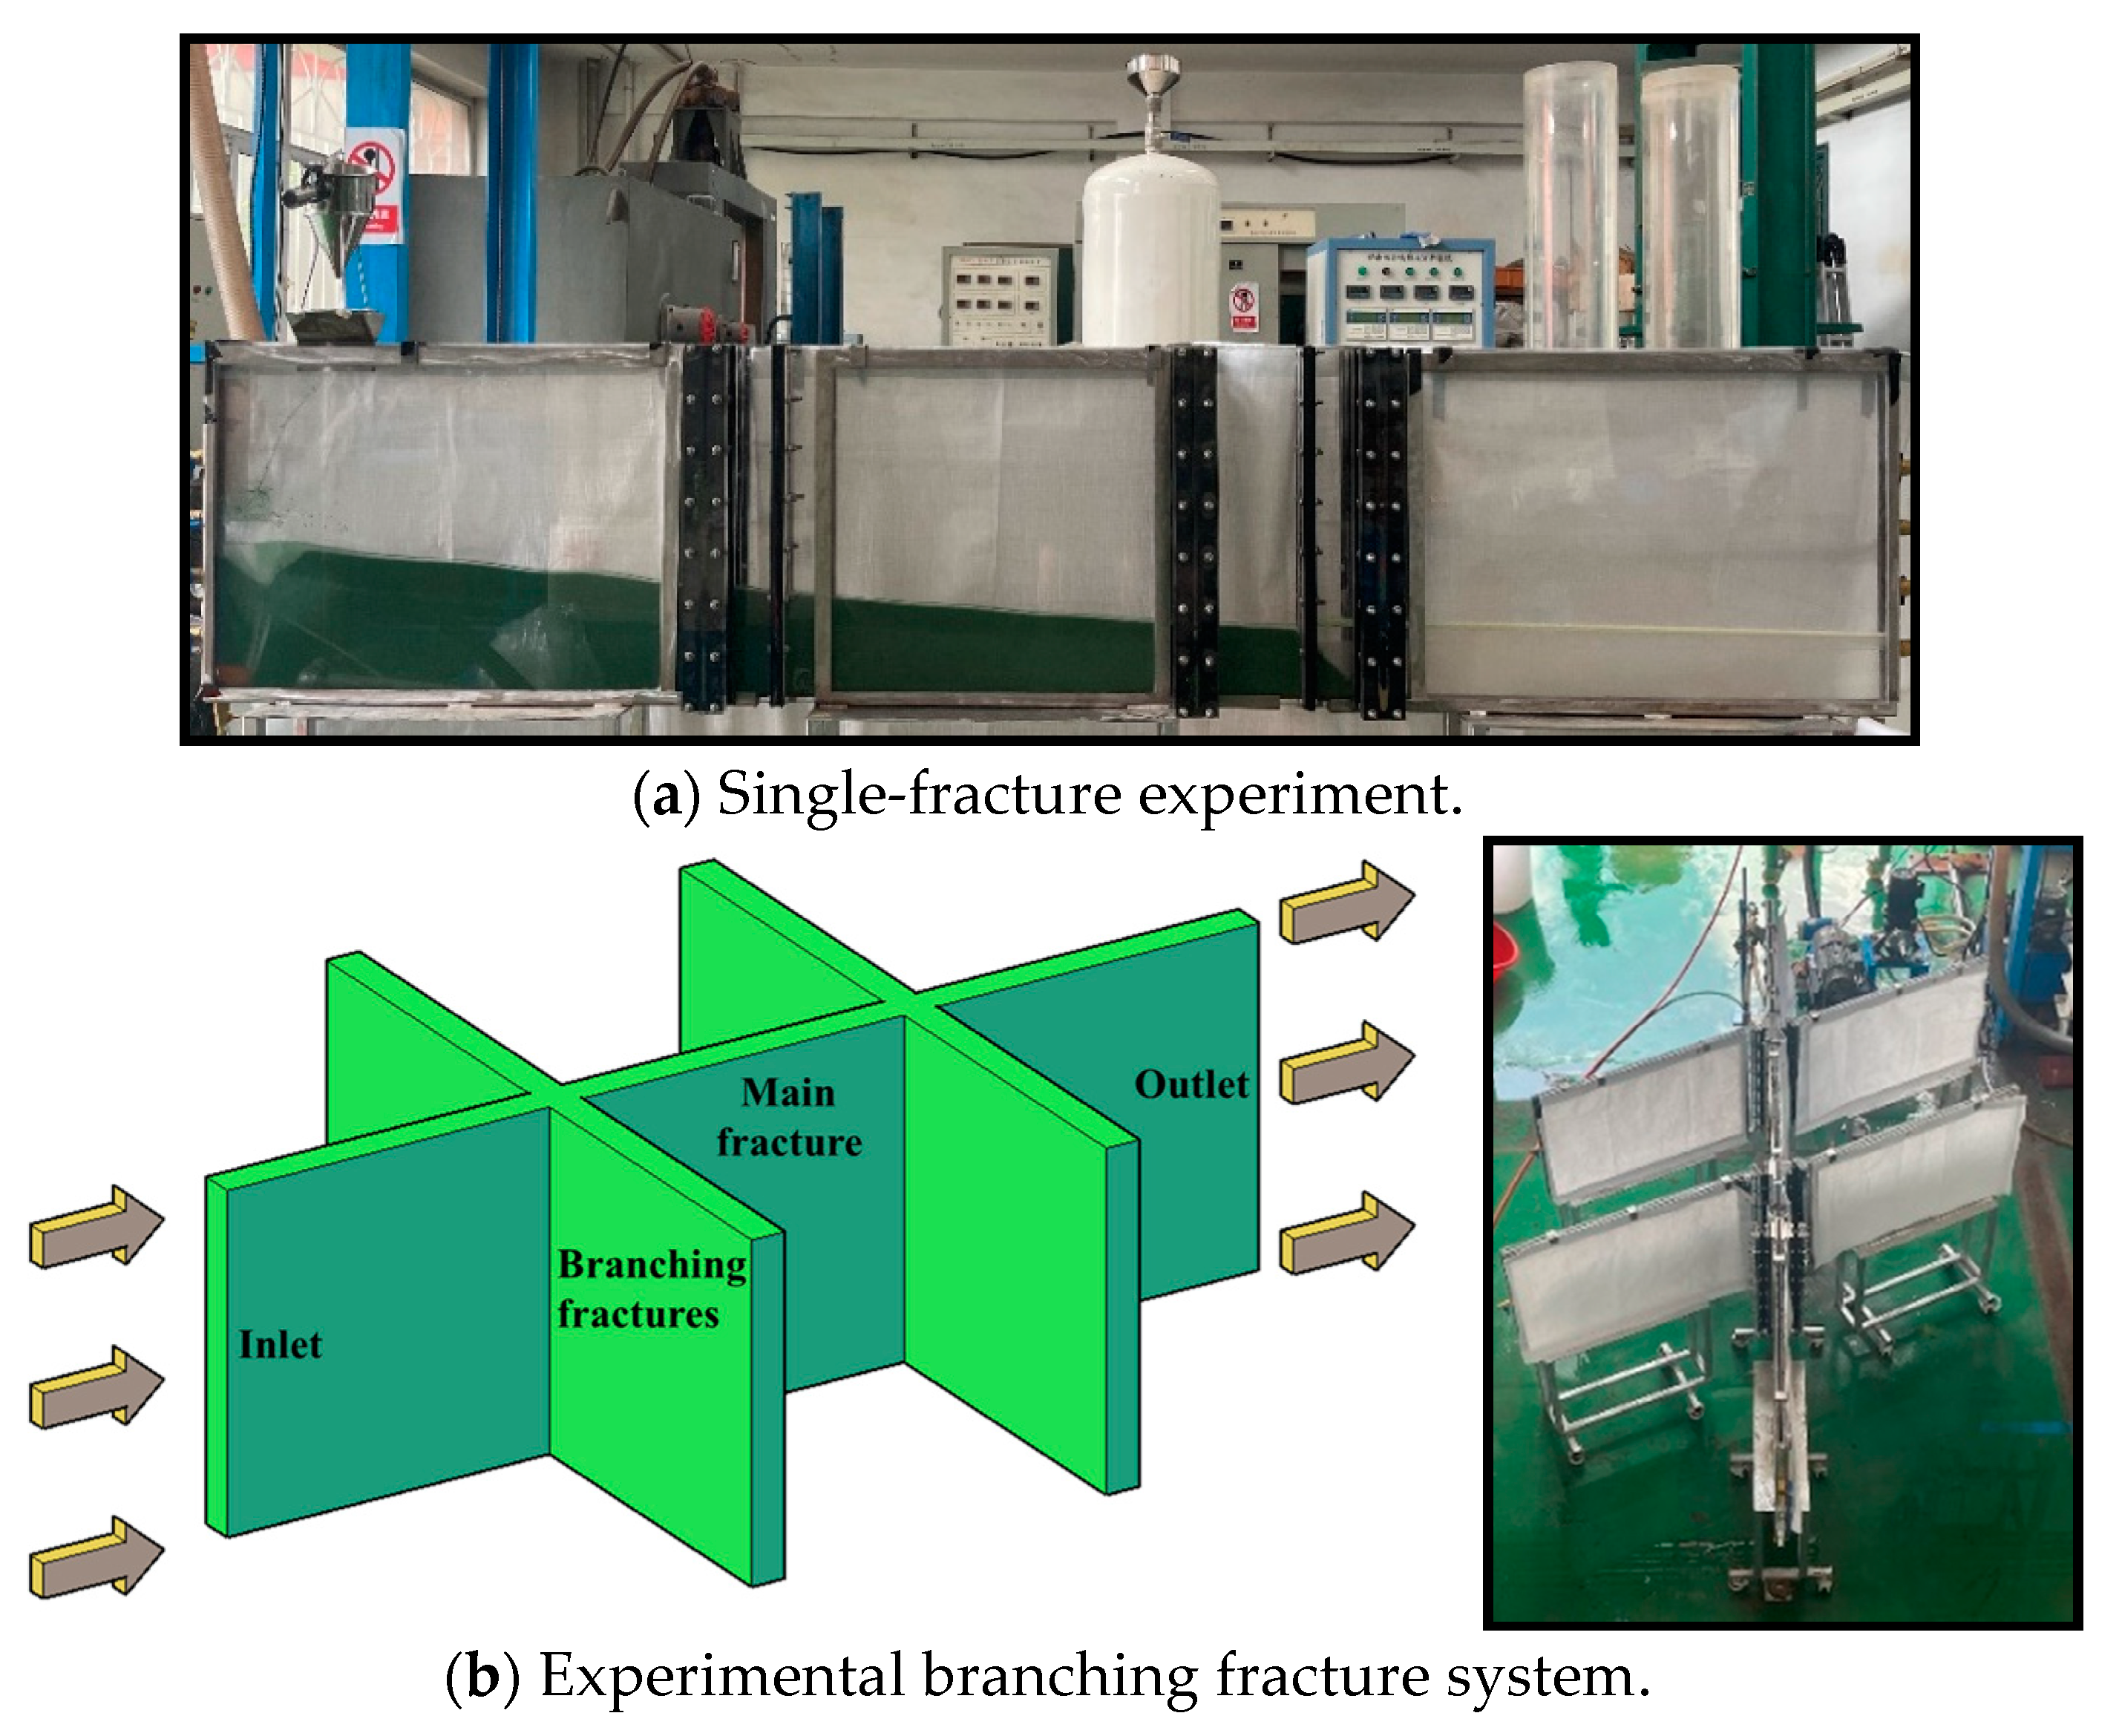
2.1. Experimental Apparatus

The self-developed experimental system for visual proppant transport and distribution mainly consists of a sand-adding system and a fracture simulation system, as illustrated in Figure 1. The sand-adding system comprises a sand-adding device, mixing tank for fluid preparation, and slurry pump which supply hydraulic fracturing fluid to the experimental system. The slurry pump allows for adjustable injection rates ranging from 0 to 30 m3/min to meet the experimental requirements. The fracture simulation system is composed of several visual fracture units. Each individual fracture unit is constructed using two parallel acrylic plates measuring 1000 mm in length, 600 mm in height, and spaced 10 mm apart. The gap between them simulates the fractures within the geological formation. To investigate the influences of single and branched fractures on proppant transport, experimental systems with single and multiple branched fractures were constructed using three and five fracture units, respectively (Figure 2). At the entrance of the fracture simulation system, four perforation holes were evenly distributed along the height direction, each with a diameter of 20 mm and spaced at 50 mm intervals. A circular outlet with a diameter of 50 mm was placed at the bottom of the fracture. Prior to the experiment, the proppant was introduced into the mixing tank via a feeding device, where it was mixed with the fracturing fluid. The sand-carrying fluid was directed into the fracture through four evenly distributed holes using a slurry pump. Throughout the experiment, a camera recorded the proppant transport process, which ceased once the accumulated proppant reached the equilibrium height.

2.2. Experimental Design

When proppants are injected through a main fracture into a complex fracture network, flow diversion occurs as the proppants pass through branched fractures, affecting the proppant transport process. However, alterations in the proppant particle size and injection rate induce changes in the forces exerted on the proppant particles within the fracturing fluid, thus influencing their transport and distribution. We investigated the influence of the proppant particle size and injection rate on proppant transport under single-fracture and branched-fracture conditions, as listed in Table 1. The selected experimental proppants consisted of quartz sand with sizes of 270–550 μm (30–50 mesh), 212–380 μm (40–70 mesh), and 109–212 μm (70–140 mesh). Proppants of various mesh sizes were dyed to facilitate the observation of their transport patterns. Slickwater with a viscosity of 5 mPa·s was used as the fracturing fluid and a constant sand ratio of 20% was maintained.
There are discrepancies between the calculated indoor injection rate and the field injection rate. To ensure that the experimental results more accurately reflect real-world conditions and achieve the goal of guiding hydraulic fracturing construction design, it is necessary to convert the indoor-tested injection rate to the field-scale injection rate. Assuming the flow velocity of the fracturing fluid within the indoor parallel plate fracture is equal to the actual flow velocity in the reservoir fracture, the process of deriving the conversion formula for the flow rates between the experimental pipeline and the reservoir fracture is as follows:
q = 3.6 × v w h × 10 3
Q = 6 × V W H × 10 5
Q = 1 60 × q W H w h
where:
v represents the flow velocity of the fracturing fluid within an indoor parallel plate fracture (m/s),
q represents the indoor flow rate, m3/h,
w is the width of the fracture, mm,
h is the height of the parallel plates, mm,
V denotes the actual flow velocity of the fracturing fluid within a reservoir fracture (m/s),
Q represents the flow rate within the reservoir fracture, m3/min,
W is the width of the reservoir fracture, mm,
H is the height of the reservoir fracture, mm.
To investigate the impact of injection rate on proppant transport and the resulting sandbank morphology in both single fractures and branched fractures, we applied three distinct discharge rates: Q = 3.0, 5.0, and 7.0 m3/h, which equate to the field injection rates of 8.0, 10.0, and 12 m3/min, respectively. Since sandbanks can eventually reach equilibrium, it suffices to conduct each experimental condition once.

3. Discussion and Analysis

3.1. Proppant Transport Behavior in Single Fractures

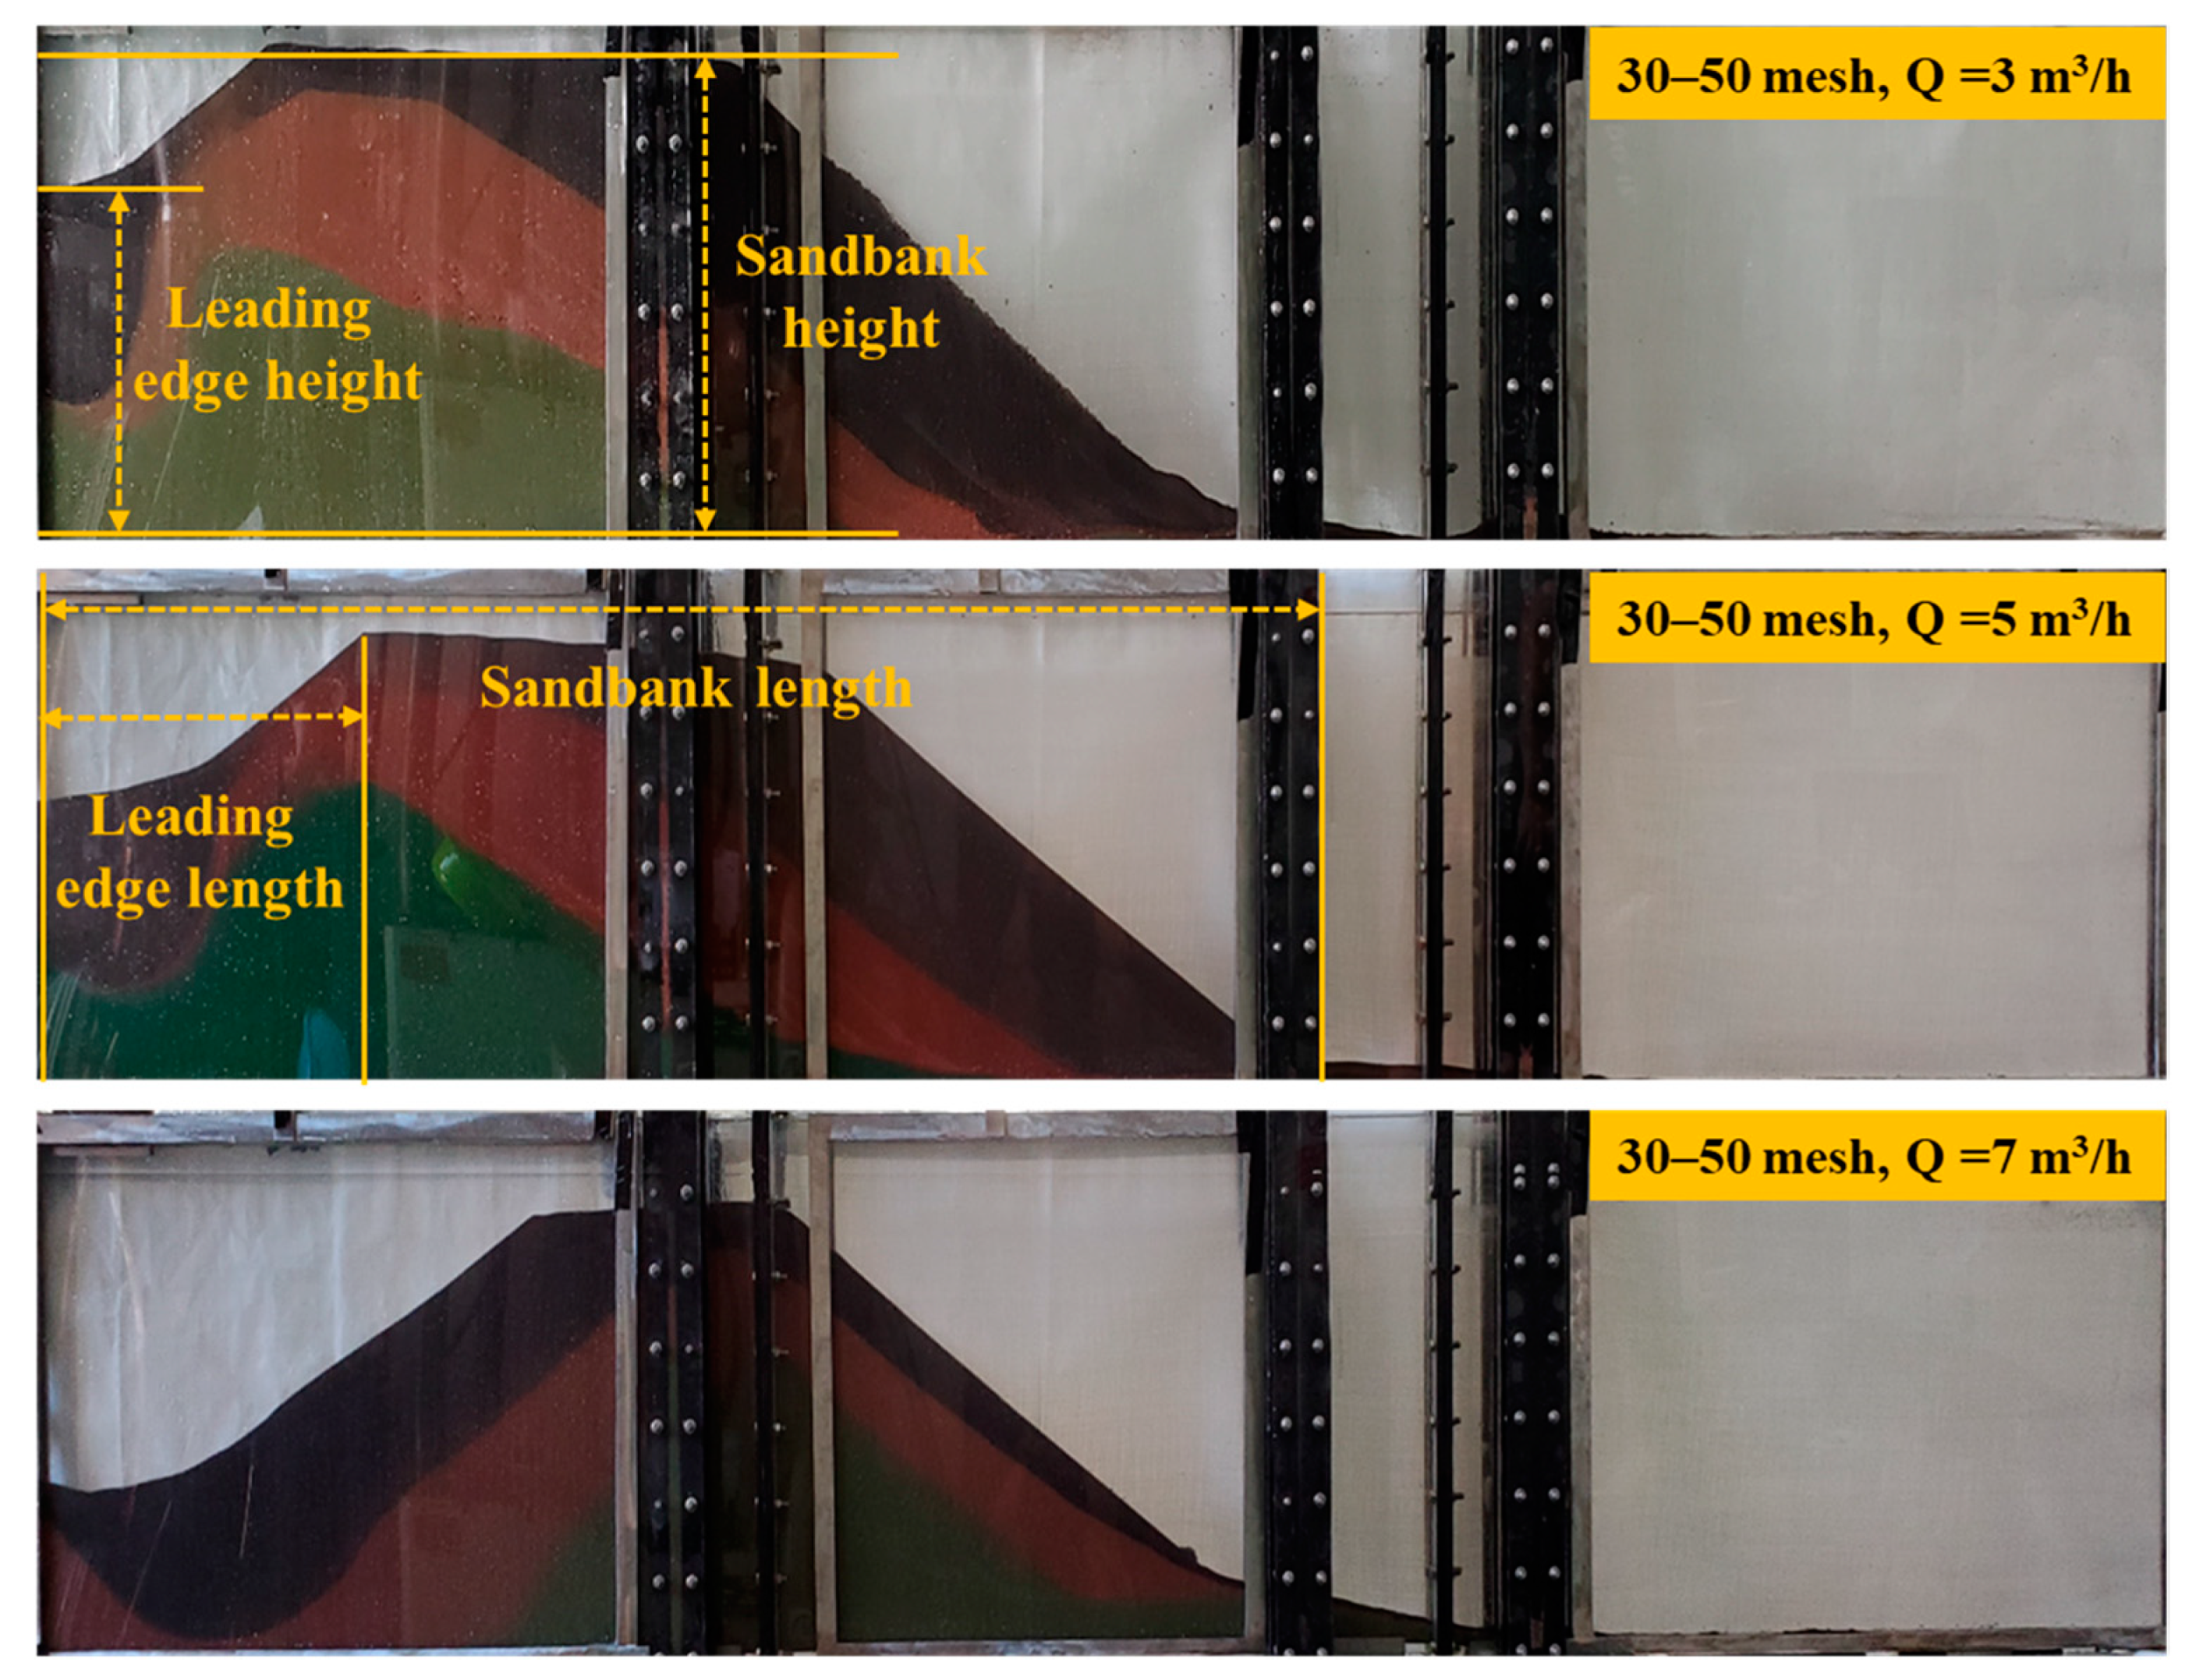
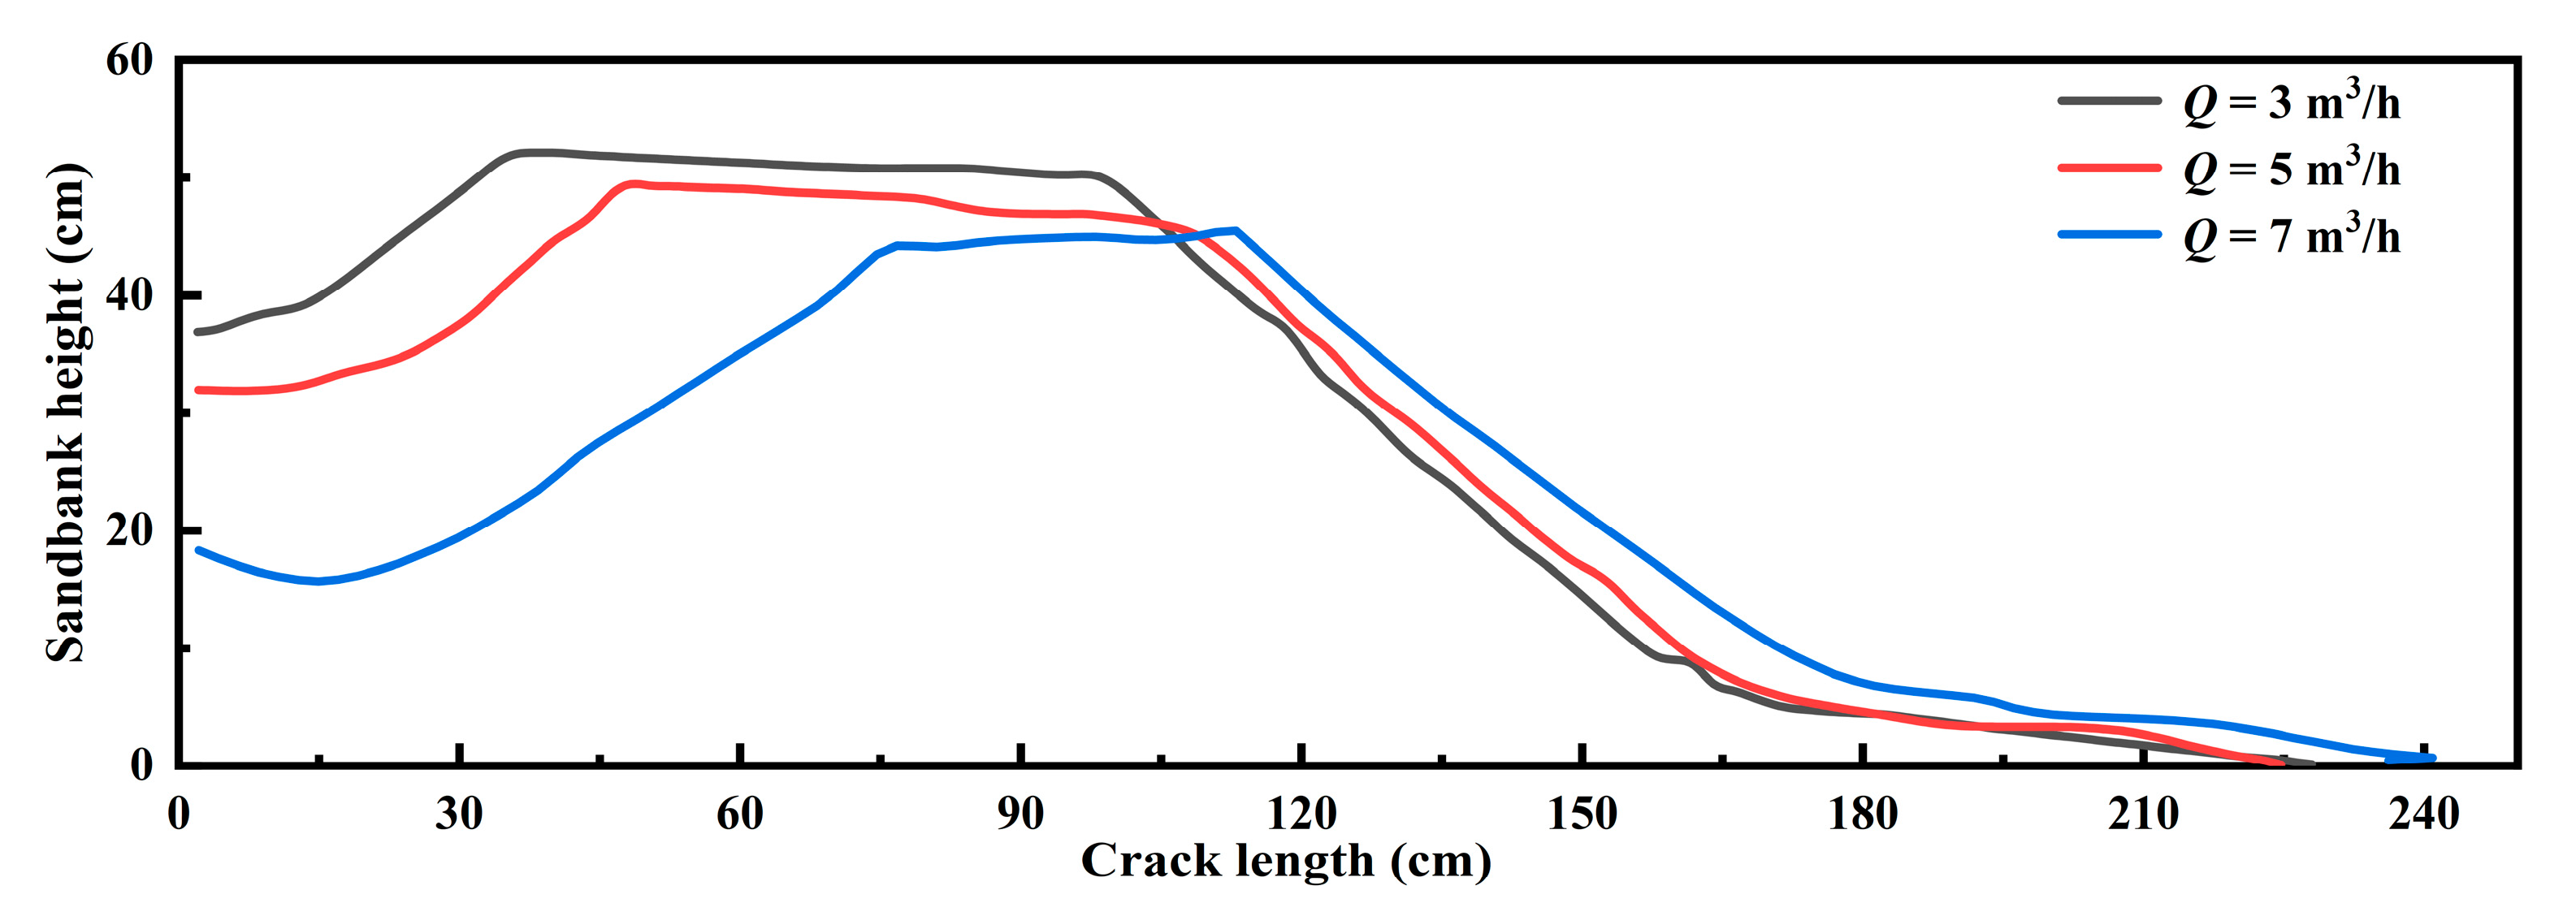
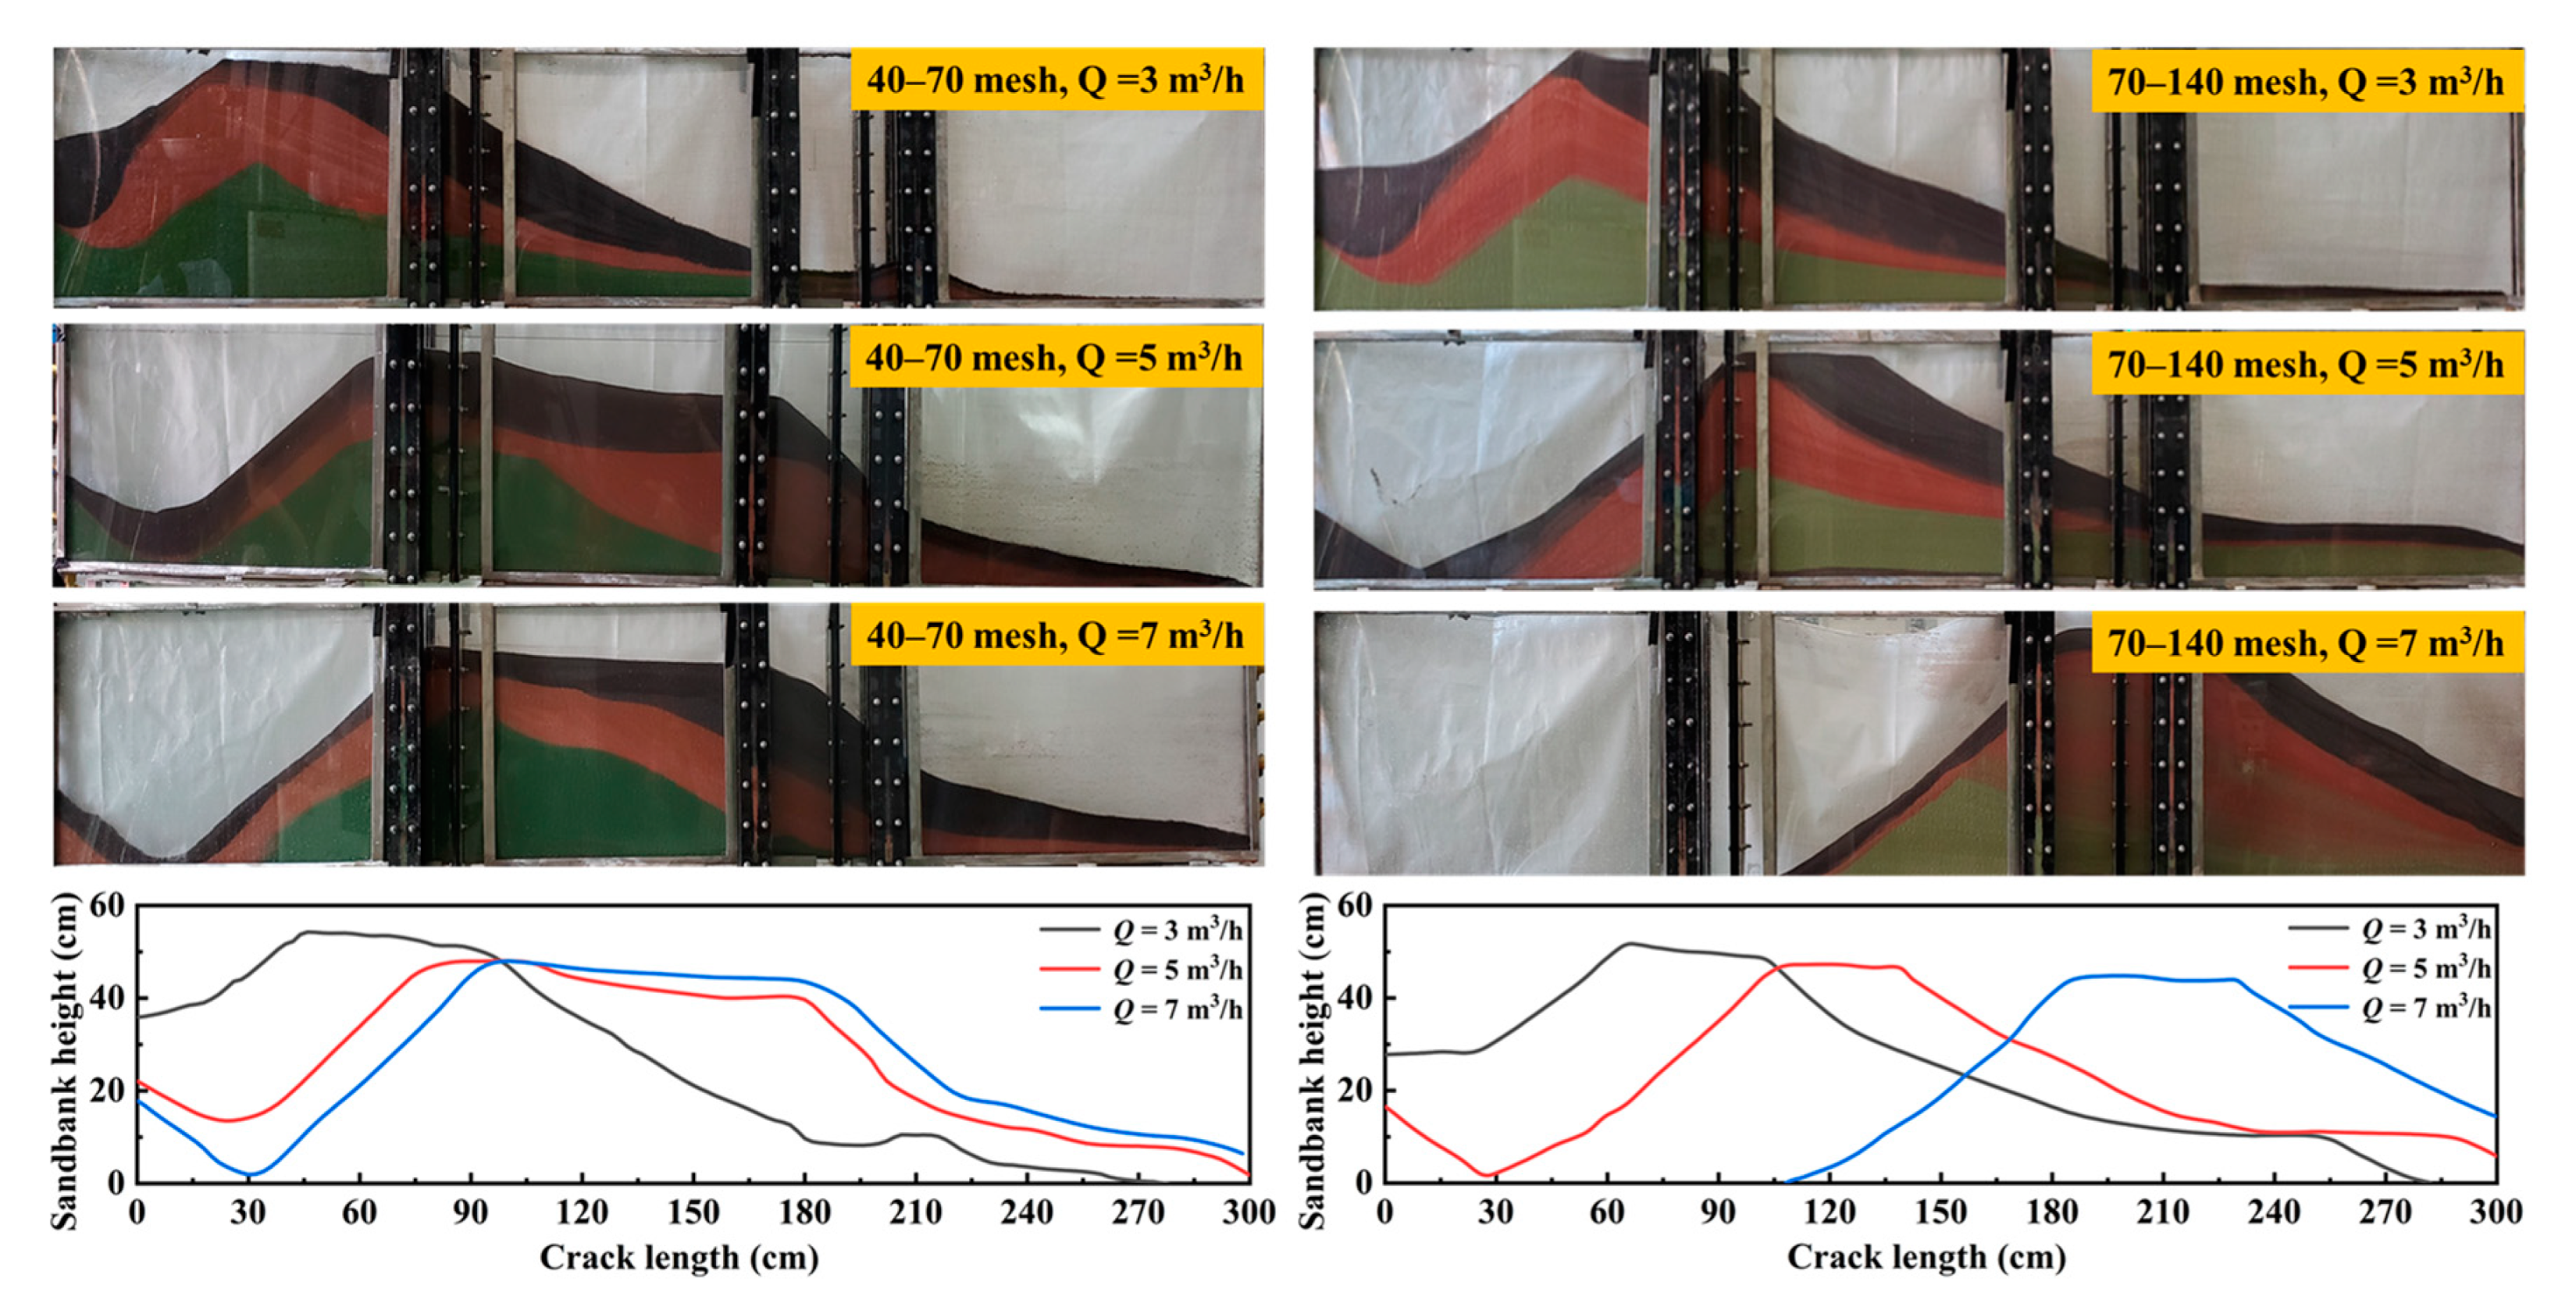
3.1.1. Injection Rates

Figure 3 depicts the distribution of proppants at different hydraulic fracturing injection rates when the proppant particle size was 270–550 μm (30–50 mesh). The sandbank morphology at equilibrium under the varying injection rates shared consistent traits, including the existence of a leading edge area, a region of height equilibrium, and a descending area. The sandbank leading edge area strongly influenced the overall flow conductivity of the fractures. Insufficient proppant placement at the fracture entrance may make fractures near the wellbore susceptible to closure, particularly under elevated geostress conditions, ultimately compromising flow conductivity. Furthermore, the equilibrium length and height of the sandbank significantly contributed to the primary factors affecting the fracture flow conductivity. Enhanced fracture flow conductivity is directly correlated with a greater sandbank equilibrium height and an extended equilibrium length [39,40,41].
Therefore, to further analyze the influence of the injection rate on proppant migration and distribution, a coordinate system was established with the lower part of the fracture as the x-axis and injection port as the y-axis, and sandbank morphological data under different injection rates were drawn in the coordinate system. Figure 4 illustrates the morphological data of the sandbank for proppant particle sizes of 270–550 μm (30–50 mesh) under different fracturing injection rates. For proppant particles sized between 270 and 550 μm (30–50 mesh) injected at a rate of 3.0 m3/h, the leading edge of the sandbank reached a height of 36.8 cm and extended to a length of 35.9 cm. The sandbank achieved an equilibrium height of 52.2 cm and a length of 224.7 cm. When the injection rate was raised from 3.0 to 5.0 and 7.0 m3/h, the leading edge height of the sandbank decreased to 31.9 and 18.3 cm, respectively. Simultaneously, the length of the leading edge increased to 48.3 and 76.7 cm. Correspondingly, the equilibrium height decreased to 49.3 and 44.2 cm, whereas the sandbank length increased to 227.9 and 236.1 cm.
According to Ranjith et al. [42], the main forces governing the acceleration of proppant particles are the drag, pressure gradient, and virtual mass forces, and their effects diminish in that sequence. As the predominant force in the proppant acceleration, drag force relies primarily on the velocity disparity between the liquid and solid phases. Increasing the injection rate of the fracturing fluid can greatly increase the velocity difference between the liquid and solid phases, resulting in an escalated drag force acting on the proppant particles. This leads to enhanced particle transportation speed and distance. When the injection rate is increased, the scale of the vortex formed at the forefront of the sandbank increases, enhancing the entrainment effect. Most of the particles continuously undergo entrainment and remain suspended within the fracturing fluid, subsequently being transported to the remote end of the fracture because of drag forces. Hence, an increase in the injection flow rate resulted in the reduced height of the leading edge of the sandbank and a simultaneous increase in the distance of particle displacement.
Figure 5 illustrates the placement morphology of 270–550 μm (40–70 mesh) and 109–212 μm (70–140 mesh) proppants for the varying injection rates. With an increase in the injection rate, the placement morphology of the proppant followed consistent patterns. Notably, for smaller particle sizes, increasing the injection rate resulted in the heightened entrainment and transportation of the proppant particles to the rear end of the fracture. This phenomenon caused the leading -edge height to decrease to 0 mm and propelled the sandbank forward. Although an increase in the injection flow rate has the potential to extend the placement distance, proppant particles do not settle near the fracture entrance close to the wellbore. This may result in fracture closure, thereby reducing the overall flow conductivity of the fracture.
These results show that, during hydraulic fracturing operations using a single-particle-sized proppant, the injection rate should be increased to increase the proppant distribution distance within the fracture. Subsequently, the injection rate can be decreased, enabling effective proppant deposition near the fracture entrance, particularly near the wellbore.

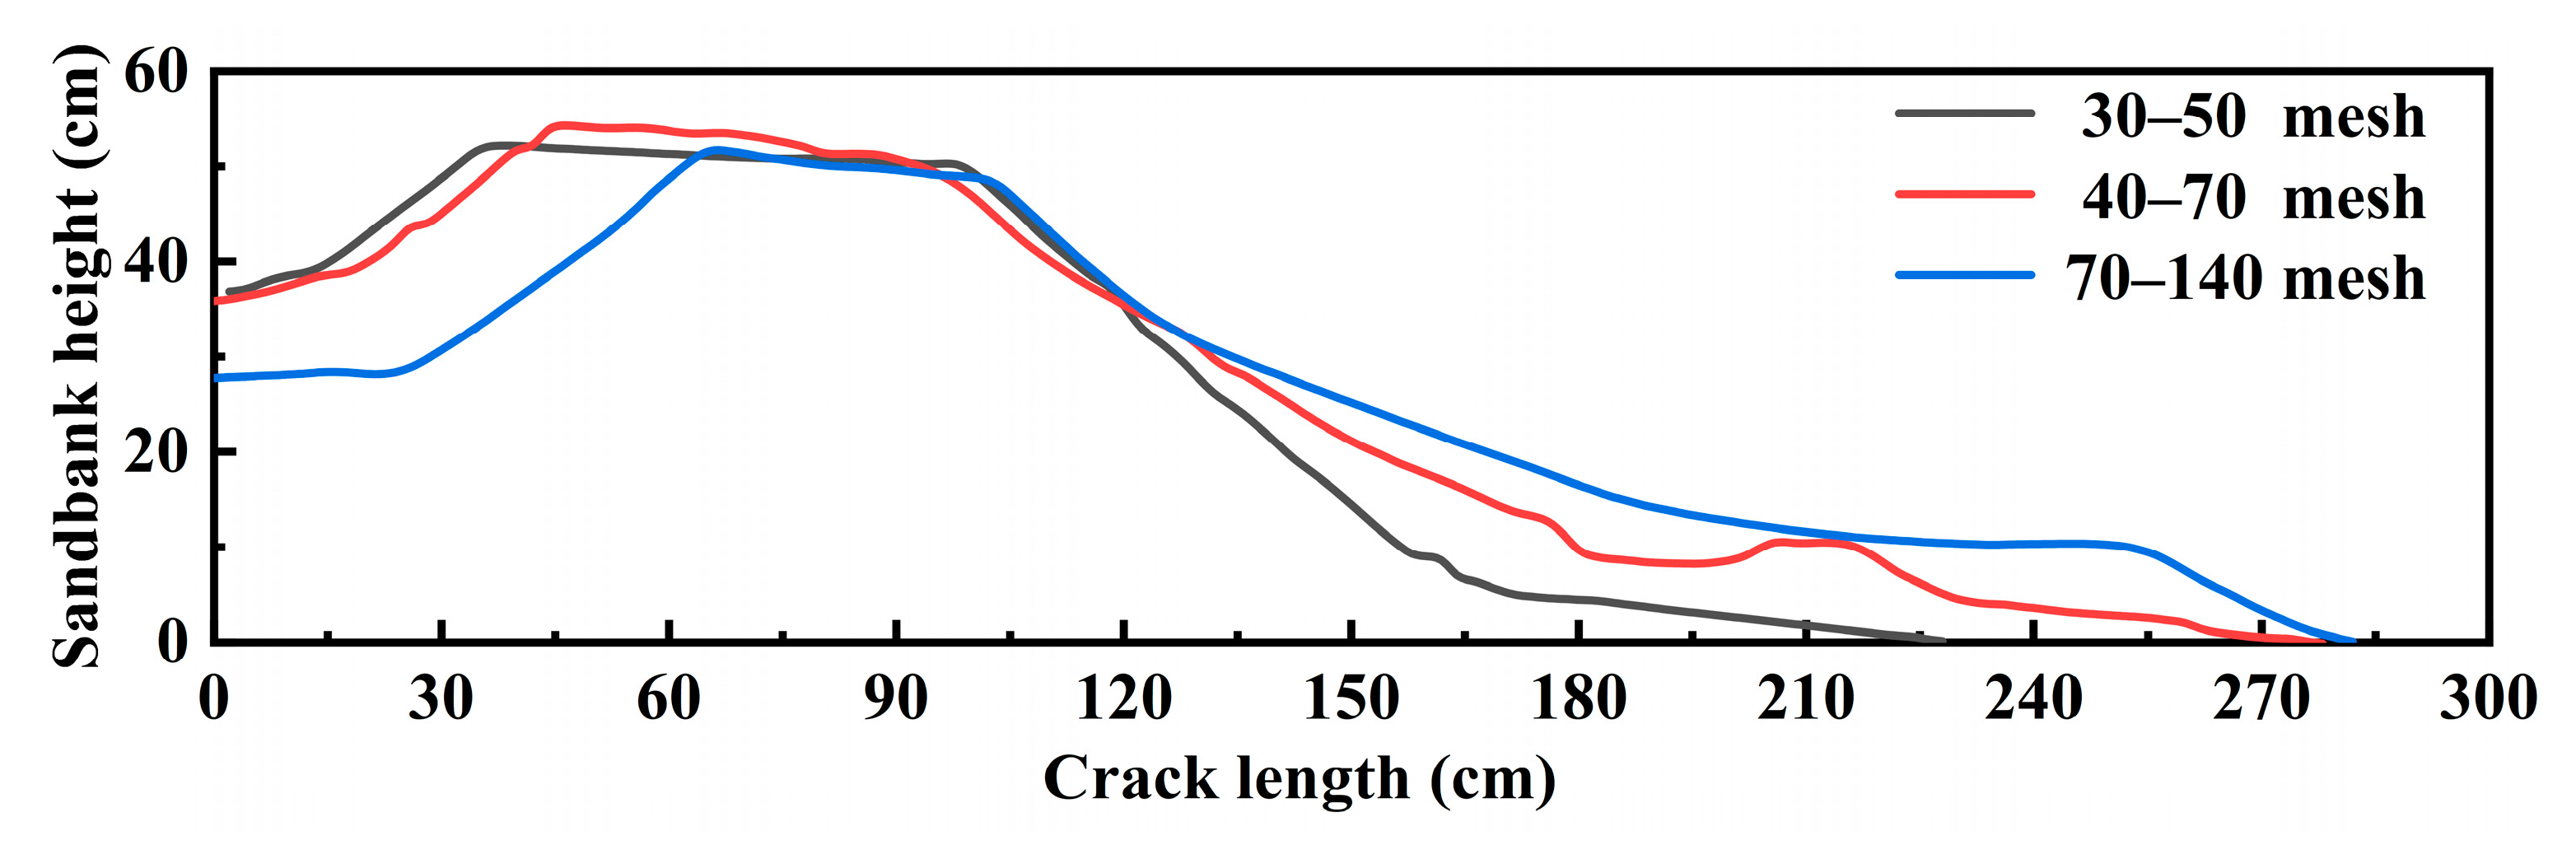
3.1.2. Particle Size

The particle size profoundly influences the transport and arrangement of proppant particles. The arrangement characteristics of proppants varying in particle sizes were derived under injection rates of 3.0, 5.0, and 7.0 m3/h, as depicted in Figure 6. At an injection rate of 3.0 m3/h and with proppant particle sizes of 109–212 μm (70–140 mesh), the leading edge of the sandbank had a height of 27.7 cm and a length of 51.0 cm, whereas the equilibrium height and length were 51.6 and 282 cm, respectively. For the proppant particle sizes of 212–380 μm (40–70 mesh), the leading edge of the sandbank had a height and length of 35.8 cm, respectively, with an equilibrium height and length of 54.2 and 276 cm, respectively. For the proppant particle sizes of 212–380 μm (40–70 mesh), the leading edge height and length of the sandbank were both 35.8 cm, and the equilibrium height and length of the sandbank were 54.2 and 276 cm, respectively. As the proppant particle size increased, the gravitational force increased the vertical force on the proppant, resulting in an increased settling rate. Proppant particles rapidly settled and accumulated at the fracture near the wellbore, forming a sandbank. The fracturing fluid consistently introduced a proppant into the fracture, leading to an accumulation at the leading edge of the sandbank until an equilibrium state was reached. Thus, as the particle size increased, and the height of the leading edge of the sandbank increased, whereas the length of the sandbank decreased. Therefore, with increasing particle sizes, the leading edge of the sandbank experienced an elevated height coupled with a reduced length.
When the proppant particle size was increased from 109–212 μm (70–140 mesh) to 212–380 μm (40–70 mesh), the sandbank leading edge height increased by 7.8 cm. However, as the particle size was further increased from 212–380 μm (40–70 mesh) to 270–550 μm (30–50 mesh), the height of the sandbank leading edge increased by only 1.0 cm. In instances of smaller particle sizes, the proppant particles that accumulated at the leading edge of the sandbank were easily sucked into the upper part of the fracture by the vortex and continuously transported to the far end of the fracture. Augmenting the particle size increased the vertical gravitational force exerted on the proppant particles. This led to an accelerated settling rate and a subdued suction effect of the vortex on the proppant particles. The continuous accumulation of proppant in the fracture near the wellbore increased the height of the sandbank’s leading edge. Further increasing the proppant particle size did not lead to the increased uptake and transport of proppant particles at the leading edge of the sandbank, resulting in a smaller increase in the leading edge height.
When the injection rate remained constant, smaller proppant particles were more easily conveyed to deeper regions of the fracture. However, this led to the reduced equilibrium height of the sandbank and increased the susceptibility to vortex effects at the entrance. Consequently, the proppant placement near the entrance was diminished, which impeded the enhancement of the overall fracture conductivity. Although larger proppant particles exhibited an improved sandbank morphology, they were less effective in transporting proppant deep within the fracture and were susceptible to sand plugging. Thus, smaller proppant particles should be used during the initial phase of hydraulic fracturing, switching to larger proppant particles in subsequent stages.

3.2. Proppant Transport Behavior in Branching Fractures

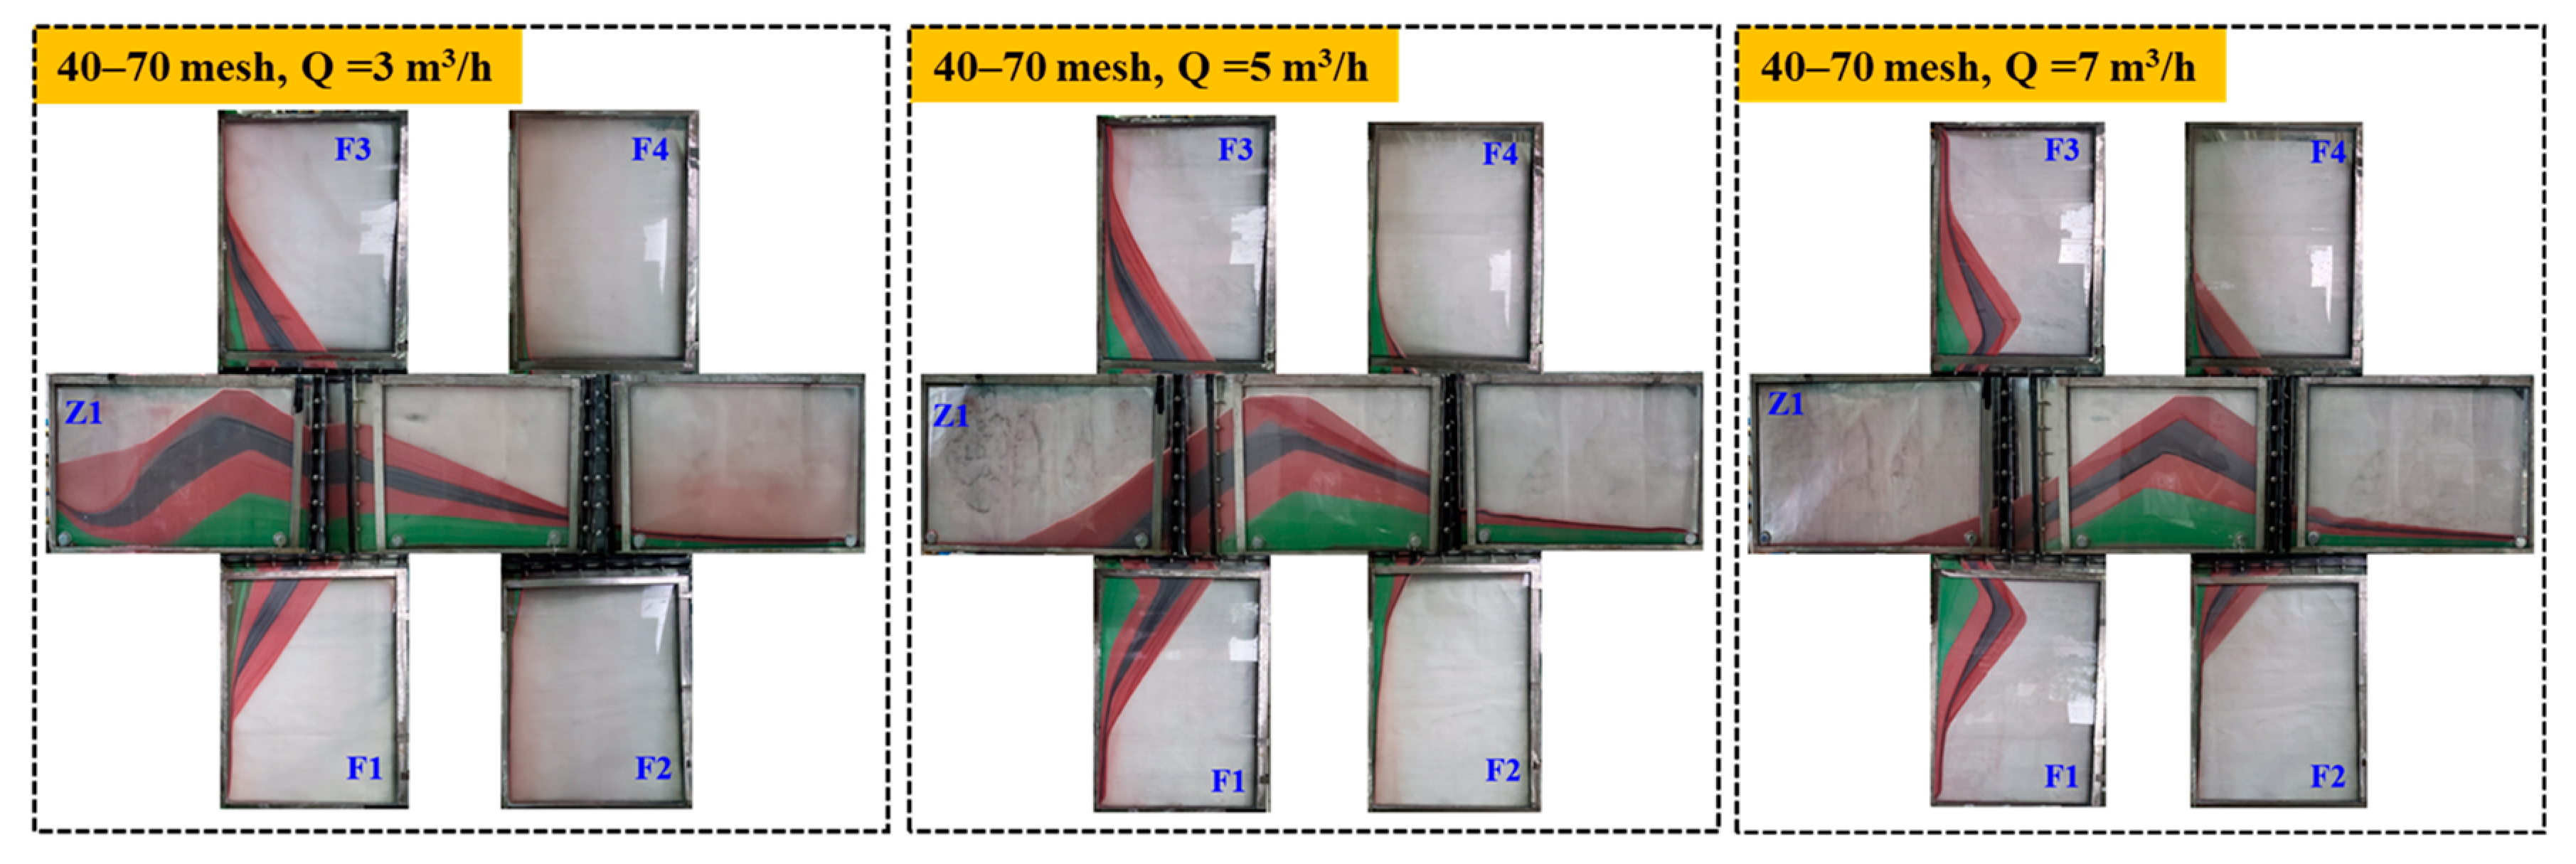
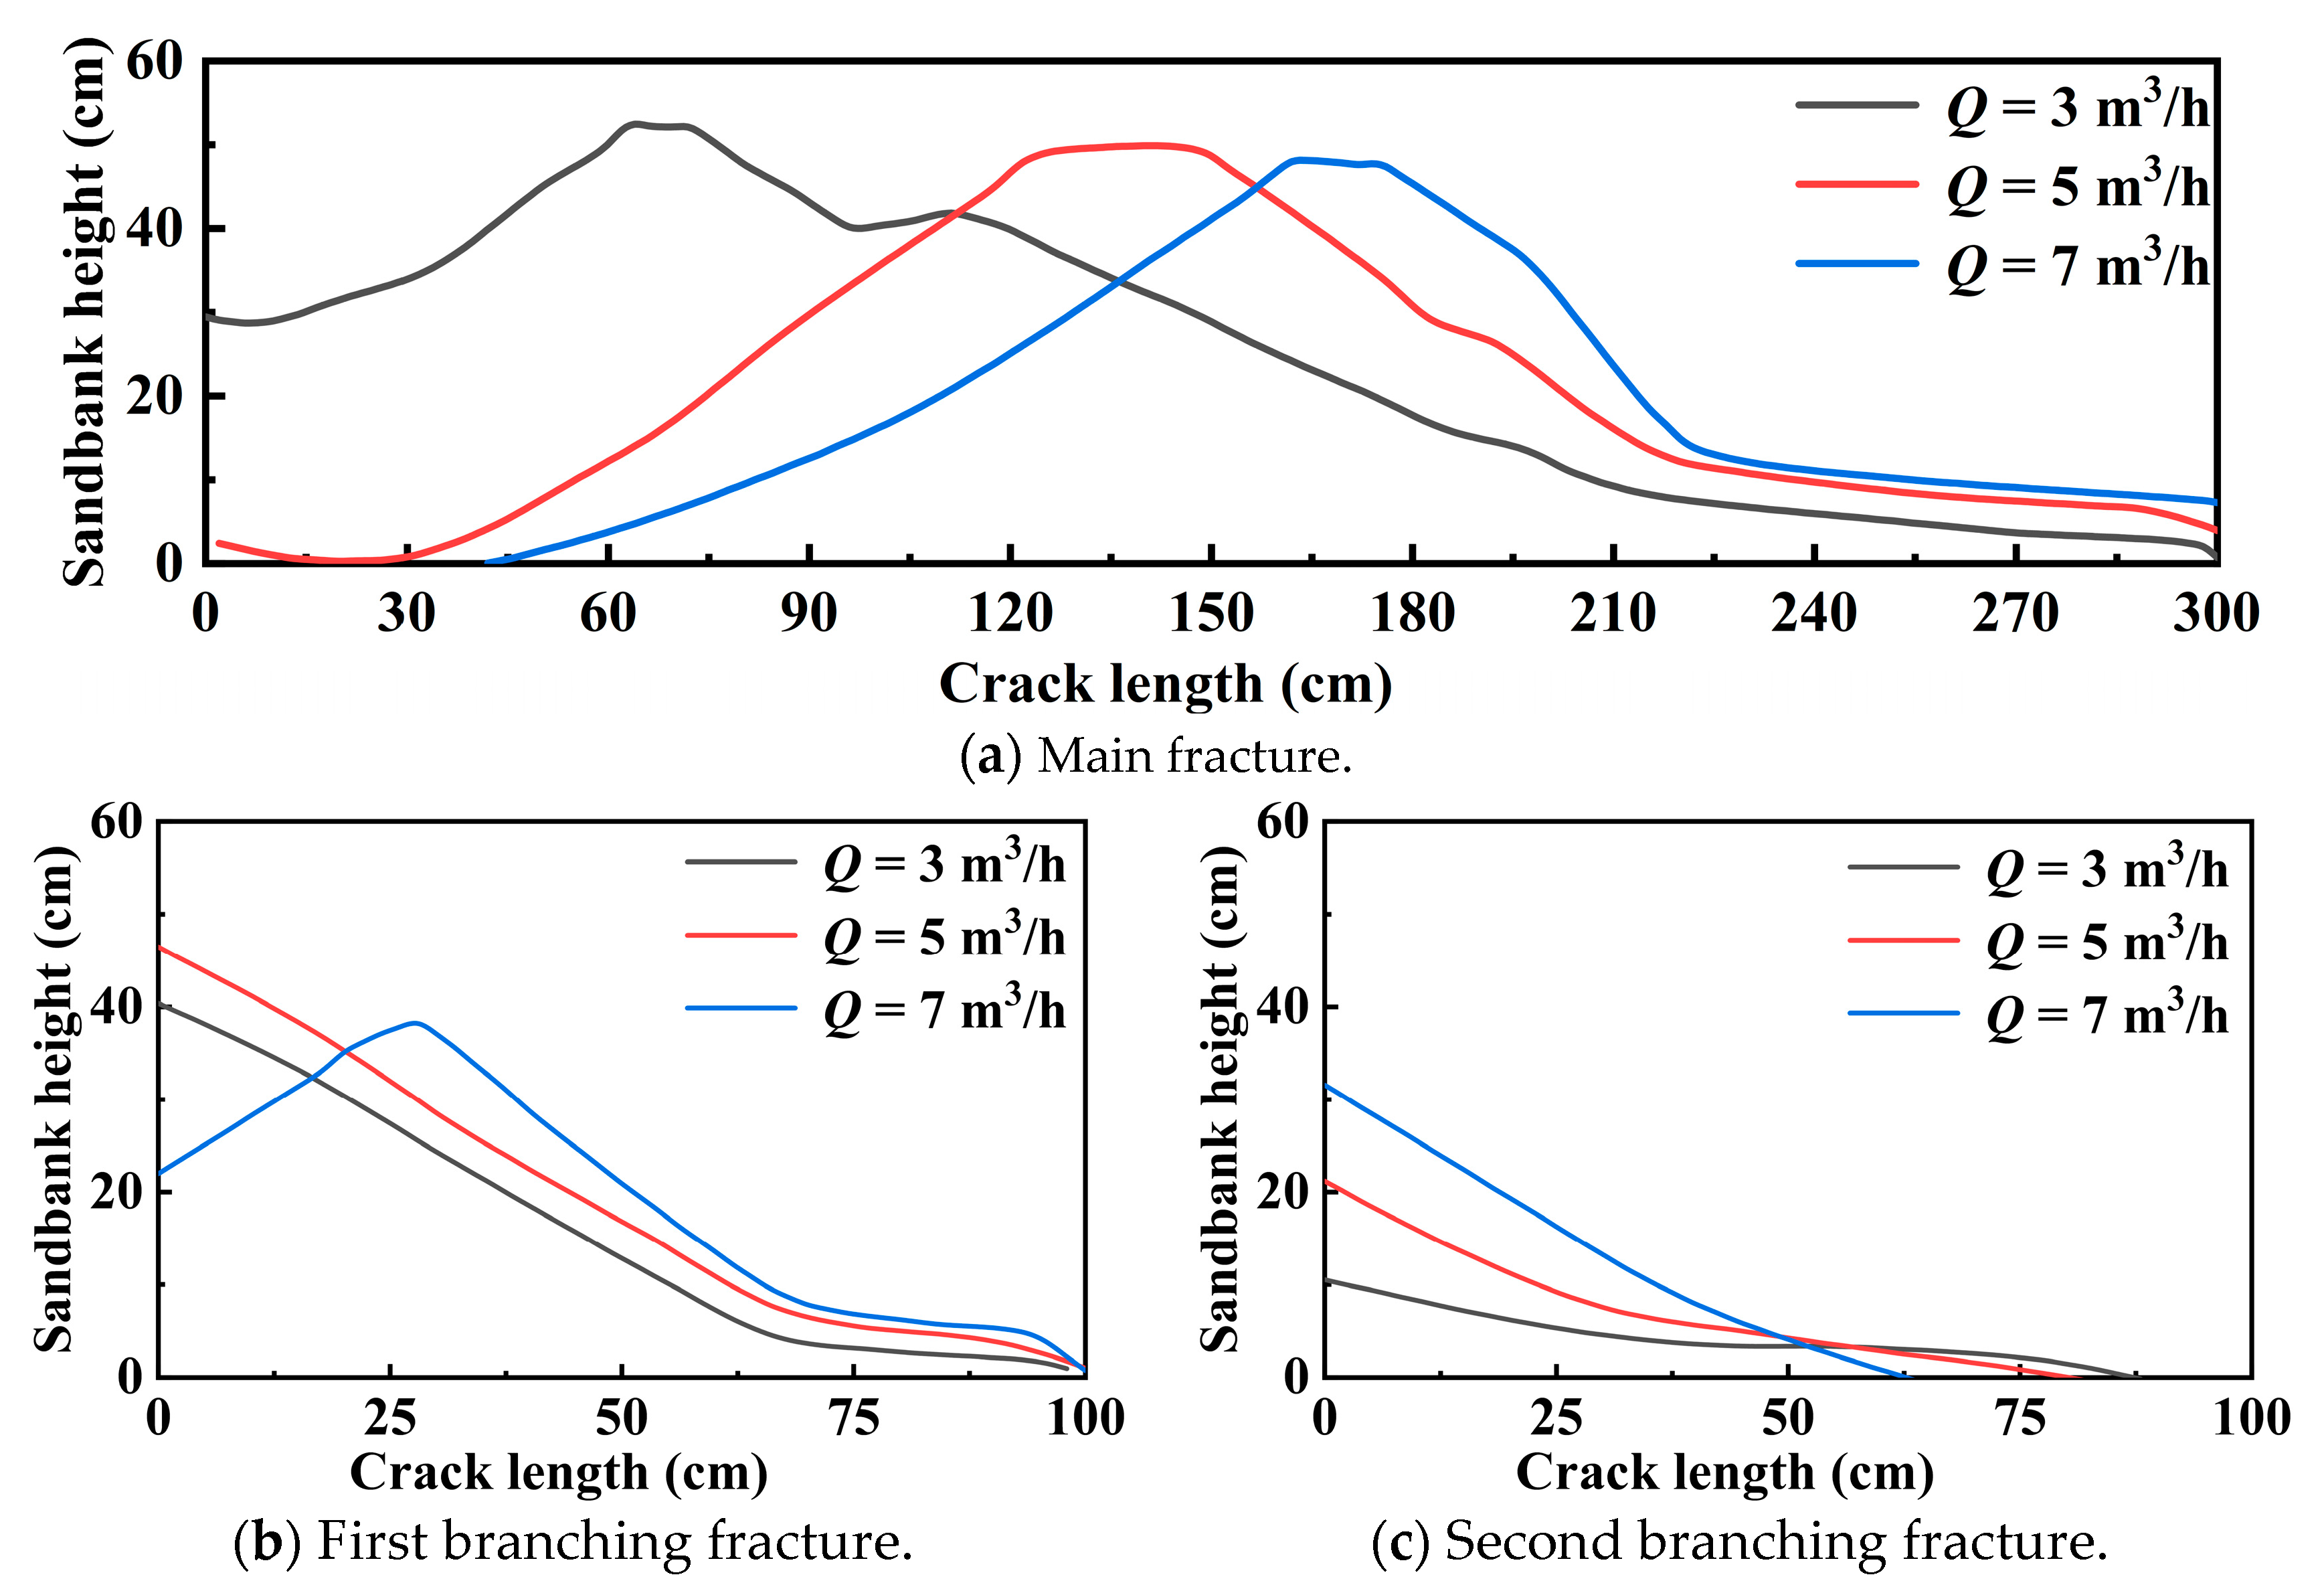
3.2.1. Injection Rates

Figure 7 illustrates the sandbank morphology within both the main and branched fractures under varying injection rates. Notably, the proppant placement morphology within the main fracture was similar to those of scenarios lacking branched fractures. These features include the existence of a sandbank leading edge area, a sandbank height equilibrium area, and a sandbank descending area. Similarly, increasing the injection rate enhanced the flow velocity of the fracturing fluid and increased the drag force on the particles. Because of the influence of drag force, the distance over which the particles migrated into the fracture expanded. Subsequently, particles settled and aggregated at the remote end of the fracture, culminating in sandbank formation. The accumulation of the sandbank extended to the entrance of the fracture, and the high-injection-rate fracturing fluid generated a vortex at the leading edge of the sandbank. The proppant at the leading edge of the sandbank was continuously taken up and transported to the rear end of the sandbank via vortexing. Thus, with increasing injection rates, the length of the sandbank within the main fracture was augmented, accompanied by the reduced height of the leading edge of the sandbank.
As illustrated in Figure 8b, a substantial disparity in the proppant placement morphology was evident within the first branched fracture compared to in the main fracture. When the proppant particle size was 212–380 μm (40–70 mesh) and the injection rate was 3 m3/h, the fracturing fluid carried the proppant particles into the first branched fracture at a lower speed. Subsequently, these particles were consistently deposited within the fracture, resulting in the formation of a sandbank characterized by an approximately triangular shape. The leading edge of the sandbank reached a height of 40.3 mm. When the injection rate was increased to 5 m3/h, the flow rate of the fracturing fluid in the first branched fracture increased, and more proppant particles were transported and accumulated inside the first branched fracture, with the sandbank leading edge height increasing to 46.5 cm. When the injection rate was 7 m3/h, the flow rate of the fracturing fluid in the first branched fracture increased rapidly. The proppant at the leading edge of the sandbank was continuously taken up and transported to the rear end of the sandbank, causing the sandbank leading edge height to decrease by 21.9 cm. Thus, within branched fractures, increasing the injection rate results in an initial increase, followed by a decrease, in the height of the sandbank’s leading edge.
Figure 8c shows the proppant placement morphology within the second branched fracture. The proppant placement area within the second branched fracture was notably smaller than that within the first branched fracture. This discrepancy arose because of the direct proportionality between the influx of proppant into the branched fracture and the flow rate and velocity of the fracture. The placement height and length of proppant in the second branched fracture were significantly lower than those in the first branched fracture. This is attributed to the increased distance of the second branched fracture from the wellbore, resulting in a diminished flow rate and flow velocity.
Hence, within intricate fracture networks, flow diversion caused by branched fractures led to a gradual reduction in the flow rate of the sand-laden fluid. Consequently, the capacity to transport proppant decreased, lowering the flow rate within the distal branched fractures. This, in turn, resulted in compromised proppant support. Thus, in reservoirs characterized by well-developed natural fractures, the proppant placement efficacy within branched fractures can be enhanced by augmenting the fracturing fluid injection rate. Nevertheless, an elevated injection rate may result in a reduced proppant placement height at the entrance of the main fracture proximate to the wellbore and at the entrance of the distal branched fractures.

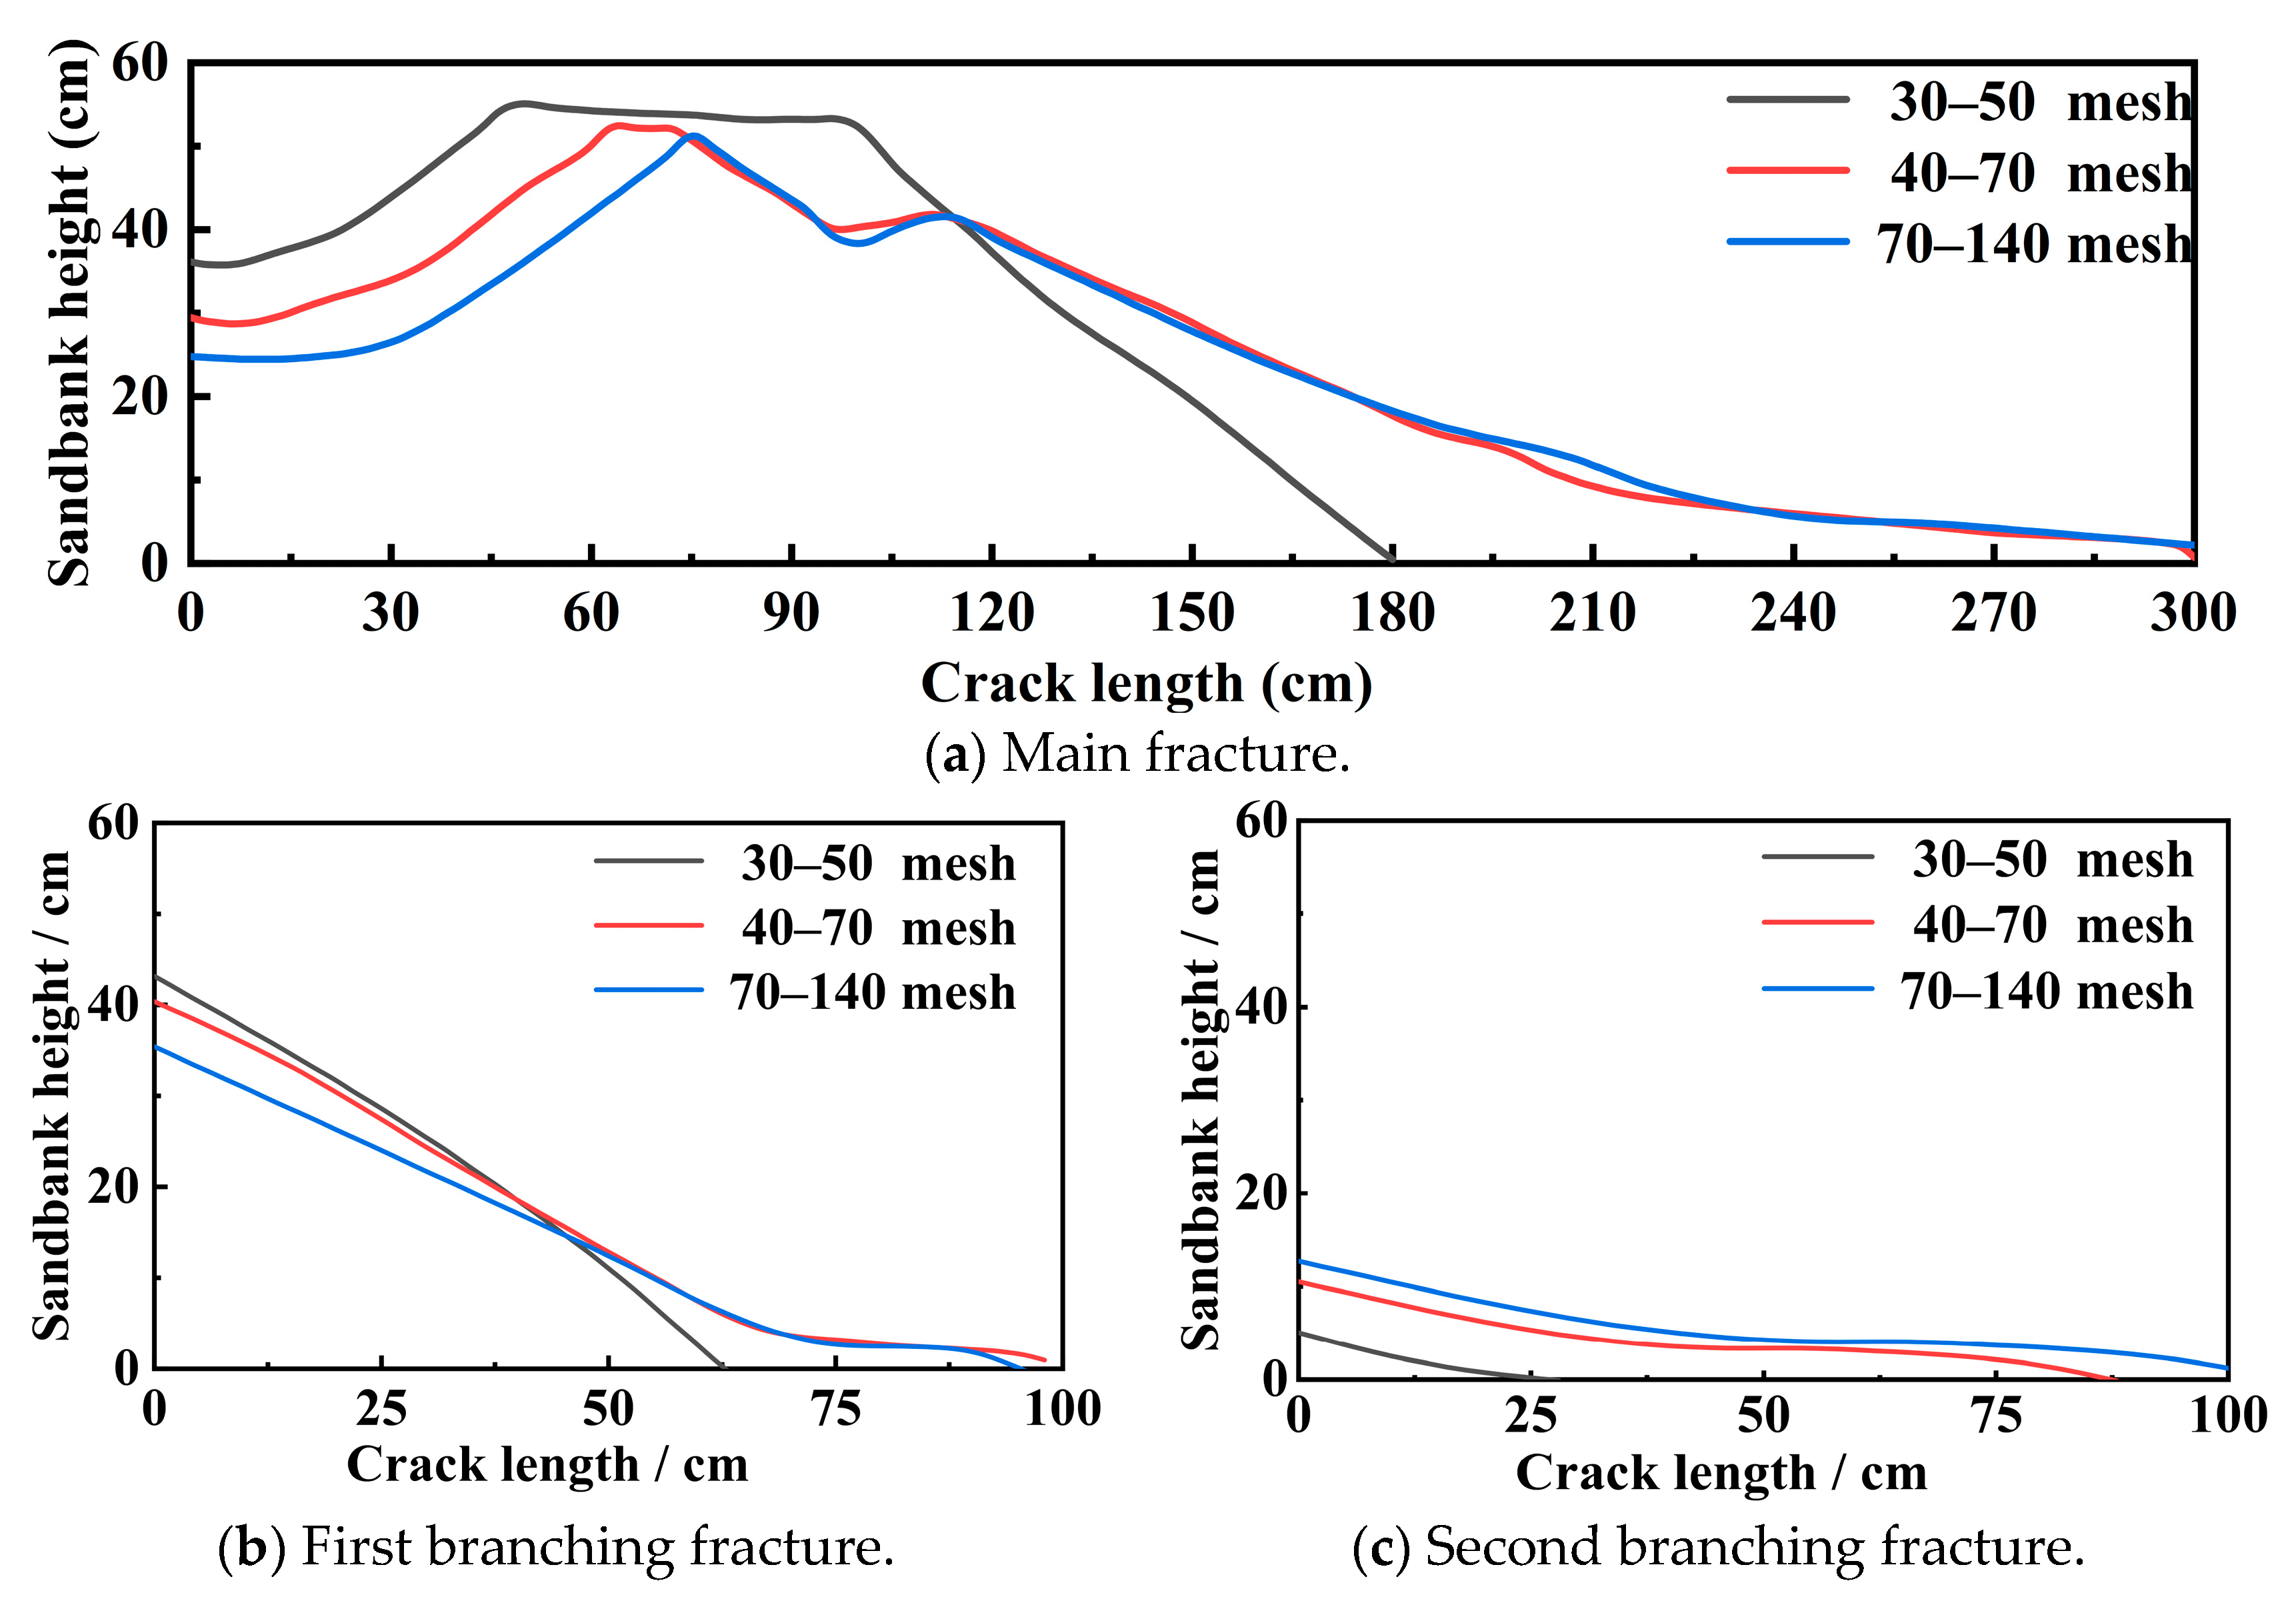
3.2.2. Particle Size

Figure 9 illustrates that, at an injection rate of 3.0 m3/h, the equilibrium heights for proppants of 270–550 μm (30–50 mesh), 212–380 μm (40–70 mesh), and 70–140 μm (70–140 mesh) were 54.9, 51.7, and 49.9 cm, respectively. The corresponding sandbank leading edge heights were 35.8, 30.8, and 24.5 cm, whereas the sandbank leading edge lengths were 10, 12.5, and 24 cm, respectively. The sandbank equilibrium lengths were 165.9, 206, and 221 cm. In line with the single fracture scenario, a decrease in the proppant particle size resulted in reduced gravitational force acting in the vertical direction, leading to a decrease in the settling rate. This change permitted the transportation of proppant particles to the remote end of the fracture, thereby enhancing the placement length and decreasing the height of the sandbank leading edge.
In the case of branch fractures, alterations in the particle size failed to substantially modify the proppant deposition patterns within the first branch fracture when the injection rate was 3 m3/h. Elevating the injection rate to 5 m3/h led to a reduction in the sandbank leading edge height for the 70–140 μm (70–140 mesh) proppant. Further raising the injection rate to 7 m3/h resulted in a decline in the sandbank leading edge height for the 212–380 μm (40–70 mesh) proppant. This phenomenon occurred because of the presence of a critical particle size at a consistent injection rate, which enabled the proppant particles to be entrained and conveyed to the extremity of the branch fracture. The critical particle size corresponding to an injection rate of 3.0 m3/h is quite small. The low-speed flow of the fracturing fluid can only transport and accumulate proppant particles up to the entrance of the first branch fracture. Consequently, variations in particle size exerted minimal influence on the proppant deposition within the branch fractures. Increasing the injection rate led to greater flow velocities within the branch fractures, which increased the critical particle size that is amenable to entrainment. Proppant particles smaller than the critical threshold are then entrained and conveyed to the remote extremities of the fractures, thereby inducing a decline in the sandbank leading edge height and a concurrent augmentation in the deposition length.
Therefore, for reservoirs with complex fracture networks, it is recommended that smaller proppant particles be used to fill the far-end branched fractures when the injection rate is constant.

4. Conclusions

To elucidate the migration and placement patterns of proppant in multibranch fractures during hydraulic fracturing, we conducted simulation experiments under both single- and multi-branch-fracture conditions. The following conclusions were drawn.
(1)
With increasing injection rates, the dimensions of the vortices formed at the forefront of the sandbank increased, thereby intensifying the entrainment effects. Simultaneously, the augmentation of the injection rate of the fracturing fluid efficiently accentuated the disparity in velocity between the liquid and solid phases. This enhancement heightened the drag force exerted on the proppant particles, improving their conveyance velocity and traversal distance. However, if proppant particle filling is not achieved at the fracture entrance near the wellbore, it may lead to fracture closure and a reduction in the overall flow conductivity of the fracture.
(2)
Increasing the particle size can increase the gravitational force on the proppant particles in the vertical direction, resulting in a faster settling rate and a weakened vortex suction effect on the proppant particles. The proppant continuously accumulated in the fracture near the wellbore, leading to a shorter particle placement distance.
(3)
Because of the flow diversion effect of the branched fractures, the flow of sand-laden fluid gradually diminished, resulting in a lower ability to transport proppant. Consequently, the placement of proppant in the branching fractures farther from the wellbore was comparatively less effective.
(4)
Augmenting the injection rate and decreasing the proppant particle dimensions can enhance the comprehensive flow capacity of fractures. This approach facilitates the filling of branching fracture networks in remote wells. Subsequently, larger proppants can be employed to pack the fractures adjacent to the wellbore.
In light of equipment limitations, this research has not yet delved into factors such as fracture angles, multistage fractures, and fracture roughness. In future investigations, we intend to address this gap by conducting a comprehensive series of experiments and numerical simulations focusing on proppant migration within intricate fractures as influenced by multiple factors.

Author Contributions

Methodology, C.K.; validation, L.Y. and X.G.; investigation, L.Y., X.G. and F.T.; data curation, L.Y.; writing—original draft preparation, C.K.; writing—review and editing, C.K.; project administration, Y.L.; funding acquisition, Y.L. All authors have read and agreed to the published version of the manuscript.

Funding

This research received no external funding.

Data Availability Statement

The raw/processed data required to reproduce the above findings cannot be shared at this time, as the data also form part of an ongoing study.

Conflicts of Interest

The authors declare no conflict of interest.

References

  1. Zou, C.; Zhu, R.; Liu, K.; Su, L.; Bai, B.; Zhang, X.; Yuan, X.; Wang, J. Tight Gas Sandstone Reservoirs in China: Characteristics and Recognition Criteria. J. Pet. Sci. Eng. 2012, 88, 82–91. [Google Scholar] [CrossRef]
  2. Han, X.; Feng, F.-P.; Zhang, X.-C.; Cao, J.; Zhang, J.; Suo, Y.; Yan, Y.; Yan, M.-S. An Unequal Fracturing Stage Spacing Optimization Model for Hydraulic Fracturing That Considers Cementing Interface Integrity. Pet. Sci. 2023, 20, 2165–2186. [Google Scholar] [CrossRef]
  3. Li, Y.; Peng, G.; Tang, J.; Zhang, J.; Zhao, W.; Liu, B.; Pan, Y. Thermo-Hydro-Mechanical Coupling Simulation for Fracture Propagation in CO2 Fracturing Based on Phase-Field Model. Energy 2023, 284, 128629. [Google Scholar] [CrossRef]
  4. Ma, T.; Wang, H.; Liu, Y.; Shi, Y.; Ranjith, P.G. Fracture-Initiation Pressure Model of Inclined Wells in Transversely Isotropic Formation with Anisotropic Tensile Strength. Int. J. Rock Mech. Min. Sci. 2022, 159, 105235. [Google Scholar] [CrossRef]
  5. Li, S.; Chen, Z.; Li, W.; Yan, T.; Bi, F.; Tong, Y. An FE Simulation of the Fracture Characteristics of Blunt Rock Indenter Under Static and Harmonic Dynamic Loadings Using Cohesive Elements. Rock Mech. Rock Eng. 2023, 56, 2935–2947. [Google Scholar] [CrossRef]
  6. Liu, Y.; Cui, J.; Wei, J.; Zhang, H.; Xu, X. Generating mechanism of self-excited oscillation pulsed super-critical carbon dioxide jet. J. China Coal Soc. 2022, 47, 2643–2655. [Google Scholar] [CrossRef]
  7. Al-Fatlawi, O.; Hossain, M.M.; Saeedi, A. A New Practical Method for Predicting Equivalent Drainage Area of Well in Tight Gas Reservoirs. In Proceedings of the SPE Europec Featured at EAGE Conference and Exhibition, Paris, France, 12–15 June 2017; p. D031S007R007. [Google Scholar]
  8. Al-Fatlawi, O.; Vimal Roy, A.R.; Hossain, M.M.; Kabir, A.H. Optimization of Infill Drilling in Whicher Range Field in Australia. In Proceedings of the SPE Kingdom of Saudi Arabia Annual Technical Symposium and Exhibition, Dammam, Saudi Arabia, 24–27 April 2017. [Google Scholar]
  9. Chen, P.; Jiang, S.; Chen, Y.; Zhang, K. Pressure Response and Production Performance of Volumetric Fracturing Horizontal Well in Shale Gas Reservoir Based on Boundary Element Method. Eng. Anal. Bound. Elem. 2018, 87, 66–77. [Google Scholar] [CrossRef]
  10. Mayerhofer, M.J.; Lolon, E.P.; Youngblood, J.E.; Heinze, J.R. Integration of Microseismic Fracture Mapping Results with Numerical Fracture Network Production Modeling in the Barnett Shale. In Proceedings of the SPE Annual Technical Conference and Exhibition, San Antonio, TX, USA, 24–27 September 2006; p. SPE-102103-MS. [Google Scholar]
  11. Sun, S.; Liang, S.; Liu, Y.; Liu, D.; Gao, M.; Tian, Y.; Wang, J. A Review on Shale Oil and Gas Characteristics and Molecular Dynamics Simulation for the Fluid Behavior in Shale Pore. J. Mol. Liq. 2023, 376, 121507. [Google Scholar] [CrossRef]
  12. Liu, Z.; Wang, S.; Zhao, H.; Wang, L.; Li, W.; Geng, Y.; Tao, S.; Zhang, G.; Chen, M. Effect of Random Natural Fractures on Hydraulic Fracture Propagation Geometry in Fractured Carbonate Rocks. Rock Mech. Rock Eng. 2018, 51, 491–511. [Google Scholar] [CrossRef]
  13. Li, Y.; Hubuqin; Wu, J.; Zhang, J.; Yang, H.; Zeng, B.; Xiao, Y.; Liu, J. Optimization Method of Oriented Perforation Parameters Improving Uneven Fractures Initiation for Horizontal Well Fracturing. Fuel 2023, 349, 128754. [Google Scholar] [CrossRef]
  14. Cong, Z.; Li, Y.; Liu, Y.; Xiao, Y. A New Method for Calculating the Direction of Fracture Propagation by Stress Numerical Search Based on the Displacement Discontinuity Method. Comput. Geotech. 2021, 140, 104482. [Google Scholar] [CrossRef]
  15. Fang, Y.; Wang, C.; Elsworth, D.; Ishibashi, T. Seismicity-Permeability Coupling in the Behavior of Gas Shales, CO2 Storage and Deep Geothermal Energy. Geomech. Geophys. Geo-Energy Geo-Resour. 2017, 3, 189–198. [Google Scholar] [CrossRef]
  16. Wanniarachchi, W.A.M.; Ranjith, P.G.; Perera, M.S.A.; Lashin, A.; Al Arifi, N.; Li, J.C. Current Opinions on Foam-Based Hydro-Fracturing in Deep Geological Reservoirs. Geomech. Geophys. Geo-Energy Geo-Resour. 2015, 1, 121–134. [Google Scholar] [CrossRef]
  17. Yasin, Q.; Du, Q.; Ismail, A.; Shaikh, A. A New Integrated Workflow for Improving Permeability Estimation in a Highly Heterogeneous Reservoir of Sawan Gas Field from Well Logs Data. Geomech. Geophys. Geo-Energy Geo-Resour. 2019, 5, 121–142. [Google Scholar] [CrossRef]
  18. Li, Y.; Long, M.; Tang, J.; Chen, M.; Fu, X. A Hydraulic Fracture Height Mathematical Model Considering the Influence of Plastic Region at Fracture Tip. Pet. Explor. Dev. 2020, 47, 184–195. [Google Scholar] [CrossRef]
  19. Tang, J.; Wu, K.; Zuo, L.; Xiao, L.; Sun, S.; Ehlig-Economides, C. Investigation of Rupture and Slip Mechanisms of Hydraulic Fractures in Multiple-Layered Formations. SPE J. 2019, 24, 2292–2307. [Google Scholar] [CrossRef]
  20. Zhang, F.; Zhu, H.; Zhou, H.; Guo, J.; Huang, B. Discrete-Element-Method/Computational-Fluid-Dynamics Coupling Simulation of Proppant Embedment and Fracture Conductivity After Hydraulic Fracturing. SPE J. 2017, 22, 632–644. [Google Scholar] [CrossRef]
  21. Bandara, K.M.A.S.; Ranjith, P.G.; Zheng, W.; Tannant, D.D.; De Silva, V.R.S.; Rathnaweera, T.D. Grain-Scale Analysis of Proppant Crushing and Embedment Using Calibrated Discrete Element Models. Acta Geotech. 2022, 17, 4837–4864. [Google Scholar] [CrossRef]
  22. Zhao, X.; Jin, F.; Liu, X.; Zhang, Z.; Cong, Z.; Li, Z.; Tang, J. Numerical Study of Fracture Dynamics in Different Shale Fabric Facies by Integrating Machine Learning and 3-D Lattice Method: A Case from Cangdong Sag, Bohai Bay Basin, China. J. Pet. Sci. Eng. 2022, 218, 110861. [Google Scholar] [CrossRef]
  23. Li, Y.; Jia, D.; Rui, Z.; Peng, J.; Fu, C.; Zhang, J. Evaluation Method of Rock Brittleness Based on Statistical Constitutive Relations for Rock Damage. J. Pet. Sci. Eng. 2017, 153, 123–132. [Google Scholar] [CrossRef]
  24. Ma, T.; Zhang, D.; Yang, Y.; Chen, Y. Machine learning model based collapse pressure prediction method for inclined wells. Nat. Gas Ind. 2023, 43, 119–131. [Google Scholar]
  25. Guo, T.; Zhang, S.; Gao, J.; Zhang, J.; Yu, H. Experimental Study of Fracture Permeability for Stimulated Reservoir Volume (SRV) in Shale Formation. Transp. Porous Media 2013, 98, 525–542. [Google Scholar] [CrossRef]
  26. Guo, T.; Zhang, S.; Wang, L.; Sui, W.; Wen, H. Optimization of Proppant Size for Frac Pack Completion Using a New Equipment. J. Pet. Sci. Eng. 2012, 96–97, 1–9. [Google Scholar] [CrossRef]
  27. Zhou, L.; Shen, Z.; Wang, J.; Li, H.; Lu, Y. Numerical Investigating the Effect of Nonuniform Proppant Distribution and Unpropped Fractures on Well Performance in a Tight Reservoir. J. Pet. Sci. Eng. 2019, 177, 634–649. [Google Scholar] [CrossRef]
  28. Zhou, L.; Hou, M.Z.; Gou, Y.; Li, M. Numerical Investigation of a Low-Efficient Hydraulic Fracturing Operation in a Tight Gas Reservoir in the North German Basin. J. Pet. Sci. Eng. 2014, 120, 119–129. [Google Scholar] [CrossRef]
  29. Chen, Q.; Huang, Z.; Huang, H.; Chen, Q.; Ling, X.; Xin, F.; Kong, X. An Experimental Study on the Impact of the Particle Size and Proportion of Composite Proppant on the Conductivity of Propped Fractures in Coalbed Methane Reservoirs Following Pulverized Coal Fines Infiltration. Processes 2023, 11, 2205. [Google Scholar] [CrossRef]
  30. Kern, L.R.; Perkins, T.K.; Wyant, R.E. The Mechanics of Sand Movement in Fracturing. J. Pet. Technol. 1959, 11, 55–57. [Google Scholar] [CrossRef]
  31. Xiao, H.; Li, Z.; He, S.; Lu, X.; Liu, P.; Li, J. Experimental Study on Proppant Diversion Transportation and Multi-Size Proppant Distribution in Complex Fracture Networks. J. Pet. Sci. Eng. 2021, 196, 107800. [Google Scholar] [CrossRef]
  32. Hou, T.; Zhang, S.; Ma, X.; Shao, J.; He, Y.; Lv, X.; Han, J. Experimental and Theoretical Study of Fracture Conductivity with Heterogeneous Proppant Placement. J. Nat. Gas Sci. Eng. 2017, 37, 449–461. [Google Scholar] [CrossRef]
  33. Guo, T.-K.; Luo, Z.-L.; Zhou, J.; Gong, Y.-Z.; Dai, C.-L.; Tang, J.; Yu, Y.; Xiao, B.; Niu, B.-L.; Ge, J.-J. Numerical Simulation on Proppant Migration and Placement within the Rough and Complex Fractures. Pet. Sci. 2022, 19, 2268–2283. [Google Scholar] [CrossRef]
  34. Shokir, E.M.E.-M.; Al-Quraishi, A.A. Experimental and Numerical Investigation of Proppant Placement in Hydraulic Fractures. Pet. Sci. Technol. 2009, 27, 1690–1703. [Google Scholar] [CrossRef]
  35. Wen, Q.; Wang, S.; Duan, X.; Li, Y.; Wang, F.; Jin, X. Experimental Investigation of Proppant Settling in Complex Hydraulic-Natural Fracture System in Shale Reservoirs. J. Nat. Gas Sci. Eng. 2016, 33, 70–80. [Google Scholar] [CrossRef]
  36. Zhao, J.; Zhao, X.; Zhao, J.; Cao, L.; Hu, Y.; Liu, X. Coupled Model for Simulating Proppant Distribution in Extending Fracture. Eng. Fract. Mech. 2021, 253, 107865. [Google Scholar] [CrossRef]
  37. Zhang, G.; Li, M.; Gutierrez, M. Simulation of the Transport and Placement of Multi-Sized Proppant in Hydraulic Fractures Using a Coupled CFD-DEM Approach. Adv. Powder Technol. 2017, 28, 1704–1718. [Google Scholar] [CrossRef]
  38. Xu, J.; Gao, R.; Yang, L.; Liu, Z.; Ding, Y.; Wang, Z.; Mo, S. A 3D Tortuous Fracture Network Construction Approach to Analyze Proppant Distribution in Post-Fractured Shale. J. Pet. Sci. Eng. 2022, 208, 109676. [Google Scholar] [CrossRef]
  39. Wang, F.; Xiao, Z.; Liu, X.; Ren, J.; Xing, T.; Li, Z.; Li, X.; Chen, Y. Strategic Design of Cellulose Nanofibers@zeolitic Imidazolate Frameworks Derived Mesoporous Carbon-Supported Nanoscale CoFe2O4/CoFe Hybrid Composition as Trifunctional Electrocatalyst for Zn-Air Battery and Self-Powered Overall Water-Splitting. J. Power Sources 2022, 521, 230925. [Google Scholar] [CrossRef]
  40. Li, Q.; Wang, F.; Wang, Y.; Forson, K.; Cao, L.; Zhang, C.; Zhou, C.; Zhao, B.; Chen, J. Experimental Investigation on the High-Pressure Sand Suspension and Adsorption Capacity of Guar Gum Fracturing Fluid in Low-Permeability Shale Reservoirs: Factor Analysis and Mechanism Disclosure. Environ. Sci. Pollut. Res. 2022, 29, 53050–53062. [Google Scholar] [CrossRef] [PubMed]
  41. Li, Q.; Han, Y.; Liu, X.; Ansari, U.; Cheng, Y.; Yan, C. Hydrate as a By-Product in CO2 Leakage during the Long-Term Sub-Seabed Sequestration and Its Role in Preventing Further Leakage. Environ. Sci. Pollut. Res. 2022, 29, 77737–77754. [Google Scholar] [CrossRef]
  42. Ranjith, P.G.; Liu, Y.; Wei, J.; Liu, X. Effect of Abrasive Mass Flow on the Abrasive Acceleration and Erosion Rates of Abrasive Gas Jets. Rock Mech. Rock Eng. 2019, 52, 3085–3102. [Google Scholar] [CrossRef]
Figure 1. Visual fracture proppant migration and distribution experiment system.
Processes 11 02921 g001
Figure 2. Single- and multi-branch-fracture experimental system.
Processes 11 02921 g002
Figure 3. Sandbank morphology for a single fracture at different injection rates (particle size: 30–50 mesh).
Processes 11 02921 g003
Figure 4. Sandbank morphology data for a single fracture at different injection rates (particle size: 30–50 mesh).
Processes 11 02921 g004
Figure 5. Sandbank morphology at different injection rates (particle size: 40–70 and 70–140 mesh).
Processes 11 02921 g005
Figure 6. Sandbank morphology data for a single fracture under different particle sizes (injection rate Q = 3.0 m3/h).
Processes 11 02921 g006
Figure 7. Sandbank morphology at different injection rates (particle size: 40–70 mesh).
Processes 11 02921 g007
Figure 8. Sandbank morphology data at different injection rates (particle size: 40–70 mesh).
Processes 11 02921 g008
Figure 9. Sandbank morphology data under different particle sizes (injection rate Q = 3.0 m3/h).
Processes 11 02921 g009
Table 1. Experimental design.
Test NumberCrack TypeParticle Size
(mesh)
Injection Rate (m3/h)Equivalent Field Injection Rate (m3/min)Sand Ratio (%)
SM-30/50-3Single fracture30–503.08.020
SM-30/50-55.010.020
SM-30/50-77.012.020
SM-40/70-340–703.08.020
SM-40/70-55.010.020
SM-40/70-77.012.020
SM-70/140-370–1403.08.020
SM-70/140-55.010.020
SM-70/140-77.012.020
MM-30/50-3Branching fractures30–503.08.020
MM-30/50-55.010.020
MM-30/50-77.012.020
MM-40/70-340–703.08.020
MM-40/70-55.010.020
MM-40/70-77.012.020
MM-70/140-370–1403.08.020
MM-70/140-55.010.020
MM-70/140-77.012.020
Disclaimer/Publisher’s Note: The statements, opinions and data contained in all publications are solely those of the individual author(s) and contributor(s) and not of MDPI and/or the editor(s). MDPI and/or the editor(s) disclaim responsibility for any injury to people or property resulting from any ideas, methods, instructions or products referred to in the content.

