Article

Complex Flow Mechanism and Pressurization Effect of Liquid Nitrogen Jet Fracturing Formation Perforation Tunnel

1
State Key Laboratory for Geomechanics and Deep Underground Engineering, China University of Mining and Technology, Xuzhou 221116, China
2
School of Mechanics and Civil Engineering, China University of Mining and Technology, Xuzhou 221116, China
3
Carbon Neutrality Institute, China University of Mining and Technology, Xuzhou 221116, China
*
Author to whom correspondence should be addressed.
Processes 2023, 11(10), 2878; https://doi.org/10.3390/pr11102878
Submission received: 1 September 2023 / Revised: 20 September 2023 / Accepted: 26 September 2023 / Published: 29 September 2023

Abstract

:
As an anhydrous fracturing method, liquid nitrogen jet fracturing technology is expected to become an efficient development method for shale gas resources. In order to explore the influence of the pressurization effect in the liquid nitrogen jet channel, the flow field in the perforation tunnel during the liquid nitrogen jet fracturing process was simulated by computational fluid dynamics, and the complex flow mechanism of liquid nitrogen in the perforation tunnel was analyzed. The pressurization effect of liquid nitrogen jet and water jet fracturing was compared, and the influence of various parameters on the pressurization effect of liquid nitrogen jet fracturing was studied. The research results indicate that under the same conditions, liquid nitrogen jets have a pressurization effect comparable to water jets, and the difference between the pressurization values of the liquid nitrogen jet and the water jet in the perforation tunnel is not more than 0.4 MPa under different nozzle pressure drop conditions. The larger the nozzle pressure drop and nozzle diameter, the greater the pressure increase value in the perforation tunnel of liquid nitrogen jet fracturing, which decreases with the increase in casing hole diameter. Further analysis shows that the pressurization effect is most affected by the two parameters of casing hole diameter and nozzle diameter. The essential reason for its influence on the pressurization value is the squeezing effect of the jet on the perforation tunnel fluid and the sealing effect of the shrinking part of the perforation tunnel on the backflow. The ambient pressure, the temperature of liquid nitrogen, and the diameter of the wellbore have no obvious effect on the pressurization effect. Therefore, through the reasonable combination of casing hole diameter and nozzle diameter, the sealing effect of the contraction part of the perforation tunnel on the fluid and the squeezing effect on the fluid in the perforation tunnel will be affected, which will significantly improve the pressurization effect of the liquid nitrogen jet in the perforation tunnel.

1. Introduction

Since entering the new century, a series of unconventional oil and gas resources such as coalbed methane and shale gas have gradually replaced traditional energy [1], the recoverable resources of shale gas, tight gas, and tight (shale) oil, respectively, account for 4.8%, 5.7%, and 9.7% of the global recoverable resources [2]. At the forefront of the natural gas extraction industry, Malozyomov et al. [3] summarized methods for improving oil and gas recovery in conventional and unconventional reservoirs and introduced the advantages and disadvantages of EOR. Stratiev et al. [4] pioneered the production model for refinery fuel gas, liquefied petroleum gas, propylene, and other products. However, the newly proved unconventional oil and gas reserves are mostly low-permeability reserves, which require fracturing to bring them into production [5,6]. By establishing a two-dimensional hydraulic jet flow field physical model, Sheng et al. [7] concluded that nozzle pressure drop and inlet area ratio are the two main factors affecting jet pressurization in the perforation tunnel, while annulus confining pressure has no influence on jet pressurization in the perforation tunnel. Qu et al. [8] found that the sealing effect of the casing hole can greatly increase the pressure of the perforation tunnel, which has a great influence on the pressurization of the perforation tunnel. Through simulation calculations, it is concluded that there is strong independence between high-speed jets and that the spatial position and number of nozzles will not affect the pressure in the perforation tunnel [9]. The pressure generated by the hydraulic jet in different-shaped perforation tunnels is the same. Hydraulic fracturing technology is an important means of extracting unconventional oil and gas reservoirs worldwide [10], but it also faces many problems such as high consumption of water resources, environmental pollution, and clay expansion [11,12,13]. In the study of anhydrous fracturing, Cheng et al. [14] simulated the flow field in the perforation tunnel during supercritical CO2 jet fracturing and concluded that supercritical CO2 jet fracturing has a stronger perforation tunnel pressurization effect than hydraulic jet fracturing under the same conditions. Li et al. [15] established a thermal–fluid–solid coupling rock stress calculation model based on the synergistic rock breaking mechanism of supercritical CO2 jet pressure and temperature difference. They conducted a comparative study on the flow field and rock stress of supercritical CO2, water, and nitrogen jet rock breaking under different spray distances, revealing the thermal fluid–solid coupling mechanism of supercritical CO2 jet rock breaking.
Aiming at the fracturing characteristics of liquefied petroleum gas in shale reservoirs, Wang et al. [16] established a fracture network expansion model for liquefied petroleum gas fracturing and studied the fracture network expansion pattern of liquefied petroleum gas fracturing in shale reservoirs. Compared with anhydrous fracturing methods such as liquefied petroleum gas and CO2, nitrogen has stable performance, a wide source, and a higher construction safety factor. It is more suitable as an alternative fluid for water-based fracturing fluid and has been widely concerned and applied in the field of anhydrous fracturing [17].
Liquid nitrogen is a colorless, extremely low-temperature, highly inert liquid; its density and viscosity are lower than those of water. Under normal atmospheric pressure, the boiling point of nitrogen is −196.56 °C. The thermal stress caused by the impact of a liquid nitrogen jet significantly deteriorates the physical and mechanical properties of rocks, greatly reducing their critical crushing pressure. Wu et al. [18] found that under the same pressure conditions, the rock-breaking volume of a liquid nitrogen jet is 18.34 times that of a water jet on average. Zhang et al. [19] conducted numerical simulation research on the impact of a liquid nitrogen jet on rocks, focusing on the distribution characteristics of thermal stress in rocks under the impact of a liquid nitrogen jet. It was found that the thermal stress formed by a liquid nitrogen jet was mainly in the form of tensile stress, and the maximum tensile stress scale could be tens of MPa, which was much higher than the tensile strength of rock. The thermal fluid solid multi-field coupling model of liquid nitrogen jet impacting high-temperature rocks was established by Wu et al. [20], further analyzing the coupling effect of jet impact and thermal stress and comparing the mechanical response differences of rock under water jet and liquid nitrogen jet impact. The research results indicate that under the impact of a liquid nitrogen jet, the rock exhibits a tensile shear mixed failure mode, and the tensile and shear stresses on the rock surface are significantly higher than those of the water jet. As the initial temperature of the rock increases, the stress amplitude on the rock surface under liquid nitrogen impact is higher.
Cai et al. [21] evaluated the flow field structure of liquid nitrogen jet by establishing a two-dimensional CFD model. In order to evaluate the flow field structure of a liquid nitrogen jet, Cai Chengzheng et al. established a two-dimensional CFD model [22]. They established a computational fluid dynamics model by coupling the physical characteristic equations of nitrogen and simulated the flow field of a liquid nitrogen jet. The CFD method was used to simulate the flow field in the cavity at different times, and then the pressure distribution and transient temperature were analyzed. Based on the cavity pressure distribution, the pressurization effect of a liquid nitrogen jet in the cavity was evaluated, and the pressurization ability of liquid nitrogen jet was determined [23]. Through CFD simulation and laboratory experimental research, it concluded that under the same nozzle pressure drop conditions, a liquid nitrogen jet has better abrasive particle acceleration performance and intra-cavity pressurization performance than a water jet. Liquid nitrogen jets and water jets have a considerable impact effect. Liquid nitrogen, due to low-temperature cooling, water freezing, and nitrogen evaporation, can have additional fracturing effects on rocks [24].
Liquid nitrogen fracturing is an efficient anhydrous fracturing method. On the one hand, low-temperature fracturing of liquid nitrogen can significantly degrade the mechanical strength of rock and reduce the initiation pressure of reservoirs. On the other hand, liquid nitrogen can induce thermal fractures in rocks, which expand under the combined action of high pressure in the geological environment and the low temperature of liquid nitrogen, increasing the connectivity and complexity of reservoirs. The experimental results show that liquid nitrogen can significantly reduce the fracture pressure of rock [25,26], and the maximum fracture pressure of rock is reduced by 40%. According to the numerical modeling results, the thermal stress formed by liquid nitrogen fracturing changes the stress distribution around the well and induces primary cracks around the well, which is the main reason for liquid nitrogen to reduce reservoir fracture pressure [17].
In order to explore the decisive factors of the pressurization effect in the liquid nitrogen jet channel, the computational fluid dynamics method is used to simulate the flow field in the perforation tunnel during the liquid nitrogen fracturing process. The simulation results of the velocity field, pressure field, density, and viscosity of the liquid nitrogen jet in the perforation tunnel are obtained, and the key reasons for the pressurization are analyzed. This paper reveals the influence of various parameters on the pressurization effect of liquid nitrogen jet fracturing, obtains the pressurization contribution of different conditions to liquid nitrogen jet, makes a comparative analysis of different effects, and obtains the main influencing conditions, which provides a theoretical basis for the subsequent research and application of liquid nitrogen fracturing reservoirs.

2. Numerical Model and Solution Method

2.1. Geometric Model and Spatial Discretization

According to the liquid nitrogen jet injection process, a three-dimensional schematic diagram of the liquid nitrogen jet flow field in the wellbore-formation perforation tunnel is established, as shown in Figure 1. This model includes a jet tool, a wellbore, and the internal space of the formation perforation tunnel. The jet tool can be installed with nozzles of different diameters according to the actual needs. The formation perforation tunnel is the common spindle shape in hydraulic perforation [27]. The formation pores are distributed symmetrically; that is, the pores are distributed symmetrically along the wellbore axis, and the pore axis is perpendicular to the wellbore axis. In the model, the number of perforation tunnels is four, and the inlet of the perforation tunnel is arranged at the center of the end of the wellbore. The inlet of the perforation tunnel is connected with the wellbore. During the process of liquid nitrogen jet injection, the perforation tunnel and the fluid in the wellbore can produce mass exchange.
The geometric model is spatially discretized, as shown in Figure 2. A structured tetrahedral mesh is used to enhance the calculation accuracy and convergence. Considering the complexity of the flow field formed by the jet fluid at the entrance of the perforation tunnel, the local refinement of the inlet diameter shrinkage of the perforation tunnel is carried out to better present the flow field characteristics.
When designing the geometric model, the wellbore has casing completion, and the jet tool is simplified. Because the main focus of research is the motion state of the fluid flow field in the formation perforation tunnel and its nearby wellbore, the three-dimensional geometric model of the liquid nitrogen jet flow field around the formation perforation tunnel is mainly established. The specific size of the model is shown in Table 1.

2.2. Control Equations

The main medium of a high pressure jet is liquid nitrogen. In the high-temperature and high-pressure environment at the bottom of the well, liquid nitrogen is very susceptible to temperature and pressure and cannot be considered an incompressible fluid. For bottom-hole compressible flow, the continuity equation can be expressed as
( ρ u i ) x i = 0
where ρ (kg/m3) is the fluid density;  u i  (m/s) is the velocity tensor. Liquid nitrogen is not an ideal fluid, and in this study, the influence of gravity is not considered. The momentum equation is described by the Navier-Stokes equation, namely
ρ u i u j x j = p x i + τ i j x j + ρ g i + F i
where p (Pa) is the pressure;  g i  (m/s2) is the acceleration of gravity (gi = 0);  F i  (N/m3) is the physical strength;  τ i j  is the deviatoric stress tensor. It is difficult to solve the Navier-Stokes equations directly. The time-averaged Navier-Stokes equations are usually used to solve the Navier-Stokes equations, namely [28,29]
( ρ u i u j ) x j = p x i + x j μ u i x j + u j x i 2 3 u k x k δ i j + x j ( ρ u i ' u j ' ¯ ) + ρ g i + F i
where  μ  ( Pa s ) is the dynamic viscosity;  ρ u i ' u j ' ¯  is the Reynolds stress, which is solved by the following equation:
ρ u i ' u j ' ¯ = μ T u i x j + u j x i 2 3   ( ρ k + μ T u k x k ) δ i j
μ T = ρ C μ k 2 ε
where k is the turbulent kinetic energy;  δ i j  is the Kronecker symbol;  C μ  is the empirical constant;  ε ( J / kg s )  is the turbulent dissipation rate. In the simulation of a liquid nitrogen jet, the standard k-ε model is used in this study.
t ρ k + x i ρ k u i = x j μ + μ t σ k k x j + G k + G b ρ ε Y M + S k
t ρ ε + x i ρ ε u i = x j μ + μ t σ ε ε x j + C 1 ε ε k G k + C 3 ε G b C 2 ε ρ ε 2 k + S ε
Among them,  C 1 ε C 2 ε , and  C 3 ε  are model constants;  σ k  and  σ ε  are the turbulent Prandtl numbers of k and ε, respectively;  G k G b , and  Y M  are the velocity gradient turbulent kinetic energy term, the buoyancy turbulent kinetic energy term, and the pulsation expansion term, respectively.  G k G b , and  Y M  can be obtained by the following equation
G k = ρ u i ' u j ' ¯ u i x i
G b = 1 ρ ρ T p g i μ T Pr T x i
Y M = 2 ρ ε k a 2
where Pr ( - ) is the Prandtl number; T (K) is temperature;  a  (m/s) is the sound velocity. The energy equation is described by the following equations
x i u i ρ E + p = x j k e f f T x j + u i τ i j + Q
where E (J/kg) is the total energy of the fluid micromass;  Q  (W/m3) is the heat source term in the fluid micromass;  k e f f  is the effective thermal conductivity, which can be obtained by the following equation
k e f f = λ + c p μ T Pr
where  λ  (W/( m K )) is the thermal conductivity;  c p  (J/( kg K )) is the specific heat capacity at constant pressure.
For the NIST real gas model, the density and isobaric heat capacity of nitrogen can be represented by the model of Span et al. [30], which is clear in the reduced Helmholtz energy. Helmholtz energy is a function of density (ρ) and temperature (T), and the reduced Helmholtz energy is a function of density (δ) and temperature (τ), namely
a δ , τ = a ρ , T / R T = a 0 δ , τ + a r δ , τ
where α (ρ, T) and α (δ, τ) are Helmholtz energy and reduced Helmholtz energy; α0(δ, τ) is the ideal gas component, and αr(δ, τ) is the residual part. R is a gas constant equal to 0.2968 kJ/(kg∙K); δ = ρ/ρc, τ = Tc/T; ρ and ρc are density and critical density, respectively; T and Tc are temperature and critical temperature, respectively. The critical temperature of liquid nitrogen is 126.492 K, and its critical density is 313.30 kg/m3.
According to the Helmholtz energy theory, the expressions of density and isobaric heat:
p δ , τ = ρ R T 1 + δ a r δ τ
C p δ , τ R = τ 2 a τ τ 0 + a τ τ r + 1 + δ a δ r δ τ a δ τ r 2 1 + 2 δ a δ r + δ 2 a δ δ r
In addition, the pure fluid viscosity and thermal conductivity models of Lemmon and Jacobsen are used to evaluate the viscosity and thermal conductivity [31]. The viscosity equation is as follows:
μ ρ , T = μ 0 T + μ R τ , δ
where μ0 (T) is the viscosity of the dilute gas, which depends on the temperature (T), μR (τ, δ) is the residual part.
According to Lemmon and Jacobsen’s model, the thermal conductivity of nitrogen is a function of temperature and density:
λ ρ , T = λ 0 T + λ R τ , δ + λ c τ , δ
where λ0 (T) is the thermal conductivity of dilute gas; λR (τ, δ) is the residual part; λc (τ, δ) is the critical enhancement of thermal conductivity.

2.3. Boundary Conditions and Calculation Process

Liquid nitrogen is sprayed by the nozzle through the jet tool, and a high-pressure and high-speed jet is formed at the nozzle outlet to enter the formation perforation tunnel through the annulus between the jet tool and the wellbore. The jet fluid in the perforation tunnel is squeezed and then forms a backflow into the annulus between the jet tool and the wellbore. Therefore, setting the fluid inside the jet tool as the boundary condition for the pressure inlet, the pressure value is determined by the injection pressure of liquid nitrogen. The pressure outlet is set as the annulus area between the jet tool and the wellbore, with a pressure value equal to the annulus pressure.
The computational fluid dynamics solver ANSYS FLUENT, based on the finite volume method, was used to simulate the liquid nitrogen jet. The initial and boundary condition parameters of the fluid domain are shown in Table 2. The liquid nitrogen jet temperature is set to 100 K, the inlet of the liquid nitrogen jet is 40 MPa, and the annular pressure is 20 MPa. Due to the strong compressibility of liquid nitrogen itself, the physical properties of liquid nitrogen undergo drastic changes with temperature and pressure during the impact heat transfer process. In this paper, the NIST real gas model is used to calculate the transport properties of nitrogen, and the thermal properties of liquid nitrogen in the fluid domain are updated in real time according to different temperature and pressure conditions.
The numerical-model-solving process is shown in Figure 3. First, the parameters are initialized. Secondly, the pressure and velocity values are obtained by solving the mass equation and the momentum equation simultaneously. The solution to the momentum equation is to solve the Navier-Stokes equation. In this article, the Navier-Stokes equations are simplified by using the standard k-ε turbulence equation. Then, the temperature data are obtained by solving the energy equation. The physical parameters of liquid nitrogen were calculated using the new temperature data, including density, viscosity, specific heat capacity at constant pressure, and thermal conductivity. The mass equation, momentum equation, and energy equation are solved repeatedly by using the new liquid nitrogen physical parameters to check the convergence of the calculation results of each parameter. When the calculation error is less than the set error, the calculation ends.

3. Perforation Tunnel Pressurization Phenomenon and Reason Analysis

3.1. Flow Law of Nozzle-Annulus-Perforation Tunnel

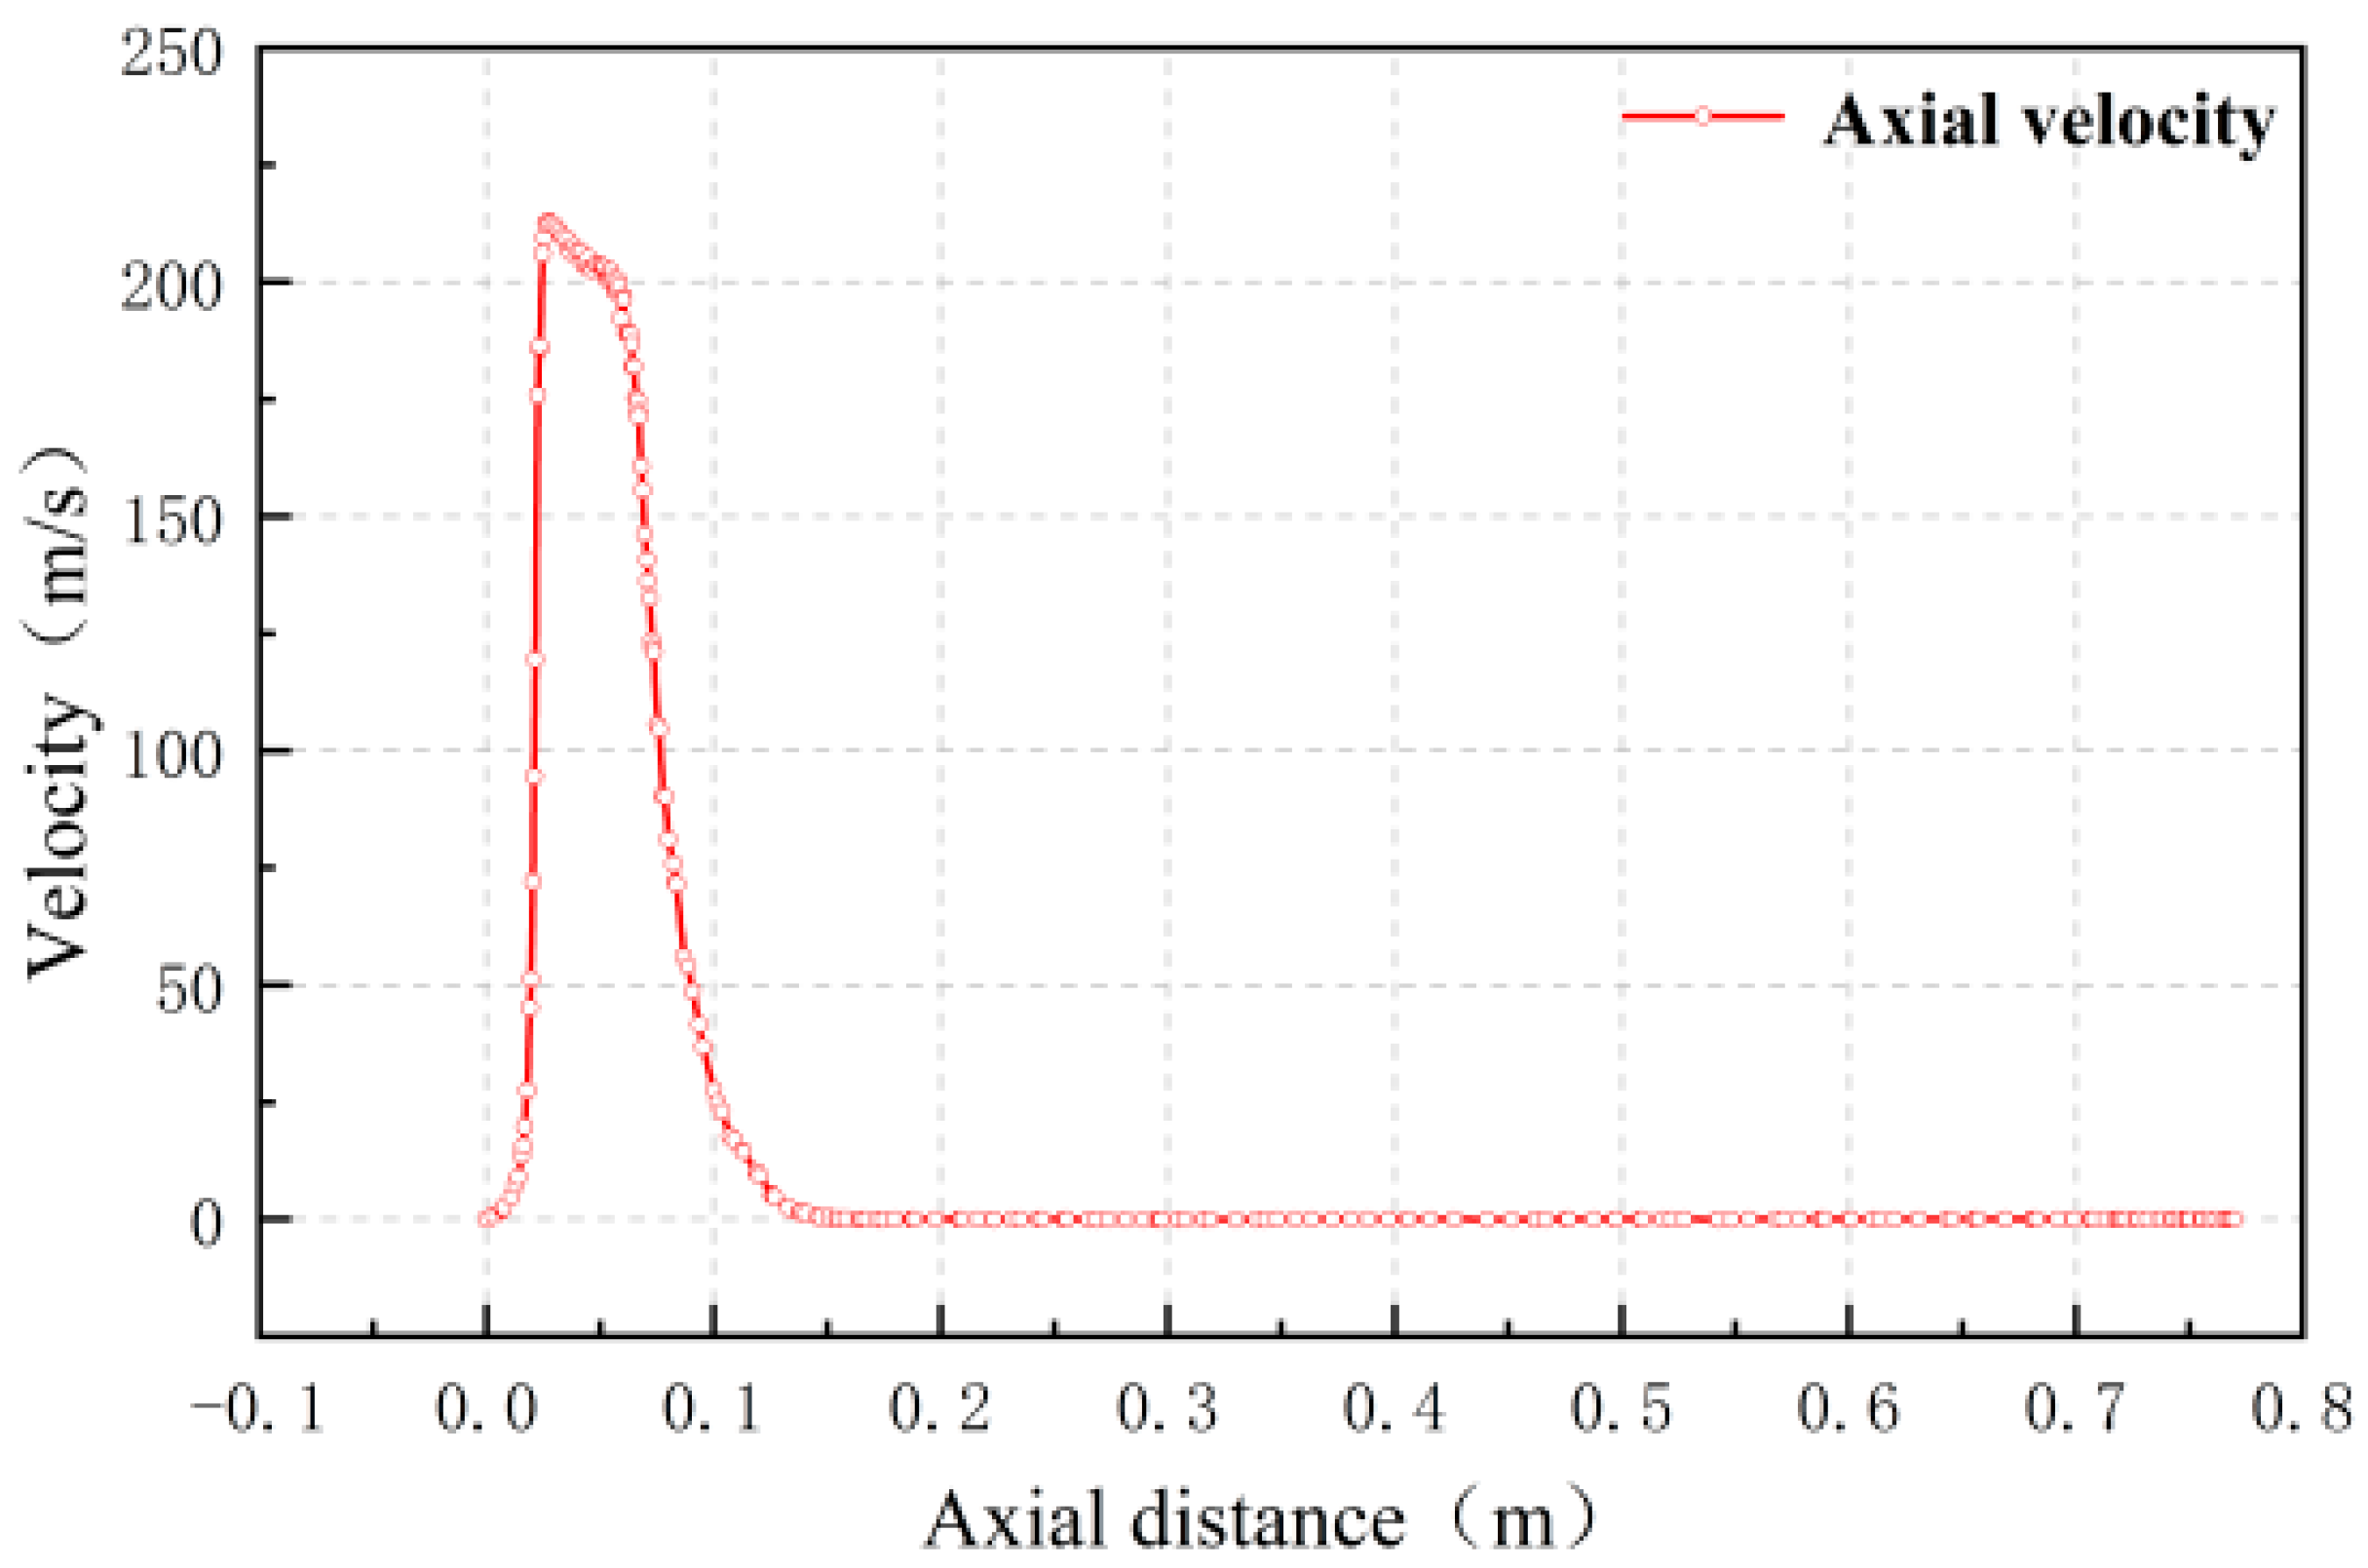
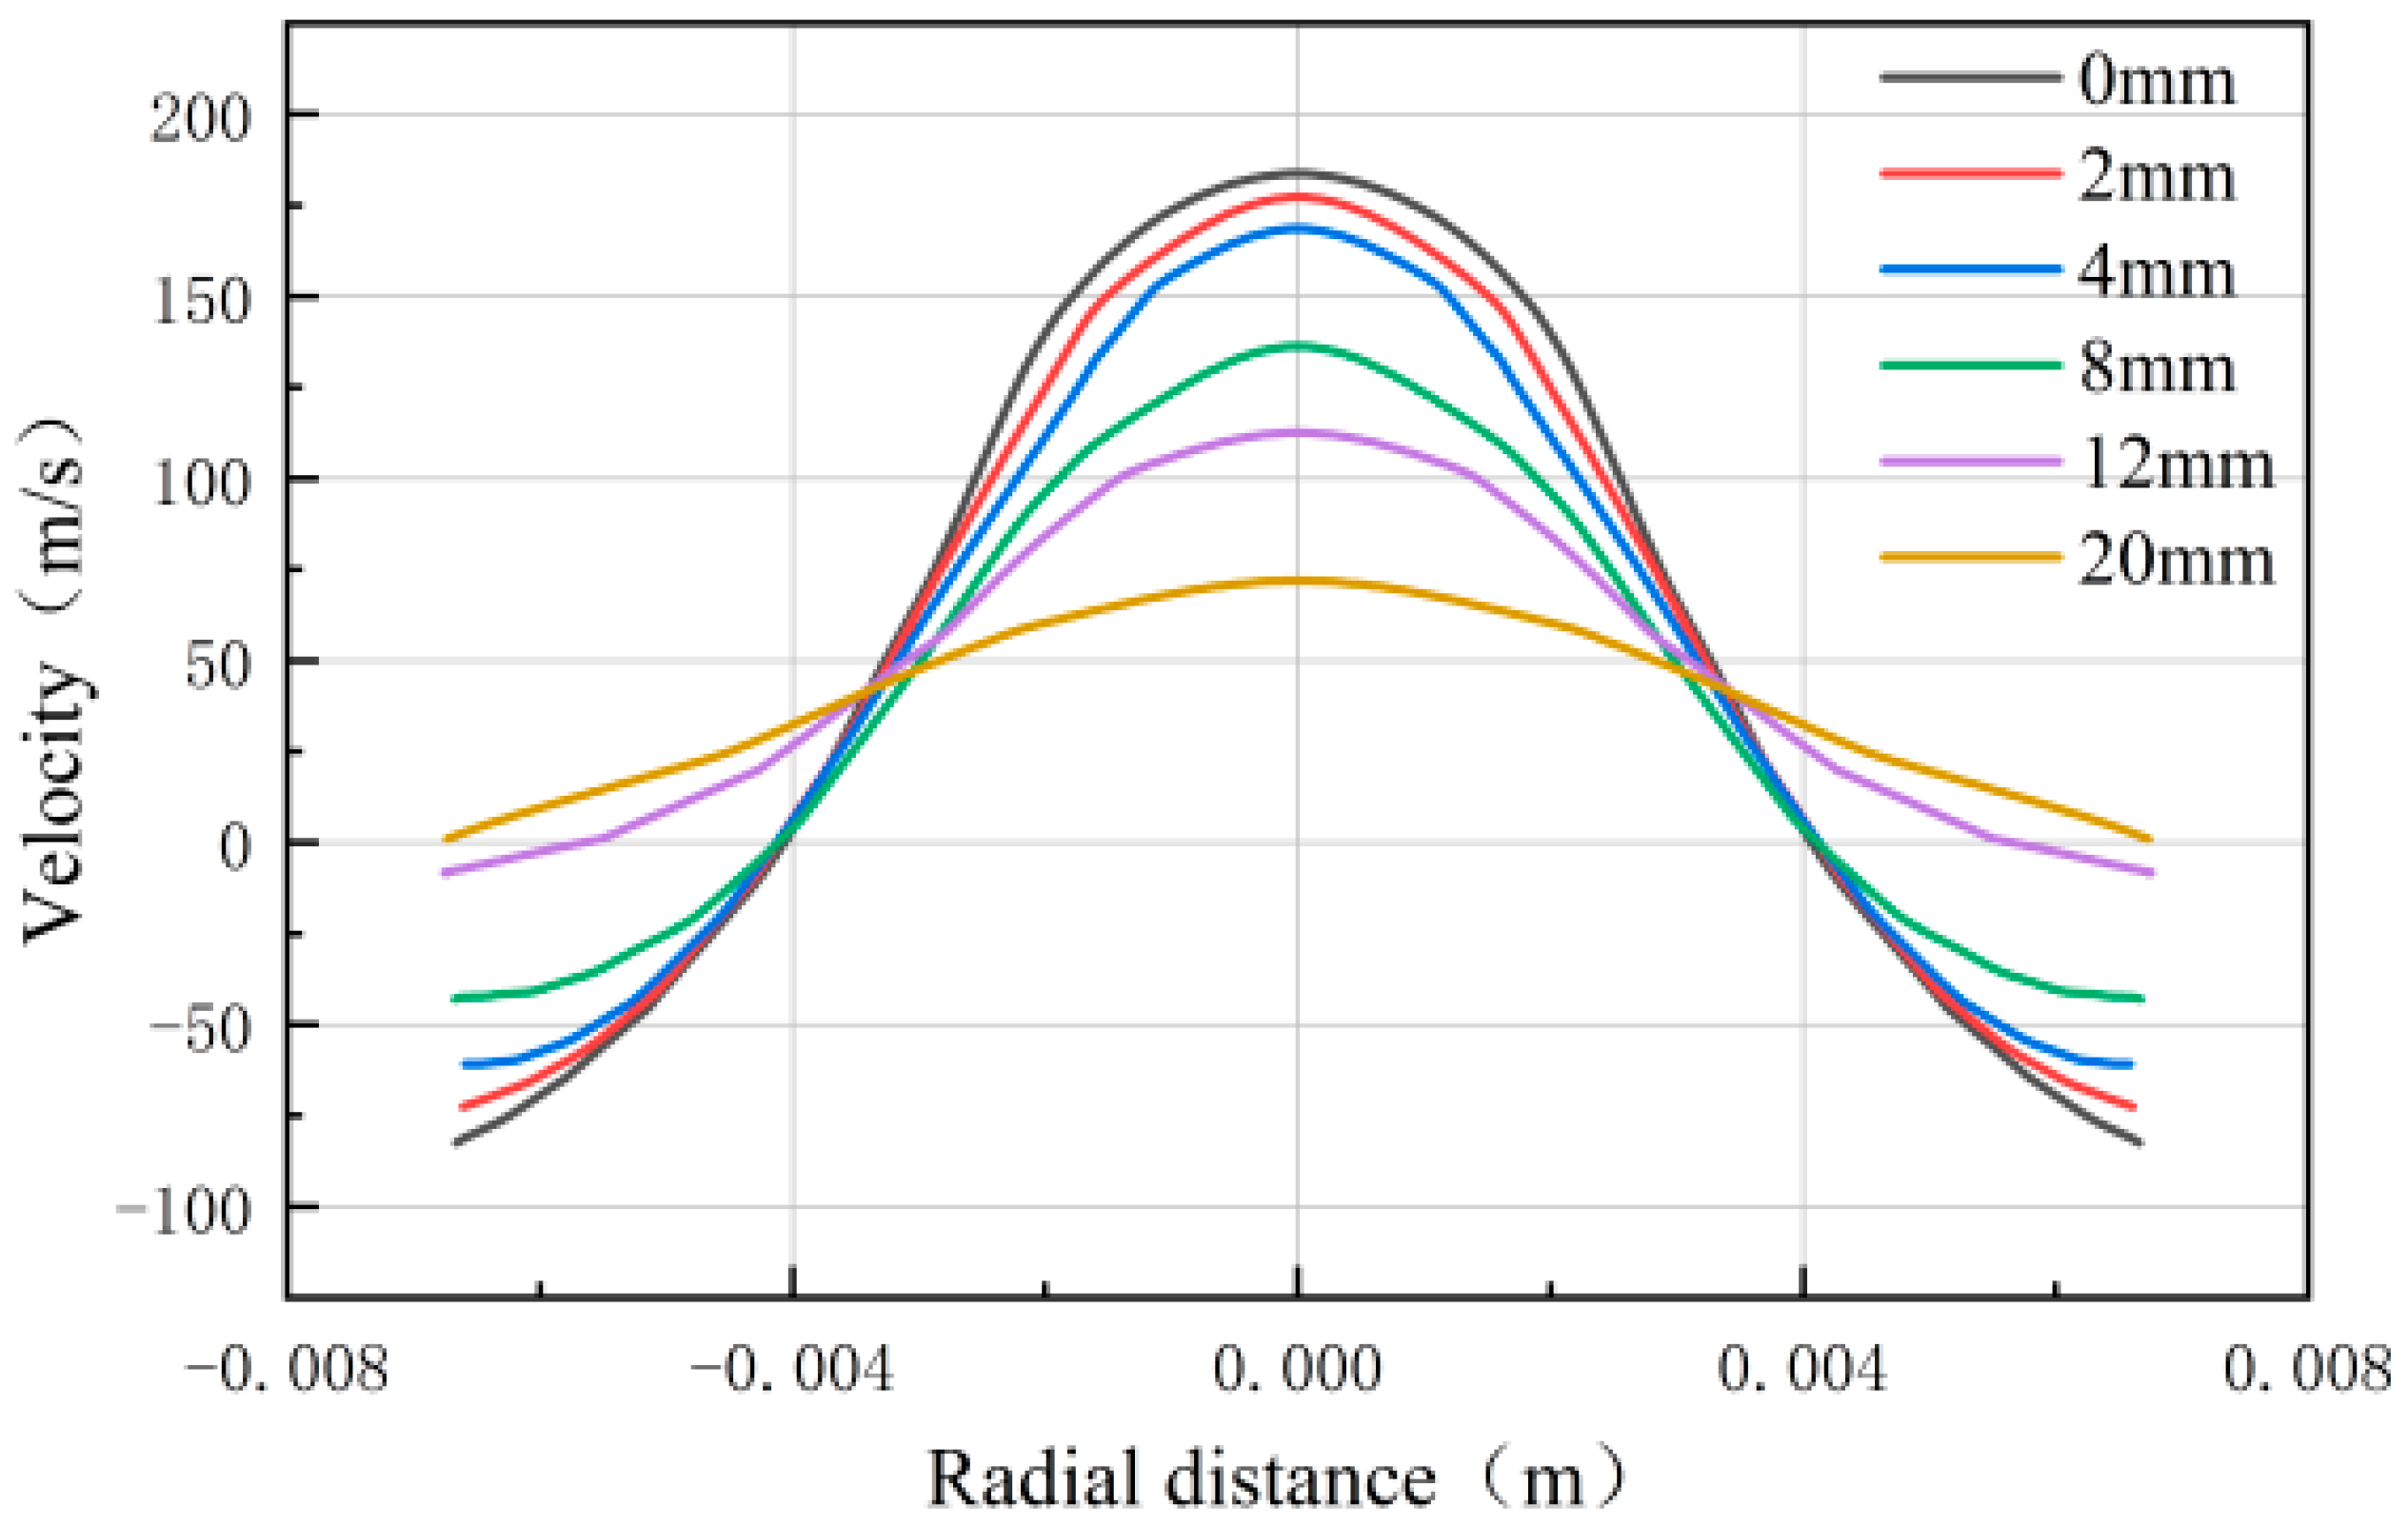
3.1.1. Velocity Field

Velocity, as one of the key parameters to characterize the jet flow field, is also an important indicator for evaluating the energy of the jet fluid. In general, the higher the jet velocity, the higher the energy it carries and the higher the pressure formed in the perforation tunnel. At the same time, the stronger the ability to block the reverse flow of fluid inside the perforation tunnel, the more the fluid inside the perforation tunnel can form a higher pressurization effect, which makes it easier to achieve the purpose of rock breaking and fracturing. Figure 4 is the liquid nitrogen jet velocity nephogram generated by the nozzle with a diameter of 6 mm. The liquid nitrogen jet is ejected from the nozzle outlet to form a high-pressure jet, and the maximum velocity can reach 217 m/s. The high-pressure jet enters the perforation tunnel through the annulus, then decelerates gradually, and finally stagnates inside the perforation tunnel. The high-pressure jet from the nozzle continuously impacts the fluid that previously entered the perforation tunnel, and the internal fluid is gradually pressurized, causing backflow, which flows from the perforation tunnel inlet into the annulus area and finally forms a dynamic balance of pressurization inside the perforation tunnel.
During the flow of the jet in the nozzle, its velocity increases rapidly over a very short distance and then decreases slowly. The velocity remains relatively stable in the area near the nozzle outlet. The velocity of the jet will decay rapidly after leaving the nozzle, and it will stagnate at about 0.03 m inside the perforation tunnel, as shown in Figure 5. After 0.03 m from the inlet of the perforation tunnel to the inside of the perforation tunnel, the fluid velocity will maintain a small range below the zero line to reach the dynamic balance of the flow field.
The velocity distribution from the inlet of the perforation tunnel to the internal horizontal radial direction was observed at different distances along the axis direction. As shown in Figure 6, the jet velocity gradually decreases along the axis direction, and the axial velocity after the jet enters the perforation tunnel presents a symmetrical distribution of positive values in the middle and negative values on both sides. This is the phenomenon in which the jet enters the perforation tunnel and the fluid in the perforation tunnel returns out of the perforation tunnel. It can be seen that the fluid enters and exits the perforation tunnel to form a dynamic balance. As the jet gradually penetrates into the perforation tunnel, the radial velocity distribution curve gradually becomes gentle. For example, the observation line 20 mm away from the perforation tunnel inlet in the axial direction is inside the perforation tunnel, where the inlet and outlet velocities of the jet are much lower than those at the perforation tunnel entrance (0 mm observation line).

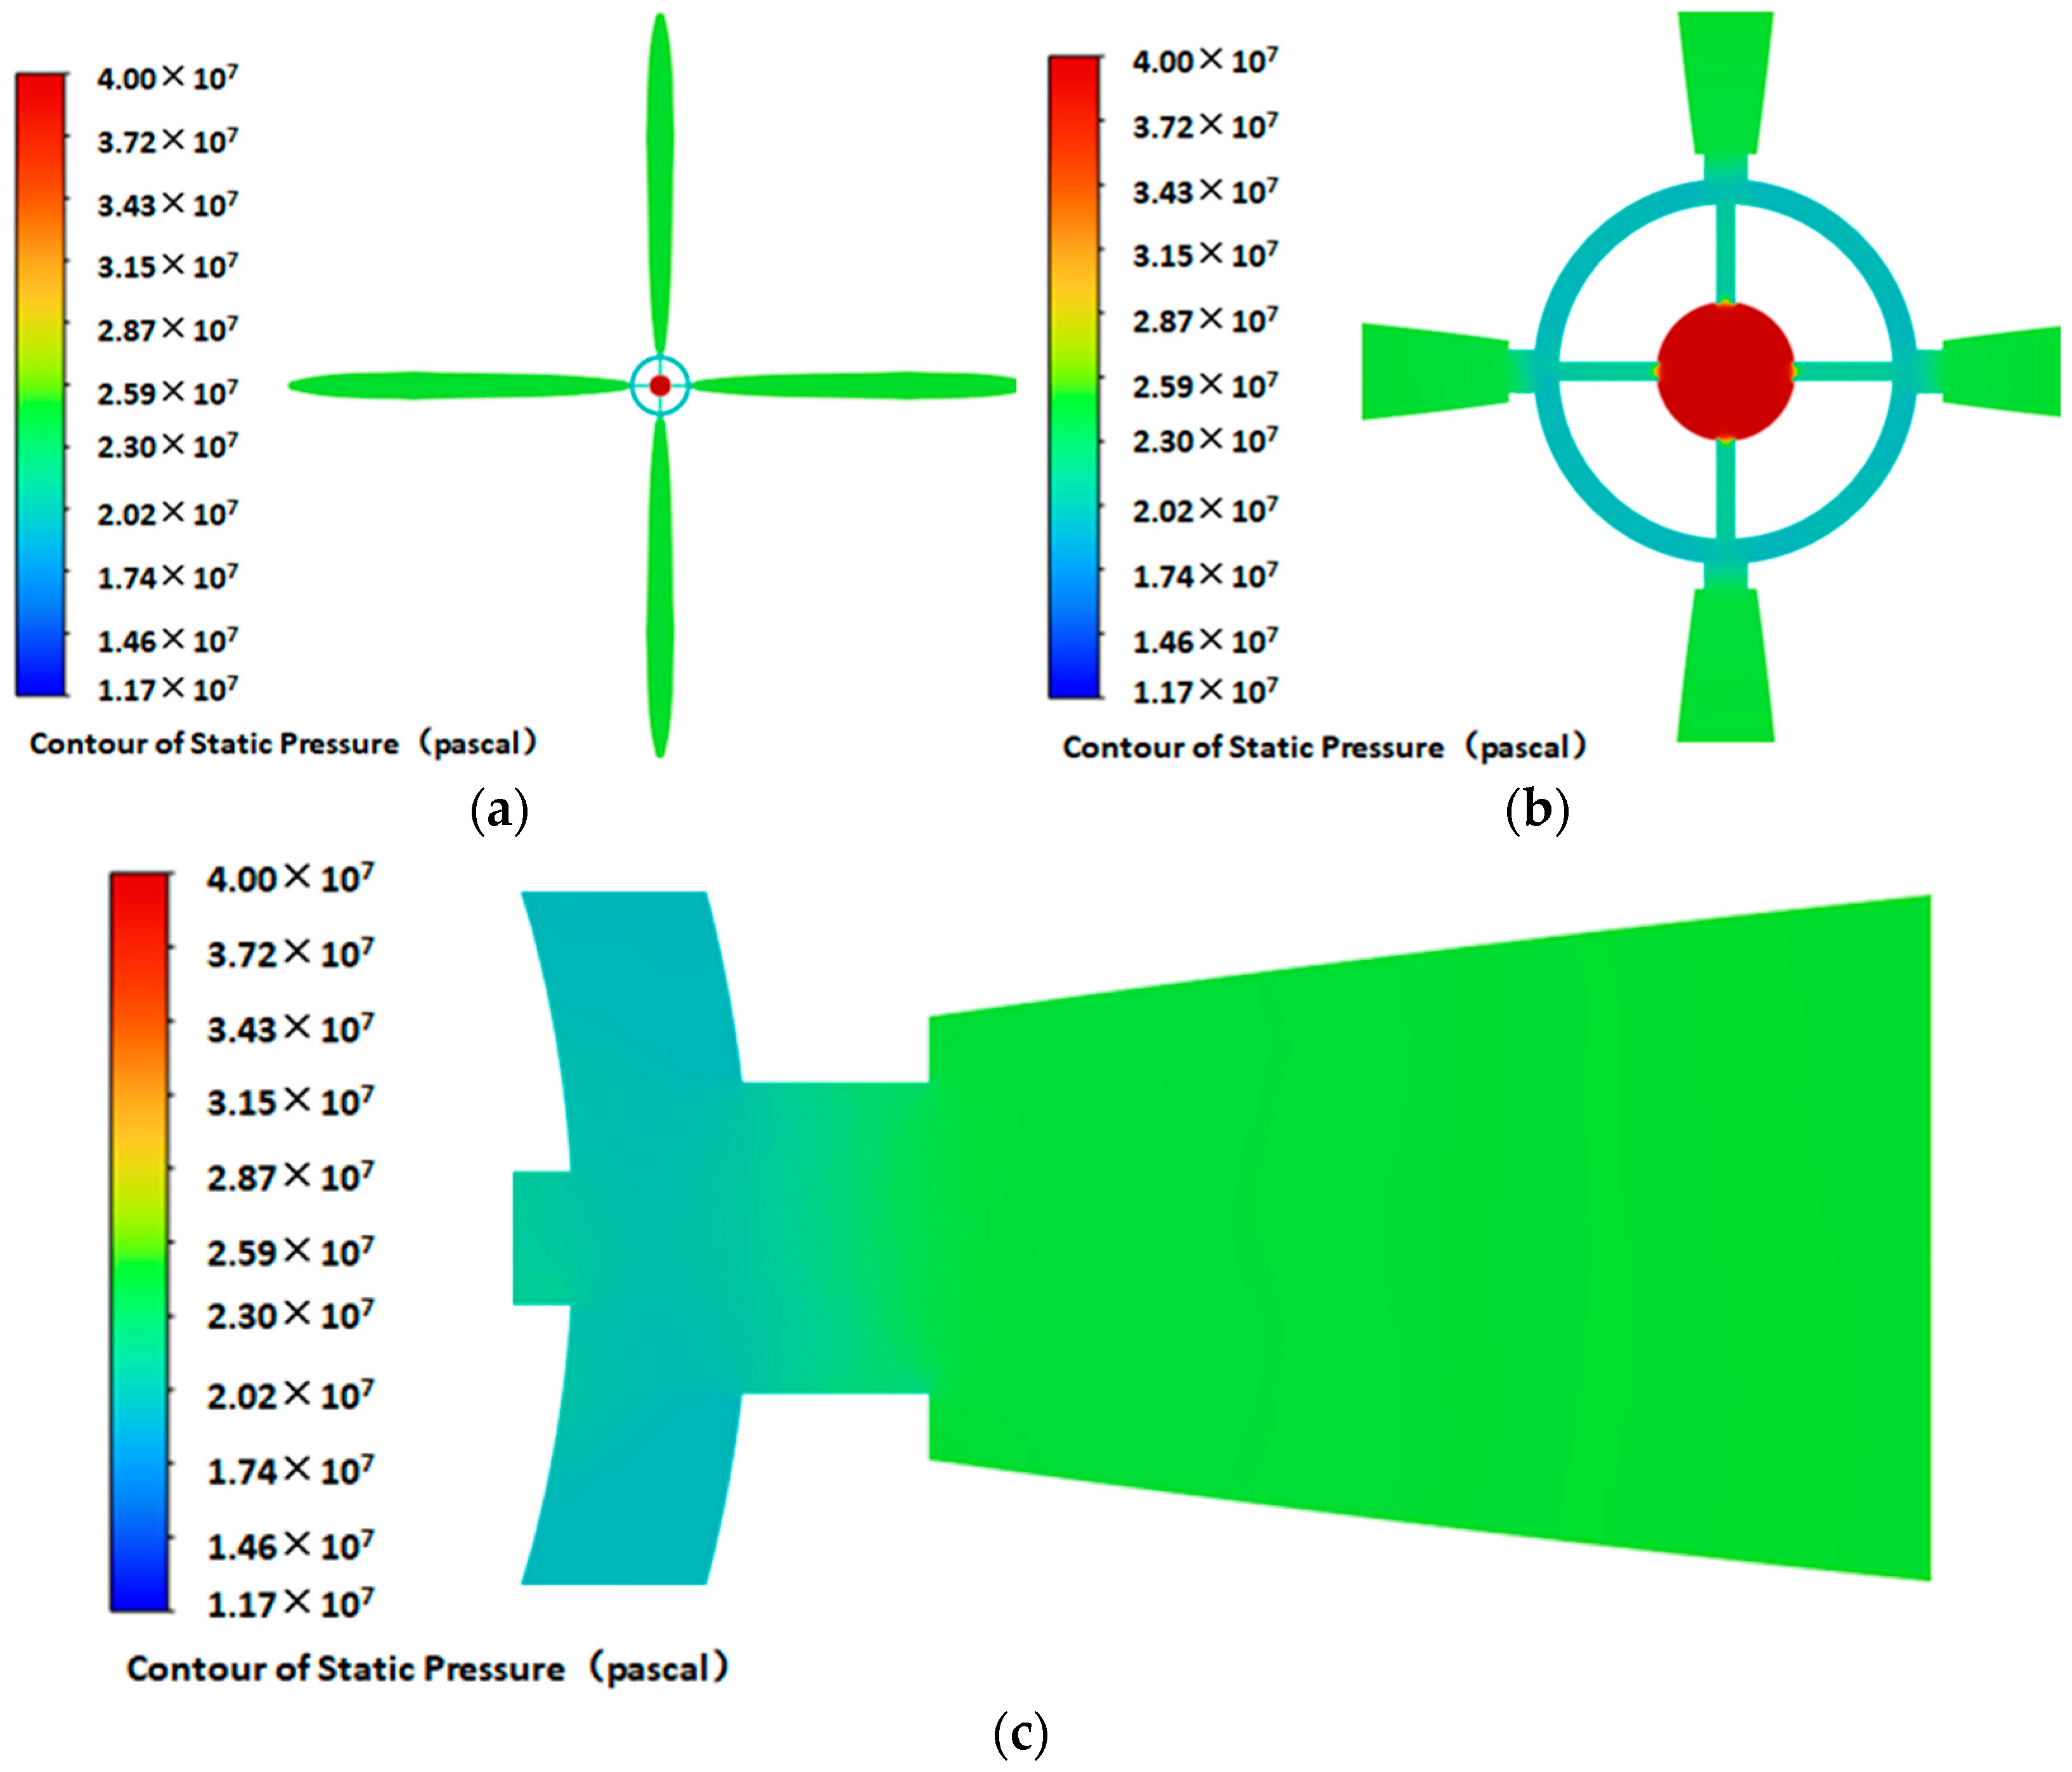
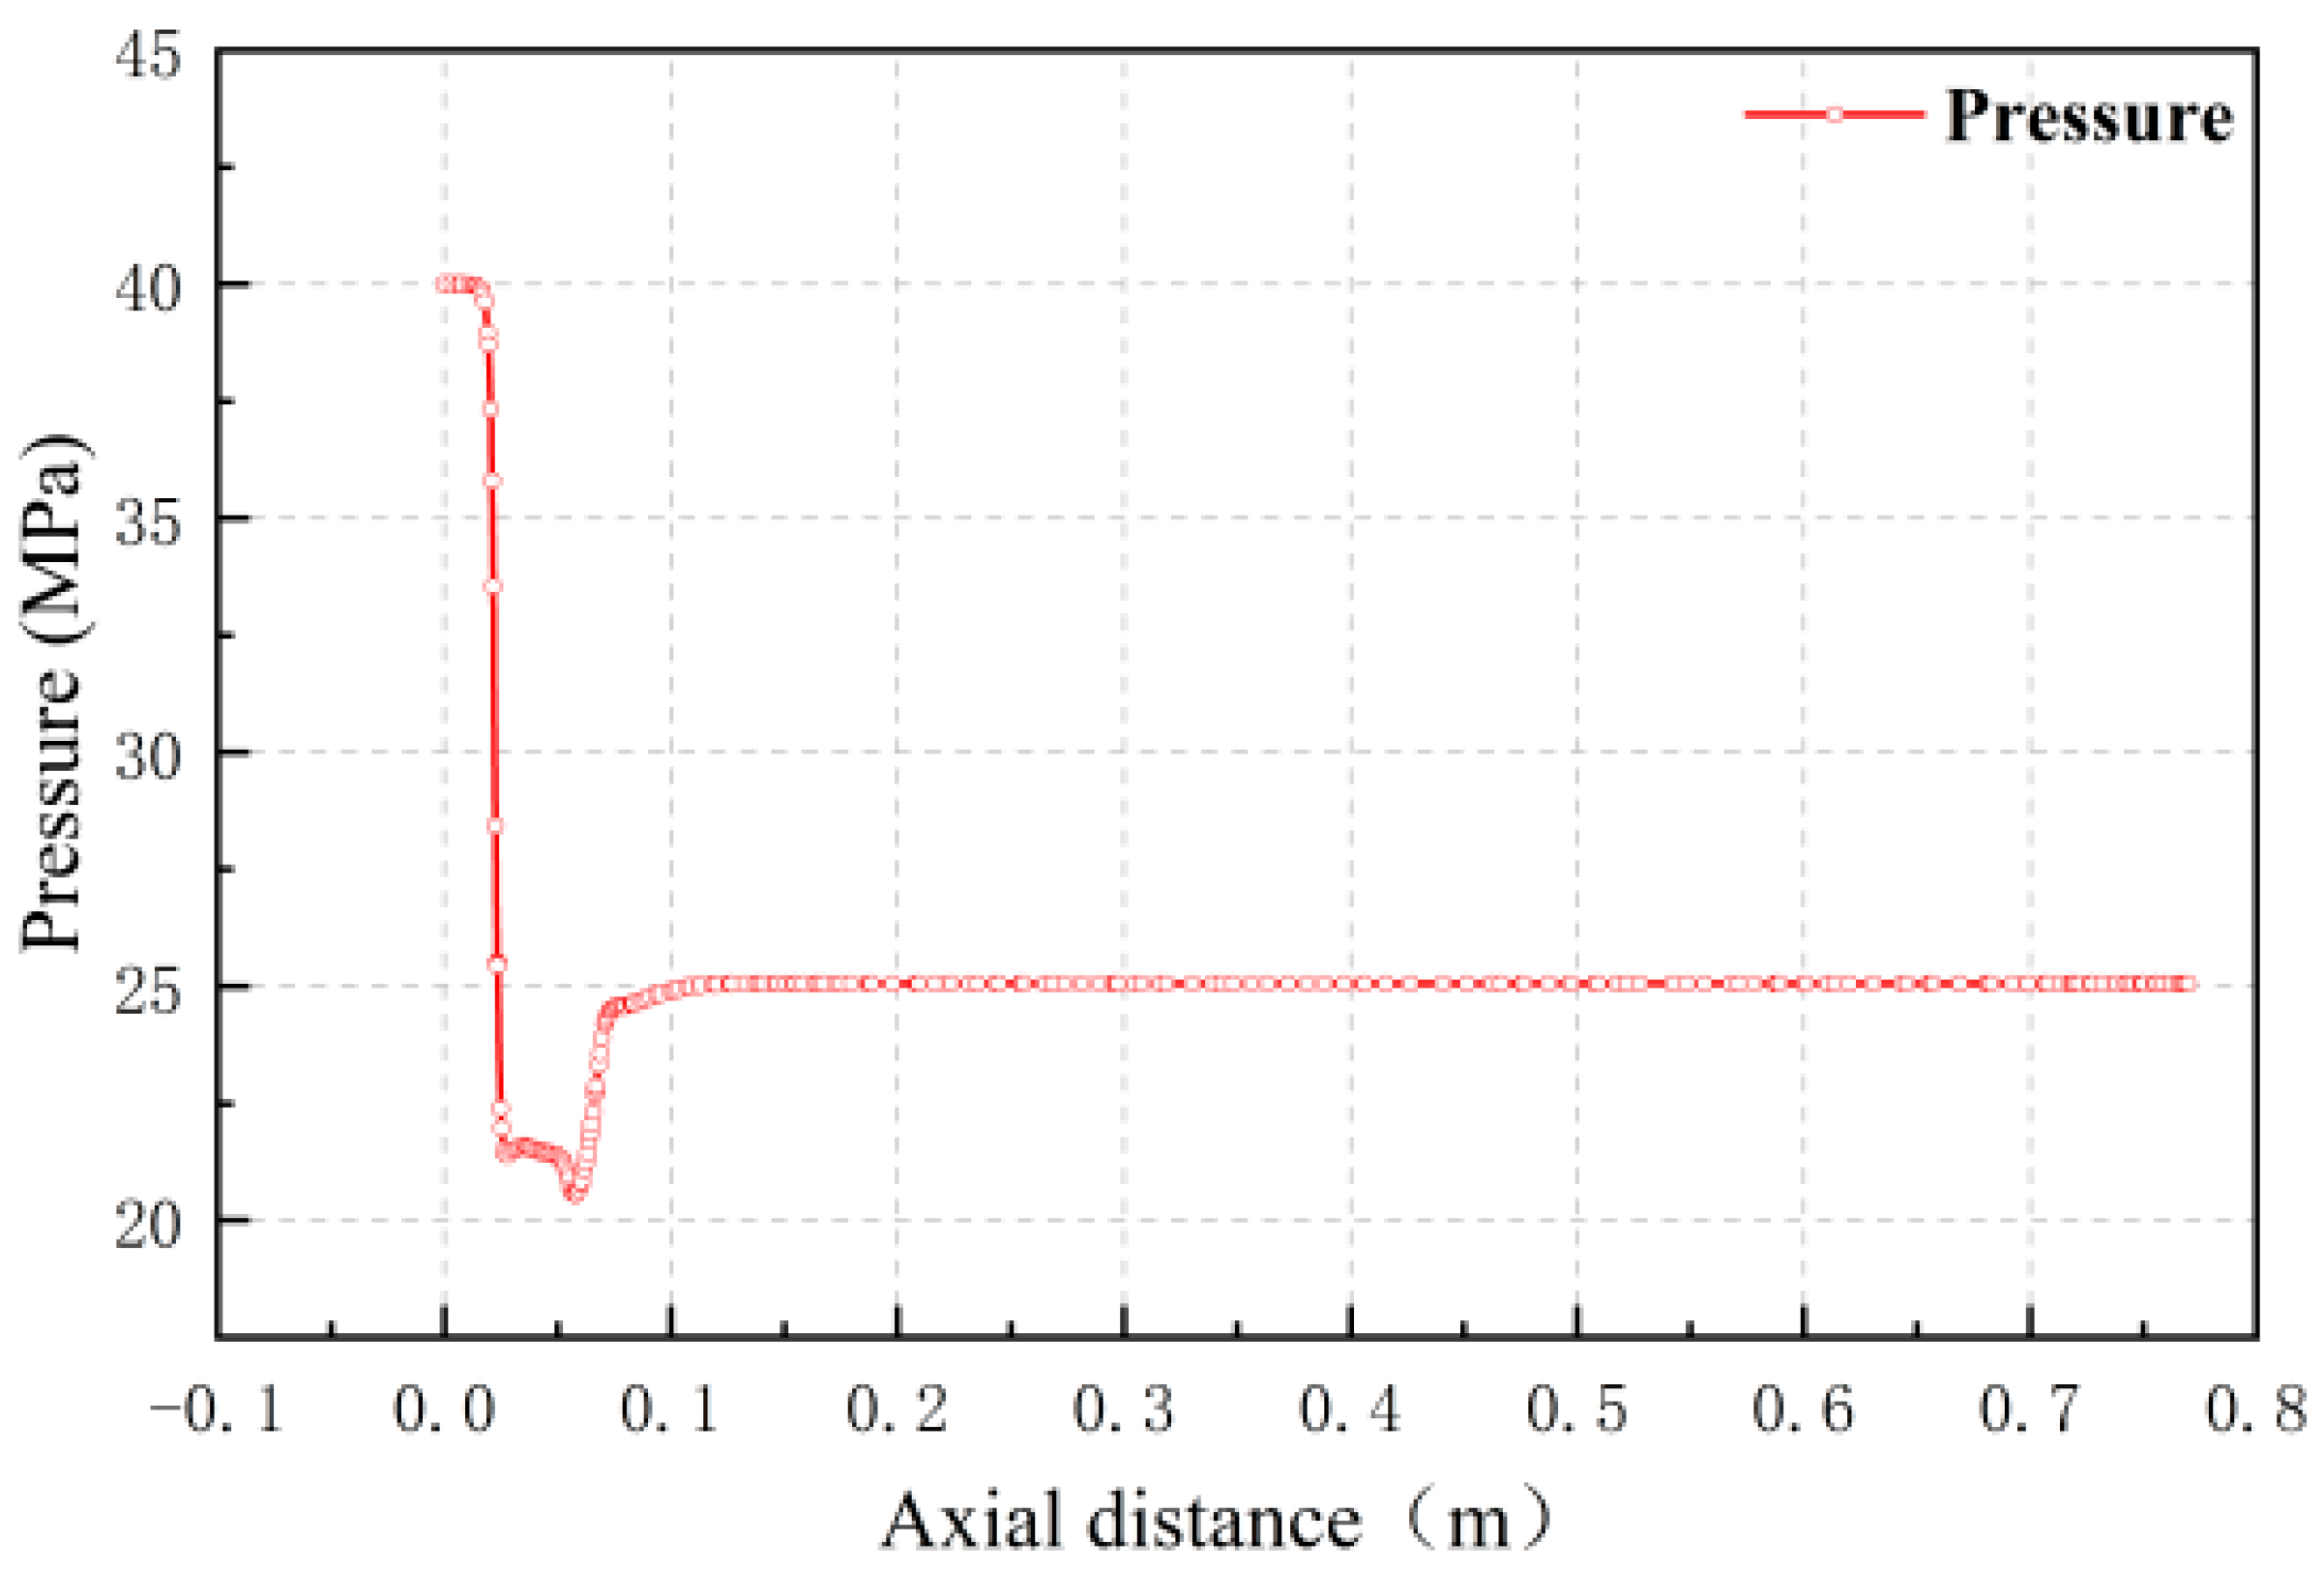
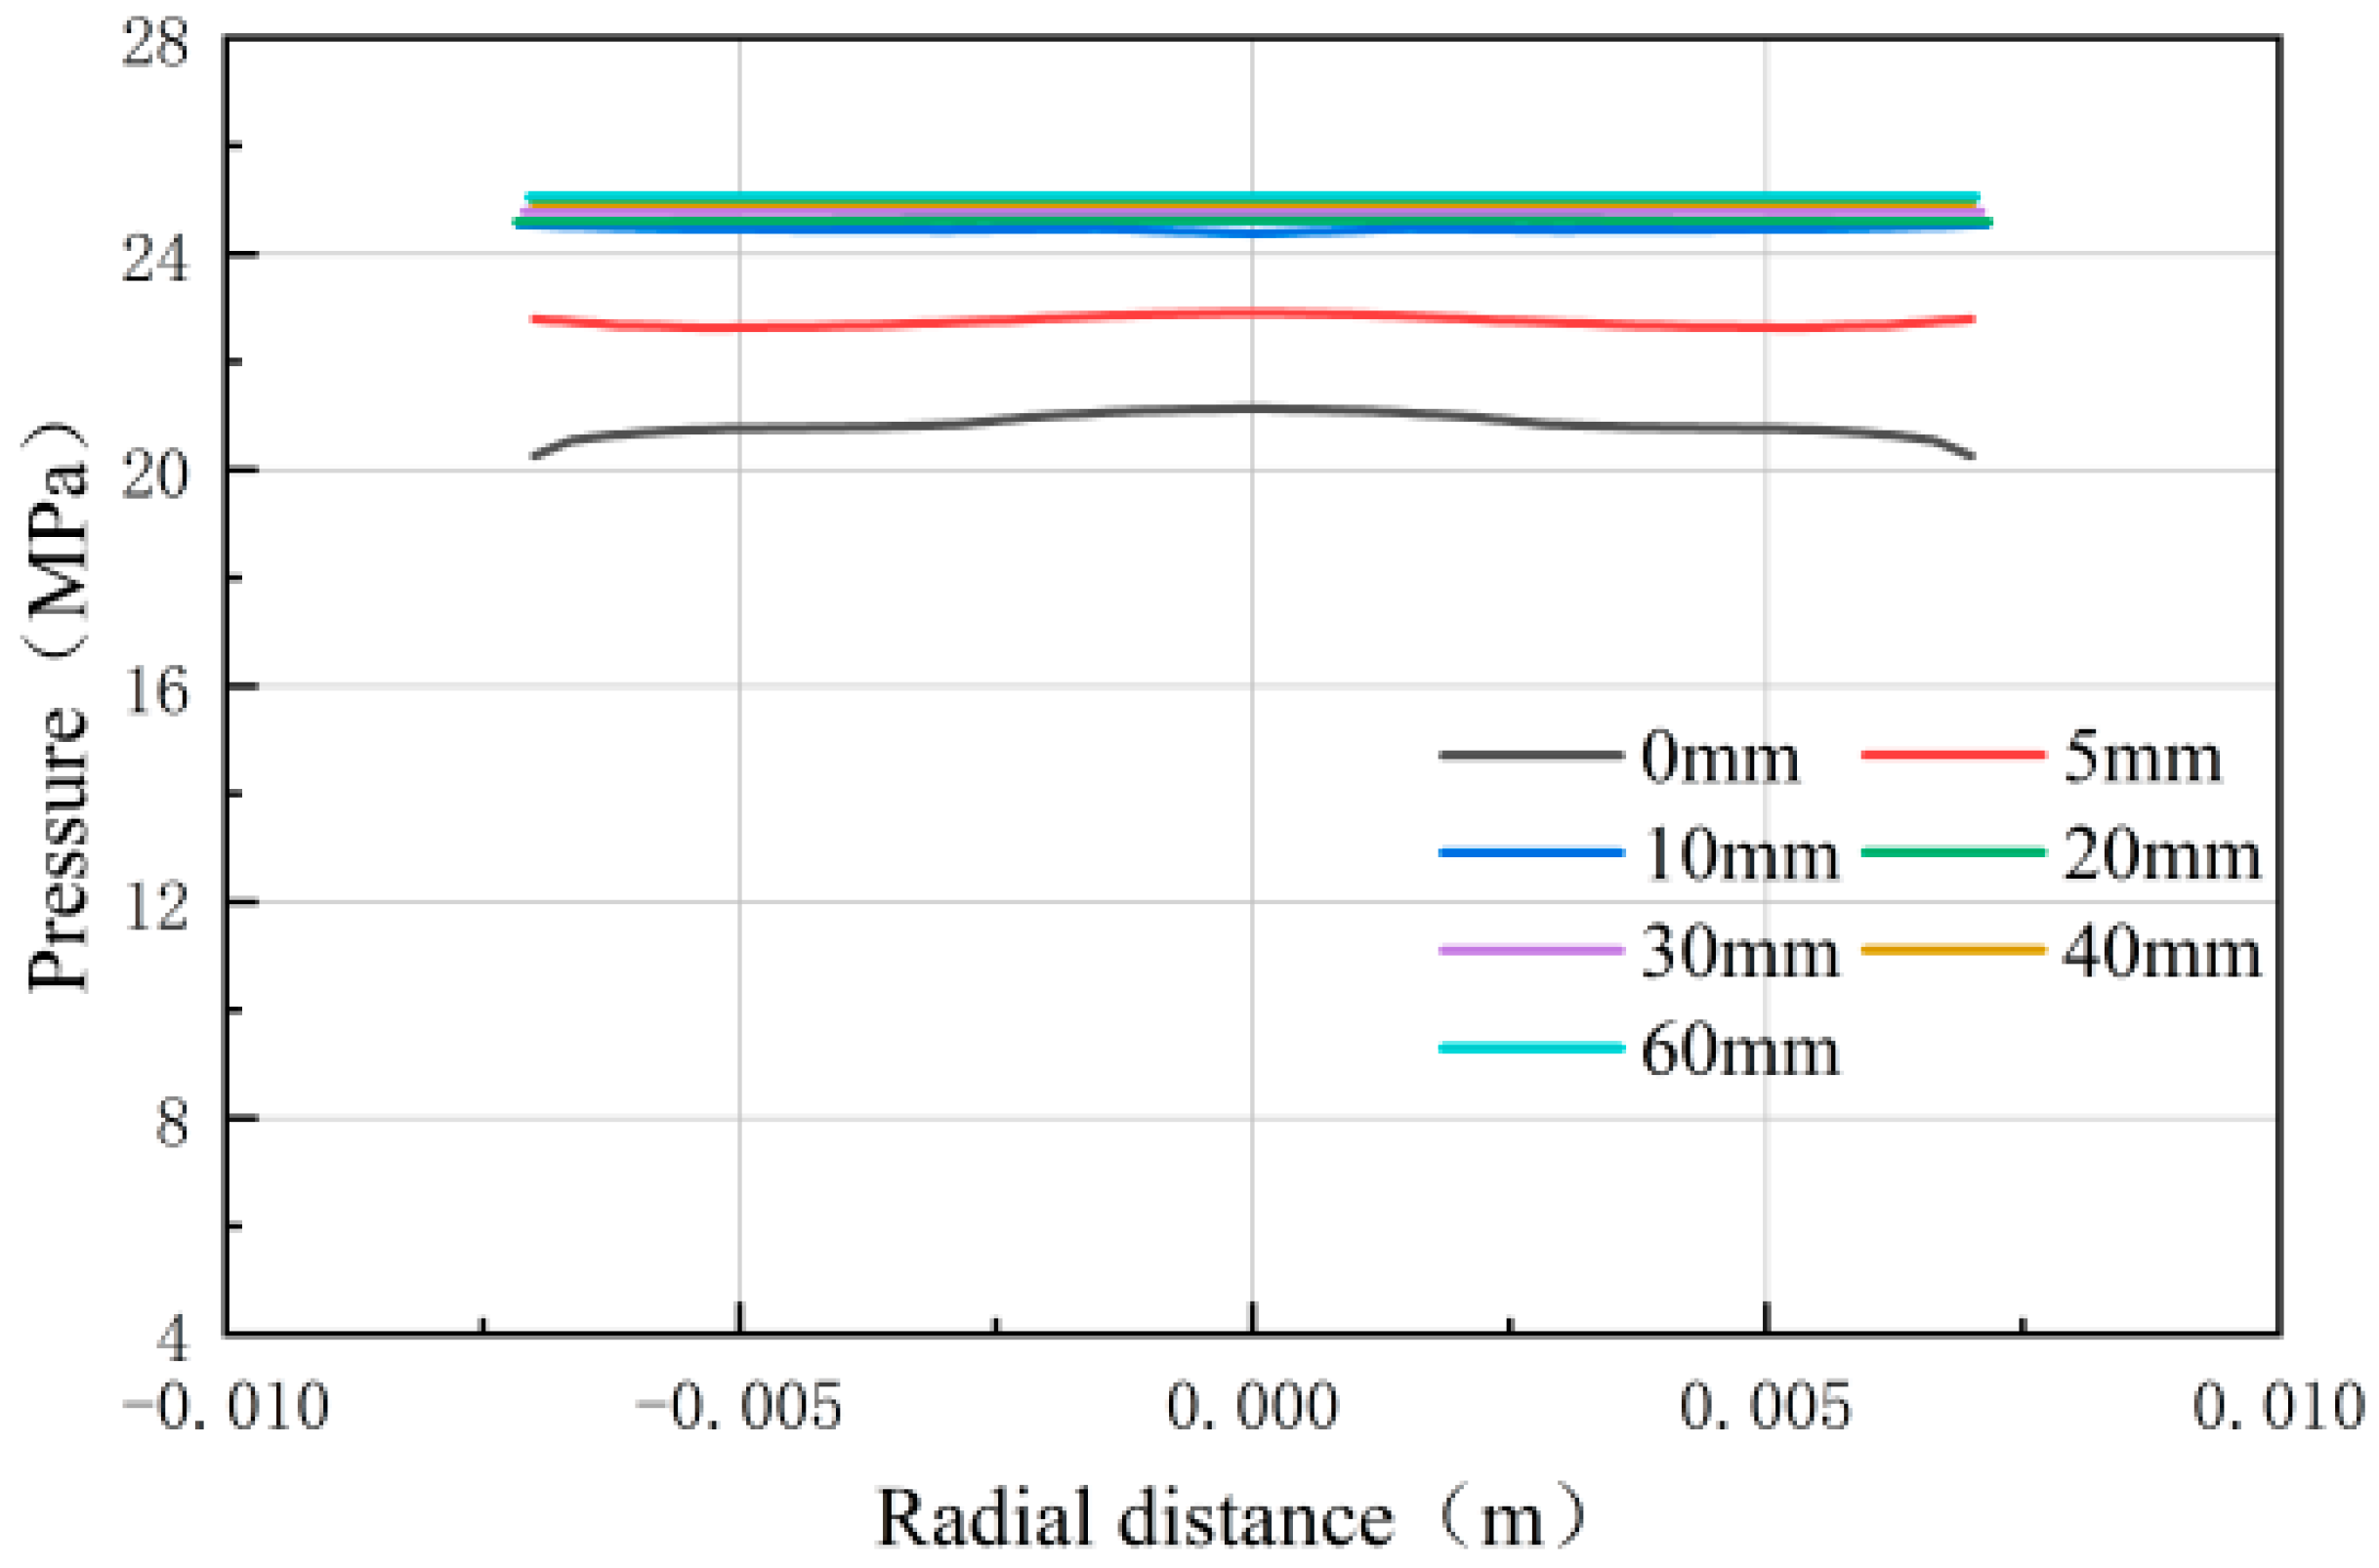
3.1.2. Pressure Field

As the most direct evaluation parameter of the reaction pressurization effect, the fluid pressure in the perforation tunnel is an indispensable observation index. Figure 7 is a pressure nephogram with an ambient pressure of 20 MPa and a pressure drop of 20 MPa. It can be seen that the high-pressure fluid enters the nozzle from the spray gun, the pressure decreases, the pressure in the annular area is relatively stable, and the internal pressure of the perforation tunnel is stable at 25.06 MPa, which is higher than the ambient pressure as a whole. The net pressurization value is 5.06 MPa. The pressurization effect is obvious, and the purpose of pressurization is achieved.
The high-pressure jet enters the nozzle from the inside of the jet tool. During the flow in the nozzle, the static pressure first decreases rapidly, and then changes into dynamic pressure. The velocity increases rapidly and the kinetic energy carried by the jet increases, as shown in Figure 8. Then, the fluid velocity in the nozzle decreases slowly, and the static pressure increases. After the jet fluid leaves the nozzle, the static pressure decreases again, the dynamic pressure increases, and the jet flows into the perforation tunnel. After the high-pressure fluid enters the perforation tunnel, the velocity decreases, and the static pressure begins to increase rapidly. It is relatively stagnant at about 0.03 m inside the perforation tunnel, and the static pressure inside the perforation tunnel remains relatively stable.
The static pressure distribution from the inlet to the internal horizontal radial direction was observed at different distances along the axis direction. As shown in Figure 9, the static pressure gradually increases along the axis direction, and the increasing speed gradually slows down. With the deepening of the jet into the perforation tunnel, the increase rate of the static pressure value slows down until stagnation and finally stabilizes at 25.06 MPa, which is 5.06 MPa higher than the ambient pressure.

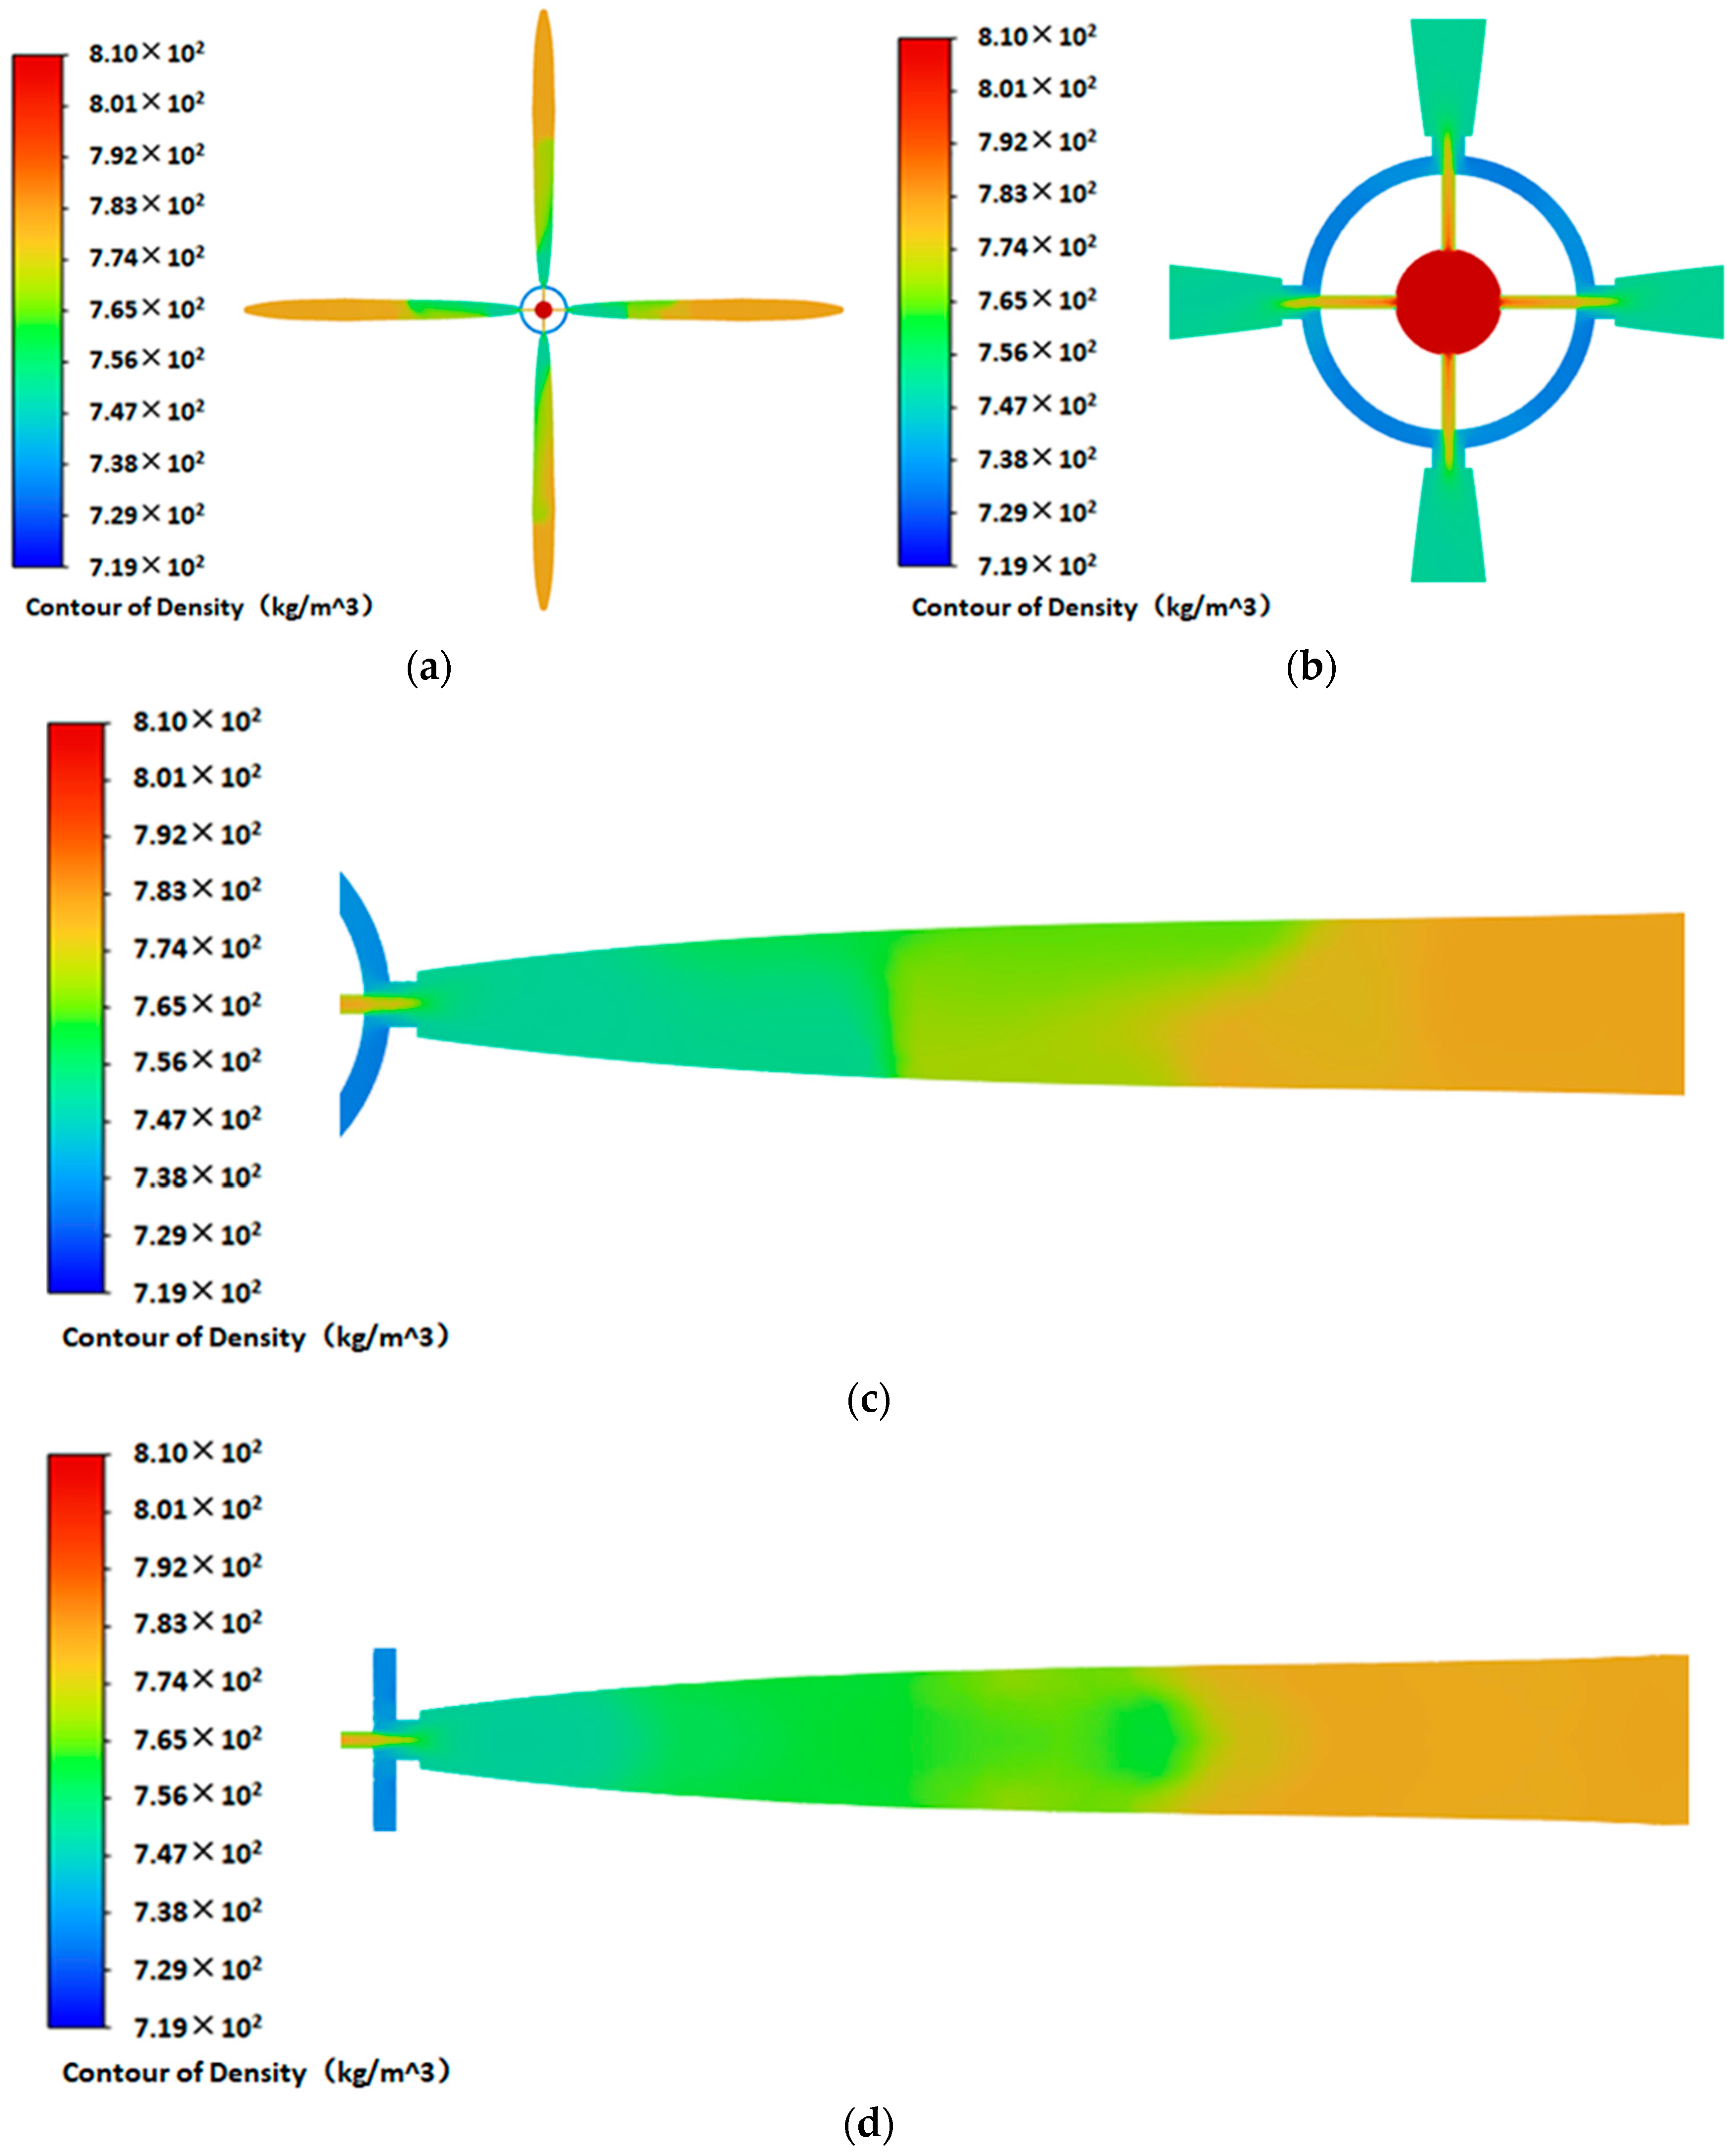
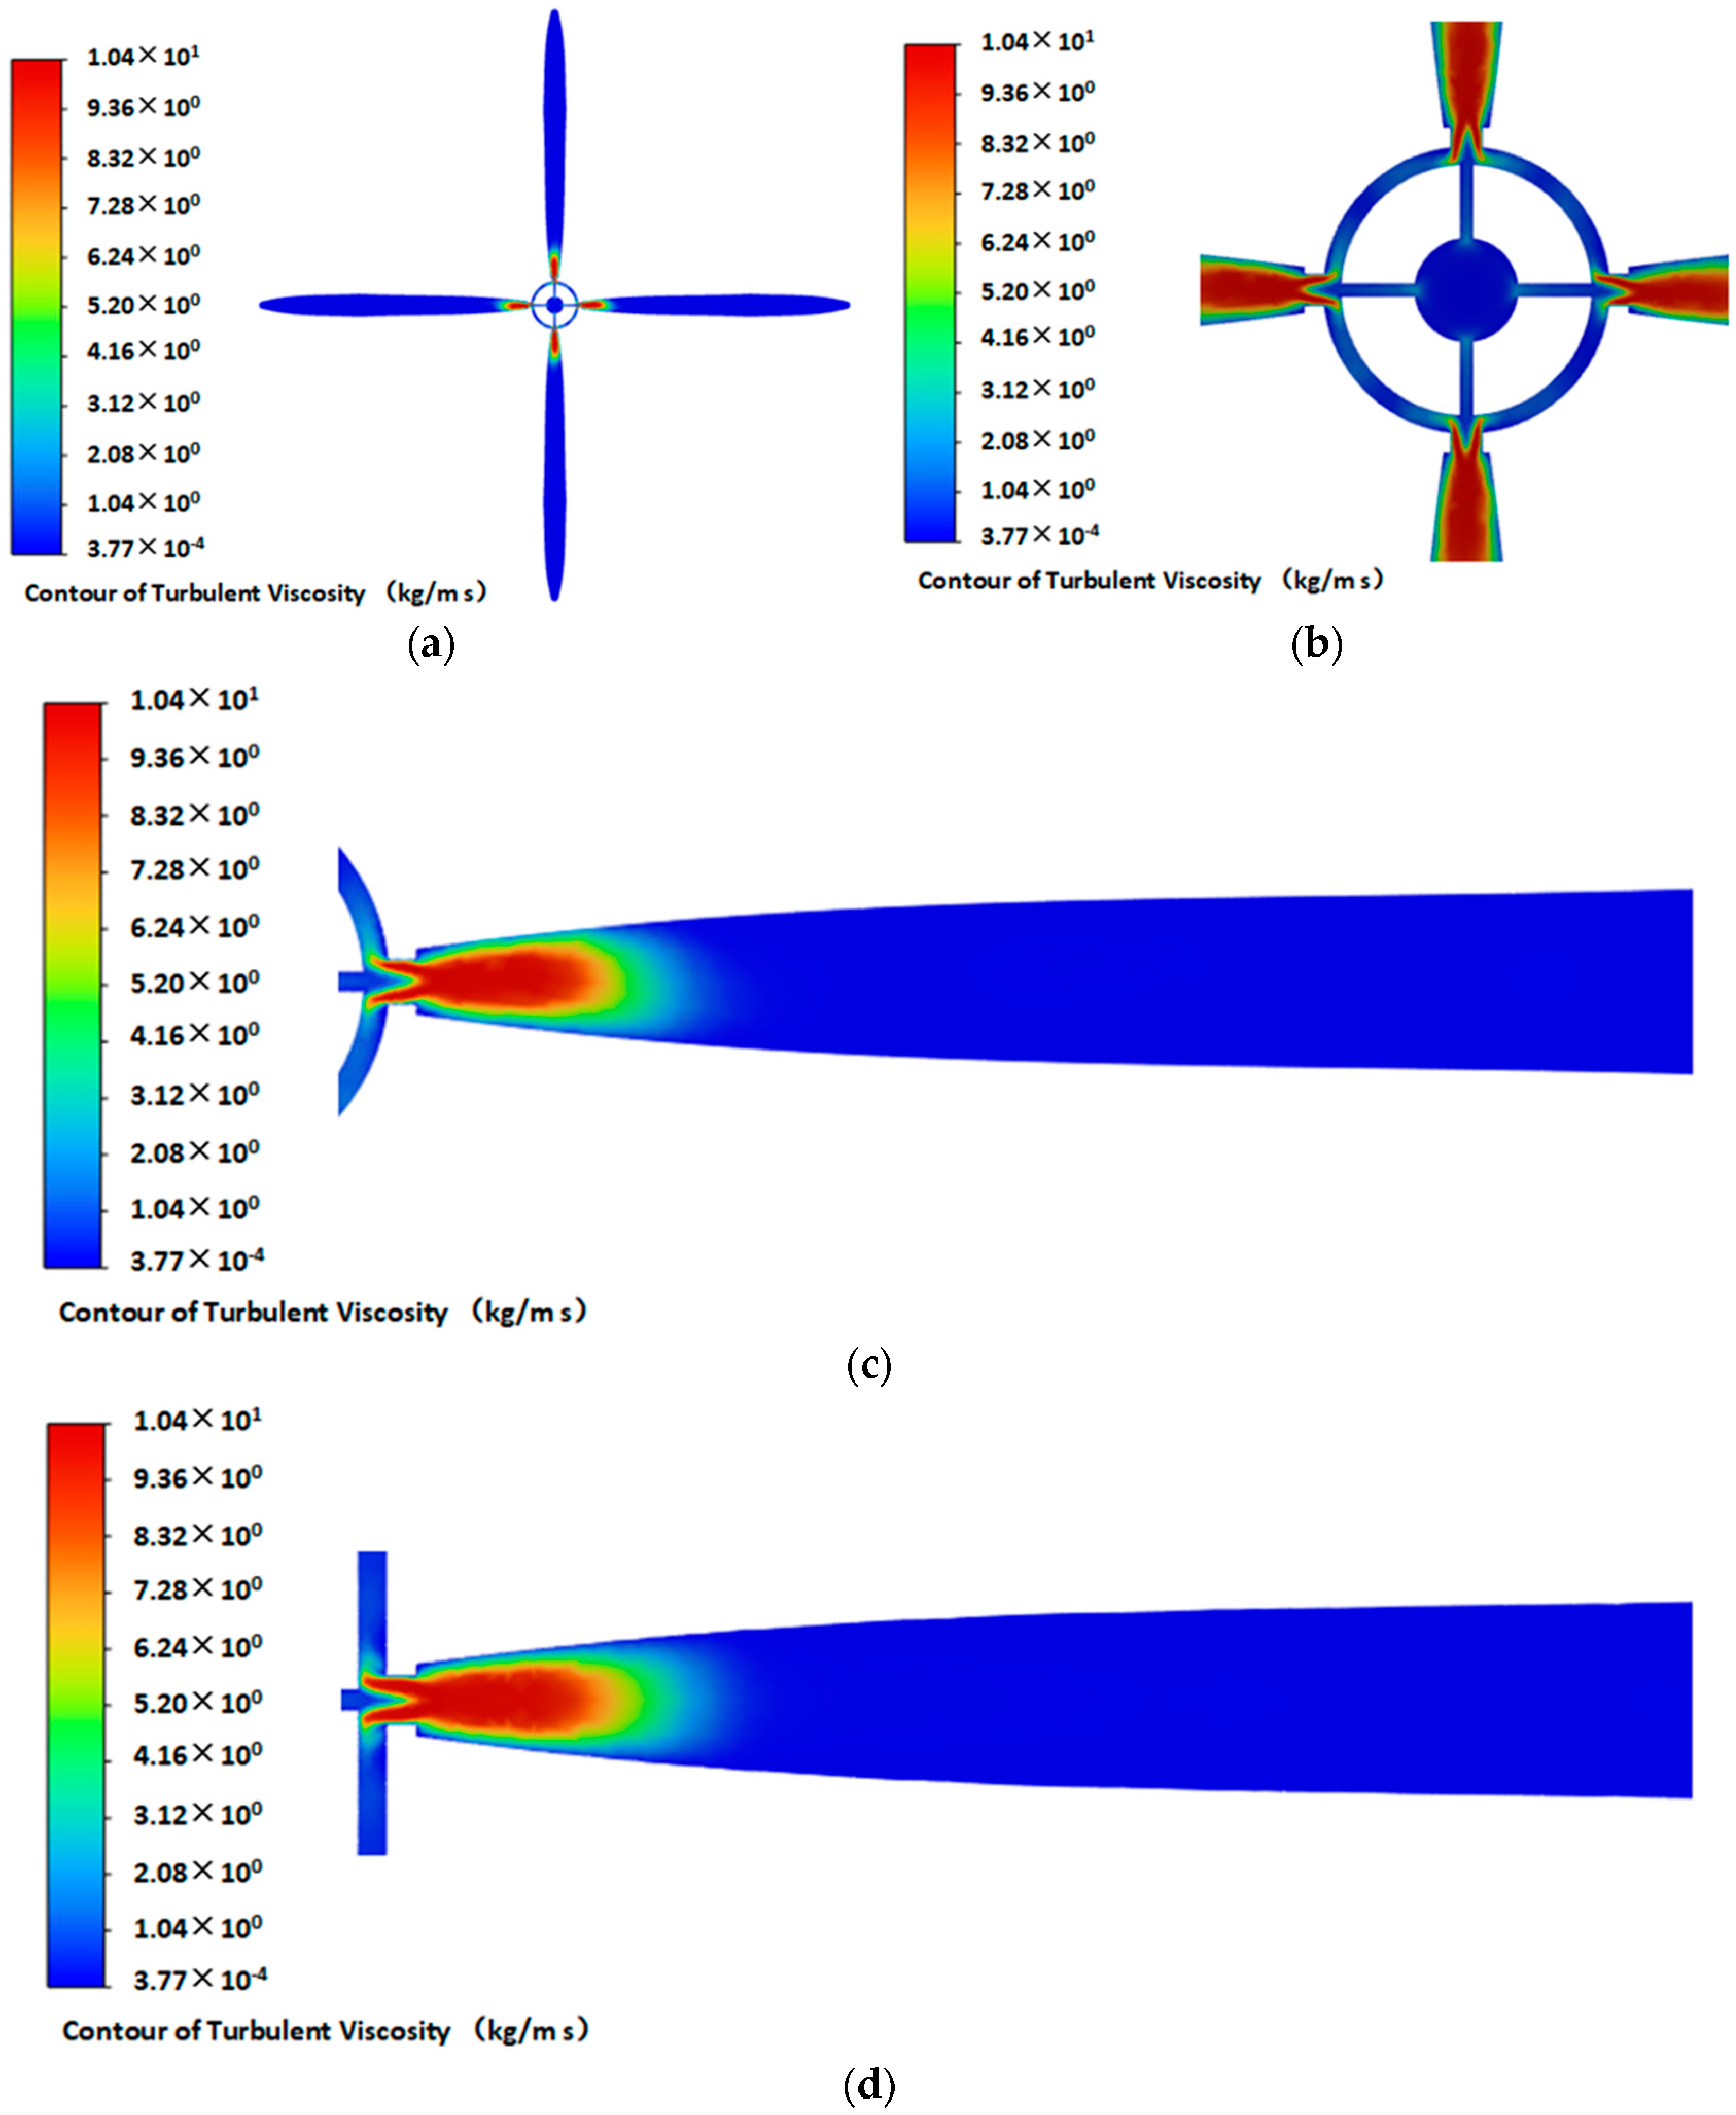
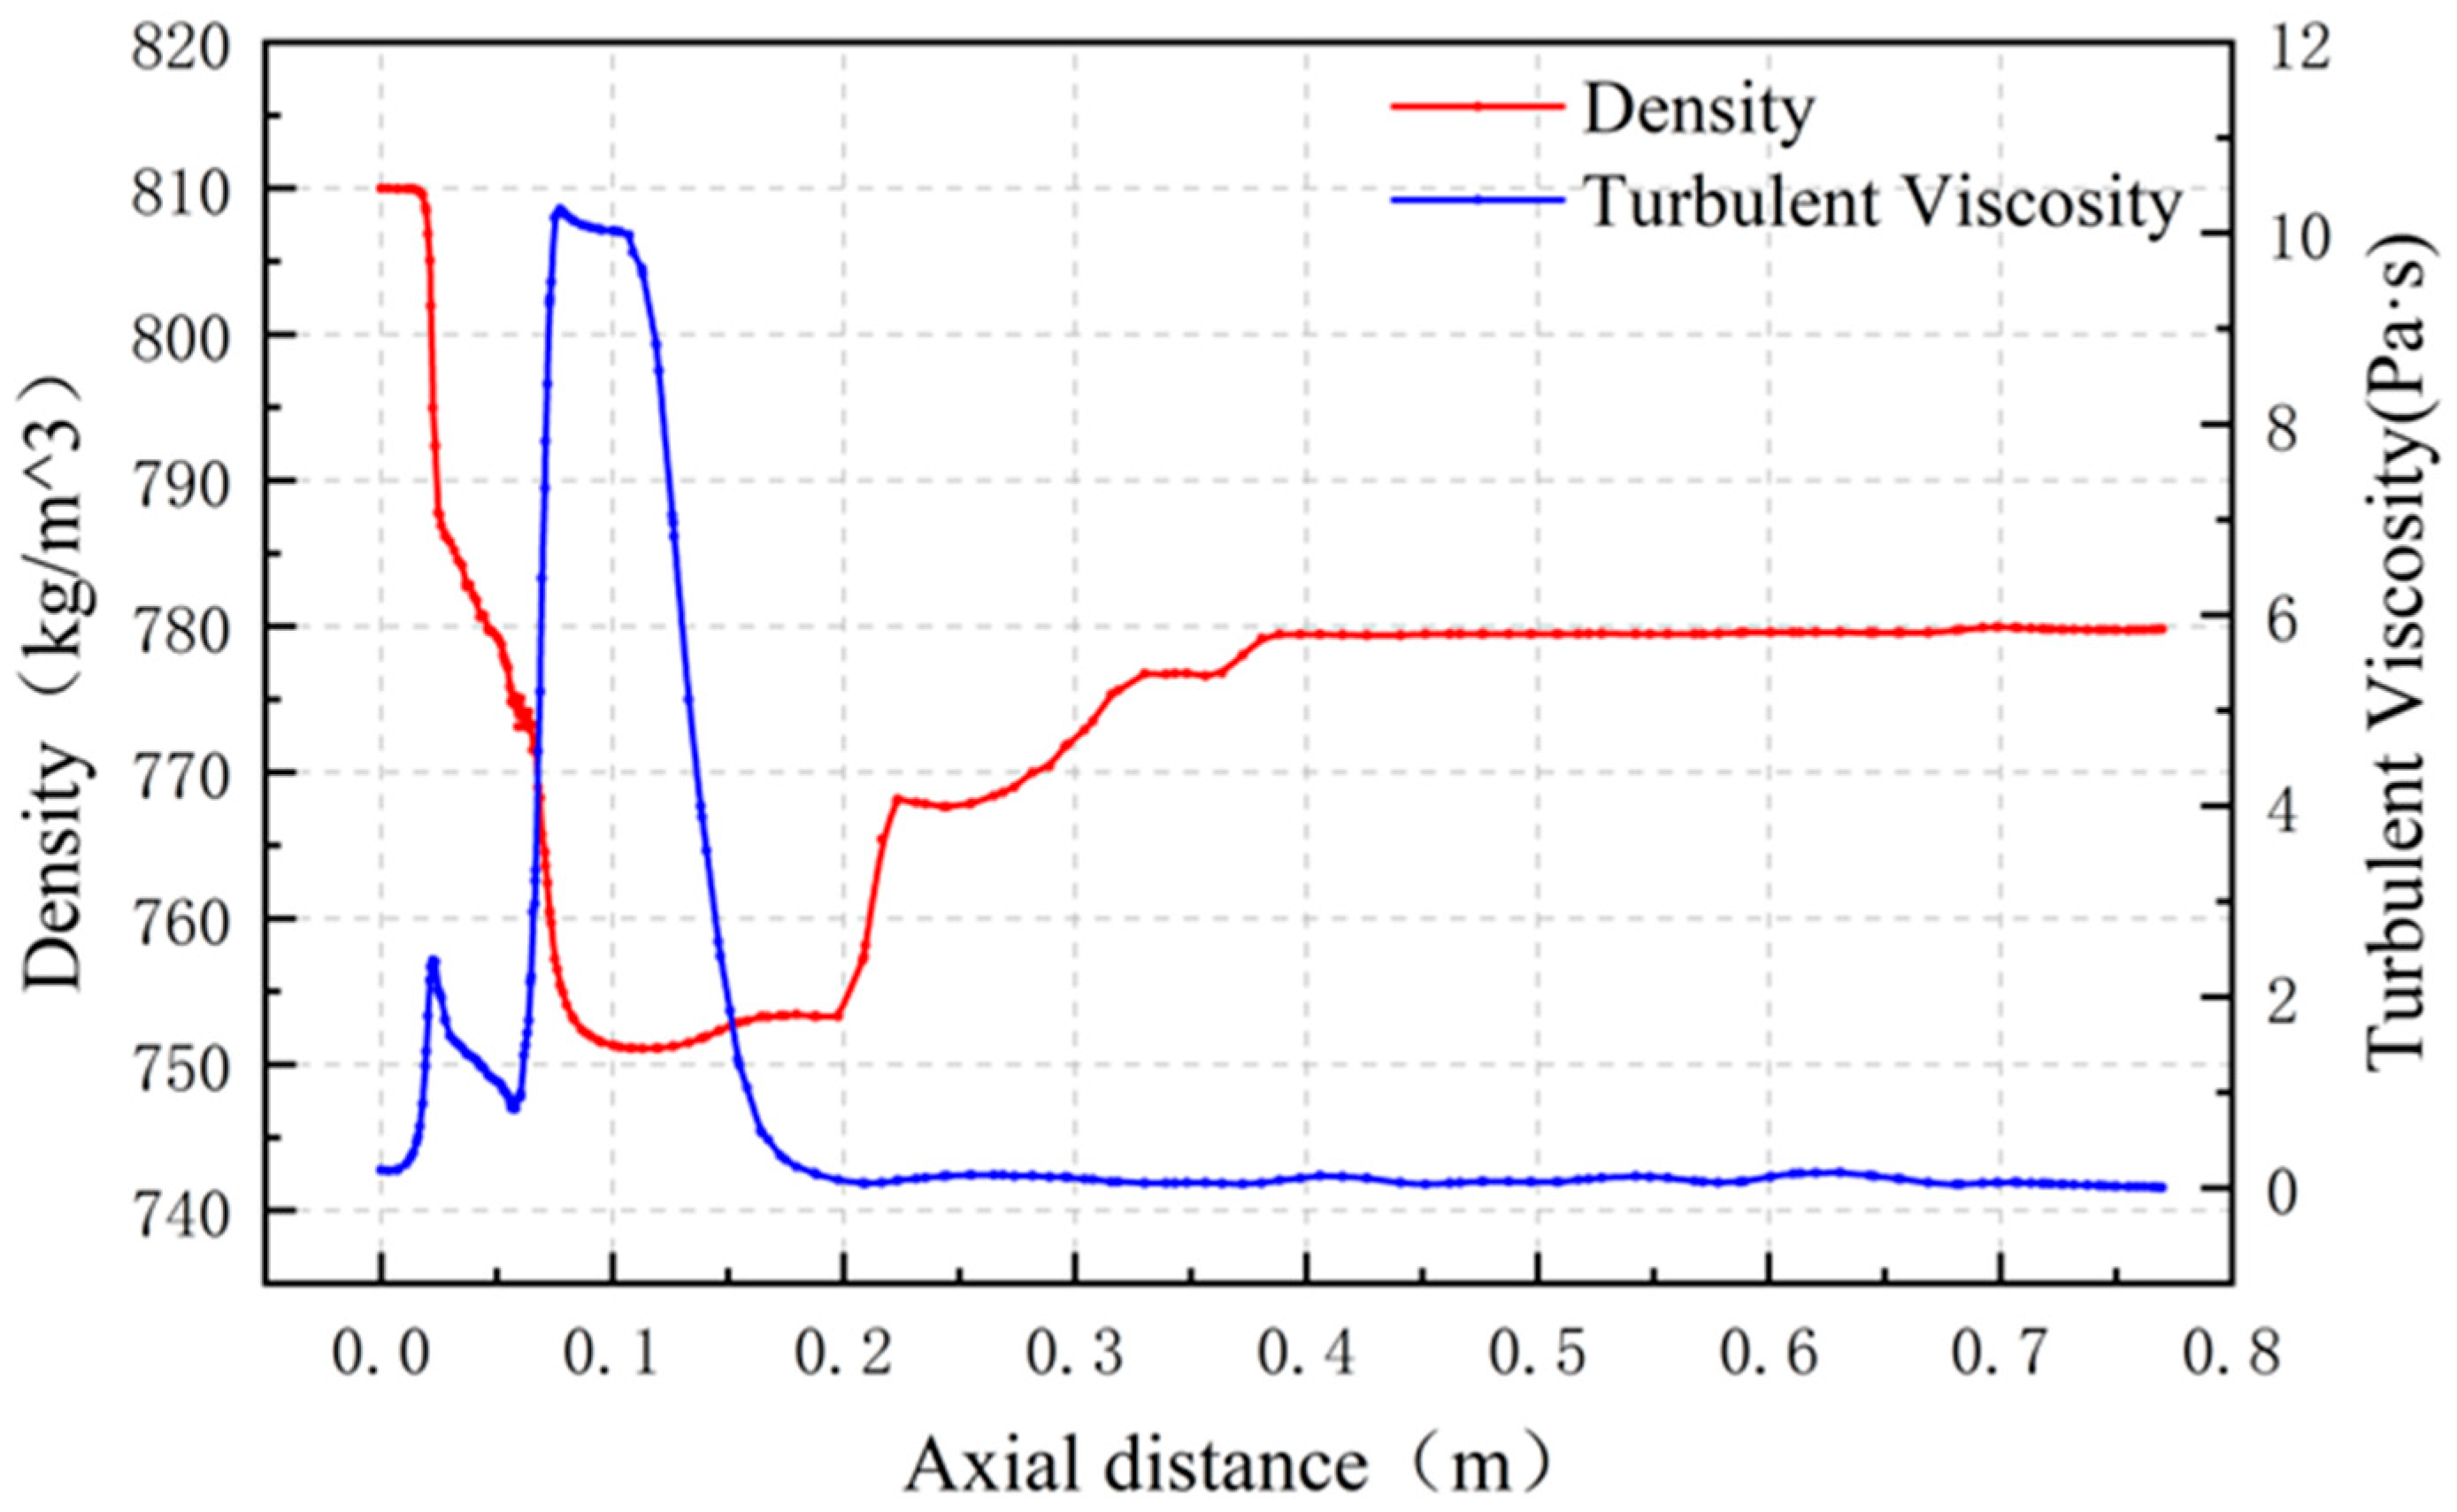
3.1.3. Physical Property Changes (Density and Viscosity)

As shown in Figure 10, the density of the jet fluid in the nozzle is the highest. After the jet is ejected, the density gradually decreases during the process of entering the perforation tunnel, and the density of the jet fluid in the perforation tunnel gradually increases from the perforation tunnel inlet to the inside of the perforation tunnel until it reaches its maximum and then remains relatively stable. This is due to the continuous entry of jet fluid into the perforation tunnel to squeeze the internal fluid; the fluid is compressed, and the pressure is increased. After the extruded fluid enters the annulus, the volume expands and the density decreases.
Through the observation of the viscosity of the perforation tunnel and the annulus area, as shown in Figure 11, the fluid viscosity at the entrance of the perforation tunnel is much higher than that inside the perforation tunnel and the annulus area, and the maximum viscosity is thousands of times higher than the minimum viscosity. The high viscosity zone is concentrated at the inlet of the perforation tunnel, blocking the backflow of liquid nitrogen inside the perforation tunnel, playing a sealing role, enhancing the squeezing of the fluid inside the perforation tunnel, and enhancing the pressurization effect.
Density is one of the important physical properties of liquid nitrogen, which increases with increasing pressure. As shown in Figure 12, the liquid nitrogen fluid inside the nozzle is in a high-density state, with a maximum of 809.97 kg/m3. After entering the annulus area, the density decreases, and the minimum is only 751.07 kg/m3. After entering the formation perforation tunnel, the density increased to 779.5 kg/m3. It can also be seen from Figure 12 that on the axis of the perforation tunnel, as the axis distance increases, the density of the liquid nitrogen fluid decreases first and then increases. This is because the pressure on the pore axis decreases first and then increases, so that the density change trend corresponds to the pressure change trend.
Viscosity, as another important property of liquid nitrogen, increases with the increase in velocity, showing a high viscosity state at the entrance of the perforation tunnel, up to 10.24 kg/ms; the viscosity decreases after entering the perforation tunnel, and the lowest is only 0.0034 kg/ms. From Figure 12, combined with Figure 5, it can be seen that on the perforation tunnel axis, as the axis distance increases, the viscosity of the liquid nitrogen fluid increases first and then decreases. This is because the velocity of the jet fluid on the axis of the perforation tunnel first increases and then decreases, and the change in viscosity lags behind the velocity change trajectory and presents a positive correlation trend with it. When the velocity decreases close to 0, the viscosity decreases to the minimum.

3.2. Mechanism Analysis of Jet Pressurization in Perforation Tunnel

3.2.1. Hole Sealing Effect Analysis

After the nozzles with different diameters are matched with the casings with different diameters, the pressurization effect is very different. As shown in Figure 13, the velocity nephogram of the nozzle jets with diameters of 2 mm and 10 mm at the entrance of the perforation tunnel under the same casing hole diameter (14 mm) are shown, respectively. From the graph, it can be observed that when a nozzle with a diameter of 2 mm flows, the proportion of the inlet area to the inlet and outlet area of the perforation tunnel is much smaller than that of the backflow area, and the maximum backflow velocity is 44.2 m/s. Under the nozzle condition with a diameter of 10 mm, the area proportion of the backflow area is much smaller than that under the nozzle condition of 2 mm, and the maximum backflow velocity reaches 112 m/s. Due to the larger diameter of the nozzle, the more fluid the jet carries and the higher the energy it carries, the fluid backflow in the perforation tunnel is greatly affected by the boundary conditions of the wellbore fluid outlet, and the backflow is concentrated on the side near the wellbore outlet. According to the law of conservation of mass, the smaller the backflow area, the greater the backflow velocity will be. In order to make the backflow fluid overcome the inflow and the hole diameter shrinkage and flow out smoothly, the internal pressure of the perforation tunnel must be greater so that the internal pressurization effect of the perforation tunnel is better.
Similarly, it can be seen from Figure 14 that for the same diameter nozzle conditions, the smaller the diameter of the casing, the smaller the area proportion of the backflow area at the inlet of the perforation tunnel is, and the greater the maximum velocity of the backflow is, so that the sealing effect of the fluid inside the perforation tunnel is stronger and the fluid backflow inside the perforation tunnel is more difficult. The internal pressure of the perforation tunnel will be greatly improved, and a better pressurization effect will also be obtained.

3.2.2. Analysis of Jet Extrusion Effect

The jet produces an impact and compression effect on the fluid inside the channel near the inlet, leading to an increase in fluid pressure inside the perforation tunnel. The more difficult it is for the fluid in the channel to flow, the easier it is for the fluid in the channel to be squeezed. Therefore, the hole sealing effect helps to reduce the fluid flow in the perforation tunnel and enhance the jet extrusion effect. In addition, increasing the jet energy also helps to improve the extrusion effect and increase the overall pressure in the perforation tunnel. As shown in Figure 15, under the condition of the same diameter nozzle and casing hole diameter and the ambient pressure of 20 MPa, the higher the pressure drop of the nozzle, the smaller the proportion of the backflow area to the inlet and outlet area of the hole, and the greater the backflow speed. This is due to the higher jet velocity and energy under the condition of high pressure drop, the stronger the mutual squeezing effect of the fluid inside the perforation tunnel, thereby inhibiting the backflow and increasing the internal pressure of the perforation tunnel.
According to the above analysis, the mechanism of pressure increase in the perforation tunnel is mainly caused by two factors: the sealing effect of the jet on the inlet of the perforation tunnel and the squeezing effect of the jet on the perforation tunnel fluid; both lead to the increase in fluid pressure in the perforation tunnel. Among them, the greater the energy carried by the jet, the better the extrusion effect; the stronger the sealing effect of the perforation tunnel, the easier the jet is to produce the squeezing effect.

3.3. Comparison of Pressurization Effects of Liquid Nitrogen Jet and Water Jet

In order to explore the effect of jet pressurization in the liquid nitrogen injection hole, hydraulic injection and liquid nitrogen injection were numerically simulated under the same parameters, and the pressurization effects of the two were compared. As shown in Figure 16, the pressure values on the fluid axis in the channel were compared between the water jet and the liquid nitrogen jet under five nozzle pressure drop conditions (10, 15, 20, 25, and 30 MPa). Research shows that under the same pressure drop conditions, the pressurization values of hydraulic injection and liquid nitrogen injection in the channel are similar. Among them, when the pressure drop is 10 MPa and 20 MPa, the pressurization value of hydraulic injection and liquid nitrogen injection is the same; when the pressure drop is 25 MPa, the pressurization value of hydraulic injection is 8.7 MPa, the pressurization value of liquid nitrogen injection is 8.3 MPa, and the maximum difference between the two pressurization effects is not more than 0.4 MPa. It can be seen that under the same conditions, liquid nitrogen injection has a similar pressurization effect as hydraulic injection.

4. Analysis of Parameter Influence Law

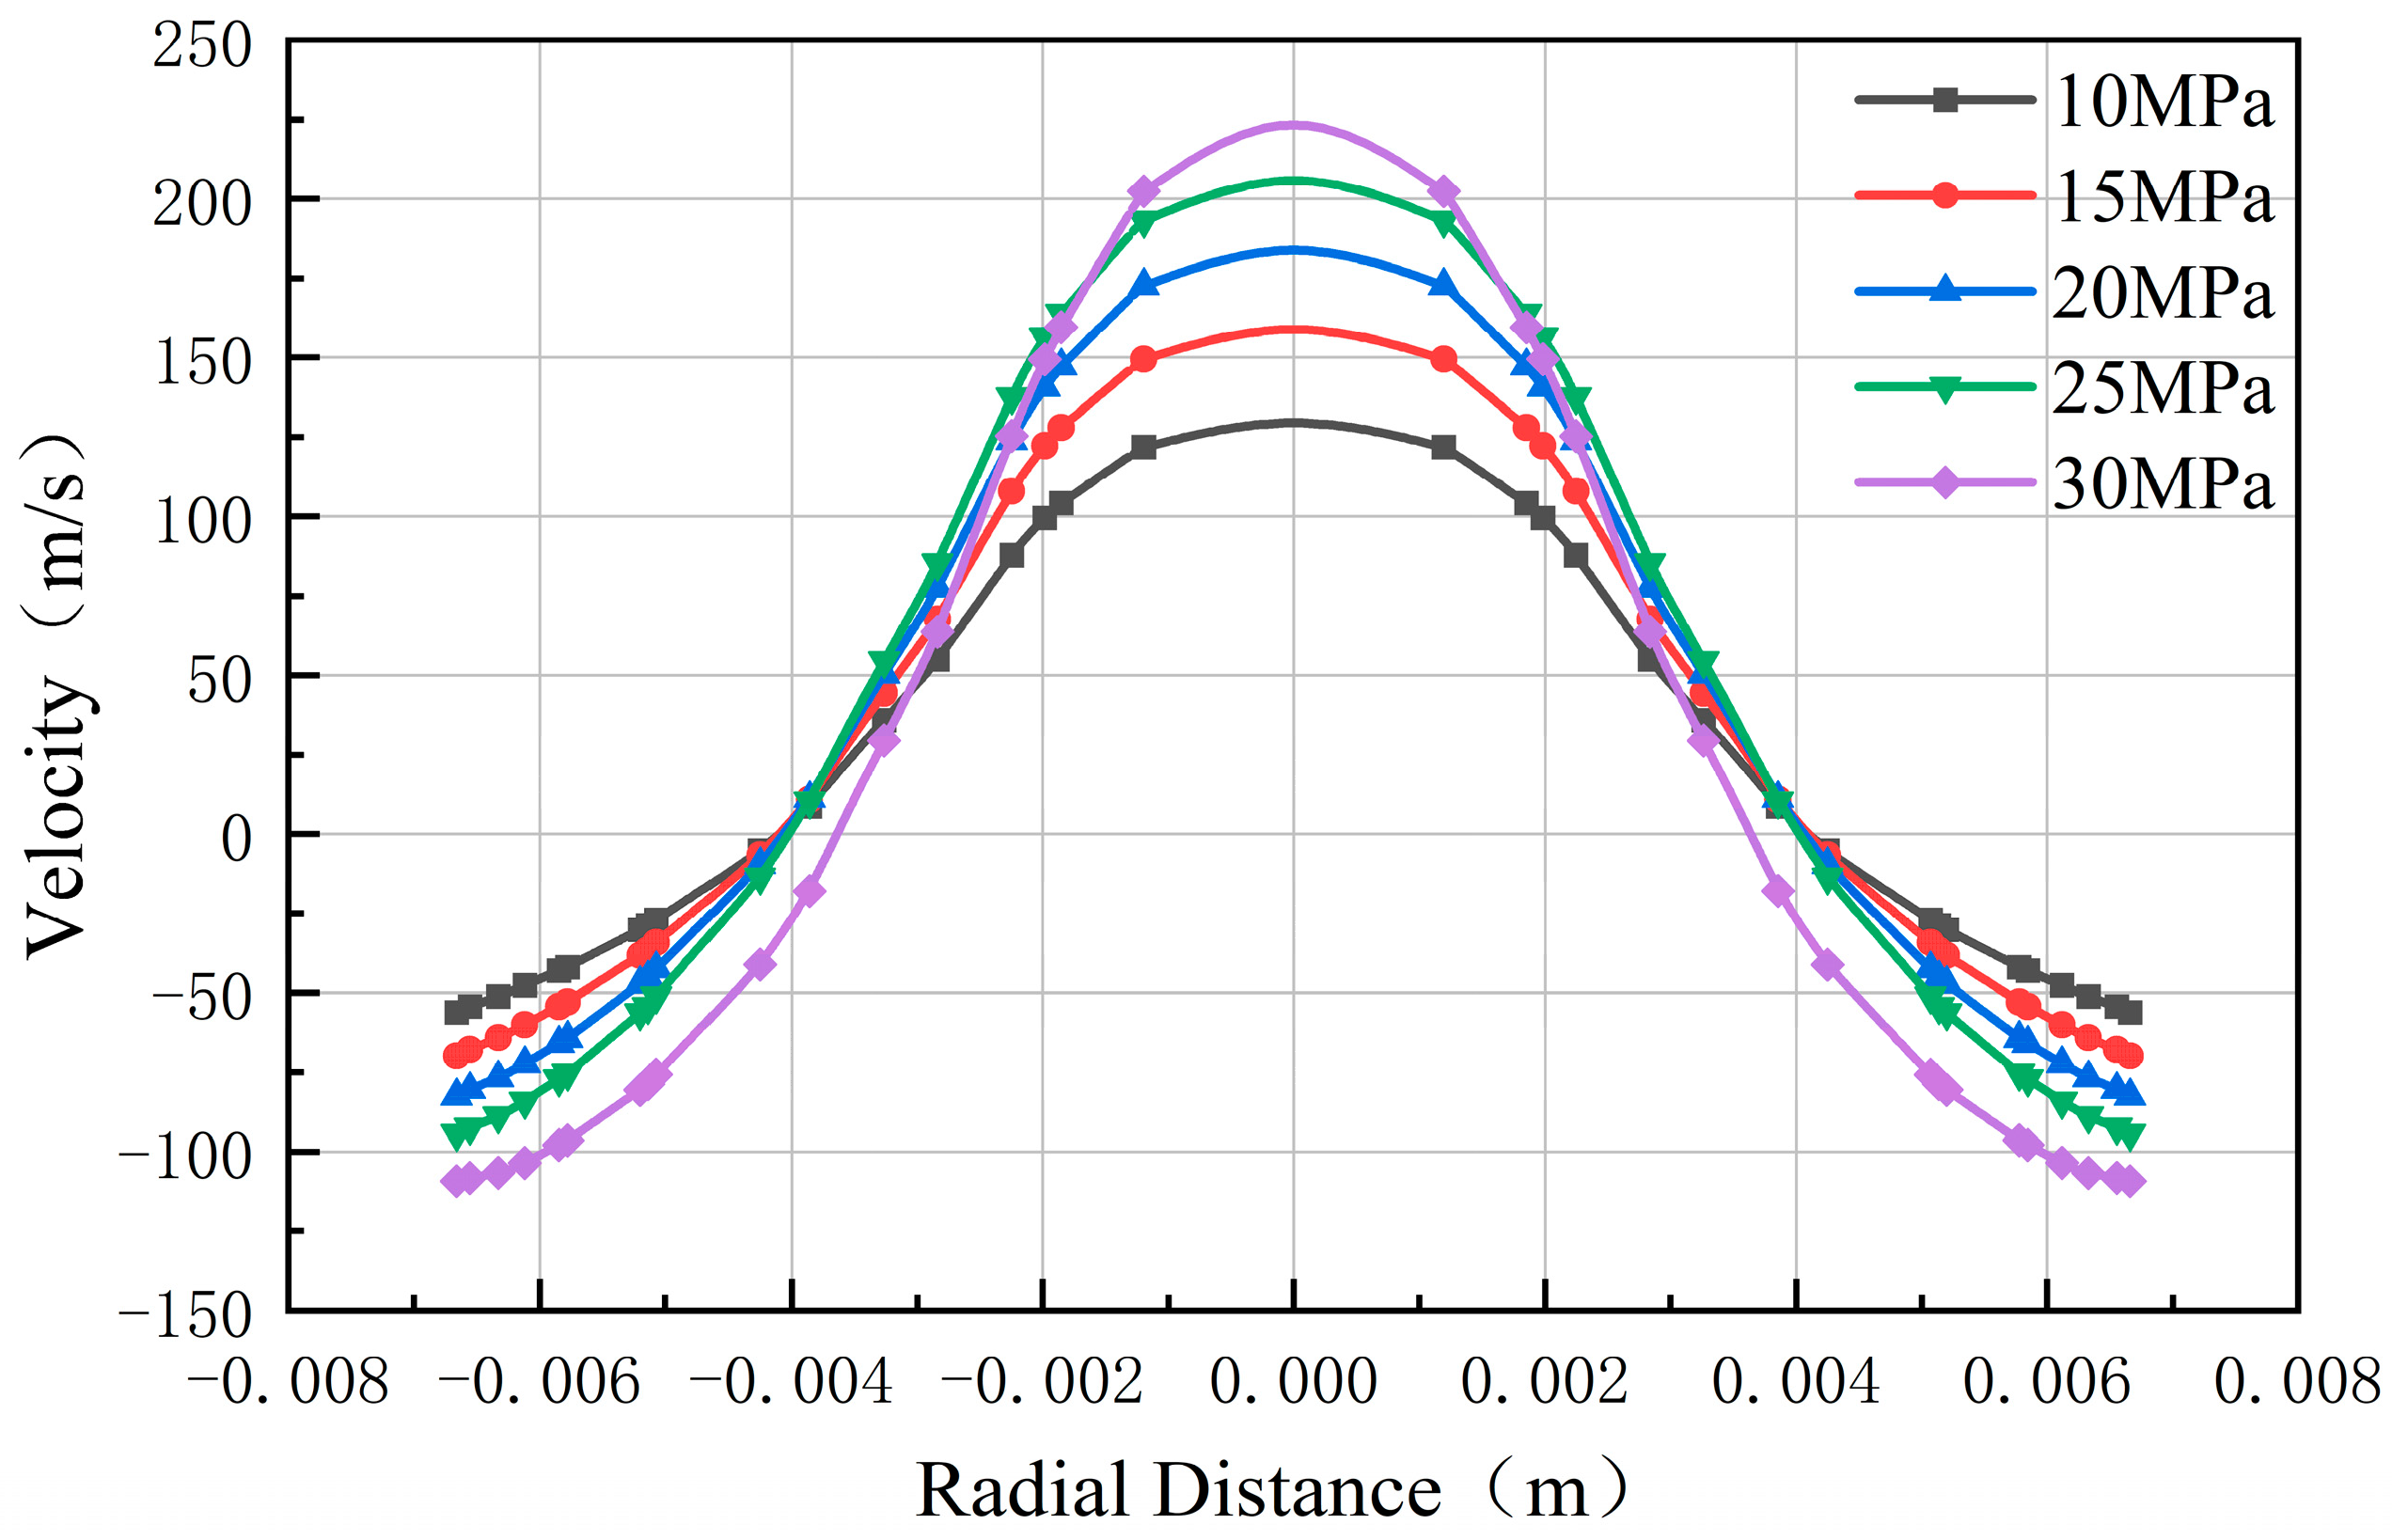
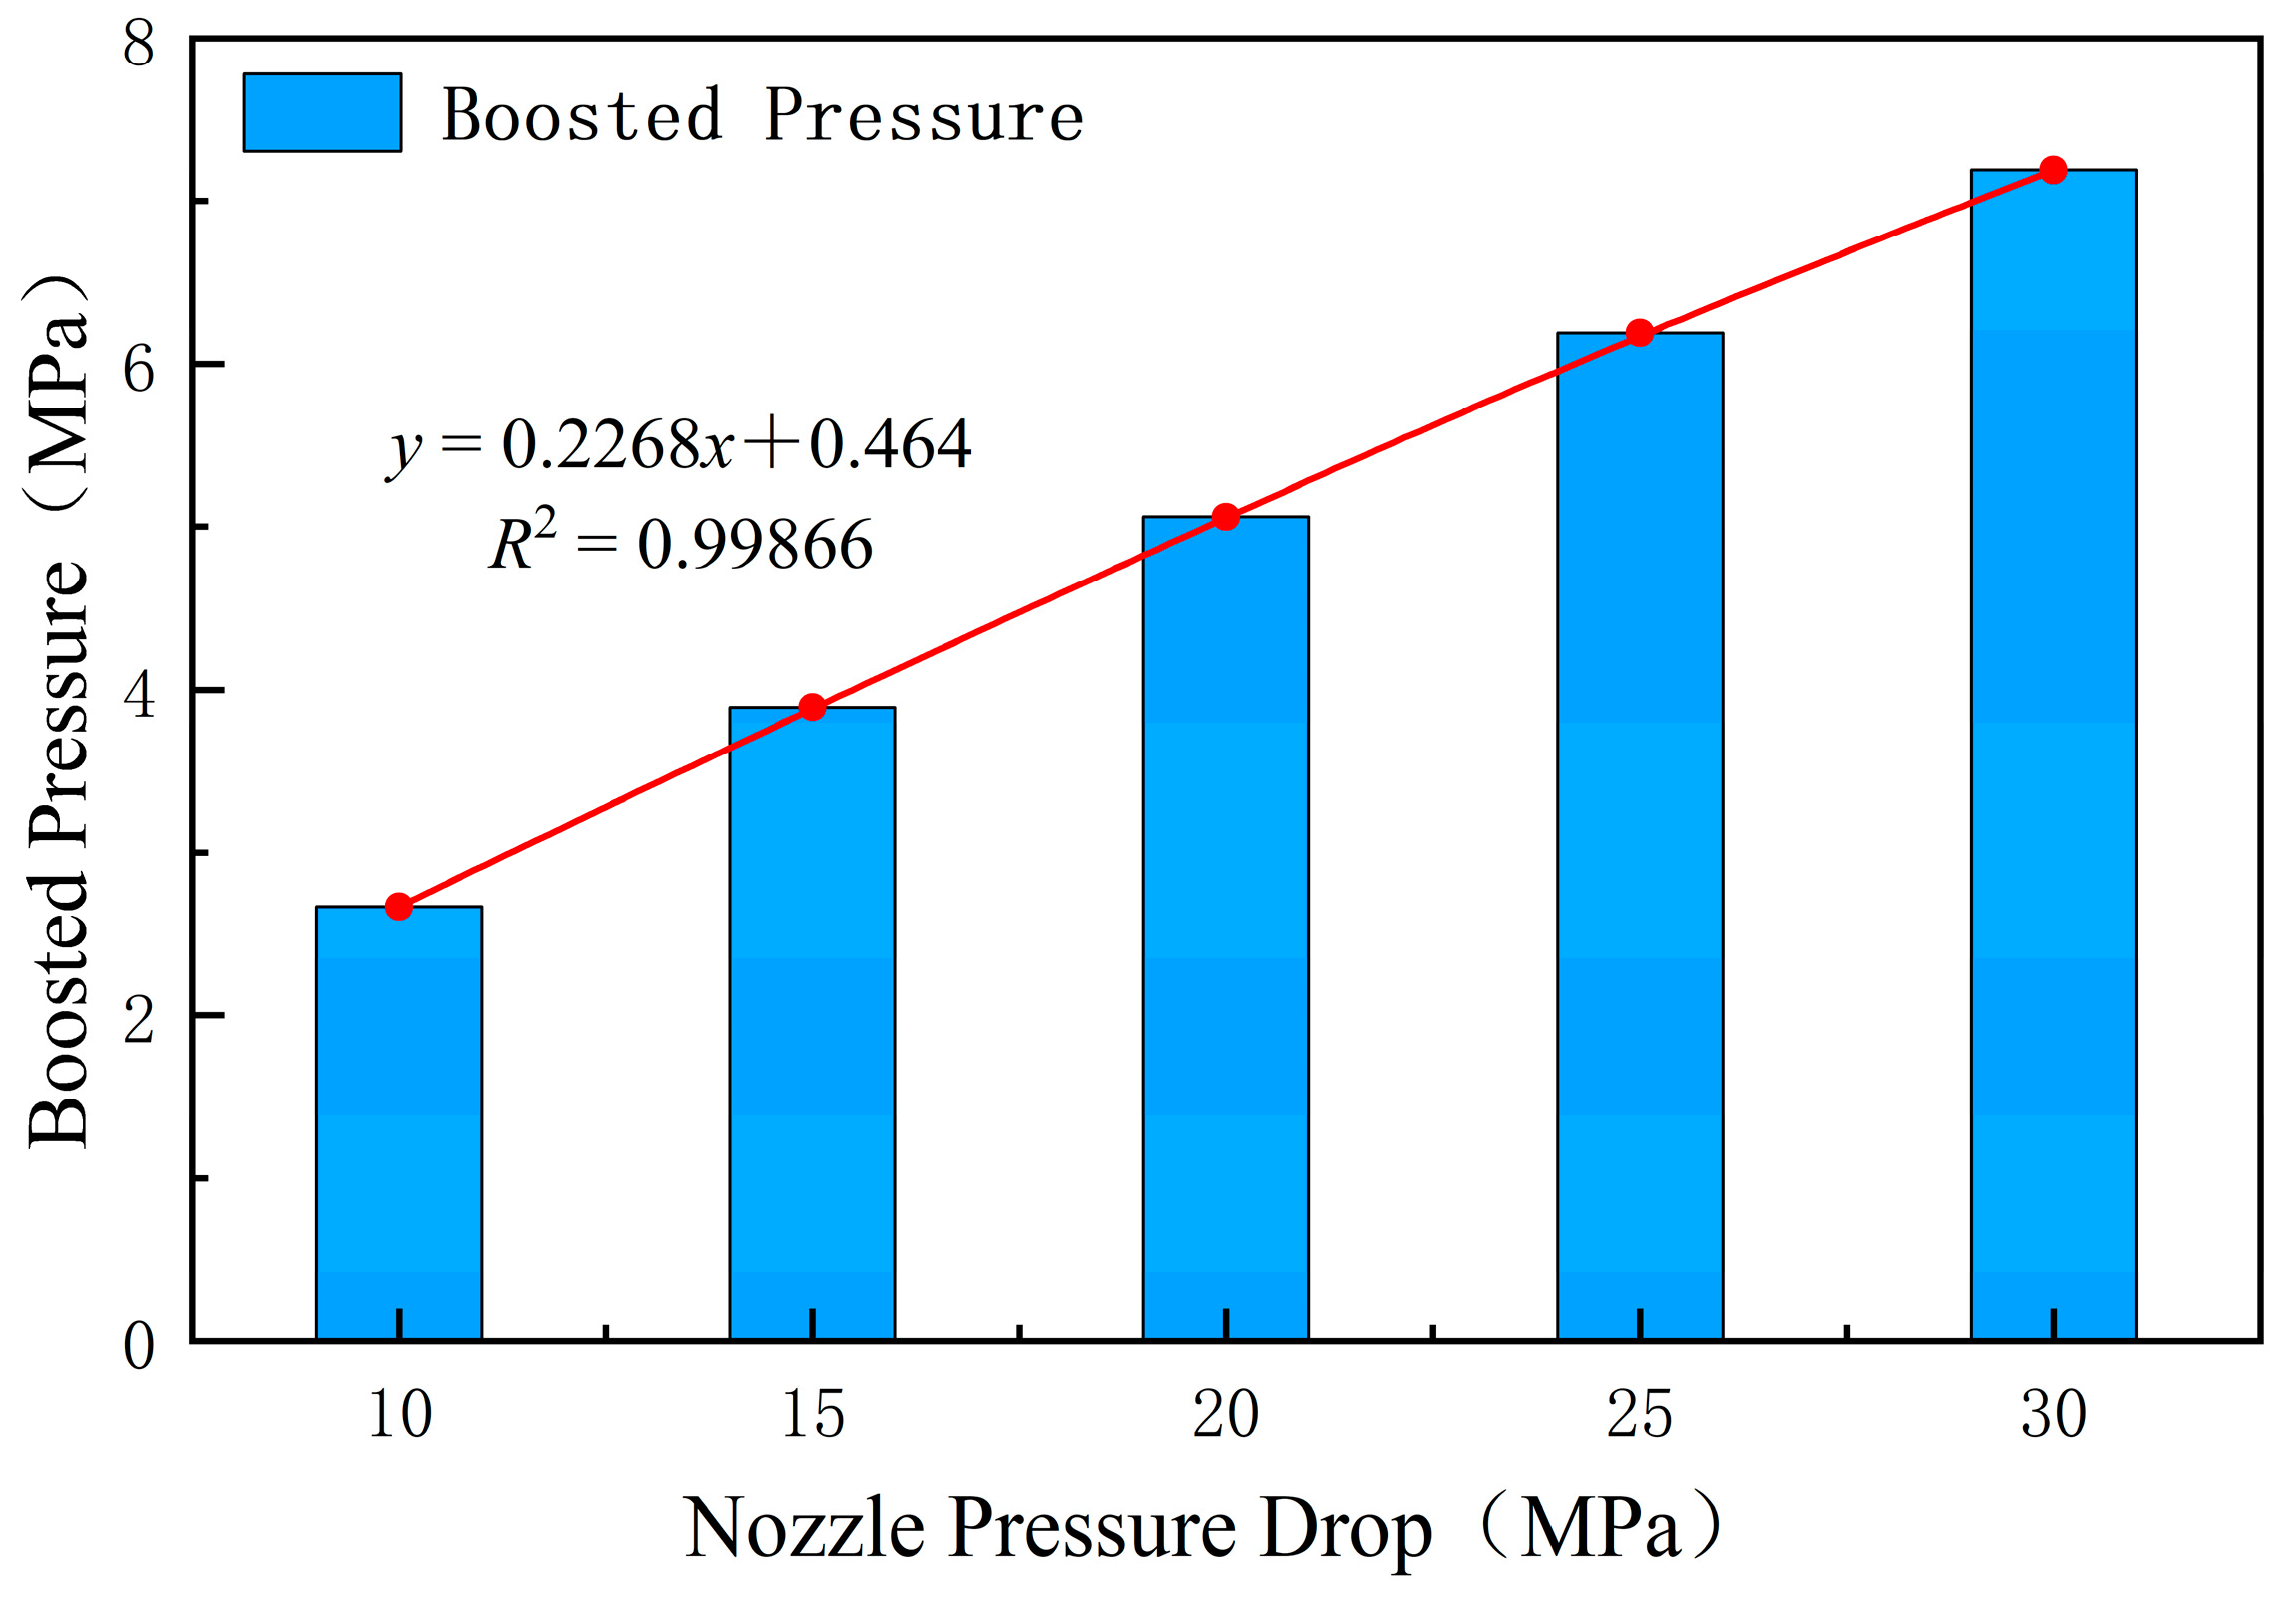
4.1. Nozzle Pressure Drop

The pressure drop of the nozzle is 10 MPa, 15 MPa, 20 MPa, 25 MPa, and 30 MPa, respectively. The radial center line velocity of the inlet of the perforation tunnel is shown in Figure 17. Under certain conditions of other parameters, the proportion of the backflow area to the inlet section of the perforation tunnel will not change with the change in the pressure drop of the nozzle. The greater the pressure drop of the nozzle, the greater the maximum velocity of the jet entering the perforation tunnel. At the same time, the shrinking part of the perforation tunnel plays a sealing role in the jet inside the perforation tunnel. The greater the maximum velocity of the backflow, the greater the stagnation pressure inside the perforation tunnel. As shown in Figure 18, the relationship between the pressurization value and the nozzle pressure drop is roughly linearly increasing, and the fitting degree of the first-order equation R2 is close to 1. This is because the pressure drop of the nozzle determines the kinetic energy of the jet fluid. The fluid is squeezed inside the perforation tunnel, and the kinetic energy of the fluid is converted into pressure energy inside the perforation tunnel, thereby increasing the stagnation pressure in the perforation tunnel.

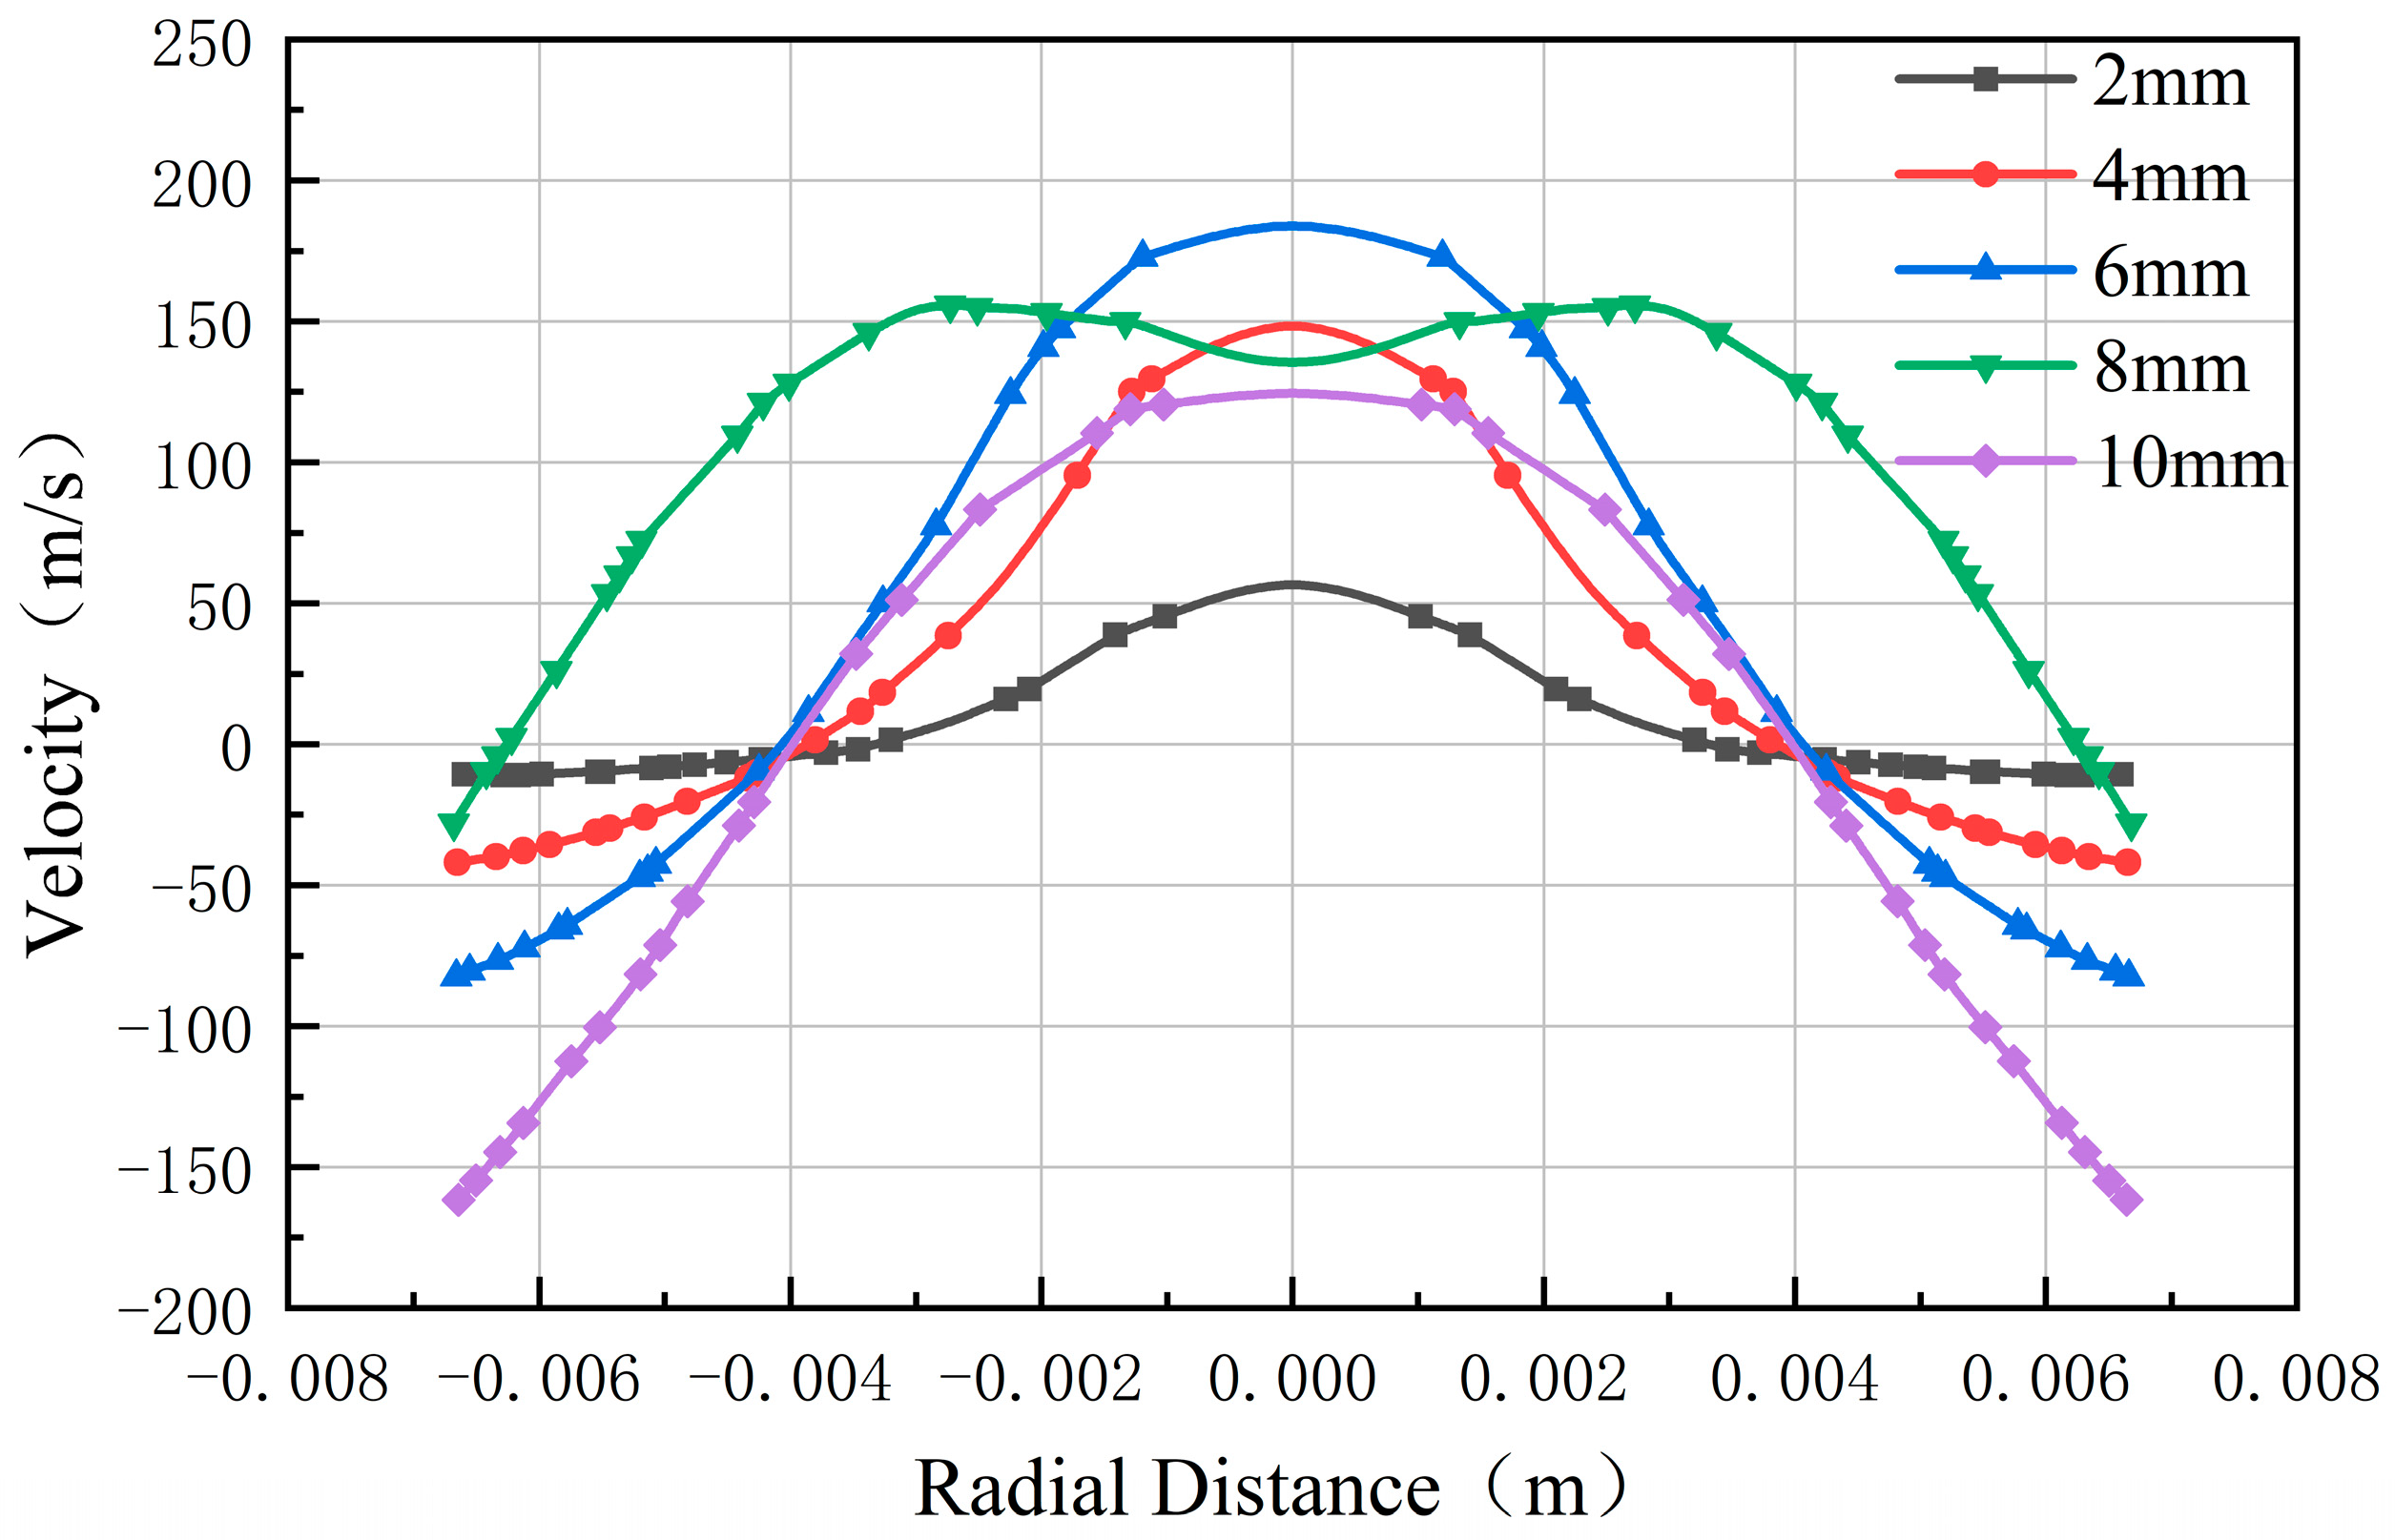
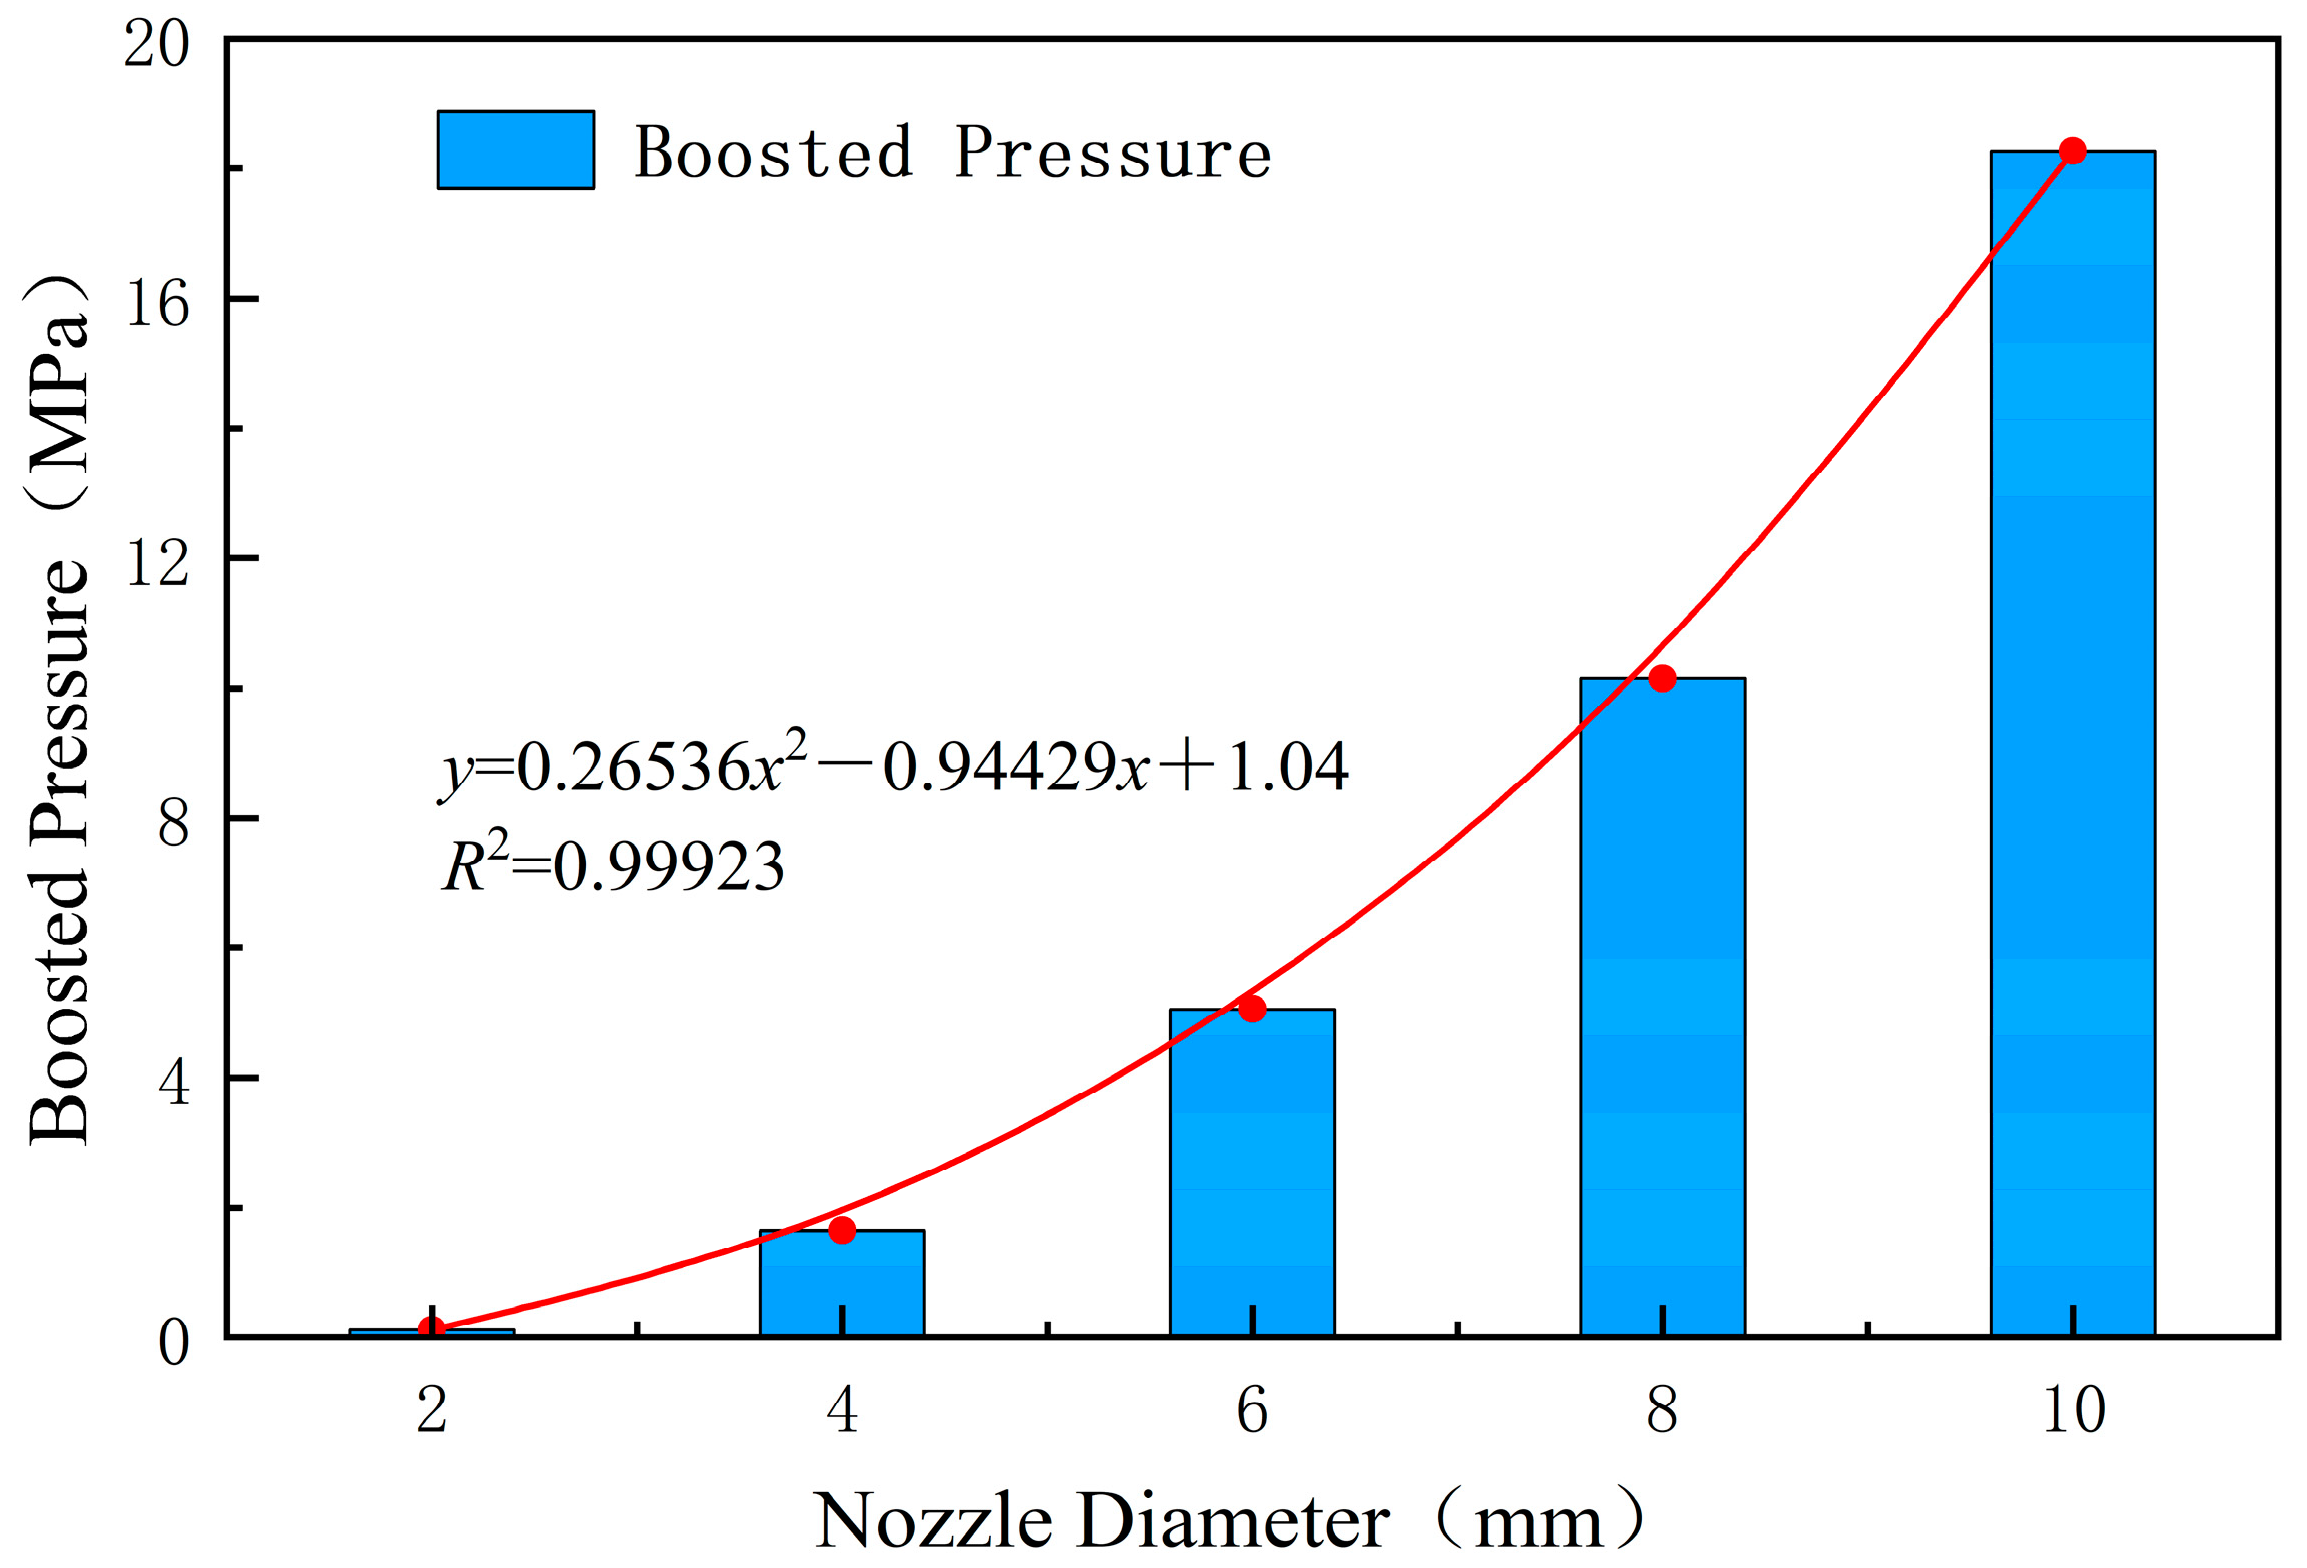
4.2. Nozzle Diameter

The nozzle is set to 2, 4, 6, 8, and 10 mm, respectively. Under certain other conditions, we investigated the effect of different nozzle diameters on the internal pressurization of the channel. From Figure 13, it can be seen that the smaller the nozzle diameter is, the larger the cross-sectional area of the backflow area in the inlet of the perforation tunnel is. This is because the smaller the nozzle diameter is, the smaller the jet flow per unit time is, the smaller the jet structure is, the weaker the squeezing effect of the subsequent jet on the jet entering the perforation tunnel is, and the less obvious the pressurization effect is. As shown in Figure 19, the larger the nozzle diameter, the larger the jet structure of the liquid nitrogen jet, the larger the jet velocity peak, the greater the kinetic energy of the fluid, the stronger the squeezing effect on the fluid in the perforation tunnel, and the greater the pressurization value in the perforation tunnel. As shown in Figure 20, the nozzle diameter is positively correlated with the pressurization value. The relationship between the two is fitted by a quadratic curve, and the fitting degree R2 is close to 1. However, it is not true that the larger nozzle is better. The choice of nozzle diameter should be matched with the casing hole diameter. In this study, we set the casing hole diameter at 14 mm. When the nozzle diameter is 10 mm, the pressurization effect is lower than that of the 8 mm diameter nozzle. This is because the nozzle diameter is too large. When it is matched with the 14 mm casing hole diameter, the jet structure of the 10 mm diameter nozzle is too large, resulting in a considerable part of the jet being blocked outside the inlet of the perforation tunnel, resulting in the jet being unable to enter the perforation tunnel completely, and thus there is a part of the energy loss, resulting in the phenomenon that the pressurization effect is not as good as that of the 8 mm diameter nozzle. In addition, when the nozzle diameter of 8 mm is matched with the casing hole diameter of 14 mm, the peak velocity is distributed on both sides of the axis, as shown in Figure 19. The nozzle diameter of 8 mm is also affected by the casing hole diameter of 14 mm, which shows that the size of the casing hole diameter will restrict the pressurization capacity of the large-diameter nozzle.

4.3. Casing Hole Diameter

The casing hole diameter is set to 10, 12, 14, 16, 18, and 20 mm, respectively, to study the influence of the size of the casing hole diameter on the perforation tunnel pressurization. Under the condition of other parameters, as shown in Figure 21, the larger the diameter of the selected casing, the larger the area of the jet inlet and reflux areas during operation. The sealing effect of the fluid in the channel is weaker, and the squeezing effect between the fluids will also be weakened, thereby reducing the pressure boosting effect in the channel. As shown in Figure 22, the pressurization value is negatively correlated with the diameter of the casing hole, and the quadratic curve fitting degree R2 is close to 1. This is because the size of the casing hole diameter plays a decisive role in the sealing and blocking effect of the jet backflow. From this, it can be seen that the smaller the diameter of the casing, the stronger its sealing effect on the internal fluid of the channel and the better the pressurization effect.

4.4. Ambient Pressure

The ambient pressures were set to 10, 15, 20, 25, and 30 MPa for simulation. Under other unified conditions, the effect of ambient pressure on the fluid pressurization effect in the perforation tunnel was studied. As the ambient pressure increased, the final pressure in the perforation tunnel would increase, but there would be no significant change in the pressurization value. As shown in Figure 23, under different ambient pressure conditions, the flow field velocity will not change; that is, the size of the ambient pressure will not change the migration state of the flow field. As shown in Figure 24, the pressurization value under different ambient pressures does not exceed 0.2 MPa, and the pressurization effect does not change with the change of ambient pressure. At the same time, it can be seen that the ambient pressure is the guarantee of a stable pressurization effect. When the ambient pressure is stable, the pressurization effect is also stable, which plays a role in maintaining the pressurization stability.

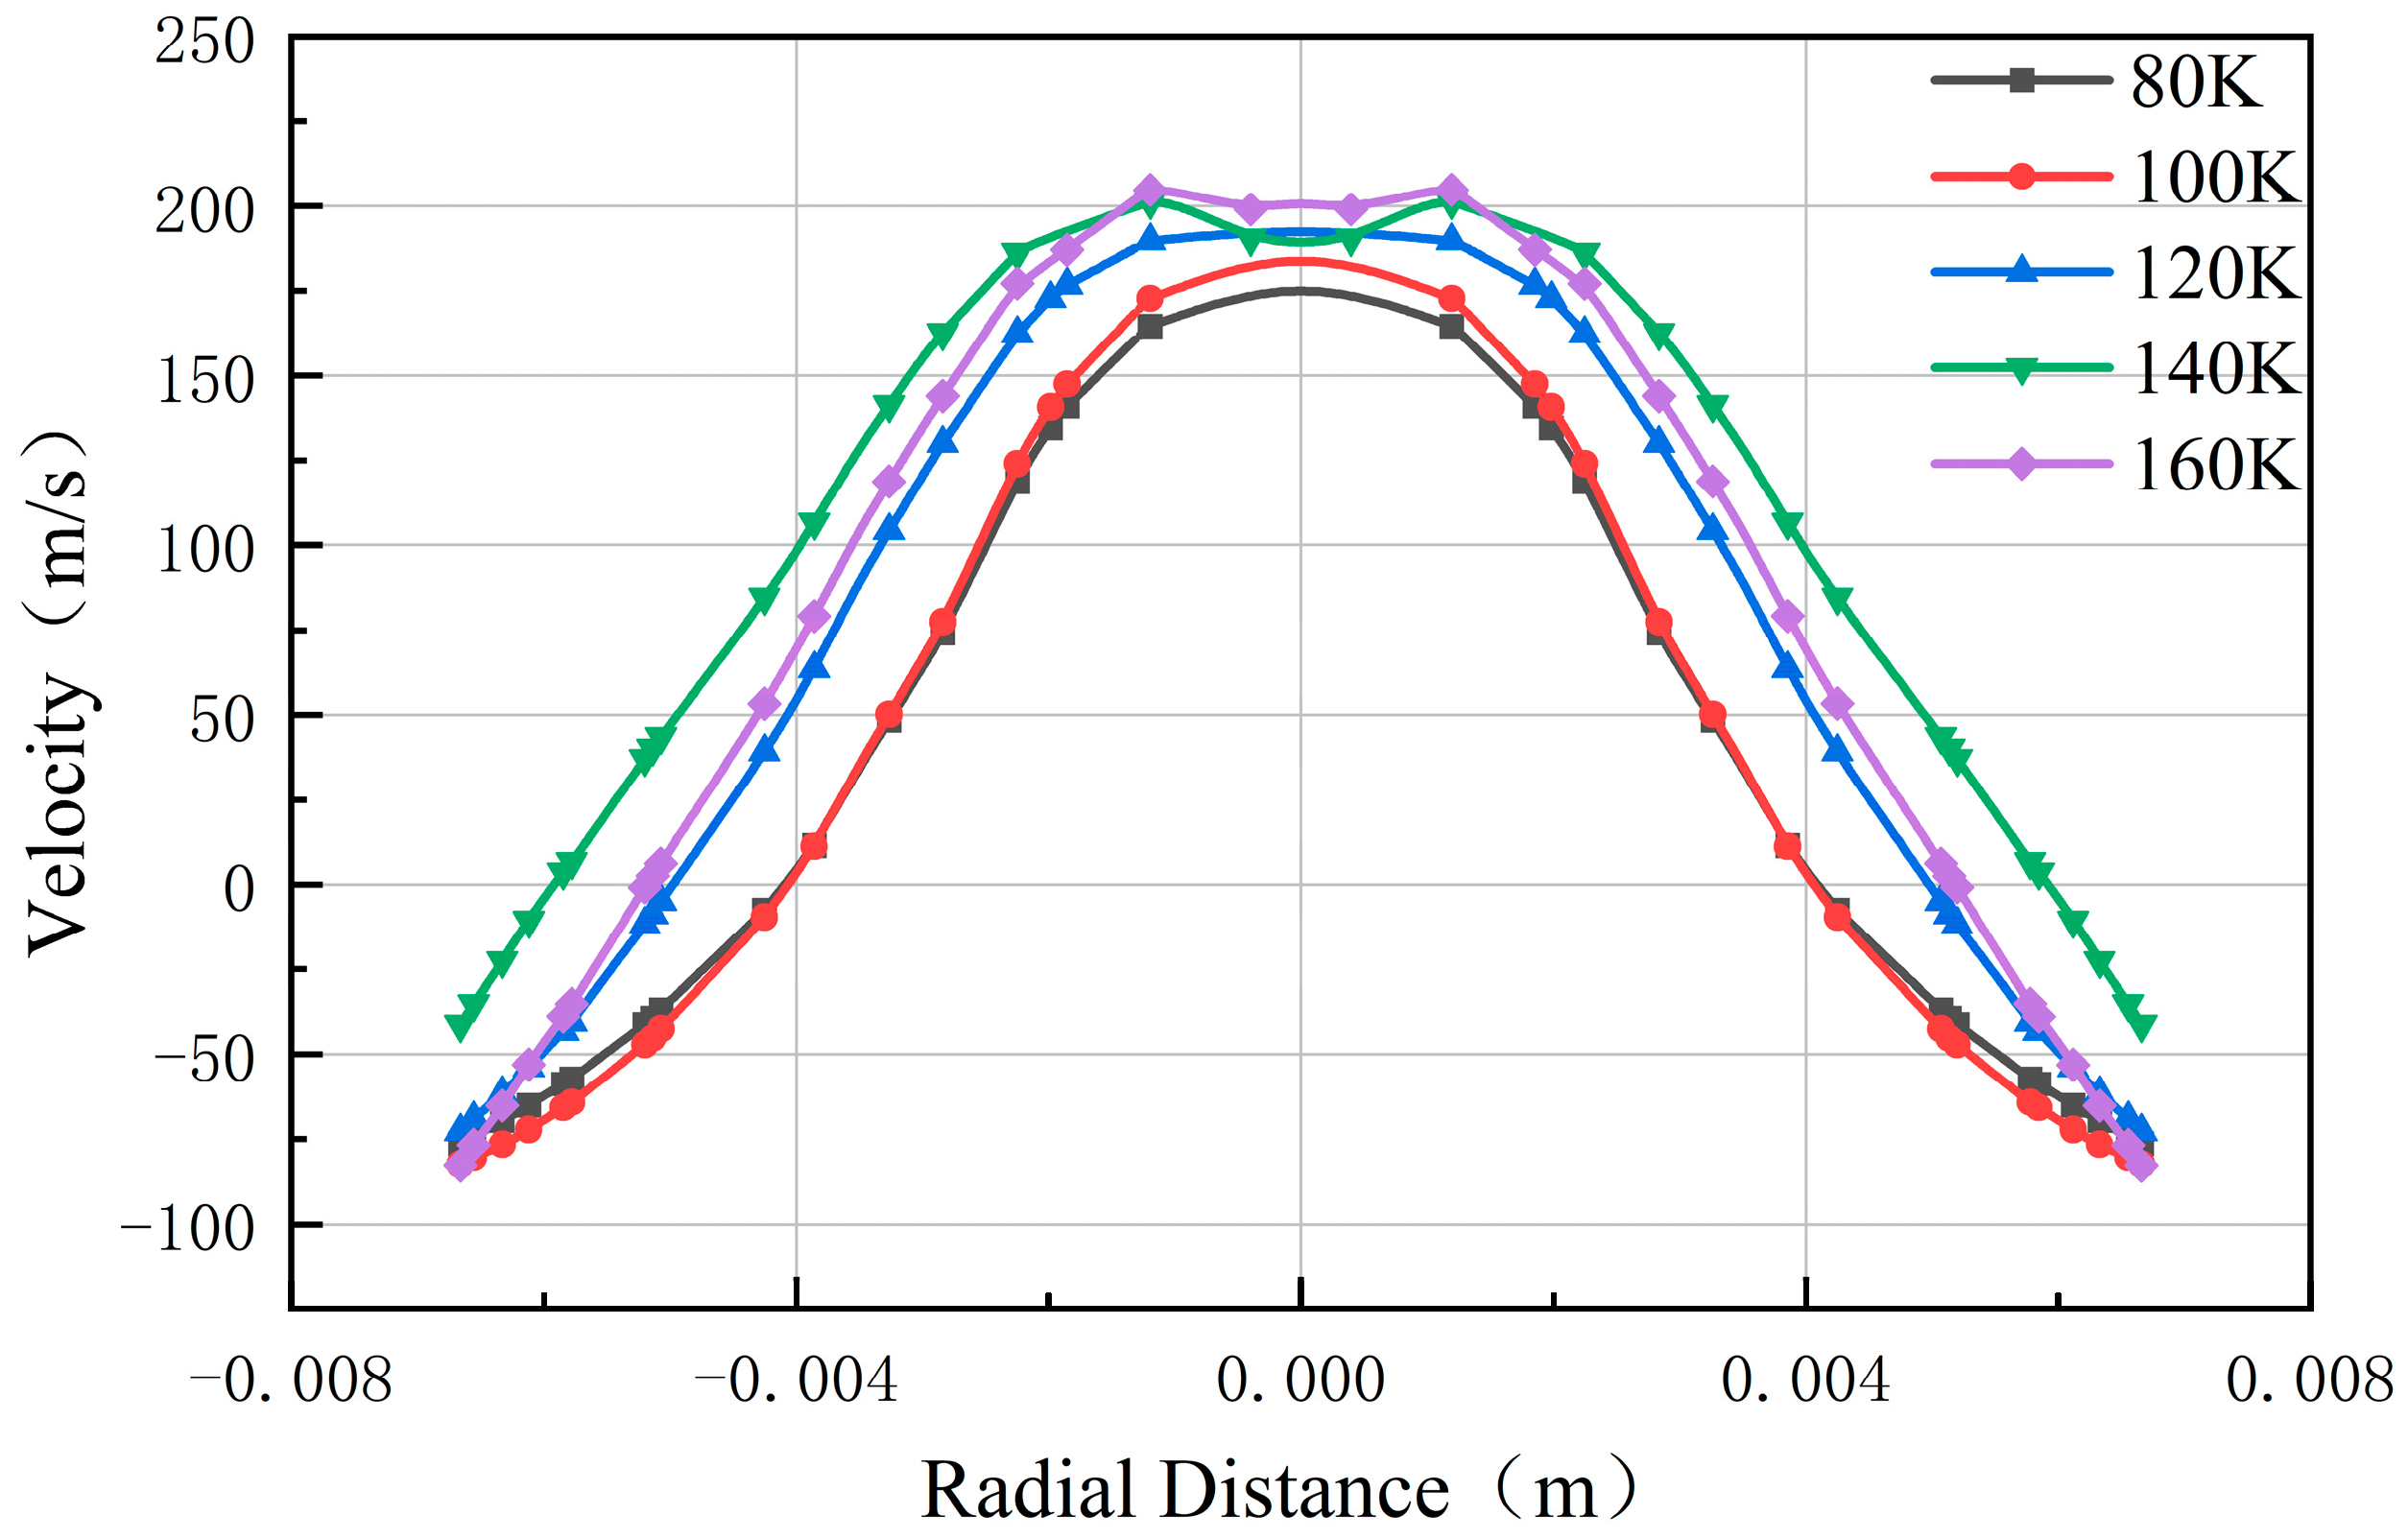
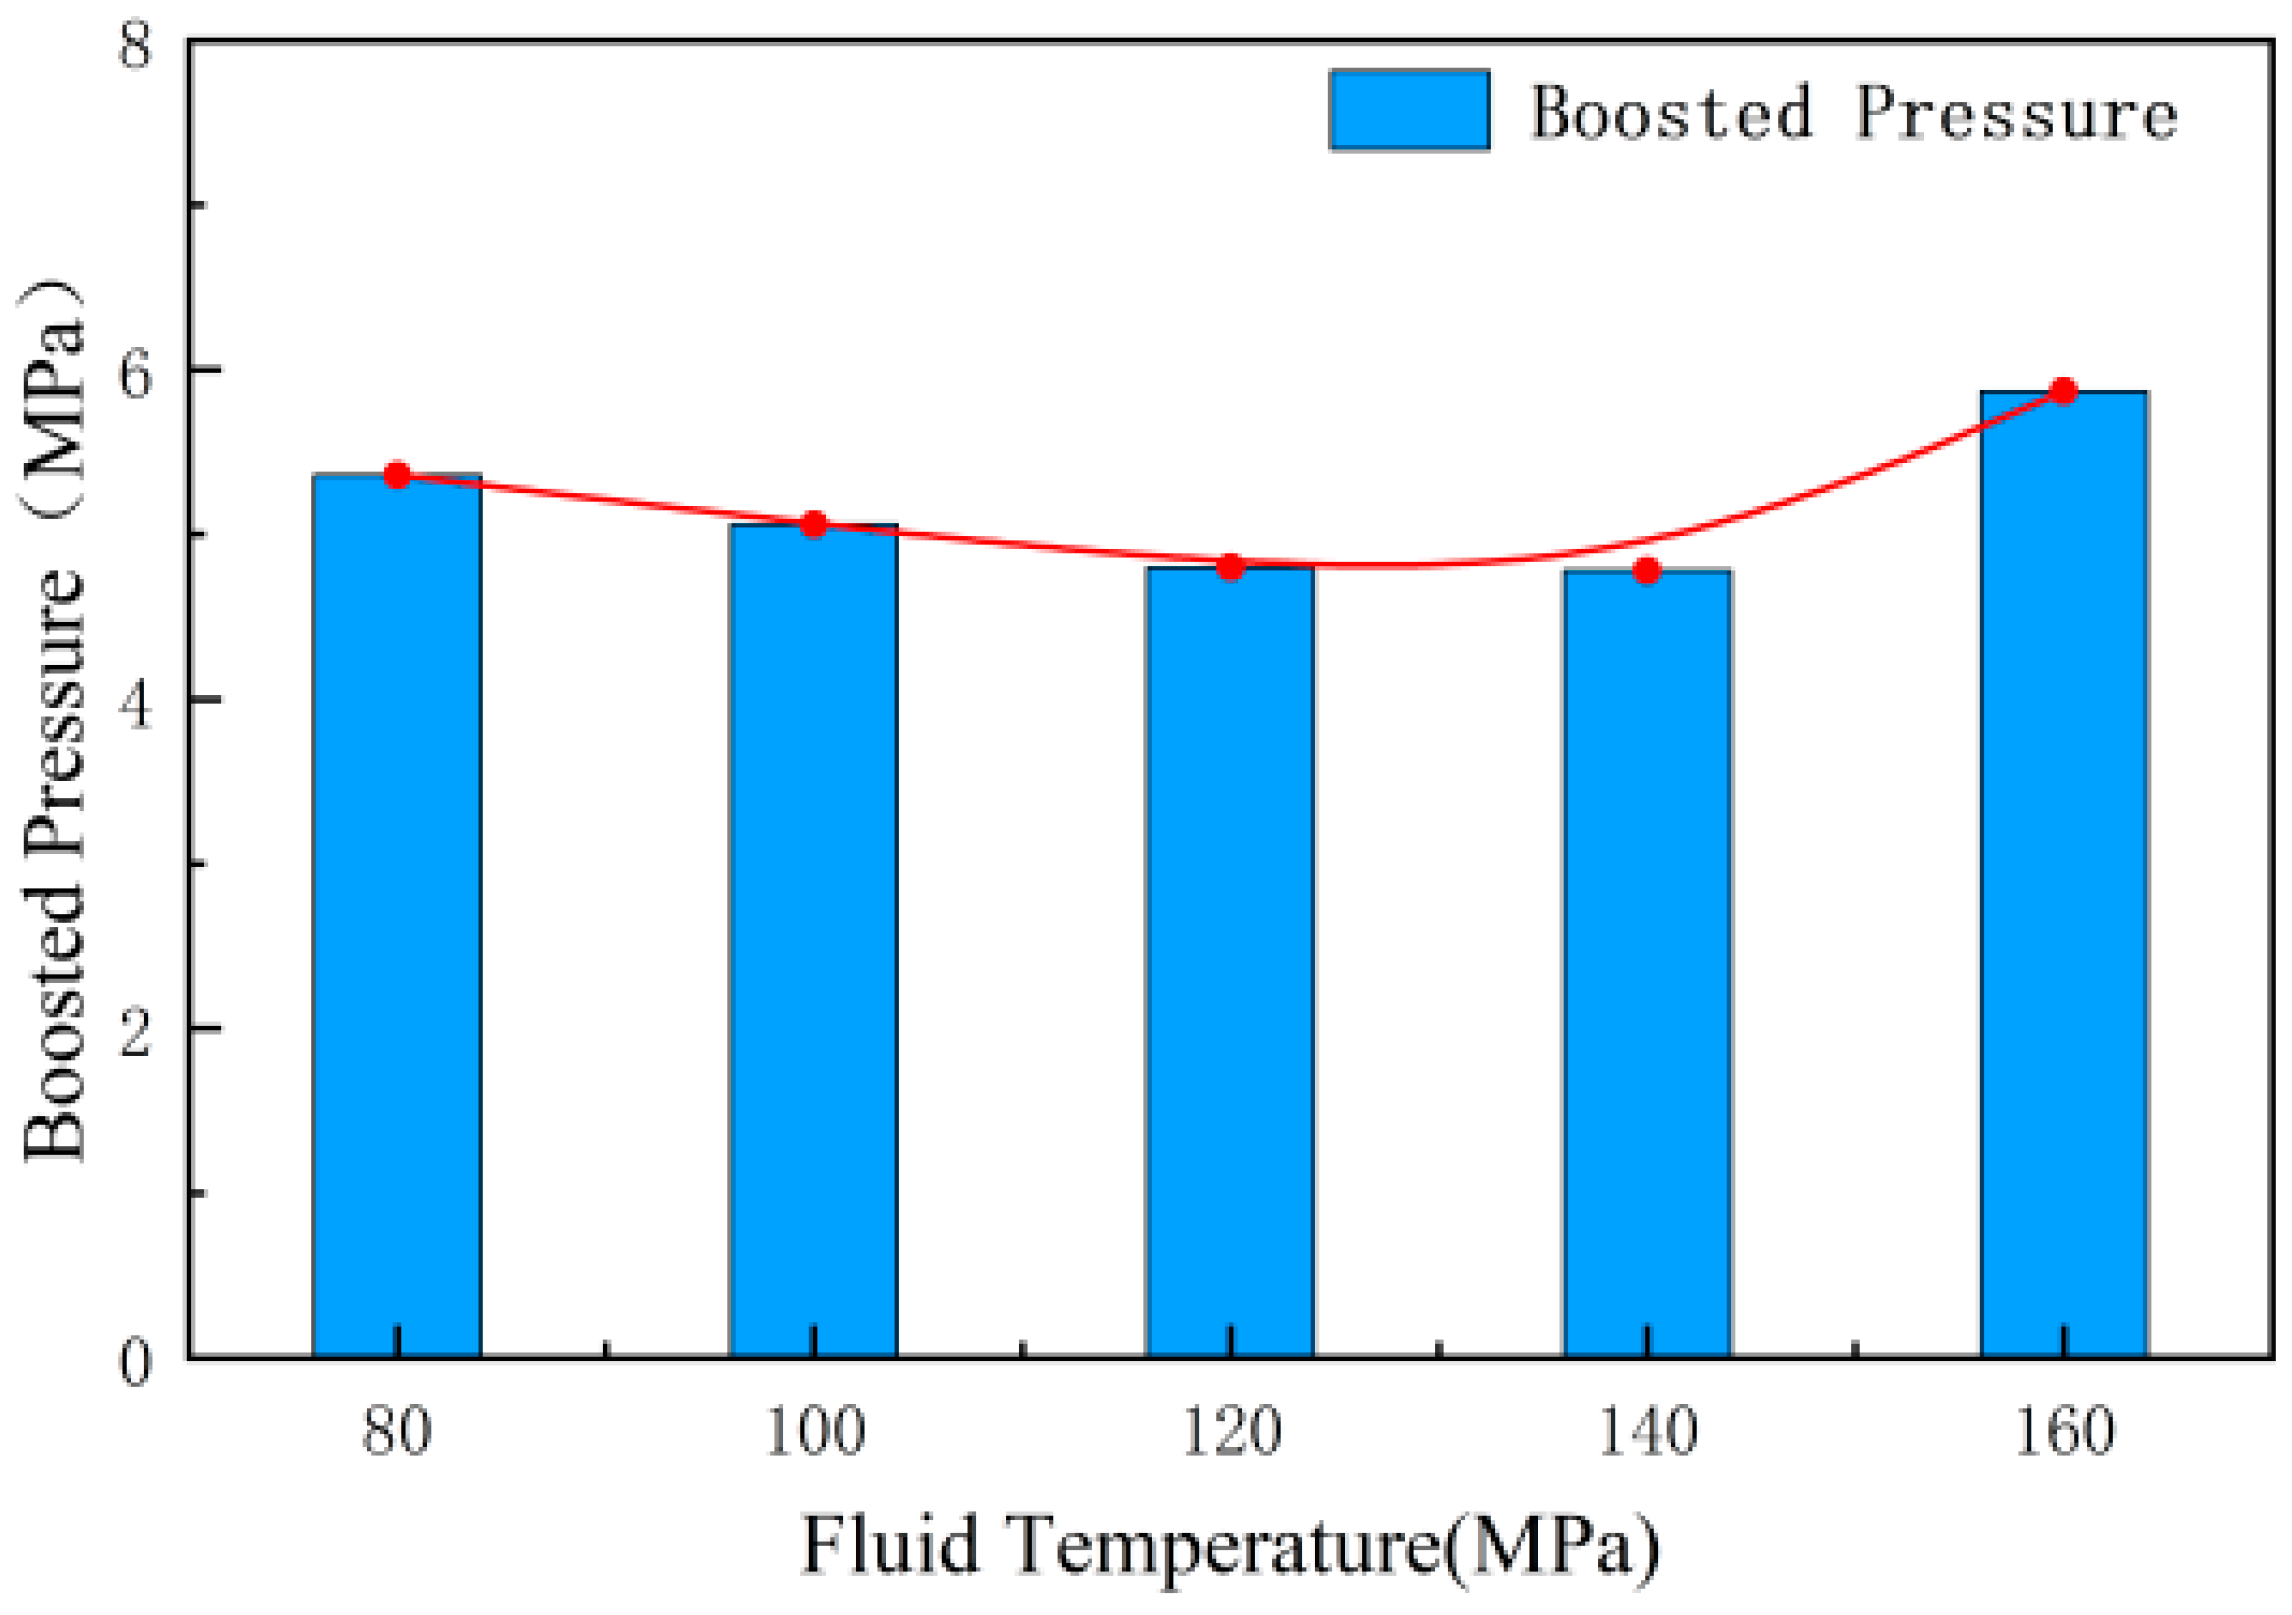
4.5. Fluid Temperature

The effect of temperature on the pressurization effect is studied by setting different jet fluid temperatures. When other conditions remain unchanged, the change in fluid temperature will not have much effect on the ability of the jet to enter and exit the perforation tunnel. As shown in Figure 25, under different temperature conditions, the flow state of the fluid in and out of the perforation tunnel is different, but the proportion of the inflow area and the backflow area will not be affected by the change in temperature. At the same time, the influence of different temperatures on the pressurization effect is not obvious. As shown in Figure 26, the maximum difference of pressurization value under different temperature conditions does not exceed 0.4 MPa, so the fluid temperature is not the influencing factor of the pressurization effect.

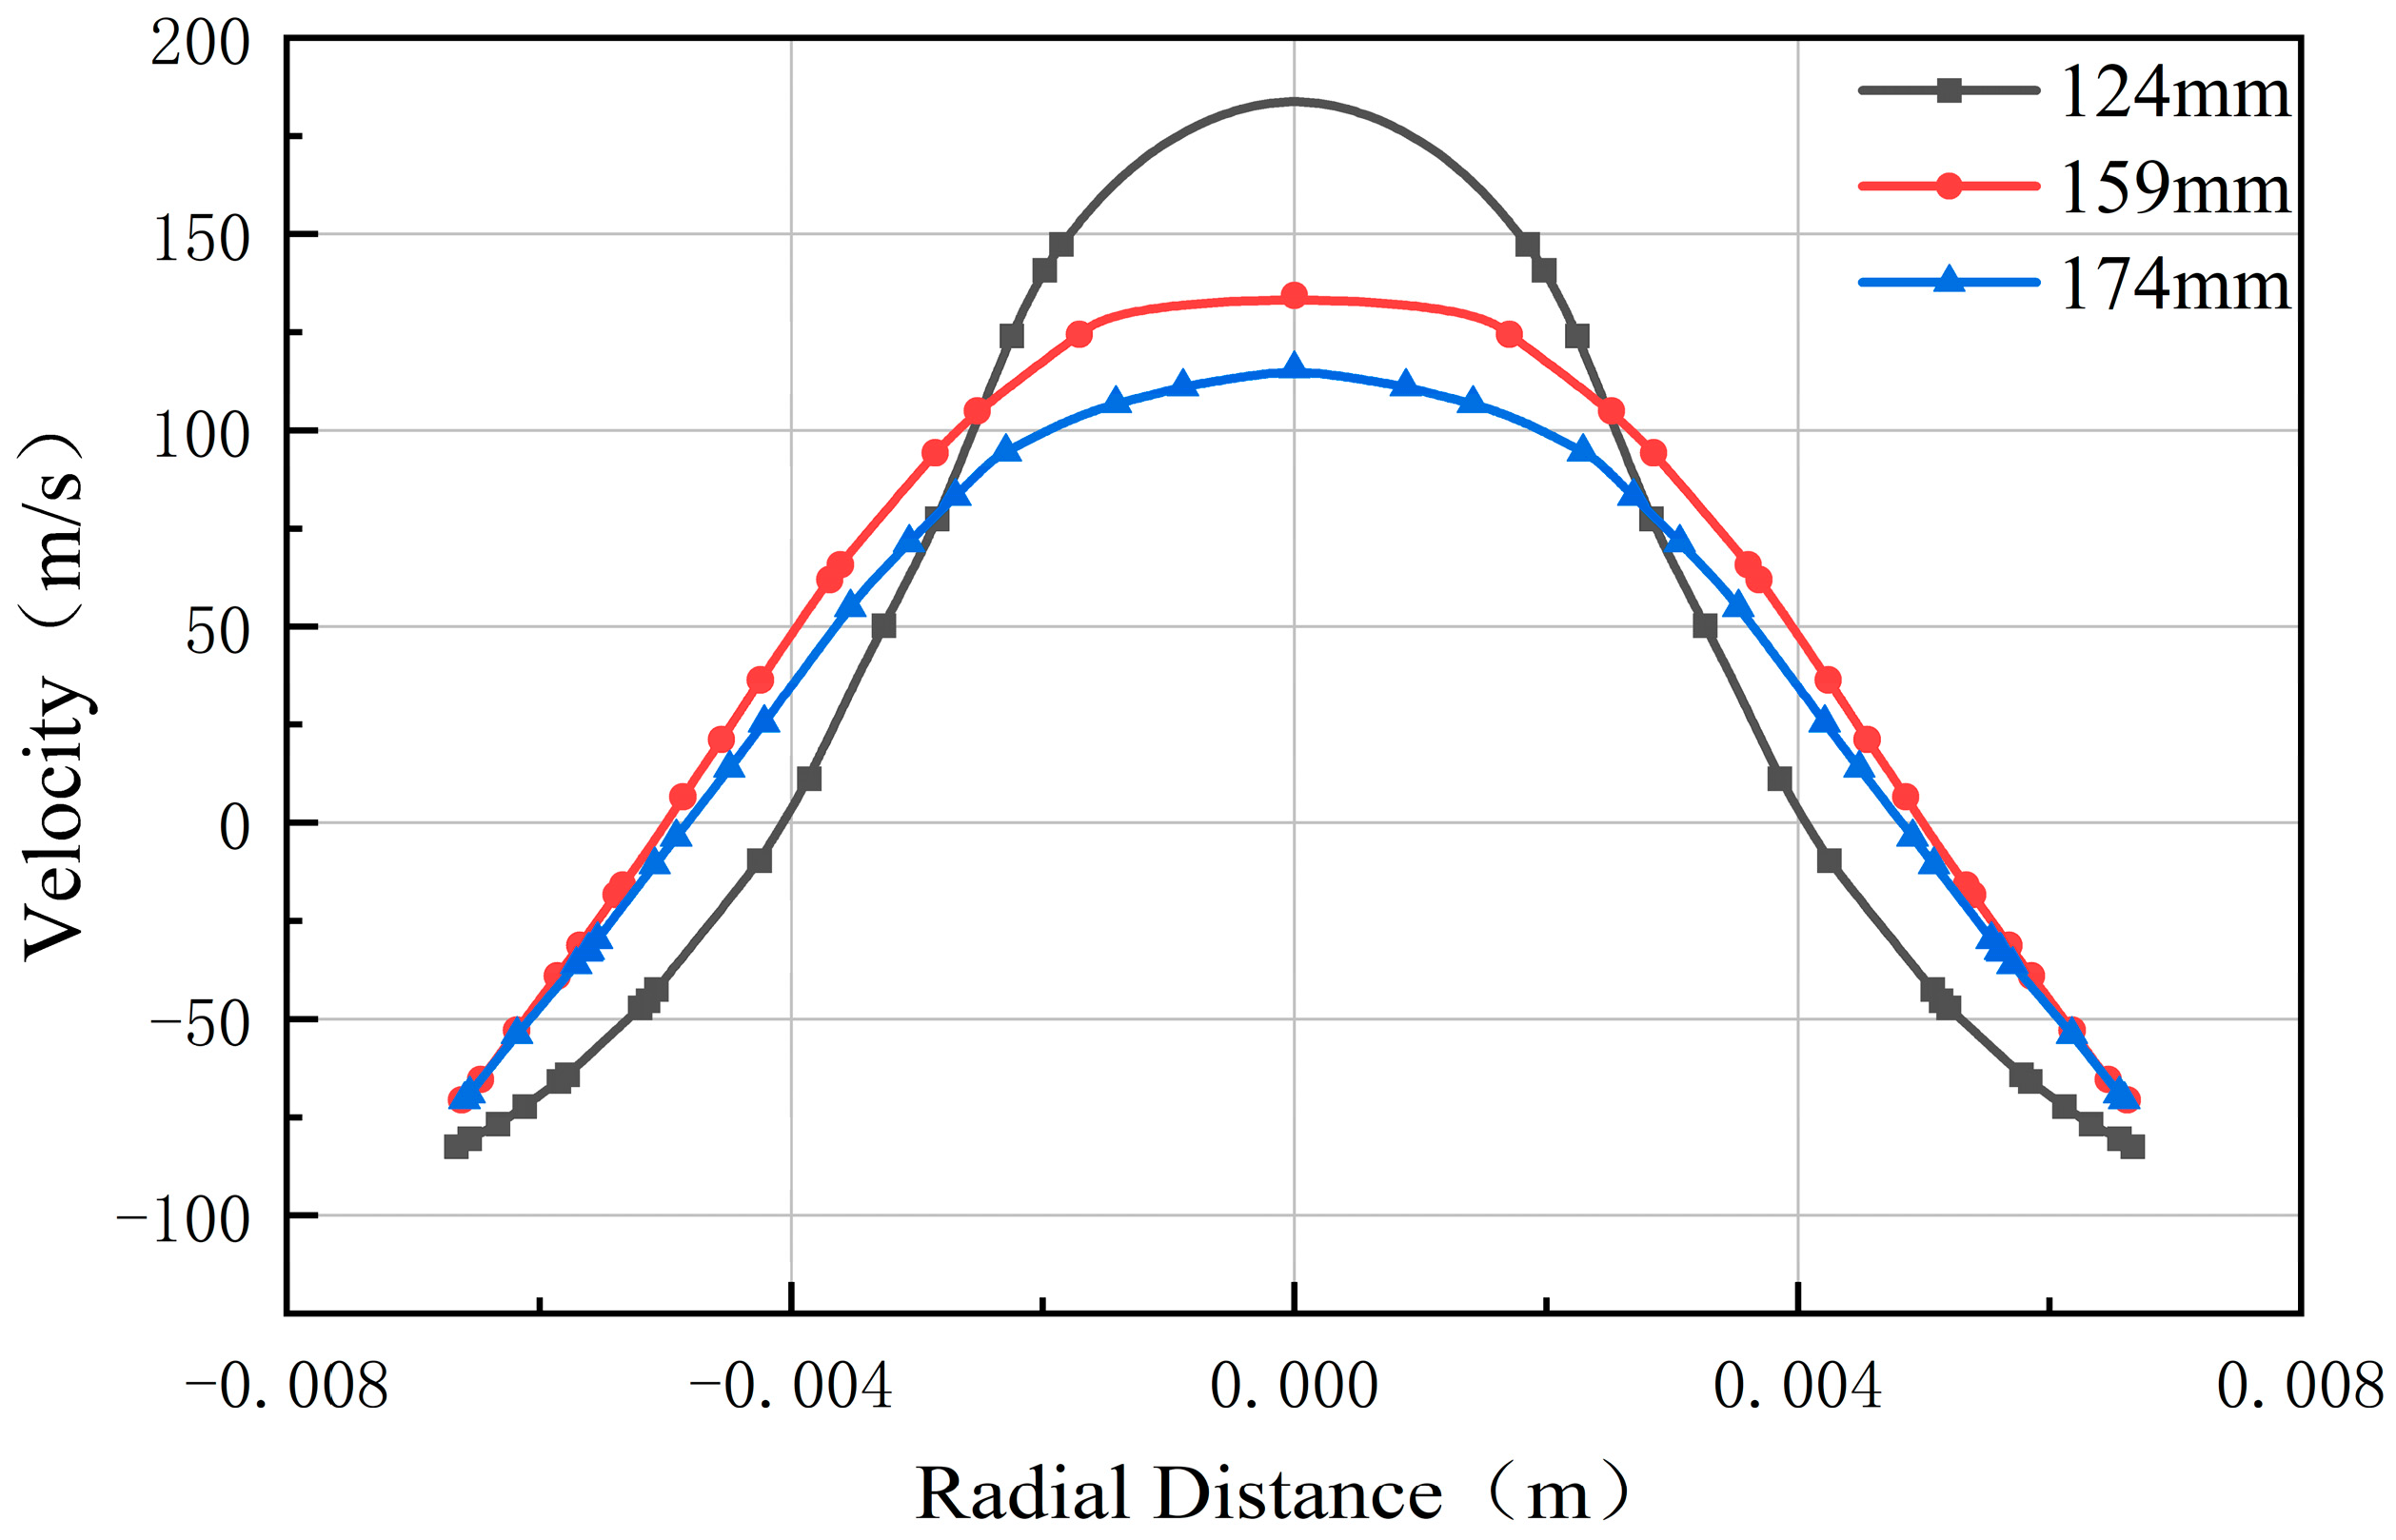
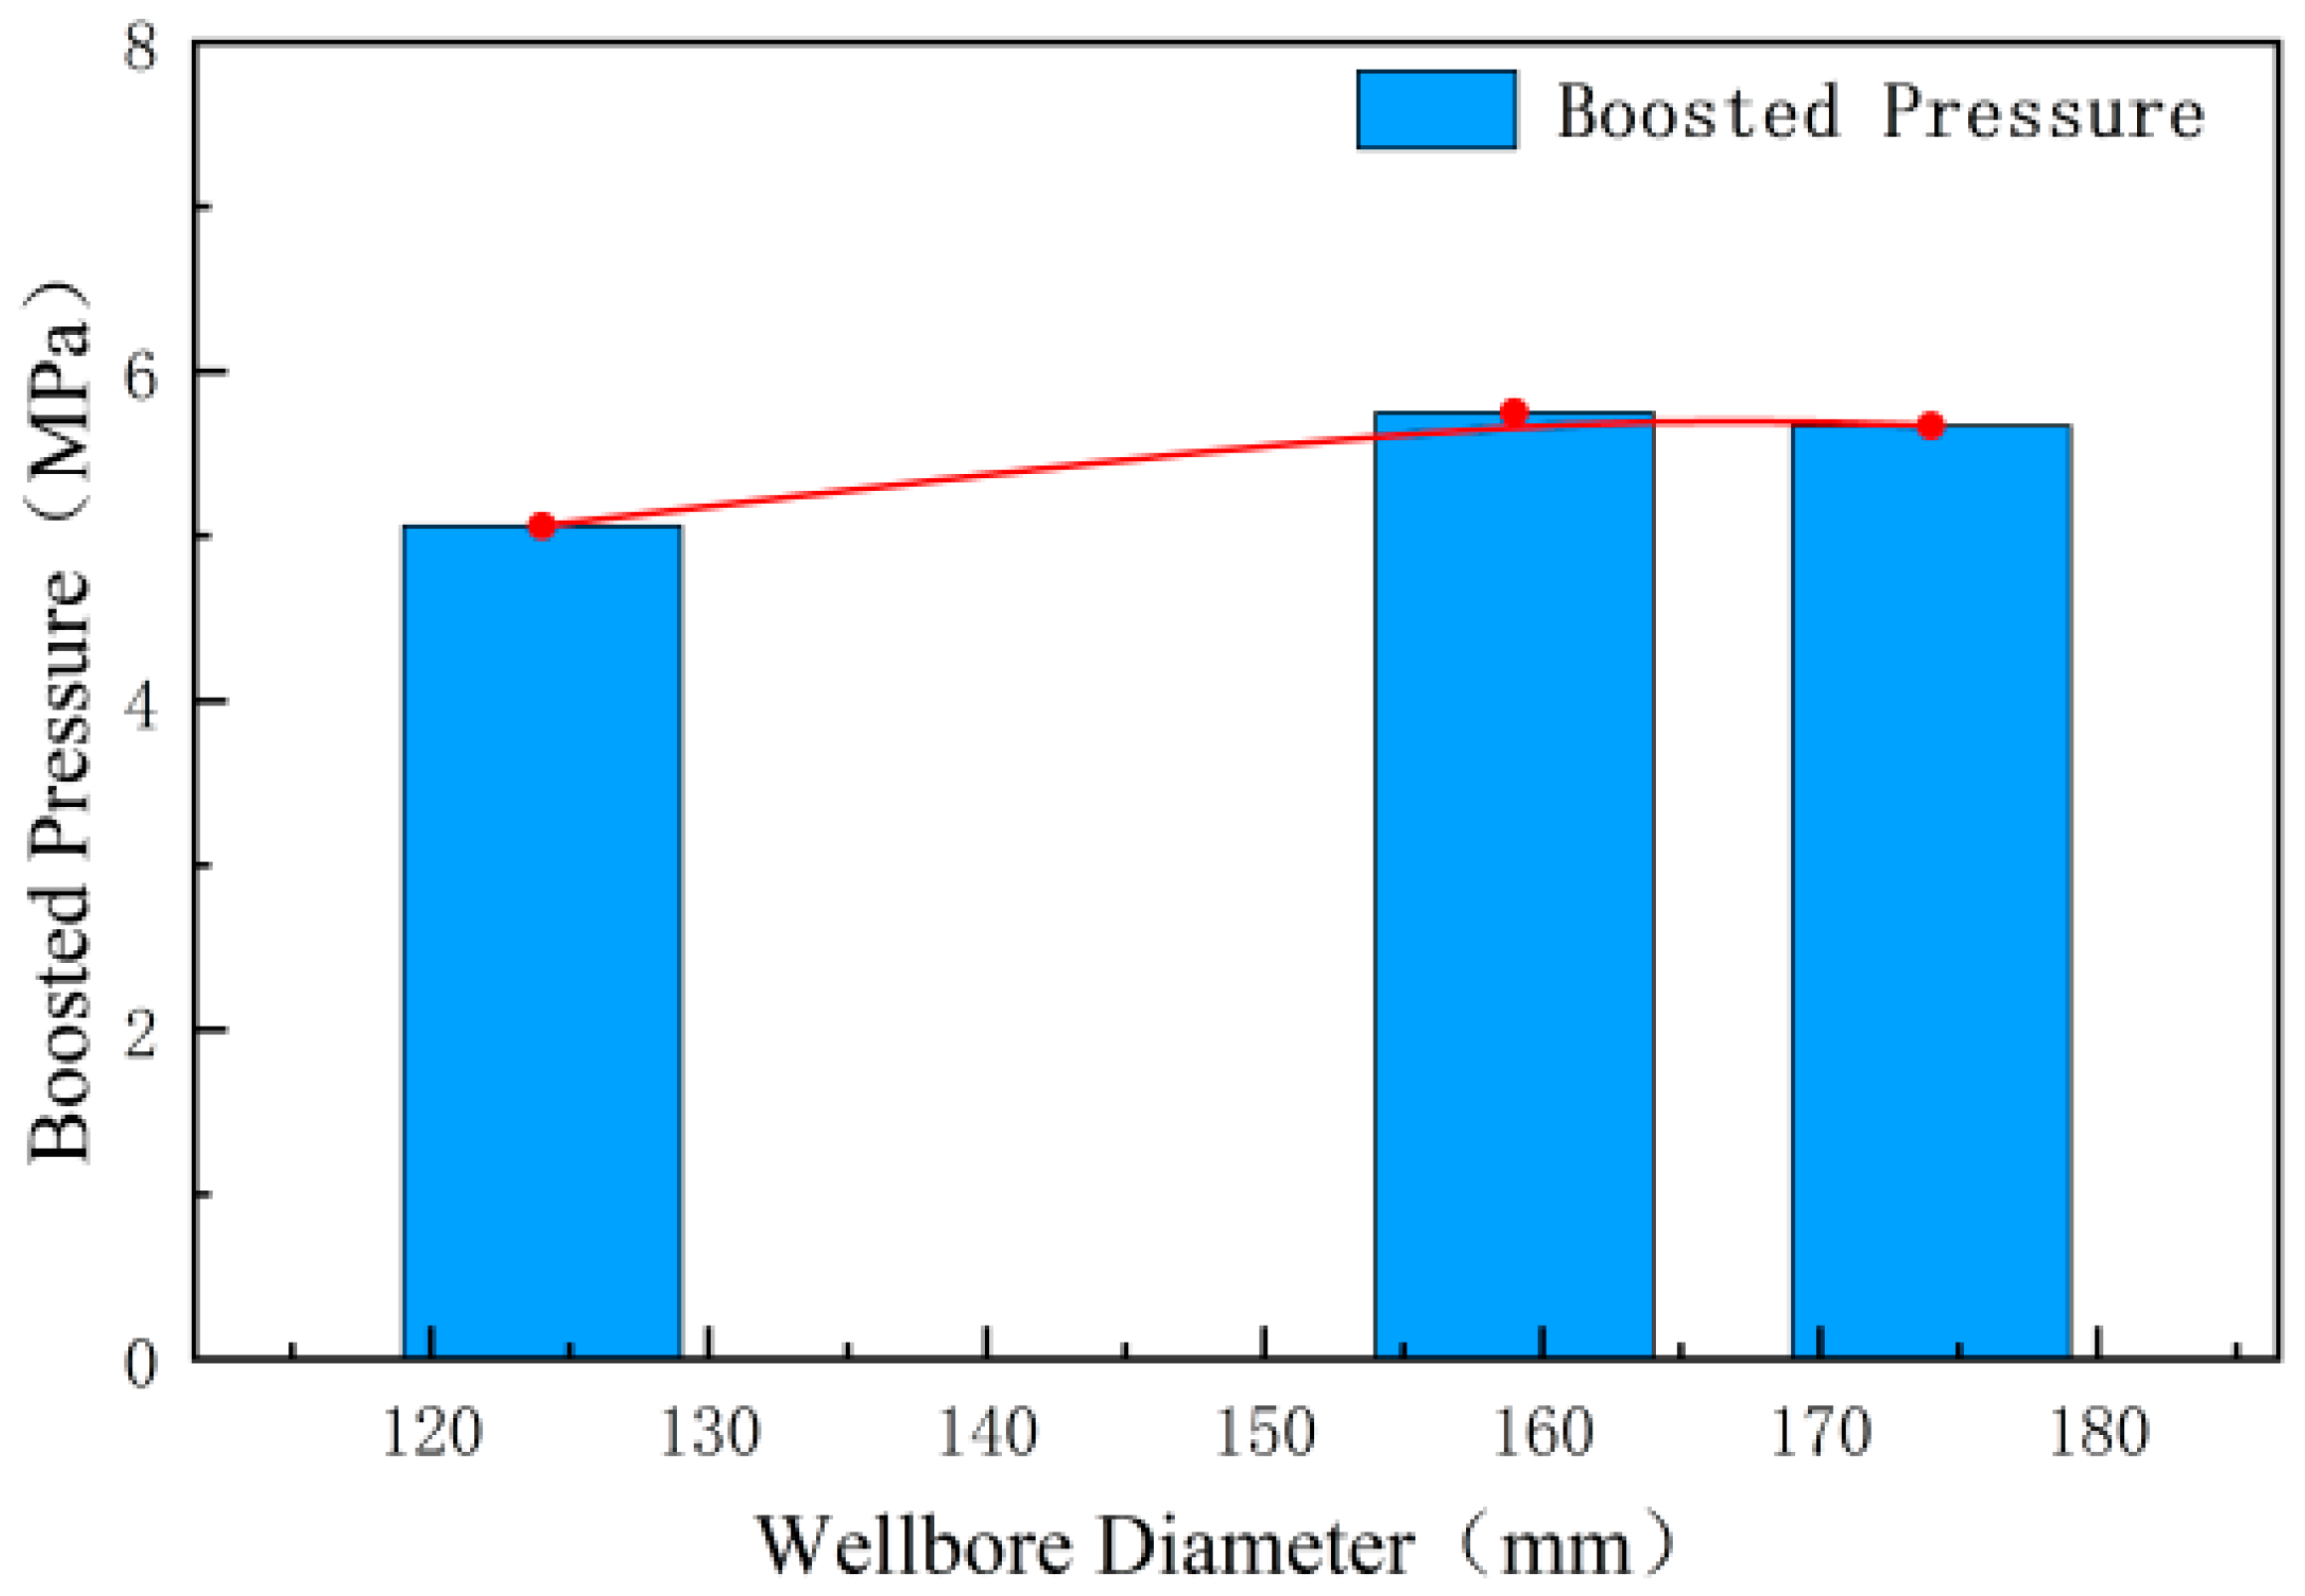
4.6. Wellbore Diameter

According to the on-site construction standards, wellbores with different diameters are selected to study the influence of wellbore diameter on the pressurization effect of the perforation tunnel. In this study, wellbore diameters of three actual engineering sizes of 124, 159, and 174 mm are set. It is calculated that the change in wellbore diameter has a great influence on the jet velocity field. As shown in Figure 27, under different wellbore diameters, the proportion of the jet backflow area to the inlet section of the perforation tunnel is different. This is because the different wellbore diameters will cause different annular areas. The distance from the jet to the hole after the jet is ejected from the nozzle is long and short. The jet structure in the annular area and the jet core reaching the inlet of the perforation tunnel are different due to the different range of the annular area, but this does not affect the pressurization effect too much. As shown in Figure 28, the pressurization values in the pores of different wellbore diameters are similar, and the maximum difference does not exceed 0.3 MPa. It can be seen that the wellbore diameter has little effect on the pressurization effect.

4.7. Analysis of Parameter Sensitivity

The parameters affecting the pressurization effect are compared, as shown in Figure 29. In contrast, the change in ambient pressure has the least influence on the pressurization effect, and the influence of wellbore diameter and fluid temperature is less. The change in nozzle pressure drop will have a great influence on pressurization. When the nozzle diameter and casing hole diameter parameters change, the pressurization effect changes very significantly, which is far more sensitive to the pressurization effect than other parameters.

5. Comparison of Perforation Tunnel Sealing and Extrusion Effect

5.1. Comparison of the Influence of Casing Hole Diameter and Nozzle Pressure Drop

The size of the casing hole diameter directly determines the sealing effect of the fluid in the perforation tunnel. By comparing the effect of the nozzle diameter, as shown in Figure 30, when the parameter variable gradient increases or decreases, the casing hole diameter has a greater effect on the pressurization. It can be concluded that the sealing effect has a higher effect on the pressurization of the fluid inside the perforation tunnel than the nozzle pressure drop; that is, selecting the appropriate casing hole diameter can directly improve the pressurization level rather than increasing the nozzle pressure drop.

5.2. Comparison of the Influence of Casing Hole Diameter and Nozzle Diameter

As mentioned above, when other conditions remain unchanged, the larger the nozzle diameter, the more jets will be injected into the perforation tunnel, the greater the energy it carries, and the greater the inflow range at the inlet of the casing. Under the condition that the diameter of the casing hole is constant, the larger the diameter of the nozzle, the stronger the sealing effect at the shrinkage of the inlet of the perforation tunnel; the stronger the squeezing effect of the fluid in the perforation tunnel, the higher the pressure required for the backflow fluid to be squeezed out of the perforation tunnel, so the stronger the pressurization effect inside the perforation tunnel. When the nozzle diameter is constant, the larger the casing diameter, the larger the jet backflow area, the worse the sealing effect at the inlet of the perforation tunnel, and the worse the squeezing effect of the fluid in the perforation tunnel, so the pressurization effect is worse. As shown in Figure 31, these two parameters have a significant impact on the pressurization effect. It can be concluded that if we want to achieve a better boosting effect, the combination of a large-diameter nozzle and a small casing hole diameter should be selected as much as possible to improve the pressurization. However, it is not necessarily true that the larger the diameter of the nozzle, the better, and the smaller the aperture of the casing, the better. In this study, the combination of a 10 mm diameter nozzle and a 14 mm casing hole diameter is not the largest pressurization combination. Therefore, the combination of large diameter nozzle and small casing hole diameter should be reasonably matched. Generally, a casing hole diameter/nozzle diameter index of about 2 is best to obtain pressurization level.

5.3. Comparison of the Influence of Nozzle Diameter and Nozzle Pressure Drop

Similar to the change in casing hole diameter, the change in nozzle diameter will also directly determine the sealing and squeezing effects of the perforation tunnel. As shown in Figure 32, the change in nozzle diameter has a greater influence on the pressurization value than the change in nozzle pressure drop. The larger the nozzle diameter and the larger the inflow area, the stronger the squeezing effect on the fluid in the perforation tunnel, and the smaller the backflow area, limiting the outflow of the backflow fluid, thus playing a key role in the pressurization ability. Increasing the nozzle pressure drop only unilaterally increases the jet flow energy, only enhances the squeezing effect of the fluid in the perforation tunnel, and cannot change the sealing effect of the perforation tunnel diameter shrinkage. The pressurization effect is naturally less than the influence of the nozzle diameter change.
It can be seen from the above research that the pressurization effect of the liquid nitrogen jet inside the perforation tunnel is affected by many aspects, and the sealing effect of the perforation tunnel is stronger than the extrusion effect. During the construction, under the condition of meeting other conditions, it is recommended to use a small diameter nozzle for sand blasting perforation (to enhance the sealing effect), then drag the string and use a large diameter nozzle for fracturing (while improving the sealing and squeezing effects); under the condition of low nozzle pressure drop, the pressurization value in the perforation tunnel is improved.

6. Result and Discussion

In the numerical simulation of the fluid flow of the liquid nitrogen jet in the perforation tunnel, through the cloud diagram of the velocity field, pressure field, and physical parameters of the obtained results, we found that the structure of the perforation tunnel has a great influence on the pressurization effect, which mainly comes from the sealing of the jet inside the perforation tunnel by the inlet of the perforation tunnel and the squeezing of the fluid in the perforation tunnel by the high-pressure jet. When the casing hole diameter is 10 mm, the pressurization value in the perforation tunnel is more than 4 times higher than when the casing hole diameter is 20 mm. When the nozzle diameter is 10 mm, the pressurization value in the perforation tunnel is more than 3 times higher than when the nozzle diameter is 6 mm. When the nozzle diameter is 2 mm, no obvious pressurization value is obtained in the perforation tunnel.
By setting in addition to the nozzle pressure drop change and parameters under the condition of the same, the pressure effect of liquid nitrogen jet and water jet simulation were compared. The results show that when the nozzle pressure drop is 20 MPa, the pressure effect of liquid nitrogen jet and water jet is the same, also increased by 5.06 MPa. Under the condition of different nozzle pressure drops, the difference between the pressure value of the nitrogen jet and water jet in the perforation tunnel is not more than 0.4 MPa. This shows that when the liquid nitrogen jet does not consider the influence of its own ultra-low temperature properties, its simple fluid pressurization ability is similar to the effect of water jets.

7. Conclusions

Under the same nozzle structure, nozzle pressure drop, and ambient pressure, a liquid nitrogen jet has the same pressurization capacity as a water jet. Taking the 6 mm nozzle as an example, when the nozzle pressure drop is 20 MPa and the ambient pressure is 20 MPa, the fluid pressure of the liquid nitrogen jet in the perforation tunnel can reach 25.06 MPa, and the pressure inside the perforation tunnel increases by 5.06 Mpa. As with the water jet pressurization effect, it is proved that the liquid nitrogen jet has a pressurization ability that is not weaker than that of the water jet.
The pressurization ability of a liquid nitrogen jet increases with an increase in nozzle pressure drop and nozzle diameter. Increasing the pressure drop of the nozzle can significantly increase the radial shear velocity, axial impact velocity, and impact pressure of the liquid nitrogen jet. The utilization of large-diameter nozzles is beneficial for improving the radial shear velocity and impact pressure of liquid nitrogen jets. Large-diameter nozzles output more liquid nitrogen per unit time, have greater kinetic energy, and form a stronger impact and extrusion on the liquid nitrogen that first enters the perforation tunnel. In this study, when the nozzle diameter is 10 mm, the pressurization value in the perforation tunnel can reach 18 MPa, which is more than 3 times larger than the pressurization value under the condition of a 6 mm nozzle diameter. The inhibition of liquid nitrogen backflow is stronger, which can improve the fluid pressure in the perforation tunnel.
The pressurization ability of a liquid nitrogen jet increases with a decrease in casing hole diameter. In this study, when the casing hole diameter is 10 mm, the pressurization value in the perforation tunnel can reach about 12 MPa, while when the casing hole diameter is 20 mm, the pressurization value is only about 2 MPa. It can be seen that the smaller the hole diameter of the casing, the stronger the sealing effect of the perforation tunnel, the better the pressurization effect, and the smaller casing hole diameter can be selected as far as possible under other conditions.
The ambient pressure has no significant impact on the radial velocity, axial velocity, and impact pressure of the liquid nitrogen jet, which makes the liquid nitrogen jet more widely applicable.
The main purpose of this paper is to explore the flow mechanism of liquid nitrogen jets in the perforation tunnel, and the pressurization effect. Therefore, the modeling is simplified, ignoring the influence of gravity. In order to improve the efficiency of calculation and the pertinence of research objectives, only the local grid is densified at the entrance of the perforation tunnel with dramatic changes in the fluid domain. The setting of boundary conditions and the selection of parameter indicators need to be further refined.

Author Contributions

Methodology, C.C. and Z.Z.; conceptualization, C.C. and B.W.; investigation, C.C. and Z.T.; data curation, Y.G. and Y.F.; writing—original draft, Z.Z.; writing—review and editing, Z.Z. and C.C.; Funding acquisition, C.C. All authors have read and agreed to the published version of the manuscript.

Funding

This research was funded by the National Key R&D Program of China (Grant No. 2020YFA0711800), the Fundamental Research Funds for the Central Universities (Grant No. 2023KYJD1006), the Postgraduate Research and Practice Innovation Program of Jiangsu Province (Grant No. KYCX23_2661), the Graduate Innovation Program of China University of Mining and Technology (Grant No. 2023WLJCRCZL047), and the project funded by the China Postdoctoral Science Foundation (Grant No. 2019M650120).

Data Availability Statement

Data will be made available on request.

Conflicts of Interest

The authors declare no conflict of interest.

References

  1. Li, J.; Zheng, M.; Zhang, G. Potential and prospects of conventional and unconventional natural gas resource in China. Acta Pet. Sin. 2012, 33, 89–98. [Google Scholar]
  2. Lei, Q.; Weng, D.; Luo, J. Achievements and future work of oil and gas production engineering of CNPC. Pet. Explor. Dev. 2019, 46, 139–145. [Google Scholar] [CrossRef]
  3. Malozyomov, B.V.; Martyushev, N.V.; Kukartsev, V.V. Overview of Methods for Enhanced Oil Recovery from Conventional and Unconventional Reservoirs. Energies 2023, 16, 4907. [Google Scholar] [CrossRef]
  4. Stratiev, D.D.; Dimitriev, A.; Stratiev, D. Modeling the Production Process of Fuel Gas, LPG, Propylene, and Polypropylene in a Petroleum Refinery Using Generalized Nets. Mathematics 2023, 11, 3800. [Google Scholar] [CrossRef]
  5. Wang, Y.; Lu, Y.; Li, Y. Progress and application of hydraulic fracturing technology in unconventional reservoir. Acta Pet. Sin. 2012, 33 (Suppl. S1), 149–158. [Google Scholar]
  6. Palisch, T.T.; Chapman, M.A.; Godwin, J. Hydraulic fracture design optimization in unconventional reservoirs: A case history. In Proceedings of the SPE Annual Technical Conference and Exhibition, San Antonio, TX, USA, 8–10 October 2012; Society of Petroleum Engineers: Richardson, TX, USA, 2012. [Google Scholar]
  7. Sheng, M.; Li, G.; Huang, Z. Numerical simulation of pressure boosting effect in jet hole during hydra-jet fracturing. Drill. Prod. Technol. 2011, 34, 42–45. [Google Scholar]
  8. Qu, H.; Li, G.; Huang, Z. Boosting mechanism in hydrajet-fracturing cavity. J. China Univ. Pet. 2010, 34, 73–76. [Google Scholar]
  9. Qu, H.; Li, G.; Huang, Z. Jetting pressure field in formation cavities during hydrajet frac-turing. J. Southwest Pet. Univ. Sci. Technol. Ed. 2011, 33, 85–88. [Google Scholar]
  10. Soliman, M.Y.; Daal, J.; East, L. Impact of fracturing and fracturing techniques on productivity of unconventional formations. In Proceedings of the SPE/EAGE European Unconventional Resources Conference and Exhibition, Vienna, Austria, 20–22 March 2012; Society of Petroleum Engineers: Richardson, TX, USA, 2012. [Google Scholar]
  11. Arthur, J.D.; Coughlin, B.J.; Bohm, B.K. Summary of environmental issues, mitigation strategies, and regulatory challenges associated with shale gas development in the United States and applicability to development and operations in Canada. In Proceedings of the Canadian Unconventional Resources and International Petroleum Conference, Calgary, AB, Canada, 19–21 October 2010; Society of Petroleum Engineers: Richardson, TX, USA, 2010. [Google Scholar]
  12. Sakmar, S.L. Shale gas development in North America: An overview of the regulatory and environmental challenges facing the industry. In Proceedings of the North American Unconventional Gas Conference and Exhibition, The Woodlands, TX, USA, 14–16 June 2011; Society of Petroleum Engineers: Richardson, TX, USA, 2011. [Google Scholar]
  13. Anderson, R.L.; Ratcliffe, I.; Greenwell, H.C. Clay swelling—A challenge in the oilfield. Earth Sci. Rev. 2010, 98, 201–216. [Google Scholar] [CrossRef]
  14. Cheng, Y.; Li, G.; Wang, H. Flow field character in cavity during supercritical carbon dioxide jet fracturing. J. China Univ. Pet. 2014, 38, 81–86. [Google Scholar]
  15. Li, M.; Wang, G.; Cheng, W. Heat-fluid-solid coupling mechanism of supercritical carbon dioxide jet in rock-breaking. Pet. Explor. Dev. 2021, 48, 1258–1268. [Google Scholar] [CrossRef]
  16. Wang, D.; Jin, Y.; Chen, M. Study on fracture network development of LPG fracturing in shale considering capillary effect. China Sci. 2016, 11, 2440–2444. [Google Scholar]
  17. Huang, Z.; Wu, X.; Xie, Z. Theory and Research Progress of Liquid Nitrogen Fracturing and Rock Breaking. Bull. Natl. Nat. Sci. Found. 2021, 35, 952–963. [Google Scholar]
  18. Wu, X.; Huang, Z.; Li, G. Experiment on coal breaking with cryogenic nitrogen jet. J. Pet. Sci. Eng. 2018, 169, 405–415. [Google Scholar] [CrossRef]
  19. Zhang, S.; Huang, Z.; Li, G. Numerical analysis of transient conjugate heat transfer and thermal stress distribution in geothermal drilling with high-pressure liquid nitrogen jet. Appl. Therm. Eng. 2018, 129, 1348–1357. [Google Scholar] [CrossRef]
  20. Wu, X.; Huang, Z.; Zhao, H. A transient fluid-thermo-structural coupling study of high-velocity LN2 jet impingement on rocks. Int. J. Rock Mech. Min. Sci. 2019, 123, 104061. [Google Scholar] [CrossRef]
  21. Cai, C.; Ren, K.; Li, Q. Numerical simulation of the flow field structure of liquid nitrogen Jet. Therm. Sci. 2019, 23, 1337–1343. [Google Scholar] [CrossRef]
  22. Cai, C.; Gao, F.; Huang, Z. Numerical simulation on the flow field characteristics and impact capability of liquid nitrogen jet. Energy Explor. Exploit. 2018, 36, 989–1005. [Google Scholar] [CrossRef]
  23. Cai, C.; Ren, K.; Su, S. Numerical ANALYSIS on the transient cavity flow field during liquid nitrogen jet fracturing. Therm. Sci. 2019, 23, 1387–1392. [Google Scholar] [CrossRef]
  24. Cai, C.; Huang, Z.; Li, G. Feasibility of reservoir fracturing stimulation with liquid nitrogen jet. J. Pet. Sci. Eng. 2016, 144, 59–65. [Google Scholar] [CrossRef]
  25. Cha, M.; Yin, X.; Kneafsey, T. Cryogenic fracturing for reservoir stimulation -Laboratory studies. J. Pet. Sci. Eng. 2014, 124, 436–450. [Google Scholar] [CrossRef]
  26. Alqatahni, N.B.; Cha, M.; Yao, B.; Yin, X.; Kneafsey, T.J.; Wang, L.; Wu, Y.; Miskimins, J.L. Experimental Investigation of Cryogenic Fracturing of Rock Specimens Under True Triaxial Confining Stresses. In Proceedings of the SPE Europe Featured at 78th EAGE Conference and Exhibition, Vienna, Austria, 30 May–2 June 2016; Society of Petroleum Engineers: Richardson, TX, USA, 2016. [Google Scholar]
  27. Niu, J.; Li, G.; Song, J. An experimental study on abrasive water jet perforation parameters. Pet. Drill. Techn. 2003, 31, 14–16. [Google Scholar]
  28. Kim, S.; Choudhury, D.; Pate, B. Computations of Complex Turbulent Flows Using the Commercial Code Fluent. Chapter of Modeling Complex Turbulent Flows; Springer: Berlin/Heidelberg, Germany, 1999; pp. 259–276. [Google Scholar]
  29. Shih, T.; Liou, W.W.; Shabbir, A. A new k-e eddy viscosity model for high Reynolds number turbulent flows. Comput. Fluids 1995, 24, 227–238. [Google Scholar] [CrossRef]
  30. Span, P.; Lemmon, E.W.; Jacobsen, R.T. A reference equation of state for the thermodynamic properties of nitrogen for temperatures from 63.151 to 1000 K and pressures to 2200 MPa. J. Phys. Chem. Ref. Data 2000, 29, 1361–1433. [Google Scholar] [CrossRef]
  31. Lemmon, E.W.; Jacobsen, R.T. Viscosity and thermal conductivity equations for nitrogen, oxygen, argon, and air. Int. J. Thermophys. 2004, 25, 21–69. [Google Scholar] [CrossRef]
Figure 1. Liquid nitrogen jet injection diagram.
Processes 11 02878 g001
Figure 2. Geometric model diagram.
Processes 11 02878 g002
Figure 3. Flow chart of numerical model solution.
Processes 11 02878 g003
Figure 4. Axial velocity nephogram of liquid nitrogen jet: (a) Overall speed nephogram; (b) Annulus speed nephogram; (c) Velocity nephogram in the perforation tunnel.
Processes 11 02878 g004
Figure 5. Axial velocity curve of jet.
Processes 11 02878 g005
Figure 6. Velocity distribution curve of jet along radial direction.
Processes 11 02878 g006
Figure 7. Axial pressure nephogram of liquid nitrogen jet: (a) Overall pressure nephogram; (b) Annulus pressure nephogram; (c) Pressure nephogram in the perforation tunnel.
Processes 11 02878 g007
Figure 8. Axial pressure distribution curve of jet.
Processes 11 02878 g008
Figure 9. Pressure distribution curve of jet along radial direction.
Processes 11 02878 g009
Figure 10. Axial density nephogram of liquid nitrogen jet: (a) Overall density nephogram; (b) Annulus density nephogram; (c) Density nephogram of longitudinal section in perforation tunnel; (d) Density nephogram of transverse section in perforation tunnel.
Processes 11 02878 g010
Figure 11. Axial viscosity nephogram of liquid nitrogen jet: (a) Overall viscosity nephogram; (b) Annulus viscosity nephogram; (c) Viscosity nephogram of longitudinal section in perforation tunnel; (d) Viscosity nephogram of transverse section in perforation tunnel.
Processes 11 02878 g011
Figure 12. Axial density and viscosity distribution of liquid nitrogen jet.
Processes 11 02878 g012
Figure 13. The velocity nephogram of the inlet of different nozzle diameters: (a) Nozzle with diameter of 2 mm; (b) Nozzle with diameter of 10 mm.
Processes 11 02878 g013
Figure 14. The velocity nephogram of the inlet of different casing hole diameter: (a) The transverse section of the casing with a diameter of 10 mm; (b) The transverse section of the casing with a diameter of 20 mm; (c) The longitudinal section of the casing with a diameter of 10 mm; (d) The longitudinal section of the casing with a diameter of 20 mm.
Processes 11 02878 g014
Figure 15. The velocity nephogram of the inlet of different nozzle pressure drop: (a) The inlet section of nozzle with pressure drop of 10 MPa; (b) The inlet section of nozzle with pressure drop of 30 MPa; (c) The transverse section in the perforation tunnel with nozzle pressure drop of 10 MPa; (d). The transverse section in the perforation tunnel with nozzle pressure drop of 30 MPa; (e) The longitudinal section in the perforation tunnel with nozzle pressure drop of 10 MPa; (f) The longitudinal section in the perforation tunnel with nozzle pressure drop of 30 MPa.
Processes 11 02878 g015
Figure 16. Comparison of pressurization in the perforation tunnel between liquid nitrogen jet and water jet.
Processes 11 02878 g016
Figure 17. The radial velocity curve of the perforation tunnel inlet with different nozzle pressure drop.
Processes 11 02878 g017
Figure 18. Effect of nozzle pressure drop on perforation tunnel pressurization.
Processes 11 02878 g018
Figure 19. The radial velocity curve of the perforation tunnel inlet with different nozzle diameter.
Processes 11 02878 g019
Figure 20. Effect of nozzle diameter on perforation tunnel pressurization.
Processes 11 02878 g020
Figure 21. The radial velocity curve of the perforation tunnel inlet with different casing hole diameter.
Processes 11 02878 g021
Figure 22. Effect of casing hole diameter on perforation tunnel pressurization.
Processes 11 02878 g022
Figure 23. The radial velocity curve of the perforation tunnel inlet with different ambient pressure.
Processes 11 02878 g023
Figure 24. Effect of ambient pressure on perforation tunnel pressurization.
Processes 11 02878 g024
Figure 25. The radial velocity curve of the perforation tunnel inlet with different fluid temperature.
Processes 11 02878 g025
Figure 26. Effect of fluid temperature on perforation tunnel pressurization.
Processes 11 02878 g026
Figure 27. The radial velocity curve of the perforation tunnel inlet with different wellbore diameter.
Processes 11 02878 g027
Figure 28. Effect of wellbore diameter on perforation tunnel pressurization.
Processes 11 02878 g028
Figure 29. Comparison of parameter sensitivity.
Processes 11 02878 g029
Figure 30. Comparison of casing hole diameter and nozzle pressure drop on pressurization effect.
Processes 11 02878 g030
Figure 31. Comparison of casing hole diameter and nozzle diameter on pressurization effect.
Processes 11 02878 g031
Figure 32. Comparison of nozzle diameter and nozzle pressure drop on pressurization effect.
Processes 11 02878 g032
Table 1. Main dimensions of geometric model.
Model Length (mm)Inner
Diameter of Wellbore (mm)
Orifice Throat Length (mm)Perforation Tunnel Inlet
Diameter (mm)
Maximum Diameter of
Perforation Tunnel (mm)
Outer Diameter of Jet Tool
(mm)
Nozzle Diameter (mm)Number of Nozzle
4501087002060452~104
Table 2. Fluid domain setting under liquid nitrogen jet impact.
Parameter SettingLiquid Nitrogen Jet
Annulus pressure (MPa)20
Inlet pressure (MPa)40
Fluid temperature (K)100
Viscosity (kg/m s)NIST real gas model
Density (kg/m3)NIST real gas model
Specific heat at constant pressure (k J/kg·K)NIST real gas model
Thermal conductivity (W/m·K)NIST real gas model
Disclaimer/Publisher’s Note: The statements, opinions and data contained in all publications are solely those of the individual author(s) and contributor(s) and not of MDPI and/or the editor(s). MDPI and/or the editor(s) disclaim responsibility for any injury to people or property resulting from any ideas, methods, instructions or products referred to in the content.

