
Numerical Investigation of the Heat and Mass Transfer during the In Situ Pyrolysis Process of Oil-Rich Coal
Abstract
:1. Introduction
2. Model Description
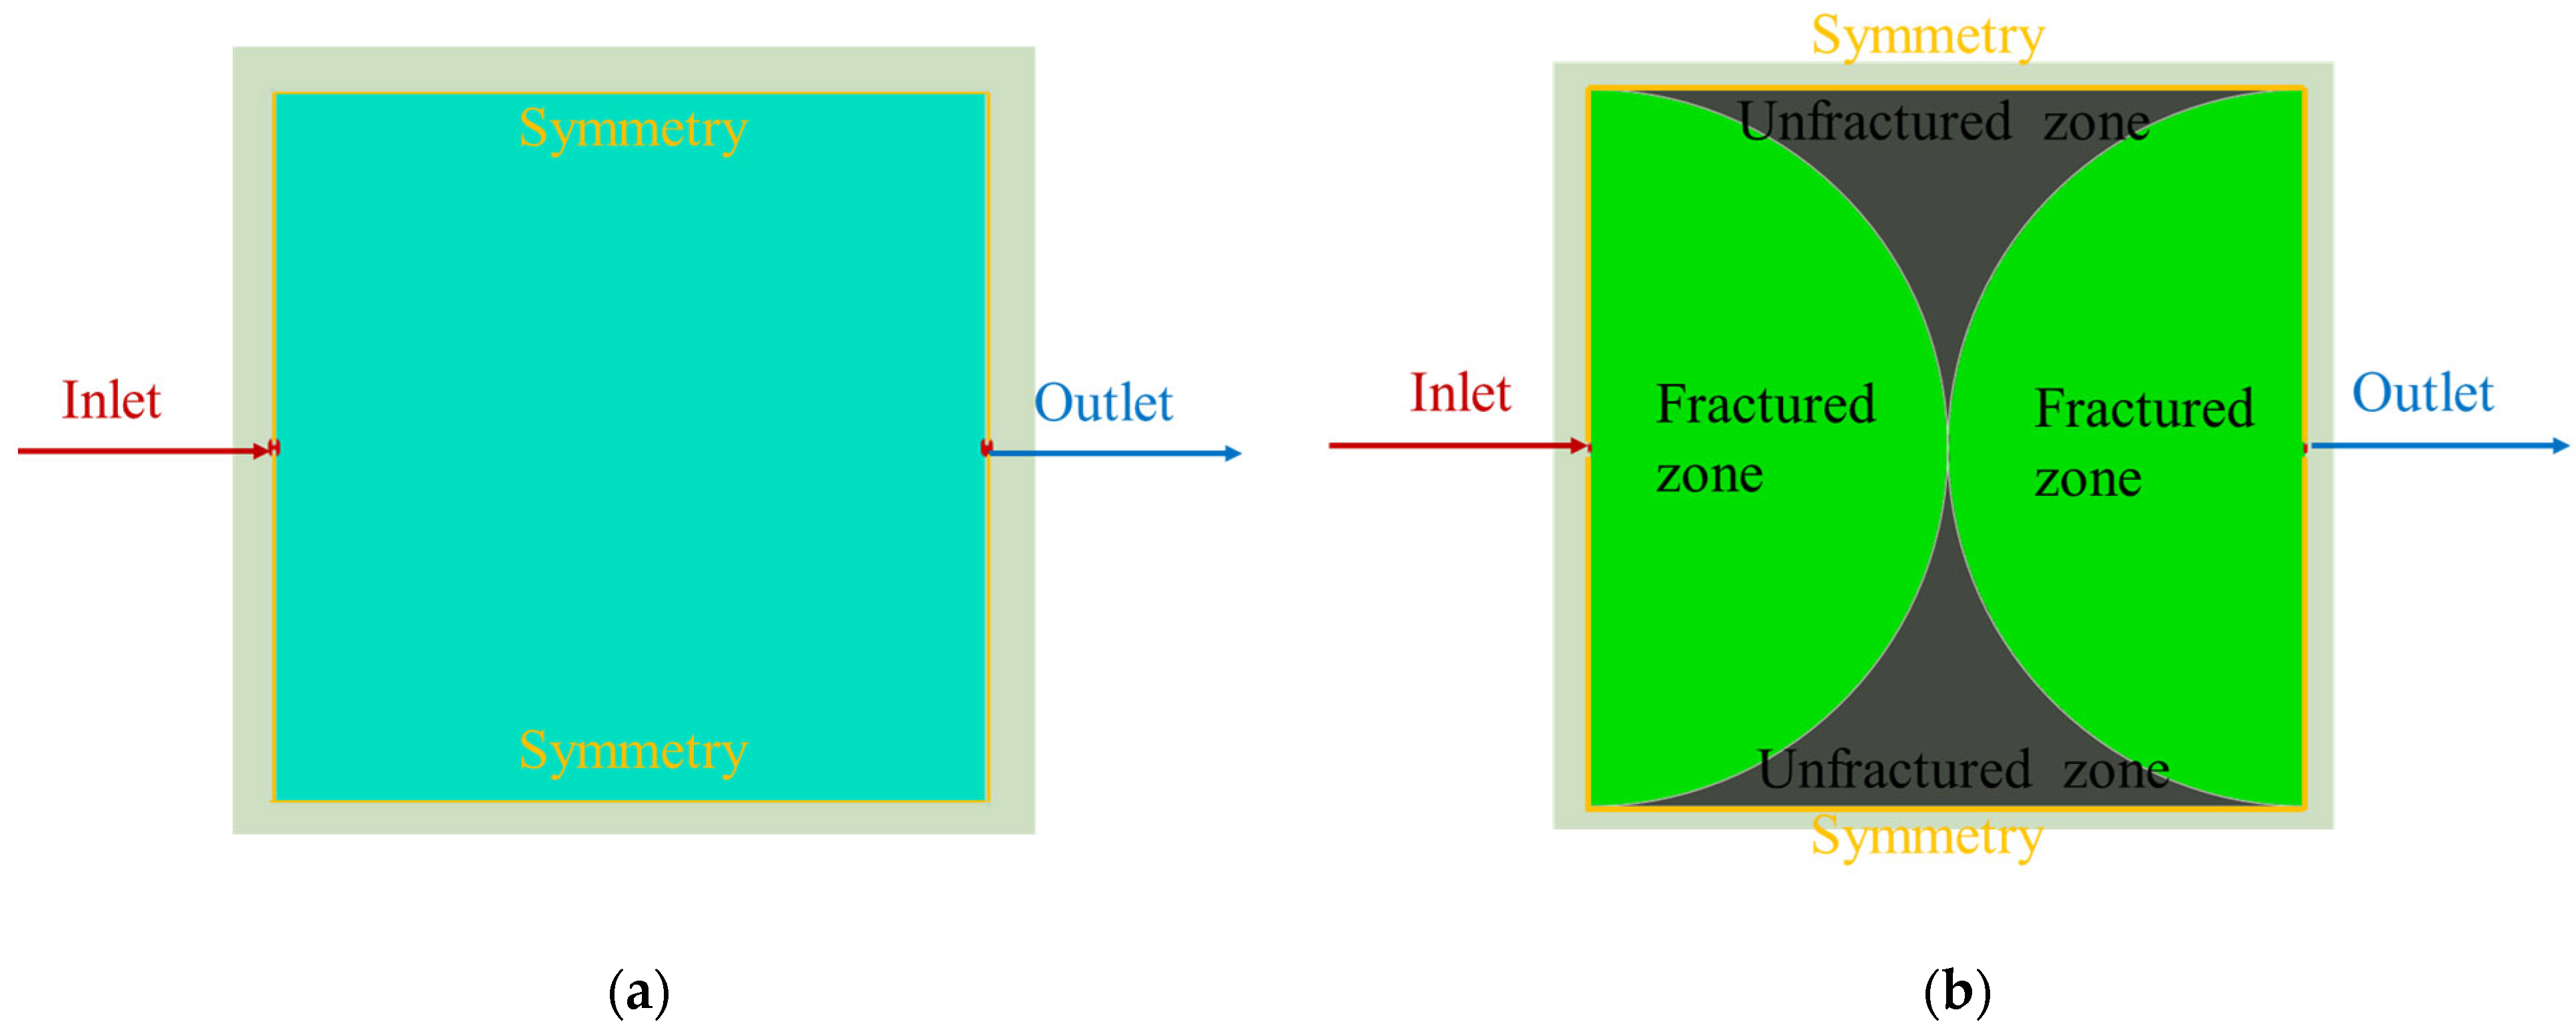
2.1. Computational Domain and Boundary Conditions
- (1)
- The actual geometric model is simplified into a two-dimensional computational region;
- (2)
- Radiative heat transfer is not considered in the process of in situ pyrolysis underground;
- (3)
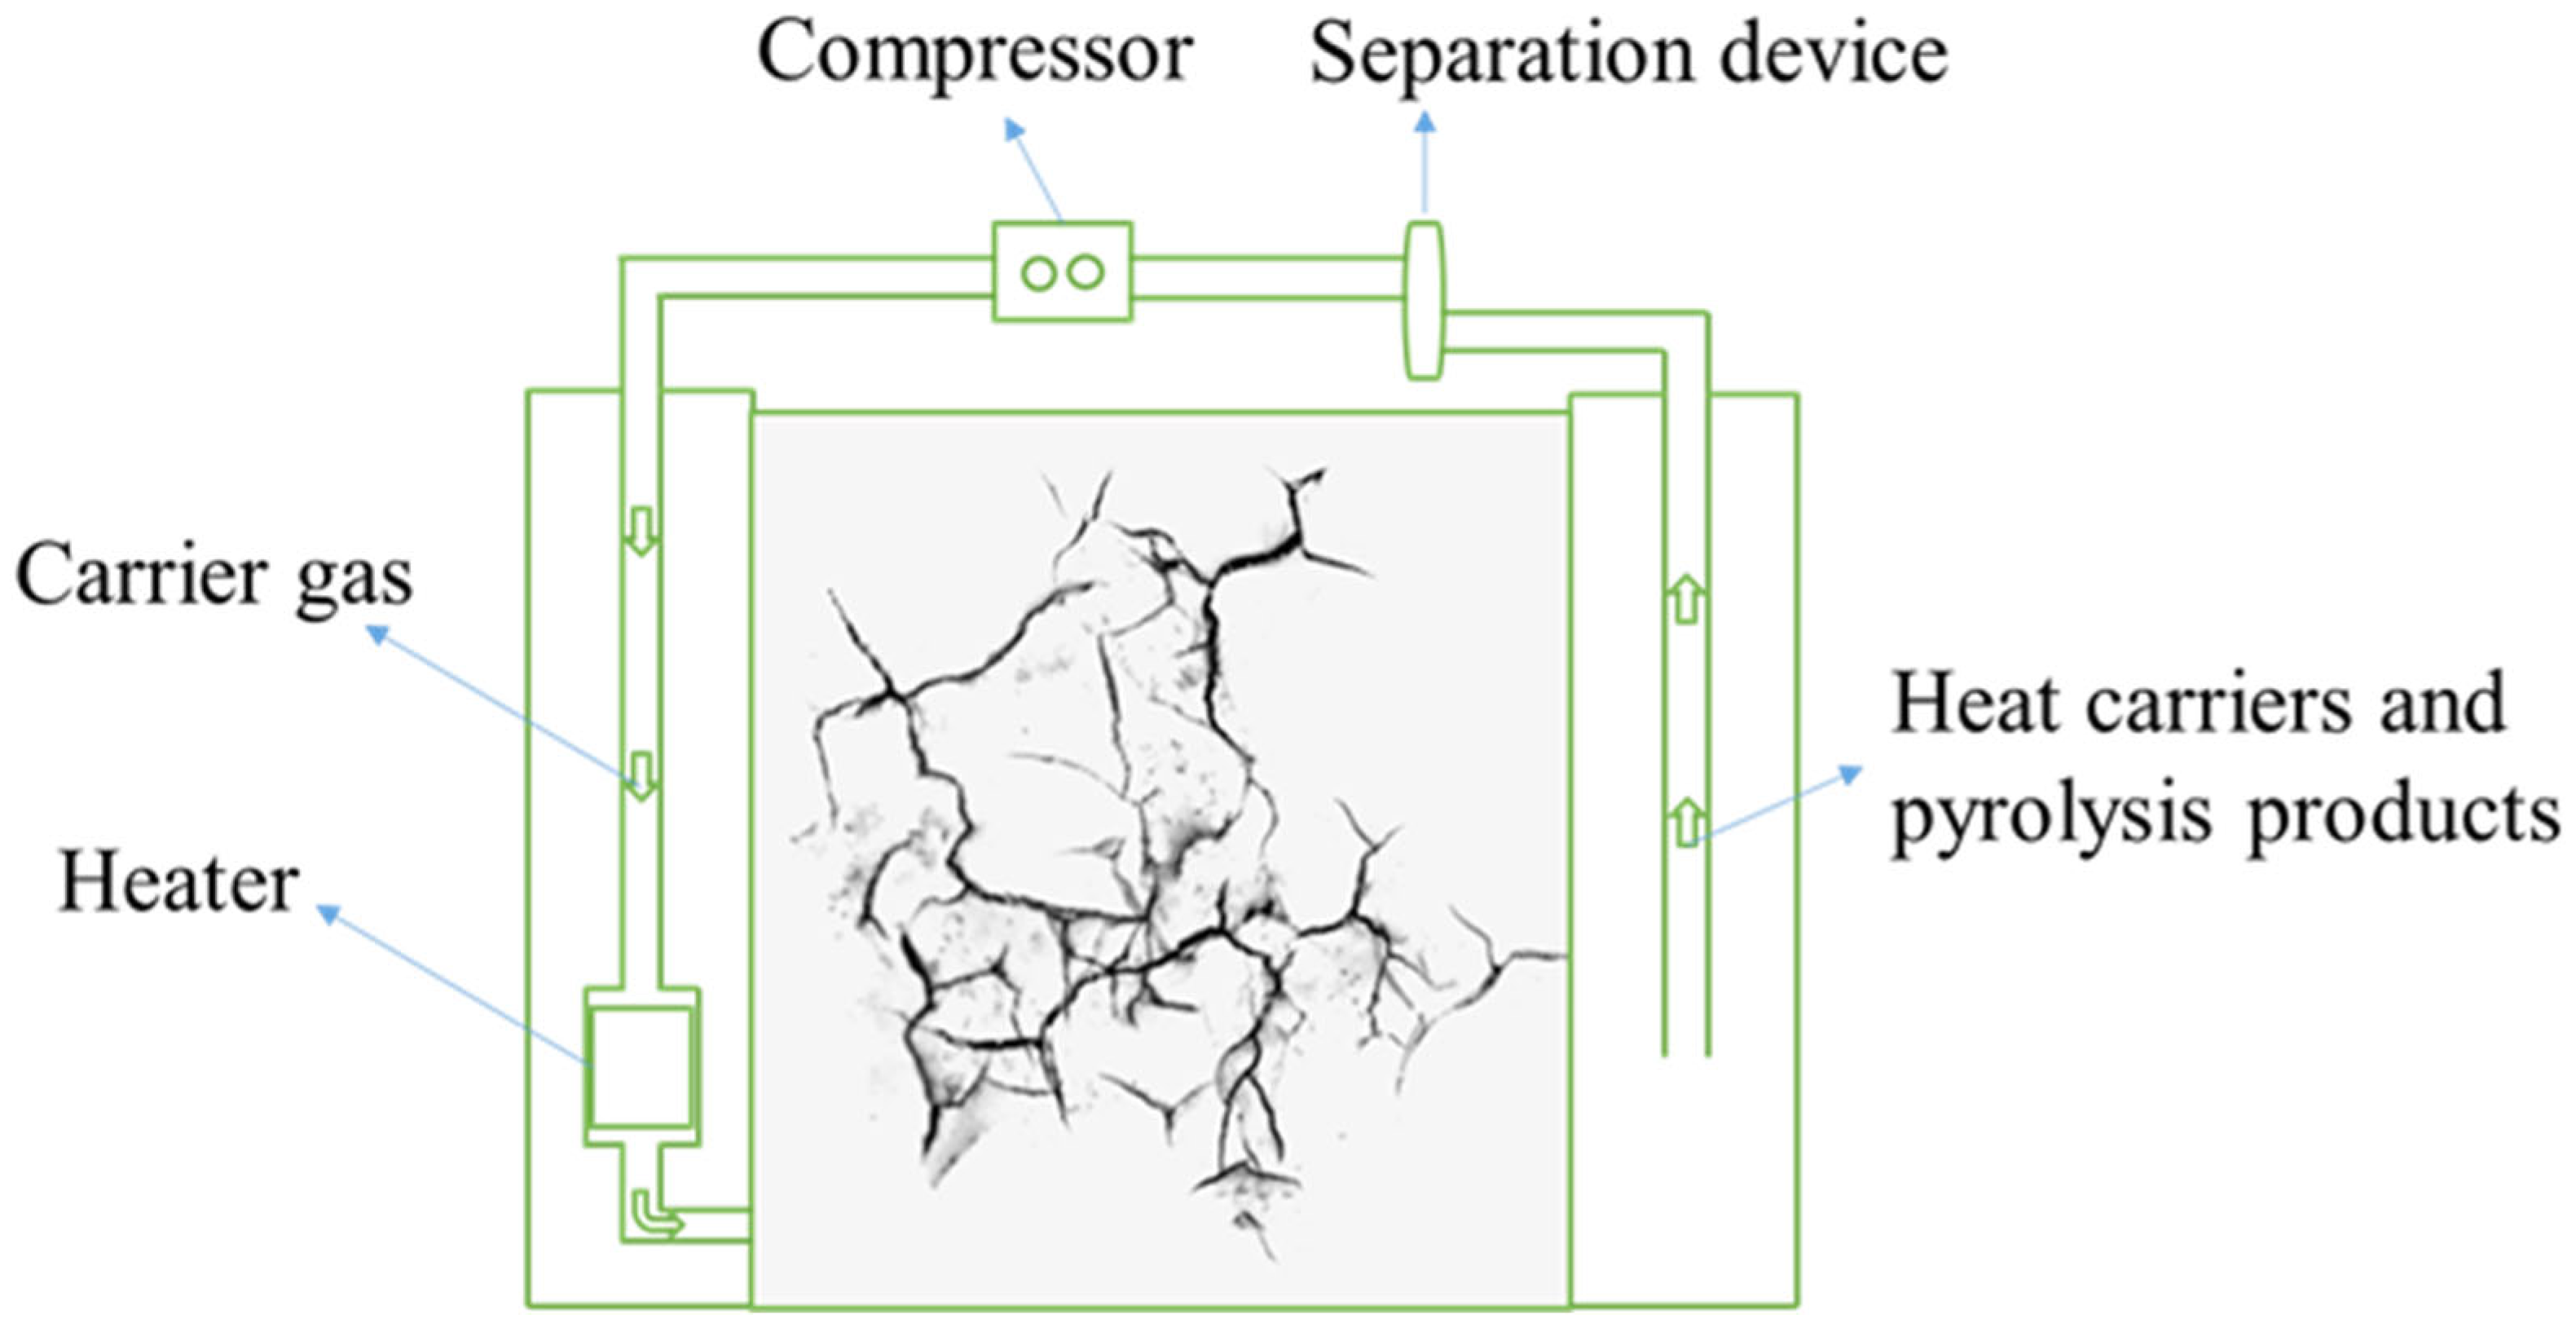
- Many fissures and cracks exist in the center, simplifying the computational domain into a porous media region;
- (4)
- The pyrolysis reaction occurs at which the temperature is higher than 573 K according to pyrolysis experiments, and thus, the oil and volatile gases in the products are assumed to be in the gaseous state.
2.2. Chemical Reaction Model
2.3. Mass and Heat Transfer Model
2.4. Grid Independence Verifications
3. Results and Discussion
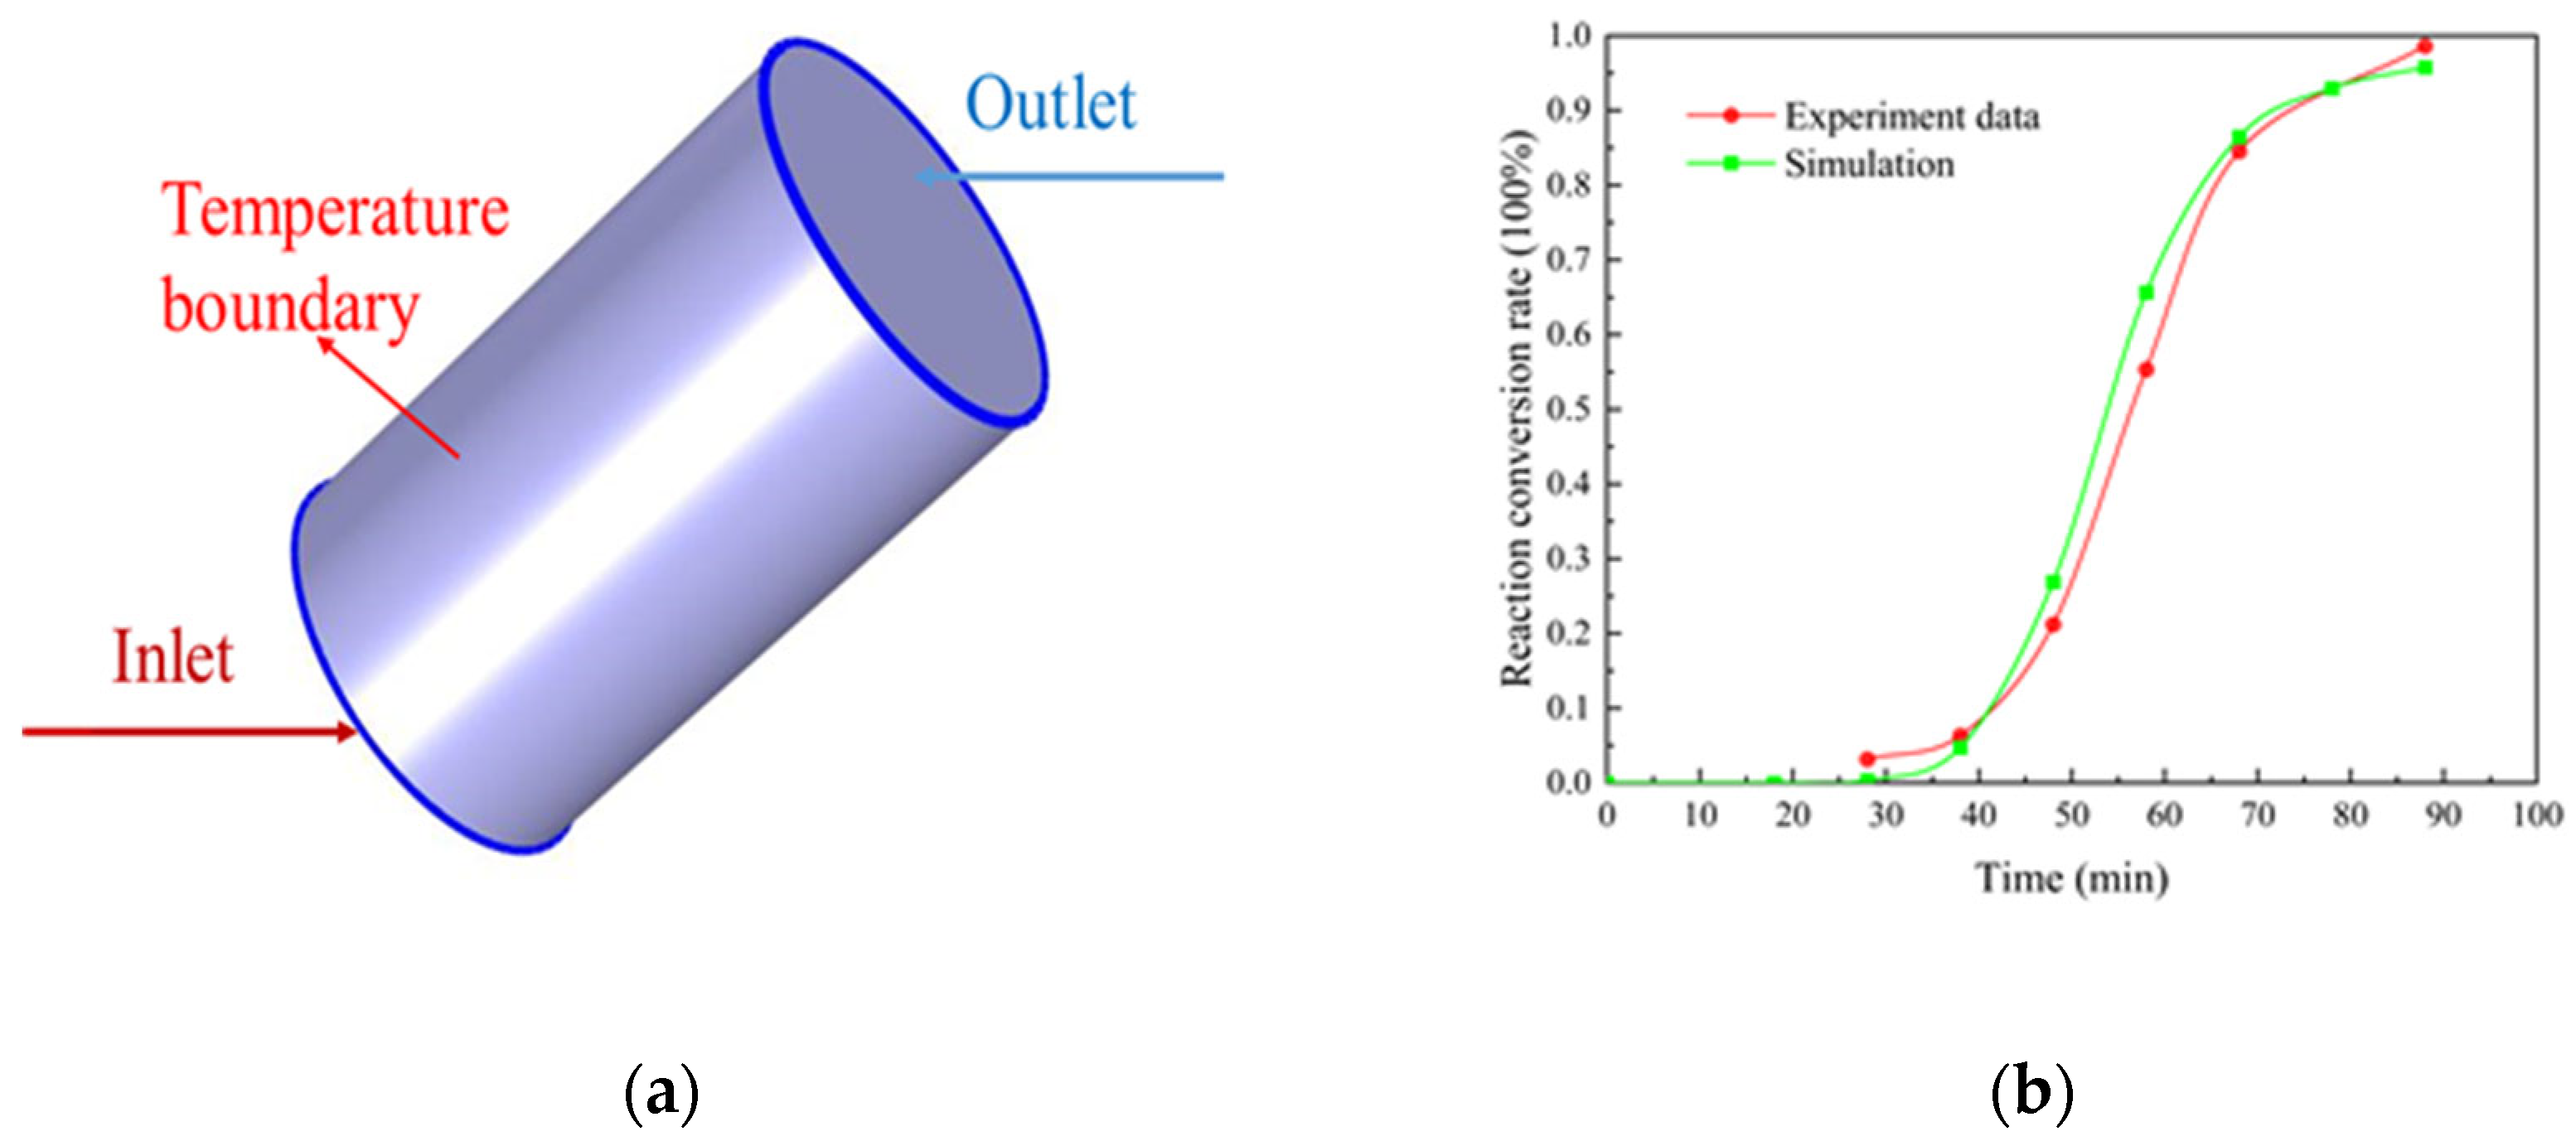
3.1. Model Validation
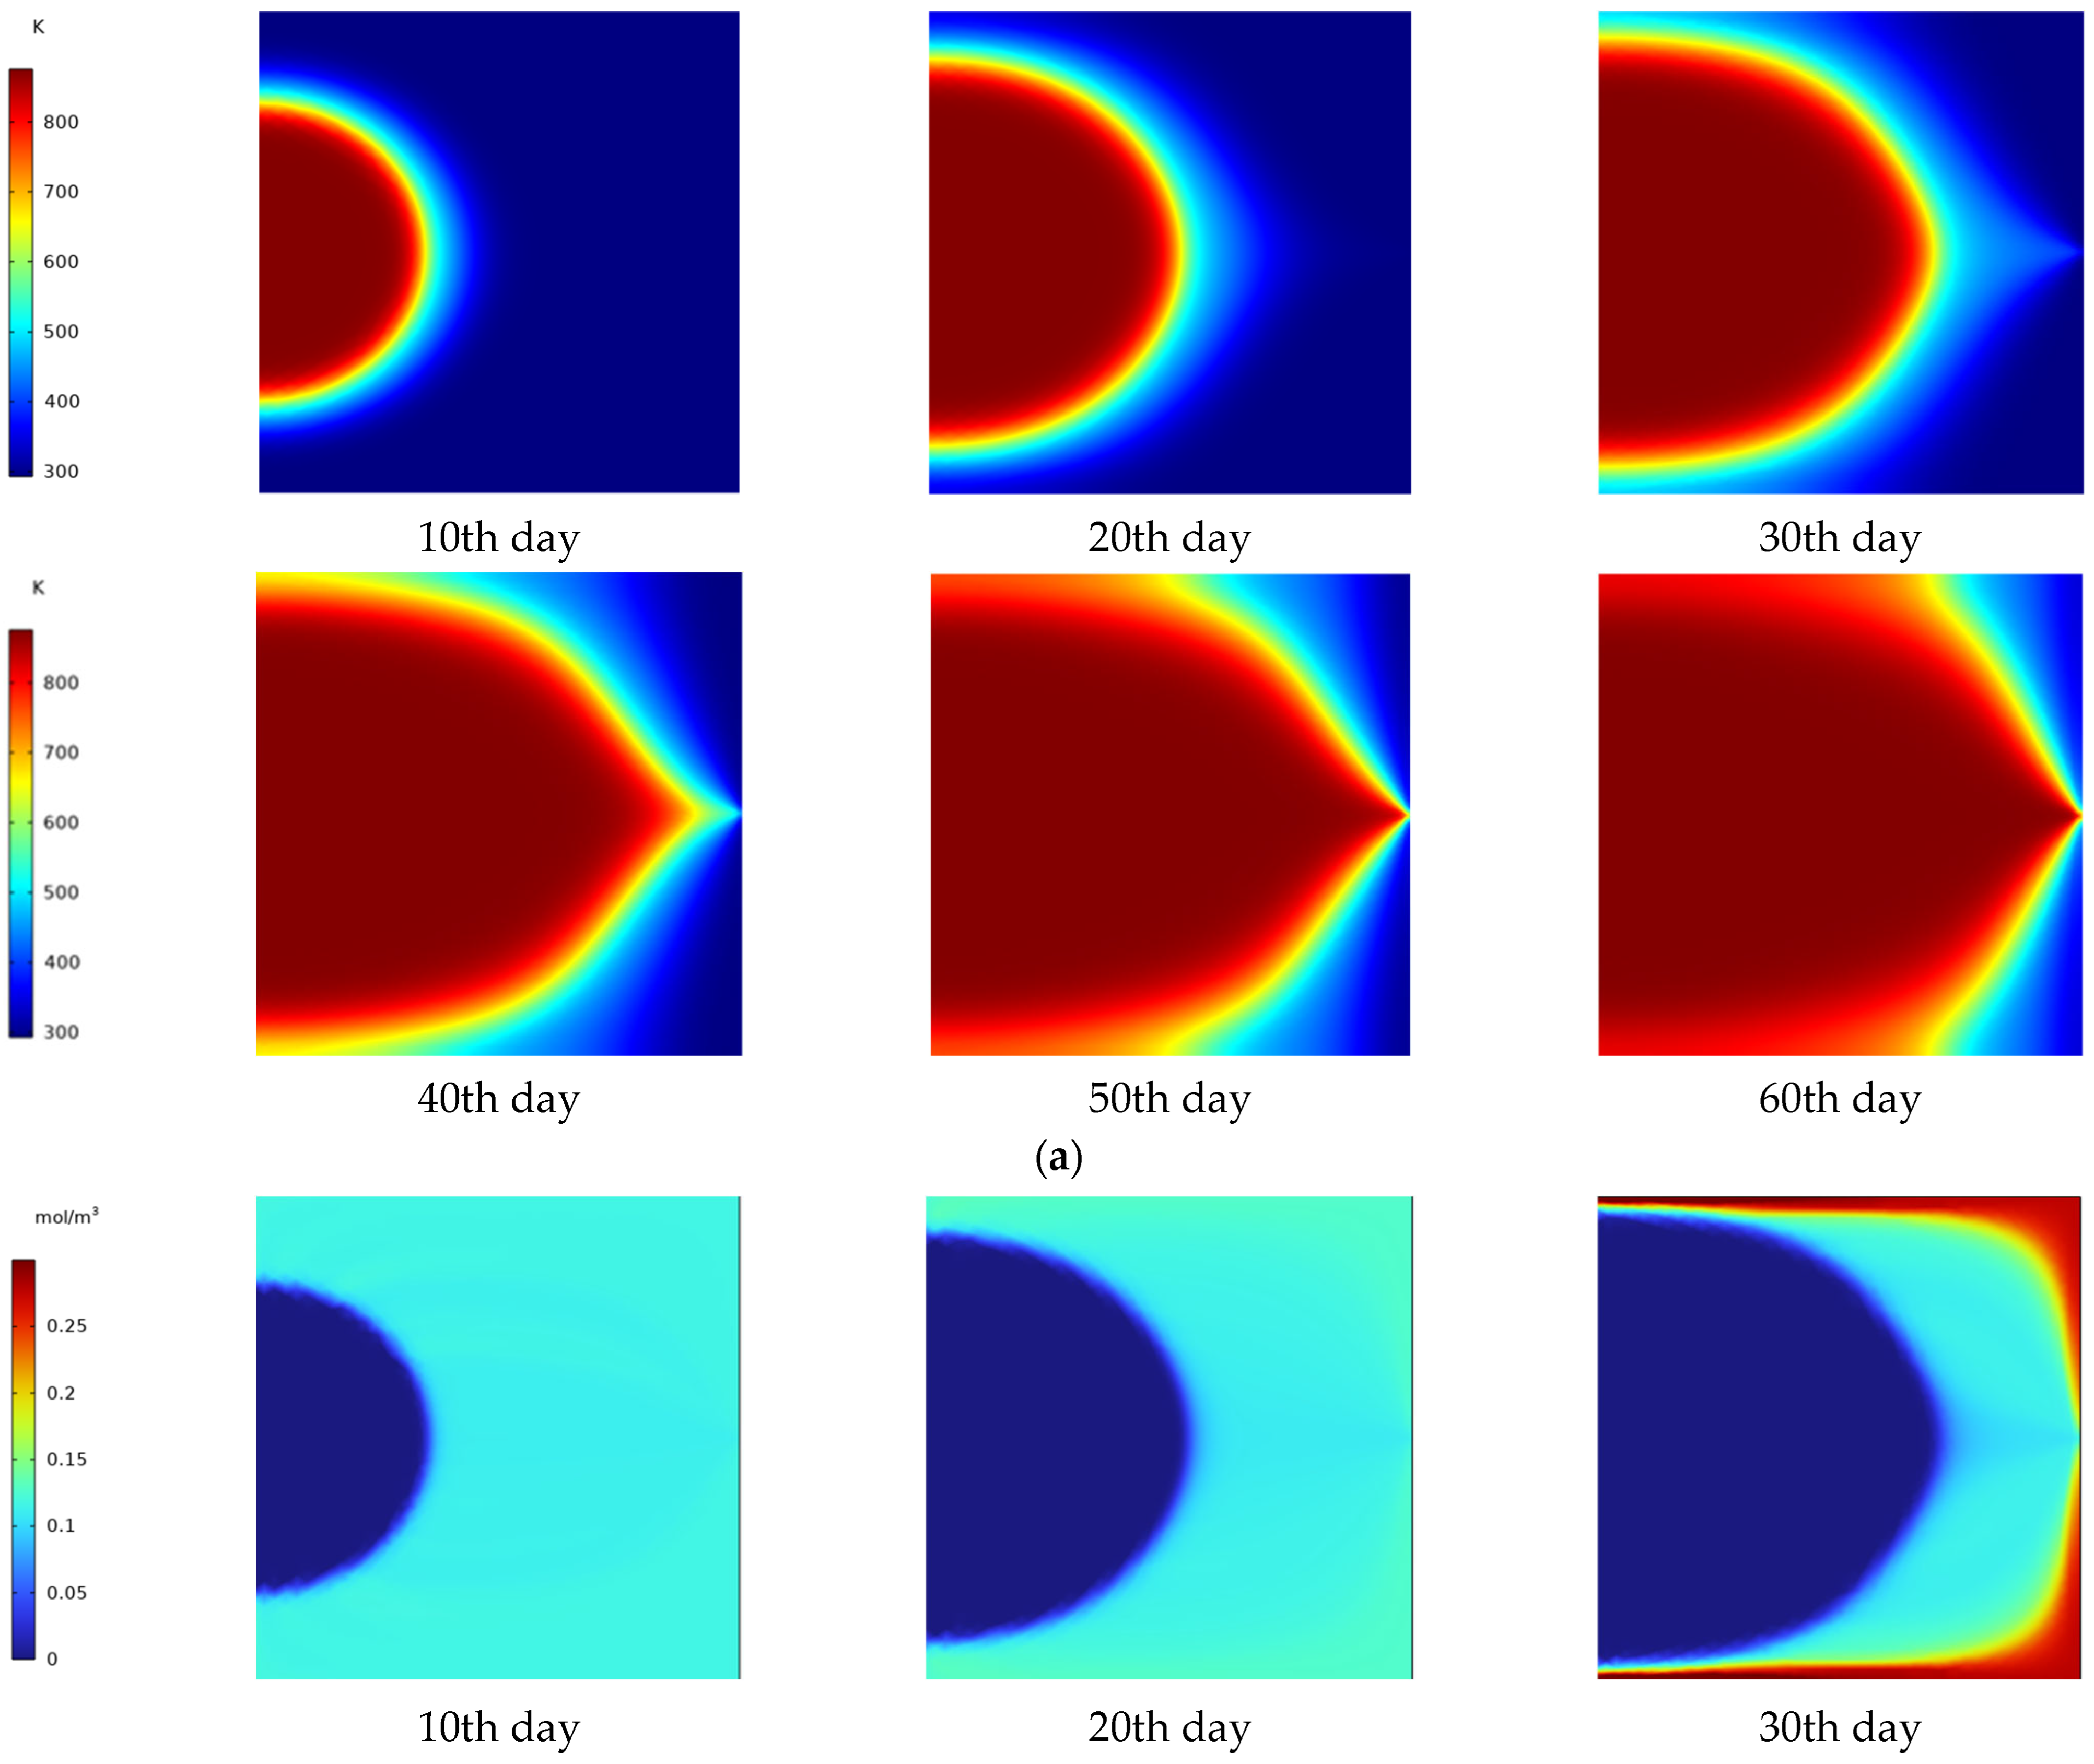
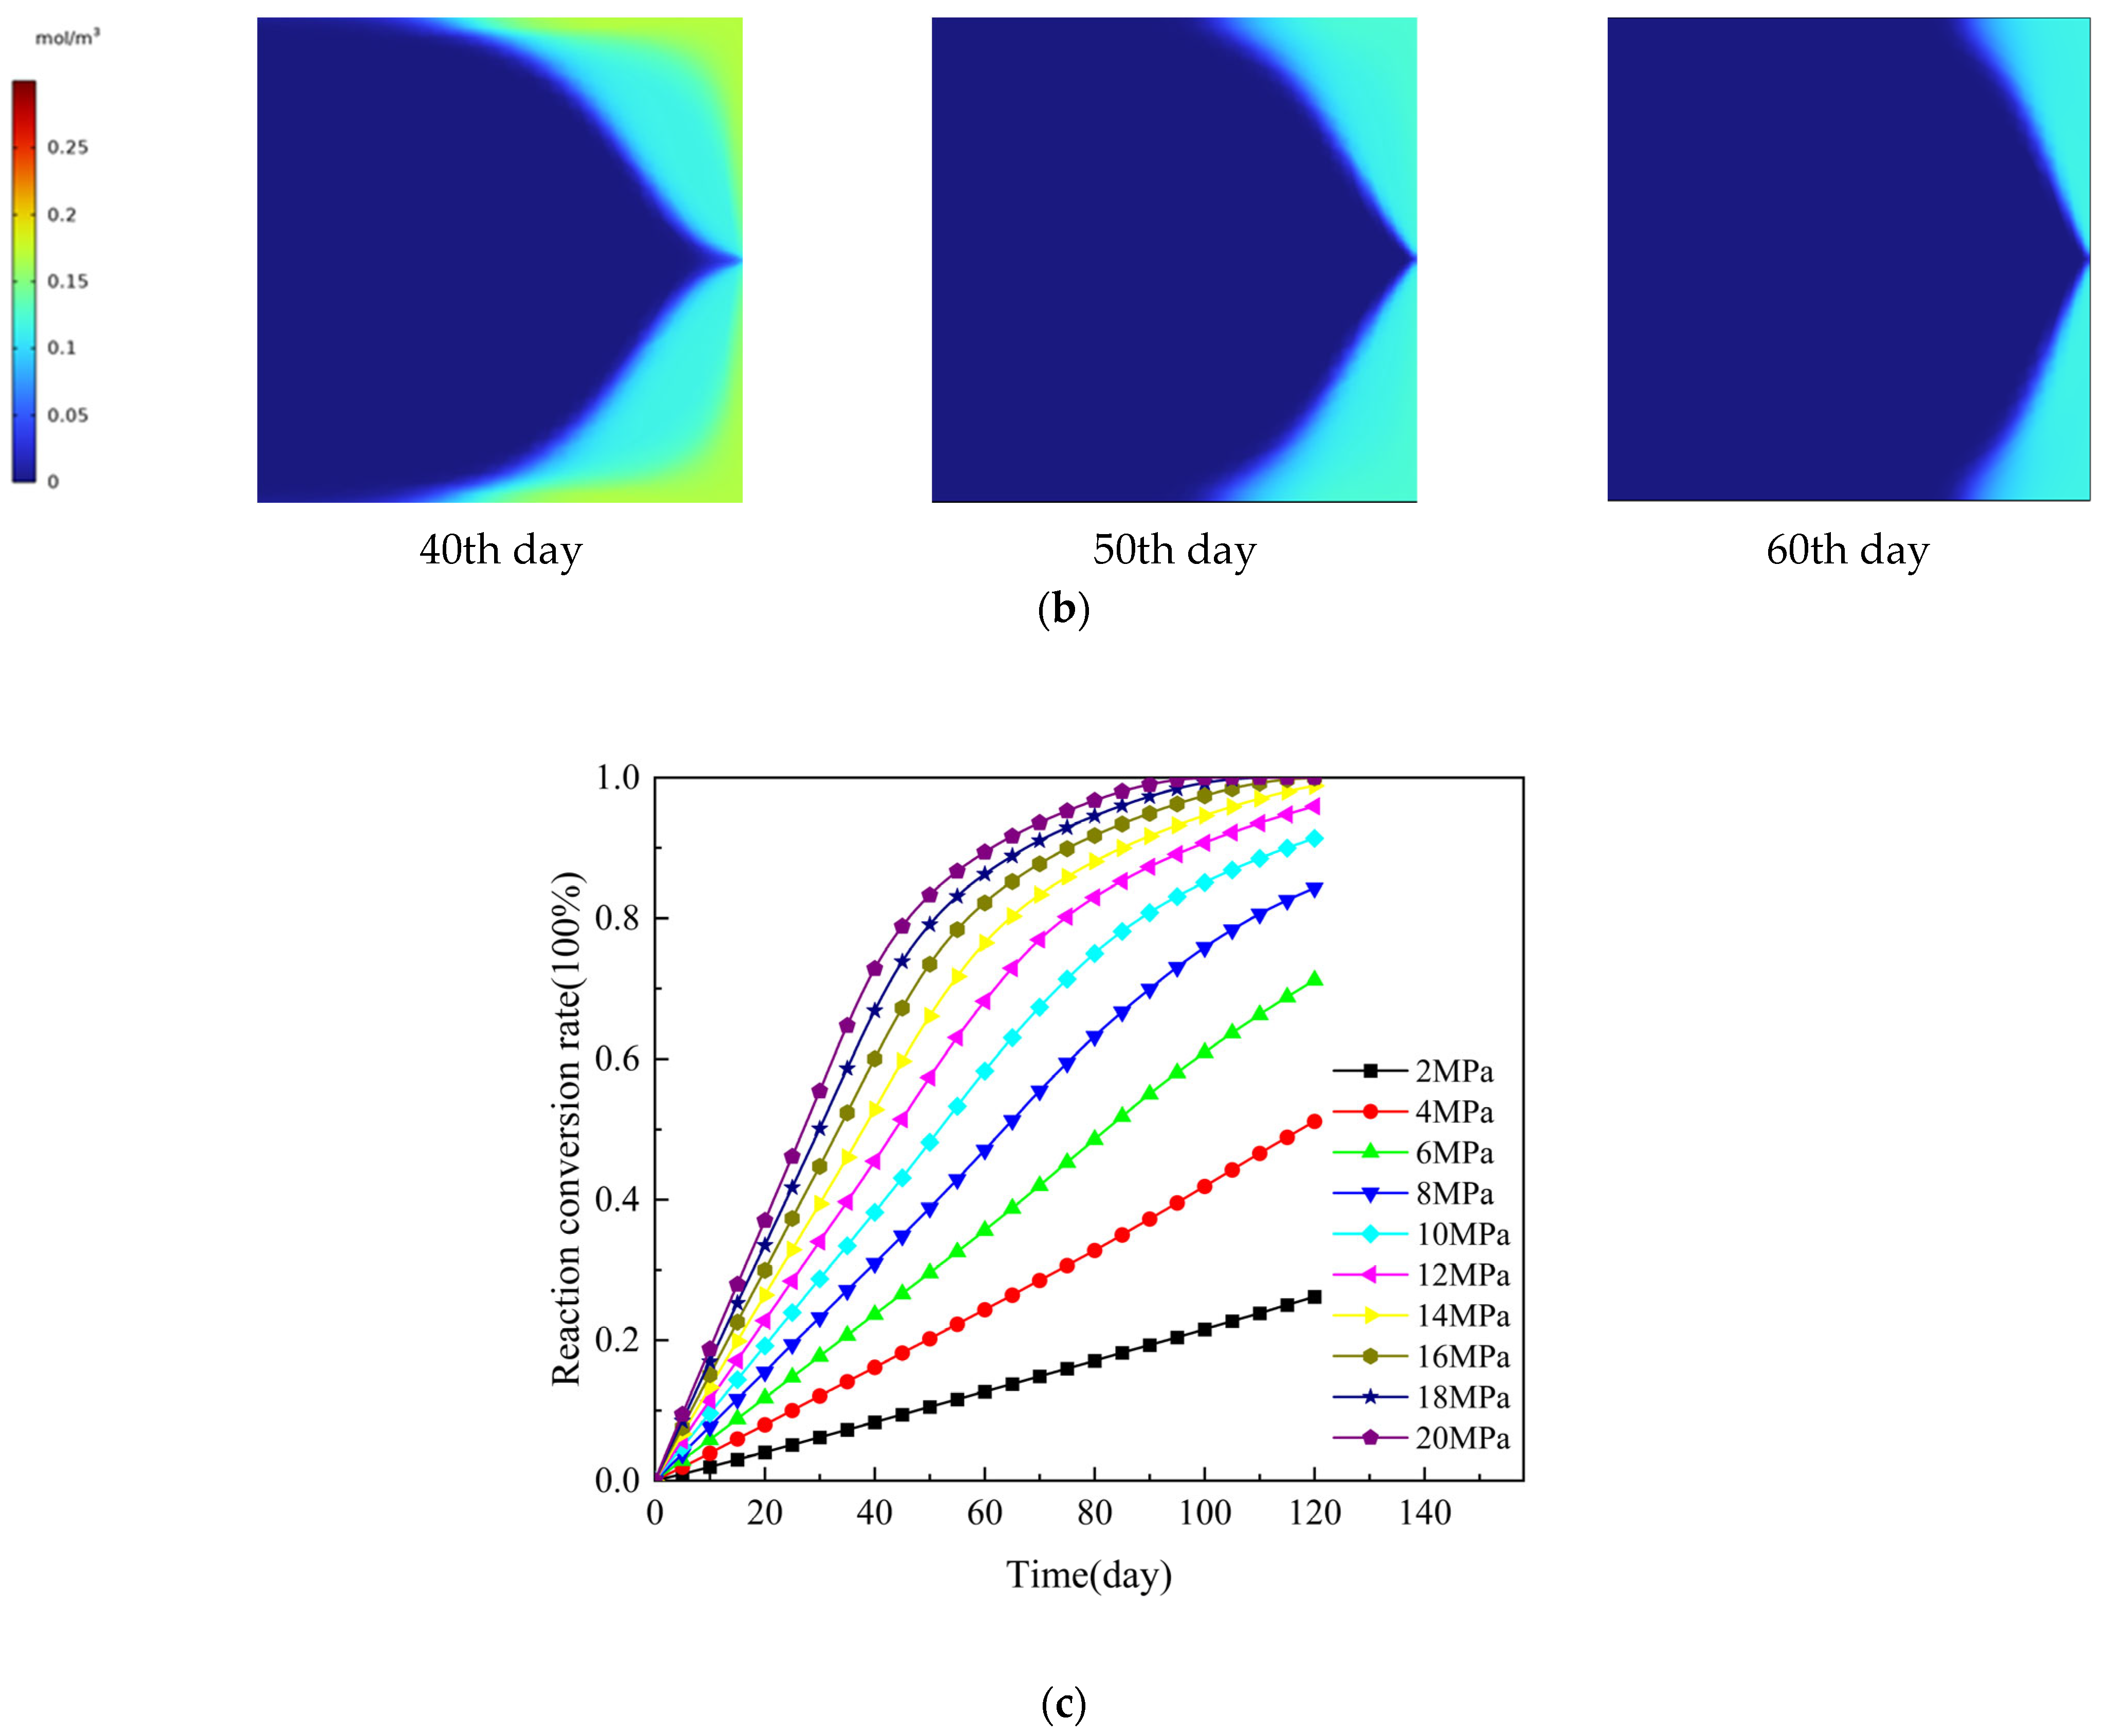
3.2. Performance Analysis for In Situ Pyrolysis of Oil-Rich Coal with and without Fracturing inside the Coal Seam
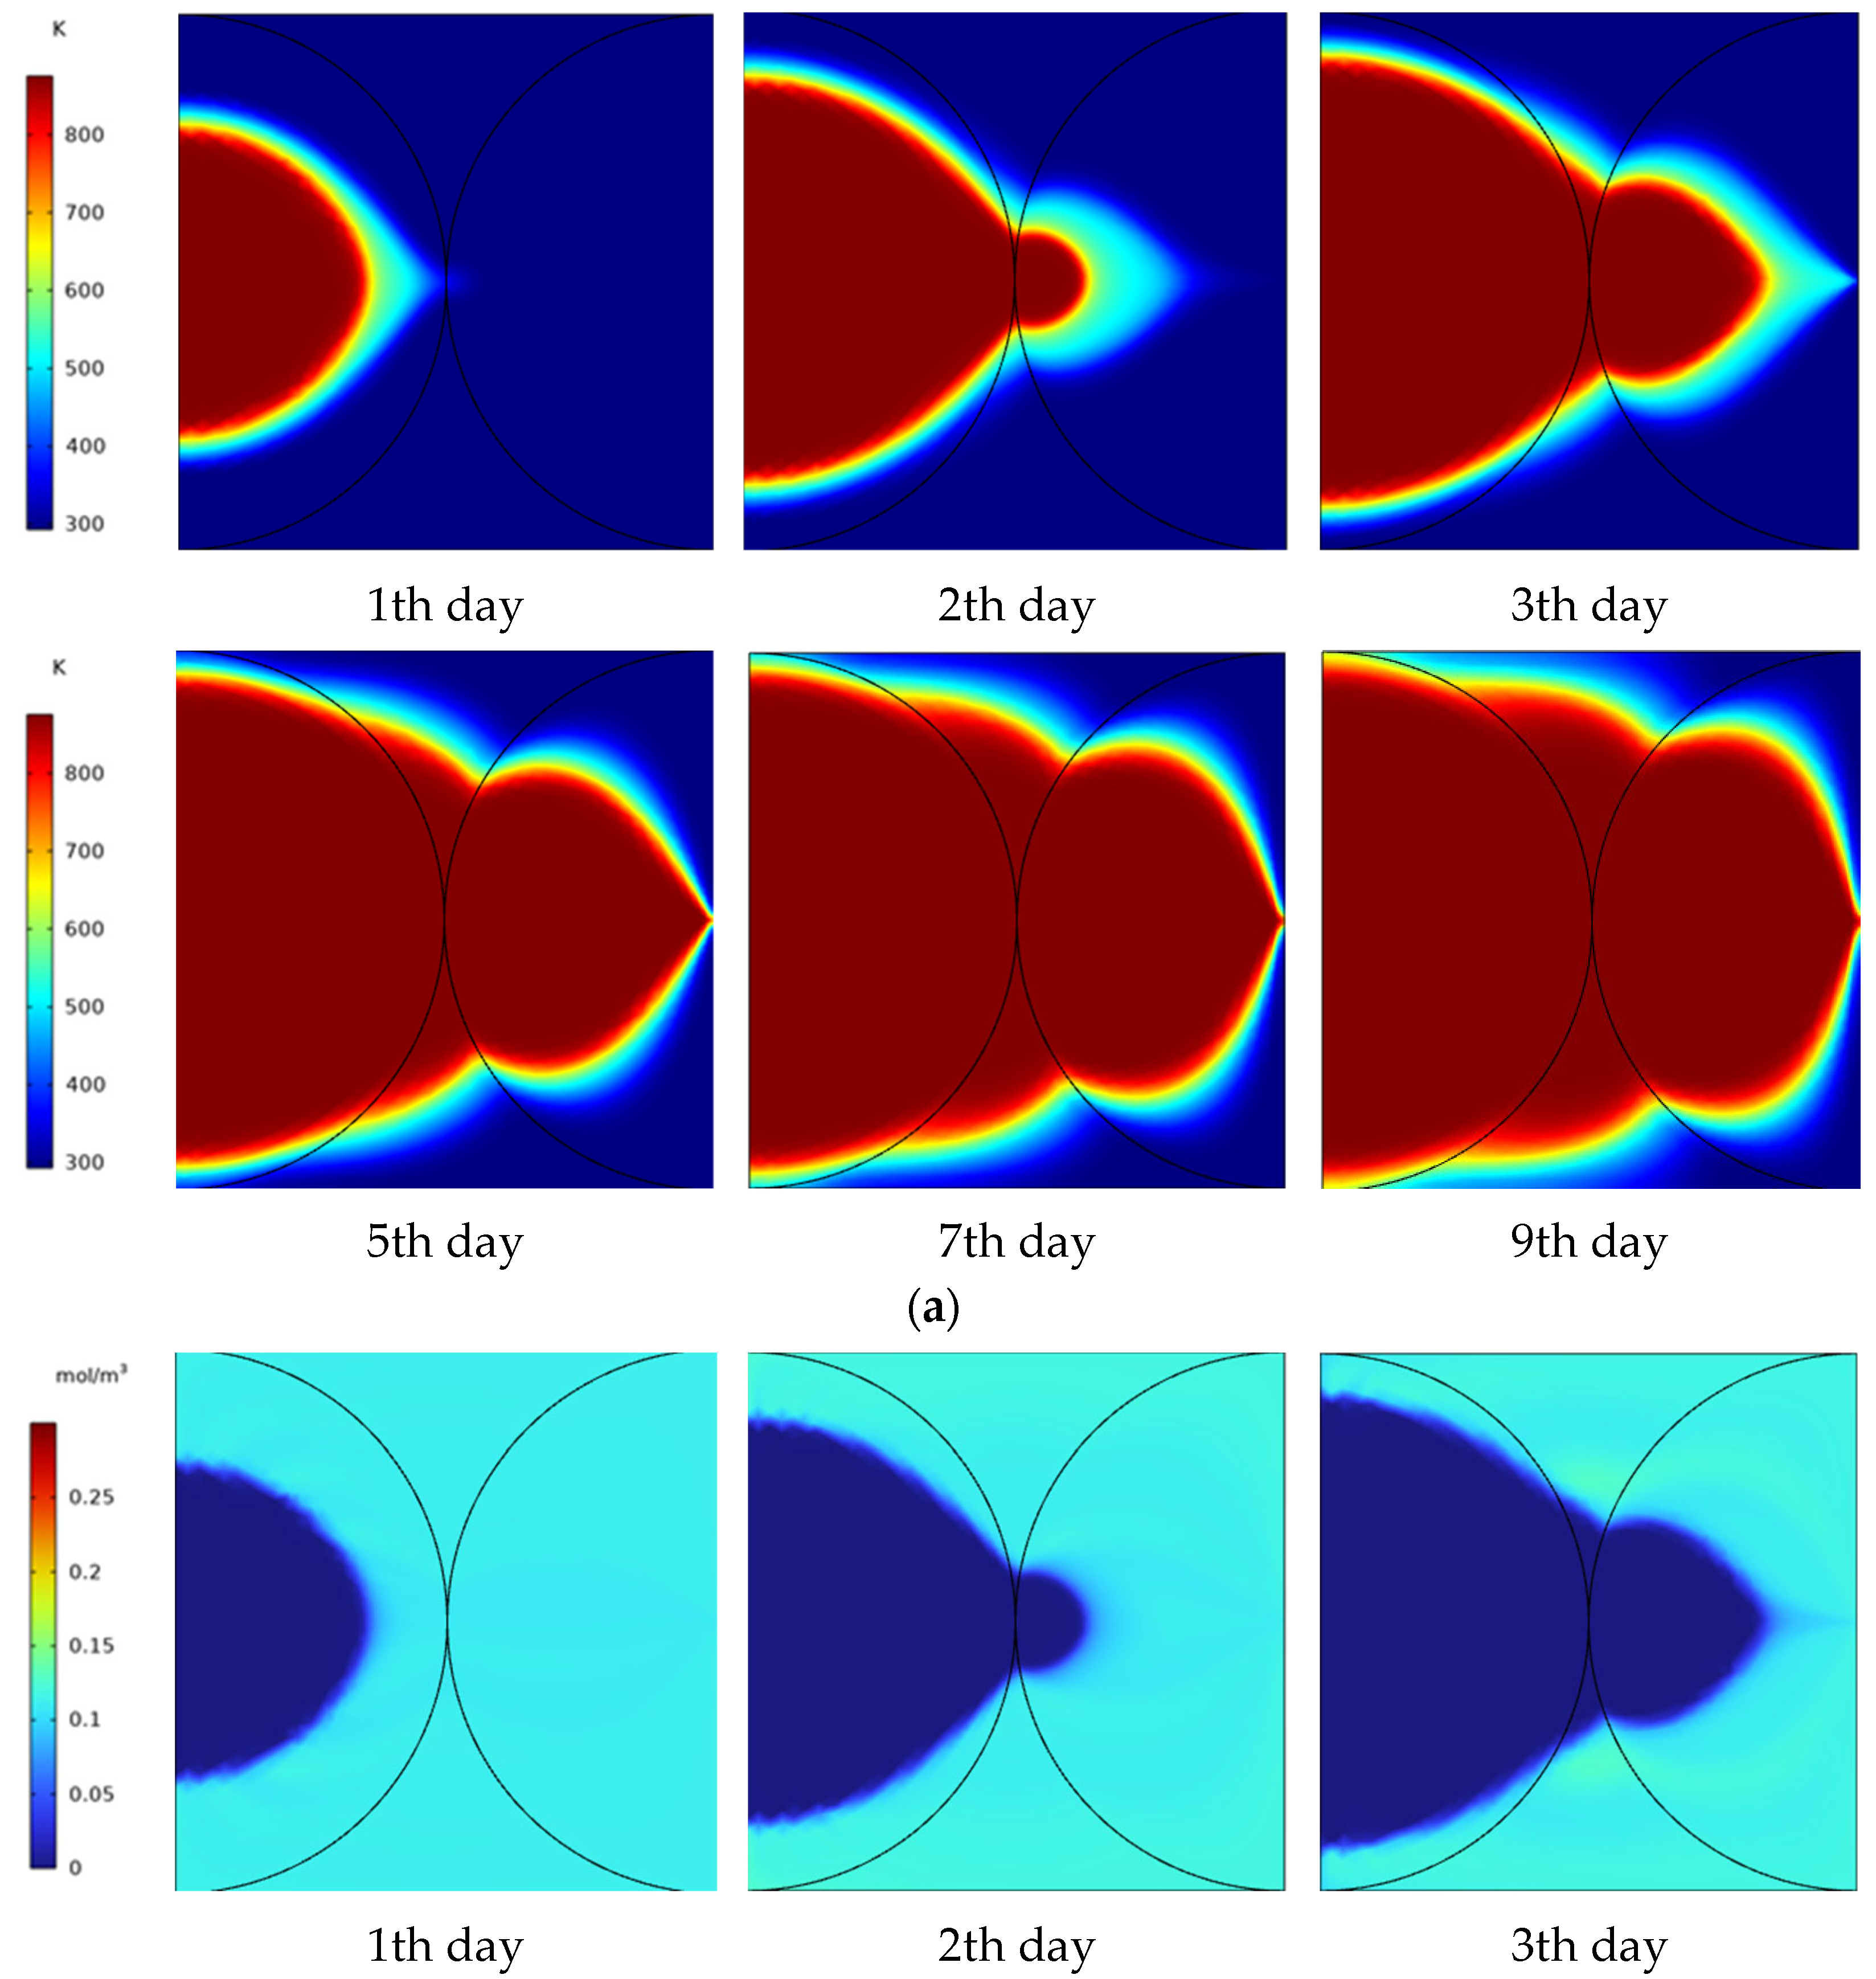
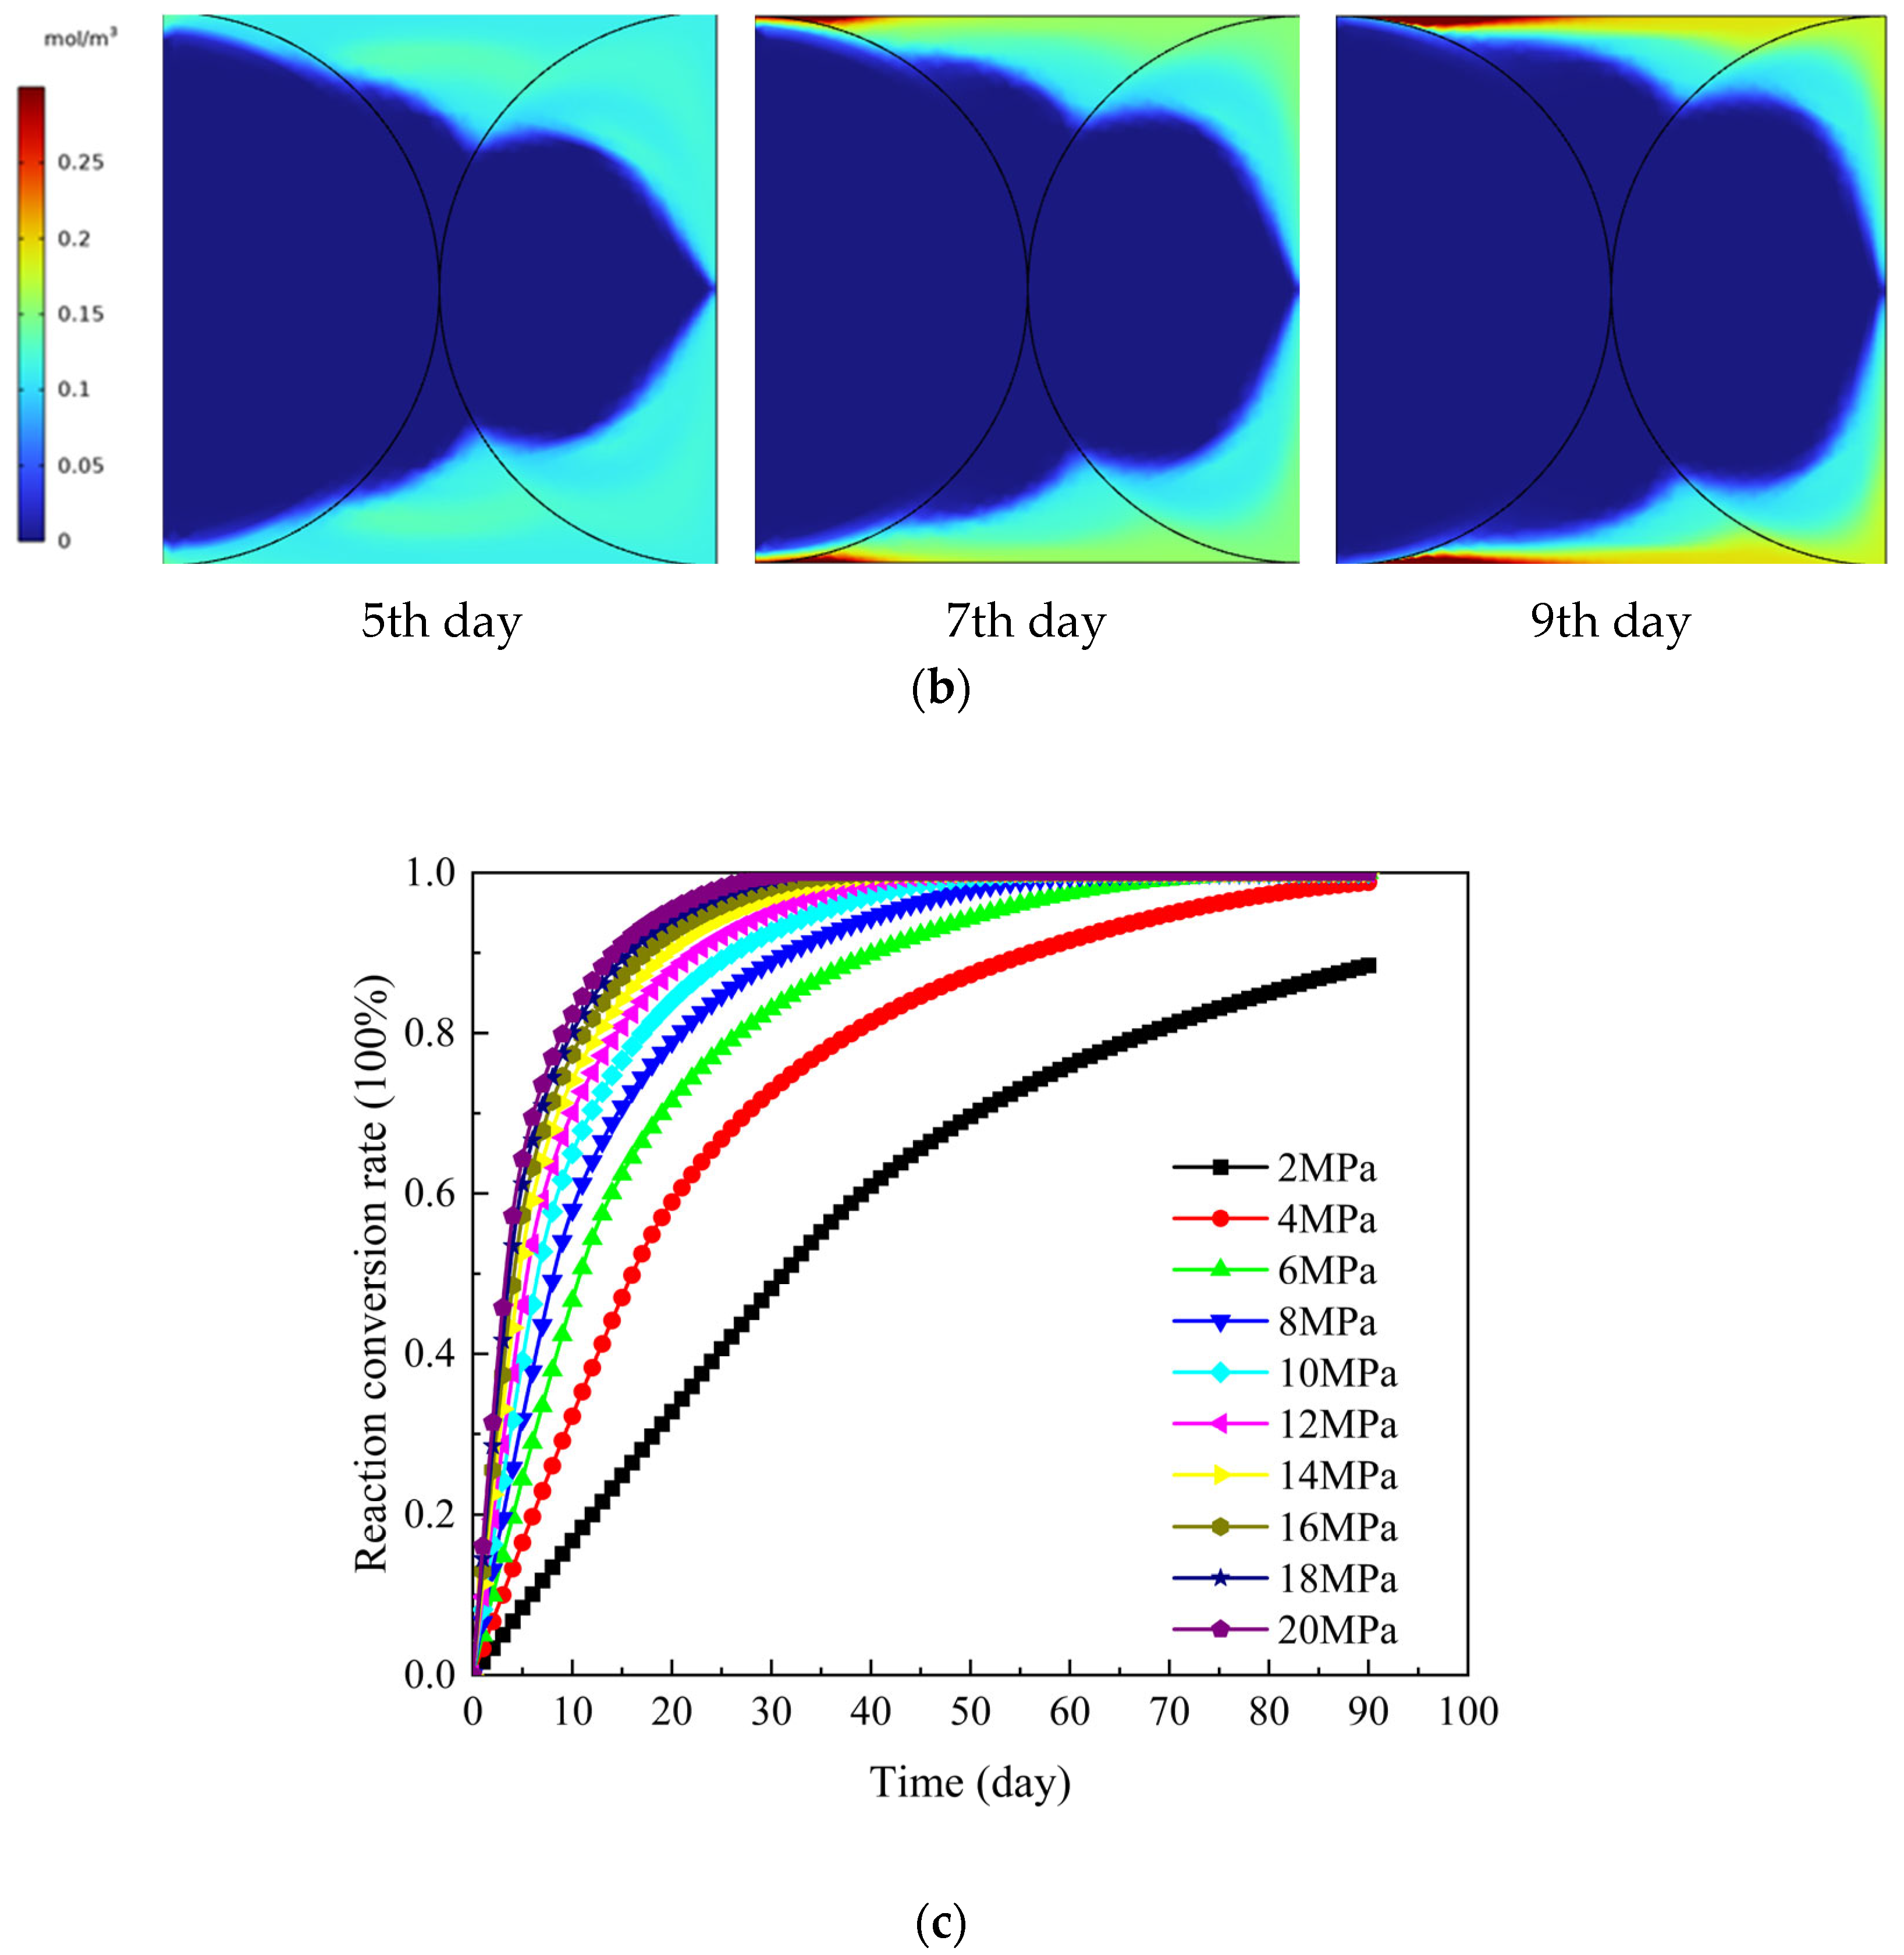
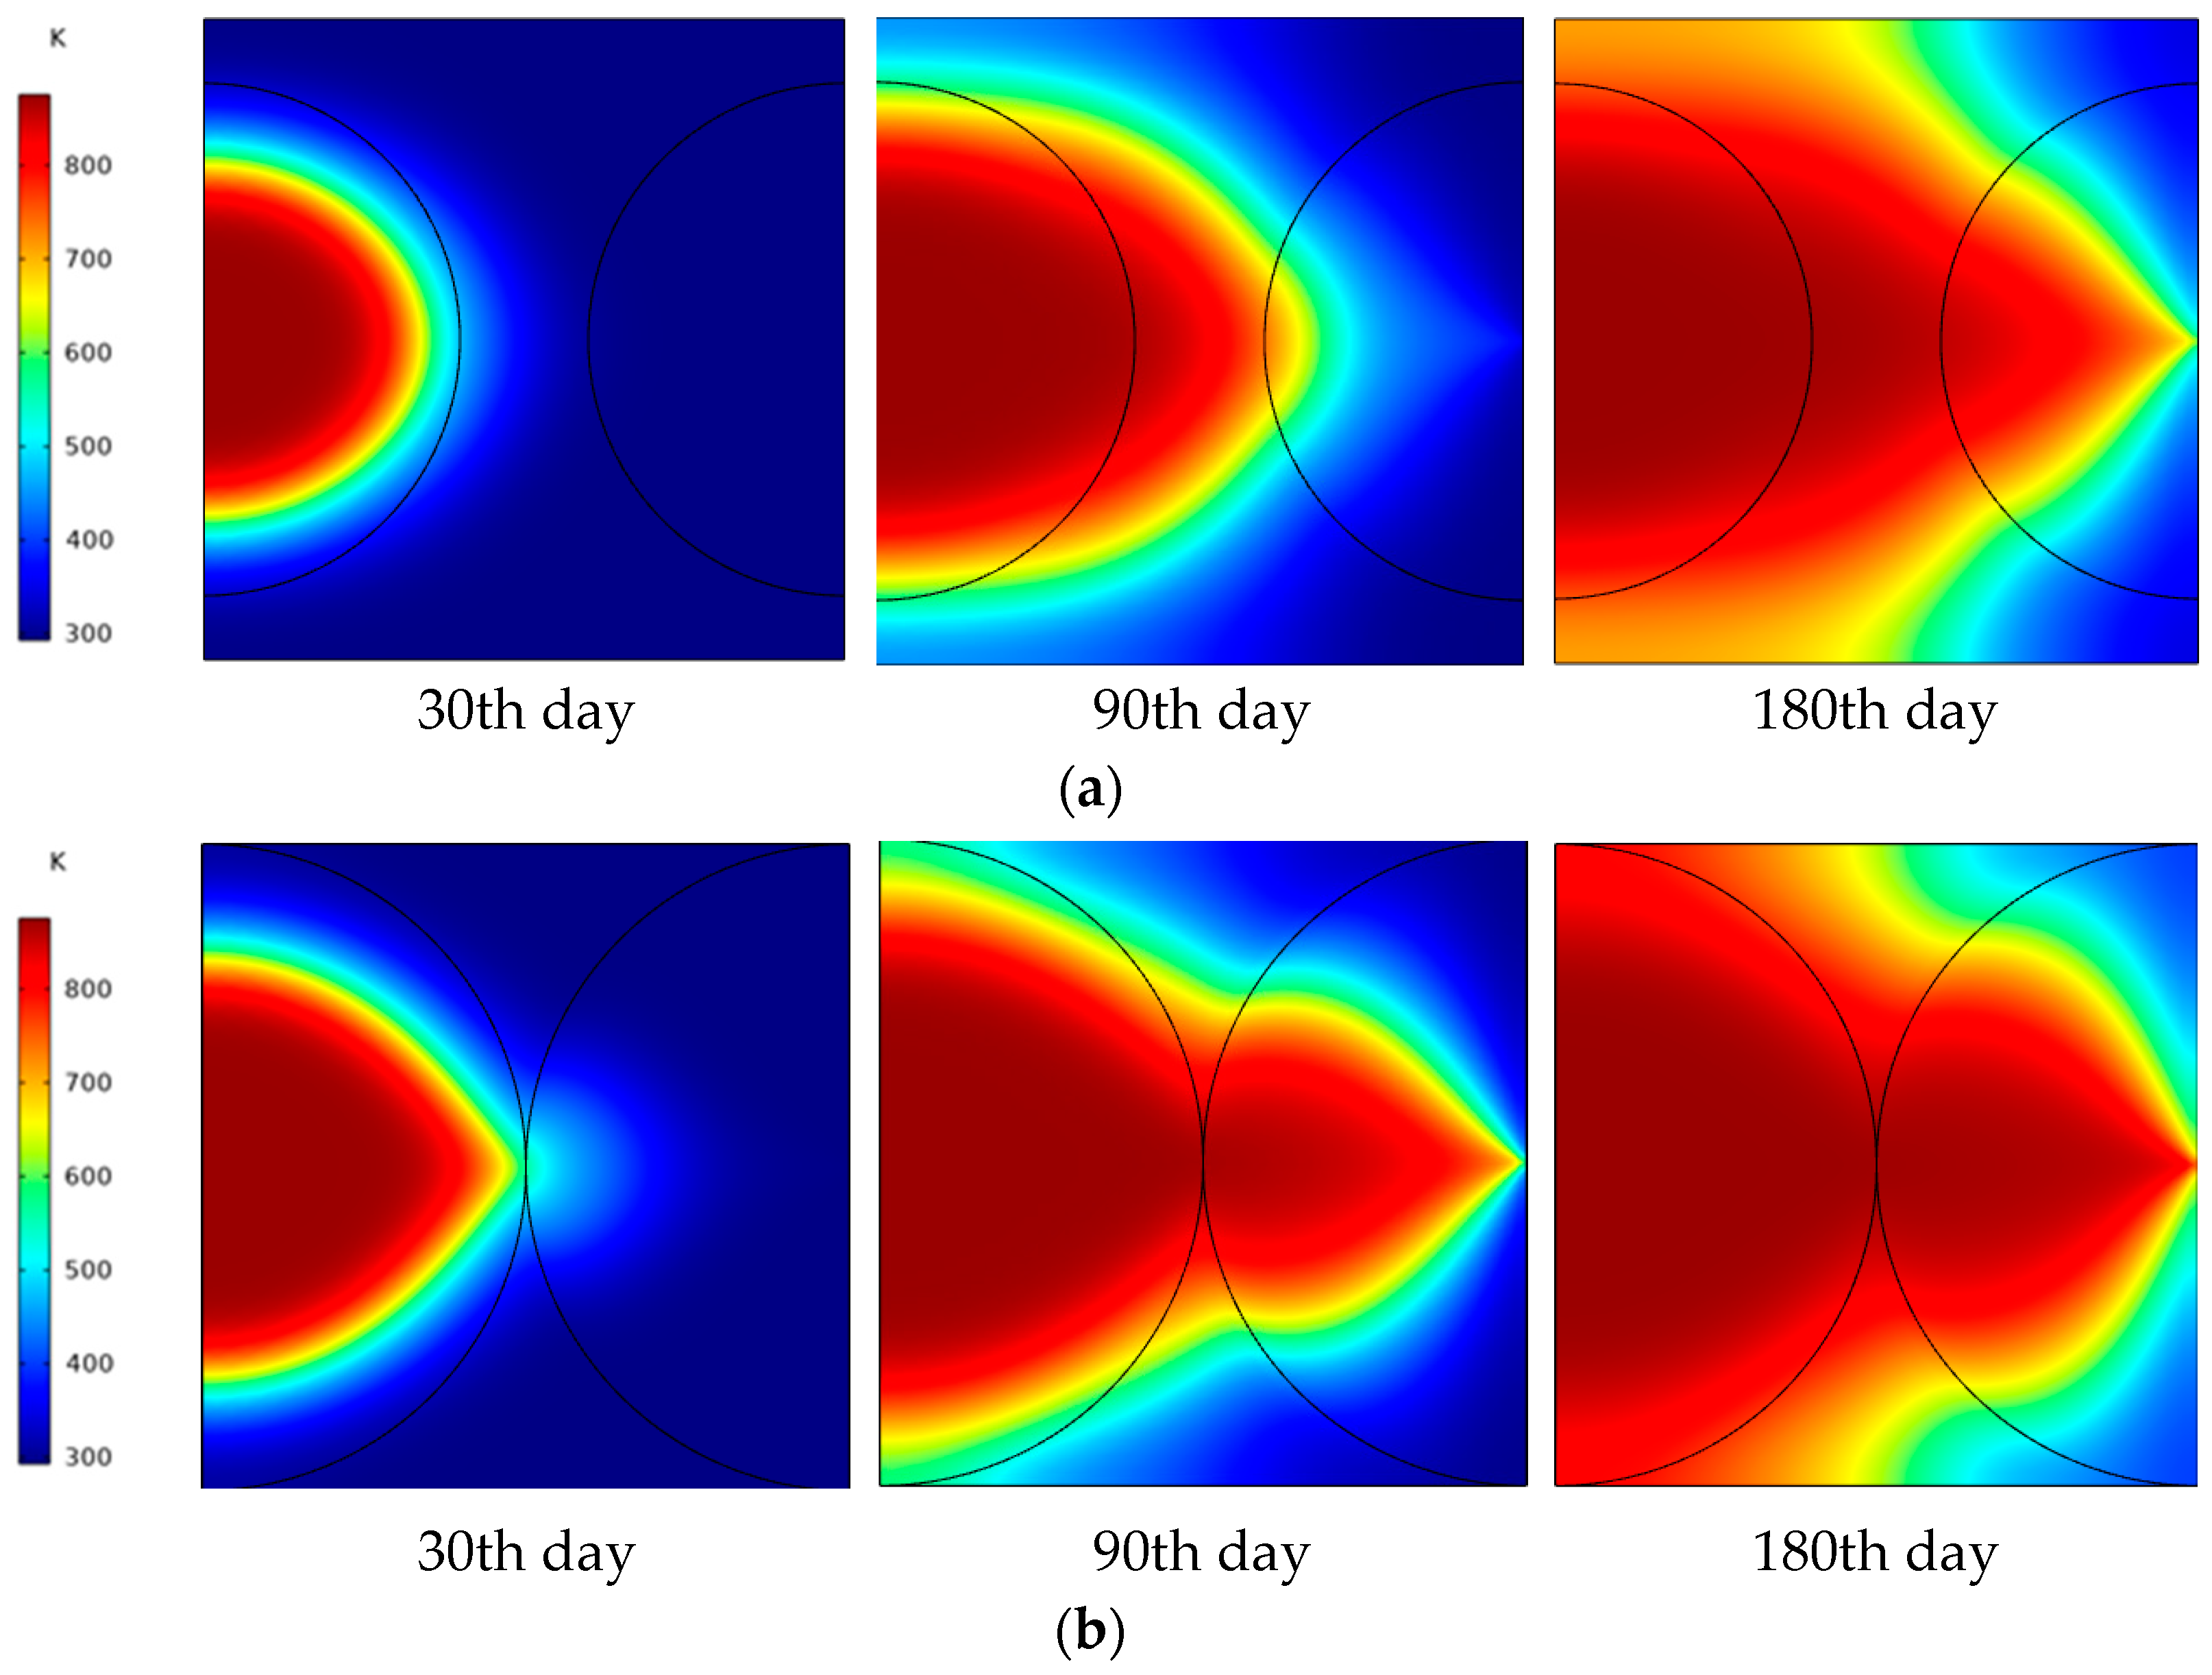
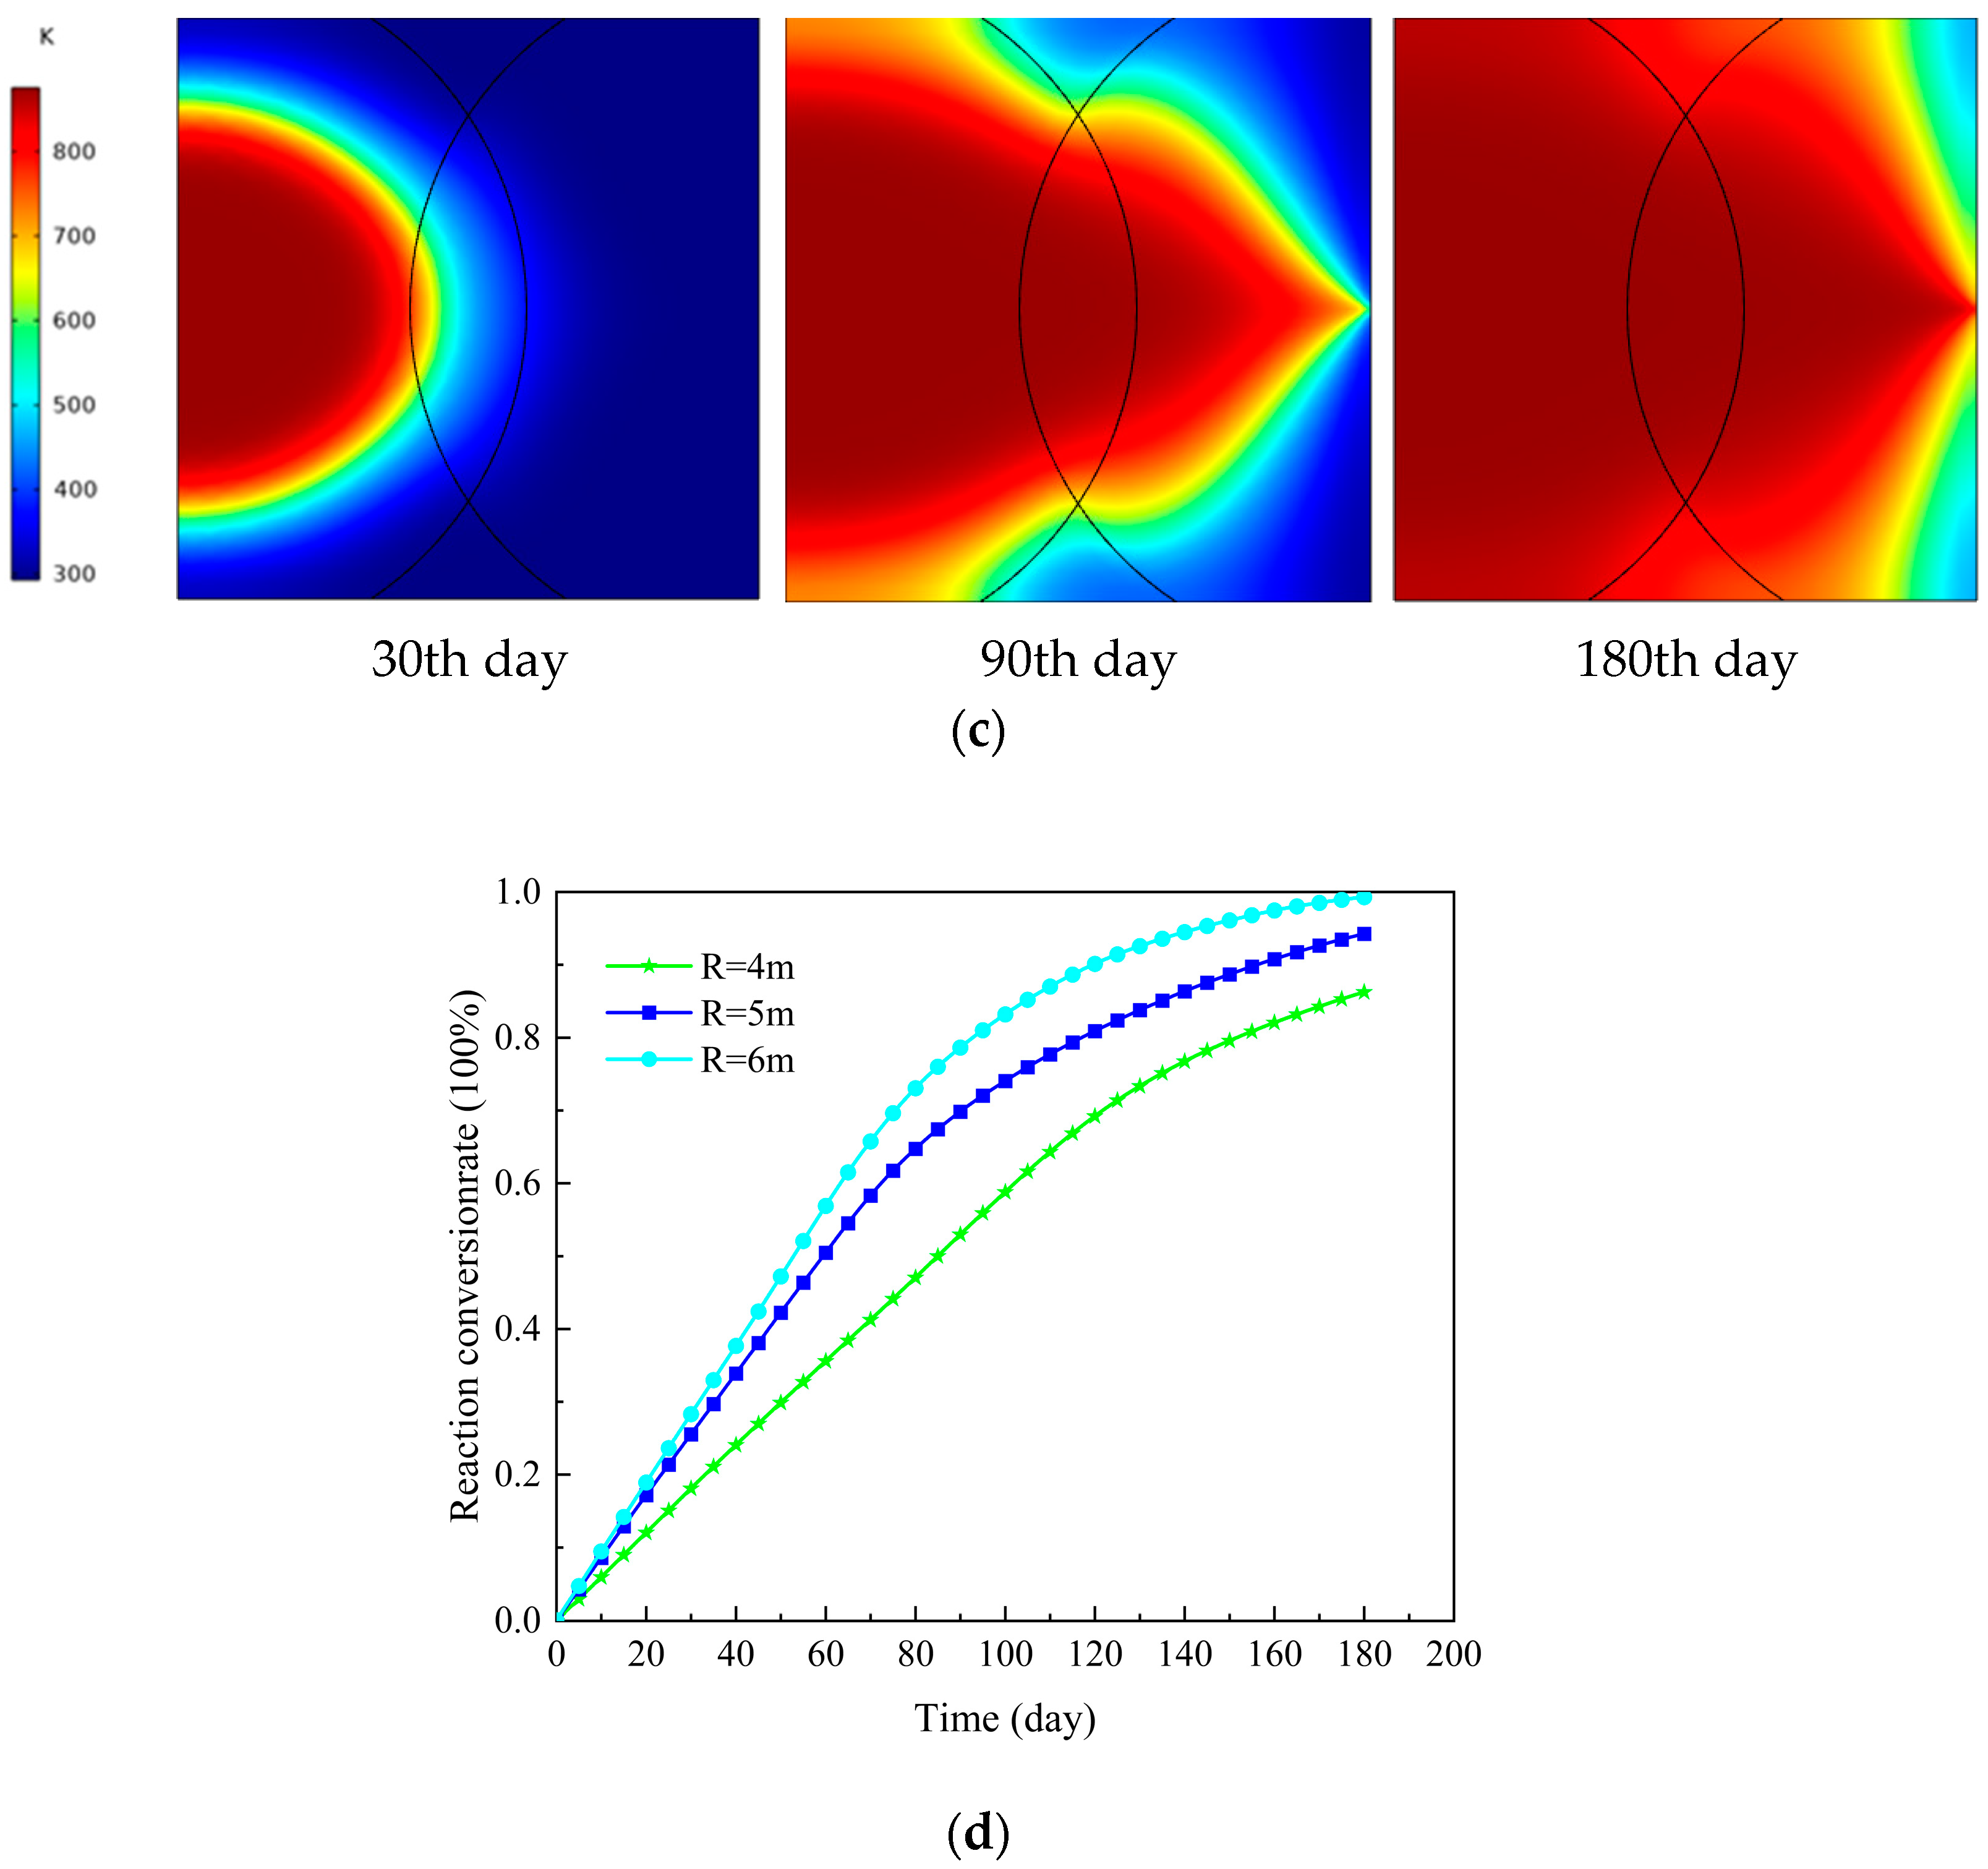
3.3. Performance Comparison for In Situ Pyrolysis of Oil-Rich Coal with Various Areas of the Fractured Zone
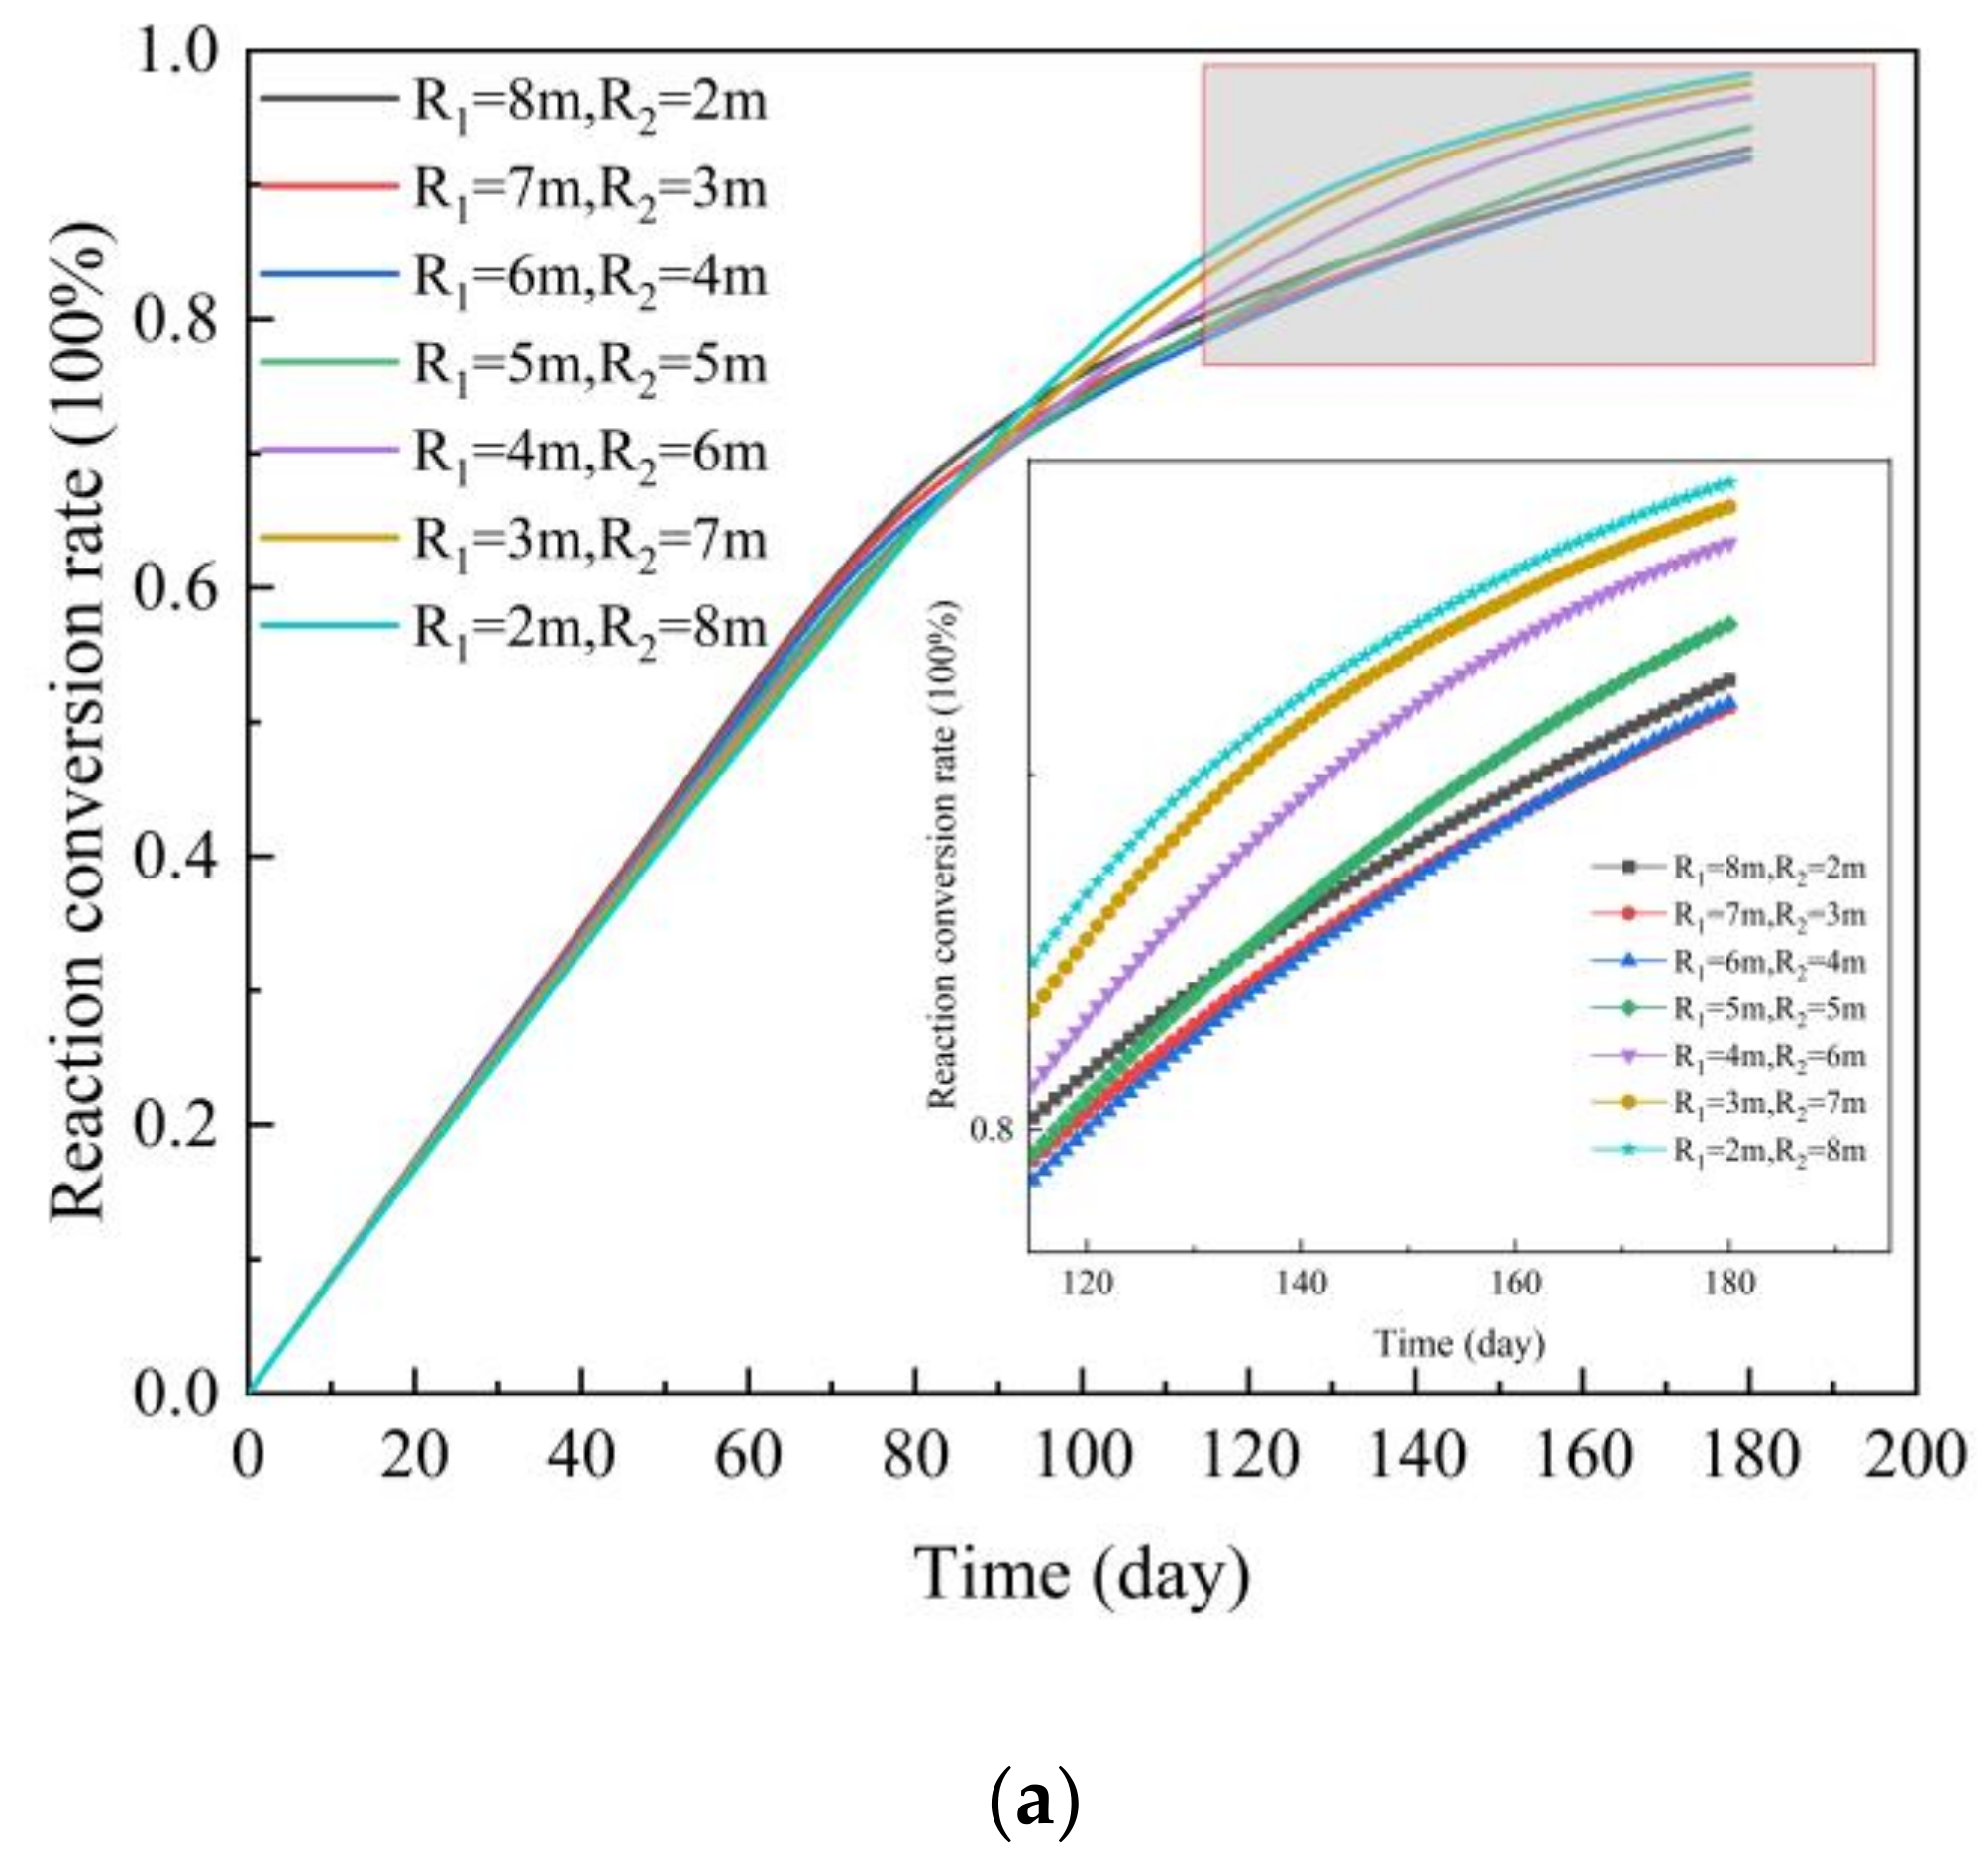
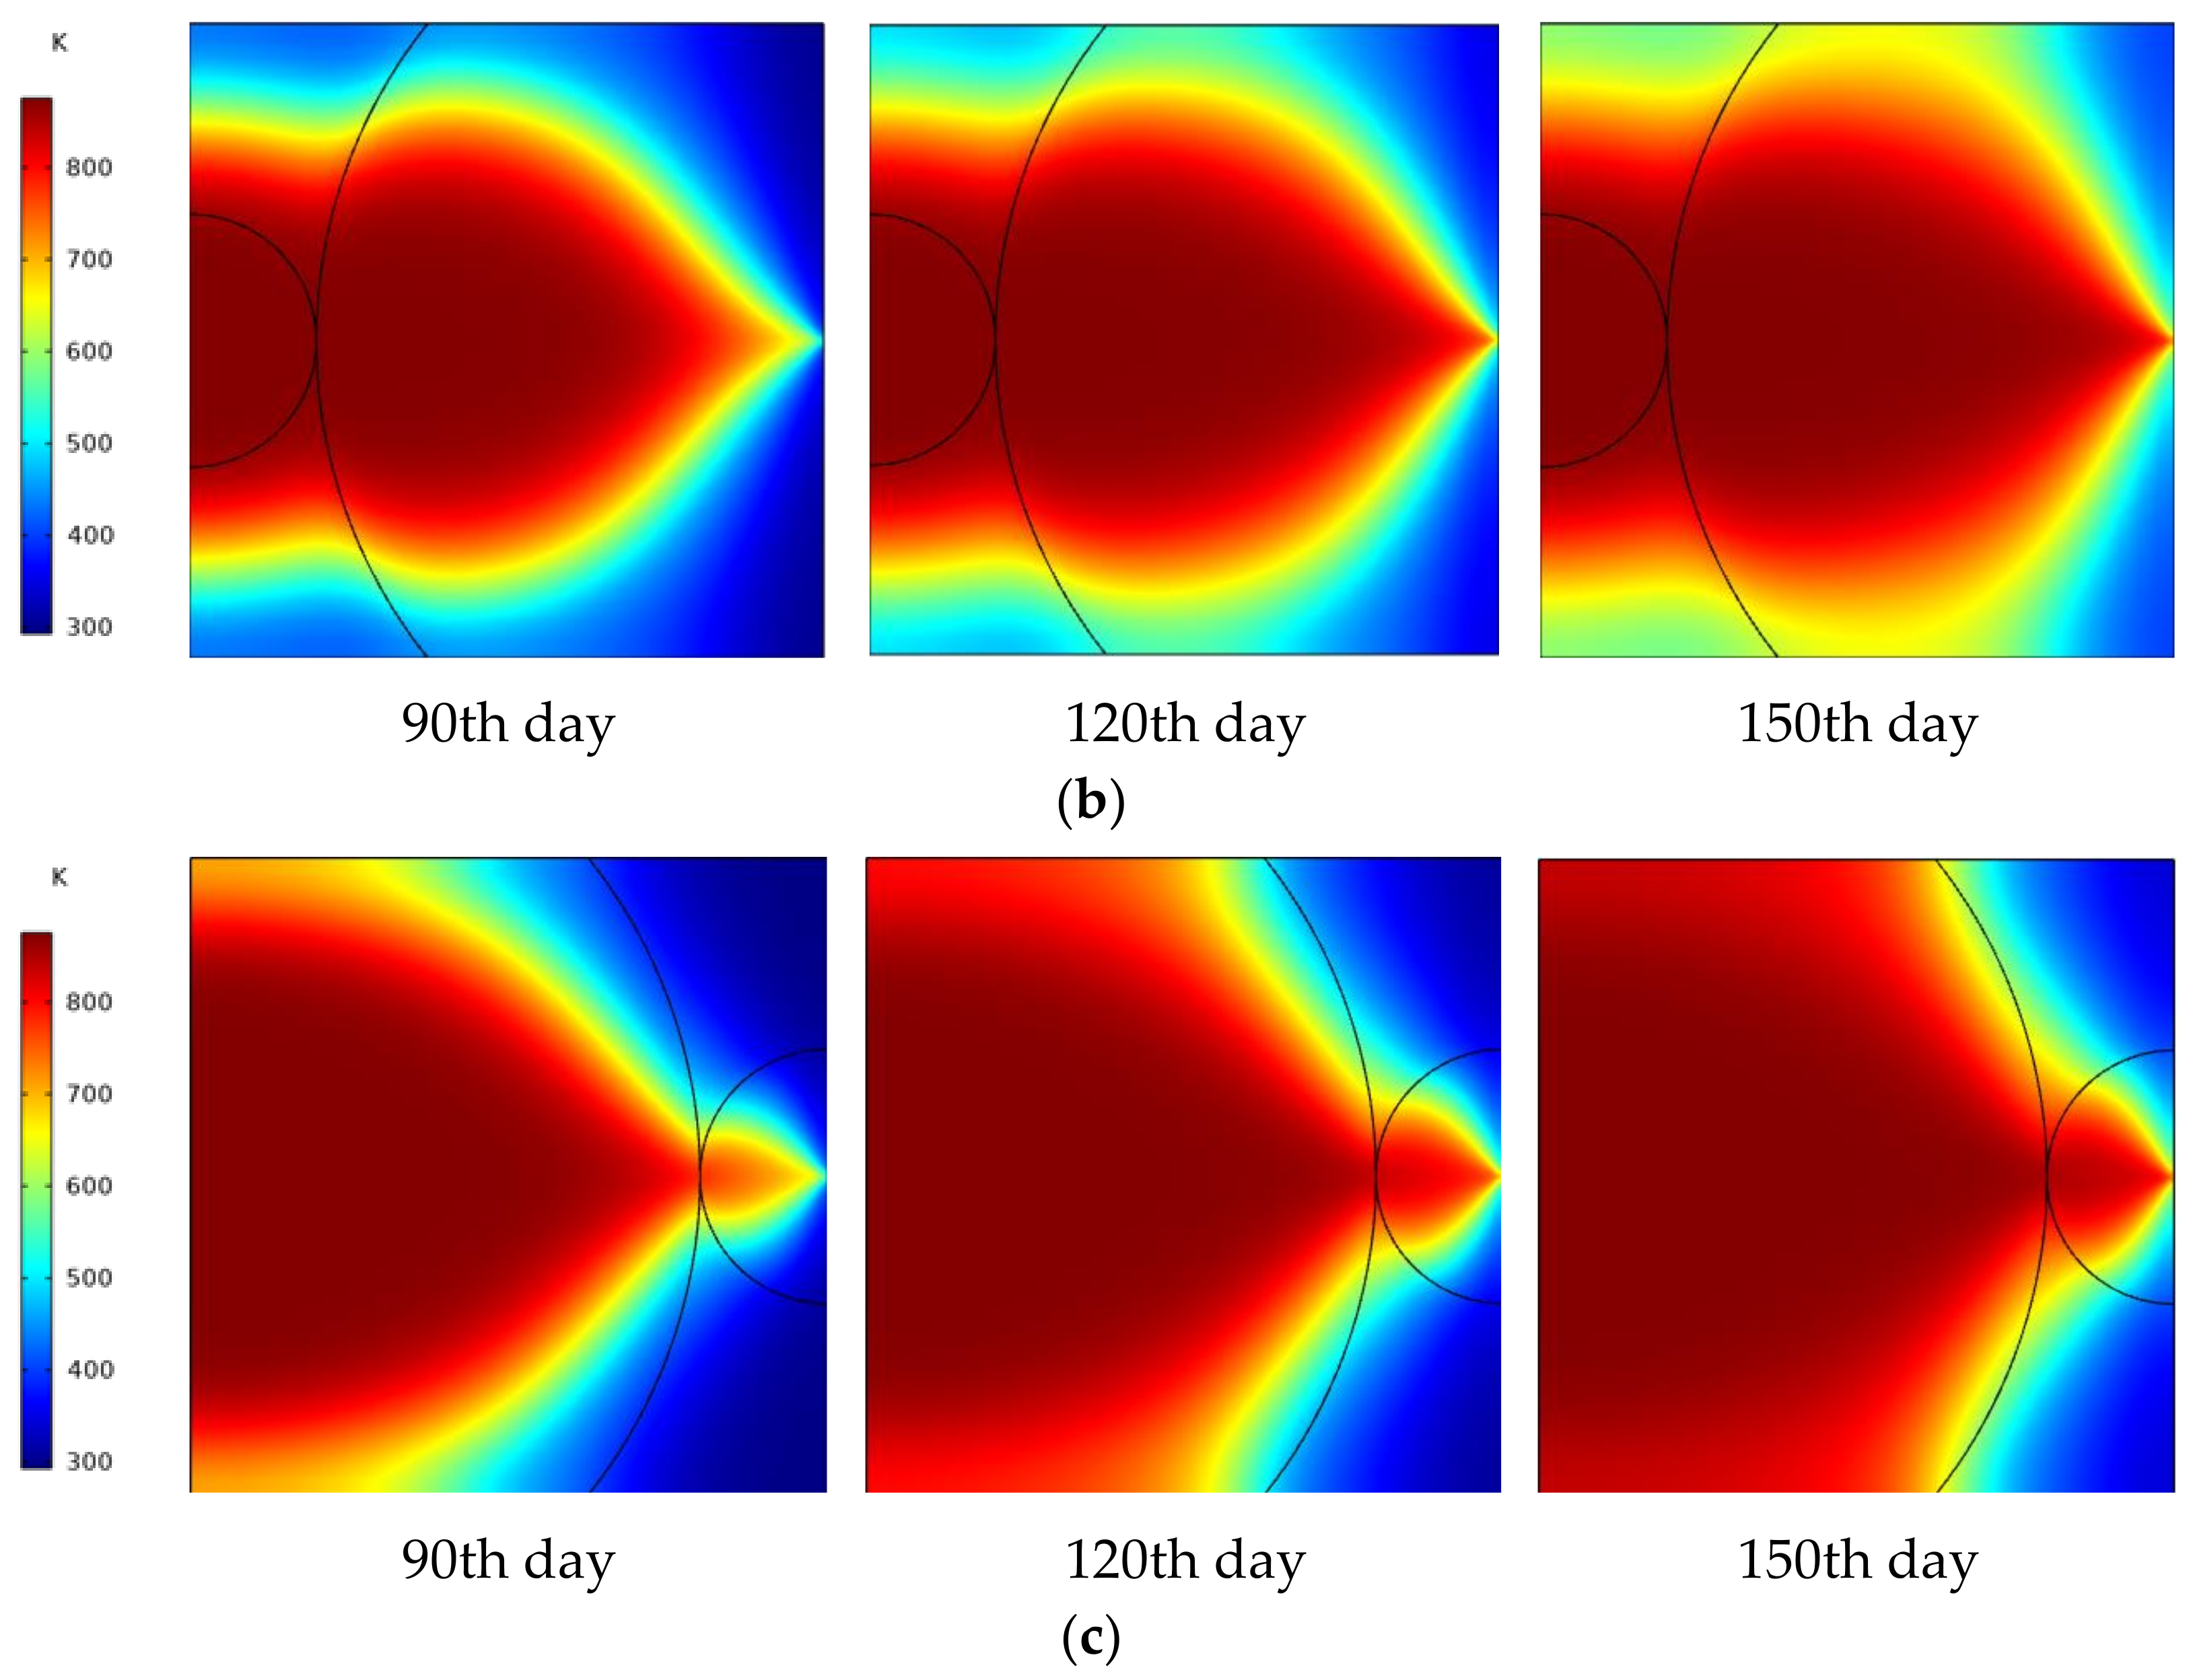
3.4. Effect of the Area of the Fractured Zone at the Outlet Well
4. Conclusions
- (1)
- For the model without fracture, the conversion rate on the 120th day is 98.8% when the injection gauge pressure is increased to 14 MPa, and the promotion is not obvious any more with further higher pressure.
- (2)
- For the model with fracture, pyrolysis can be completed in only 90 days at a much lower pressure of 4 MPa, which is beneficial for both reducing the heating period and the rapid harvesting of oil production.
- (3)
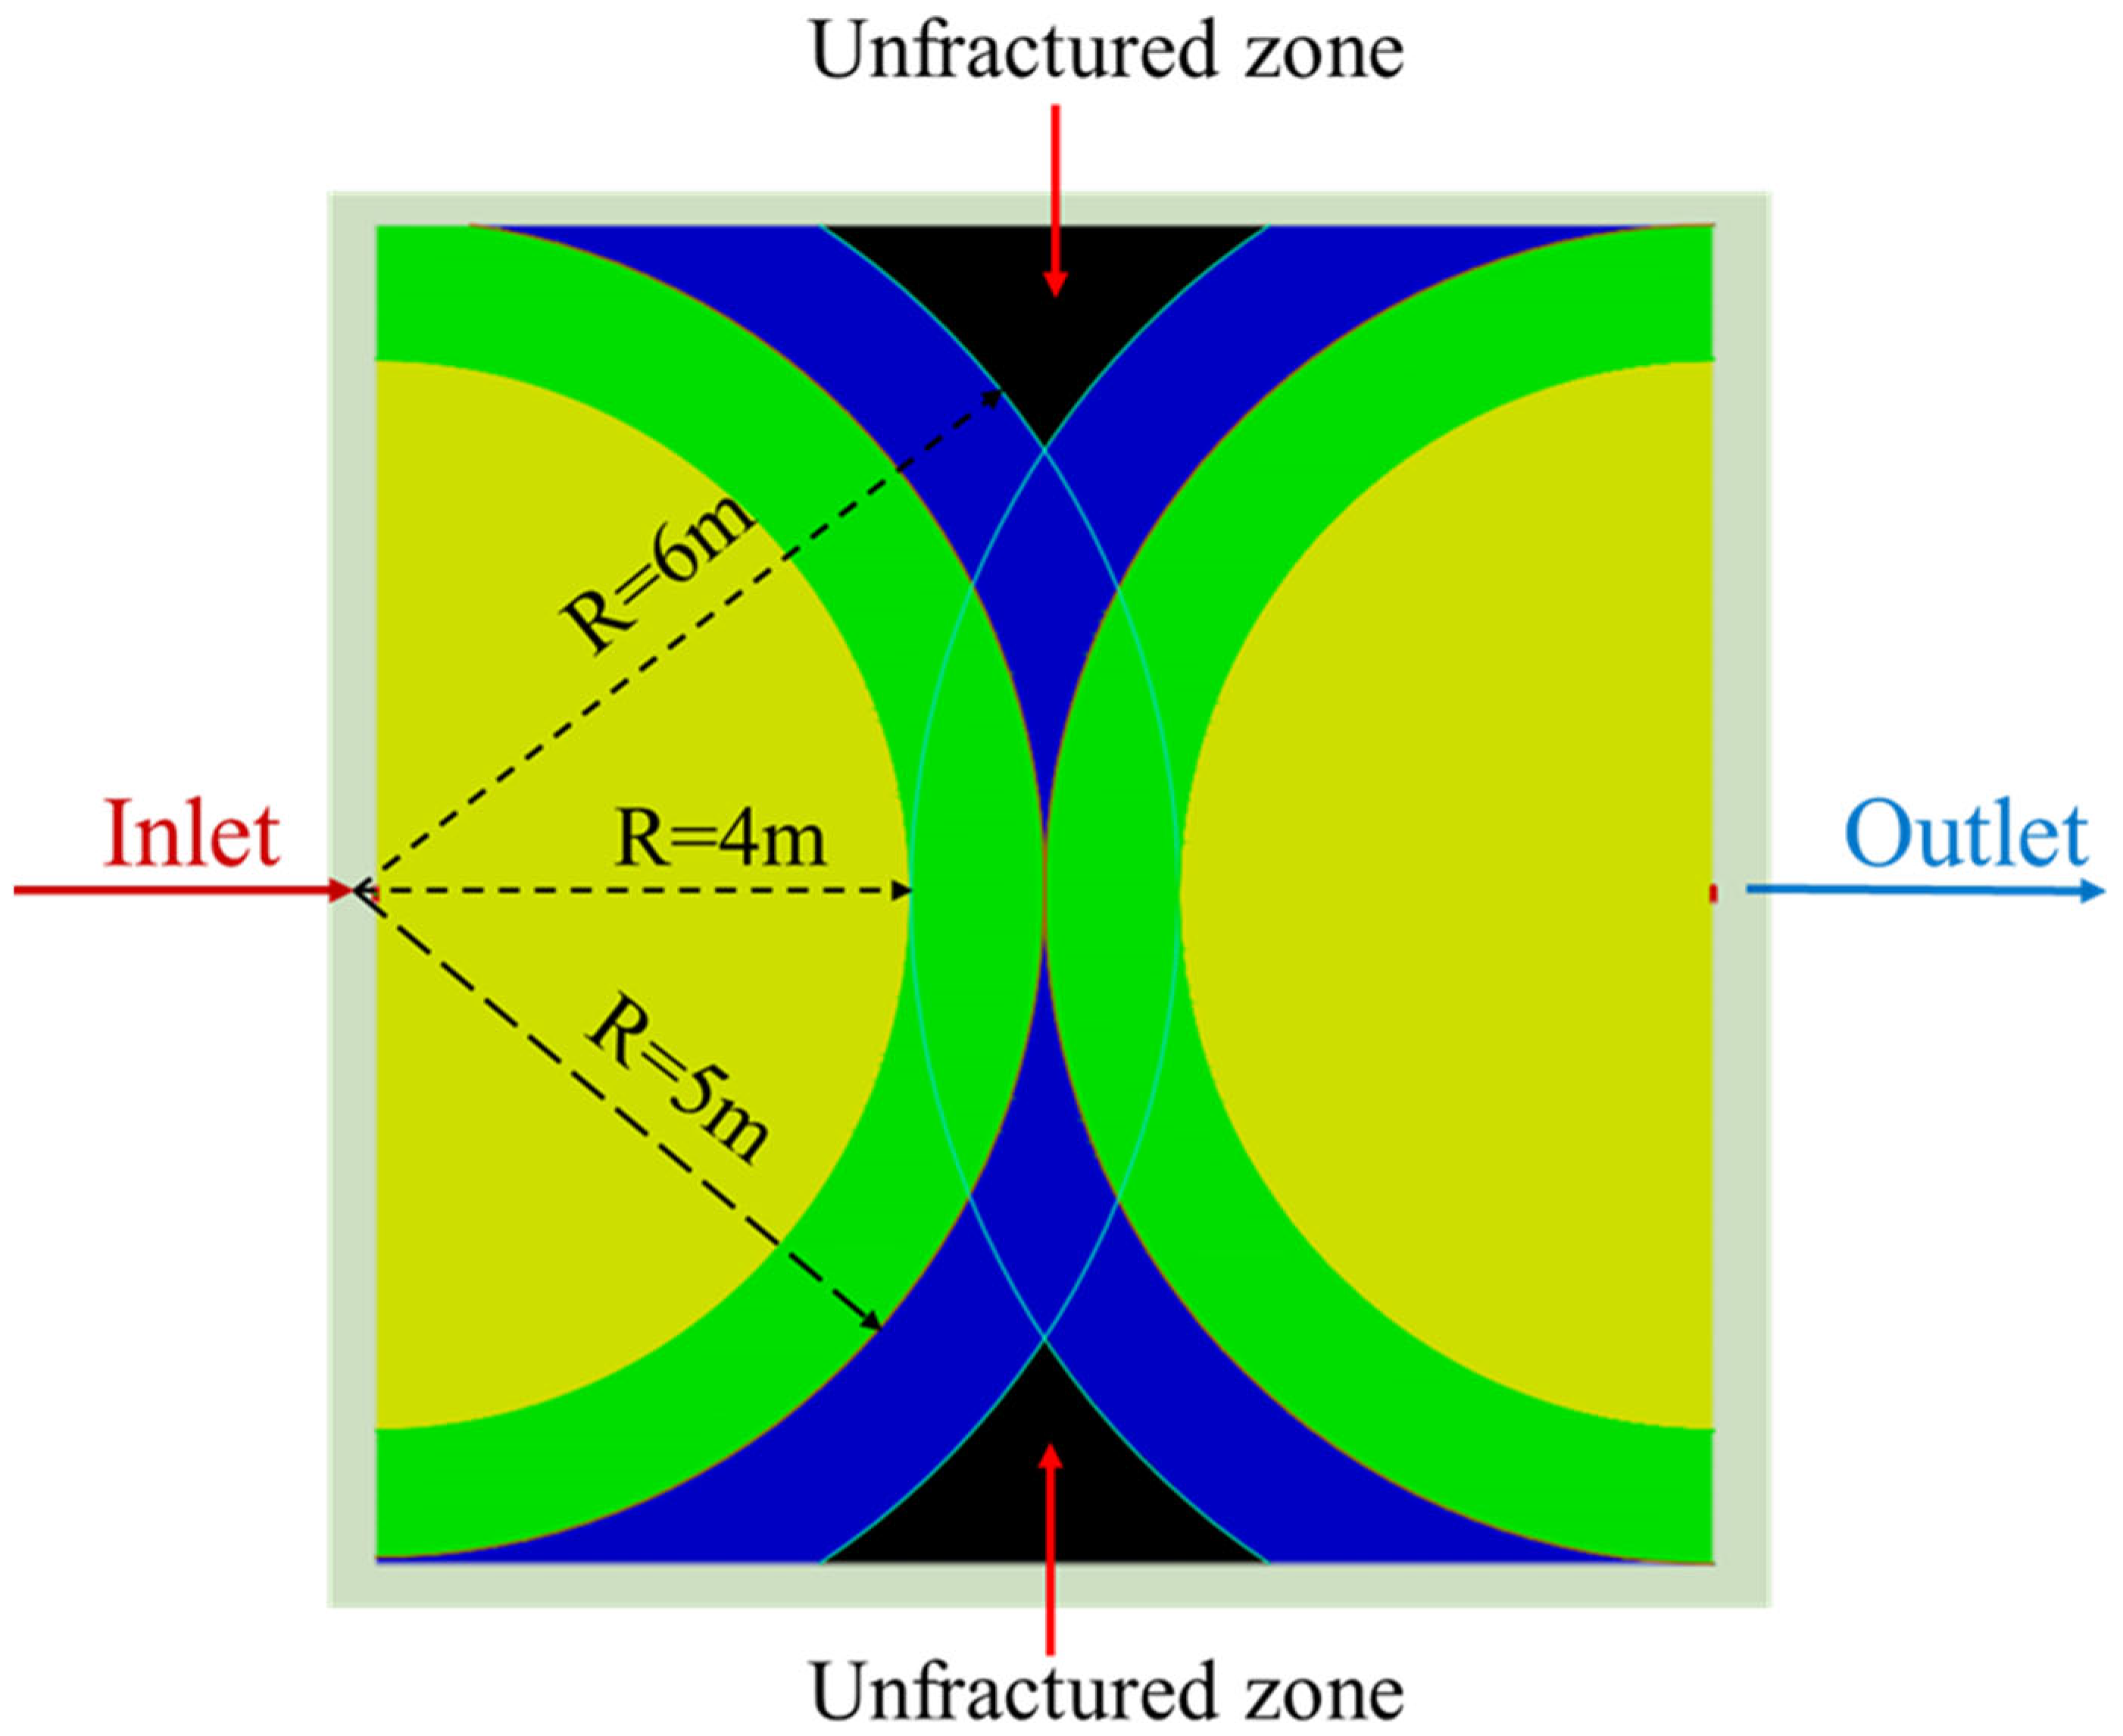
- The dead zones around the two corners at the right side of the computational domain near the outlet well are reduced effectively when the diameter of the fractured zone is increased.
- (4)
- The heat and mass transfer can be enhanced with the larger area of the fractured region at the outlet well for the reason that the flowing ‘dead zone’ experienced a longer effective heating time.
Author Contributions
Funding
Data Availability Statement
Conflicts of Interest
References
- Wang, S.; Shi, Q.; Wang, S.; Shen, Y.; Sun, Q.; Cai, Y. Resource property and exploitation concepts with green and low-carbon of tar-rich coal as coal-based oil and gas. J. China Coal Soc. 2021, 46, 1365–1377. [Google Scholar]
- Ma, L.; Tuo, B. Shaanxi’s tar-rich coal resources rank first in China-Yulin can be “rebuilt a Daqing oilfield”. Shaanxi Coal 2020, 39, 220–222. [Google Scholar]
- Pei, S.; Cui, G.; Zhang, L.; Zhang, P.; Ren, S. Performance and important engineering aspects of air injection assisted in situ upgrading process for heavy oil recovery. J. Pet. Sci. Eng. 2021, 202, 108554. [Google Scholar]
- Pei, S.; Wang, Y.; Liang, Z.; Huang, L.; Cui, G.; Zhang, P.; Ren, S. An innovative nitrogen injection assisted in-situ conversion process for oil shale recovery: Mechanism and reservoir simulation study. J. Pet. Sci. Eng. 2018, 171, 507–515. [Google Scholar]
- Zhao, W.; Hu, S.; Hou, L. Connotation and strategic role of in-situ conversion processing of shale oil underground in the onshore China. Pet. Explor. Dev. 2018, 45, 563–572. [Google Scholar]
- Song, X.; Zhang, C.; Shi, Y.; Li, G. Production performance of oil shale in-situ conversion with multilateral wells. Energy 2019, 189, 116145. [Google Scholar]
- Mukhina, E.; Cheremisin, A.; Khakimova, L.; Garipova, A.; Dvoretskaya, E.; Zvada, M.; Kalacheva, D.; Prochukhan, K.; Kasyanenko, A.; Cheremisin, A. Enhanced oil recovery method selection for shale oil based on numerical simulations. ACS Omega 2021, 6, 23731–23741. [Google Scholar]
- Maes, J.; Muggeridge, A.H.; Jackson, M.; Quintard, M.; Lapene, A. Scaling analysis of the in-situ upgrading of heavy oil and oil shale. Fuel 2017, 195, 299–313. [Google Scholar]
- Lee, K.J.; Moridis, G.J.; Ehlig-Economides, C.A. Numerical simulation of diverse thermal in situ upgrading processes for the hydrocarbon production from kerogen in oil shale reservoirs. Energy Explor. Exploit. 2017, 35, 315–337. [Google Scholar]
- Pei, S.; Cui, G.; Wang, Y.; Zhang, L.; Ren, S. Air assisted in situ upgrading via underground heating for ultra heavy oil: Experimental and numerical simulation study. Fuel 2020, 279, 118452. [Google Scholar]
- Wang, L.; Yang, D.; Kang, Z. Evolution of permeability and mesostructure of oil shale exposed to high-temperature water vapor. Fuel 2021, 290, 119786. [Google Scholar]
- Lee, K.J.; Moridis, G.J.; Ehlig-Economides, C.A. In situ upgrading of oil shale by steamfrac in multistage transverse fractured horizontal well system. Energy Sources Part A Recovery Util. Environ. Eff. 2016, 38, 3034–3041. [Google Scholar]
- Gao, W.; Zagorščak, R.; Thomas, H.R. Insights into solid-gas conversion and cavity growth during Underground Coal Gasification (UCG) through Thermo-Hydraulic-Chemical (THC) modelling. Int. J. Coal Geol. 2021, 237, 103711. [Google Scholar]
- Panahi, H.; Kobchenko, M.; Meakin, P.; Dysthe, D.K.; Renard, F. In-situ imaging of fracture development during maturation of an organic-rich shale: Effects of heating rate and confinement. Mar. Pet. Geol. 2018, 95, 314–327. [Google Scholar]
- Jiang, L.; Chen, Z.; Ali, S.M.F. Thermal-hydro-chemical-mechanical alteration of coal pores in underground coal gasification. Fuel 2020, 262, 116543. [Google Scholar]
- Wang, G.; Yang, D.; Kang, Z.; Zhao, J.; Lv, Y. Numerical investigation of the in situ Oil Shale pyrolysis process by superheated steam considering the anisotropy of the thermal, hydraulic, and mechanical characteristics of oil shale. Energy Fuels 2019, 33, 12236–12250. [Google Scholar]
- Yuan, J.; Jiang, R.; Cui, Y.; Xu, J.; Wang, Q.; Zhang, W. The numerical simulation of thermal recovery considering rock deformation in shale gas reservoir. Int. J. Heat Mass Transf. 2019, 138, 719–728. [Google Scholar]
- Hu, L.; Li, H.; Babadagli, T.; Xie, X.; Deng, H. Thermal stimulation of shale formations by electromagnetic heating: A clean technique for enhancing oil and gas recovery. J. Clean. Prod. 2020, 277, 123197. [Google Scholar]
- Alfarge, D.; Wei, M.; Bai, B. Factors affecting CO2-EOR in shale-oil reservoirs: Numerical simulation study and pilot tests. Energy Fuels 2017, 31, 8462–8480. [Google Scholar]
- Gür, M.; Canbaz, E.D. Analysis of syngas production and reaction zones in hydrogen oriented underground coal gasification. Fuel 2020, 269, 117331. [Google Scholar]
- Xi, J.; Liang, J.; Sheng, X.; Shi, L.; Li, S. Characteristics of lump lignite pyrolysis and the influence of temperature on lignite swelling in underground coal gasification. J. Anal. Appl. Pyrolysis 2016, 117, 228–235. [Google Scholar]
- Zhou, Y.; Li, L.; Jin, L.; Zhu, J.; Li, J.; Li, Y.; Fan, H.; Hu, H. Effect of functional groups on volatile evolution in coal pyrolysis process with in-situ pyrolysis photoionization time-of-flight mass spectrometry. Fuel 2020, 260, 116322. [Google Scholar]
- Xiong, Y.; Jin, L.; Li, Y.; Zhou, Y.; Hu, H. Structural features and pyrolysis behaviors of extracts from microwave-assisted extraction of a low-rank coal with different solvents. Energy Fuels 2019, 33, 106–114. [Google Scholar]
- Shu, P.; Yu, L.; Ming, D. Pyrolysis characteristics and kinetics of the marine microalgae Dunaliella tertiolecta using thermogravimetric analyzer. Bioresour. Technol. 2010, 101, 359–365. [Google Scholar]
- Boonchom, B.; Puttawong, S. Thermodynamics and kinetics of the dehydration reaction of FePO4·2H2O. Phys. B Condens. Matter. 2010, 405, 2350–2355. [Google Scholar]
- Yorulmaz, S.; Atimtay, A. Investigation of combusition kinetics of treated and untreated waste wood samples with thermogravimetric analysis. Fuel Process. Technol. 2009, 90, 939–946. [Google Scholar]
- Fu, X.; Zhong, Z.; Xiao, G.; Li, R. Comparative study on characteristics and dynamics of pyrolysis process of grass biomass. Boil. Technol. 2011, 42, 60–64. [Google Scholar]


| Temperature (K) | (kJ·mol−1) | (min−1) | R2 |
|---|---|---|---|
| 573–873 | 72.35 | 414.6 | 0.9902 |
| Parameters/Unit | Value |
|---|---|
| / | 0.2 |
| / | 1 |
| / | 1300 |
| / | 1000 |
| / | 0.239 |
| / | 11.67 |
| / | 7.3 |
| Initial temperature/K | 293 |
| Initial pressure/Pa | 0 |
Disclaimer/Publisher’s Note: The statements, opinions and data contained in all publications are solely those of the individual author(s) and contributor(s) and not of MDPI and/or the editor(s). MDPI and/or the editor(s) disclaim responsibility for any injury to people or property resulting from any ideas, methods, instructions or products referred to in the content. |
© 2023 by the authors. Licensee MDPI, Basel, Switzerland. This article is an open access article distributed under the terms and conditions of the Creative Commons Attribution (CC BY) license (https://creativecommons.org/licenses/by/4.0/).
Share and Cite
Yang, F.; Cheng, X.; Li, M.; Wei, J.; Duan, Z.; Ma, L. Numerical Investigation of the Heat and Mass Transfer during the In Situ Pyrolysis Process of Oil-Rich Coal. Processes 2023, 11, 3226. https://doi.org/10.3390/pr11113226
Yang F, Cheng X, Li M, Wei J, Duan Z, Ma L. Numerical Investigation of the Heat and Mass Transfer during the In Situ Pyrolysis Process of Oil-Rich Coal. Processes. 2023; 11(11):3226. https://doi.org/10.3390/pr11113226
Chicago/Turabian StyleYang, Fu, Xiangqiang Cheng, Mingjie Li, Jinjia Wei, Zhonghui Duan, and Li Ma. 2023. "Numerical Investigation of the Heat and Mass Transfer during the In Situ Pyrolysis Process of Oil-Rich Coal" Processes 11, no. 11: 3226. https://doi.org/10.3390/pr11113226