Article

Impact Load Identification Algorithm of Helicopter Weapon Pylon Based on Time-Domain Response Signal

College of Aerospace Engineering, Nanjing University of Aeronautics and Astronautics, Nanjing 210001, China
*
Author to whom correspondence should be addressed.
Aerospace 2022, 9(7), 388; https://doi.org/10.3390/aerospace9070388
Submission received: 22 June 2022 / Revised: 13 July 2022 / Accepted: 16 July 2022 / Published: 18 July 2022
(This article belongs to the Special Issue Structural Dynamics and Control)

Abstract

:
Accurately identifying the peak value of impact load acting on the helicopter structure during weapon launch is of great significance to the design and finalization of weapon pylons. Firstly, a method of standardized preprocessing load signal is proposed by analyzing the vibration response and the characteristics of the impact load. Then, the test model of the weapon pylon is designed, and the position of the strain gauge is determined; the static load calibration test and the ground impact test are carried out on the test model. Next, the time-domain response measured by the strain gauge is filtered and de-noised. Impact load is processed by a standardized method. The response and load are used to train BP neural network and the mapping relationship between response and load is established. The impact load generated by a specific weapon is statistically processed to obtain the normalized average load time history, and the identified standard load is converted back to the original load pattern. Finally, the network that meets the error requirements is tested. Both the standardized pattern and the original pattern have high identification accuracy, which shows that an effective load identification model can be established based on the time-domain response signal and the standardized processed load signal.

1. Introduction

Invisible damage to the helicopter structure caused by the impact load while launching weapons is the huge threat and hidden danger to flight safety. Therefore, timely and accurately identifying the peak value of impact load and checking the strength of the weapon pylon structure are of great significance for the design and finalization of the weapon pylon as well as the life evaluation.
There are several studies on dynamic loads caused by weapon launches. Yu, X.Y. [1] indirectly identified the impact load generated by the weapon launch during the flight of the helicopter through the response signal collected by the airborne acquisition equipment. Cheng W.Z. et al. [2] identified the recoil force of the airborne gun system and proposed the method of “piecewise linear transfer function” to solve the nonlinear problem of the system. Zhou F. et al. [3] conducted a force analysis on the structure of the aircraft missile pylon and established the missile pylon load–strain coefficient matrix. Zheng J.H et al. [4] obtained the time history variation law of the weapon pylon load under typical flight conditions by analyzing the force of the helicopter weapon pylon structure.
According to the difference in using the response information, the load identification can be divided into the frequency domain method and the time-domain method. In contrast, the time-domain method has more advantages [5]. It does not require Fourier transform of the signal and has high recognition accuracy. Traditional dynamic load identification methods are carried out on the basis of knowing accurate model information and transfer functions [6,7,8]. However, in practice, accurate structural models are often difficult to obtain. When there is a deviation in the structural model, these traditional identification methods often fail to obtain good identification results when identifying loads on structures with complex working environments.
Artificial neural network is an interdisciplinary subject that emerged in the 1950s with a wide range of applications [9,10,11]. Its core is to use a computer-simulated neuron network system to imitate the human brain’s ability to solve problems, reason, and learn [12]. The load identification method based on the neural network does not need to establish the theoretical expression between vibration response and dynamic load as traditional methods, avoiding difficulty in structural modeling accuracy. It is one of the research hotspots of load identification methods.
In 1997, Zhang, F. et al. [13] deduced the autoregressive function used in the neural network algorithm in the time domain according to the theory of structural dynamics and established a neural network dynamic load identification model with time delay feedback. In 1998, Cao, X. et al. [14] proposed a new idea of using neural network technology to identify wing loads in the process of cantilever load identification.
In 2000, Staszewski, W.J. et al. [15] used a neural network model to identify the impact load acting on the composite box panel and used a genetic algorithm to optimize the arrangement of the sensors. In 2009, He, F.D. et al. [16] used a combination of Bayesian regularization and BP network to construct a three-layer BP network for analyzing aircraft wing loads.
In 2013, Cao, S.C. et al. [17] proposed a BP neural network model that optimizes and improves the setting parameters by using the set aside method and genetic algorithm for the identification of flight load parameters, combined with typical maneuvering actions.
In 2018, Samson, B.C. et al. [18] used a feedforward neural network to realize the identification of large wing rib loads, but they only identified the static load of the structure. In 2019, Chen, G.R. et al. [19] used a deep neural network (DNN) to realize the impact load identification of a rigid body on a hemispherical shell structure. The DNN network with double hidden layers is trained and tested by taking the five characteristic parameters of the impact load’s first contact point position, load amplitude, impact duration, rigid body tangential velocity, and normal velocity as output. The same year, Zhou et al. [20] used a deep Recurrent Neural Network (RNN) for identifying the impact load on nonlinear structures and verified the method by three nonlinear cases: damped Duffing oscillator, nonlinear three-degree-of-freedom system, and nonlinear composite plate.
In 2020, Chen, Q. et al. [21] took the wing load as an example to build a BP neural network model of load-flying parameters and analyzed the generalization ability of the neural network model by comparing the error between the predicted load and the measured load.
In 2021, XIA Peng et al. [22] combined the “memory” characteristics of time-delay neural networks, the theory of causal finite impulse response (FIR) systems, and the solution principle of vibration response, and proposed a time-domain dynamic model using time-delay neural networks load reverse sequence identification method. T. Feng et al. [23] proposed a deep learning-based identification method to identify the static load amplitude and position of the bulkhead plate. Wang, L.J. et al. [24] proposed a new computational inverse method to reconstruct impact loads acting on composite laminated cylindrical shells based on the augmented Tikhonov regularization (ATR) method and matrix perturbation method.
Among the above methods, the traditional method is suitable for the identification of simple models, and it is difficult to fit complex mapping relationships. Relatively speaking, the artificial neural network can establish a more accurate model, but still have oscillations at the tail of identified load, resulting in inaccurate identification of the load impulse. The subsequent interception processing will inevitably introduce additional errors. Compared with continuous loads, the identification of impact load has a certain peculiarity, that is, the duration of the load is very short relative to the response. Therefore, some identification models suitable for continuous loads may require some processing before they can be used for impact load problems.
In this paper, a standardized processing load method is proposed, the mapping relationship between the standardized load and the time-domain response and measuring point position information is deduced, and a high-precision BP neural network identification model is established. Refer to the actual weapon pylon design test model, and it is more convincing to verify the effectiveness of the method with test data. Using the time-domain response signal, the processing of the signal is also carried out in the time domain, to avoid the introduction of errors in the Fourier analysis process of the finite response signal. By selecting the appropriate sampling points in the response signal, the problem that the load and the response duration are very different is solved, and a one-to-one mapping relationship is established. The response of a specific structure is relatively stable, the standard load is used to establish a mapping relationship, and the identified load impulse is more accurate. When establishing the recognition model, the response signal and the position information of the measuring point are used to establish a more complete recognition model.
The rest of the paper is organized as follows. In Section 2, through the vibration analysis, the method of the standardized preprocessing load is obtained and the mapping relationship between the load and the response is established, and the BP neural network is briefly introduced. Design weapon pylon model and carry out several test studies in Section 3. In the next section, the test data is processed, the recognition effect of the model is analyzed, and the method in this paper is further discussed and prospected. The whole work is summarized in Section 5.

2. Methodology

2.1. Theoretical Analysis of Standardized Processing Methods and Mapping Relationship

2.1.1. Structural Response Analysis

Under the unit impact force, the structure’s response signal corresponding to a specific position of a certain mode can be approximately expressed as:
x = A sin ( ω t + ϕ )
where ω is the frequency of the response, and ϕ is the phase, representing the delay of the response relative to the excitation, which can be assumed to be a constant value for a given structure. The response of the linear structure satisfies the superposition theorem. Assuming that the start time of the excitation is t 1 and the end time is t n , finally, the response is:
x = i = 1 n A i sin ( ω t + ω ( t i t 1 ) + ϕ )
In the above formula, t i is the i-th sampling point of the load and A i is the response amplitude, which is approximately proportional to the amplitude of the impact force at the moment. ω ( t i t 1 ) = ω × ( i 1 ) × Δ t , corresponds to the response phase of the force excitation acting at the t i moment, where Δ t is the sampling time interval.
For the structure, different modes correspond to the response of different frequencies, and the response of the structure is the superposition of sine waves with different amplitudes and different phase offsets described by Equation (2). Through the calculation of trigonometric functions, the final result of each order mode superposition contains two independent parameters, namely the amplitude and phase of the signal.

2.1.2. Impact Load Analysis

The impact load has a short-acting time. Compared with the low-order mode, the time width of the impact load is much smaller than the time width of the vibration response. Through the analysis of the vibration response, in the time range of the impact load, the phase shift of the vibration response corresponding to the force at different times is very small. Using the trigonometric function calculation formula, the vibration response expression (2) is expanded as follows:
x = i = 1 n A i cos ( ω ( t i t 1 ) ) sin ( ω t + ϕ ) + i = 1 n A i sin ( ω ( t i t 1 ) ) cos ( ω t + ϕ )
The phase difference ω ( t i t 1 ) , as the independent variable of the cosine function in the first term, when its absolute value is much smaller than π , the value of the cosine function is approximately equal to 1; in the second term, as the independent variable of the sine function, under the same condition, the sine function is approximately equal to 0. Therefore, the vibration response can be simplified as:
x = i = 1 n A i sin ( ω t + ϕ )
From the simplified expression of vibration response, it can be seen that for low-frequency signals, the vibration response of impact load is approximately proportional to the sum of the amplitudes of the load at each moment but has little to do with the change history of the load during the action time.

2.1.3. Impact Load Standardization

The discrete-time signal of the impact load is obtained by the method of equal-spaced sampling. The parameters related to the load include the load amplitude at the sampling time and the action width of the load. The load amplitude at the sampling time can be regarded as a representative value of the load within a certain time width. The sum of the impact load amplitudes in the above analysis should be multiplied by the corresponding time width. The standardized processing method is obtained through the above analysis: for the collected load signal, it can be approximately replaced by a standard impact load with the same impulse, a specific variation, and a specified time width.

2.1.4. Mapping Relationship between Standard Load and Time-Domain Response

For the actual structure, considering the effect of damping, the vibration response of the point in the system with the label j and the spatial coordinates of ( X j , Y j , Z j ) is shown in Equation (5).
x j = k A k j ( ζ ) e ζ ω k t s i n ( 1 ζ 2 ω k + φ ) = k f ( X j , Y j , Z j ) g ( A k , ω k , ζ ) e ζ ω k t s i n ( 1 ζ 2 ω k + φ )
where k is the modal order, ζ is the structural damping coefficient, A k j ( ζ ) is the amplitude corresponding to the eigenfrequency ω k under damping, and A k is the corresponding amplitude without damping. The amplitude of the vibration response Amplitude _ x j can be expressed as Equation (6):
Amplitude _ x j = k c k A k j ( ζ ) = k c k f ( X j , Y j , Z j ) g ( A k , ω k , ζ )
where c k is the constant. Without damping, the relationship between the amplitude A k corresponding to the characteristic frequency ω k and the approximate impulse of the impact load can be expressed as I A k . Substituting the above relationship into Equation (6), the relationship between the approximate impulse and the spatial position information, the maximum value of the structural response and the structural characteristic parameters is obtained, as shown in Equation (7):
I = f 1 ( ( X j , Y j , Z j ) , Amplitude _ x j , ω , ζ )
In this paper, the overall time-domain response is used, and the single-frequency signal extraction is not performed to avoid introducing additional errors during extraction. Intercepting first n oscillations, the eigenfrequency ω of each order is estimated by the width of each oscillation w i d t h k , and the damping ζ of the structure is estimated by the attenuation of the response signal, that is, the ratio of the oscillation amplitude, as shown in Equation (8):
ω ^ = f 2 ( w i d t h 1 , w i d t h 2 , , w i d t h n ) , ζ ^ = f 3 ( a 2 a 1 , a 3 a 1 , , a n a 1 )
where a i is the amplitude of the i-th oscillation, the estimated eigenfrequency, and the estimated damping value ζ ^ are substituted into Formula (7), and the standard load is obtained from the approximate impulse. Finally, the mapping relationship between the standard load and the spatial position information of the selected measuring point and the vibration response of the measuring point is established as shown in Formula (9):
S t a n d a r d   L o a d = F ( ( X j , Y j , Z j ) , Amplitude _ x j , f 2 ( w i d t h 1 , w i d t h 2 , , w i d t h n ) , f 3 ( a 2 a 1 , a 3 a 1 , , a n a 1 ) )

2.1.5. Summary

Firstly, by analyzing the characteristics of the response signal and impact load of the undamped system, a method of standardized preprocessing load signal is proposed. The structural response under damping is further analyzed, and the characteristic frequency and damping of the structure are estimated through the time-domain response. The mapping relationship between the impact load and the spatial position of the point, the time-domain response signal, and the structural parameters is established.
For a specific structure, its response signal has relatively stable characteristics. Therefore, using a standard load, with a specific width and change history, can better establish the mapping relationship with the response signal.
Due to the complexity of the structural response, only an implicit mapping relationship can be established. The relevant parameters are determined, and the neural network model can be further applied to fit the mapping relationship.

2.2. BP Neural Network

An artificial neural network does not need to determine the mathematical equation of the mapping relationship between input and output in advance, and only through its own training and specific learning rules, it can obtain the result closest to the expected output value when the input value is given. BP neural network is a multi-layer feedforward network trained by error backpropagation, called BP algorithm, its basic idea is gradient descent method [25]. The gradient search technique is used to minimize the error mean square error between the actual output value and the expected output value of the network.
In this paper, the neural network adopts the mean square error (MSE) as the evaluation method, and the expression is as follows:
ε n = 1 2 e j 2 + 1 2 λ ω 2
The first term is the sum of squares of errors between the neuron output and the expected output; the second term is the sum of squares of neuron weights and biases; λ is the regularization parameter. Appropriate selection of parameters λ can alleviate the problem of over-fitting while training the network.

3. Results

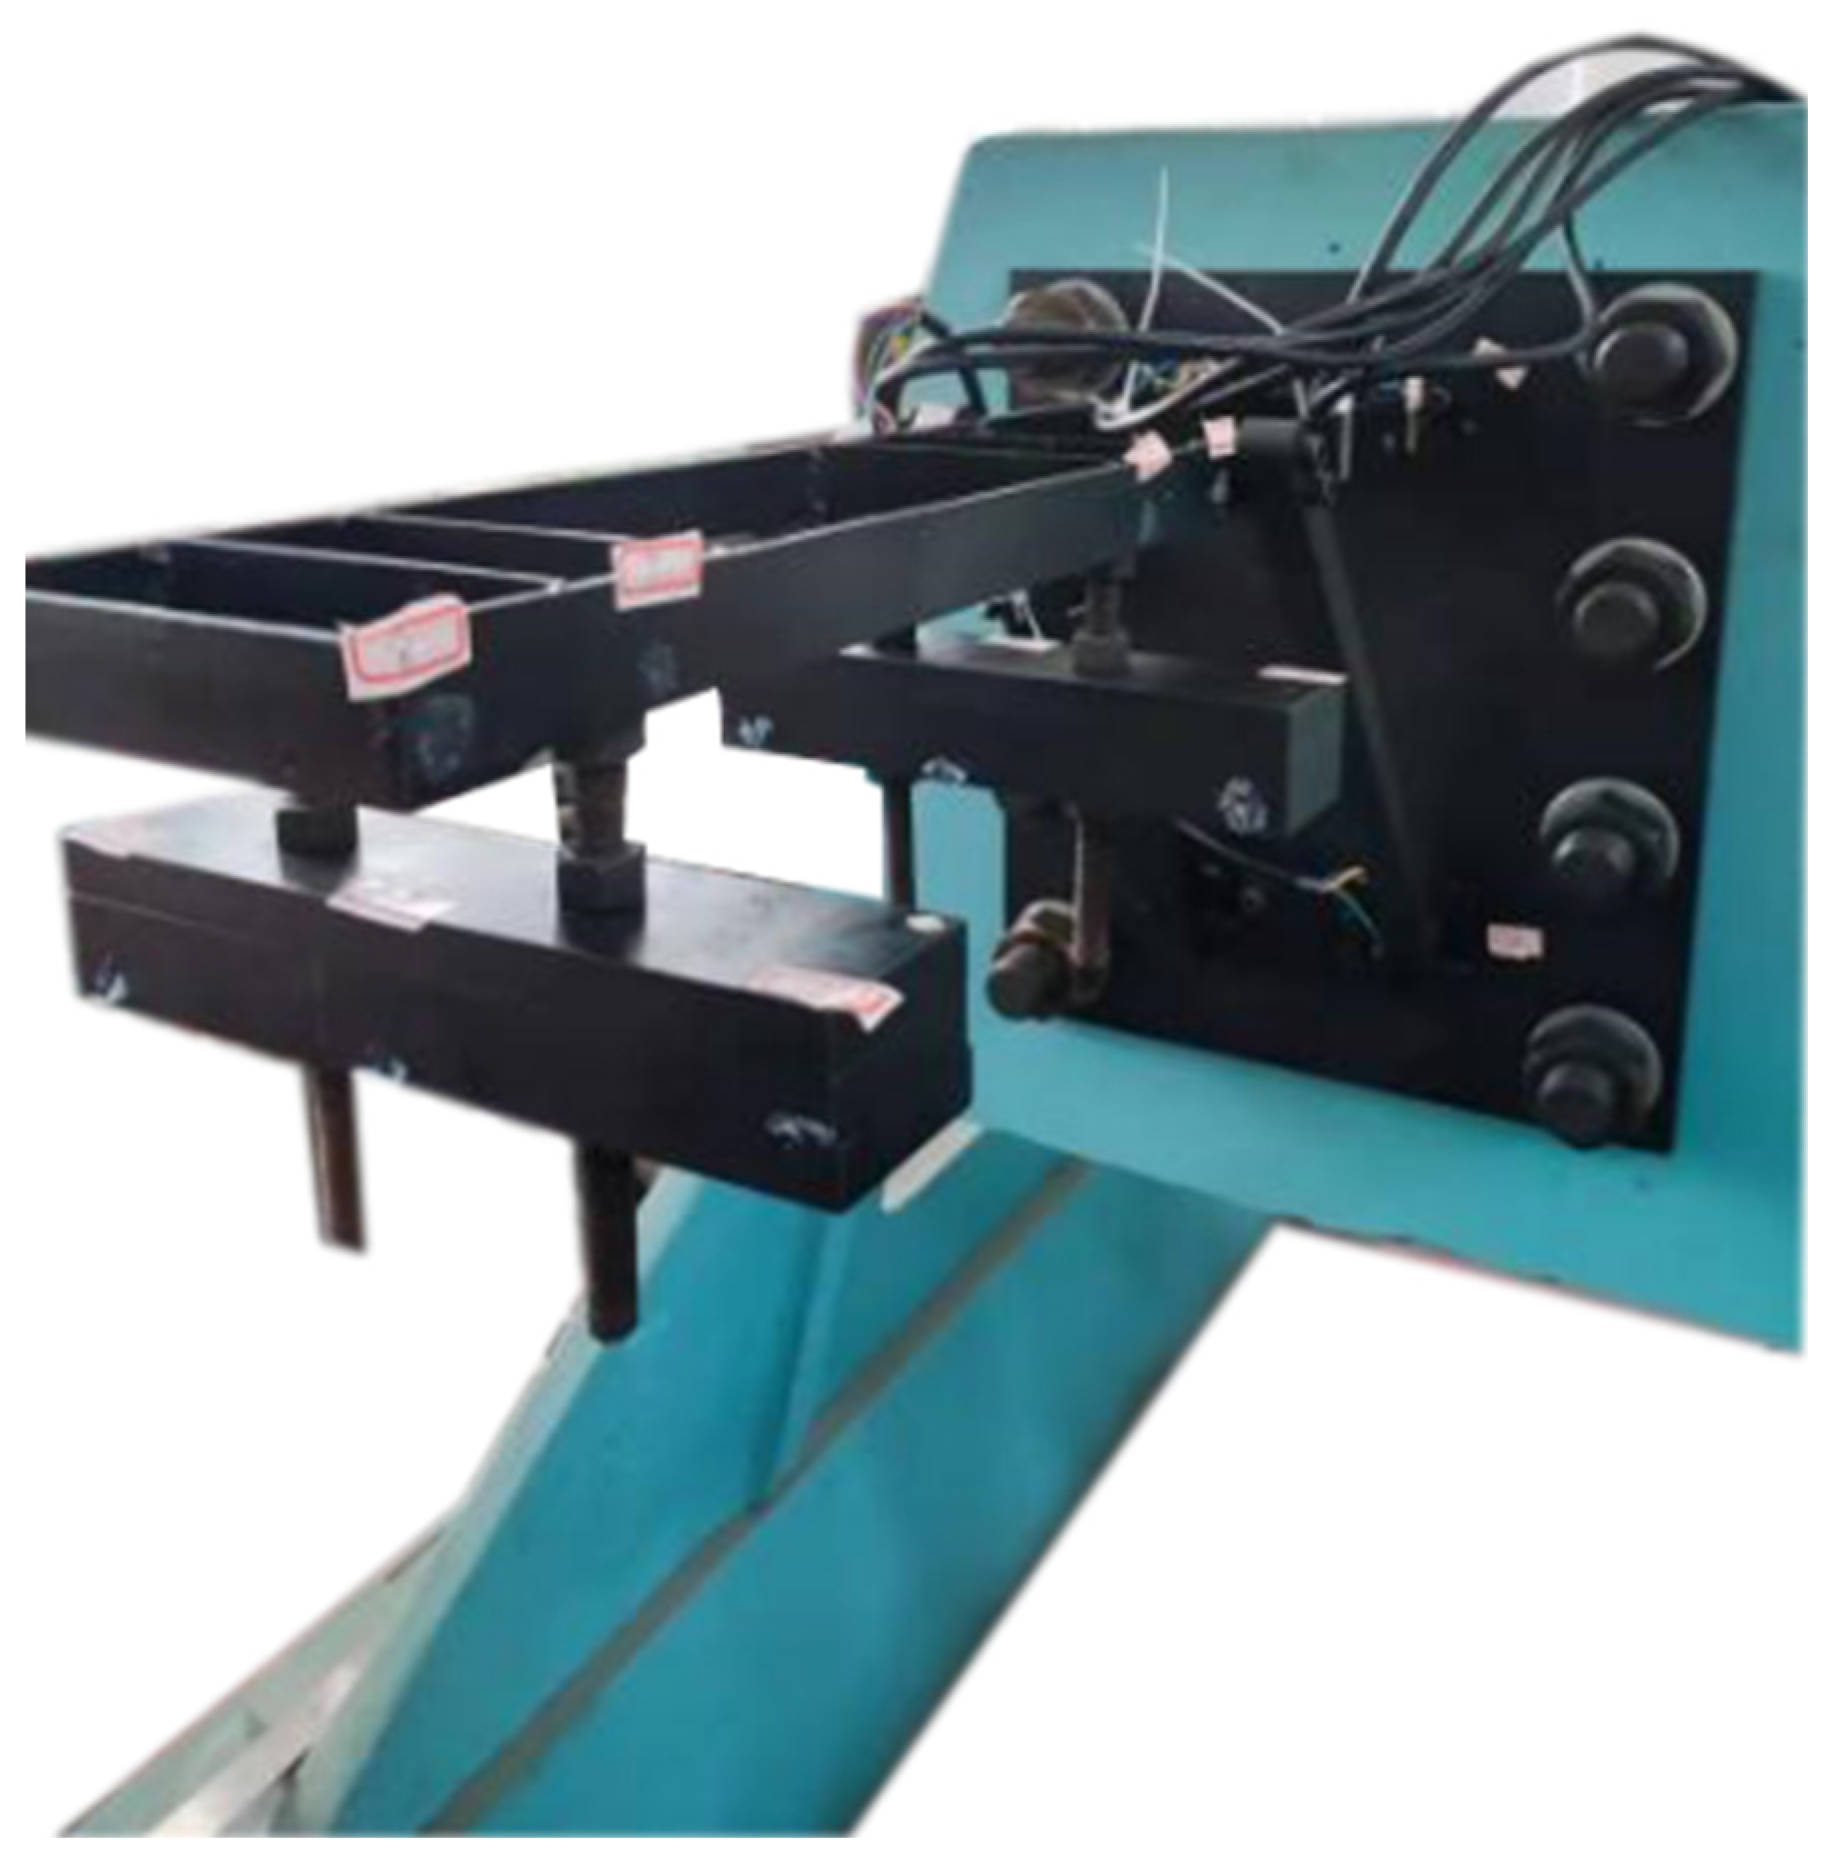
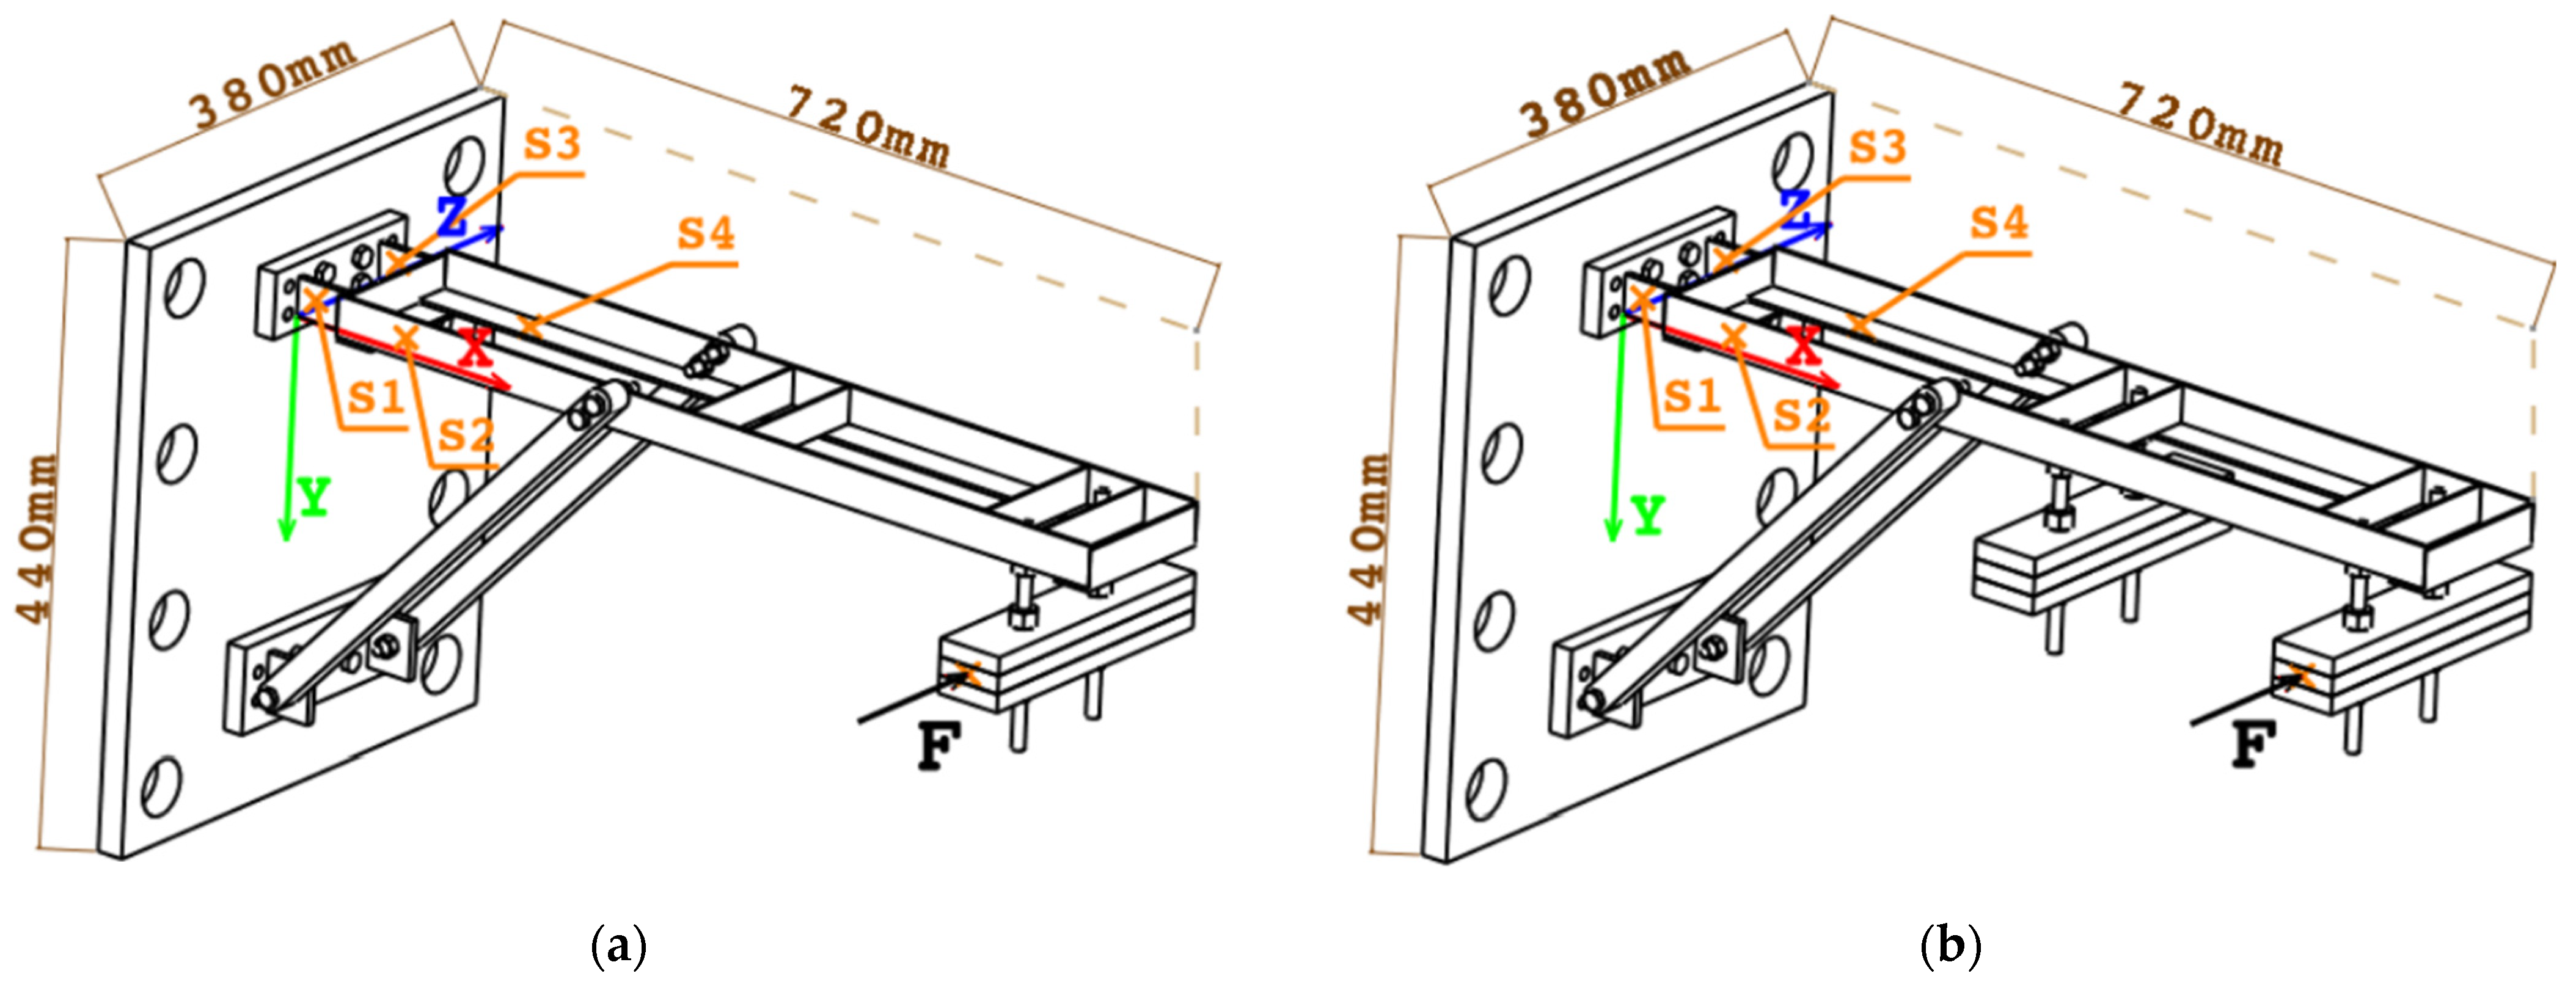
3.1. Design of Weapon Pylon Model

Through the analysis and research of a helicopter weapon pylon structure, an all-steel test piece is designed. The main beam and the counterweight are connected by bolts and the distance between them can be adjusted flexibly. Simulate the impact load under different conditions by loading and unloading counterweights. The test model is shown in Figure 1.

3.2. Determination of Measuring Point Position of Pylon Model

Select the position with large strain and no stress concentration to place the strain gauge and avoid obstacles and sections with excessive stress gradient to ensure data reliability. According to the above analysis and taking into account the actual structure of the pylon and the response to stress and strain, the arrangement of the strain gauge is determined as shown in Figure 2. In the figure, S1, S2, S3, and S4 are the positions of the strain gauges, and F is the striking position of the force hammer.
For the ground test, the specific position coordinates of the strain gauge and the force hammer are shown in Table 1 and Table 2:

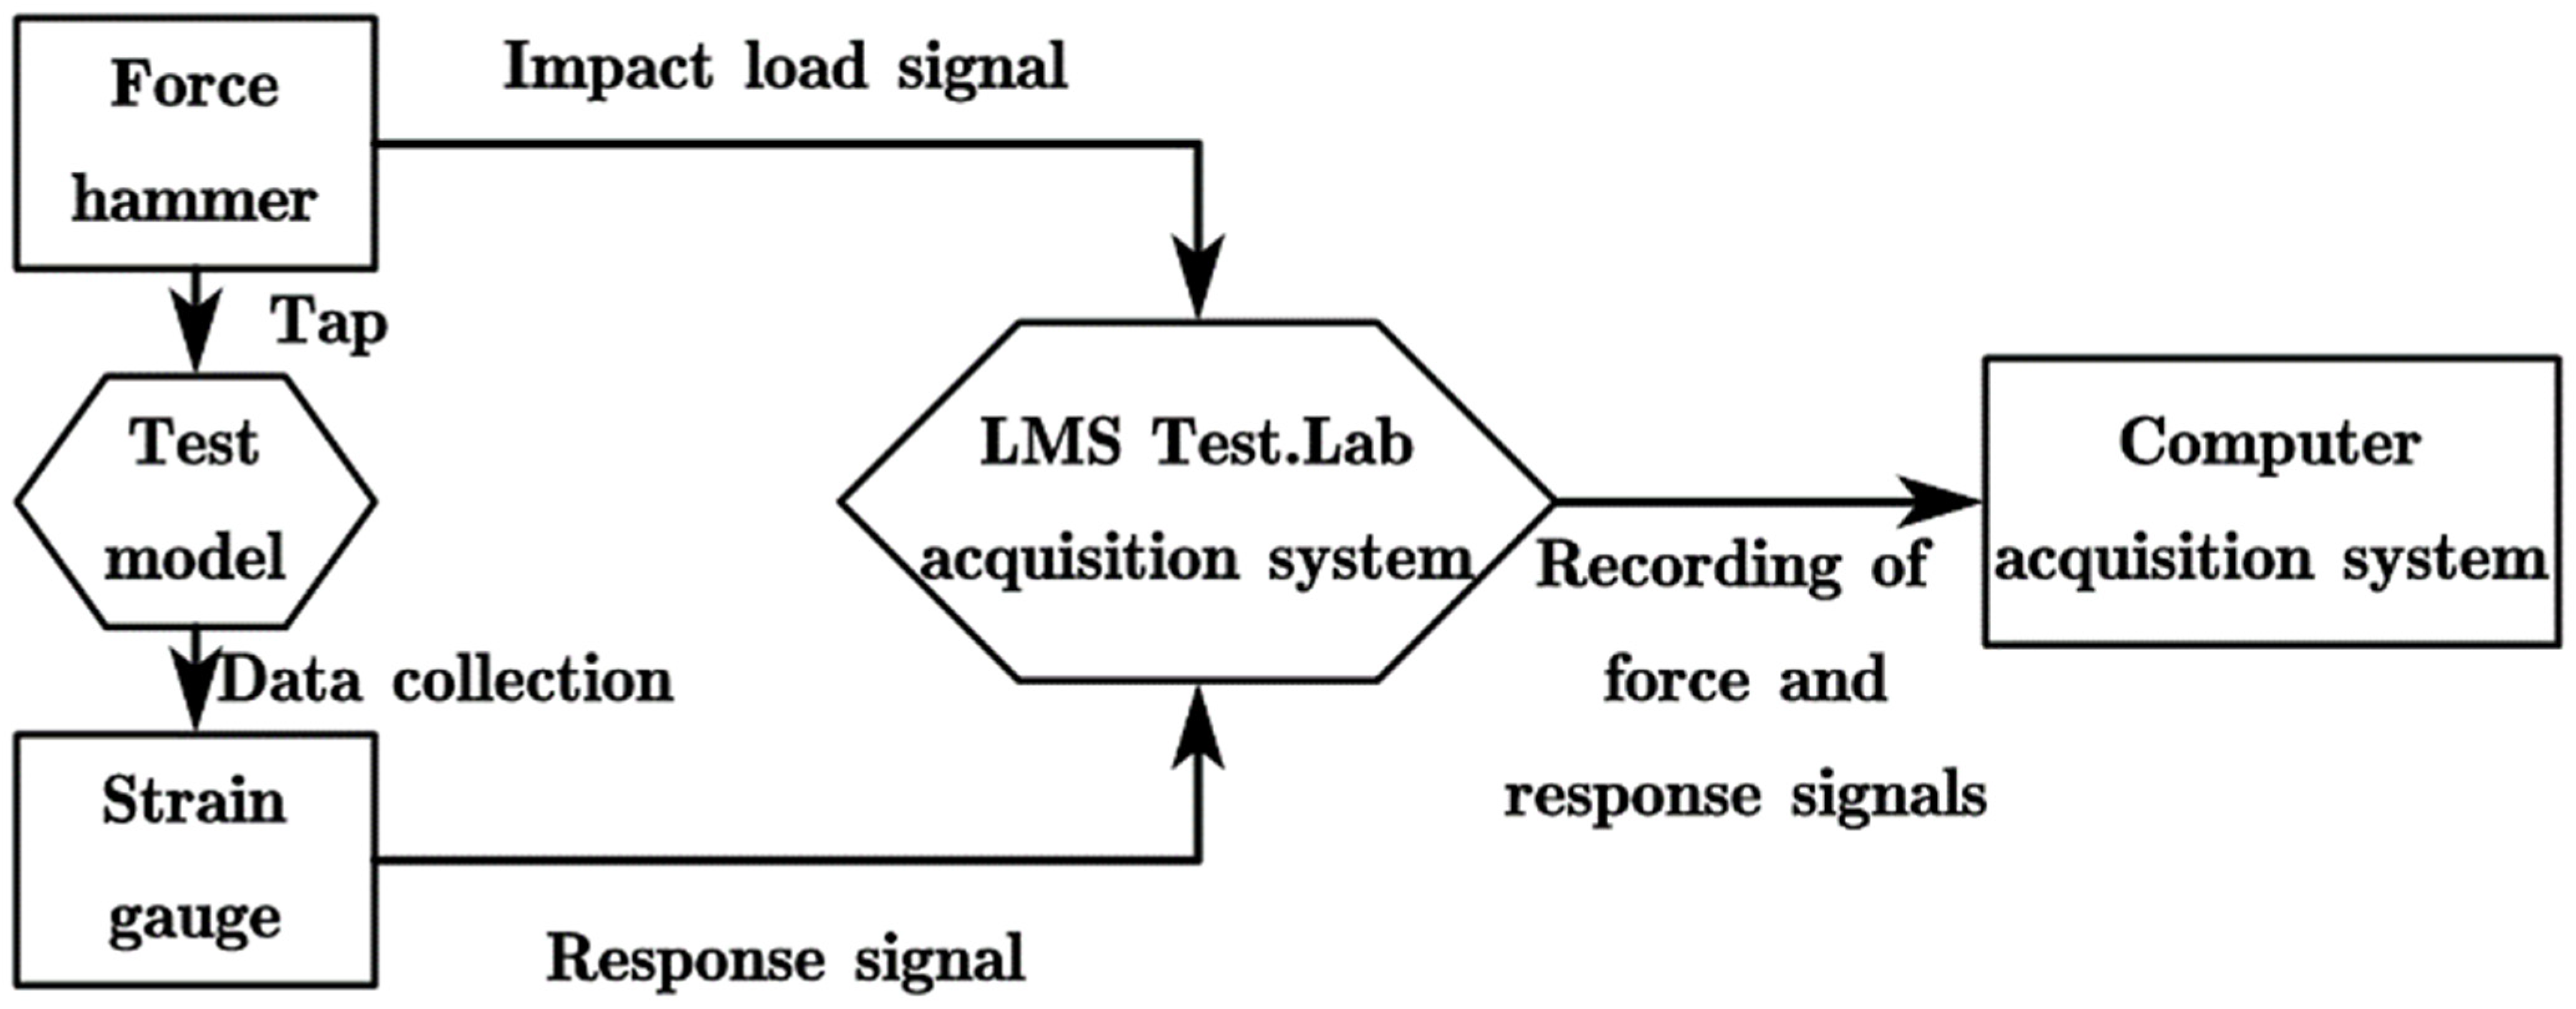
3.3. Test of Pylon Model

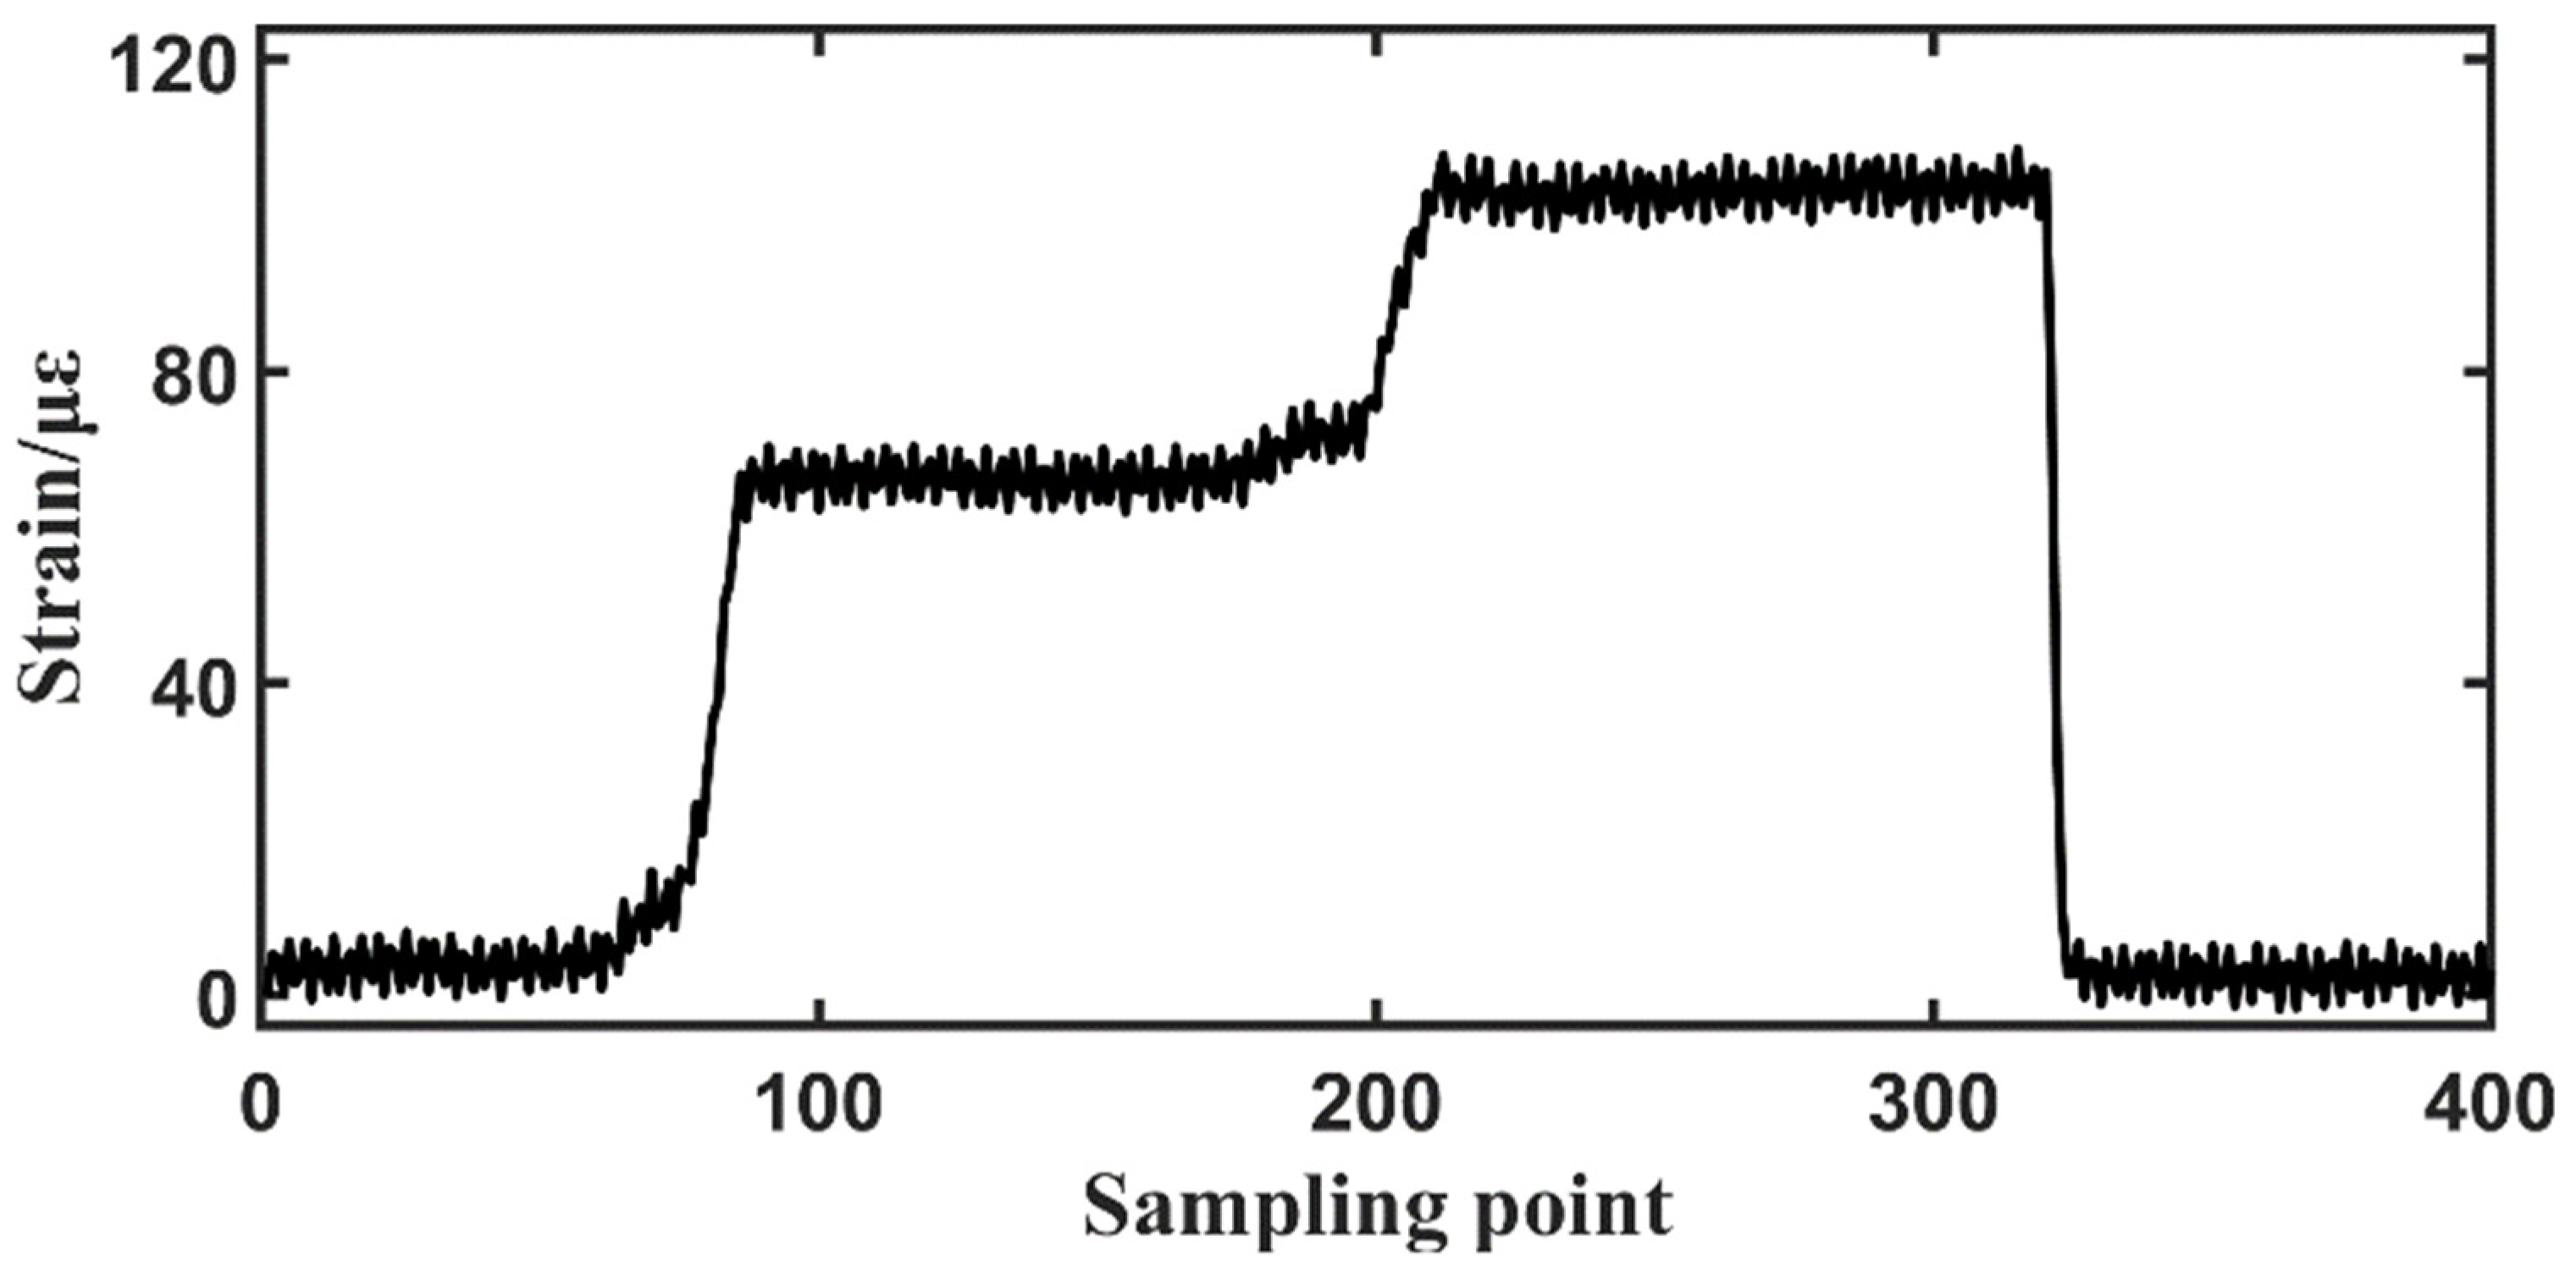
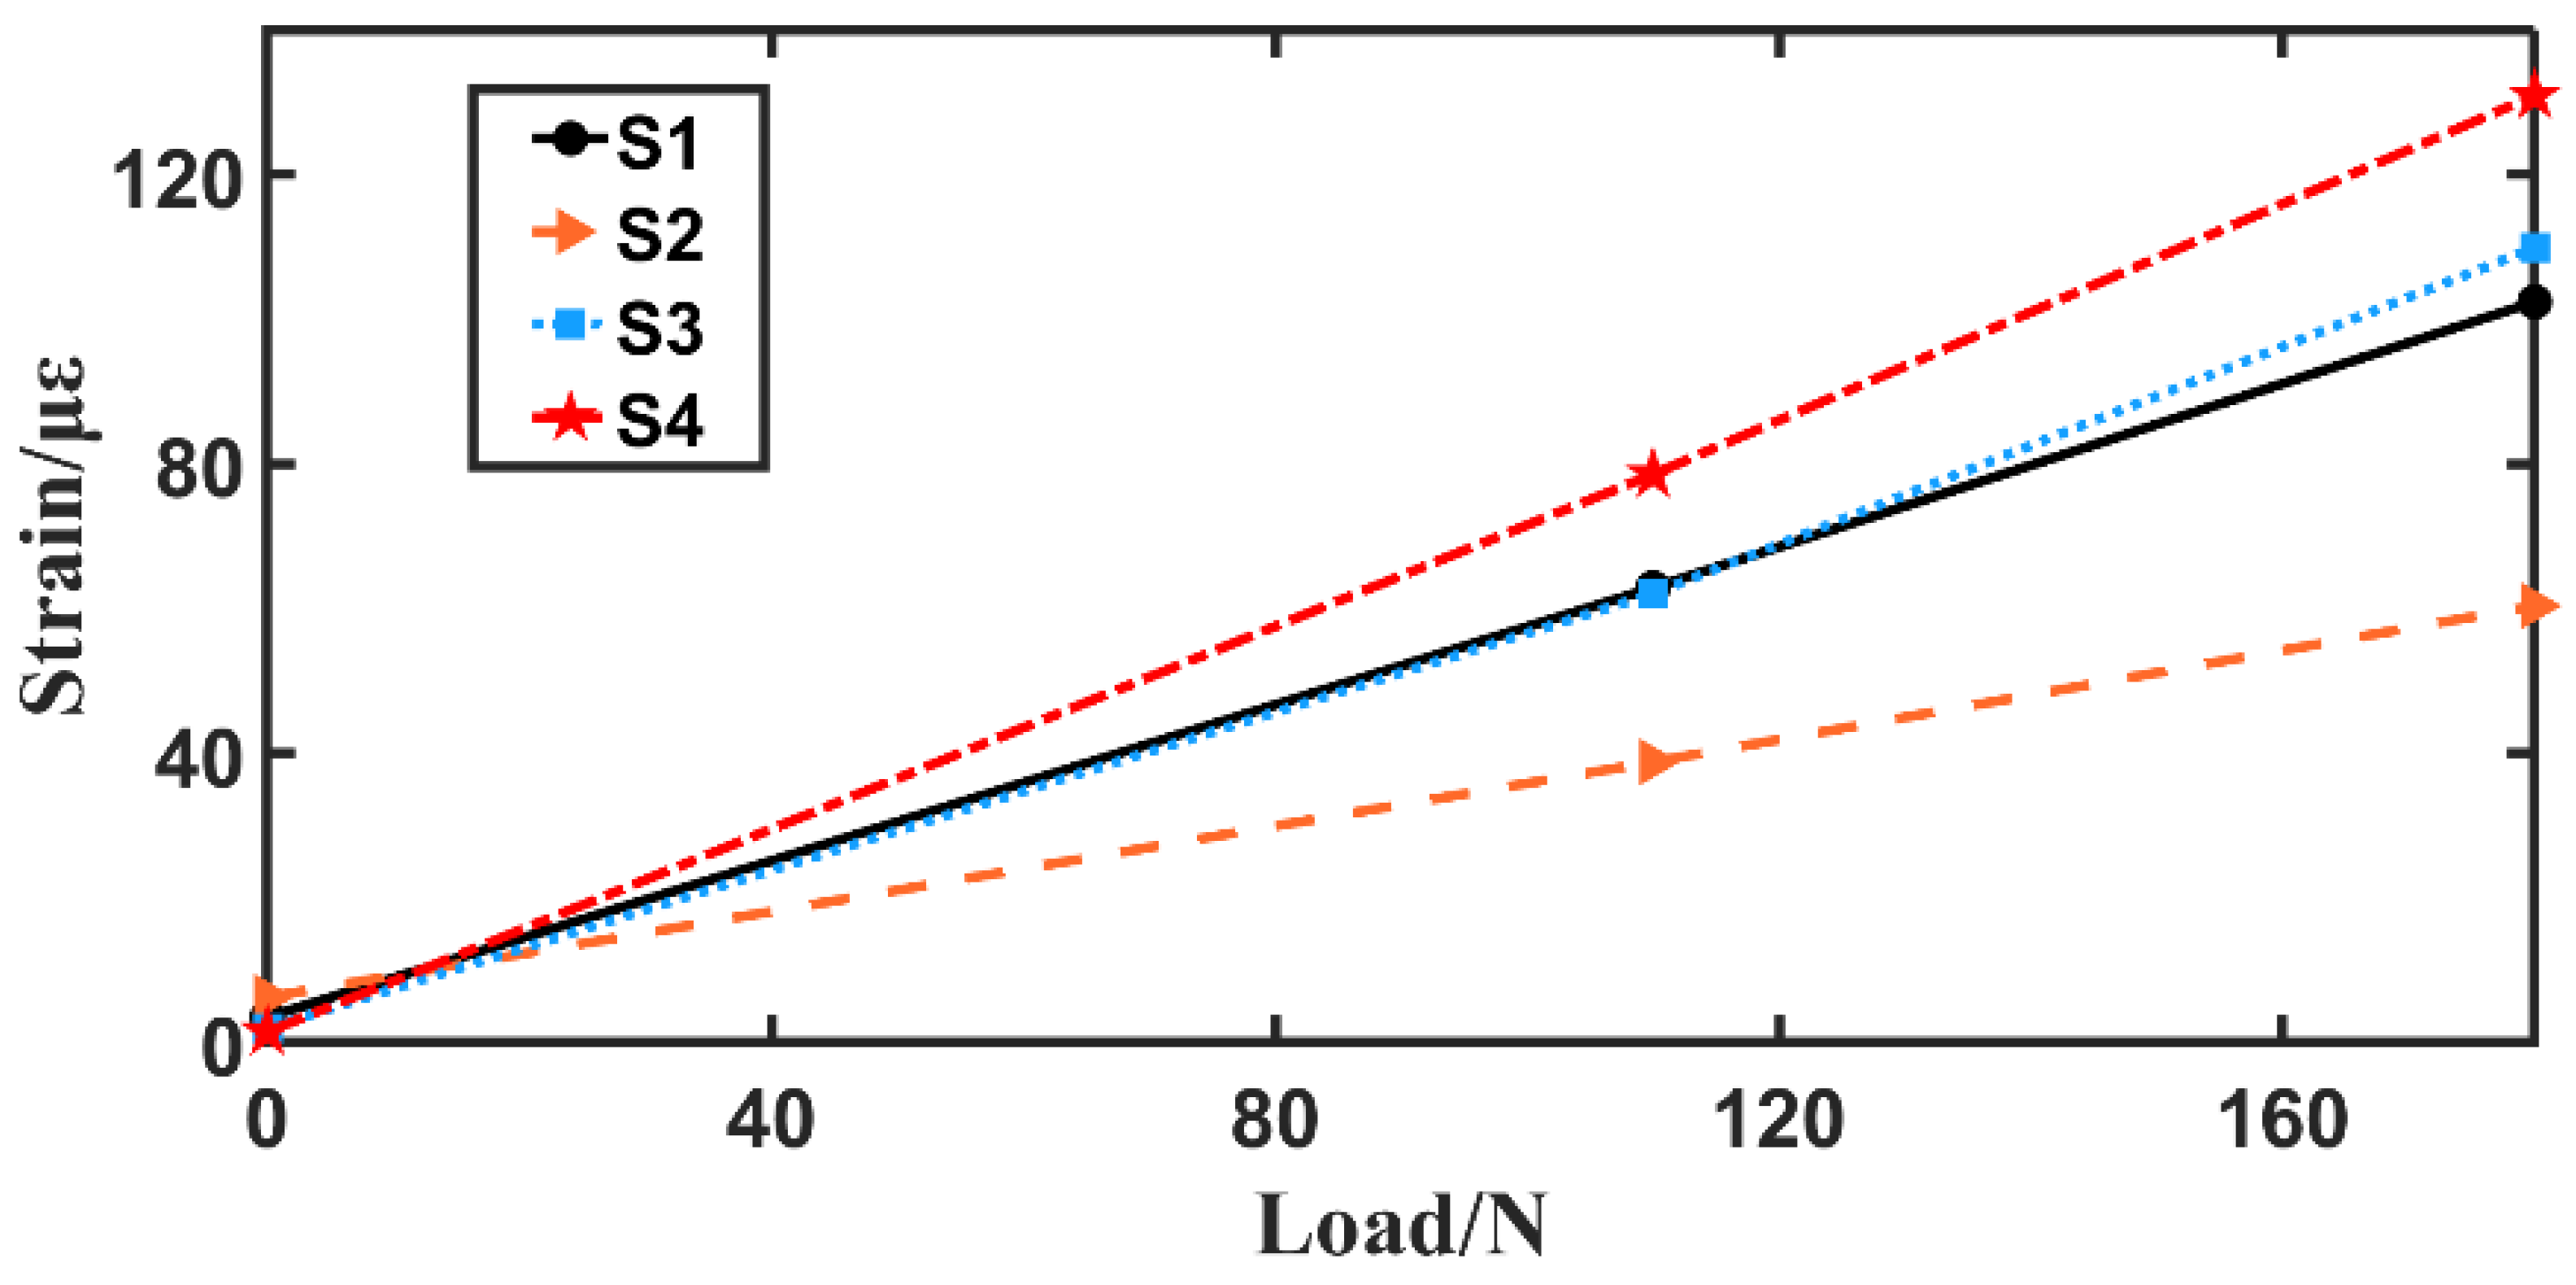
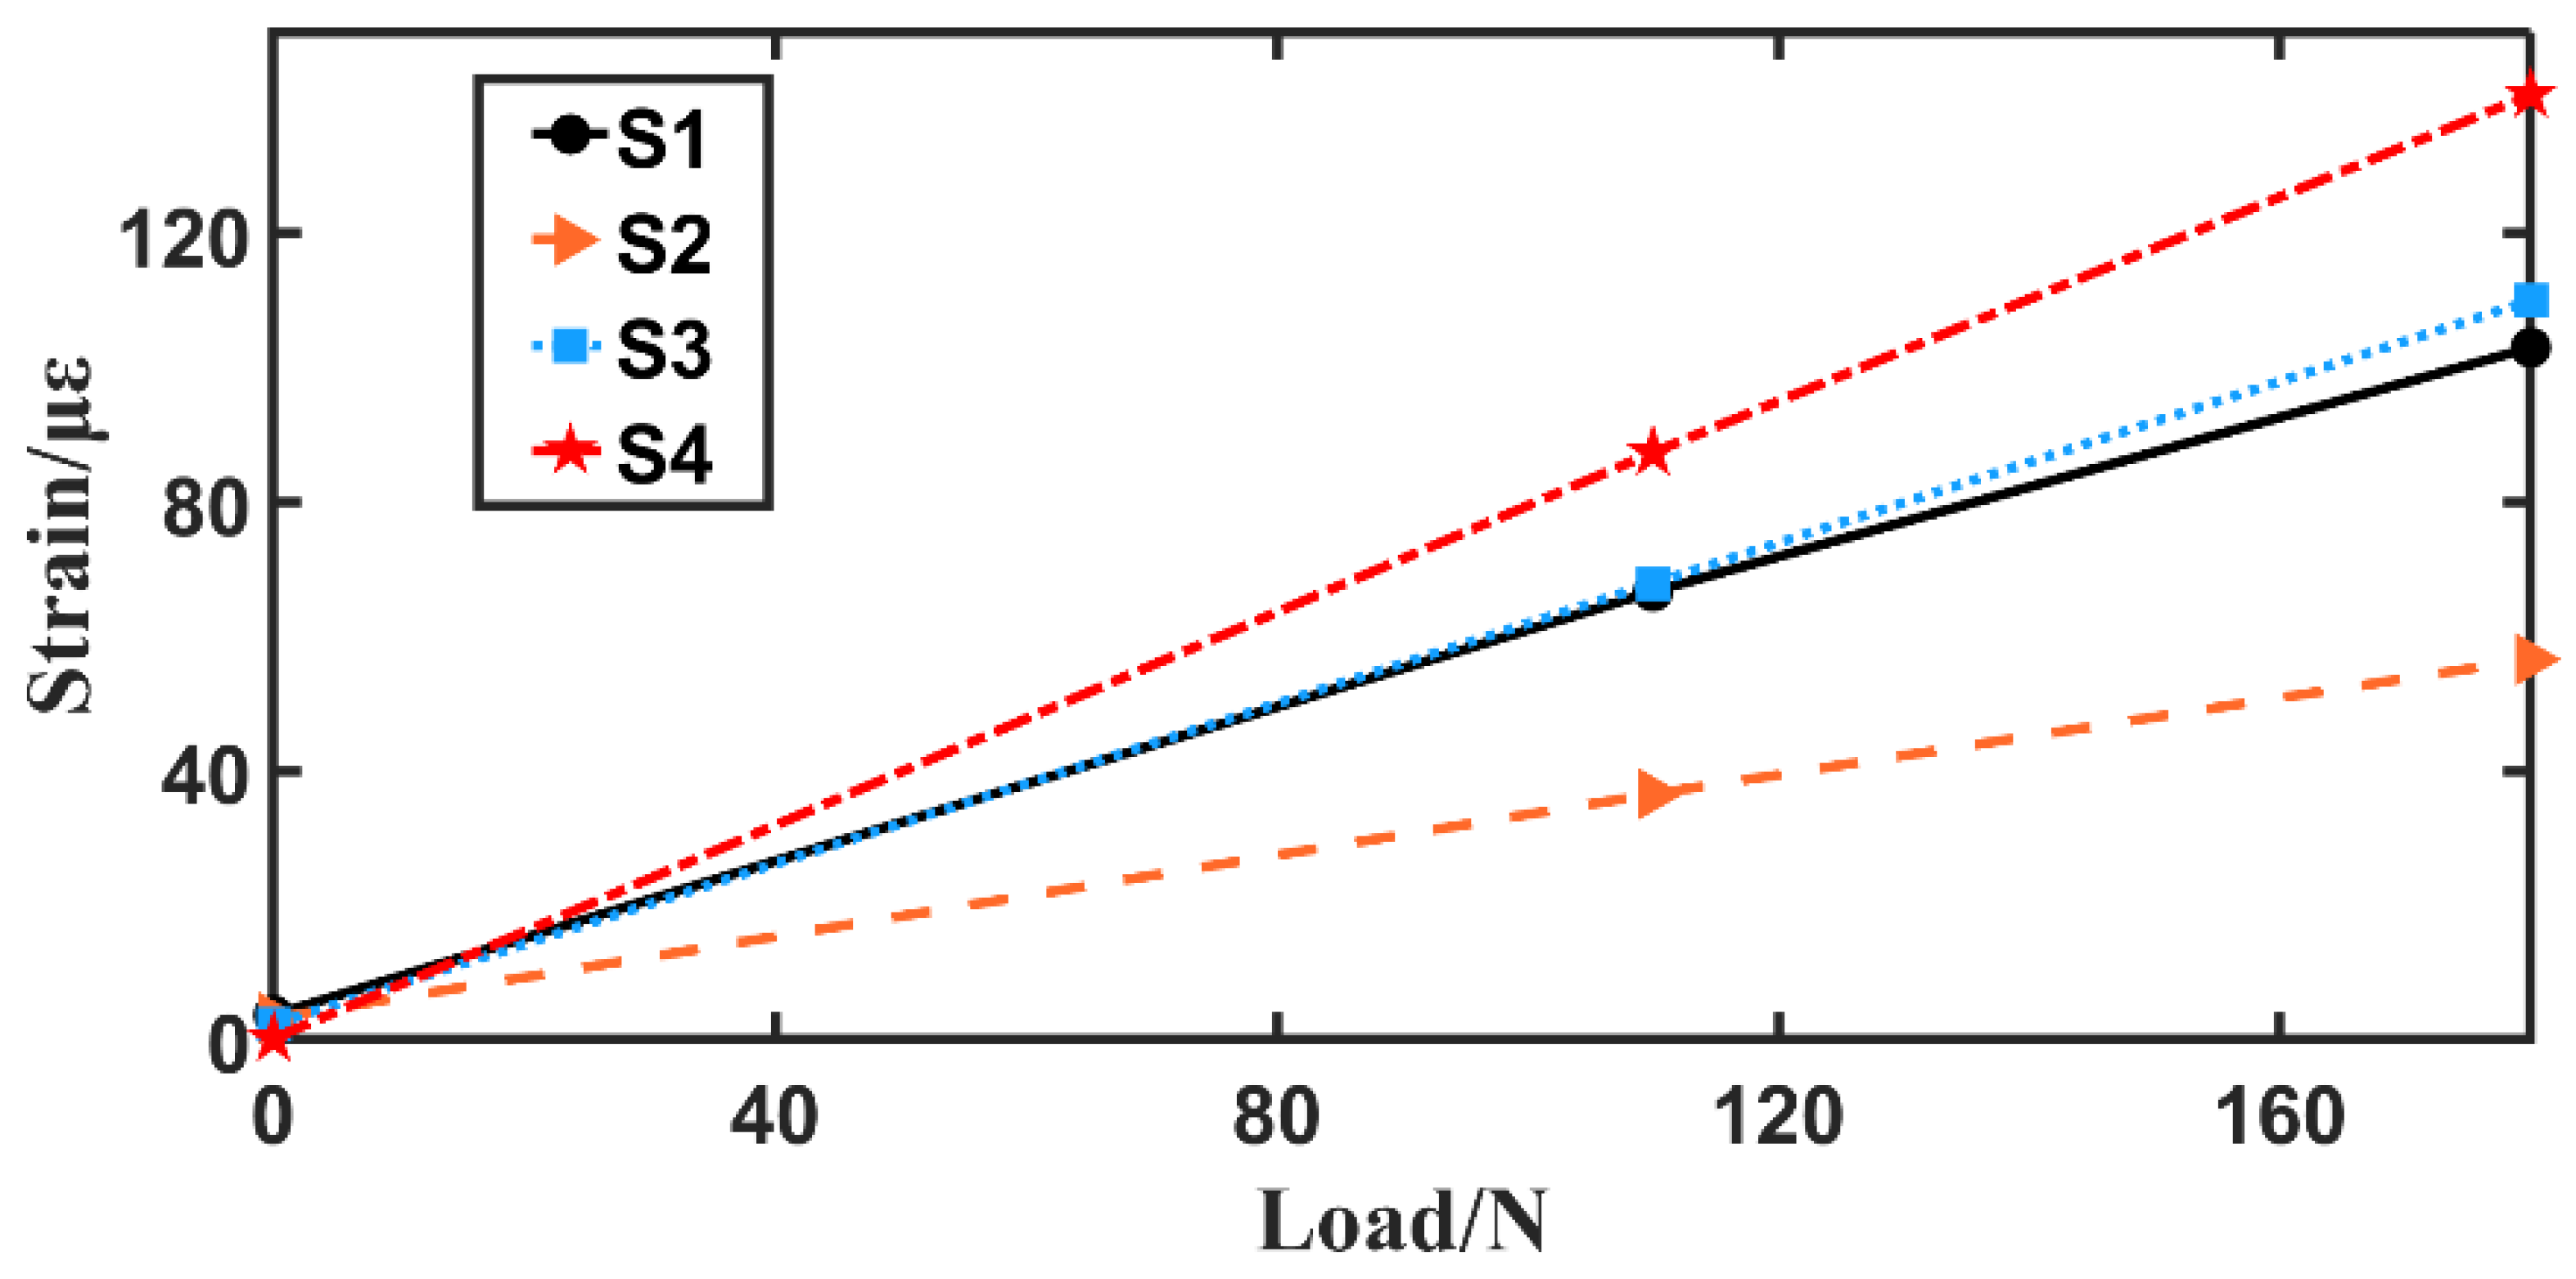
3.3.1. Test of Static Load Calibration

Loading is achieved through the counterweight mass block on the long bolt connecting the hanging bomb and the main beam. During the static load calibration process, firstly measure the strain value generated by the background noise. Then, load an 11 kg counterweight mass, and record after stabilization. Continue to load 7 kg counterweight mass for a total of 18 kg, record the strain and finally unload all counterweights.

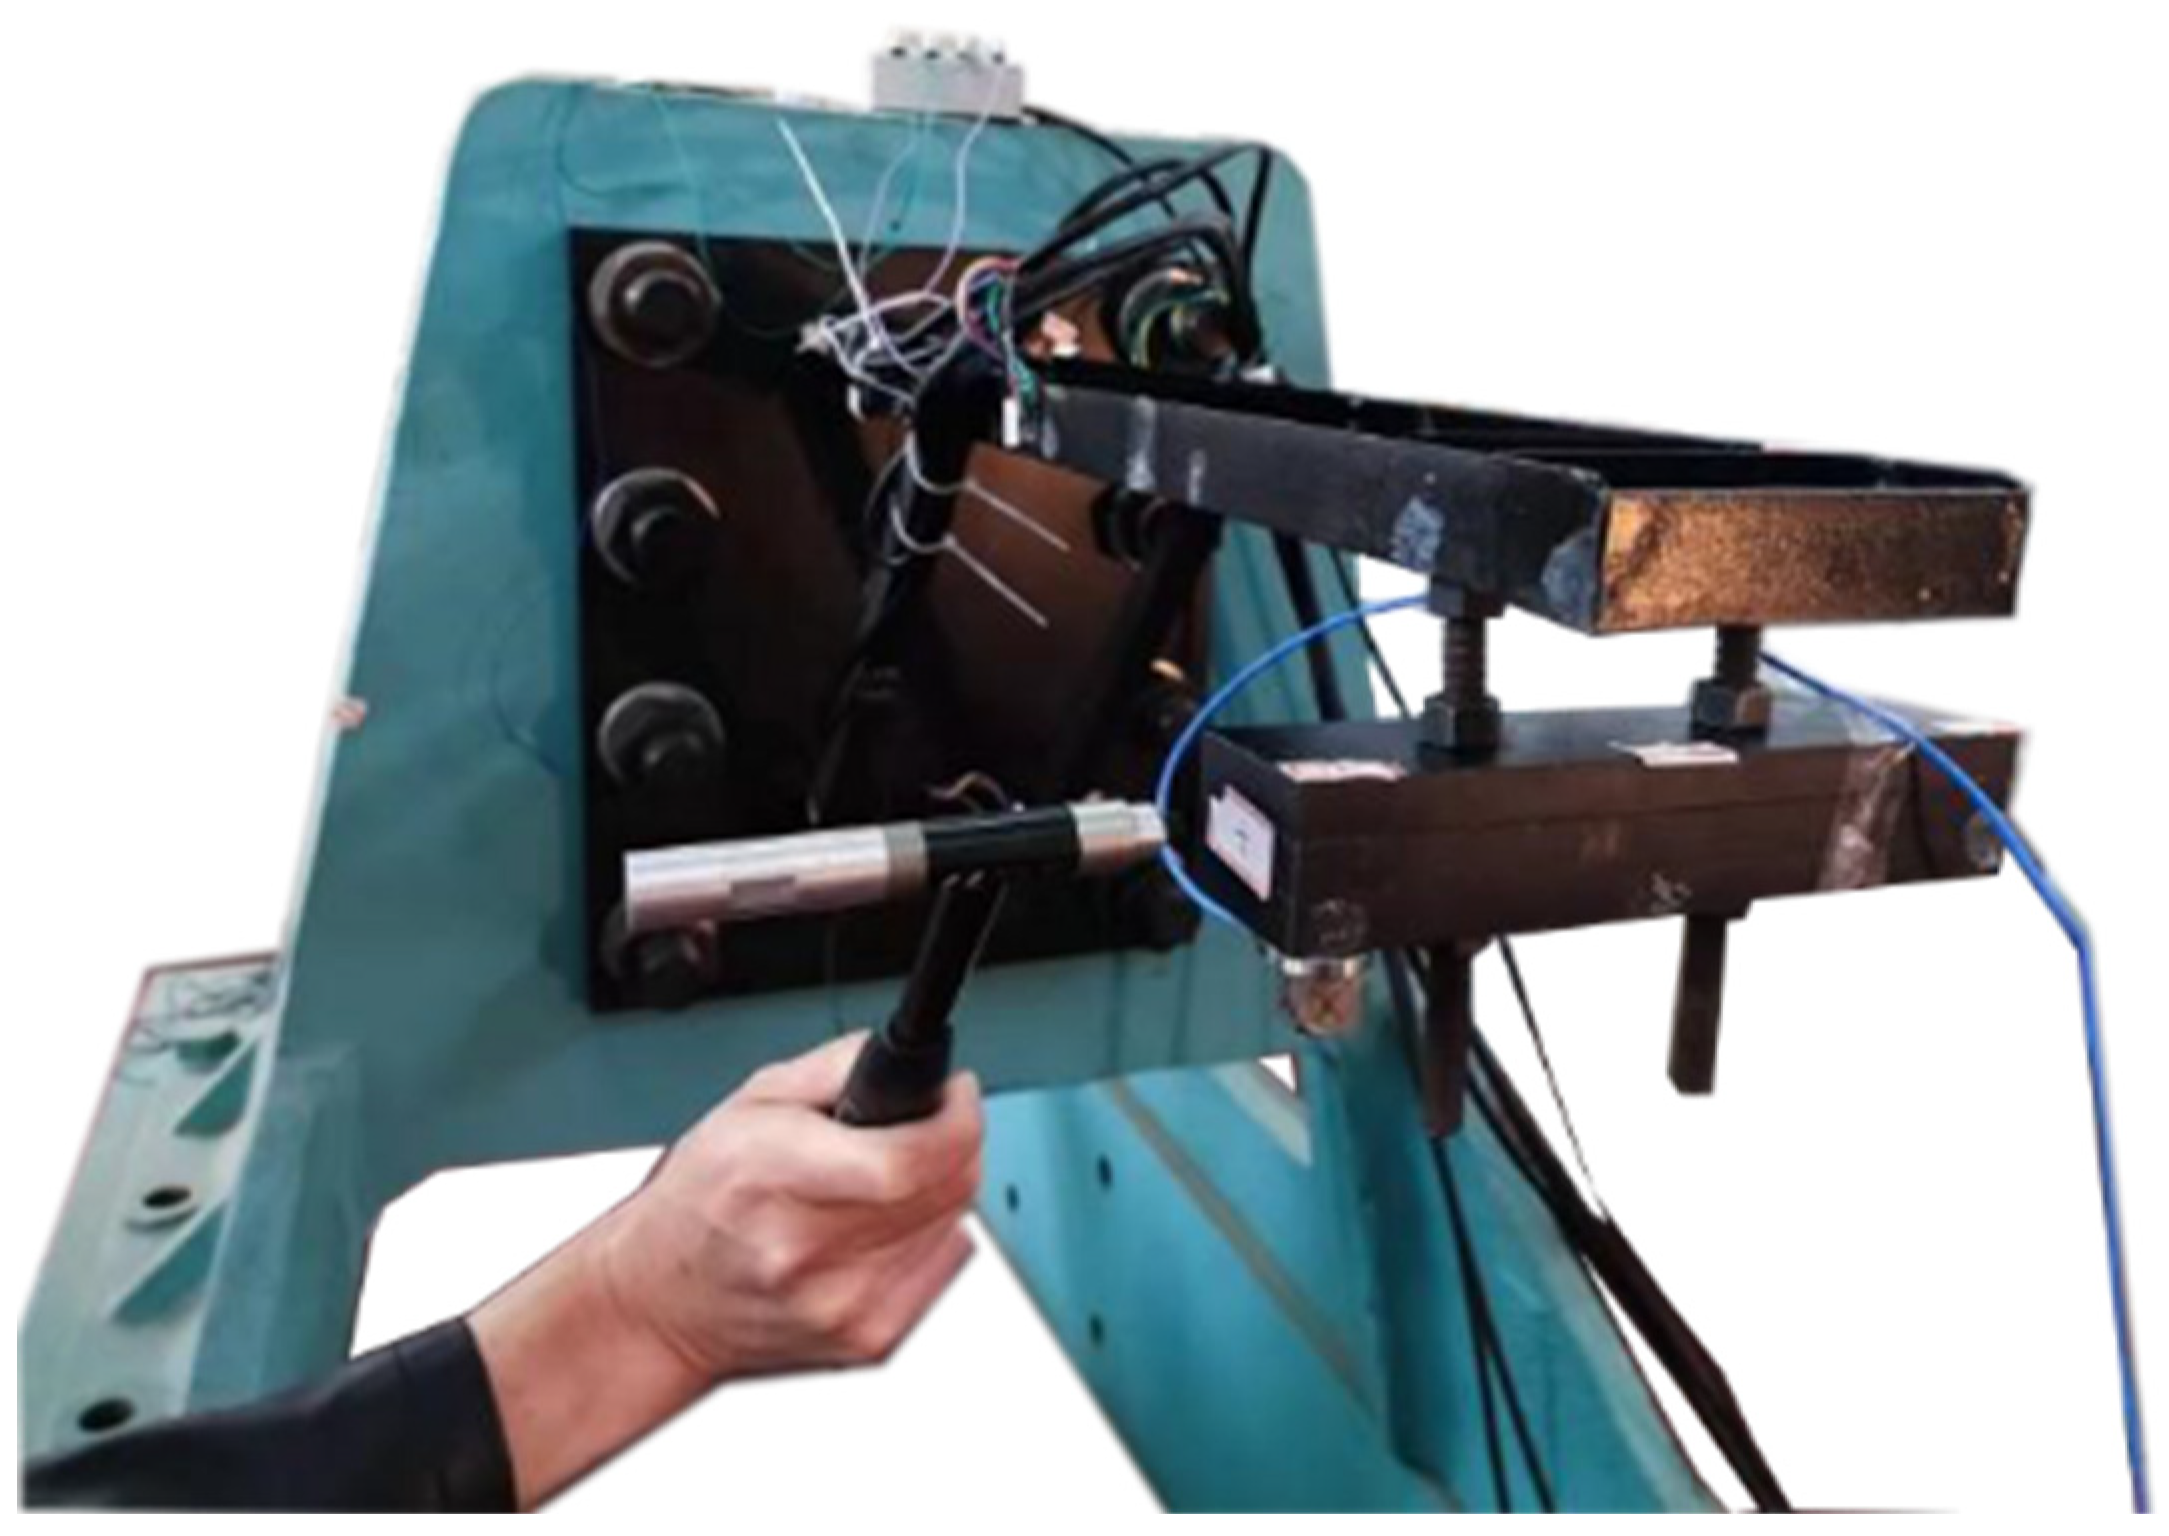
3.3.2. Test of Ground Impact

The impact load test system of the weapon pylon is shown in Figure 3. The whole test system includes LMS Test Lab acquisition system, portable data acquisition device of LMS SCADAS Mobile SCM01; force hammer (PCB 086C03), its range is ±2225 N and sensitivity is 12.5 mV/N.
During the test process, the impact load test was carried out under the two working conditions of a single pylon and a double pylon, respectively. Use the data collector to connect the hammer data to the first channel. According to the position and number of the strain gauges on the pylon, the response signals of the strain gauges are connected to the second, third, fourth, and fifth channels, respectively. Set the sampling frequency to 4096 Hz, that is, the sampling interval is 0.00025 s, and the total time of each sampling is 100 s. In order to ensure that the response of the previous tapping will not affect the next response signal, tap once every 13 s. Use the force hammer to excite at the center of the weapon’s tail, as shown in Figure 4, for the experiment of the single pylon.

4. Discussion

4.1. Test of Static Load Calibration

4.1.1. Test Data Processing

Obtain the signal of the strain gauges S1, S2, S3, and S4 during the static load test. Figure 5 shows the value of strain gauge S1 of the single pylon model. It can be seen that the experimental device has a certain amount of background noise and the response changes in steps during the loading process. (The signal form recorded by the rest of the strain gauges is similar to that of S1, the difference lies in the noise floor and the magnitude of the response value).
The stable steps in the strain gauge data are averaged to obtain the strain value under the corresponding static load, and the relationship between the strain and the static load is drawn, as shown in Figure 6 and Figure 7.

4.1.2. Result Analysis

By processing the strain signals at different positions obtained in the static load calibration test, it can be seen that the strain value and the load are basically linear, that is, the weapon pylon model satisfies the assumption of a linear structure, which verifies the rationality of applying the superposition theorem to analyze the response signal.

4.2. Test of Ground Impact

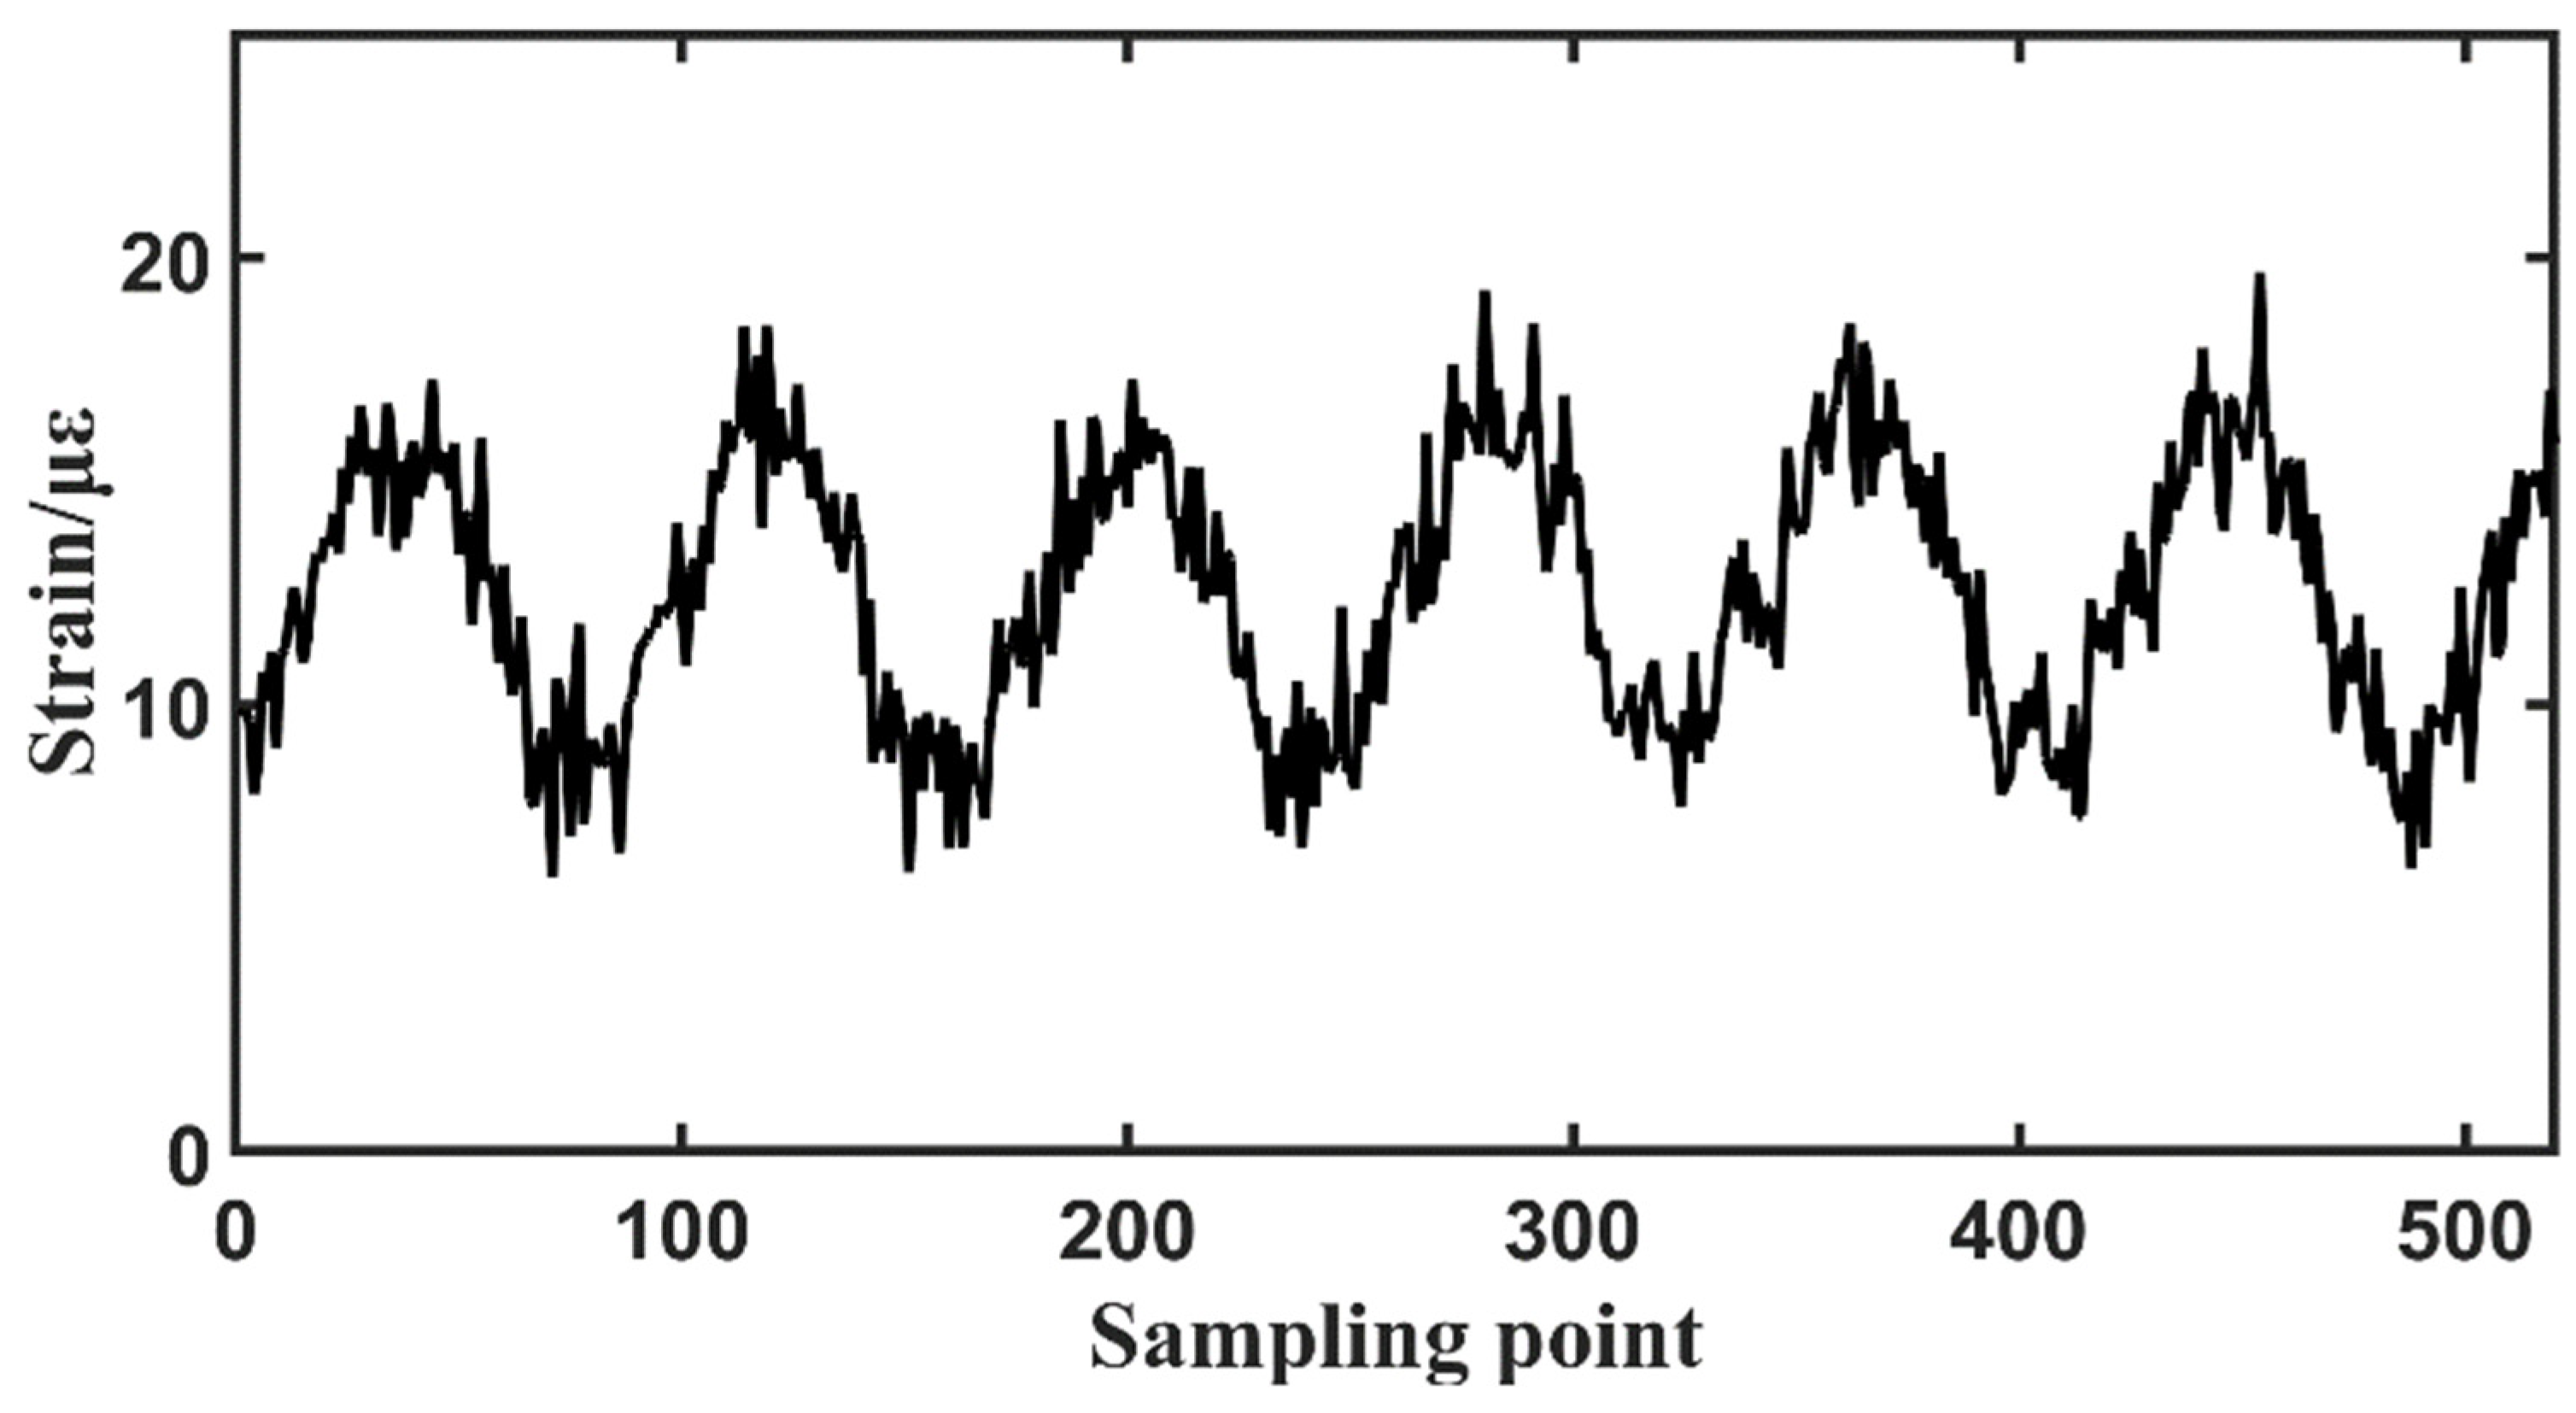
4.2.1. Test Data Processing

(1)
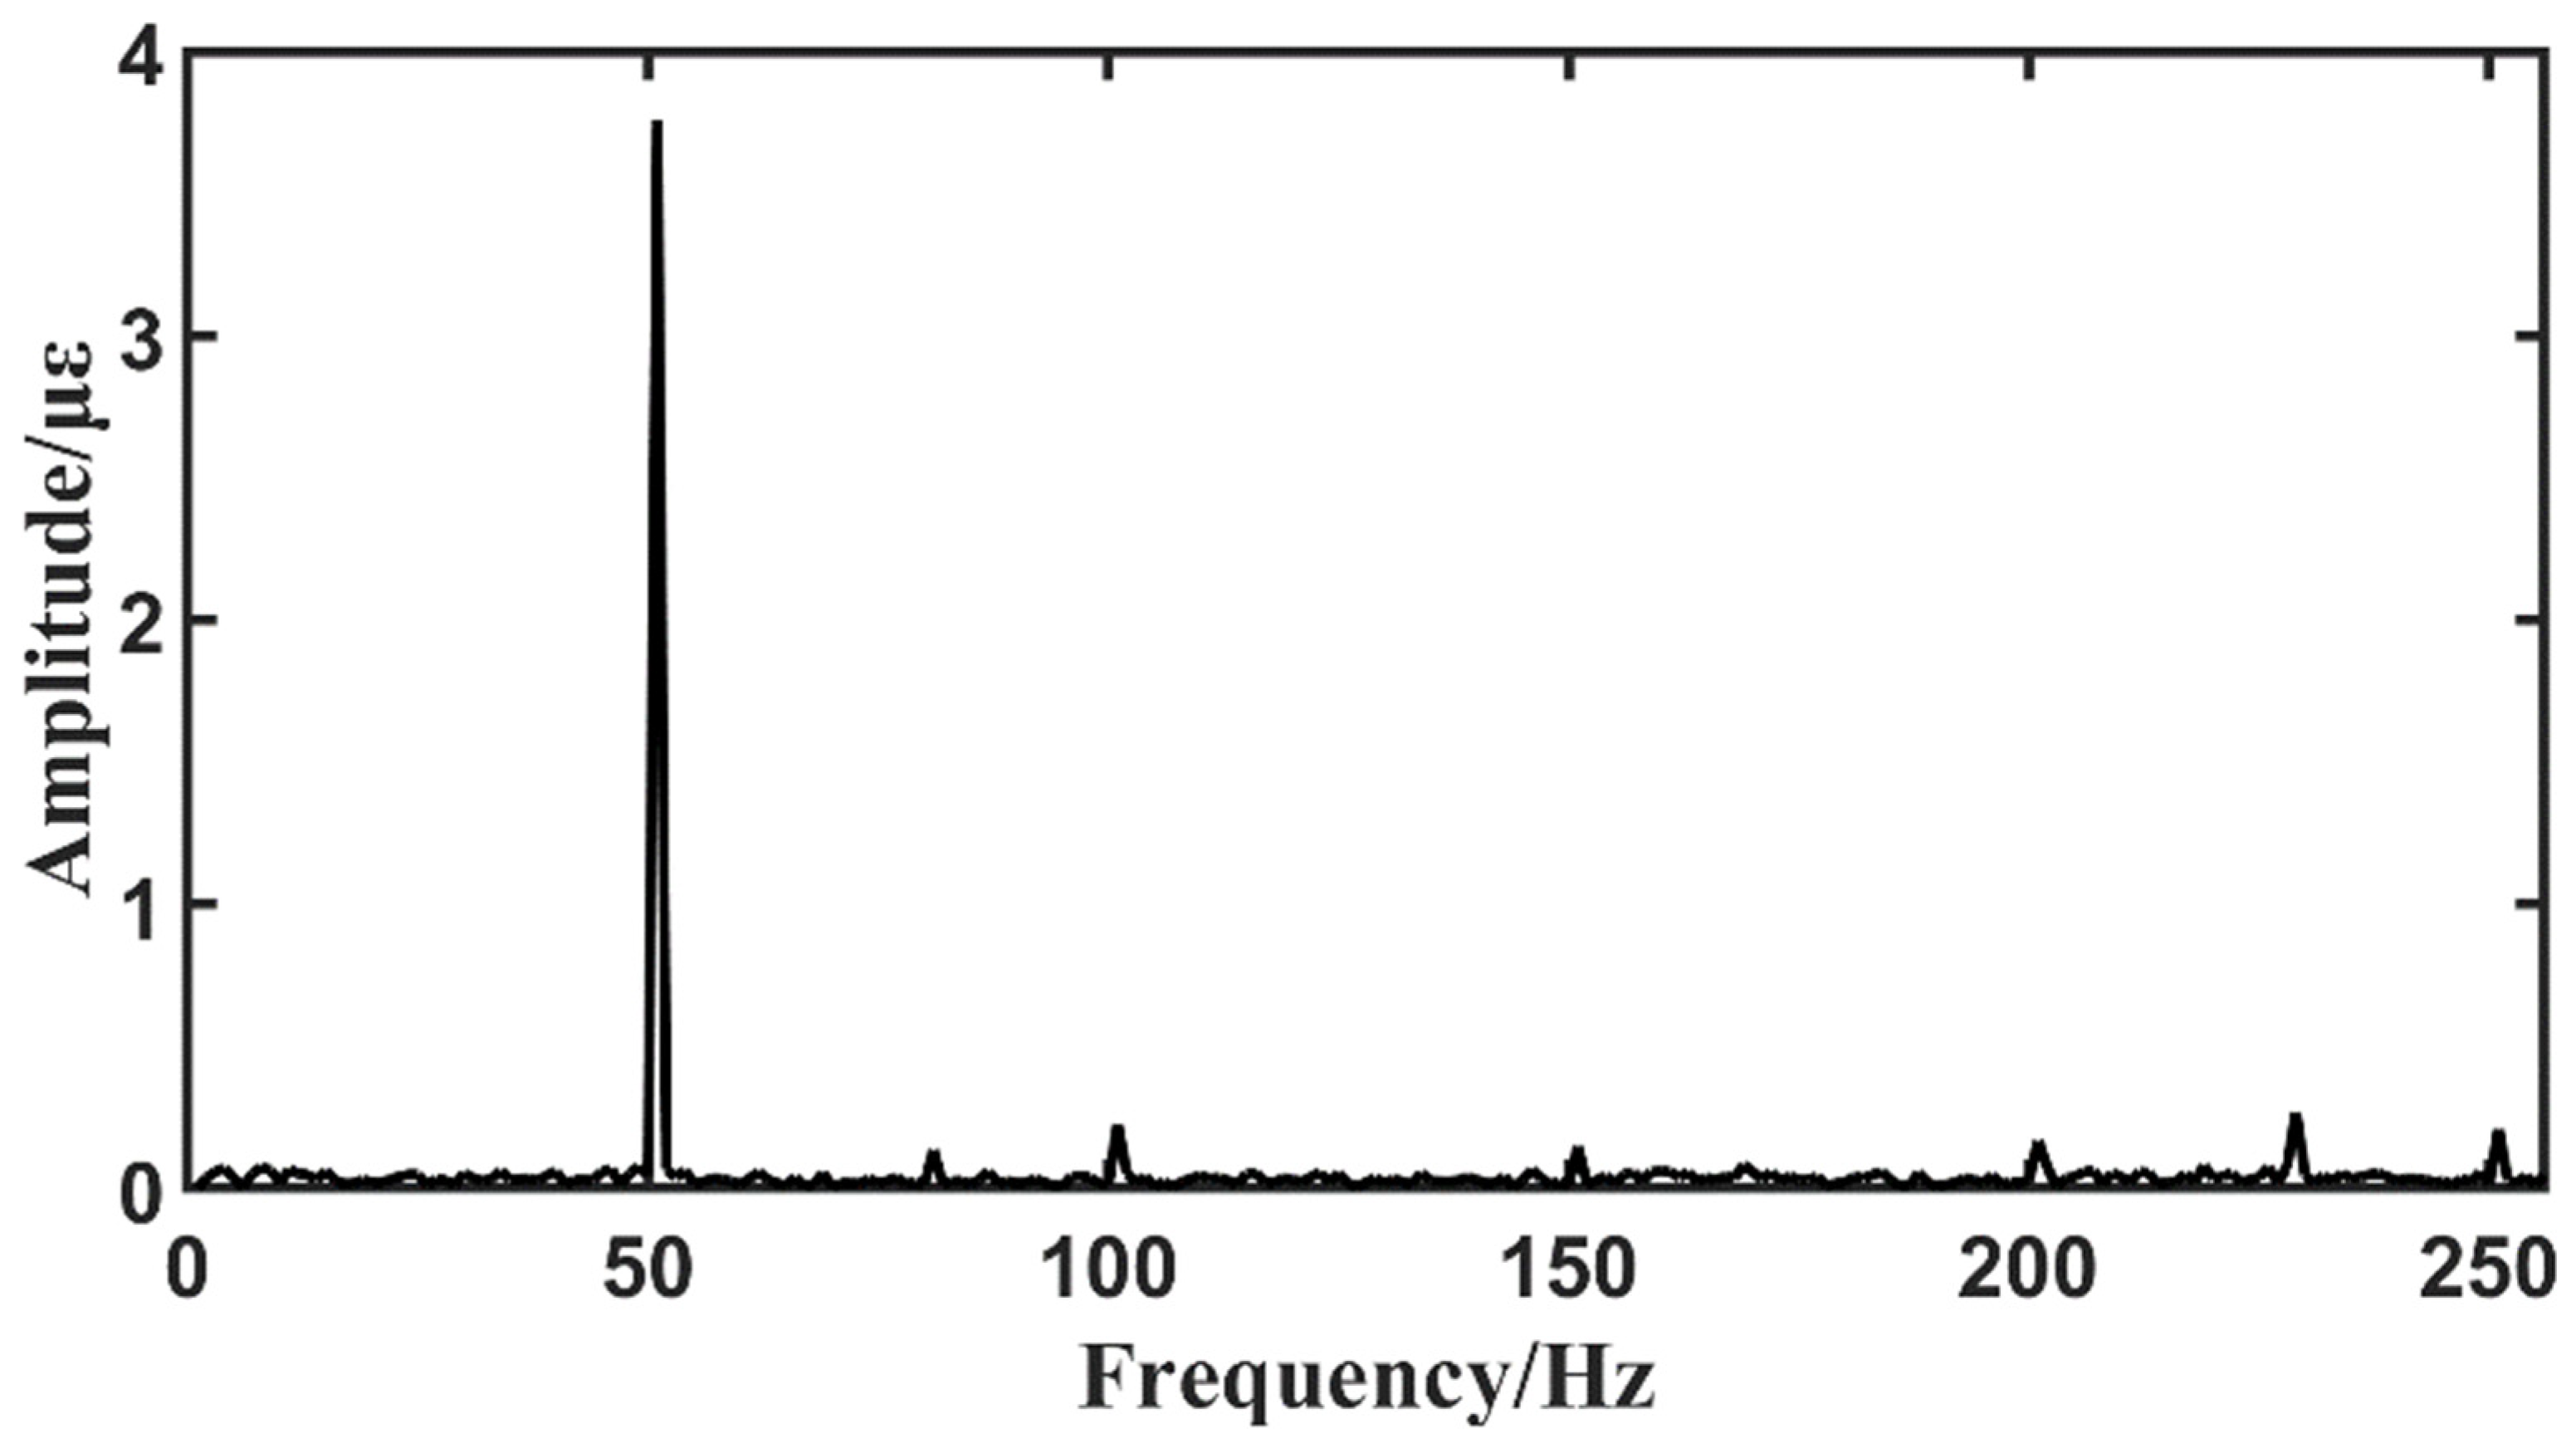
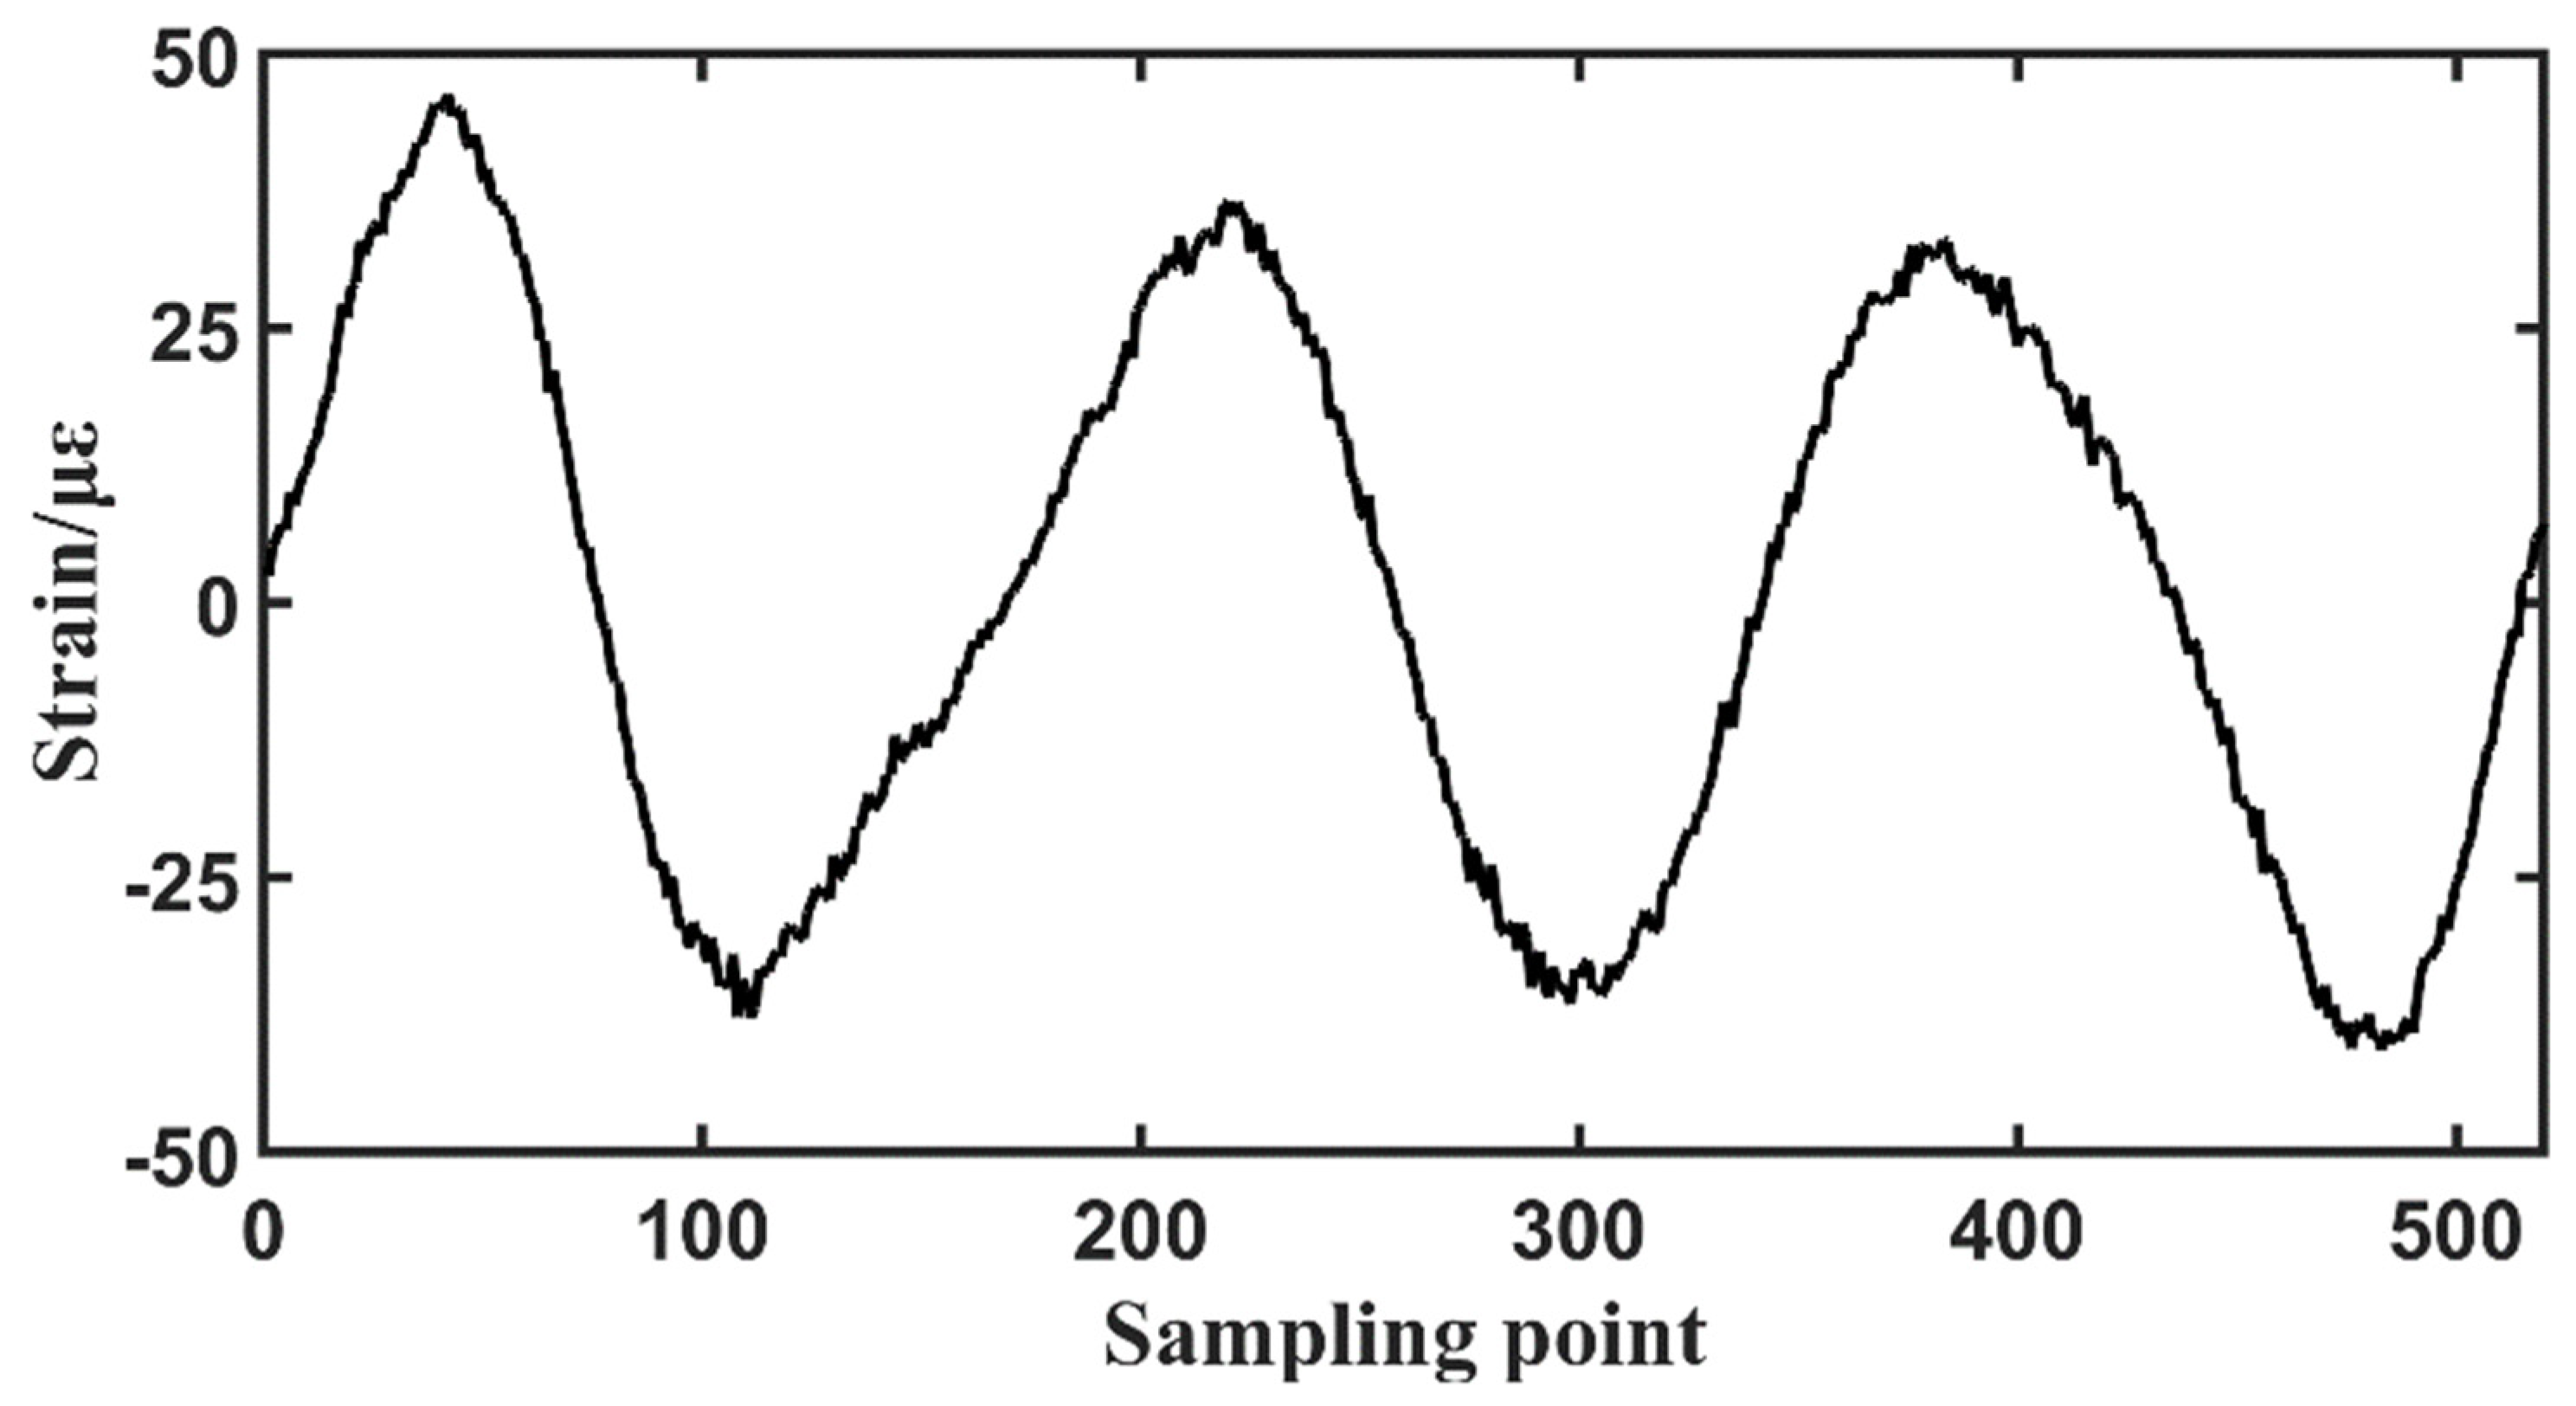
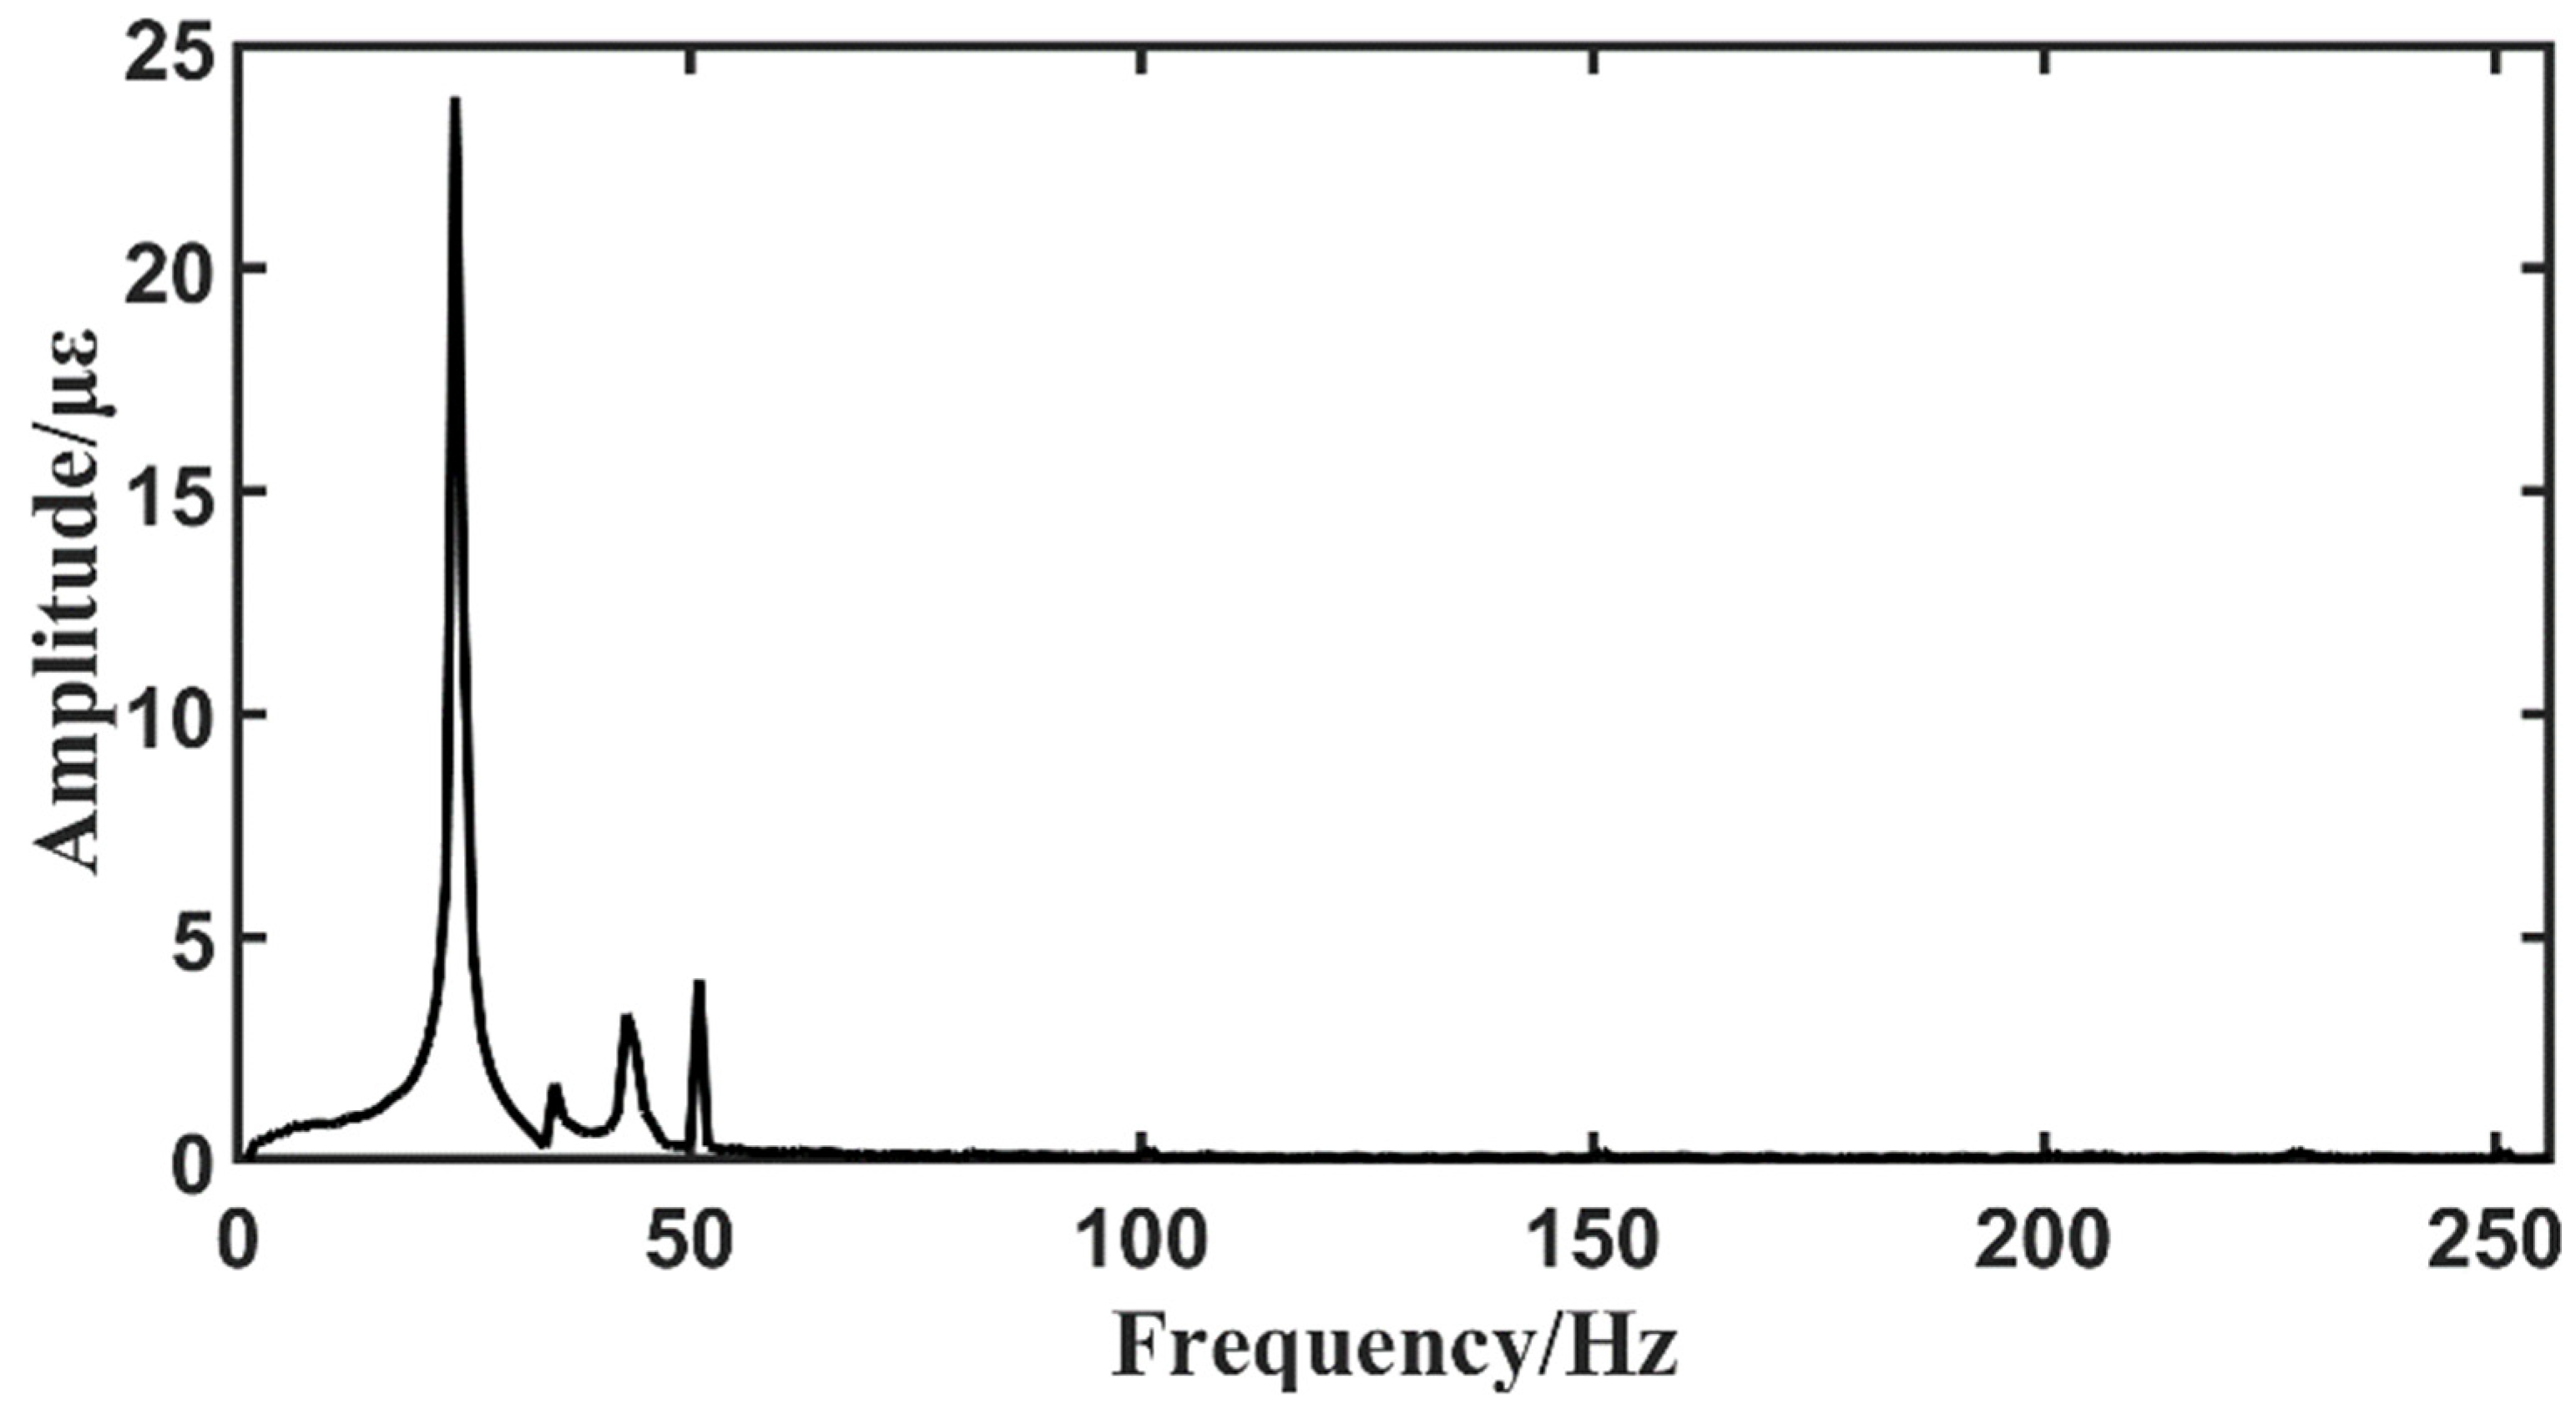
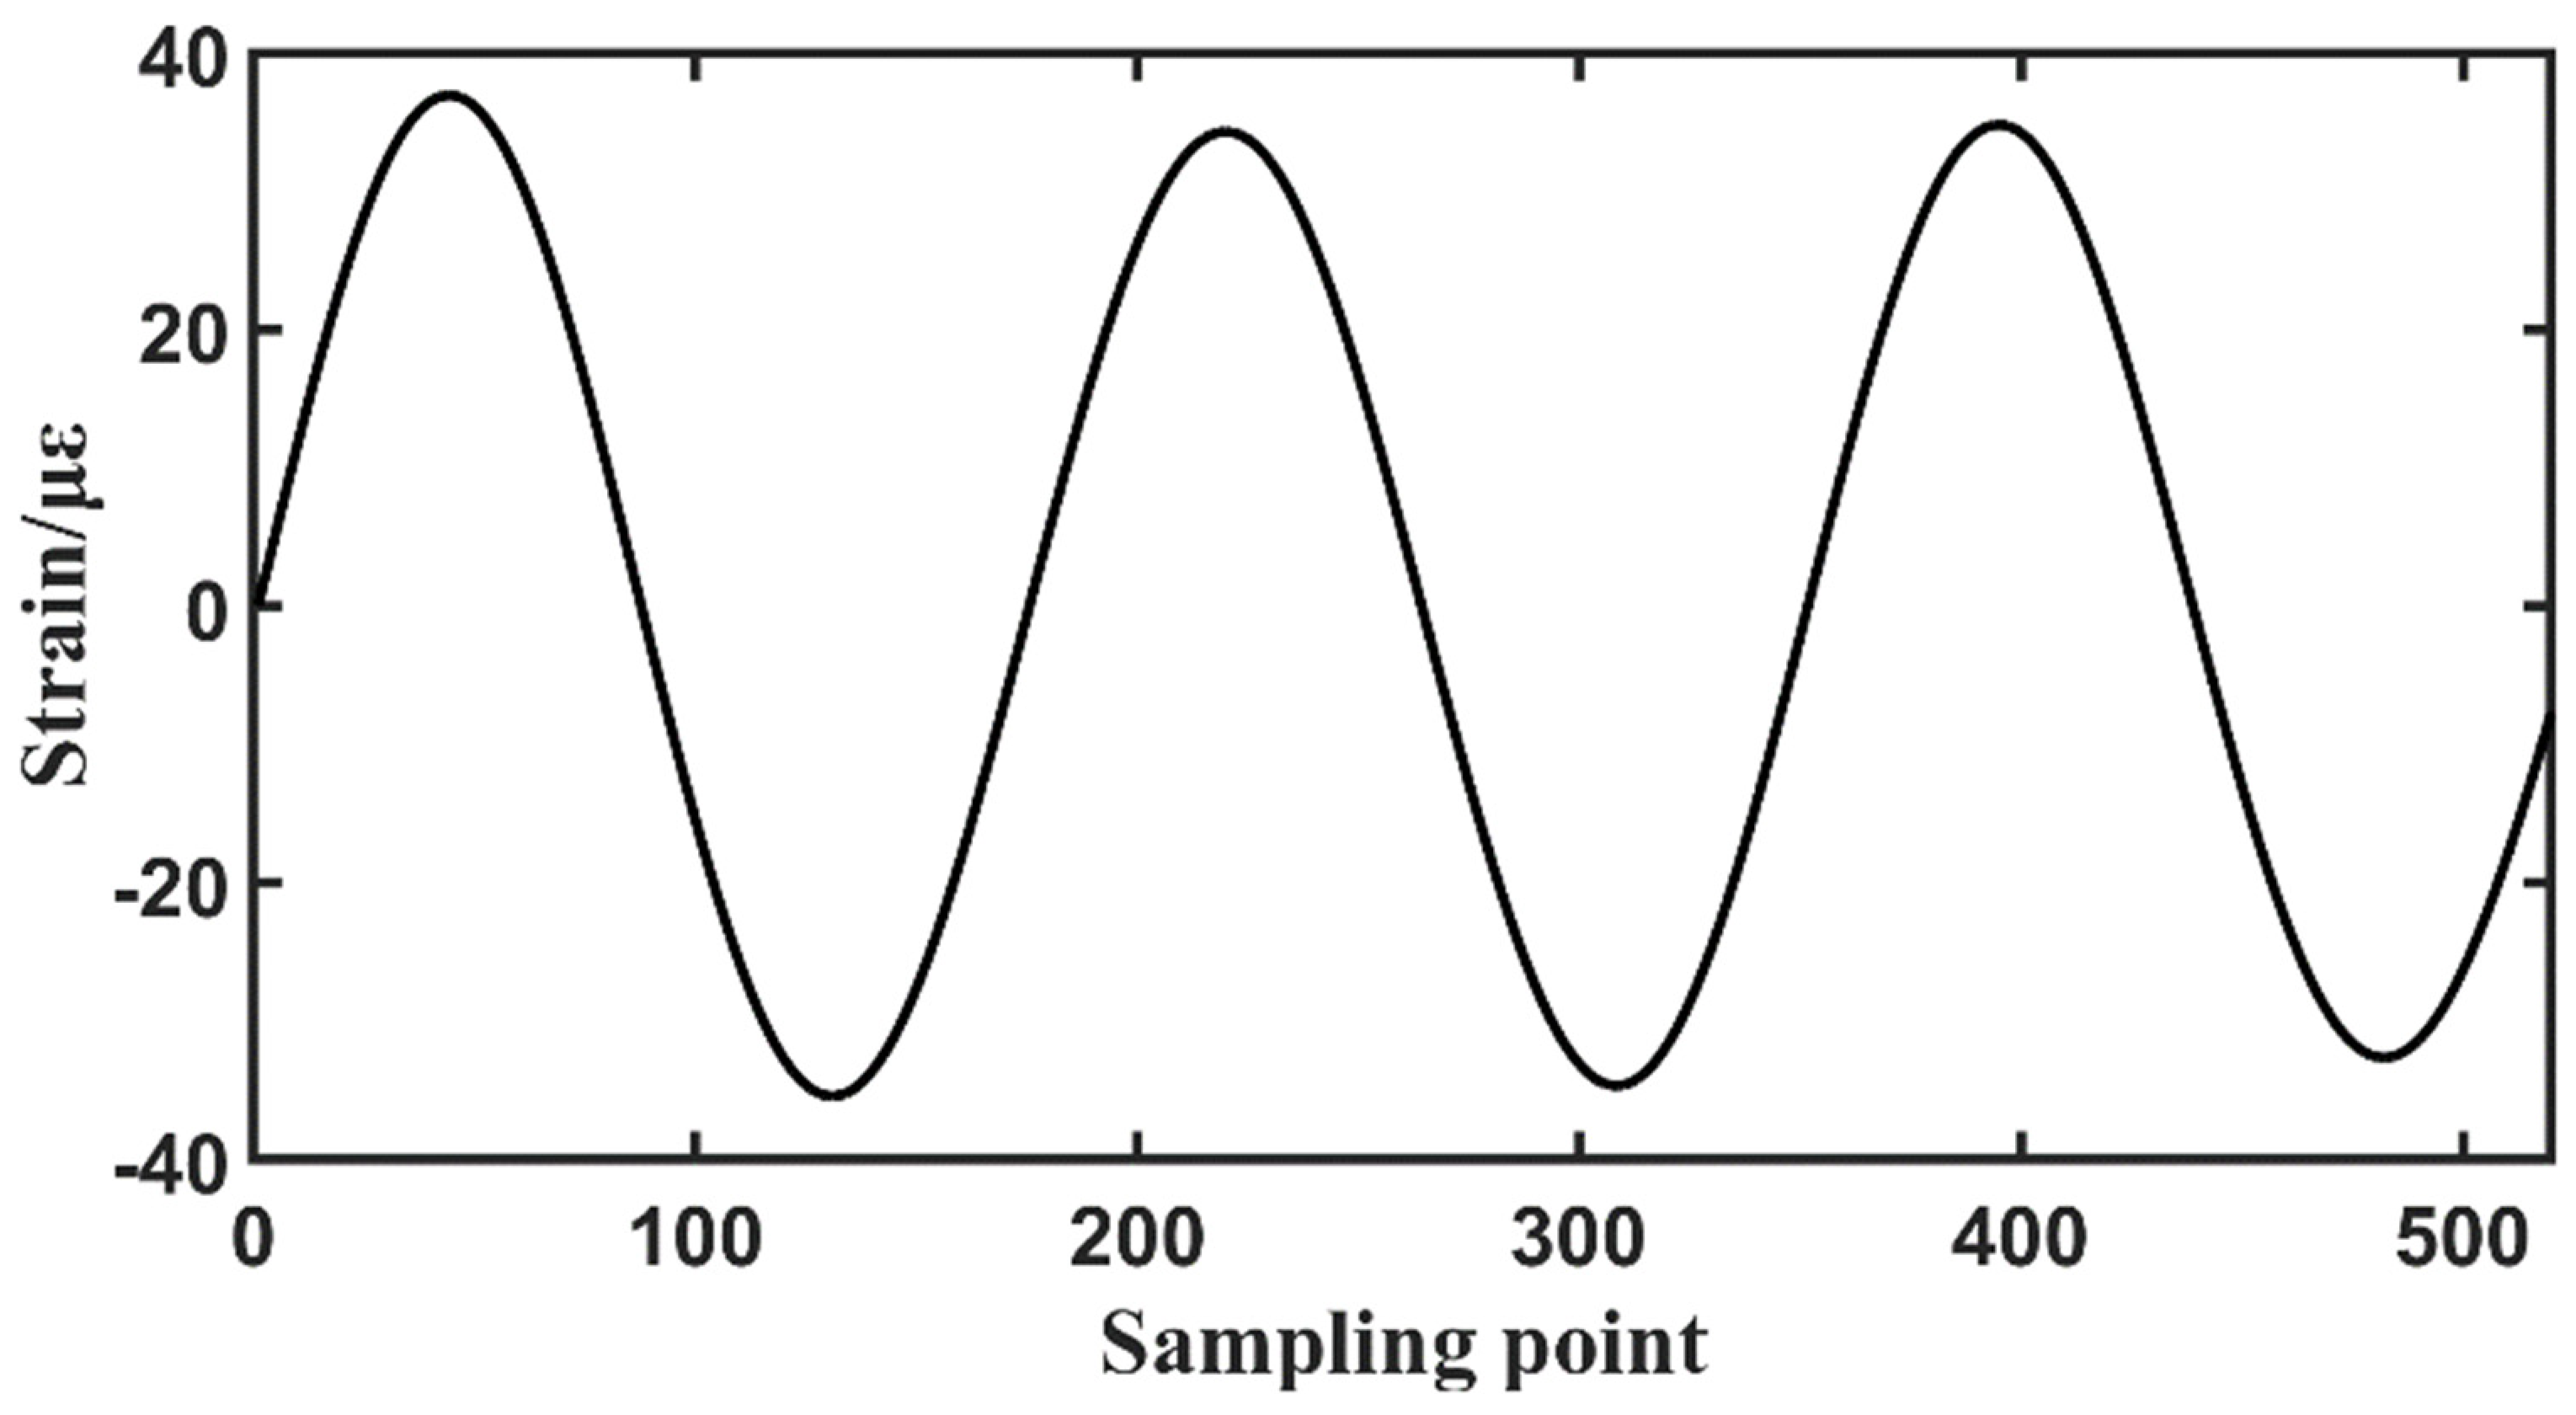
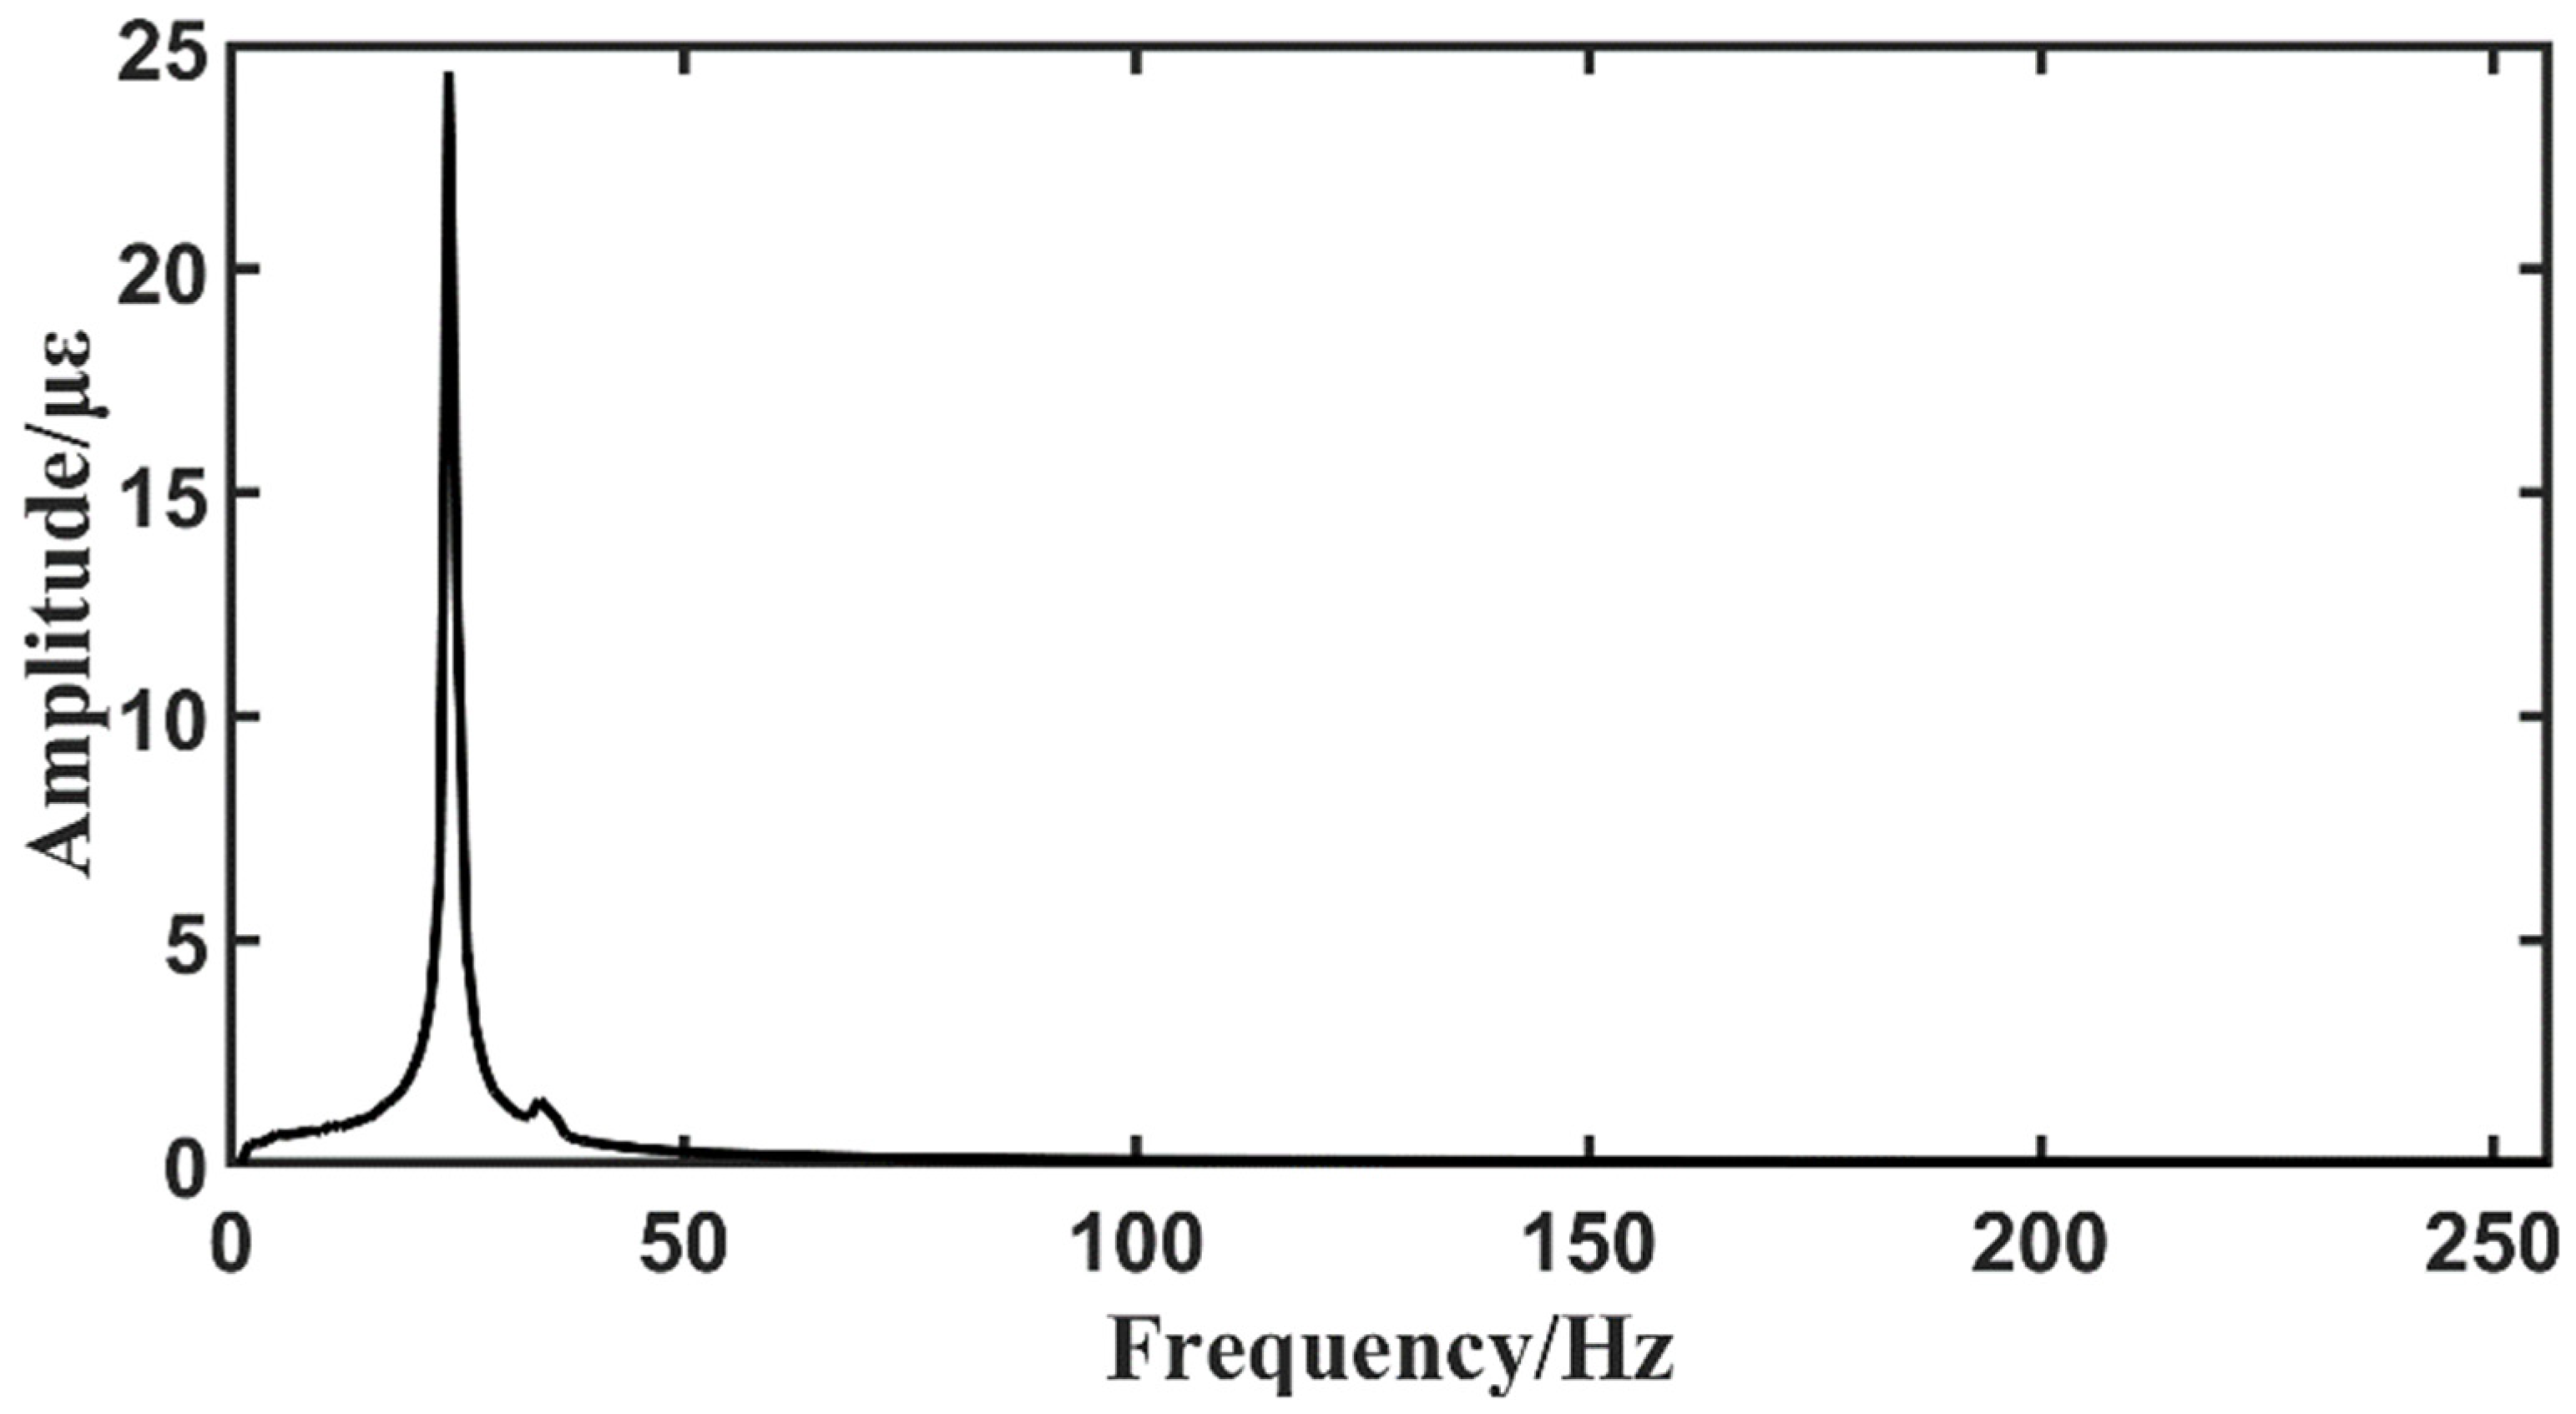
Response signal noise reduction processing
Ideally, before the tapping moment, the response signal of the strain gauge is zero, but due to insufficient strain gauge trimming, electromagnetic interference, and the movement of people in the laboratory, the test model has background noise.
Taking the noise signal of channel 2, as shown in Figure 8, you can see a fixed deviation of about 10 μ ε and an oscillating part around the deviation. The frequency domain characteristics of the noise signal are shown in Figure 9, and it can be seen that the noise energy is mainly concentrated around 50 Hz.
Part of the response signal is intercepted. It can be seen from Figure 10 that the collected strain response is approximately a sinusoidal signal, which is the result of the superposition of signals of different frequencies, which conforms to the assumption that the structure is a linear system. The frequency domain characteristics of the response are shown in Figure 11. The strain response is dominated by low-frequency components, and more than 80% of the energy is concentrated in the first two-order eigenfrequencies. Design a low-pass filter according to the sampling frequency and the characteristics of the noise to reduce the noise and preserve the main properties of the structural strain response.
An elliptical filter is selected, and the specific parameters are set as follows: the sampling frequency is 4096 Hz, the pass frequency is 35 Hz, the cutoff frequency is 40 Hz, and the passband ripple is 0.5 dB, and the stopband attenuation is 80 dB. After polynomial removal of the trend, the above-mentioned low-pass filter is applied to filter the strain response signal to obtain the response signal for load identification. The filtered signal is shown in Figure 12 and Figure 13. The response in the time-domain graph is smoother and the number of extremums in the frequency domain graph is reduced, indicating that the filtering operation can reduce noise and high-frequency response signals and preserve the main characteristics of the response signal.
(2)
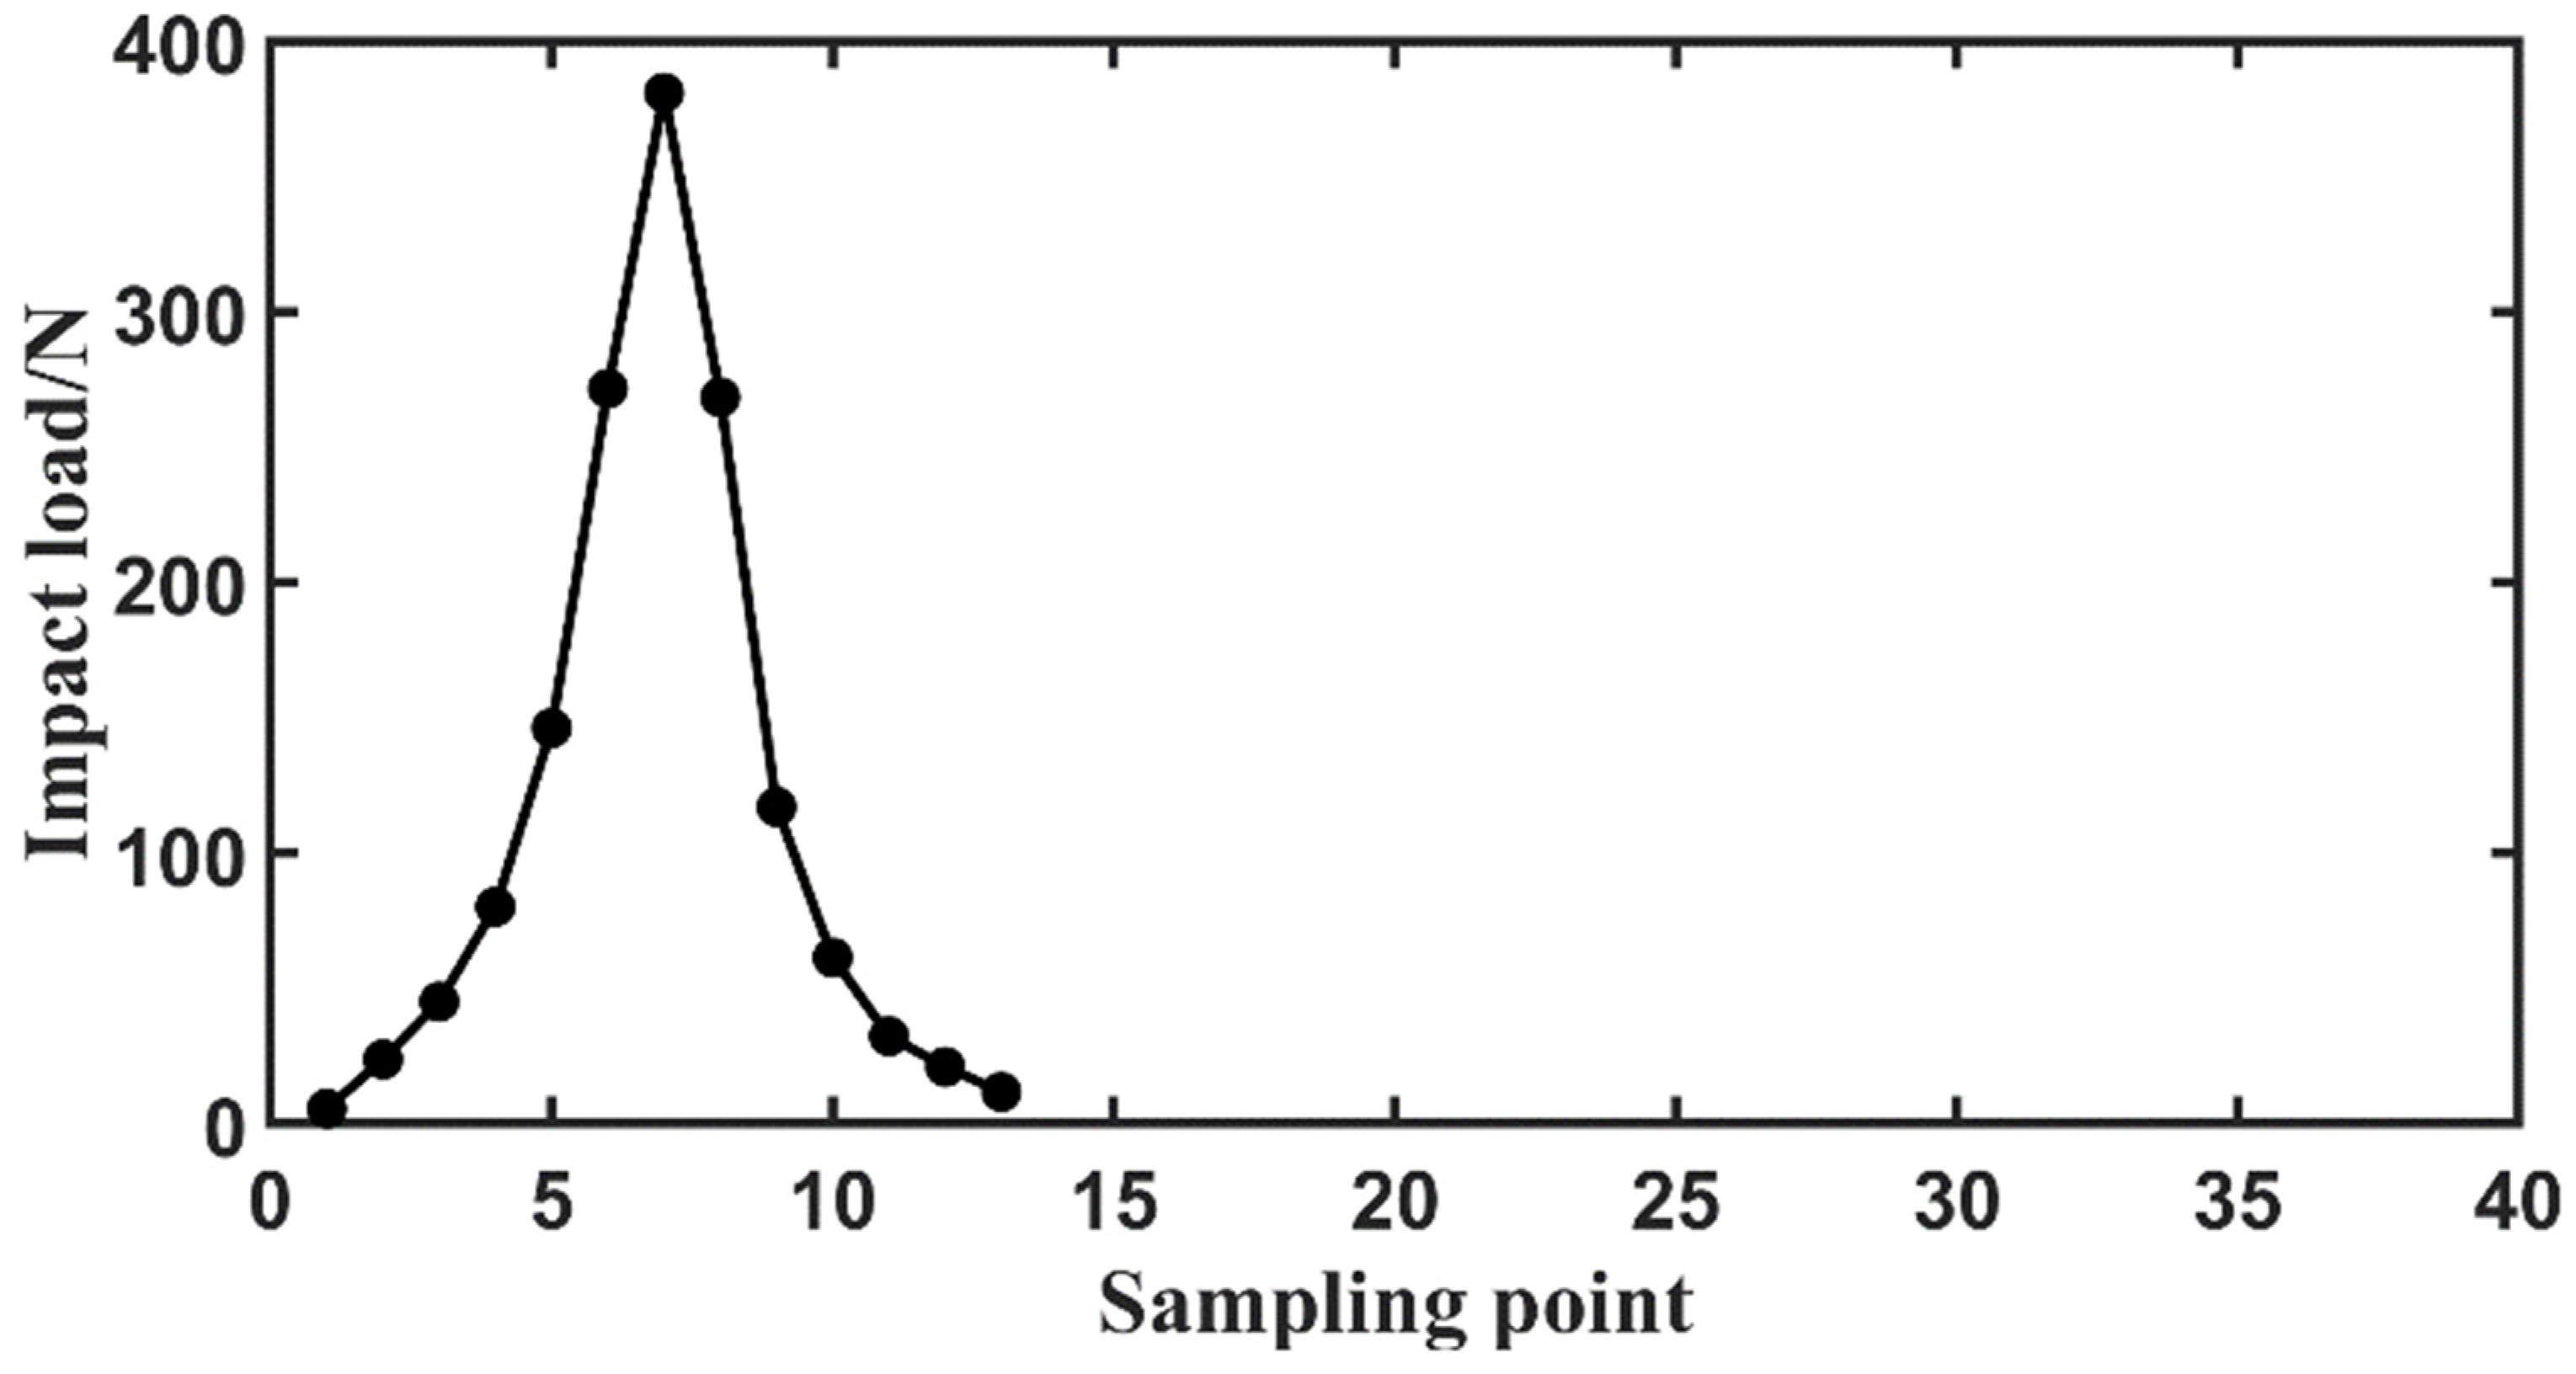
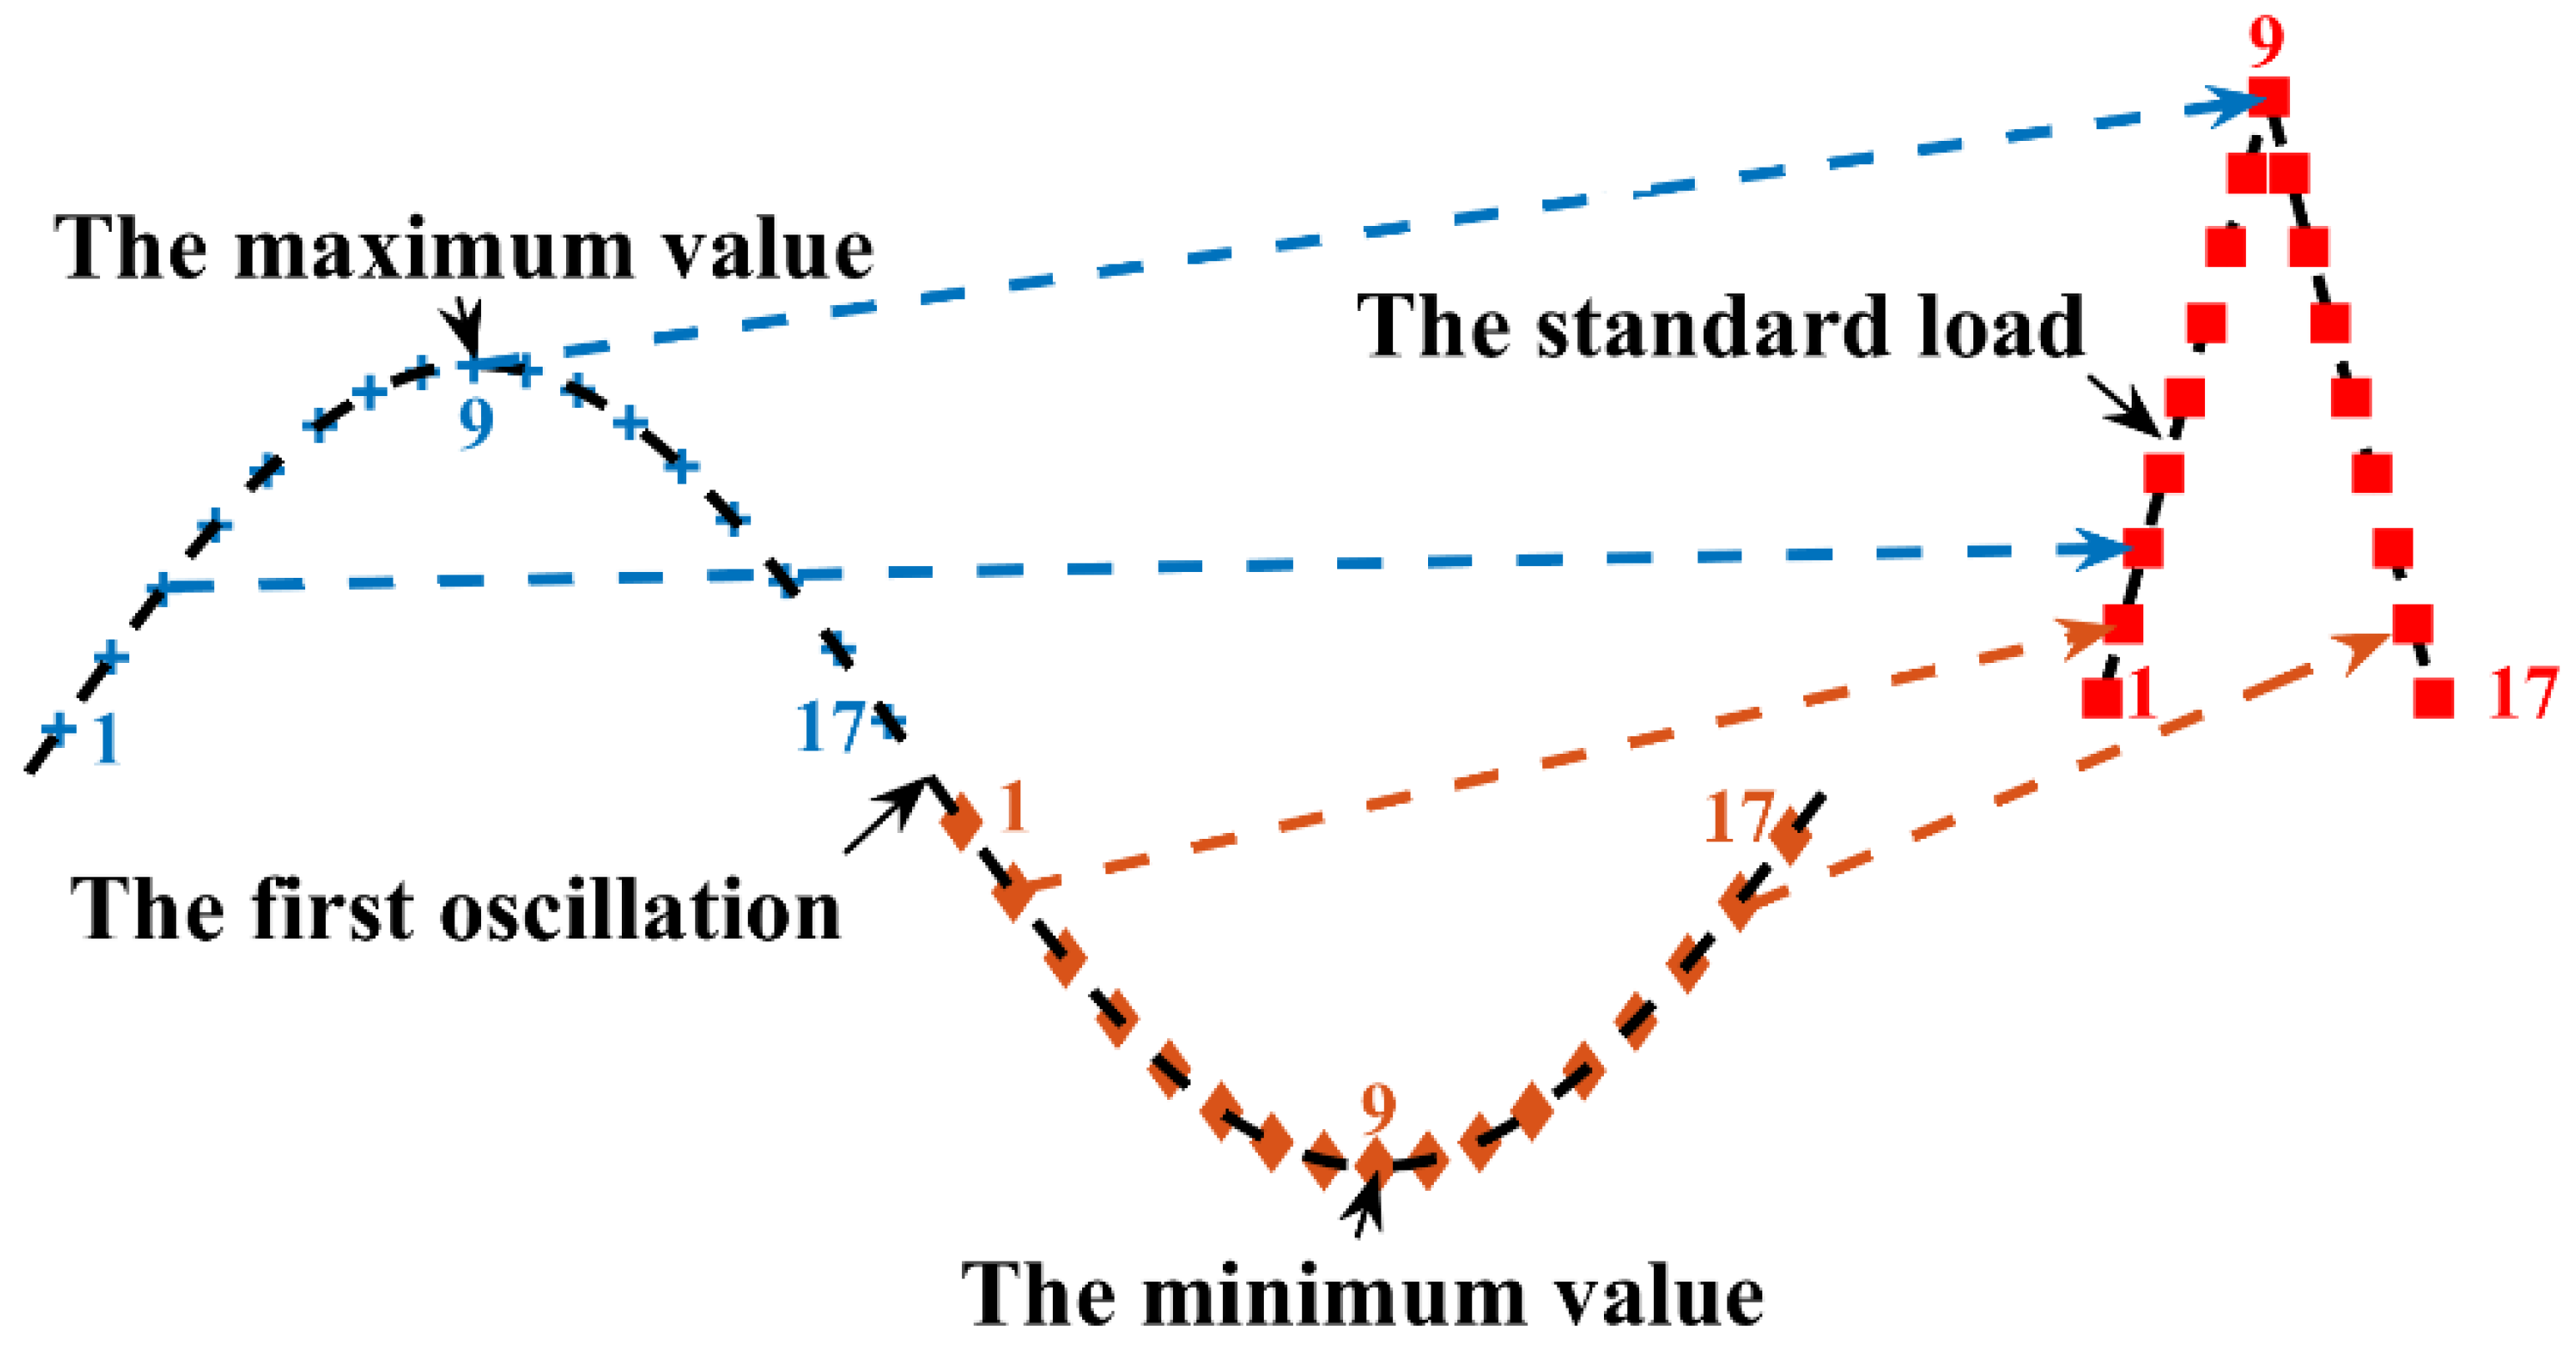
Standardized processing of impact force signal
The impact load, shown in Figure 14, is much smaller in width (about 15 samples) than the lower-order modal response (about 200 samples). In line with the assumption of standardized treatment, the specified standardized load action width is 17 sampling points, and the impact load is standardized to obtain the standard load in a symmetrical triangle type, as shown in Figure 15:
(3)
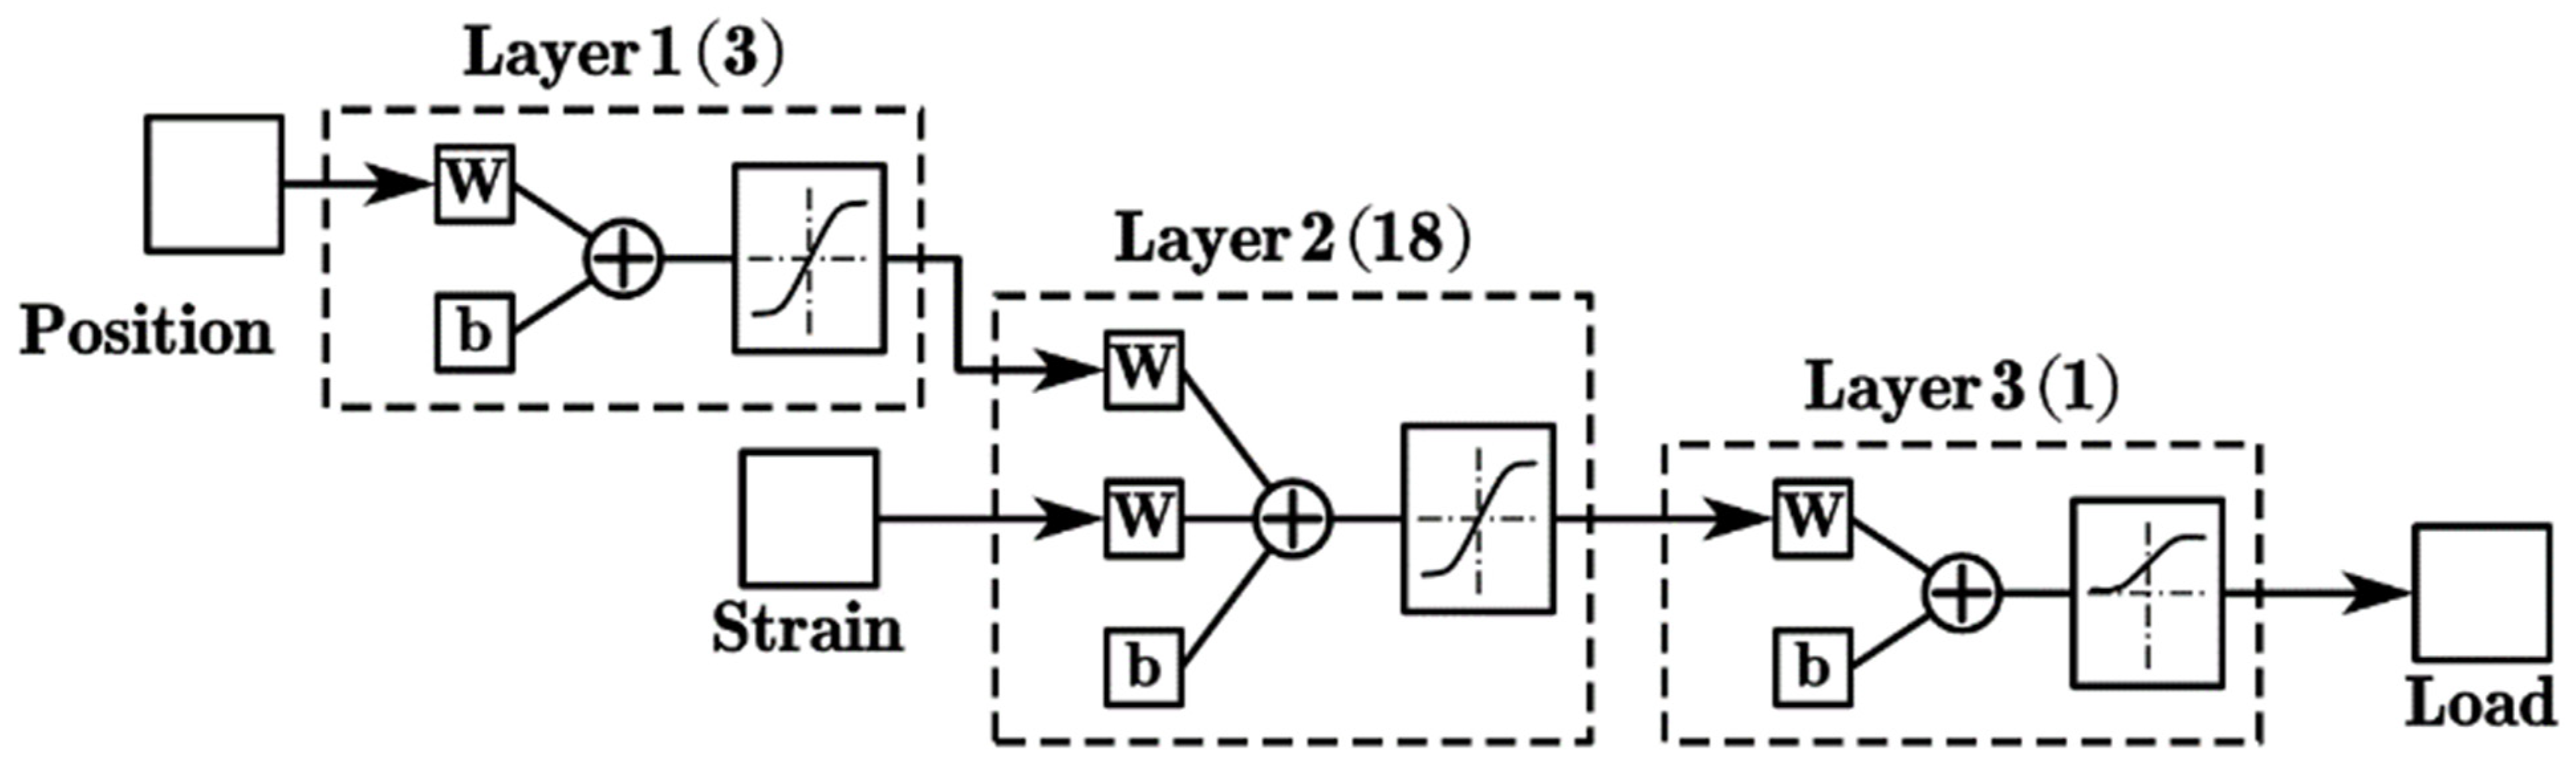
Determination of the neural network structure
Take the position information of the strain gauge as the first group of input. Intercept the first nine oscillations of the filtered response signal, mark the extreme value of each oscillation and obtain eight marked points at equal distances before and after the extreme value, and number the marked points corresponding to each extreme value in turn. Establish the mapping relationship between the signal marker and the standard load, as shown in Figure 16. Through intercepting multiple oscillations of the signal and selecting multiple markers per oscillation, the time-domain information of the response signal can be more fully utilized.
Establish a three-layer network structure, as shown in Figure 17. The first layer preprocesses the position information of the measuring point. The second layer processes the output signal of the first layer and the response signal and then outputs the integrated information. The third layer integrates the output signal of the second layer to complete the identification of the corresponding load.
(4)
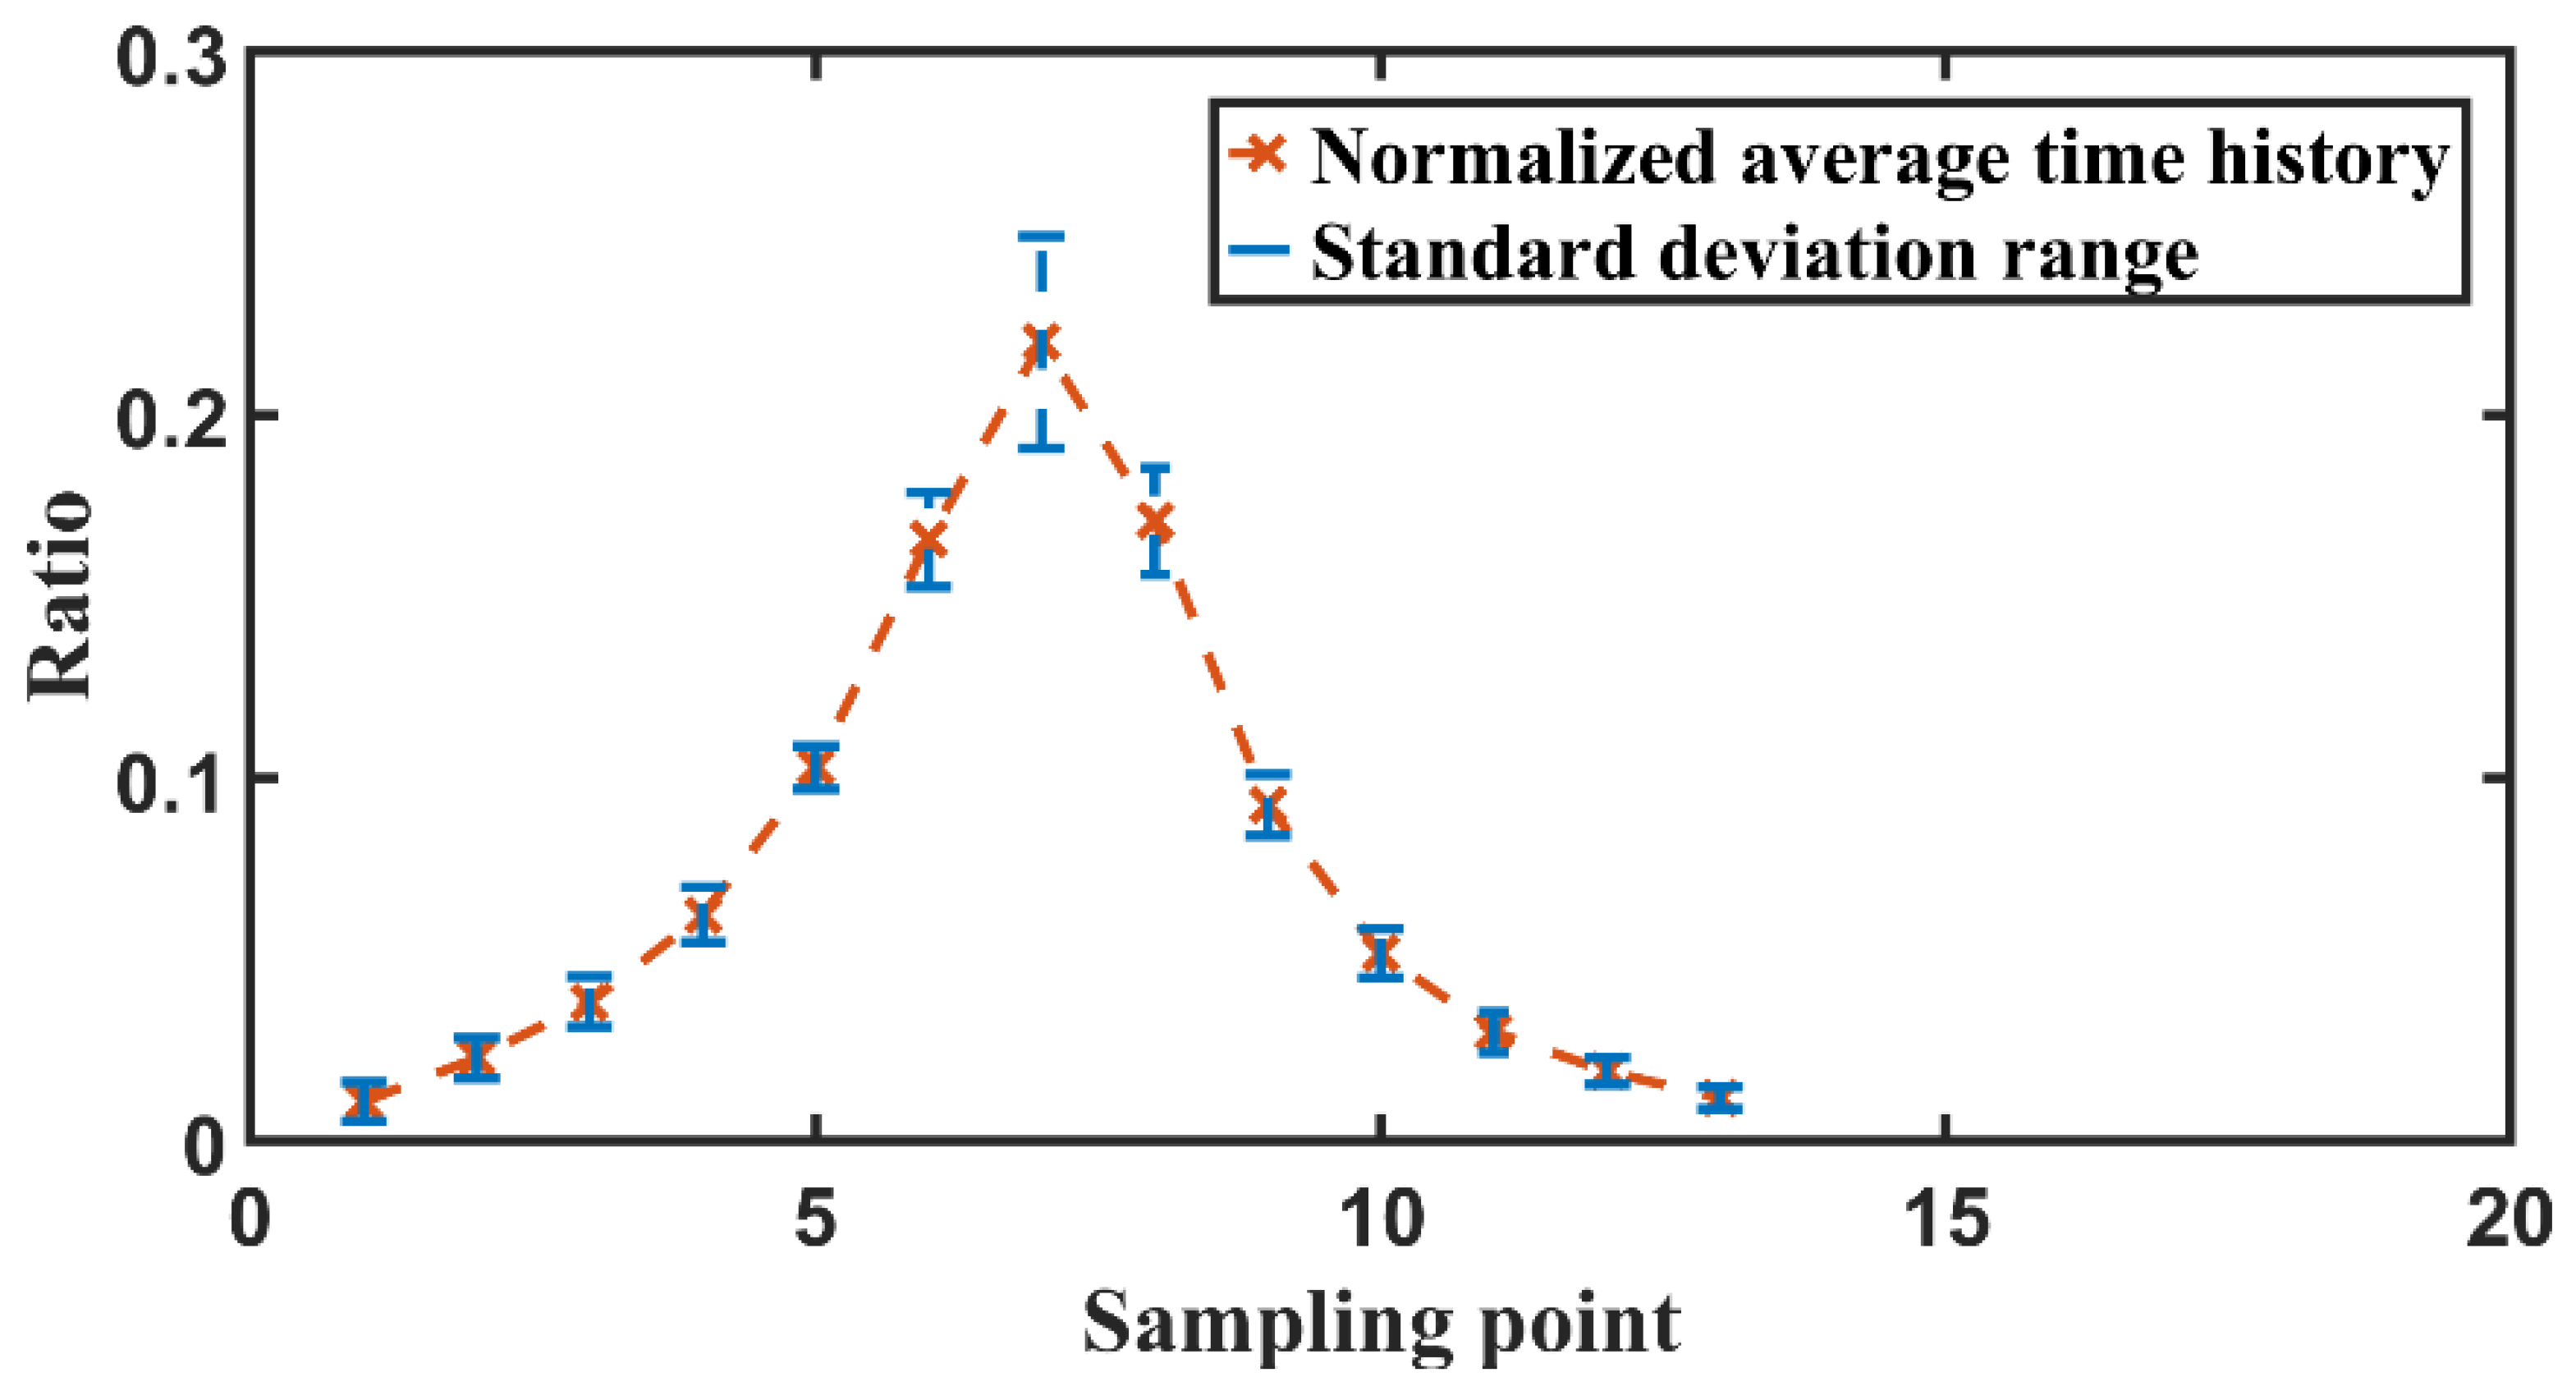
Acquisition of the average time history of the impact load
For a specific weapon, although the time history of the impact load generated by each launch is different, the overall trend of the change is basically the same. Therefore, the average load variation history and the standard deviation of each sampling point can be obtained by performing statistical processing on multiple launches. For the test in this paper, the tapping process is completed by the same person, which can be regarded as a “specific weapon launch”. The normalized average time history by statistical processing is shown in Figure 18.

4.2.2. Analysis of Identification Effect
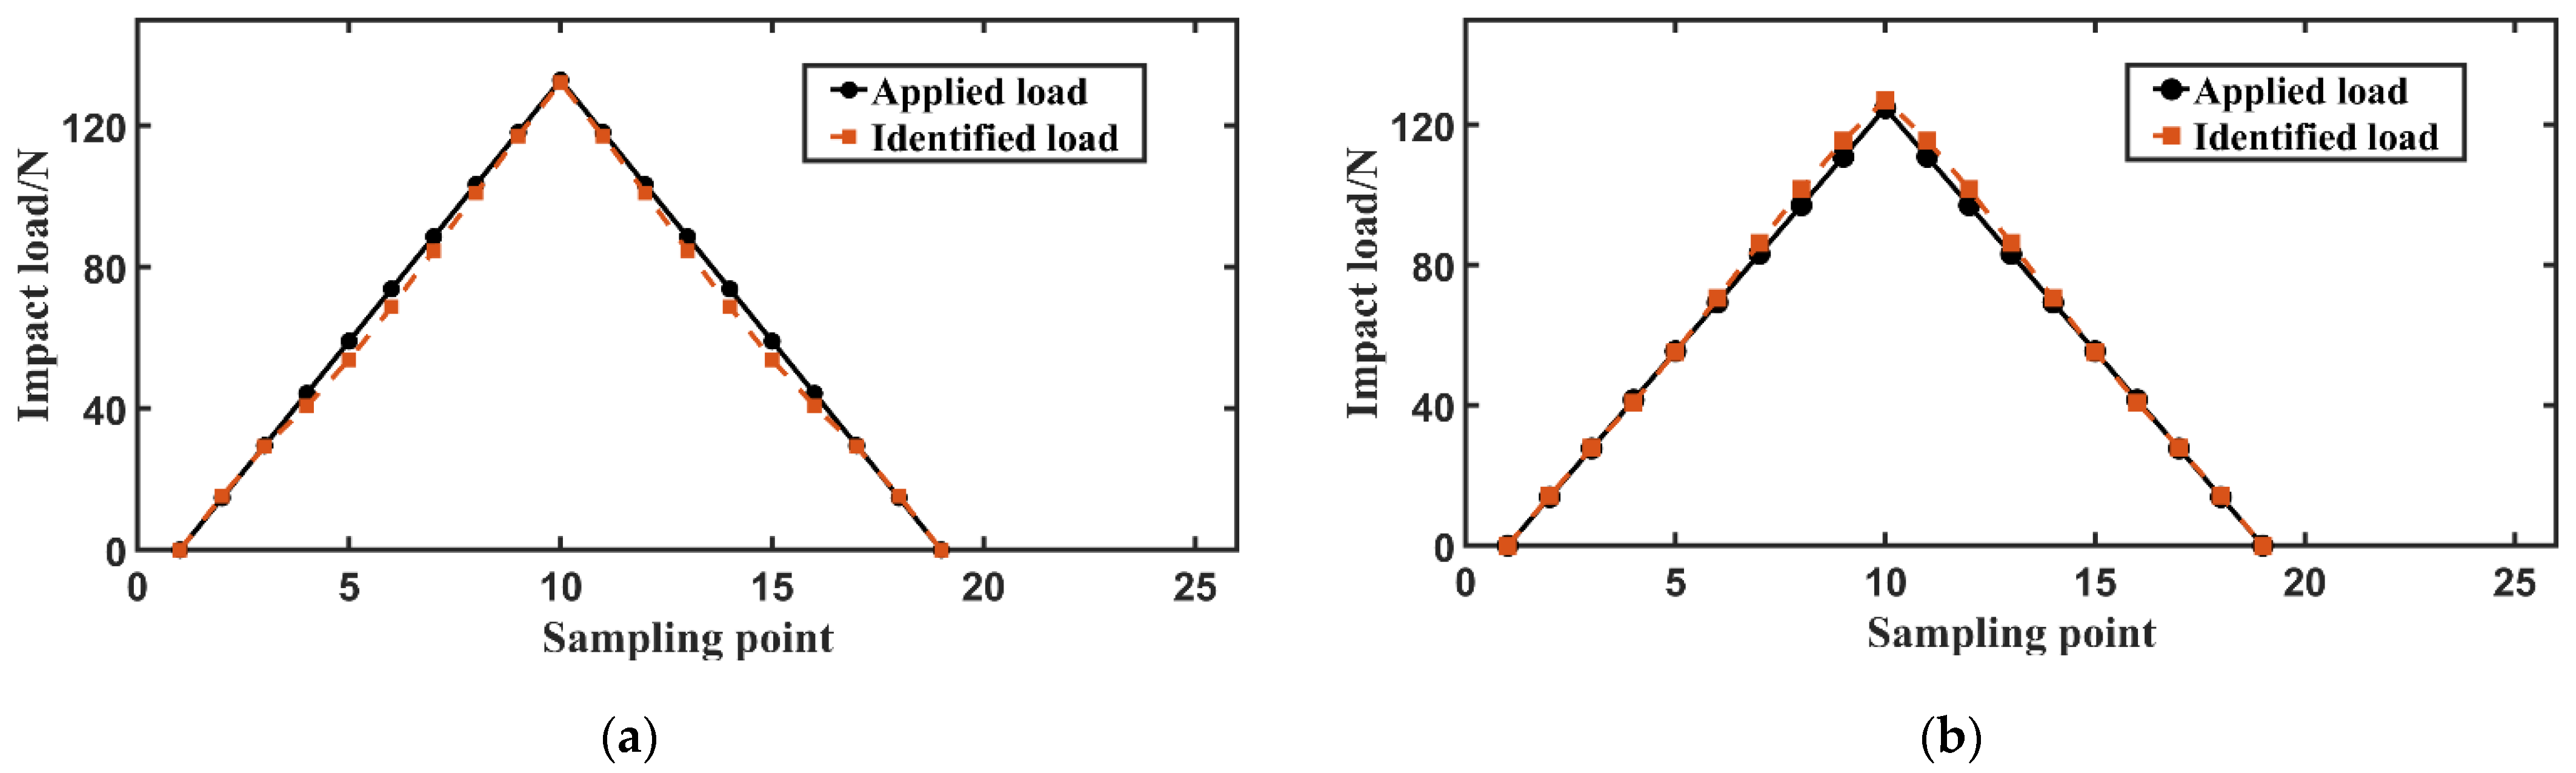
(1)
Identification effect of different working conditions
In this paper, two cases of the pylon model are, respectively, studied to simulate the load of the real weapon pylon when the weapon is launched under different working conditions. The recognition effect is shown in Table 3.
It can be seen that the maximum relative error of load identification under the two working conditions is less than 10%, which can meet the requirements of the project. In the case of a single pylon, a response that does not participate in training and verification is selected for testing. As shown in Figure 19a, the load identified by the neural network is compared with the standardized impact load, and the identified load is a little small. The maximum identification error is 8.87% and the average error is 4.29%, which meets the requirements. As shown in Figure 19b, the maximum identification error of the double pylon is 4.70% and the average error is 2.46%. The overall identified load is larger than the applied impact load.
According to the principle of the equivalent area and the normalized average time history obtained by statistics, the standard load is converted back to the original form, as shown in Figure 20. Compared with the load applied in the test, it can be seen that the deviation between the identified load and the applied load near the peak value under the two working conditions is basically within the standard deviation range. Although the identification deviation of some sampling points at the end exceeds the standard deviation range, the degree of excess is very small. It has high recognition accuracy, and the average error around peak value is less than 10%. By increasing the number of tests, the average change history obtained by statistics will better reflect the change characteristics of the “specific weapon” impact load, and further reduce the identification error.
(2)
Influence of retaining different order modes on the identification effect
The signal used for identification above retains the mode corresponding to the first second order frequency of the response signal. Now for the working condition of a single pylon, the modes corresponding to the first order, the first second order and the first third order frequencies are, respectively, retained during the filtering process. First of all, these filtered signals can basically eliminate the influence of the noise signal, retain the main characteristics of the response signal, and the response width corresponding to the highest-order frequency can basically meet the requirements of standardizing the load, that is, the width of the load is much smaller than the width of the response. The recognition effect is shown in Table 4. The response width corresponding to the high-order frequency decreases and the applicability of standardization becomes worse. As the reserved highest frequency order increases, the recognition effect will decrease to a certain extent, but the overall recognition accuracy can basically meet the engineering requirements.

4.3. Analysis, Prospects and Limitations

Analysis: In this paper, the cantilever beam model and the flat plate test model commonly used in other articles are not used for verifying the proposed method. The test model is designed with reference to the real weapon pylon structure, and the ground impact test is carried out to verify the effectiveness of the proposed method and obtain a high recognition accuracy. The results can better illustrate the effectiveness and robustness of the method. The time-domain information of the response signal is used to identify the impact load, and the signal processing is carried out in the time domain to avoid additional errors introduced by the Fourier transform of the finite signal. The frequency domain figures in this paper are only to demonstrate the effectiveness of the processing method. The standard load and the response signal establish a good mapping relationship, and the impulse of the load can be accurately identified. The identified load will not appear the phenomenon of oscillation at the tail as in other literature. The standard deviation range of each sampling point obtained by statistics can provide a reference threshold for the load carrying capacity of the structure. When establishing the mapping relationship, the response signals commonly used in the literature as well as the spatial position information of the measuring points are considered. A more complete identification model is established.
Prospects: By increasing the number of taps, the accuracy of the recognition can be further improved. Increasing the number of strain gauges in the test to make full use of the spatial position information of the strain gauges is expected to establish a more complete identification model. The model parameters were appropriately adjusted, and the real weapon pylon impact test was further carried out to verify the effectiveness and applicability of the method.
Limitations: The proposed method is suitable for approximately linear structures, and the applicability to nonlinear structures needs further verification. If the interval between two consecutive taps is short and the response of the second tap is significantly affected, the method needs to be further adjusted.

5. Conclusions

(1) Through the theoretical analysis of the vibration response and the characteristics of impact load, a method for standardizing the impact load based on the principle of approximately equal impulse is proposed and the mapping relationship between the impact load and the spatial position of the point, the time-domain response signal and the structural parameters is established.
(2) According to the design test model of a helicopter weapon pylon, determine the position of the strain gauge, carry out the static load calibration test and the impact test.
(3) By analyzing the results of the static load calibration test, it is shown that the weapon pylon model conforms to the linear structural assumption; noise reduction is performed on the response signal of the impact test and the force signal is standardized. The processed signals are used for neural network training, and the recognition accuracy of neural network models under different working conditions all meet the engineering requirements. The average change history of the impact load is obtained by statistical processing, and the identification load is converted back to the original pattern by using the principle of equivalent area and the average change history of the load. In both working conditions, the identification accuracy near the peak value is high. The influence of filter parameter selection on the recognition effect is further analyzed.

Author Contributions

Conceptualization, methodology, software, validation, formal analysis, investigation, resources, data curation, writing—original draft preparation, writing—review and editing, visualization, X.Y., L.C. and D.H.; supervision, project administration, funding acquisition, Y.G. All authors have read and agreed to the published version of the manuscript.

Funding

This research is a project funded by the Nanjing University of Aeronautics and Astronautics: National Key Laboratory of Rotorcraft Aeromechanics (61422202104) and Priority Academic Program Development of Jiangsu Higher Education (PAPD).

Institutional Review Board Statement

Not applicable.

Informed Consent Statement

Not applicable.

Data Availability Statement

Not applicable.

Acknowledgments

Not applicable.

Conflicts of Interest

The authors declare no conflict of interest.

References

  1. Yu, X.Y. The Research On Dynamic Test Technology of Weapon Blast off Recoil for Flying Helicoper. Helicopter Technol. 2006, 51–54. [Google Scholar]
  2. Cheng, W.Z.; Wang, Y.G.; Sun, Y.J.; Zhang, J.H. Identification technique considering nonlinearity of airborne gun recoil. J. Vib. Shock. 2008, 27, 67–70. [Google Scholar]
  3. Zhou, F.; Zhang, S.; Yan, C. Study on calibrating load test and model for missile pylon. Jixie Qiangdu/J. Mech. Strength 2009, 31, 221–224. [Google Scholar]
  4. Zheng, J.H.; Shen, L.; Kou, F.J. Flight Test Investigation of the Pylon Loading for Helicopter. Aeronaut. Sci. Technol. 2016, 27, 60–64. [Google Scholar]
  5. Zhou, P.; Zhang, Q.; Shuai, Z.; Li, W. Review of Research and Development Status of Dynamic Load Identification in Time Domain. Noise Vib. Control. 2014, 34, 6–11. [Google Scholar]
  6. Choi, K.; Chang, F.K. Identification of Impact Force and Location Using Distributed Sensors. Aiaa, J. 1996, 34, 136–142. [Google Scholar] [CrossRef]
  7. Yan, G. Bayesian approach for impact load identification of stiffened composite panel. Inverse Probl. Sci. Eng. 2014, 22, 940–965. [Google Scholar] [CrossRef]
  8. Sun, H.; Büyüköztürk, O. Identification of traffic-induced nodal excitations of truss bridges through heterogeneous data fusion. Smart Mater. Struct. 2015, 24, 075032. [Google Scholar] [CrossRef] [Green Version]
  9. Wang, B.; Ma, J.H.; Wu, Y.P. Application of artificial neural network in prediction of abrasion of rubber composites. Mater. Des. 2013, 49, 802–807. [Google Scholar] [CrossRef]
  10. Wu, Y.-C.; Feng, J.-W. Development and Application of Artificial Neural Network. Wirel. Pers. Commun. 2018, 102, 1645–1656. [Google Scholar] [CrossRef]
  11. Ali, U.; Muhammad, W.; Brahme, A.; Skiba, O.; Inal, K. Application of artificial neural networks in micromechanics for polycrystalline metals. Int. J. Plast. 2019, 120, 205–219. [Google Scholar] [CrossRef]
  12. Shi, J.R.; Ma, Y.Y. Research progress and development of deep learning. Comput. Eng. Appl. 2018, 54, 1–10. [Google Scholar]
  13. Zhang, F.; Zhu, D.M. The Dynamic Load Identification Research Based on Neural Network Model. J. Vib. Eng. 1997, 40–46. [Google Scholar]
  14. Cao, X.; Sugiyama, Y.; Mitsui, Y. Application of artificial neural networks to load identification. Comput. Struct. 1998, 69, 63–78. [Google Scholar] [CrossRef]
  15. Staszewski, W.J.; Worden, K.; Wardle, R.; Tomlinson, G.R. Fail-safe sensor distributions for impact detection in composite materials. Smart Mater. Struct. 2000, 9, 298. [Google Scholar] [CrossRef]
  16. He, F.D.; Shu, C.H. Application of BP Neural Networks Based on Bayesian Regularization to Aircraft Wing Loads Analysis. Flight Dyn. 2009, 27, 85–88. [Google Scholar]
  17. Cao, S.C.; Yin, Z.P.; Huang, Q.Q.; Kai-Chao, M.A. Development of a Parametric Flight loads Identification Method using Genetic Improved BP Neural Networks. Aeronaut. Comput. Technol. 2013. [Google Scholar]
  18. Samson, B.C.; Dimaio, D. Static load estimation using artificial neural network: Application on a wing rib. Adv. Eng. Softw. 2018, 125, 113–125. [Google Scholar]
  19. Chen, G.R.; Li, T.G.; Chen, Q.J.; Ren, S.F.; Wang, C.; Li, S.F. Application of deep learning neural network to identify collision load conditions based on permanent plastic deformation of shell structures. Comput. Mech. 2019, 64, 435–449. [Google Scholar] [CrossRef]
  20. Zhou, J.M.; Dong, L.; Guan, W.; Yan, J. Impact load identification of nonlinear structures using deep Recurrent Neural Network. Mech. Syst. Signal Processing 2019, 133, 106292. [Google Scholar] [CrossRef]
  21. Chen, Q.; An, Y. Wing load identification based on neural network. China High New Technol. 2020, 54–55. [Google Scholar]
  22. Xia, P.; Yang, T.; Xu, J.; Wang, L.; Yang, Z. Reversed time sequence dynamic load identification method using time delay neural network. Acta Aeronaut. Astronaut. Sin. 2021, 42, 224452. [Google Scholar] [CrossRef]
  23. Feng, T.; Duan, A.; Guo, L.; Gao, H.; Chen, T.; Yu, Y. Deep learning based load and position identification of complex structure. In Proceedings of the 2021 IEEE 16th Conference on Industrial Electronics and Applications (ICIEA), Chengdu, China, 1–4 August 2021; pp. 1358–1363. [Google Scholar]
  24. Wang, L.J.; Liu, Y.; Xie, Y.X.; Chen, B.J. Impact load identification of composite laminated cylindrical shell with stochastic characteristic. Arch. Appl. Mech. 2022, 92, 1397–1411. [Google Scholar] [CrossRef]
  25. Cheng, G. Research on Load Identification Based on Parameter Optimized BP Neural Networks of Double Span Rotor System. Master’s Thesis, Taiyuan University Of Technology, Taiyuan, China, 2018. [Google Scholar]
Figure 1. Test model of weapon pylon.
Aerospace 09 00388 g001
Figure 2. Coordinate system and strain gauge layout. (a) Single pylon test model (b) double pylon test model.
Aerospace 09 00388 g002
Figure 3. Impact load test system of weapon pylon.
Aerospace 09 00388 g003
Figure 4. Test of single pylon.
Aerospace 09 00388 g004
Figure 5. Static load calibration process of single pylon.
Aerospace 09 00388 g005
Figure 6. The static load–strain relationship of single pylon.
Aerospace 09 00388 g006
Figure 7. The static load–strain relationship of double pylon.
Aerospace 09 00388 g007
Figure 8. Time-domain noise signal.
Aerospace 09 00388 g008
Figure 9. Frequency-domain noise signal.
Aerospace 09 00388 g009
Figure 10. Time-domain response signal.
Aerospace 09 00388 g010
Figure 11. Frequency-domain response signal.
Aerospace 09 00388 g011
Figure 12. Filtered time-domain signal.
Aerospace 09 00388 g012
Figure 13. Filtered frequency-domain signal.
Aerospace 09 00388 g013
Figure 14. A certain impact load in the test.
Aerospace 09 00388 g014
Figure 15. Standard load in symmetric triangular form.
Aerospace 09 00388 g015
Figure 16. Mapping relationship between response signal and standard load.
Aerospace 09 00388 g016
Figure 17. Neural network structure.
Aerospace 09 00388 g017
Figure 18. Normalized average time history of impact load.
Aerospace 09 00388 g018
Figure 19. Impact load identification effect in standardized pattern of two working conditions. (a) Single pylon. (b) Double pylon.
Aerospace 09 00388 g019
Figure 20. Impact load identification effect in original pattern of two working conditions. (a) Single pylon. (b) Double pylon.
Aerospace 09 00388 g020
Table 1. Coordinates of strain gauge.
S1S2S3S4
Coordinates/mm(10, −14, 0)(51.6, −17.2, −13.8)(0, −14, 90.15)(74.6, −5.2, 71.5)
Table 2. Coordinates of striking point.
F
Coordinates/mm(617.6, −59.8, −156.2)
Table 3. Identification effect of different working conditions.
Working ConditionData (Group)Maximum Relative Error
Single pylon5277.21%
Double pylon4596.93%
Table 4. Influence of retaining different order modes on the identification effect.
ModeFirst OrderFirst Second OrderFirst Third Order
Maximum relative error6.05%7.21%8.76%
Publisher’s Note: MDPI stays neutral with regard to jurisdictional claims in published maps and institutional affiliations.

