1. Introduction
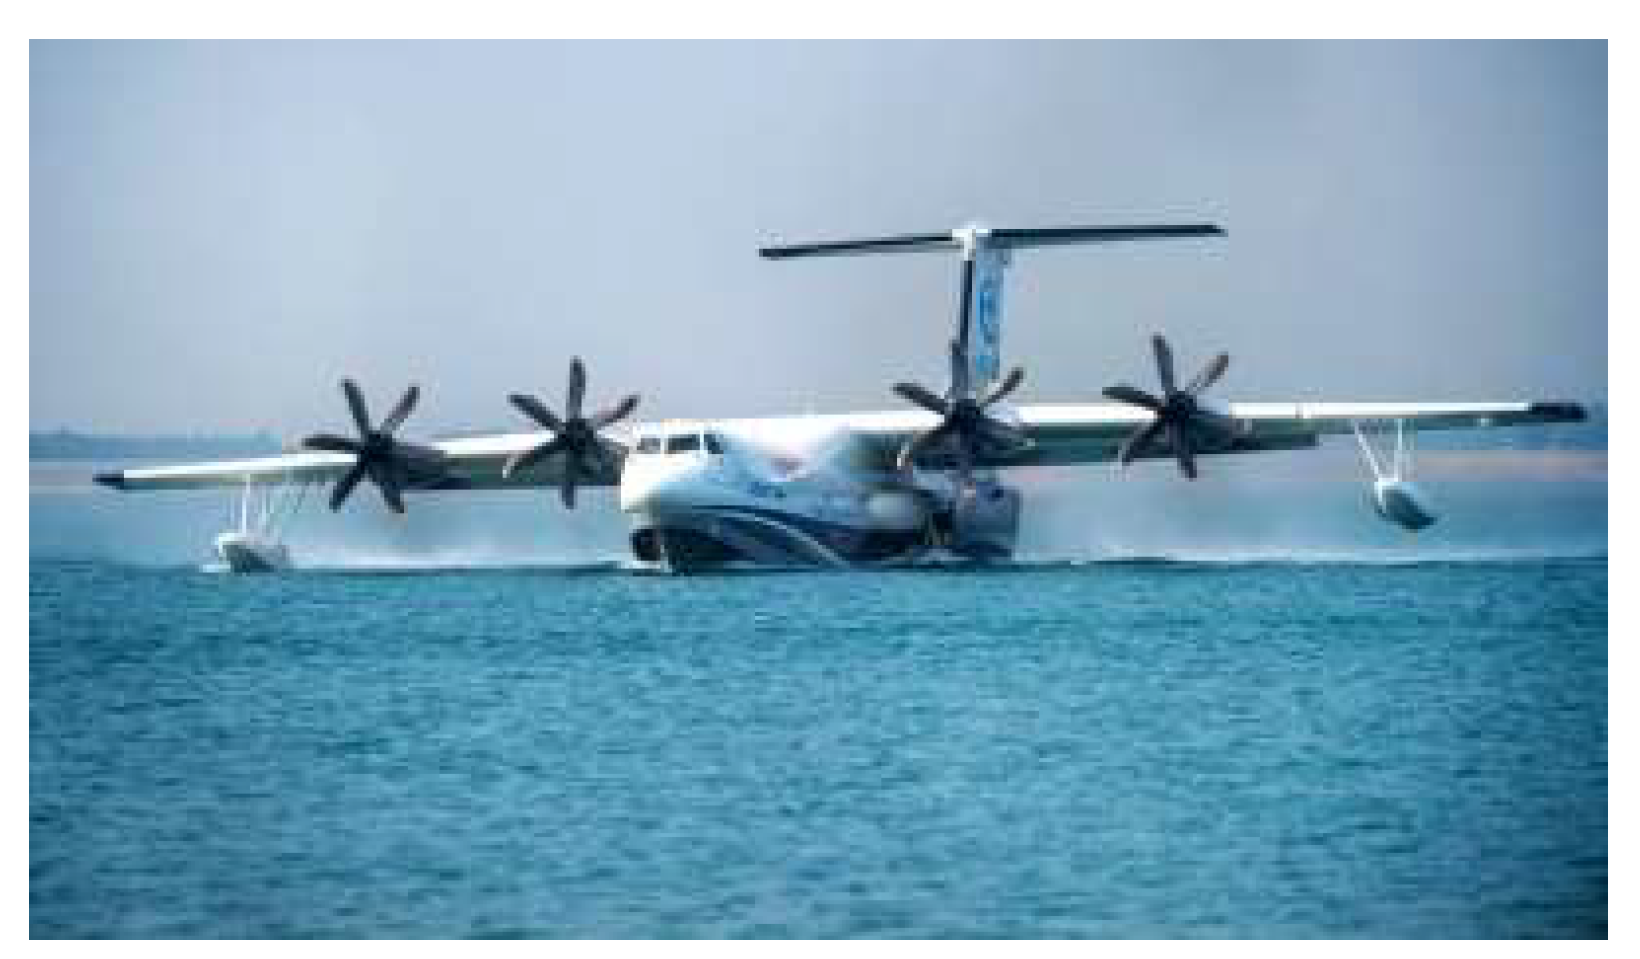
An amphibious aircraft is an aircraft that can take off and land on both land and water. It can adapt to two different environments, i.e., the water and the air.
Figure 1 shows an amphibious aircraft taking off from water. Generally, there are two types of hull and pontoon [
1]. When an amphibious aircraft is operating on the water, the lower part of the fuselage is immersed in water. Because the landing gear compartment is non-watertight, the water enters the compartment through the joints of the compartment cover, and the landing gear and wheels are immersed in the water, with the surface being wetted by water. When an amphibious aircraft operates in a low-temperature environment or takes off from a water surface into a high altitude, the liquid water freezes on the surface of structures at low temperatures, and icing poses a threat to the flight safety of aircraft [
2]. Aircraft landing gear can use anti-icing or deicing facilities in key parts to eliminate the effect of icing on the retractable performance of the landing gear. Since the wheels are movable parts, it is difficult to directly install anti-icing or deicing devices on them.
The icing of wheels brings risks to the flight of amphibious aircraft. The statistics of the American Safety Advisor from 1990 to 2000 show that the flight accidents caused by icing accounted for 12% of all flight accidents caused by meteorological factors [
3]. When the liquid water attached to the wheels freezes, it may freeze together with the searchlight line, hydraulic actuator, and brake system pipeline in the landing gear compartment, and cause mechanical damage to the above pipeline when the landing gear is retracted and the wheels are forced to rotate, resulting in the serious consequences of circuit breaking and pipeline damage; when the aircraft lands, the ice frozen in the tire crown touches the ground first, and the friction between the ice and the ground is much lower than the friction between the wheels and the ground, and it skids and even rushes out of the runway; the compressive strength of freshwater ice can reach 4.47 MPa [
4]. The moment the wheels touch the ground when the aircraft is landing, the ice attached to the tire crown is squeezed and impacted by the ground and the tire crown, and the resulting debris may cause damage to the surface of the wheels. Damage such as splits and punctures shorten the service life of wheels and cause the wheels to be scrapped ahead of time.
In order to avoid the possible adverse effects of wheel icing, reasonable anti-icing and deicing methods can be used. Therefore, it is necessary to study the adhesion shear strength of tire icing as a basis for selecting wheel anti-icing methods. In addition, aircraft tire materials are mainly vulcanized rubber made from different vulcanization processes. The adhesion shear strength of the tire material under severe low temperature conditions can be obtained through studies. Besides, when simulating the landing state of the aircraft with iced wheels through simulation analysis, it is necessary to consider the constitutive parameters of adhesion shear strength under static icing to obtain more accurate simulation results.
The ice adhesion shear strength is the force between the ice and the substrate, mainly in the direction of shear. There are two kinds of icing between ice and substrate, i.e., impact icing, which usually freezes under ice wind tunnel conditions and its adhesion is measured; in-mold icing, that is, water freezes with a static state in a mold. At present, the research on the ice adhesion shear strength is relatively extensive, mainly focusing on two aspects, the ice adhesion mechanism and the influencing factors of the ice adhesion shear strength.
In the aspect of the ice-adhesion mechanism, the influences of the contact angle, surface roughness, rolling angle, receding angle, and surface microstructure of the substrate on the ice adhesion shear strength are mainly studied. Fortin et al. [
5] proposed a model to explain the mechanism of ice adhesion. The model was based on the water behavior before and after freezing, the roughness of the substrate, and the ice type during the dynamic icing process, which could predict the cohesive failure of ice. However, the model is not perfect and more in-depth research is needed to quantify physical parameters. Chen et al. [
6] prepared silicone rubber materials with different microstructures. After laser treatment, tiny gaps were processed on the surface of the silicone rubber. This caused the existence of air between the surface of the silicone rubber and the ice layer, and the adhesion shear strength of icing was small. Jin et al. [
7] used aluminum to prepare anti-icing materials with super-hydrophobic surfaces and studied the static icing process of samples with different contact angles. It was found that the freezing time of water droplets on superhydrophobic surfaces was much longer than that on other surfaces, and the contact area between water droplets and the surface of superhydrophobic materials was much smaller than other surfaces. Yang et al. [
8] studied the adhesion strength and static and dynamic water contact angles of fluoropolymers, including fluorinated room temperature vulcanized silicone rubber coatings. The results showed that the fluoropolymers with a smooth surface could significantly reduce the ice adhesion strength, but the anti-icing effect was not obvious when the temperature was lower than −8 °C. Jellinek et al. [
9] studied the ice adhesion strength of concrete slabs and smooth aluminum slabs. At −10 °C, the adhesion strength of ice adhering to the aluminum slab surface could reach 0.556 ± 0.108 MPa. Meuler et al. [
10] investigated the relationship between the strength of ice adhesion on steel disks and the water contact angle and found that the average strength of ice adhesion had a strong correlation with the adhesion scaling parameter of liquid water. Wang et al. [
11] studied the ice adhesion strength on aluminum surfaces, and found through experiments that the microstructured superhydrophobic aluminum surface could reduce the adhesion strength. Ronneberg et al. [
12] tested the ice adhesion strength at −10 °C and −18 °C using centrifugation and vertical shear methods, confirming that ice formation is a key parameter of the ice adhesion mechanism.
The main influencing factors of adhesion shear strength under static icing are freezing temperature, salinity, and substrate surface roughness. Makkonen [
13] systematically proposed the concept and model for estimating ice adhesion, and discussed the influence of freezing temperature, ice salinity, and substrate material properties on ice adhesion. Hohne et al. [
14] studied the adhesion shear strength of icing on the surface of different chemical groups, and explored the influence of water quality on the adhesion shear strength. They found that a small amount of impurities in the water could have a significant impact on the adhesion shear strength. Andersson et al. [
15] studied the adhesion shear strength between ice and rubber, and tested the surface wettability and adhesion shear strength of different rubber materials. For water contact angles below 90°, the adhesion shear strength decreased linearly with the increase of the contact angle, and when the contact angle exceeded 90°, the adhesion shear strength remained almost unchanged. In addition, they also found that the high surface energy additives in the substrate could significantly improve the adhesion shear strength. Roberts [
16] studied the contact phenomenon of rubber and found that the adhesion of ice to rubber depended on the salinity of the ice. Tetteh et al. [
17] used centrifugal and push methods to study the adhesion shear strength of static ice and impact ice. The experimental results showed that factors such as material surface wettability, roughness, and temperature all affect the adhesion shear strength. Adhesive shear strength decreased for high receding angles and soft material surfaces. Dong et al. [
18] explored the factors of the ice adhesion strength, and the experimental results showed that the surface roughness was nonlinear with the ice adhesion strength. The adhesive shear strength increased with decreasing temperature, but tended to stabilize when the temperature was lower than −20 °C. Using a new centrifugation method, Boinovich et al. [
19] investigated the ice adhesion strength, and the results showed that the ice adhesion strength of superhydrophobic surfaces and SLIPS was closely related to temperature, and the degradation of anti-icing performance had a significant effect on the ice adhesion strength.
Existing research mainly involves the adhesion and shear strength of metals, superhydrophobic coatings, polymer films, silicone rubber, etc., and there is a lack of systematic research on the icing of amphibious aircraft tires. In view of this, this paper explores the effects of freezing temperature and the salinity of freezing water samples on the adhesion shear strength of tires through experiments. The experimental results are analyzed and discussed.
2. The Relationship between Adhesion Shear Strength and Freezing Temperature
When an amphibious aircraft is taking off from and landing on seawater, the water in the landing gear compartment will cause the seawater to freeze on the wheels. To formulate a reasonable anti-icing and deicing method and provide the necessary constitutive parameters for the simulation analysis, this paper investigates the influencing factors of adhesion shear strength of amphibious aircraft tires under static icing. The effects of freezing temperature and salinity of icing water samples are mainly explored. In this section, the influence of freezing temperature is studied, and the experiments in Dalian, Qingdao, Fuzhou, and Zhuhai are selected for exploration.
2.1. Principle of the Experiment
There are various methods for the measurement of icing adhesion strength in existing research, including but not limited to the centrifugal method, push-pull method, and so on [
20,
21,
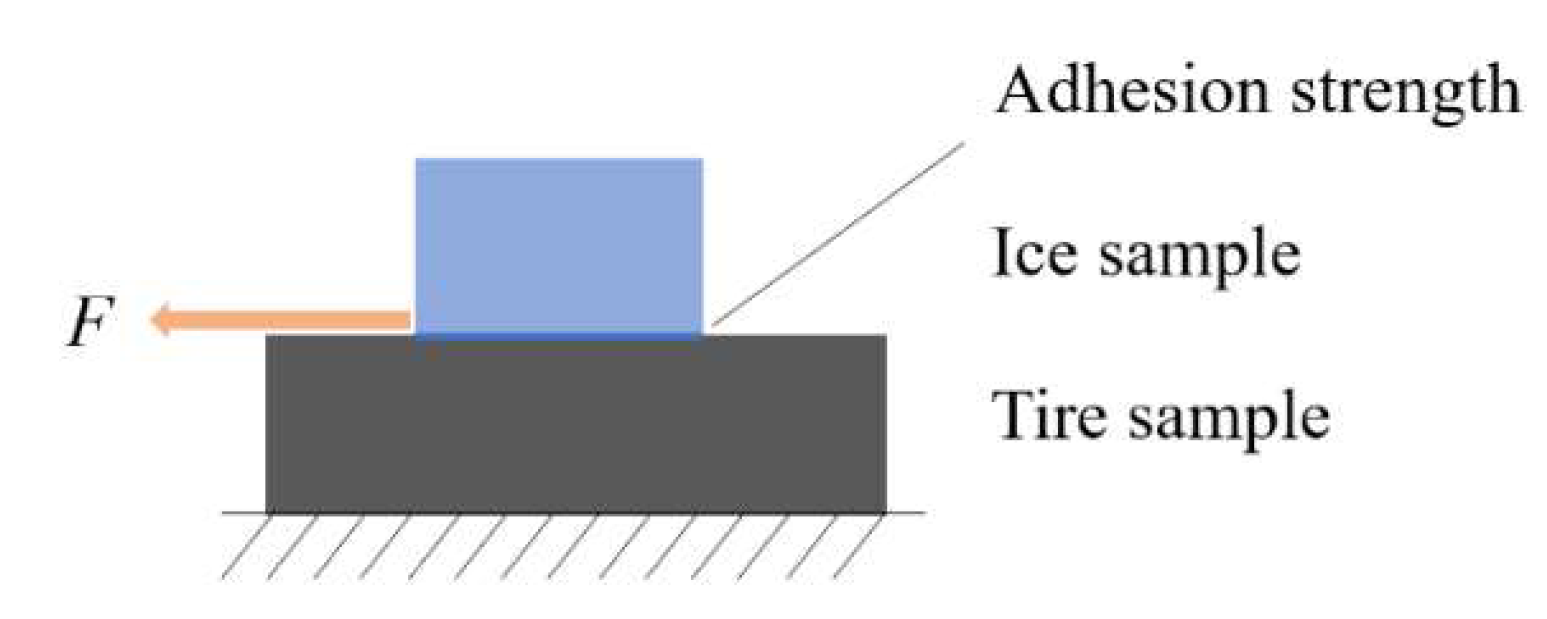
22]. In this study, the push-pull method is used for experiments. When liquid water freezes on the surface of the tire substrate, there is an adhesion layer at the interface of the ice-tire substrate. Either the tire substrate or ice is fixed, and a pulling force parallel to the adhesive layer is applied to the other. Under the action of pulling force, shear stress is generated at the interface of ice and tire substrate. When the shear stress is greater than the adhesion shear strength at the ice-tire substrate interface, the adhesion layer will undergo shear failure. According to the tensile force
F at the time of failure, the adhesion shear strength can be calculated by:
where
A is the adhesion area of ice on the surface of the tire substrate.
In the experiment, to avoid the force perpendicular to the adhesion layer during loading, the tensile force was loaded close to the ice-tire substrate interface.
Figure 2 shows the mechanical model for the adhesion shear strength in this study. Considering that ice may crack or even damage itself because of concentrated stress at low temperatures, ice is frozen in a ring-shaped icing mold. When loading, the tensile force is applied to the position where the bottom end of the ring-shaped icing mold contacts the tire substrate to avoid the influence of normal stress. The experiment is susceptible to temperature fluctuations. To strictly control the temperature during the experiment, the entire experiment should be completed in a high and low temperature environment test box.
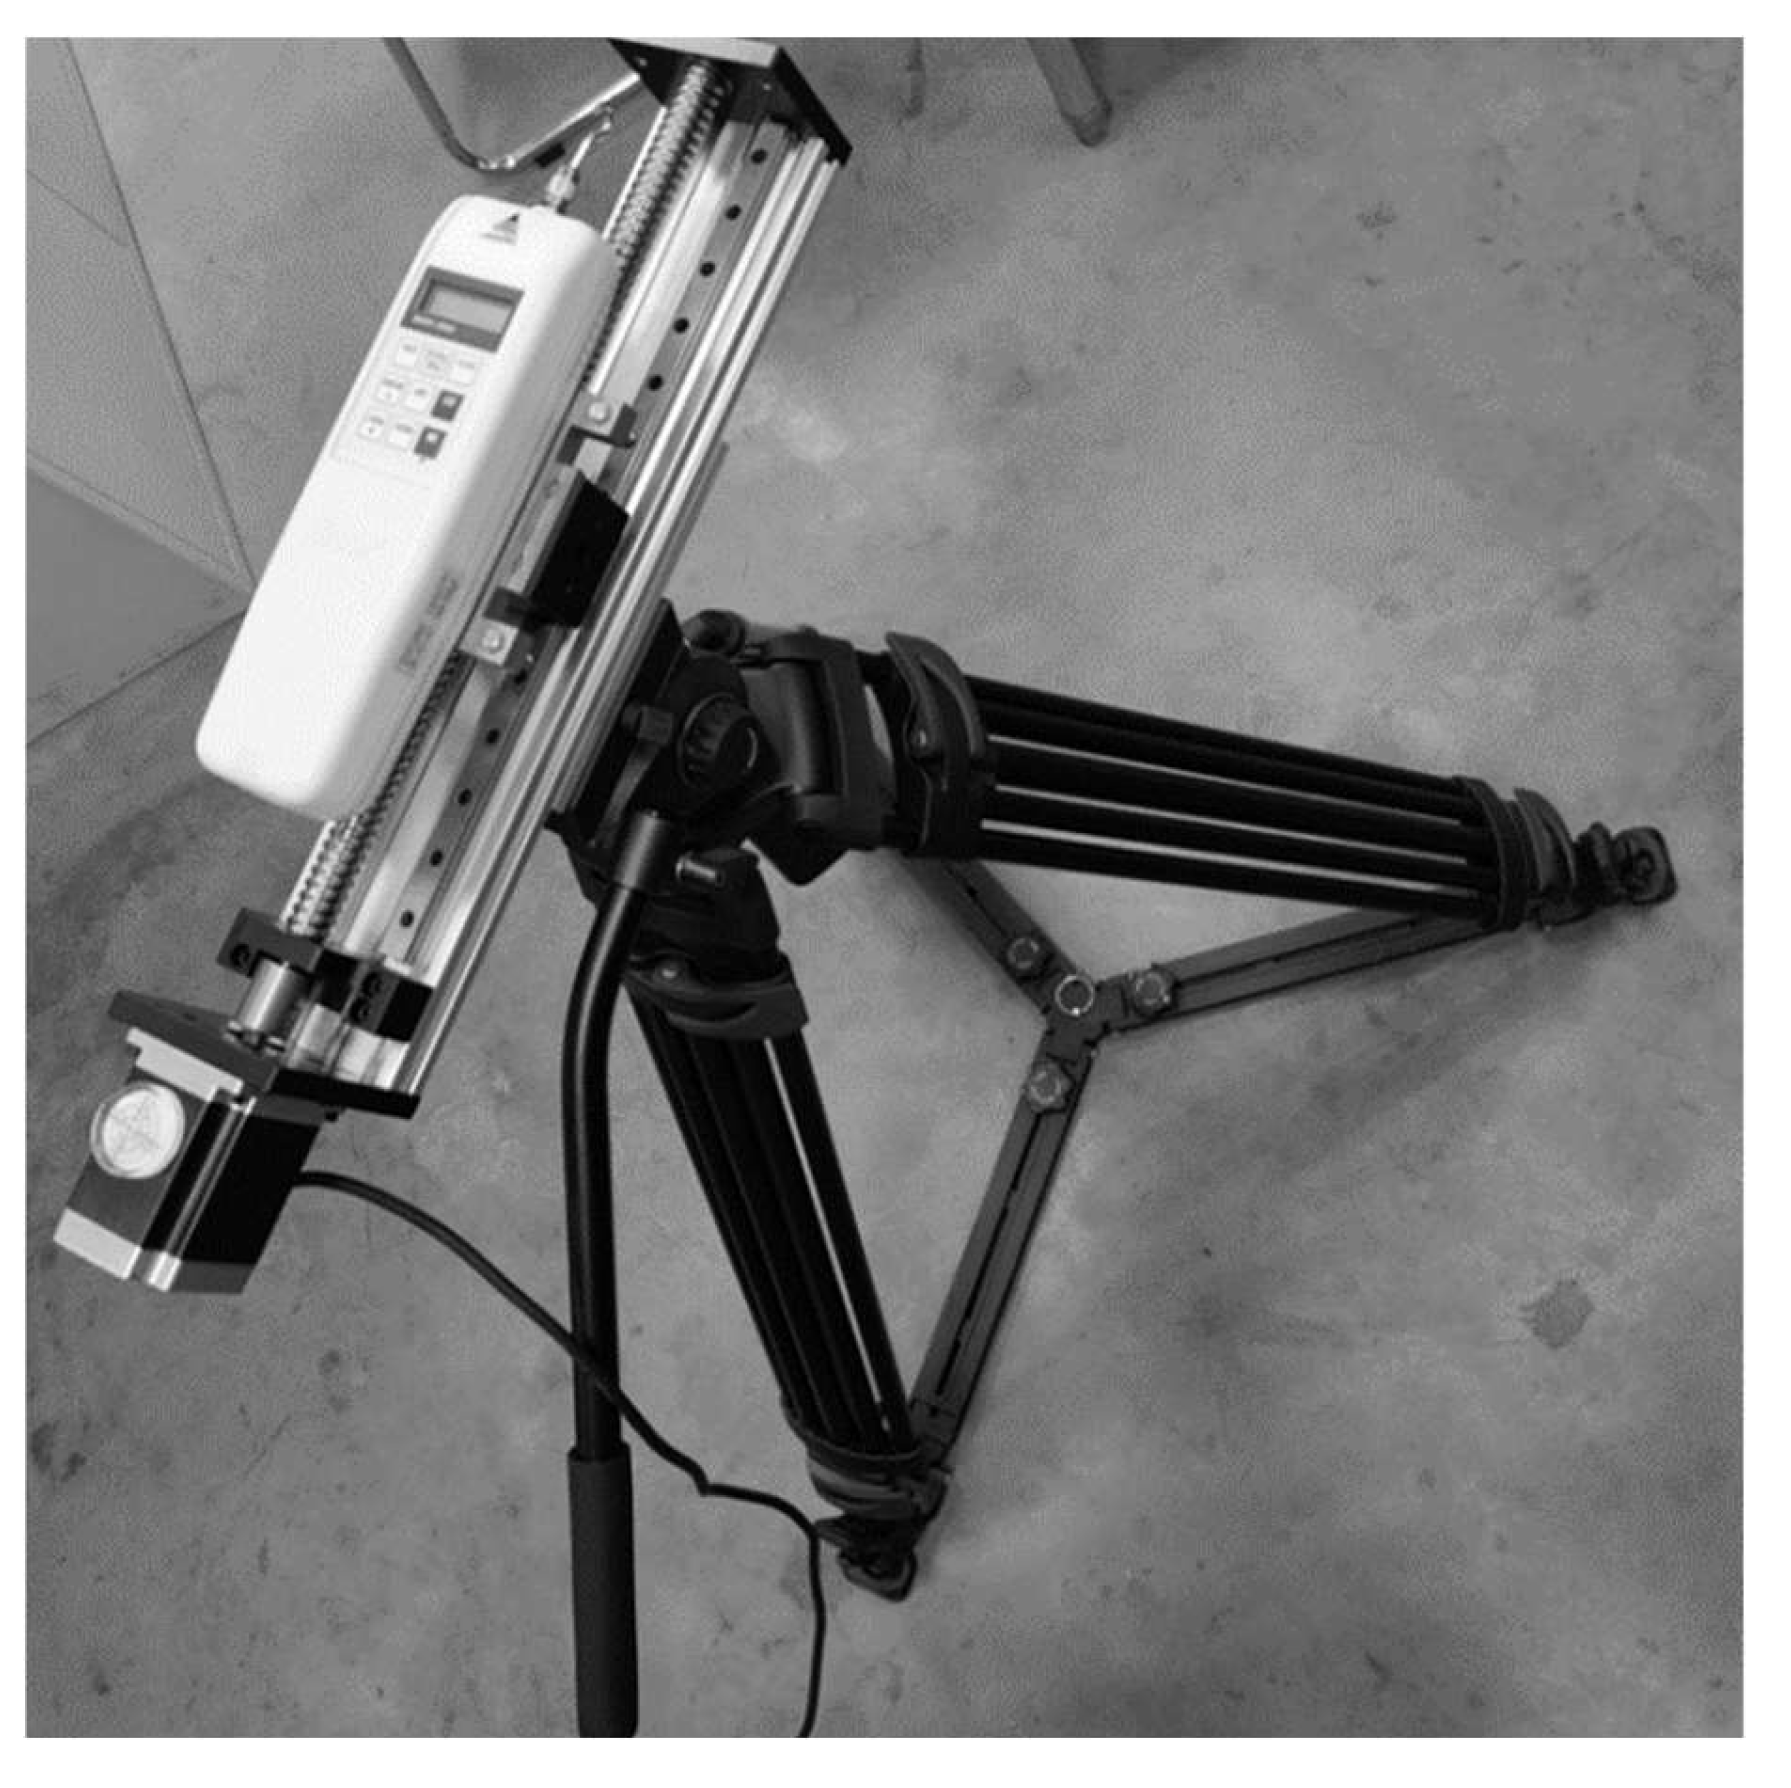
2.2. Experimental Device
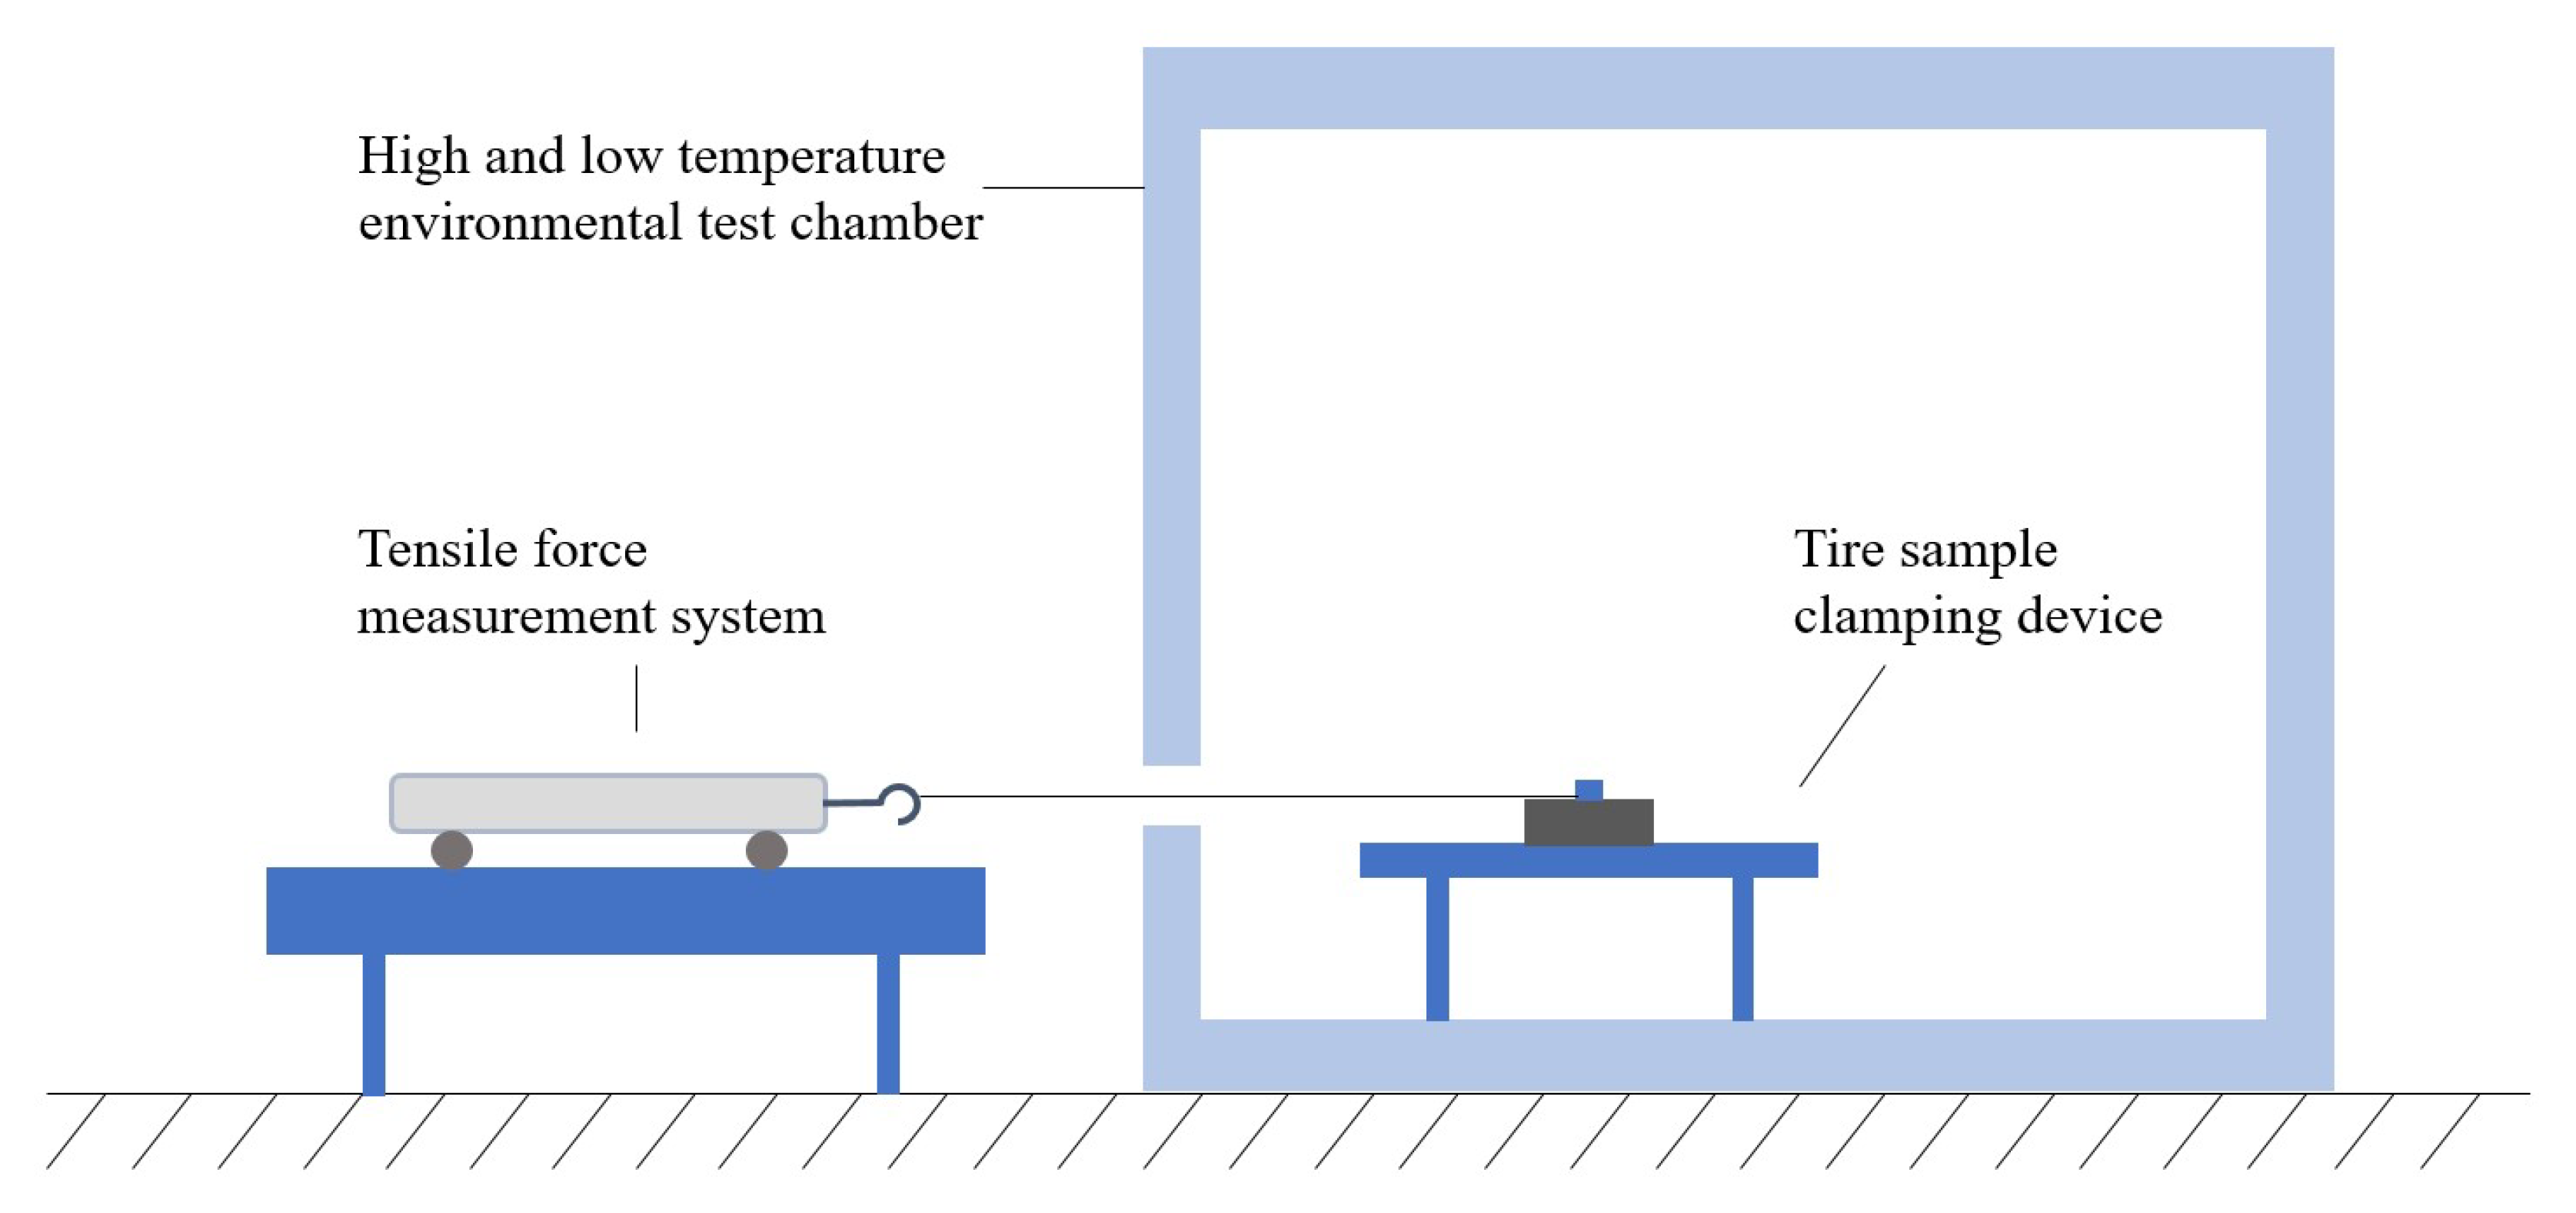
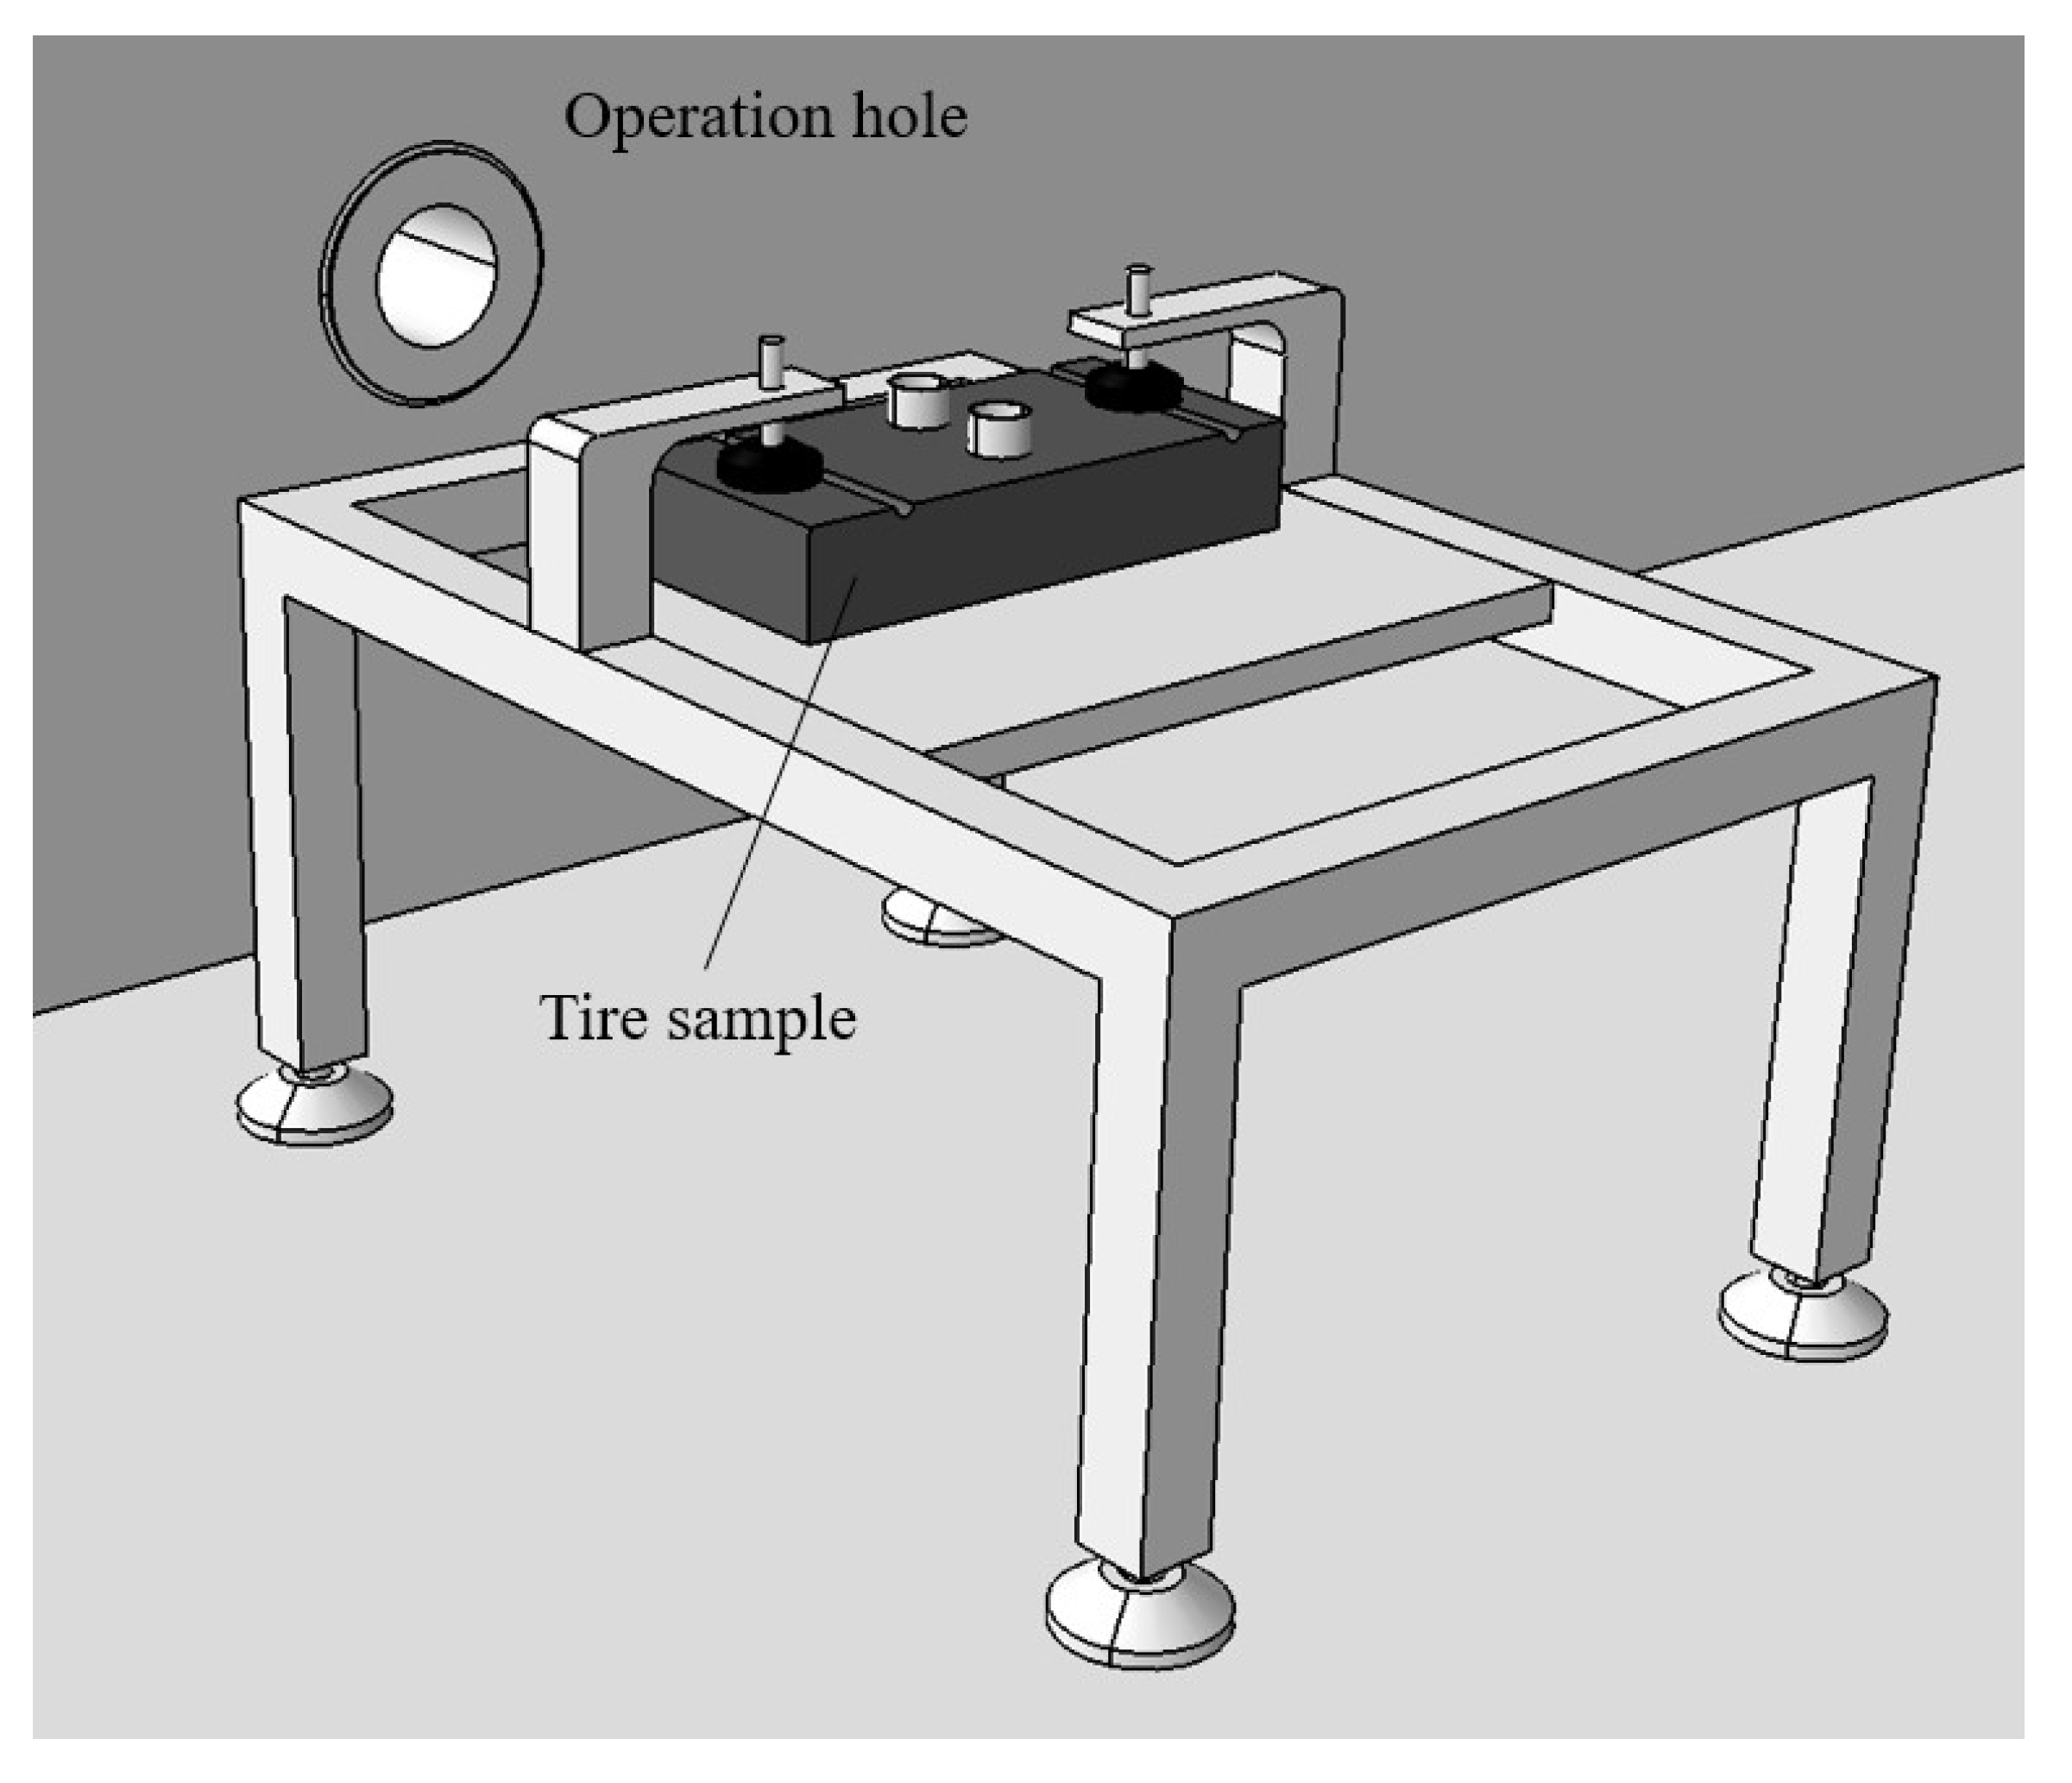
Based on the above experimental principles, an experimental device was built for measuring the adhesion shear strength of amphibious aircraft tires under static icing. The device could directly measure adhesion shear strength in a high and low temperature environment test box. This device was composed of a high and low temperature environment test box, a tire-sample-clamping device located in the test box, and a tensile-force measurement system located outside the test box. The adhesion shear strength of the tire sample in the test box was measured by the tensile force measurement system through the operation hole on the side wall of the test box, as shown in
Figure 3,
Figure 4, and
Figure 5.
Figure 3 was the schematic diagram of the experimental device,
Figure 4 was the tire sample clamping device, and
Figure 5 was the measurement system.
The test box provided the low temperature environment required for the experiment and maintained the stability of its internal temperature field. The temperature of the test box was calibrated before the experiment. After measurement, the temperature error in the test box was ≤±1 °C, which met the requirements. The tire-sample-clamping device in the test box played the role of fixing the tire sample during the experiment. For the tensile-force measurement system outside the test box, the screw slide table was driven by a stepping motor to exert load. The loading rate was adjustable at a uniform speed, with the range of the tension sensor being 0–500 N and an accuracy of ±0.2% Full Scale (FS). The tension sensor was calibrated with a standard weight before the experiment.
2.3. Preparation of Experimental Materials
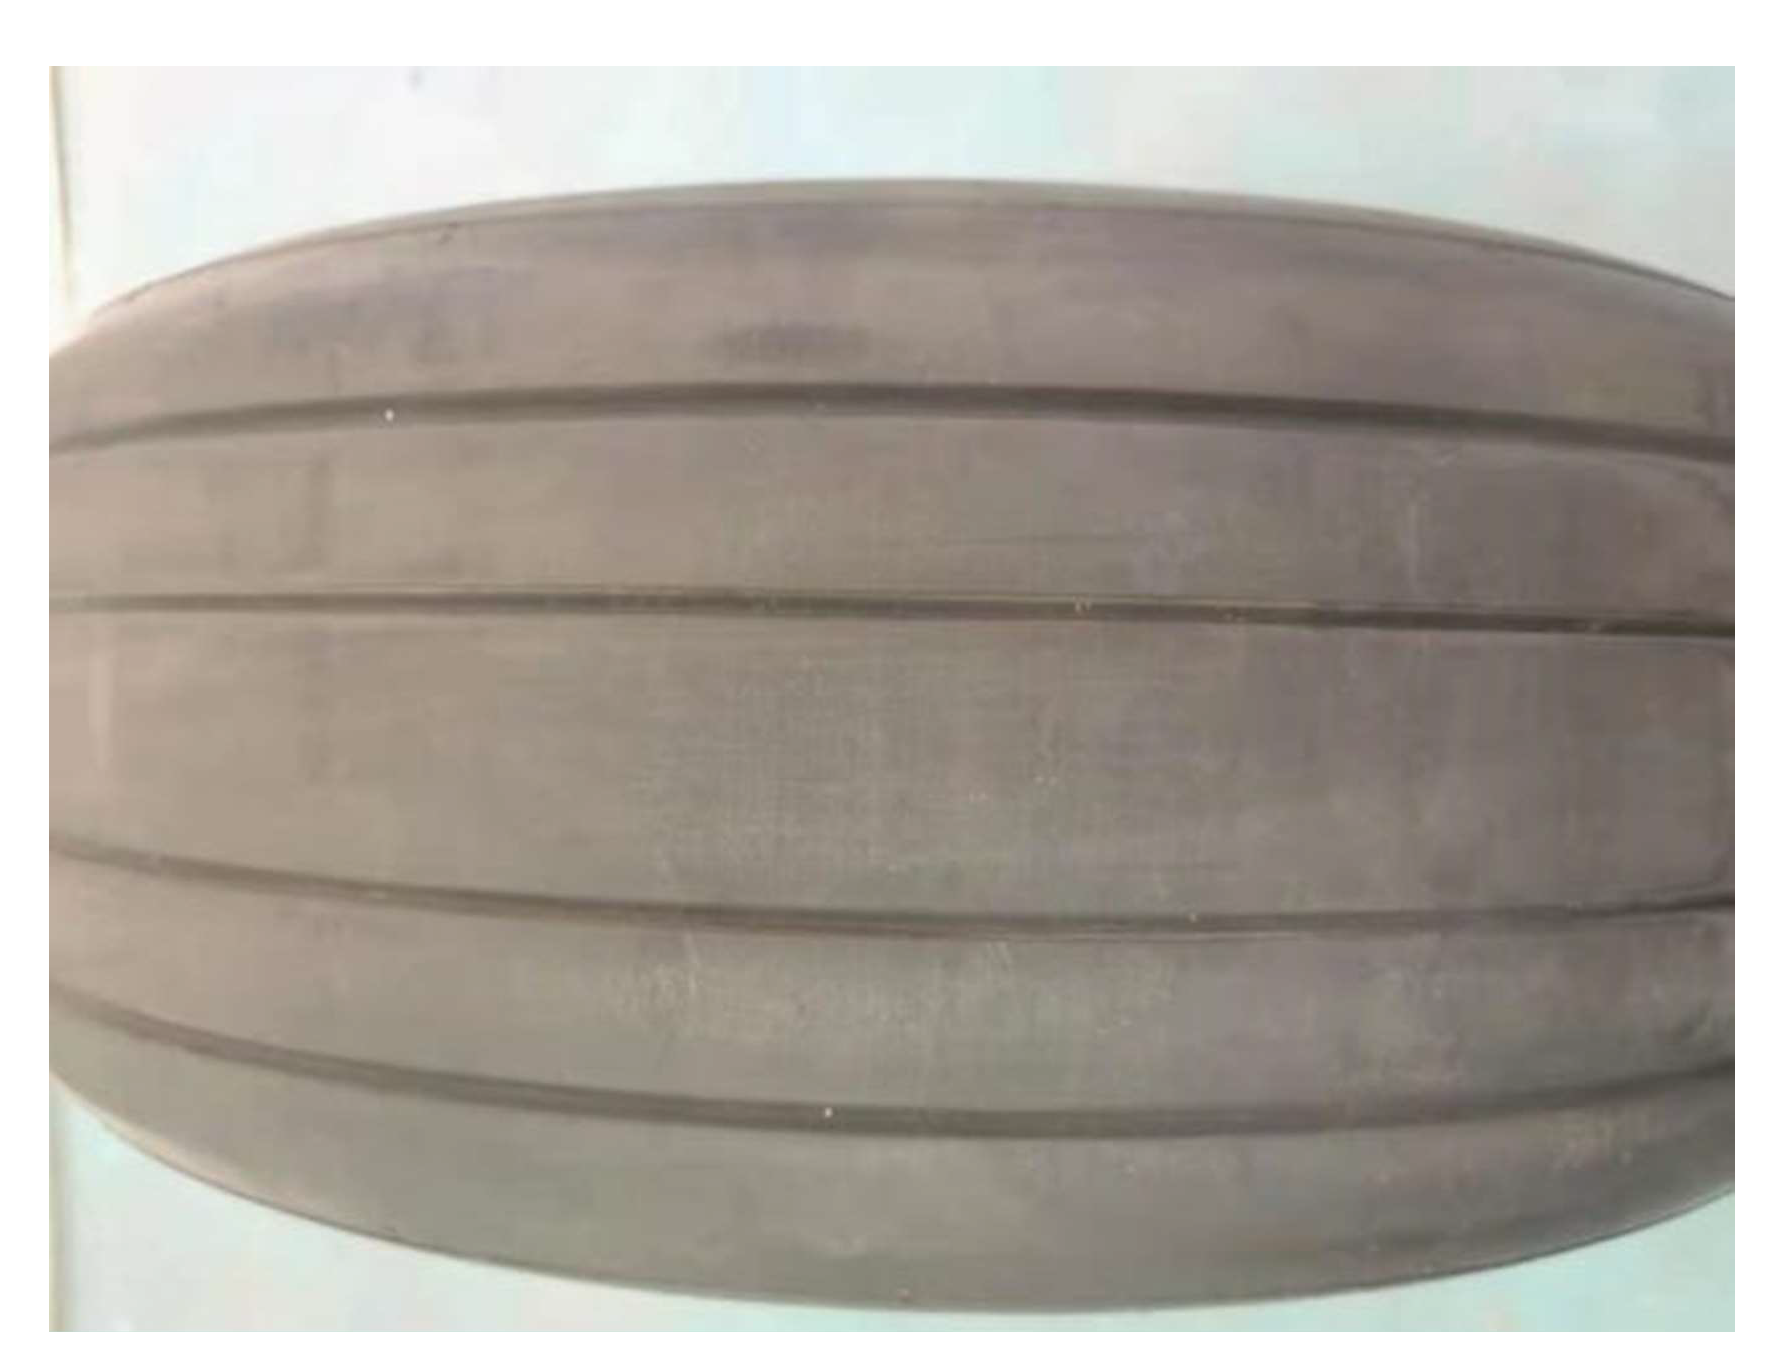
2.3.1. Tire Samples
The tire samples used in the experiment came from the tires normally used by the amphibious aircraft, as shown in
Figure 6. The crown of the tire had traces of wear left by normal use. The sample was taken from the crown of the tire and cut into long strips for testing. The range of the surface roughness of the tire material is obtained: 0.05~0.1 mm.
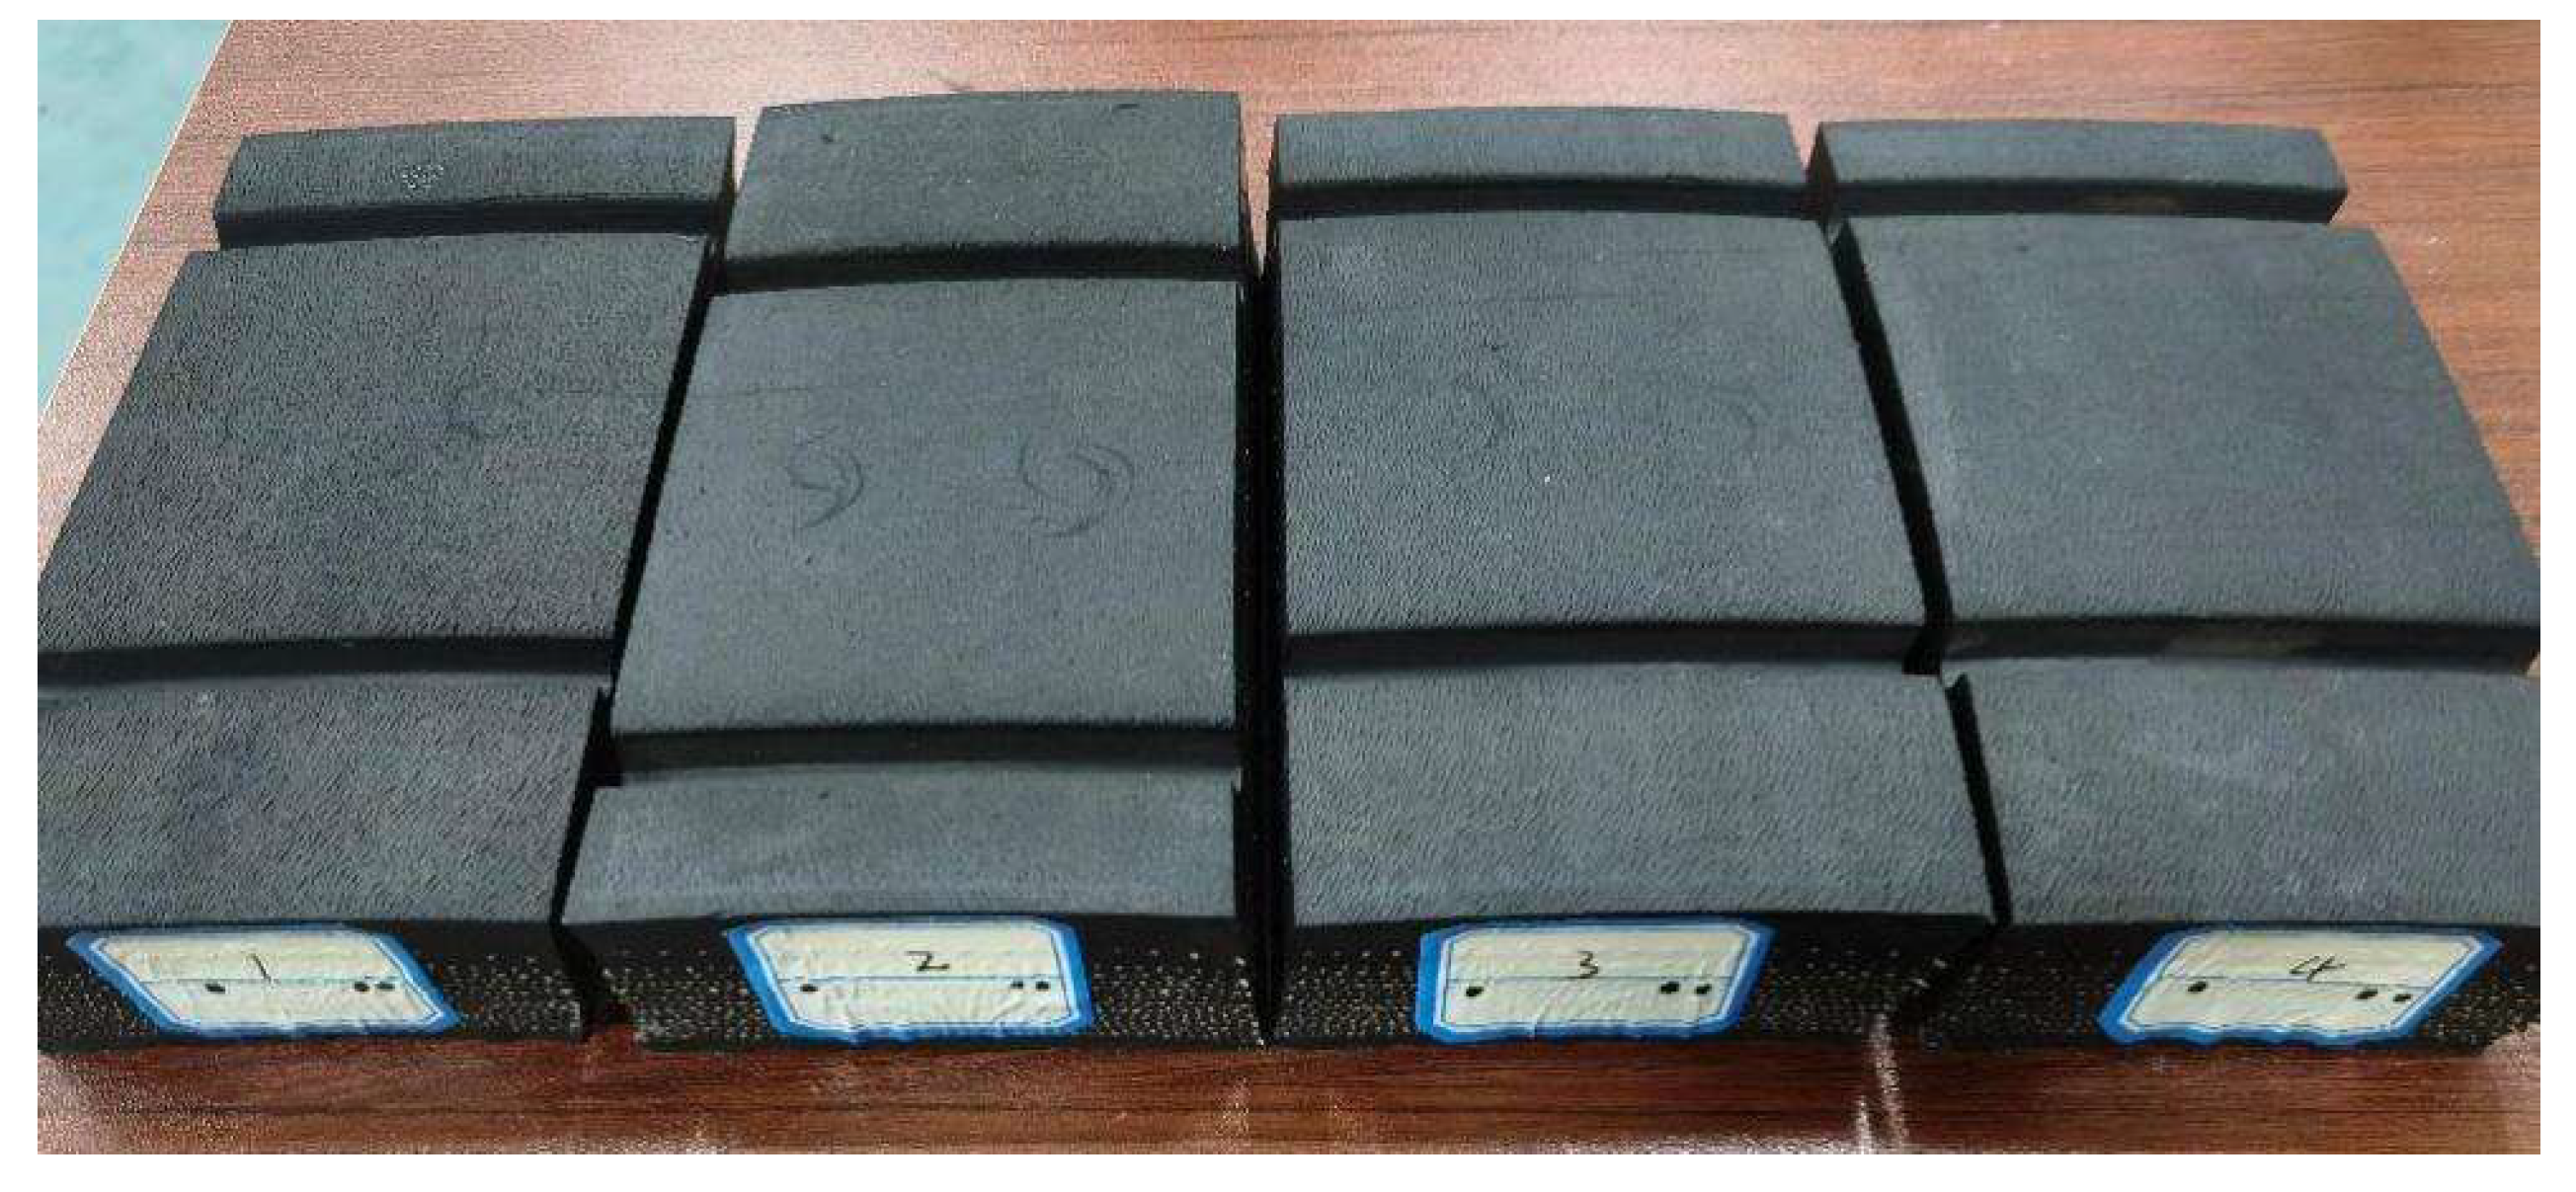
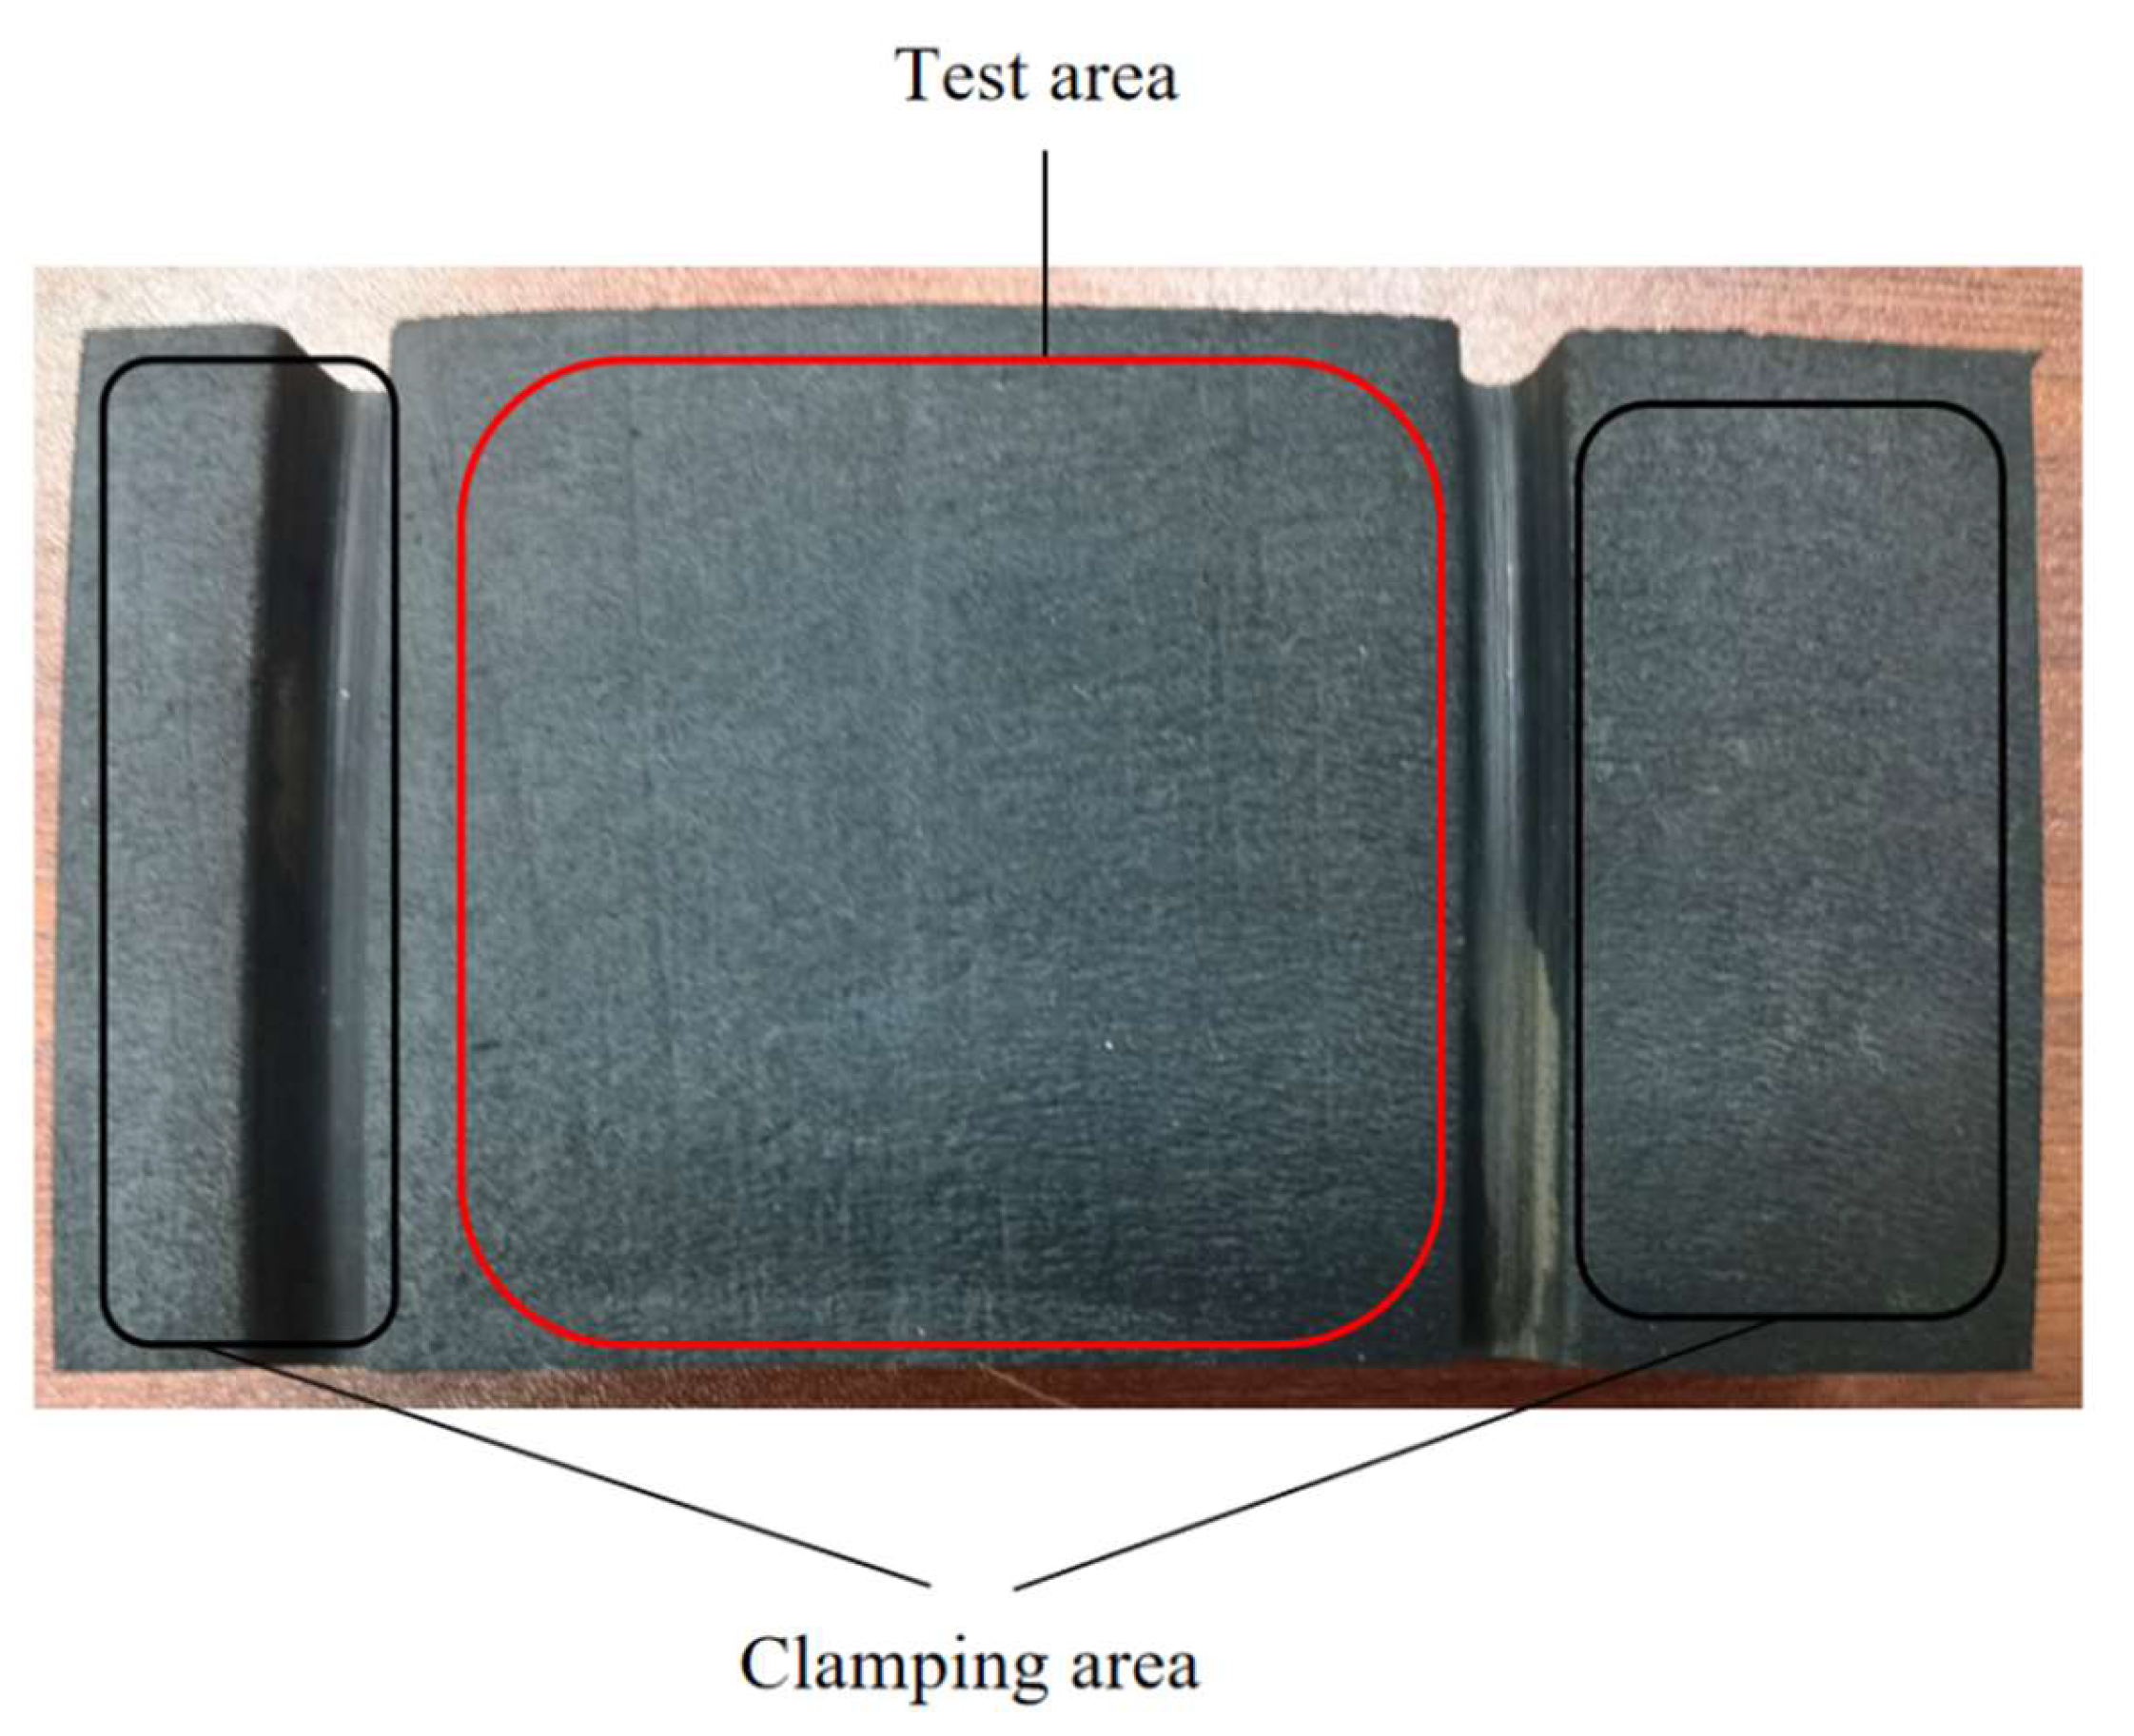
Figure 7 and
Figure 8 show the prepared tire samples.
2.3.2. Seawater Sample
Four kinds of seawater samples were used in the experiment, all collected from the sea areas near Dalian, Qingdao, Fuzhou, and Zhuhai. After the seawater samples were collected, they were filtered with filter paper and then stored in a 4 °C refrigerator for subsequent use. The salinity of the four seawater samples was measured with a salinometer and recorded in
Table 1. And the model of the salinometer is SMART SENSOR AR-8012 (Walfront, Toronto, ON, Canada), the range is 0.00 ppt~9.99 ppt, 10.0~50.0 ppt, and the accuracy is ±3% FS + 1 dig.
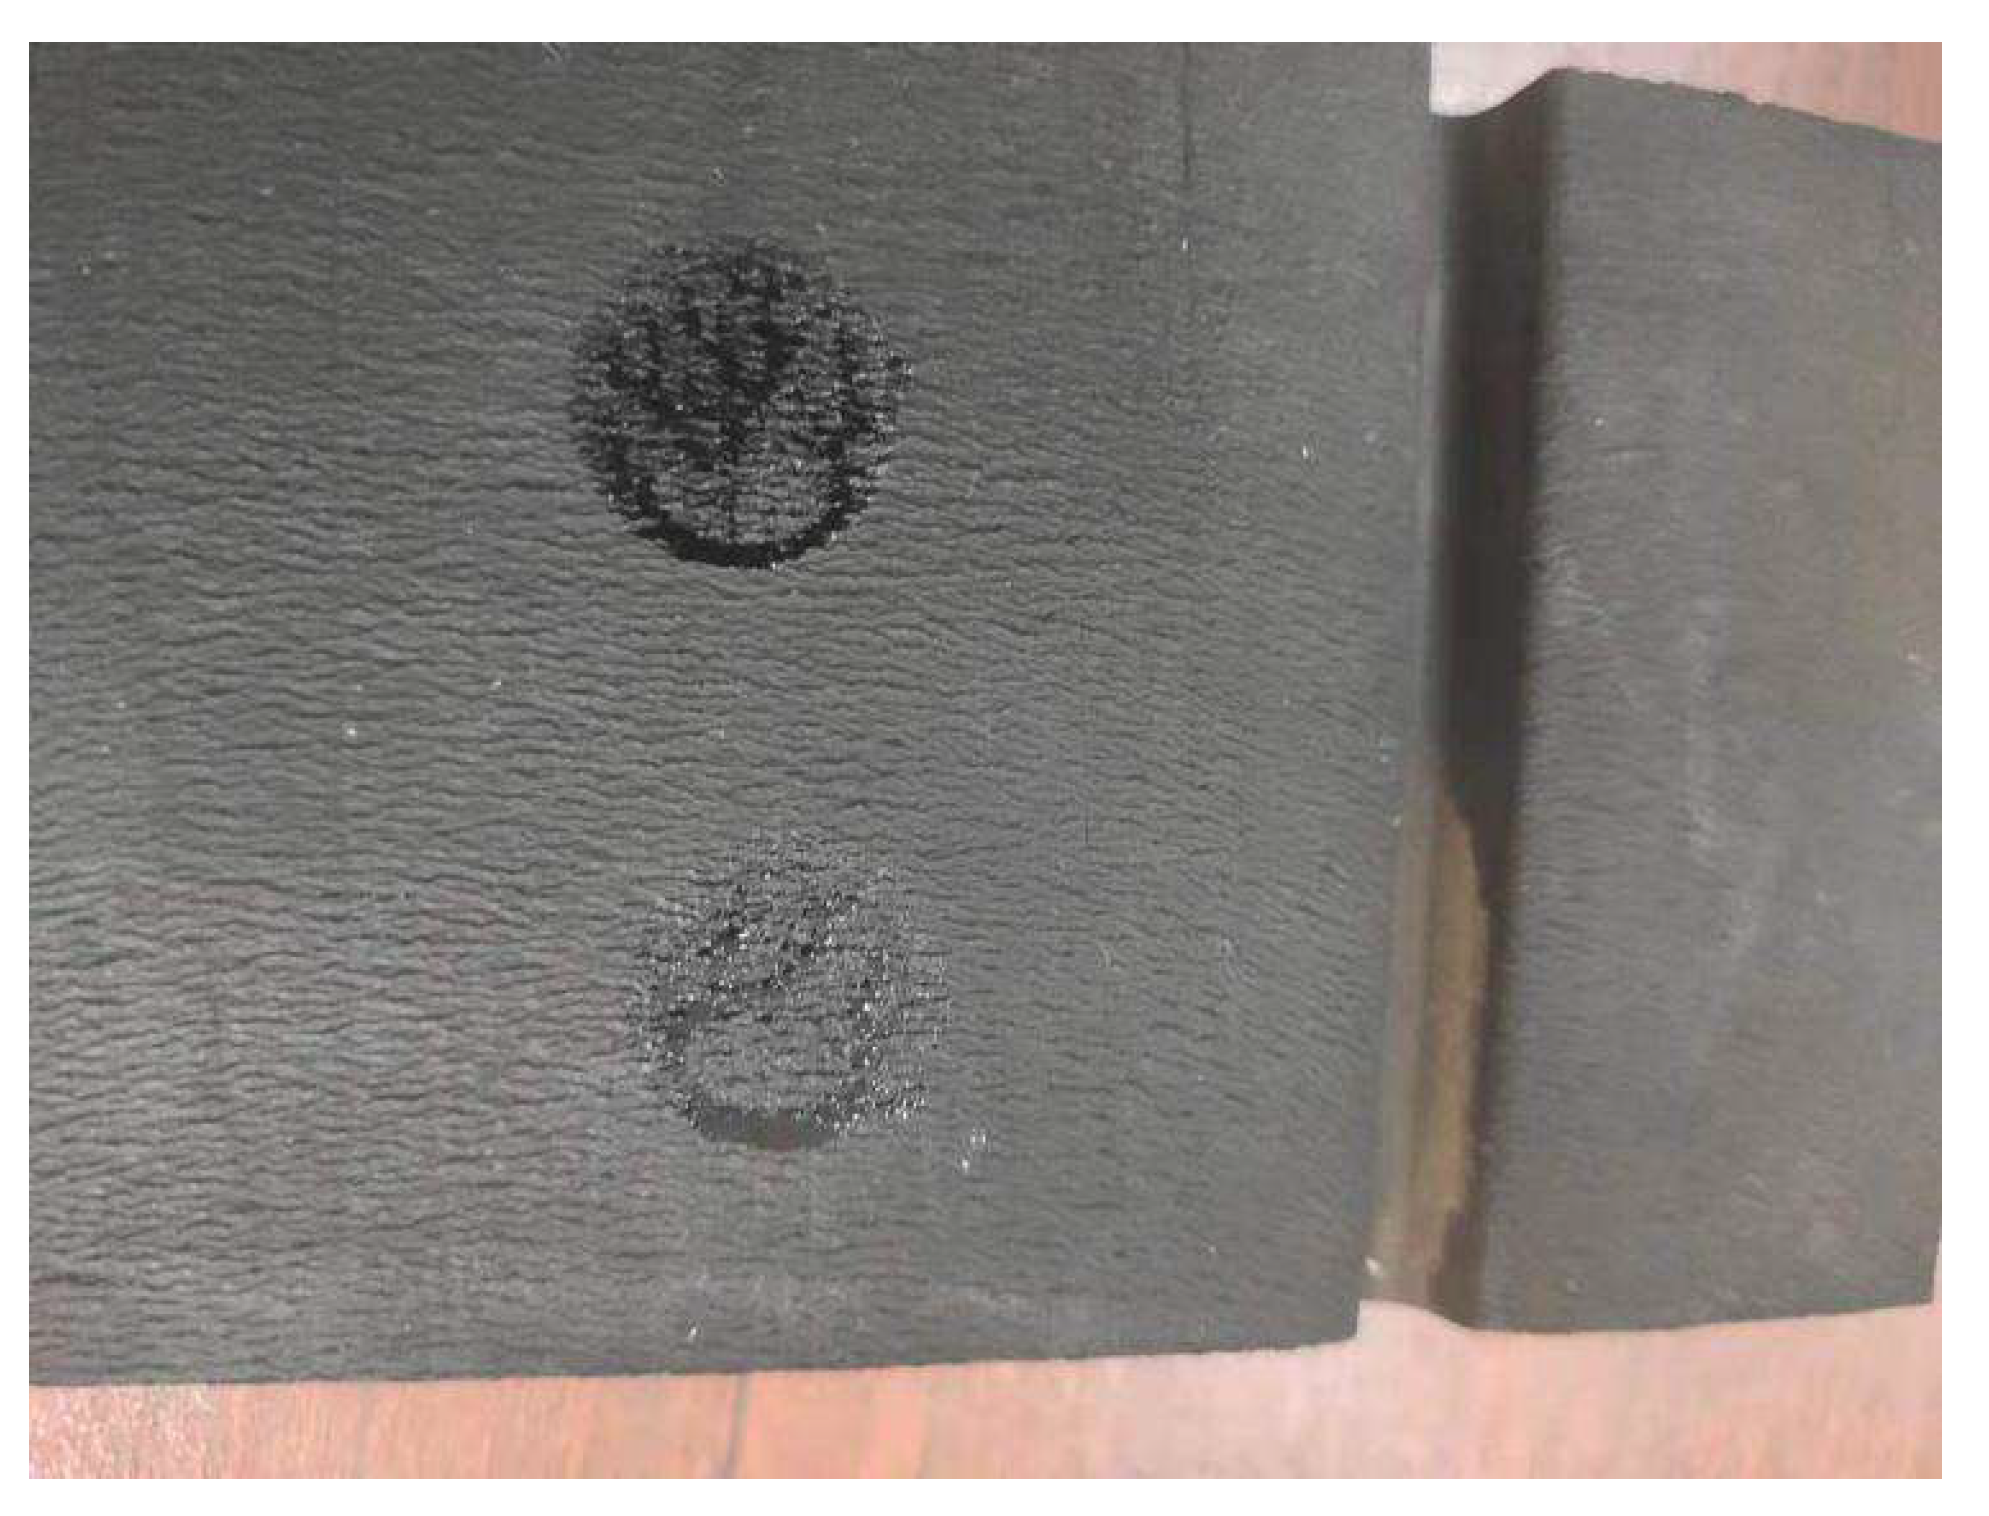
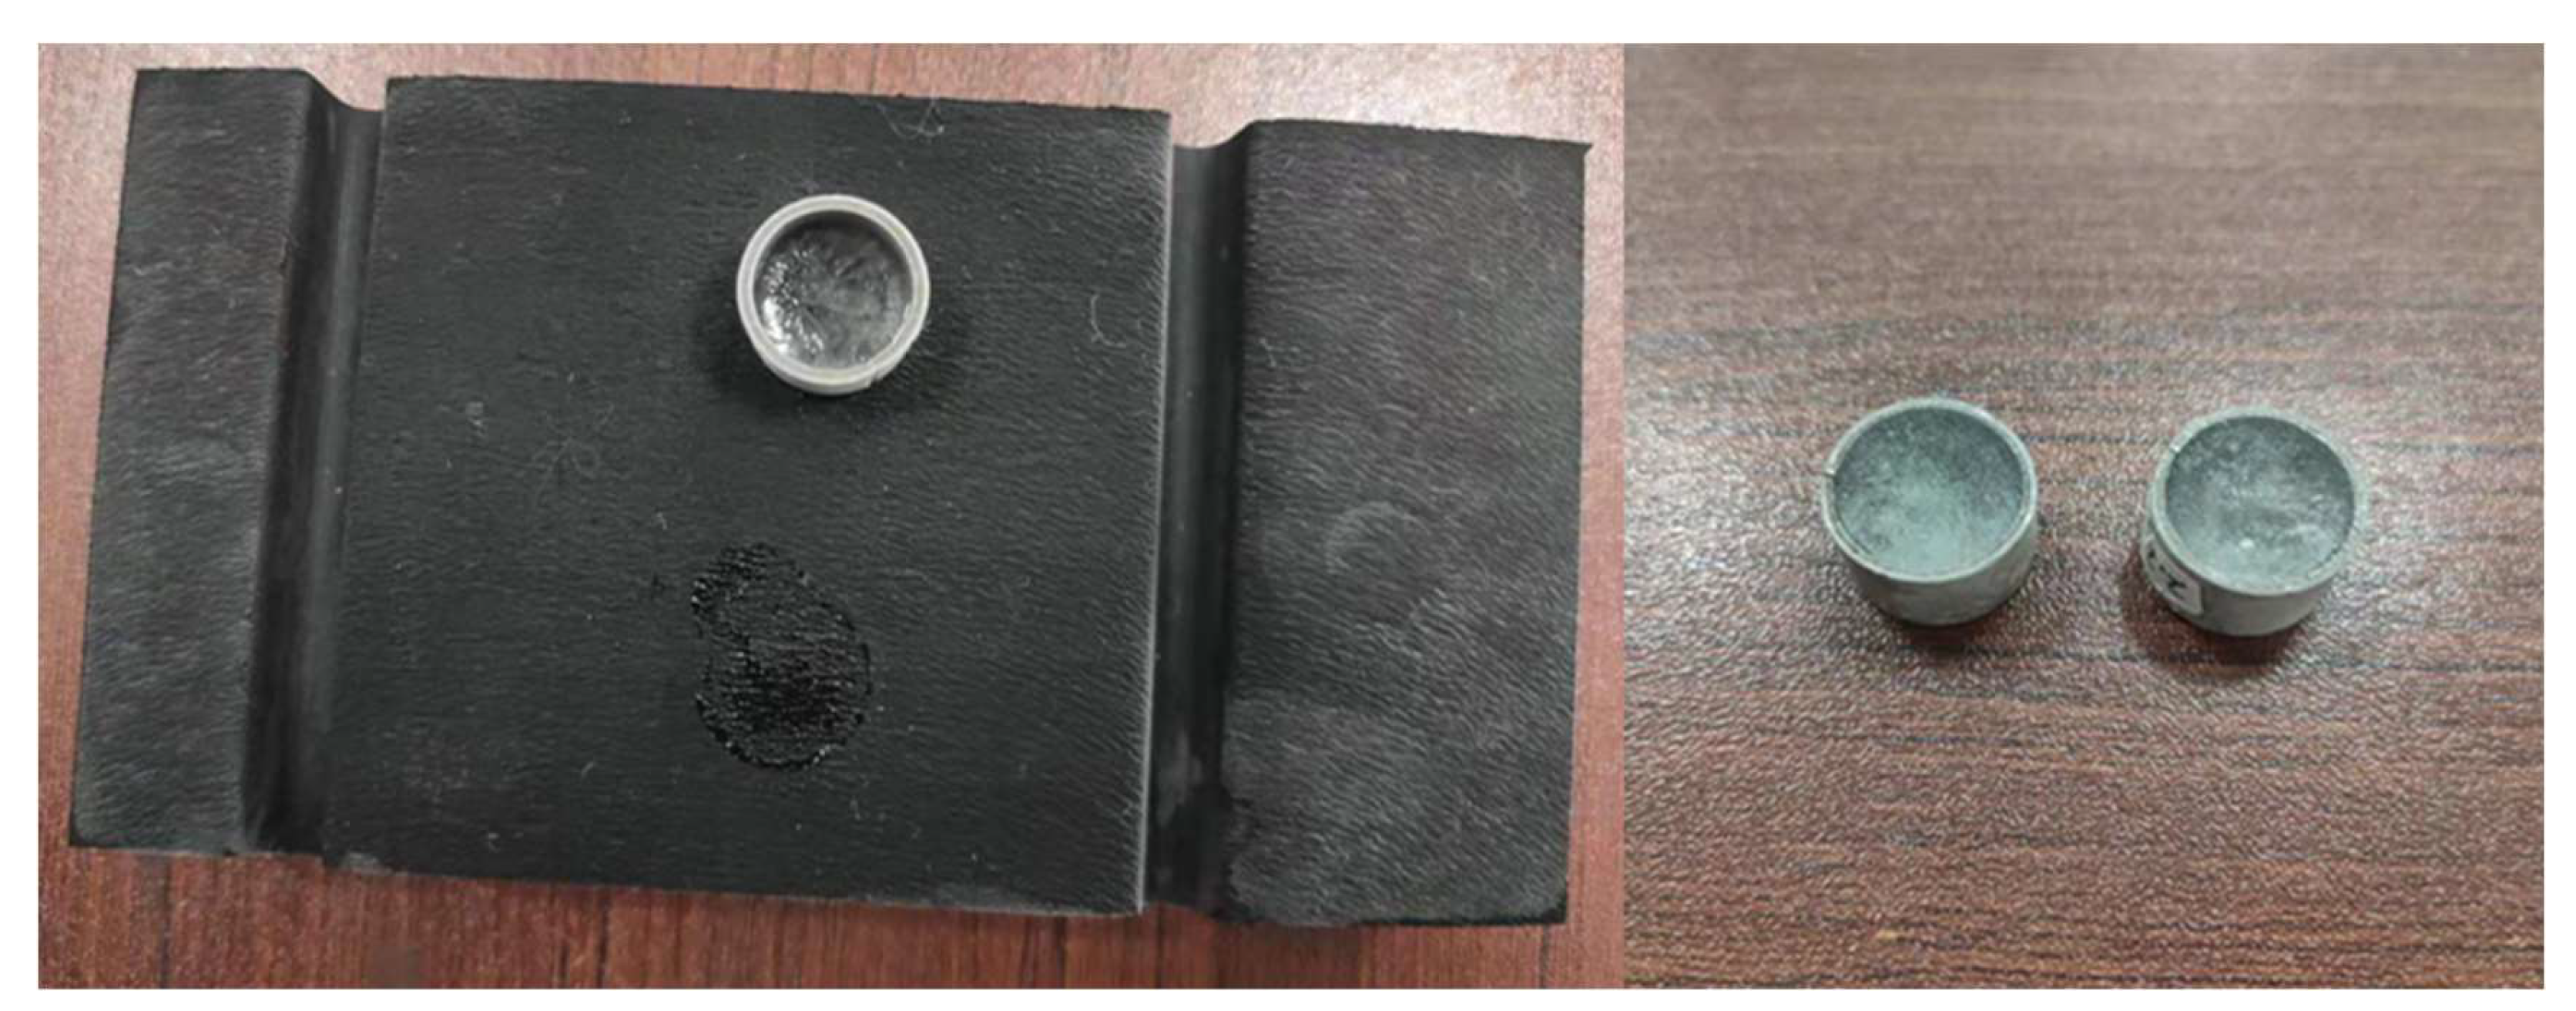
Due to the presence of salt in seawater, the freezing temperature of seawater is lower than that of freshwater. In the initial experiment, seawater could not be directly frozen on the surface of the tire because the salt in the seawater would gradually precipitate during the freezing process of seawater. The precipitated salt increased the salinity of part of the seawater. Due to the presence of seawater with higher salinity, the seawater could not be completely frozen at the set temperature. There was a saltwater layer at the interface between the ice sample and the tire substrate. This phenomenon was more obvious when the temperature was relatively high (−20–0 °C).
Figure 9 records this phenomenon in the initial experiment. From the figure, frozen brine could be clearly seen on the surface of the tire substrate and there was also unfrozen brine. Li Zhijun et al. [
23] researched the adhesion shear strength of seawater ice and building materials under static icing, where ice-melted seawater was used to freeze the sea ice and building materials together to measure the adhesion shear strength. This research refers to this approach, and preprocesses the seawater sample used in the experiment. The processing method is as follows.
An appropriate amount of raw seawater sample was taken and poured into a silicone mold, followed by being placed in a high and low temperature environmental test box and frozen at −10 °C for 3 h. Then, the frozen ice cubes were taken out from the silicone mold, and the brine on the surface of the ice cubes was removed. Next, the ice cubes were crushed, and gauze was used to filter out the remaining brine inside the ice. Finally, the broken ice was bottled and sealed, and melted under airtight conditions.
After the above-mentioned processing, the seawater sample was filtered again with filter paper, and its salinity was measured at room temperature.
Table 2 shows the salinity of the treated water samples. The seawater sample was refrigerated for later use. Compared with the original seawater sample, the salinity of the treated seawater was significantly reduced.
2.4. Experiment Procedure
During the experiment, the ice sample was prepared first, and then the adhesion shear strength was measured on the prepared ice sample. The preparation of the ice sample and the experiment were carried out in a high and low temperature environment test box. The specific steps are as follows:
Install the experimental devices inside and outside the high and low temperature environment test box and calibrate the positions of the tire material clamping device and the tension sensor, so that the center lines of the two overlap and maintain a horizontal state.
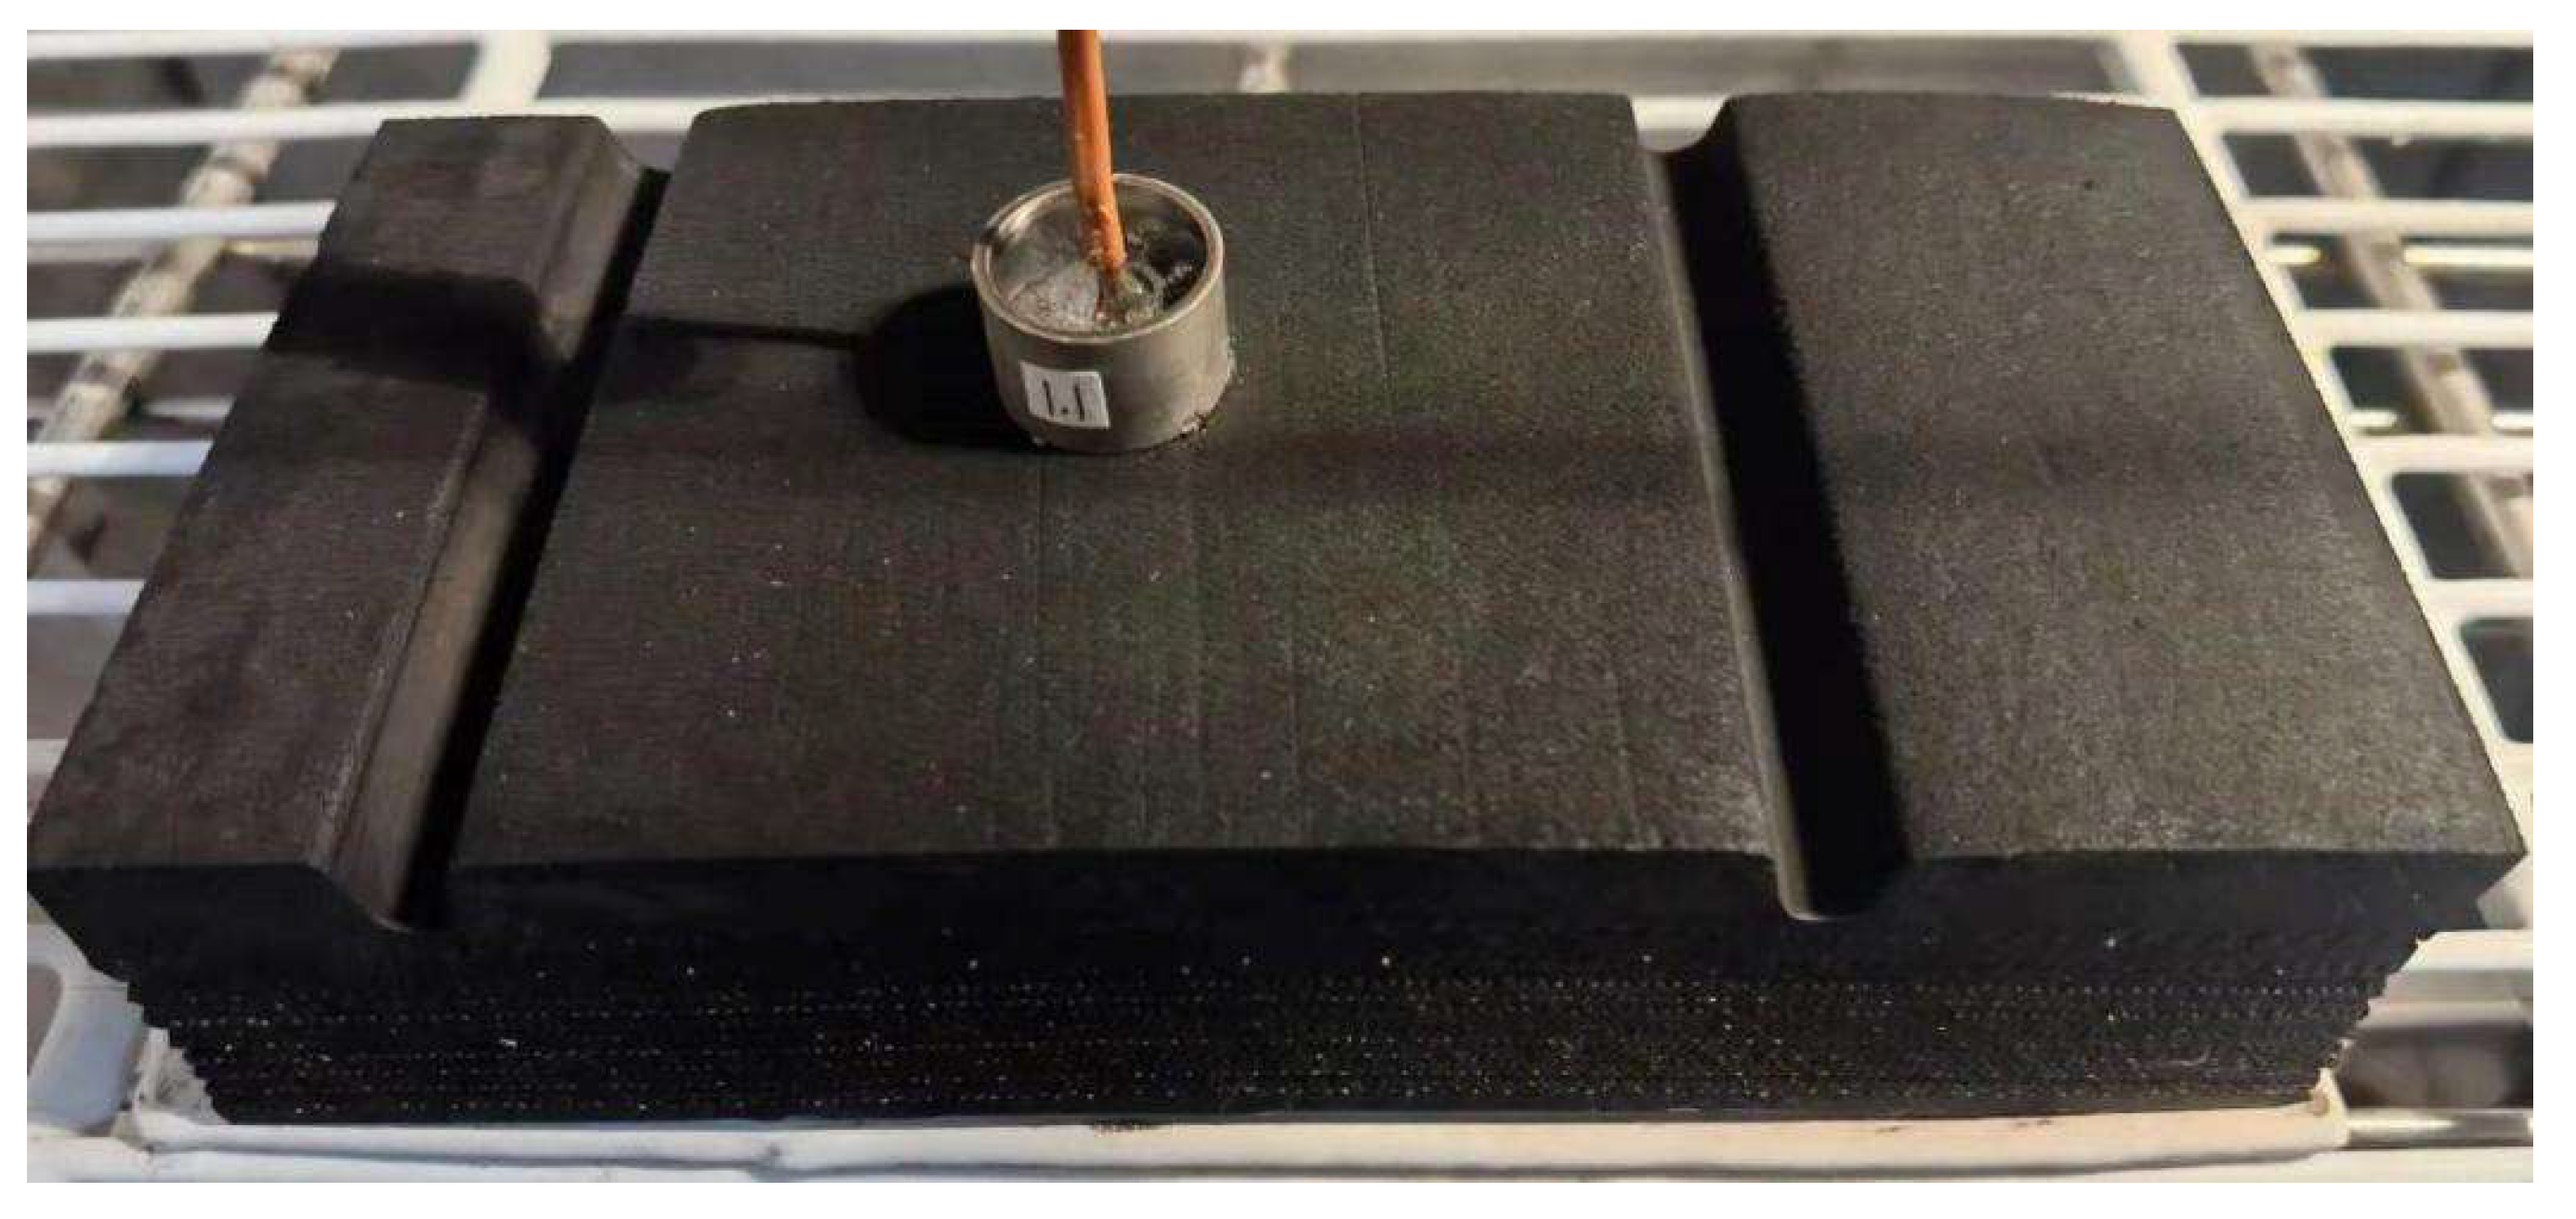
Remove the dust with dust cloth and blower on the surface of the tire sample and place it in the test box. Place the ring-shaped icing mold on the surface of the tire sample. When the set temperature is reached, use a syringe to inject 1 mL of the water sample into the ring-shaped icing mold. Then continue to freeze at the set temperature for 3 h.
Install the frozen tire sample on the clamping device, start the tensile force measurement system to apply the load at a rate of 10 mm/min, and end the experiment when the frozen ice on the surface of the tire sample falls off, and record the tensile sensor readings.
Return the tension sensor to zero and repeat Step (2) and Step (3) to continue the experiment.
2.5. Analysis and Discussion of Experimental Results
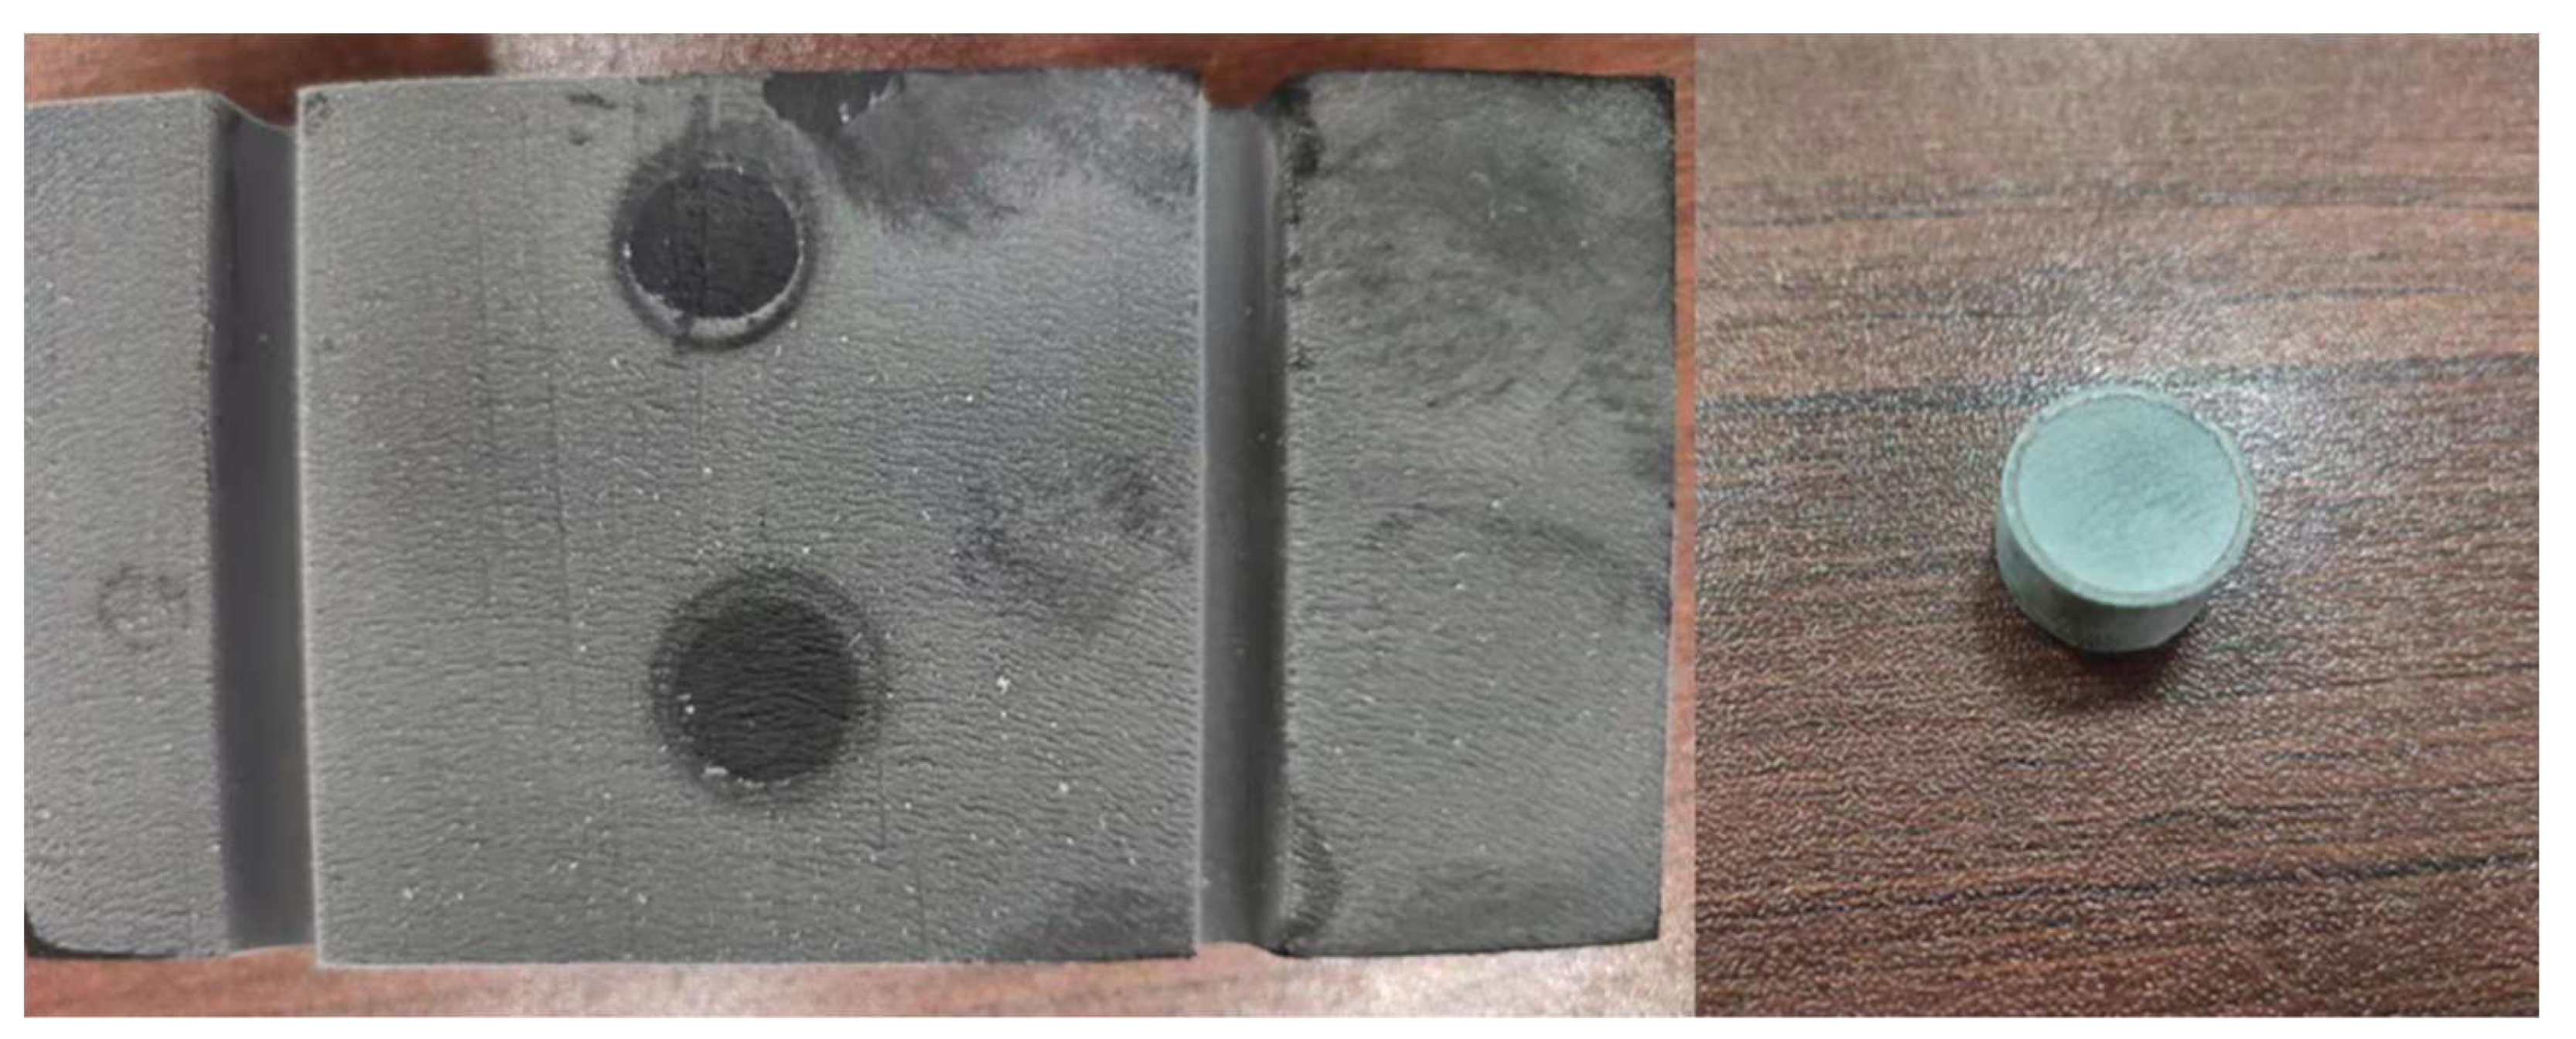
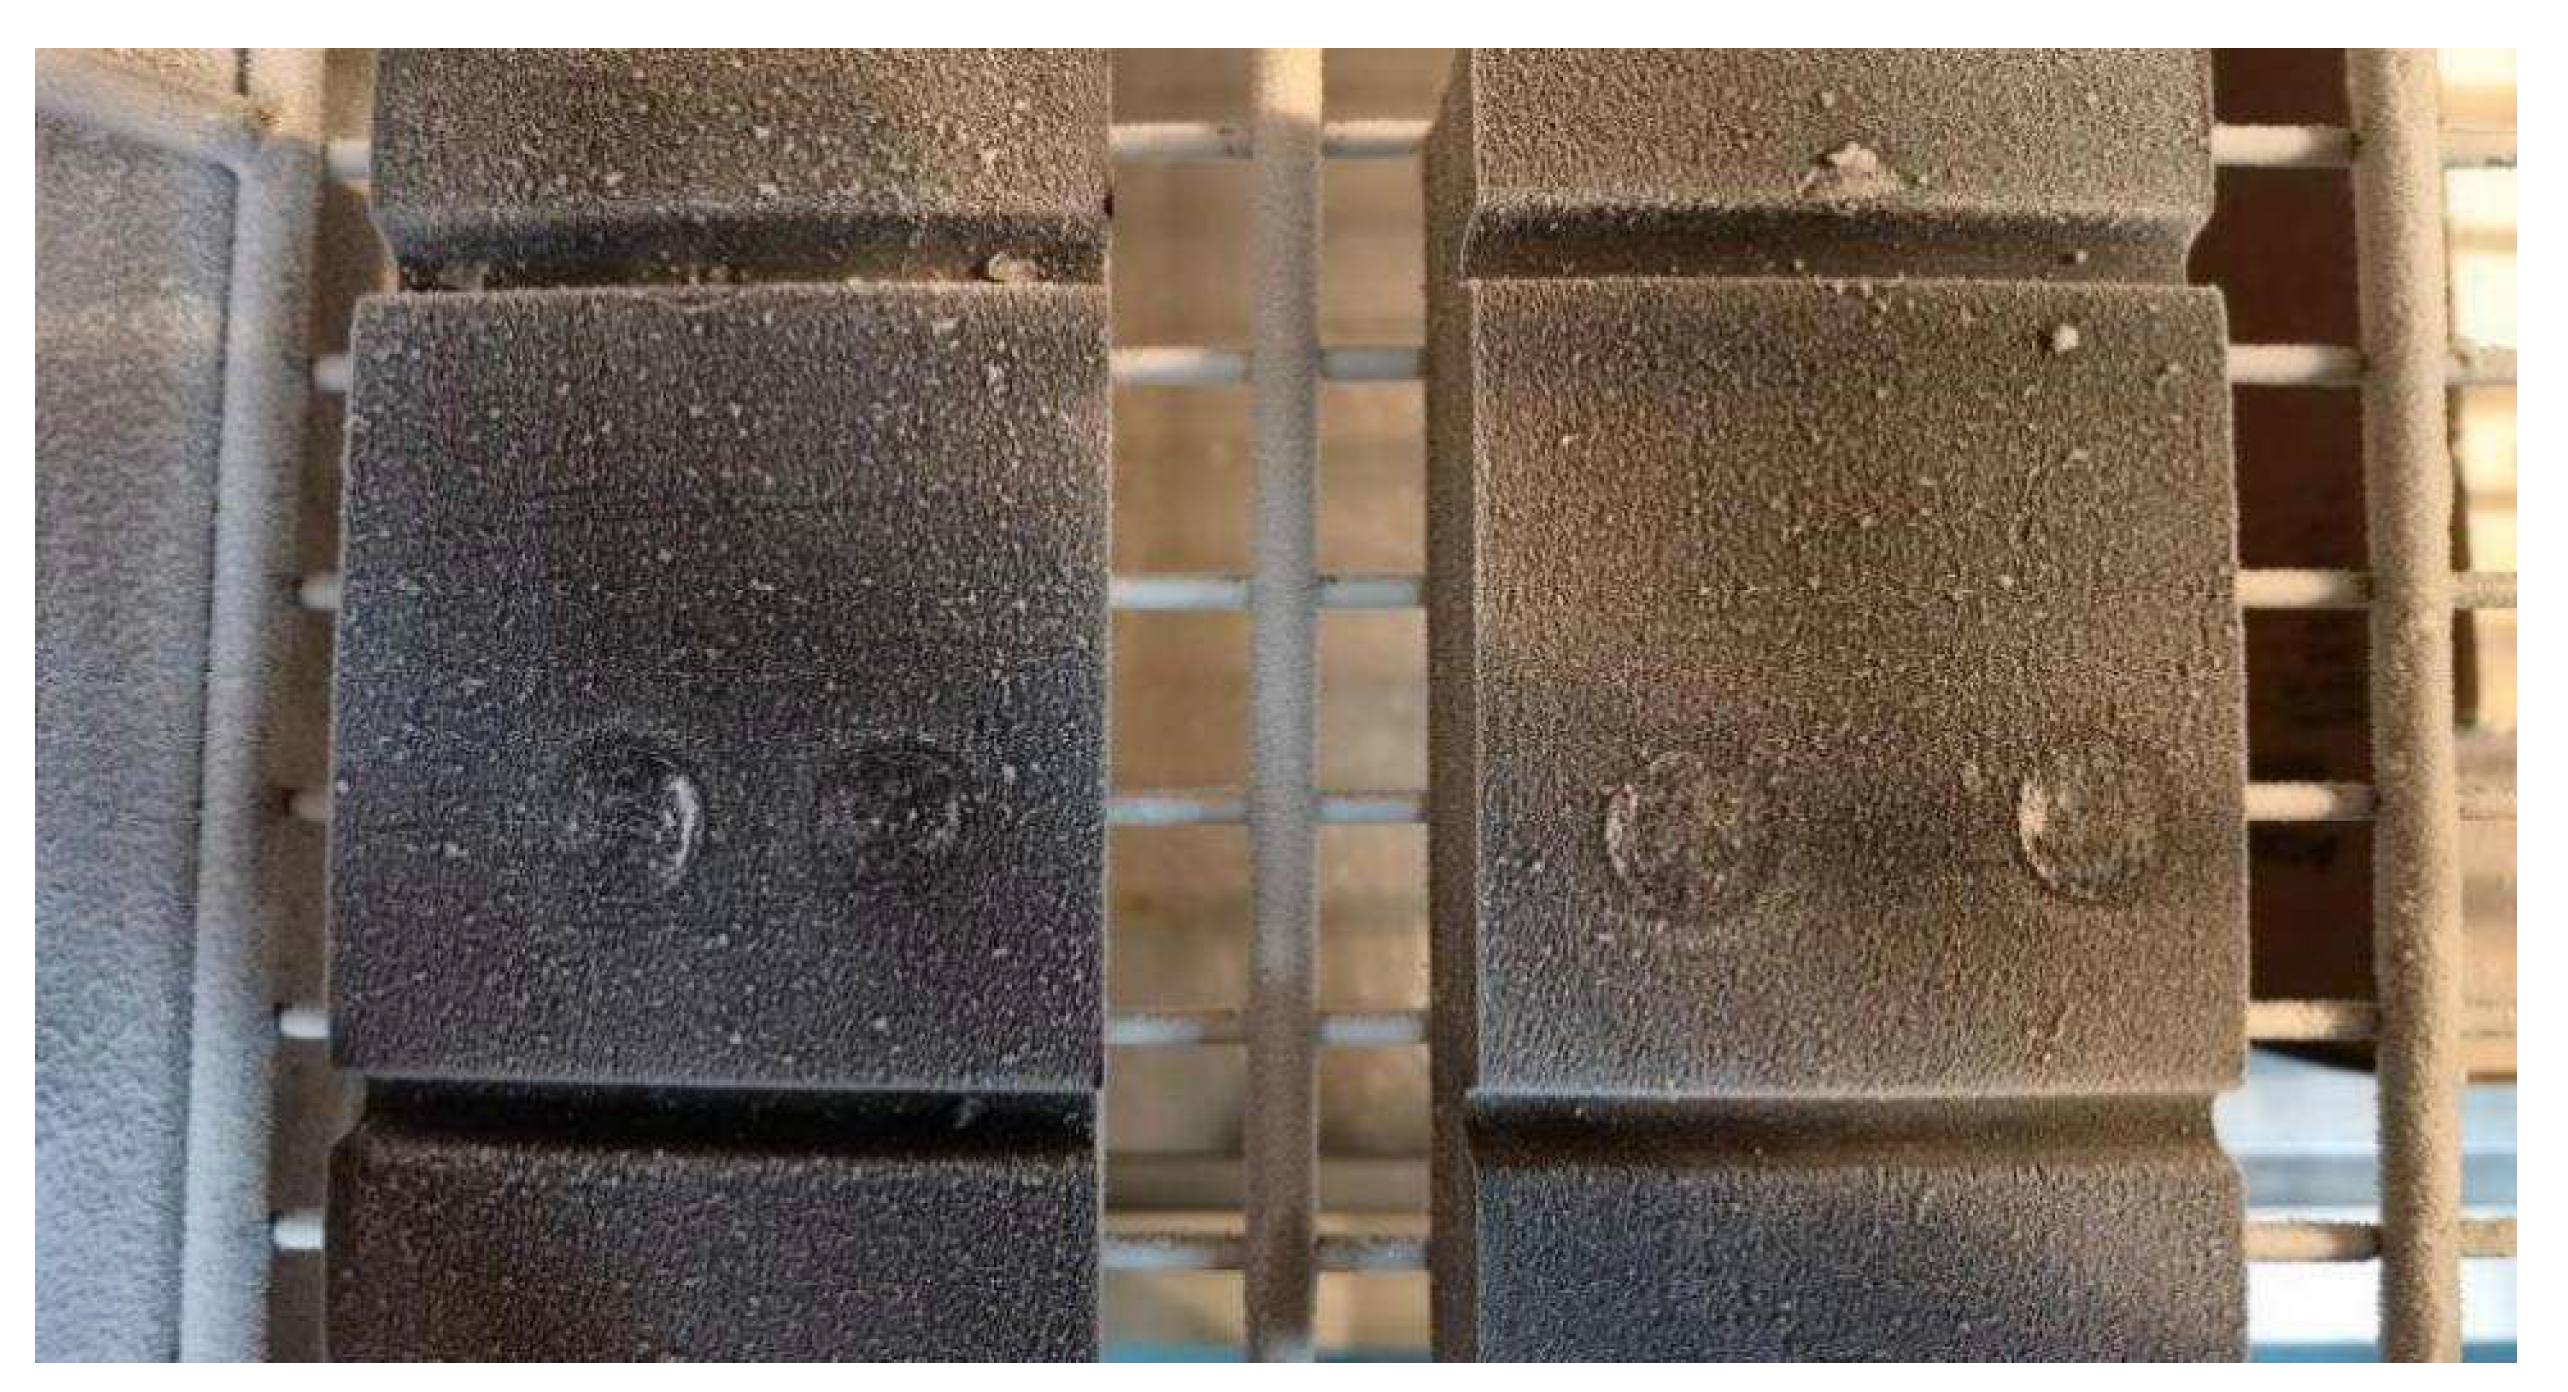
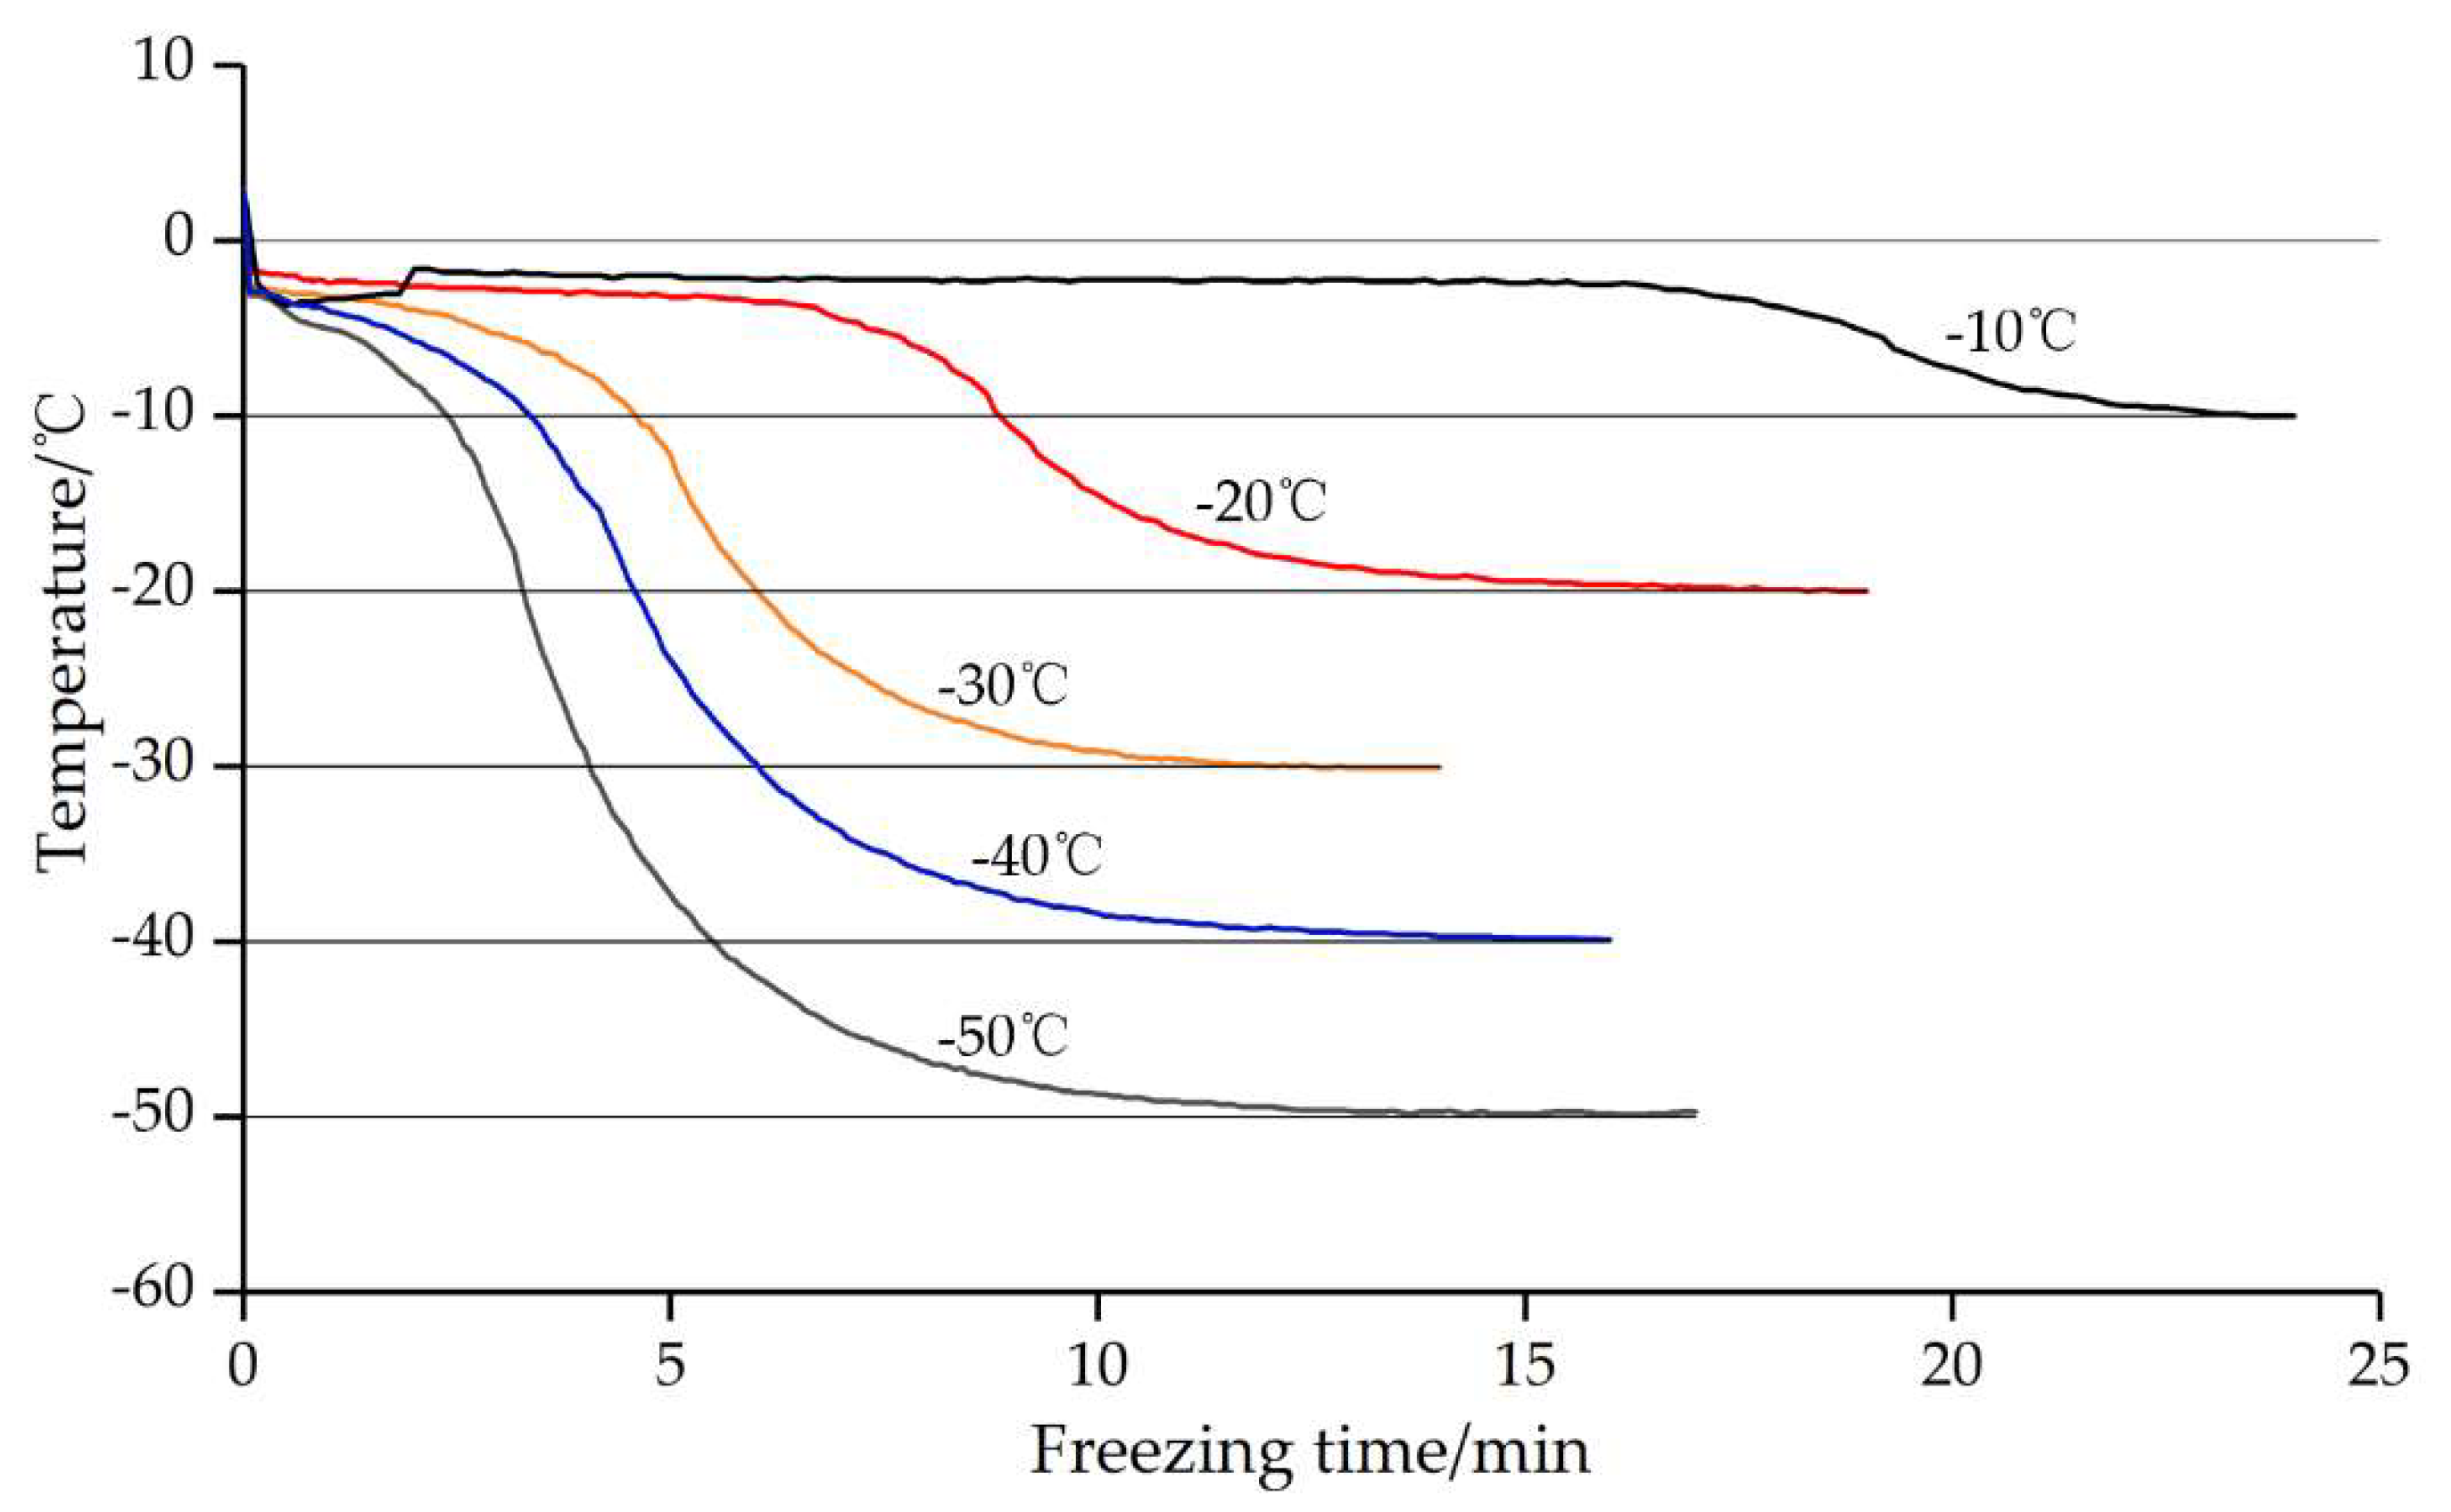
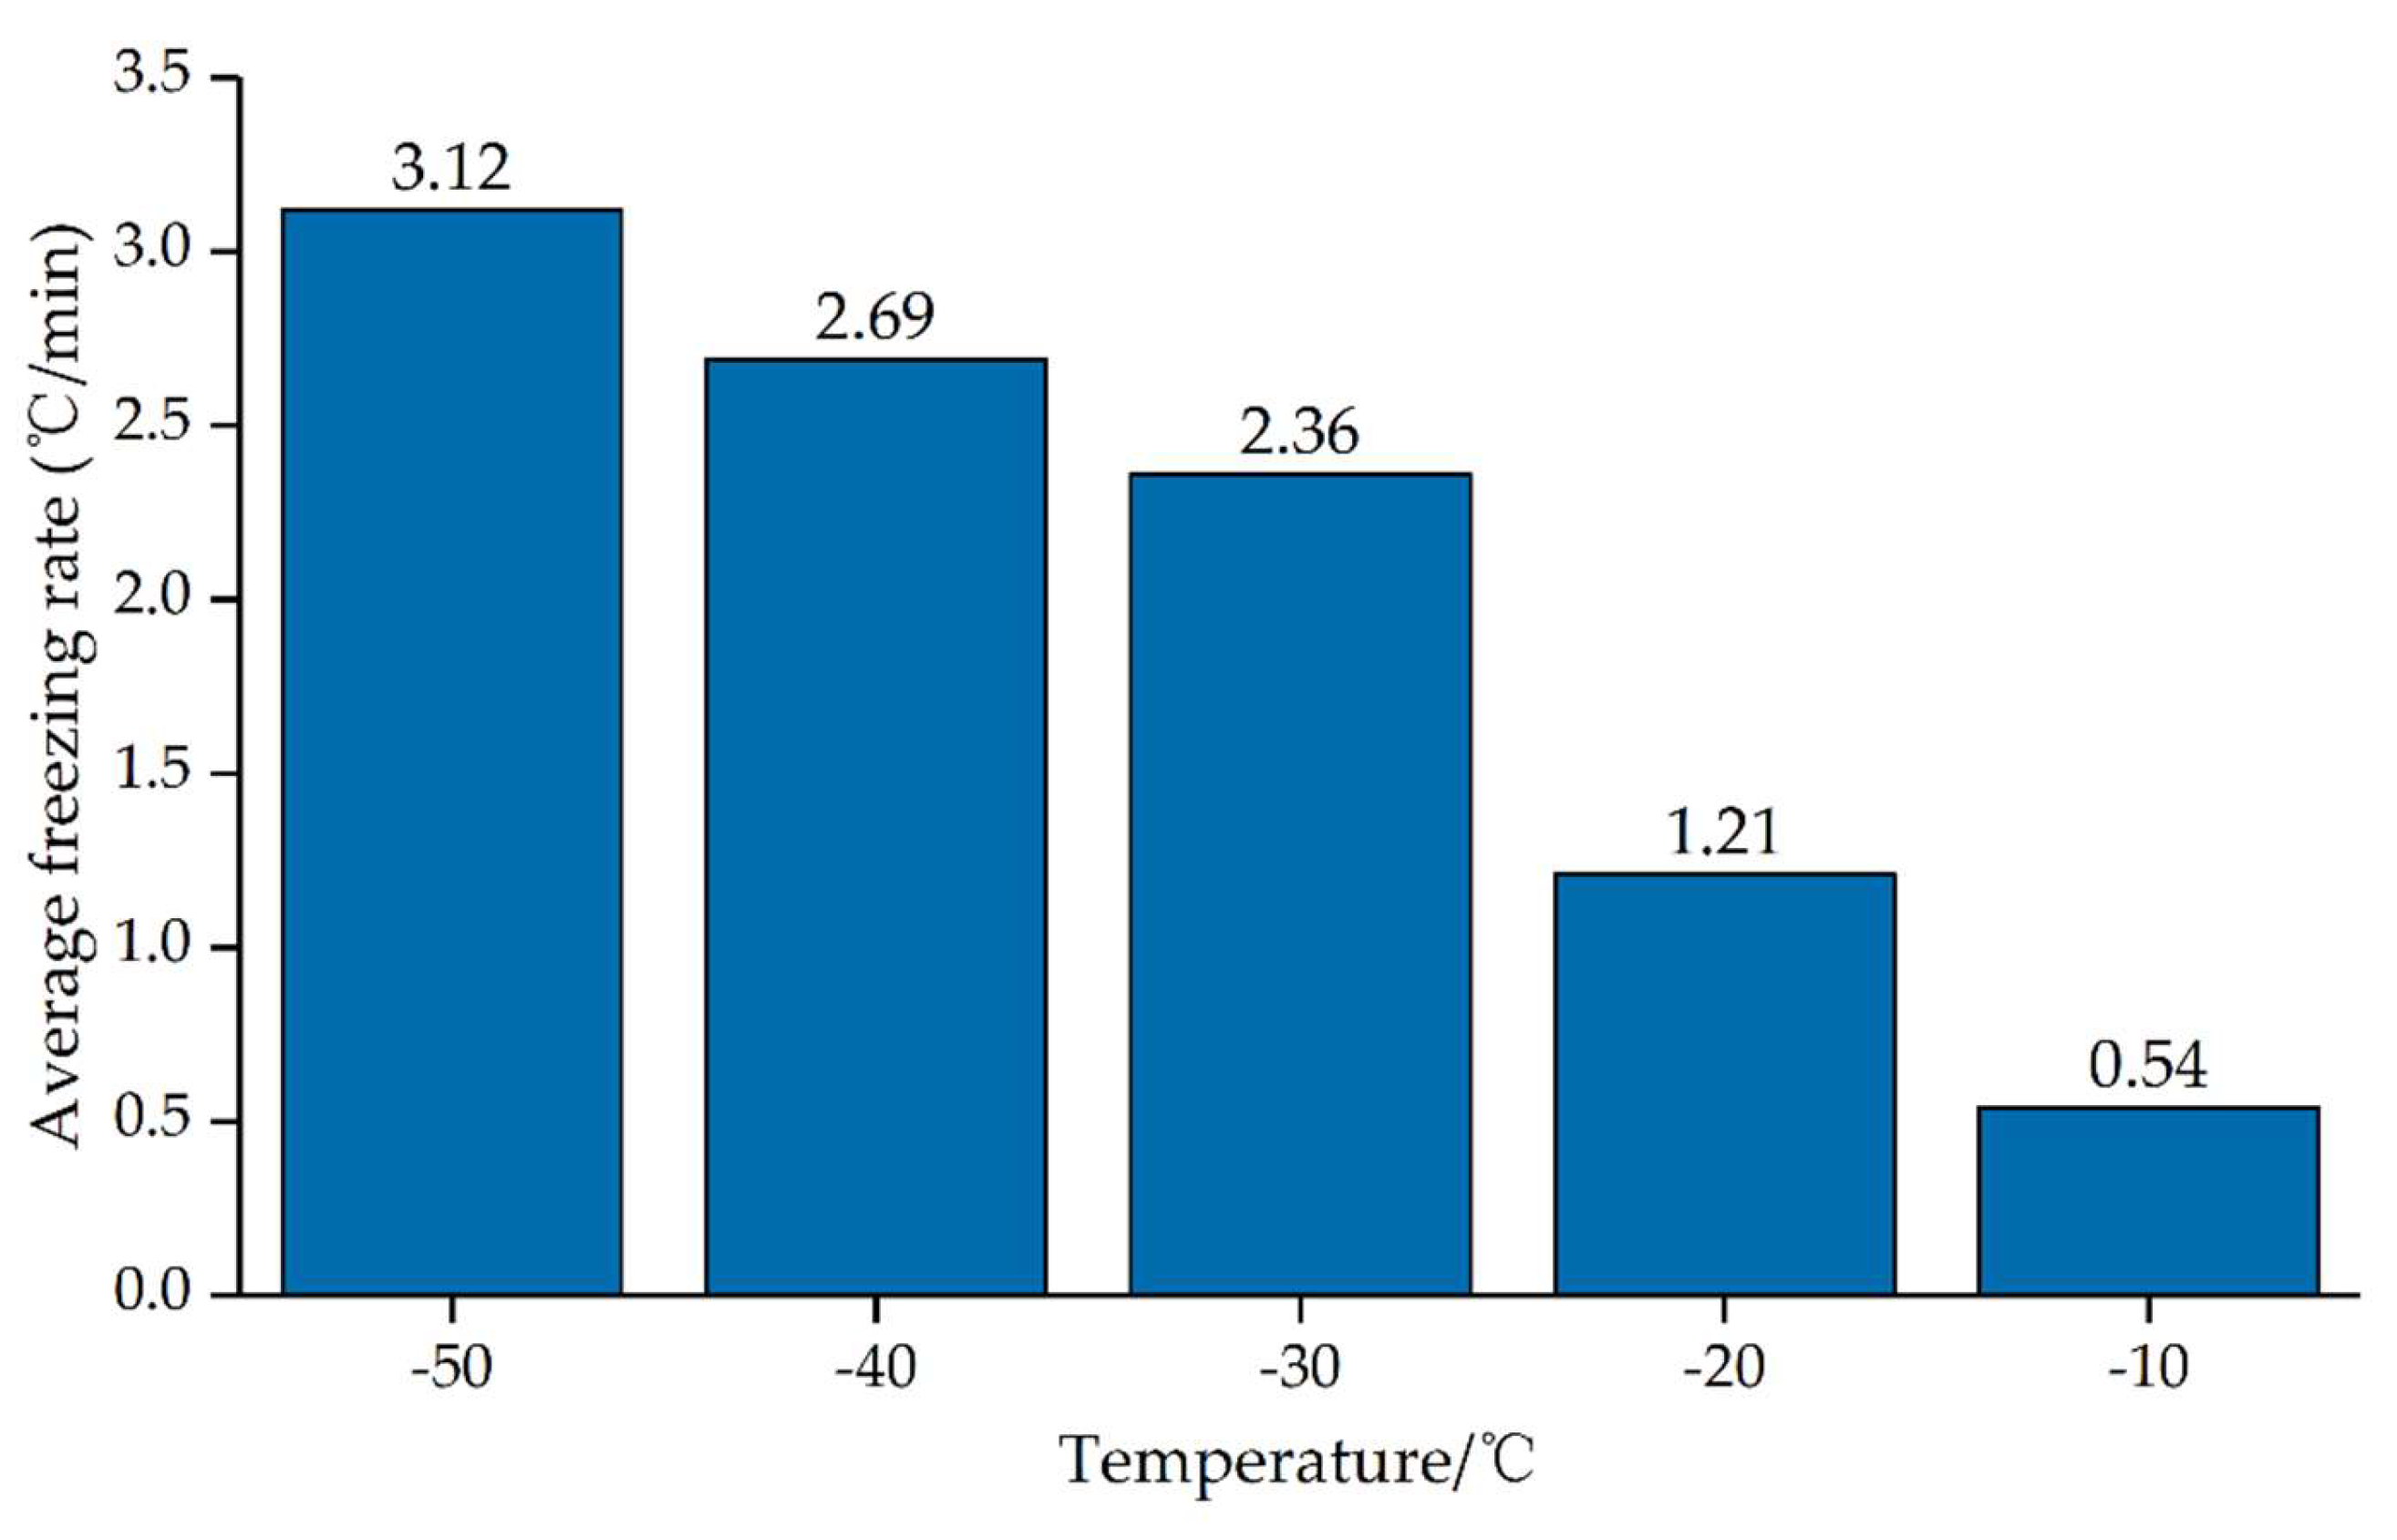
According to the experimental procedures mentioned above, seawater samples from Dalian, Qingdao, Fuzhou and Zhuhai were taken to measure the adhesion shear strength. To investigate the adhesion shear strength of amphibious aircraft tires under extreme low temperature, four temperatures of −20 °C, −30 °C, −40 °C, and −50 °C were selected to measure the adhesion shear strength of tire materials at different temperatures and different seawater sample conditions. The tire material surface and sea ice samples after the test are shown in
Figure 10 and
Figure 11. The experimental results are presented in
Figure 12,
Figure 13,
Figure 14,
Figure 15 and
Figure 16. The loading rate in the experiment was 10 mm/min.
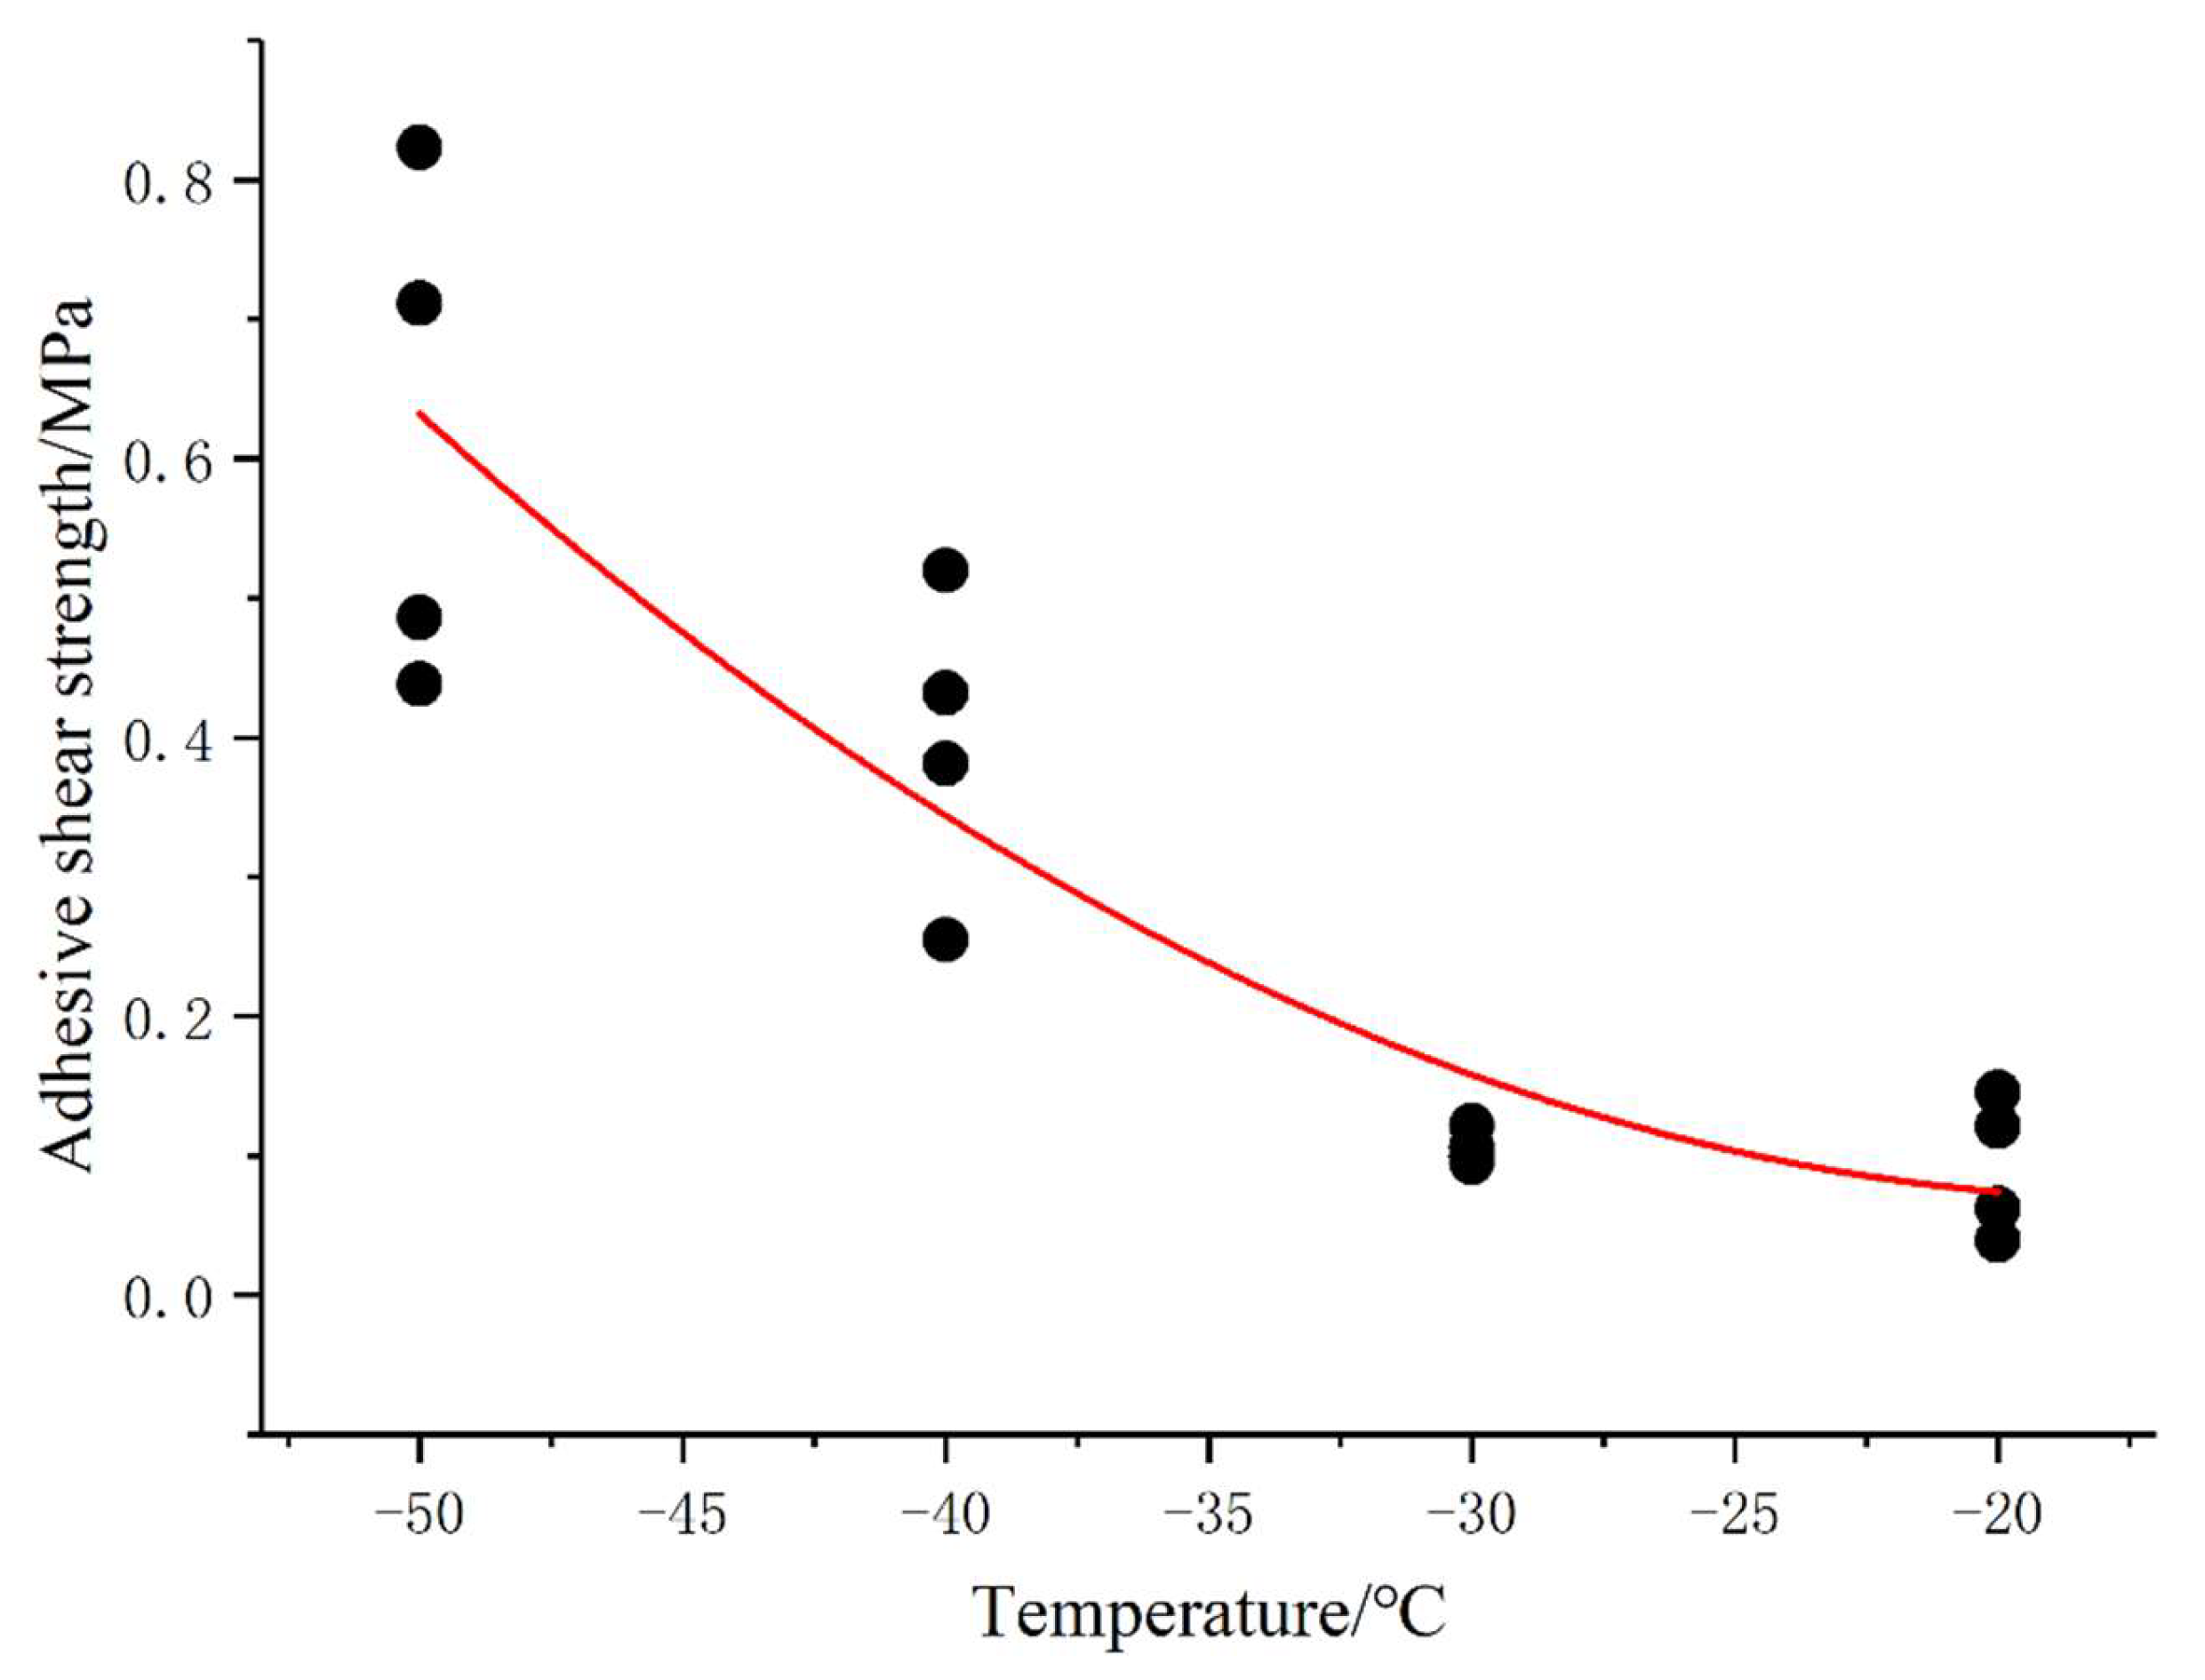
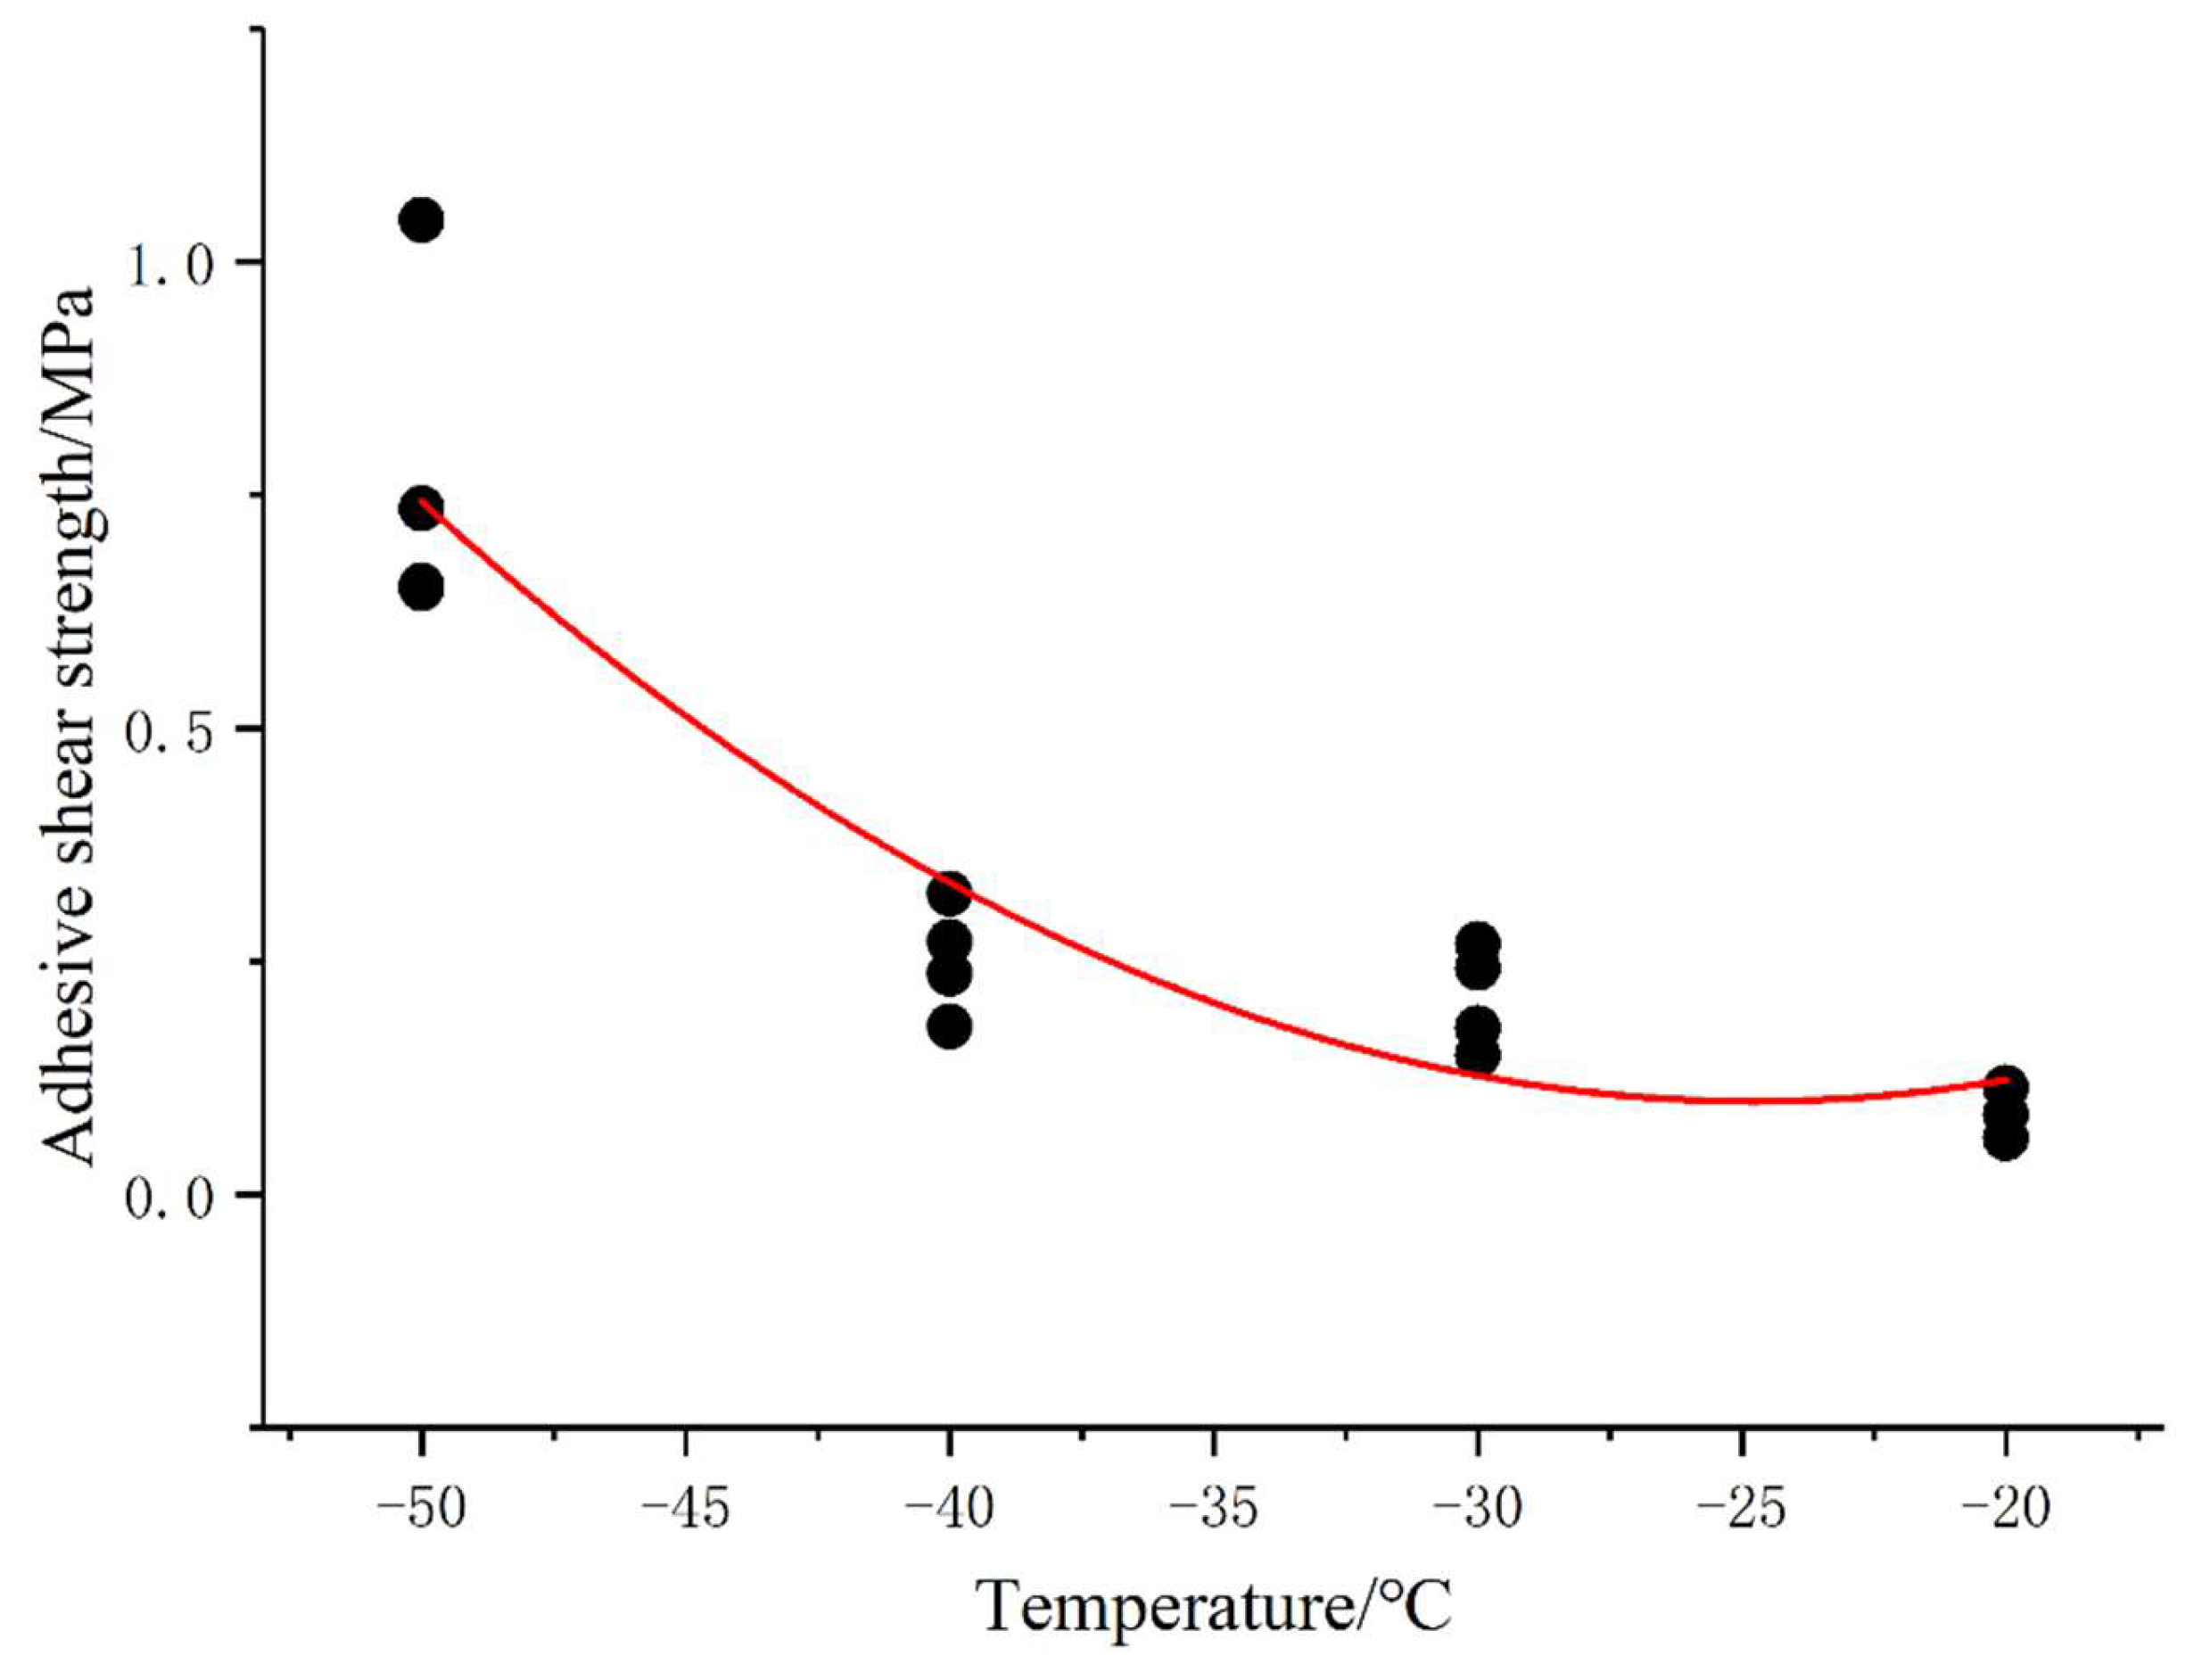
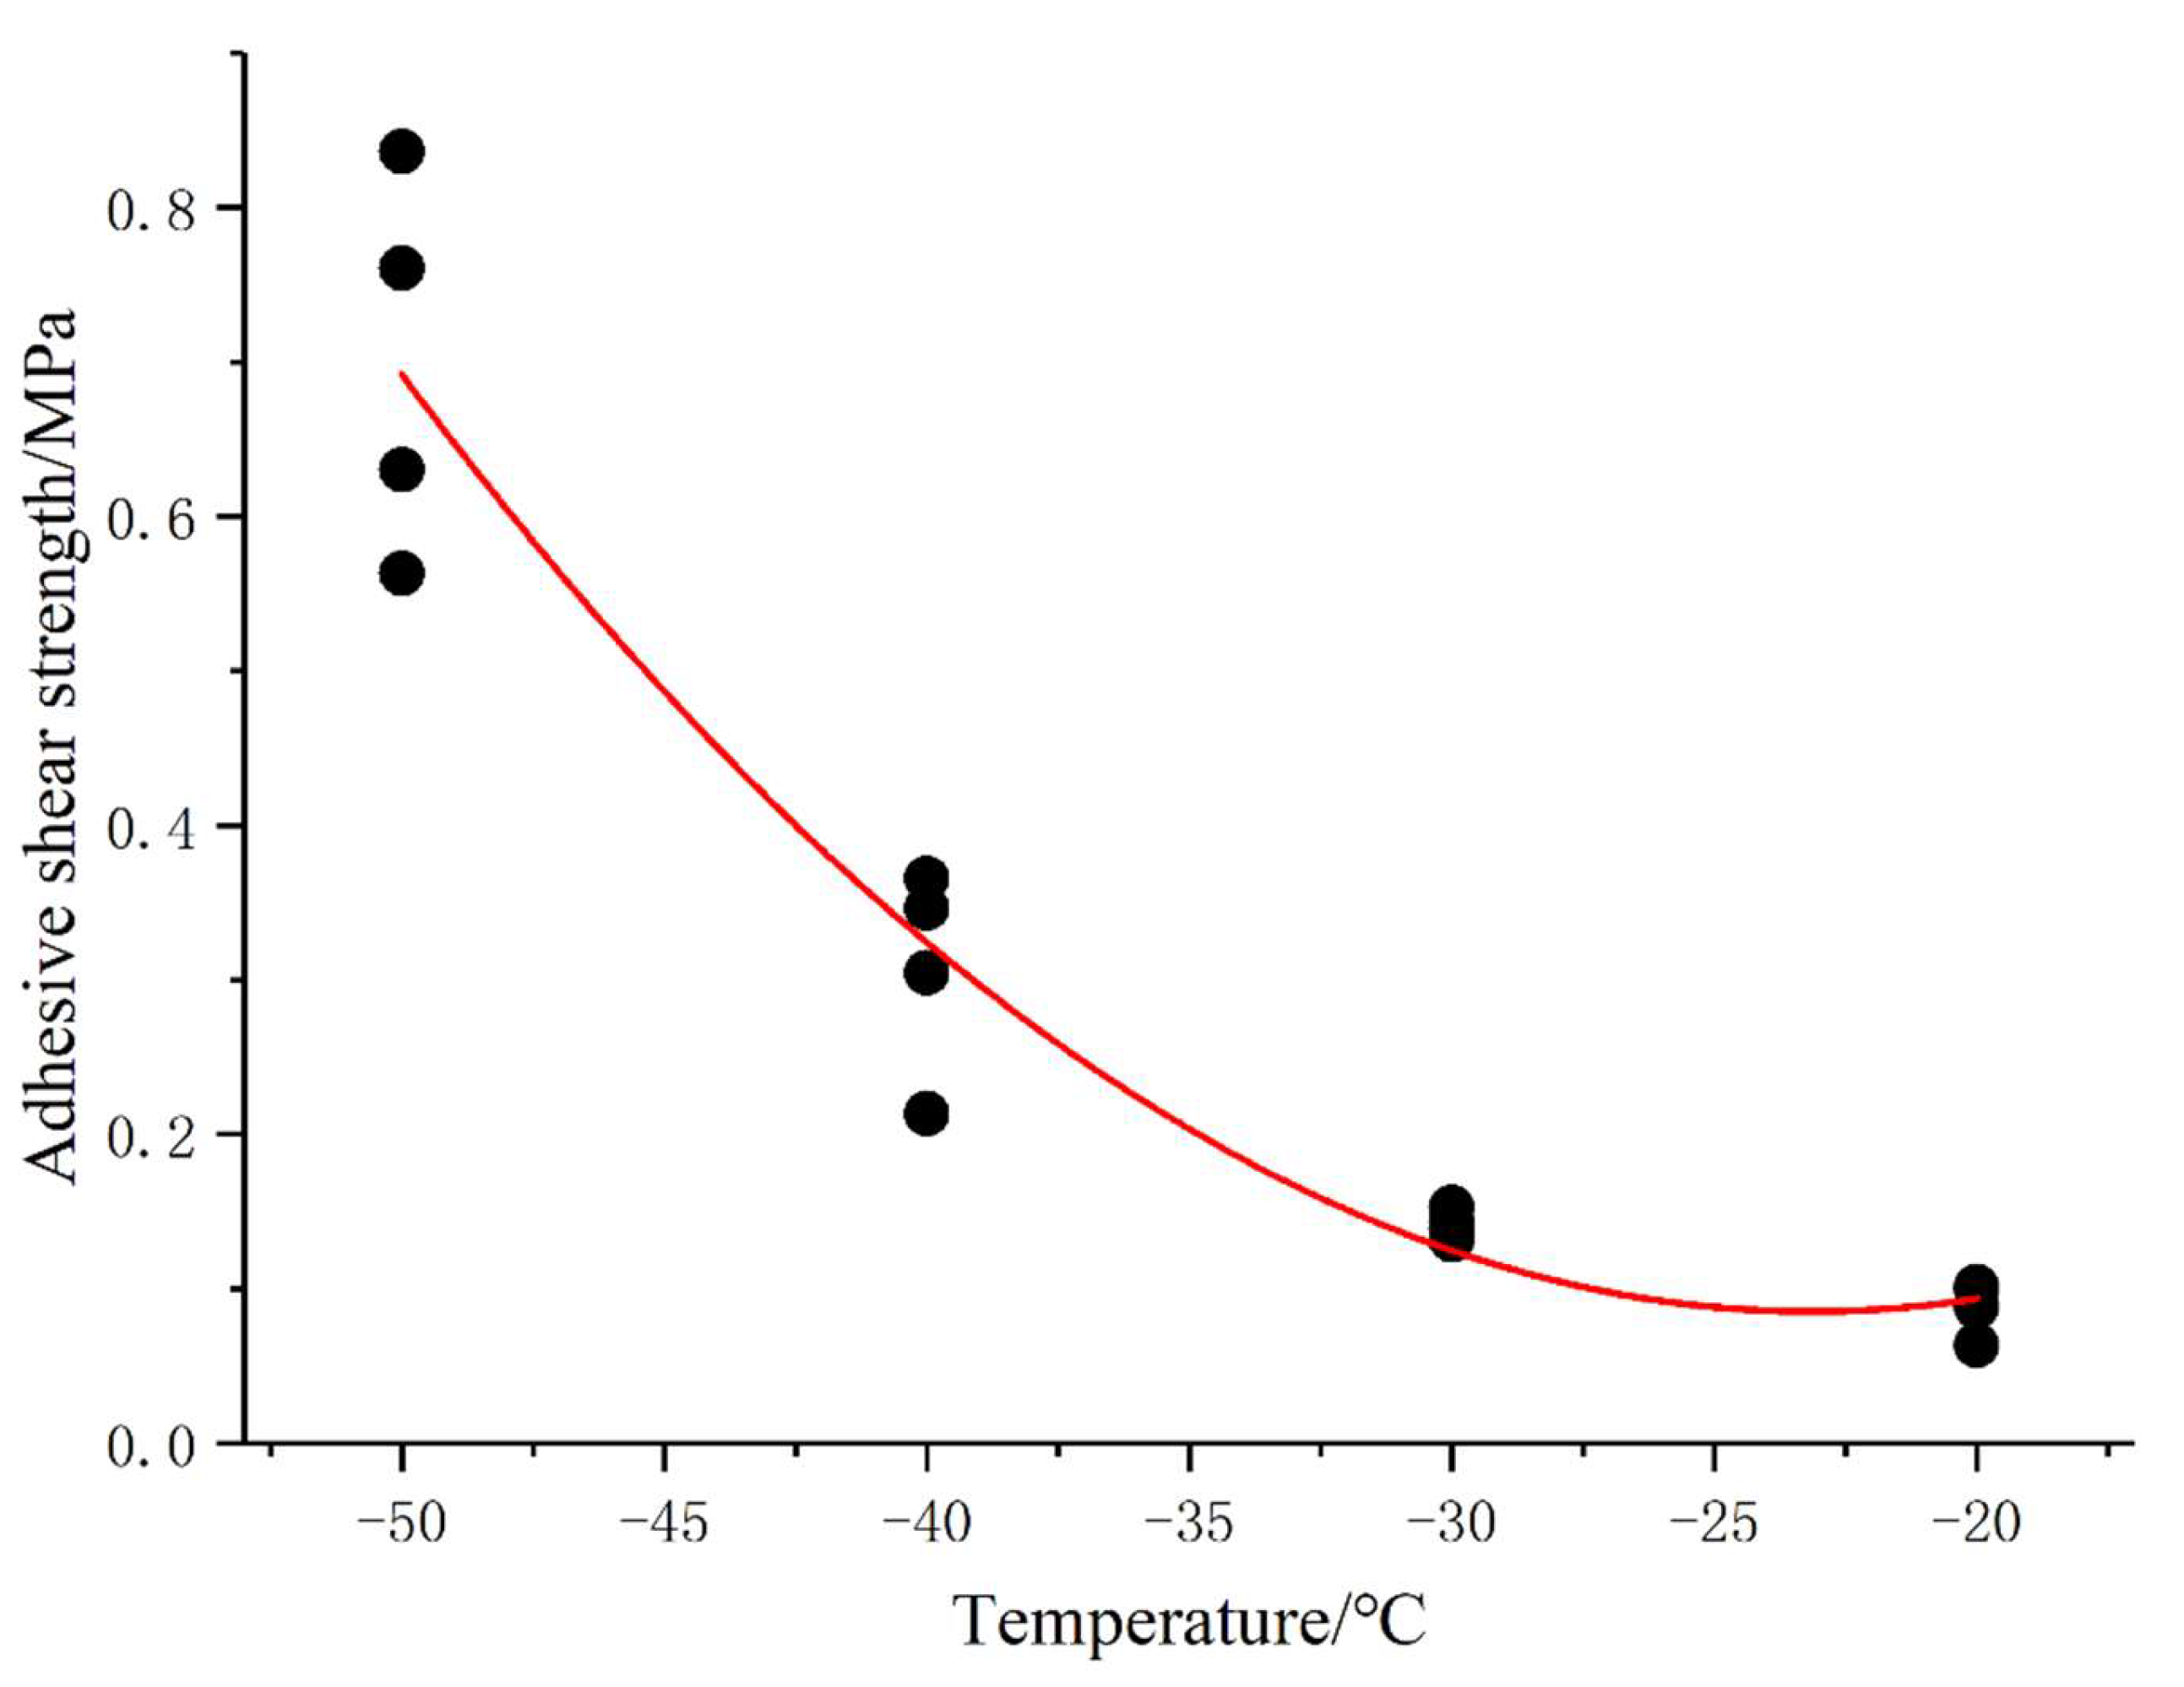
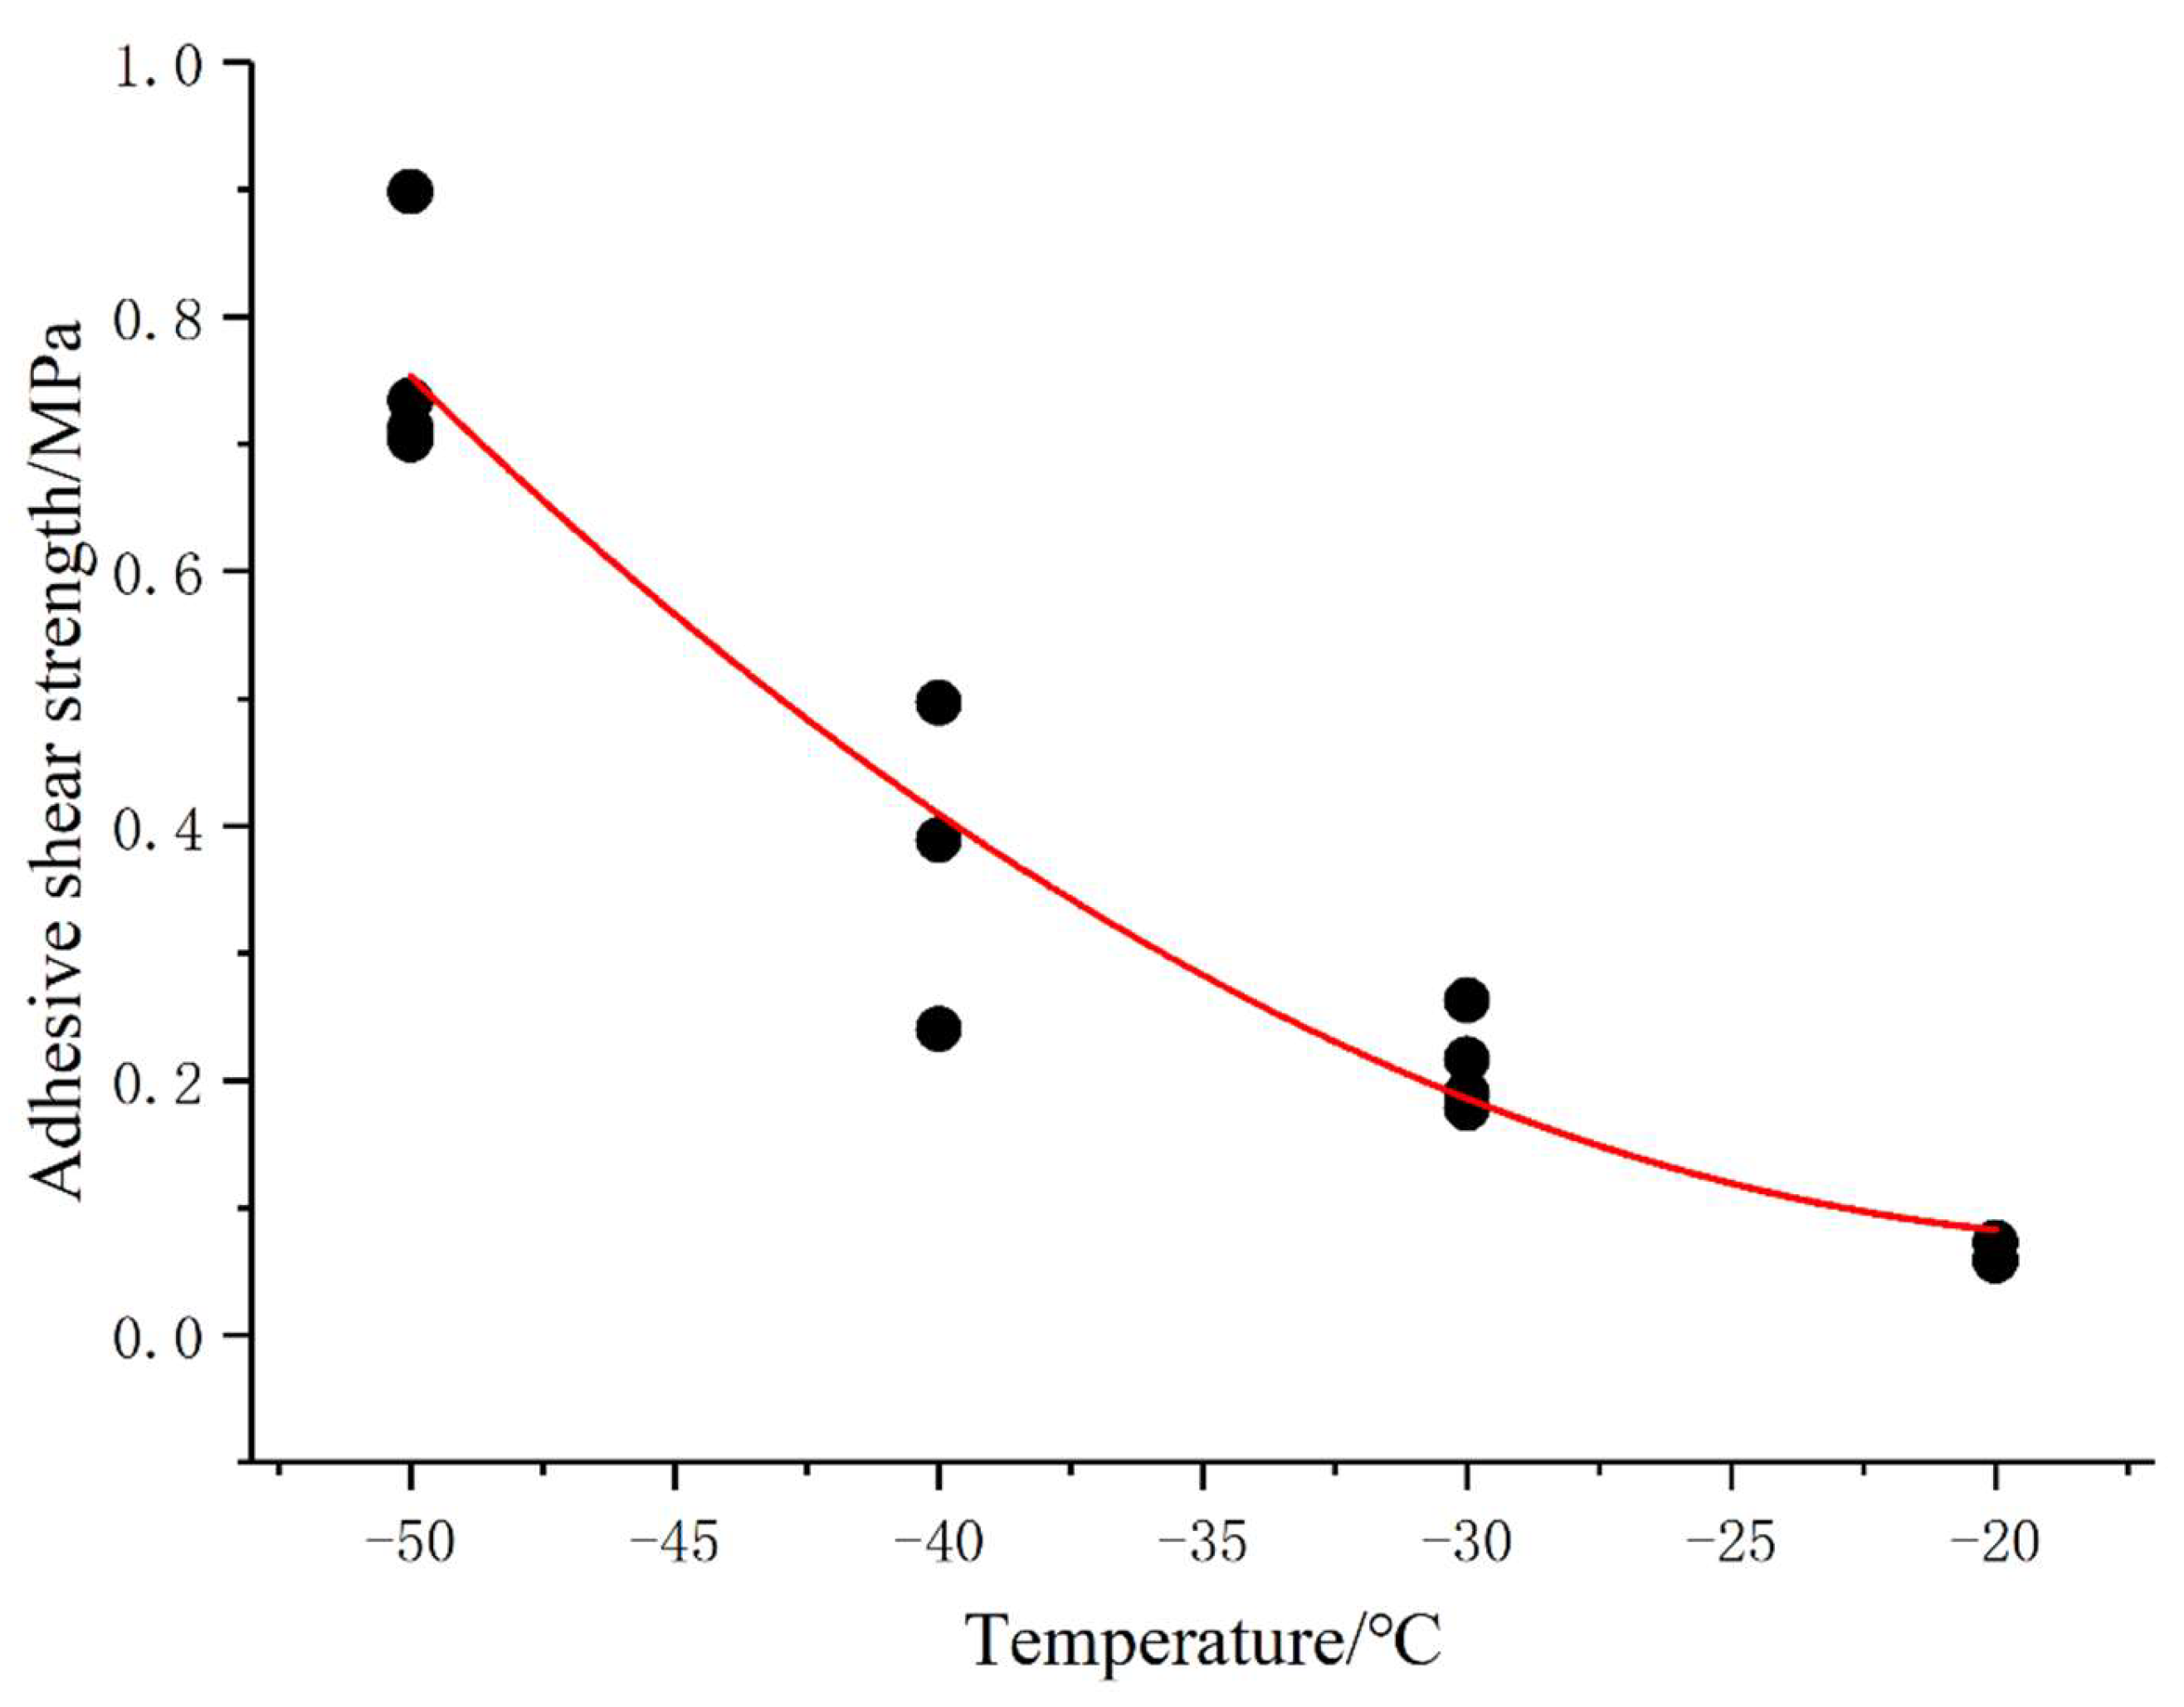
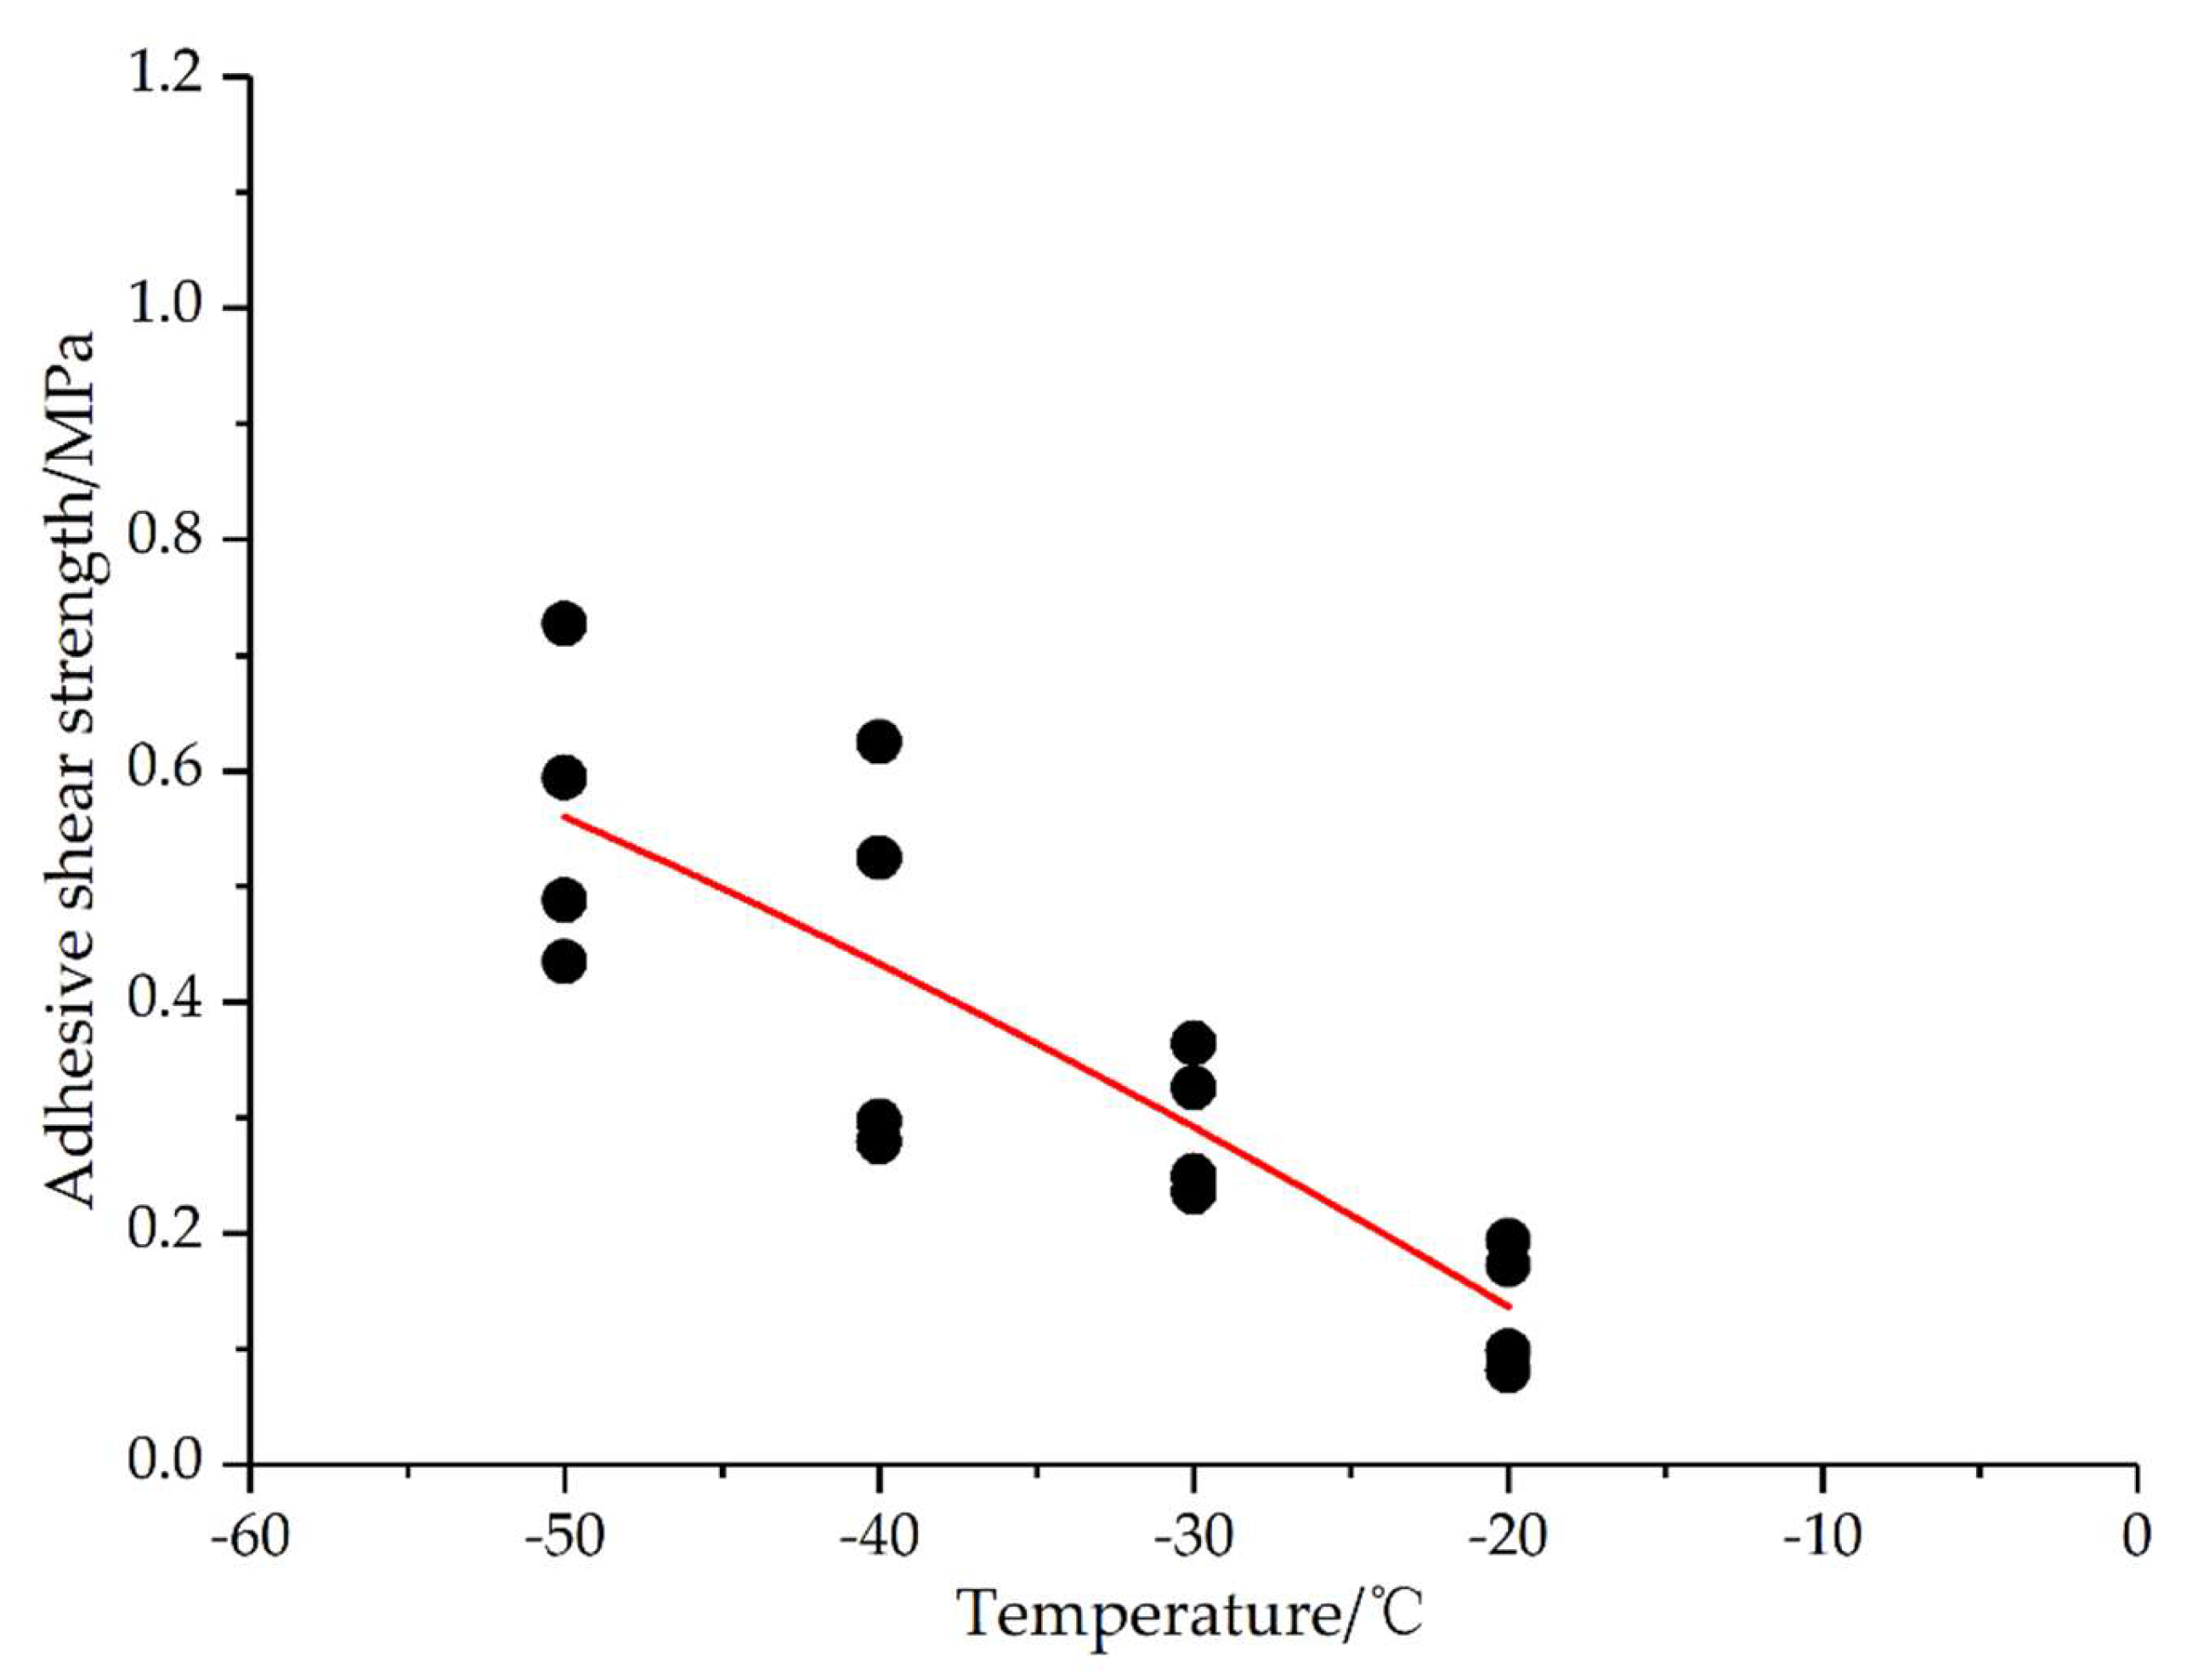
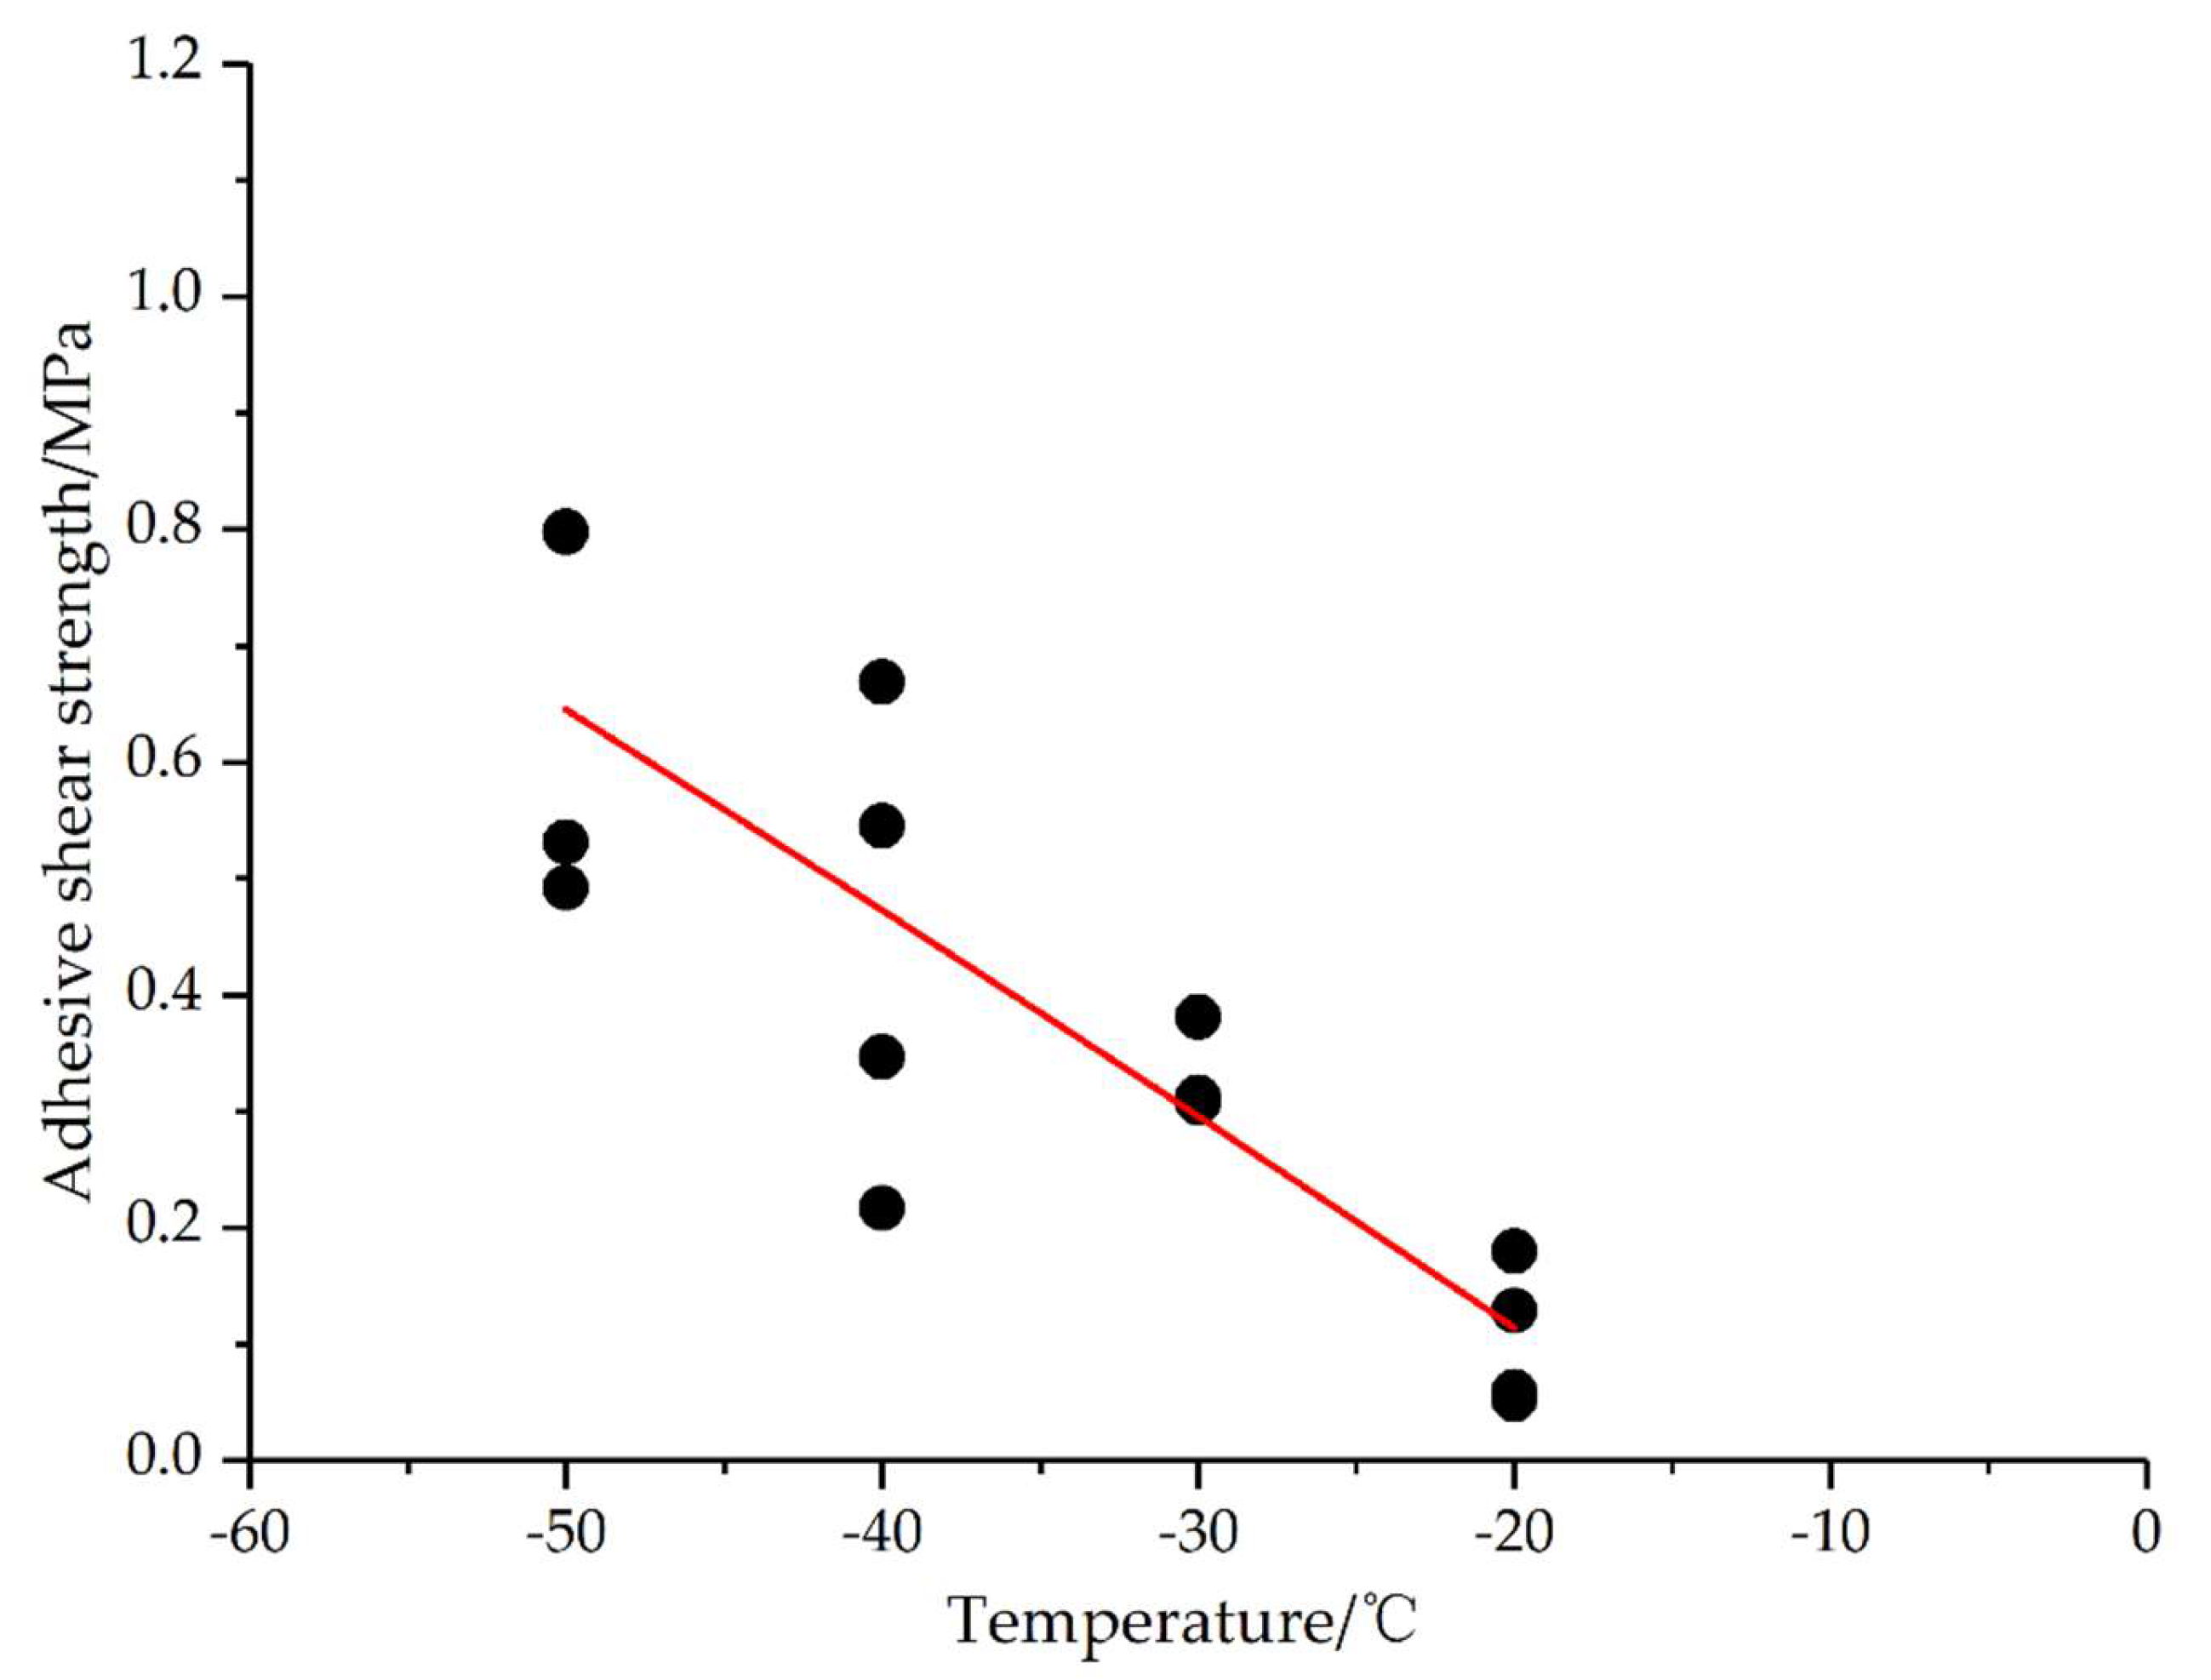
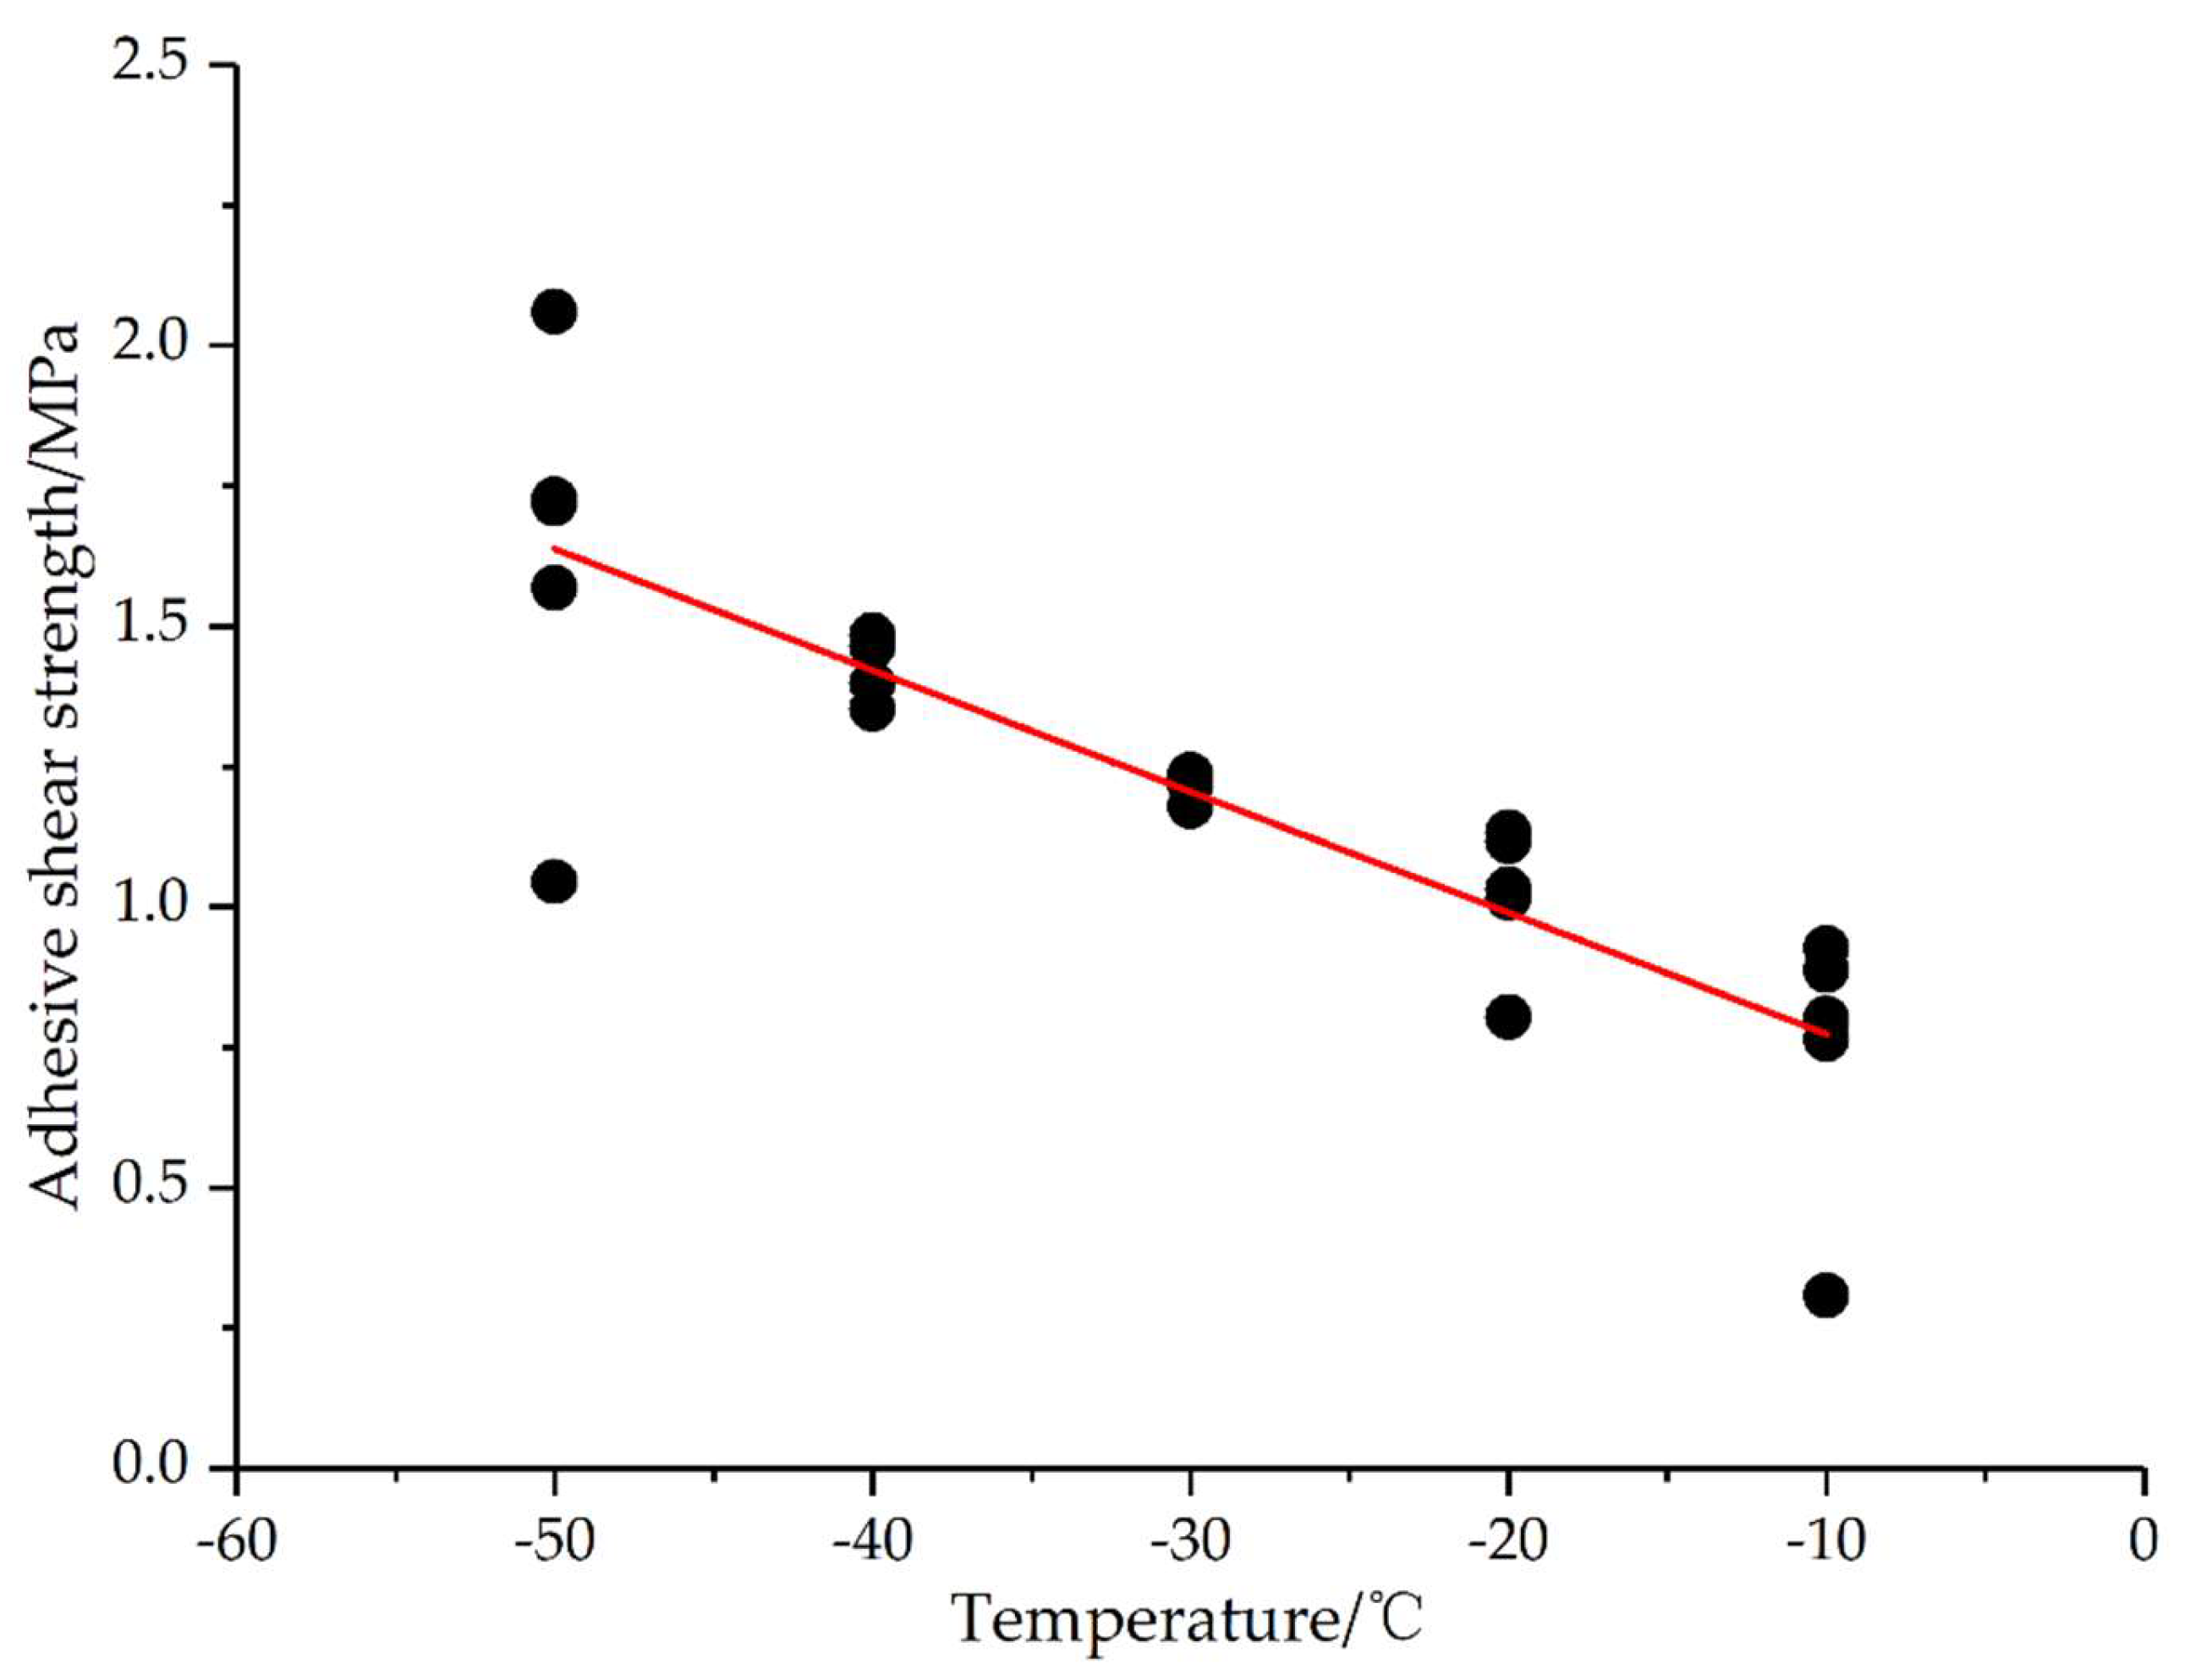
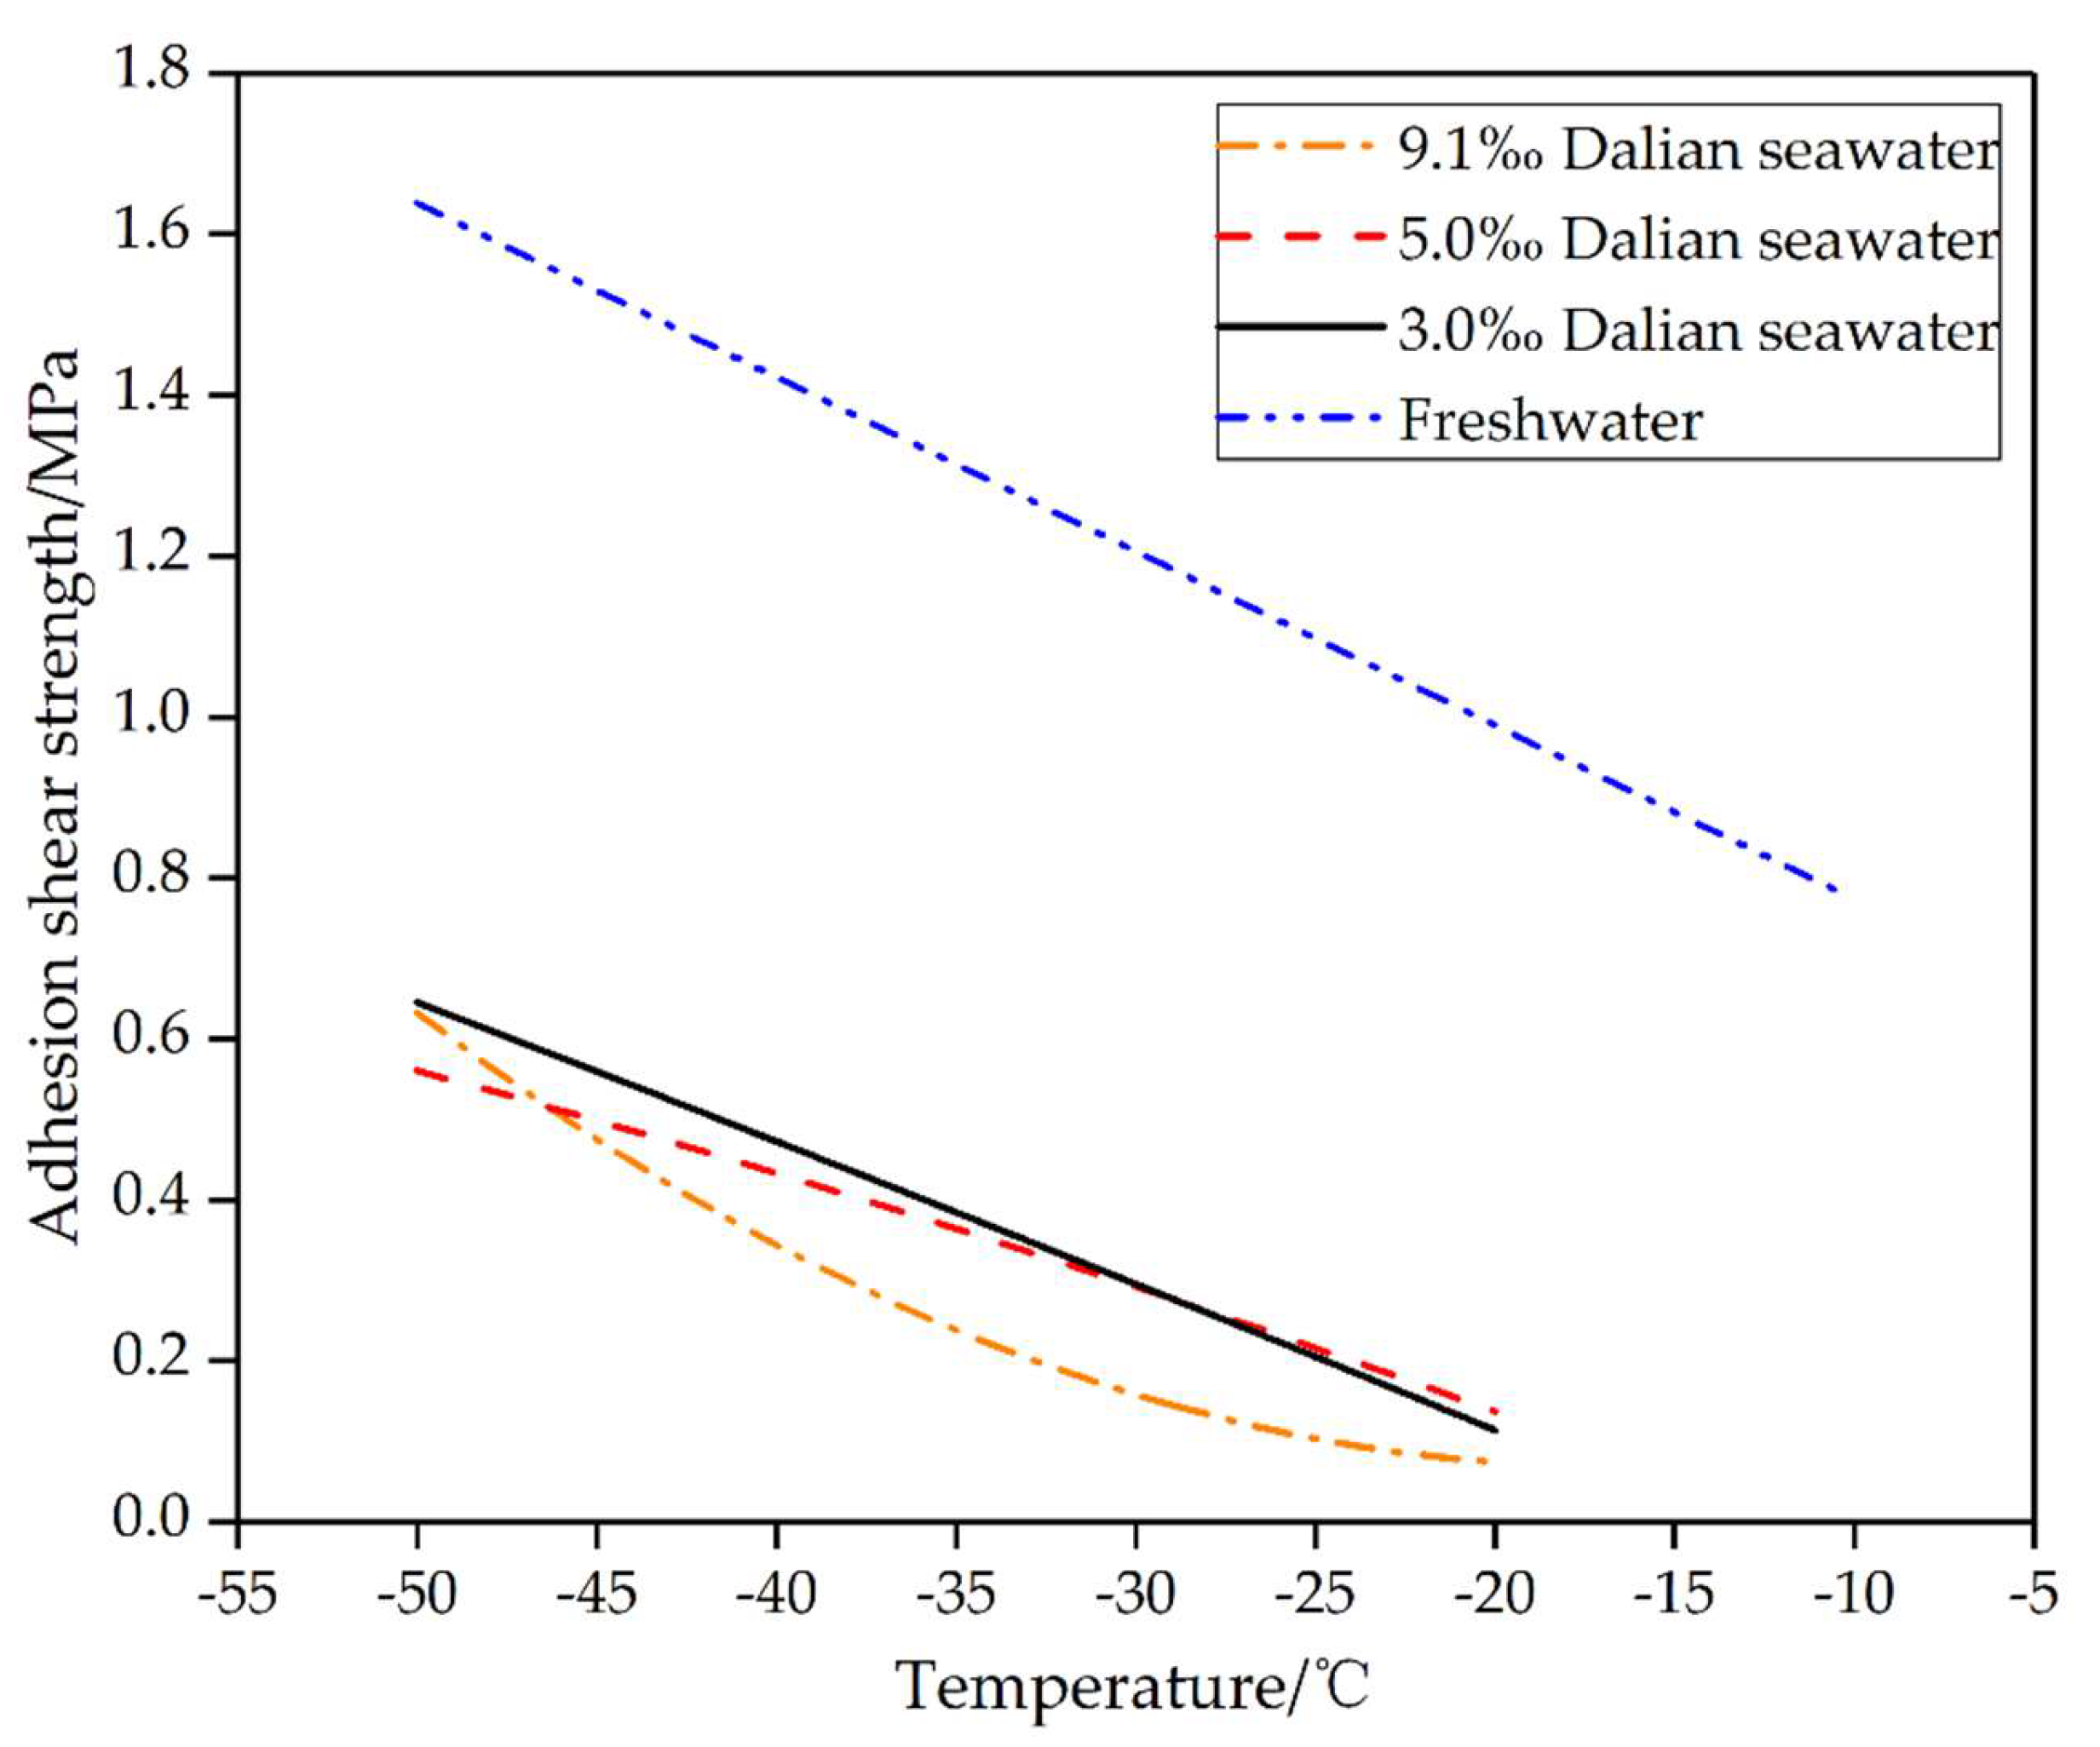
In this study, the adhesion shear strength of tire samples under static icing was negatively correlated with temperature—that is, the lower the temperature, the greater the adhesion shear strength. Specifically, the adhesion shear strength of the four seawater samples (Dalian, Qingdao, Fuzhou, and Zhuhai) under static icing was 0.039~0.823 MPa, 0.060~1.044 MPa, 0.063~0.836 MPa, and 0.059~0.898 MPa, respectively. At −50 °C, the adhesion shear strength of the four seawater samples under static icing reached the maximum.
Petrenko and Whitworth [
24] proposed the microscopic mechanism of ice adhesion, claiming that there were three kinds of interactions between ice and substrate, i.e., covalent bond or chemical bond, van der Waals force, and ionic electrostatic interaction. The study of Petrenko and Peng [
25] confirmed that the ice adhesion force increased with the increase in the number of hydrogen bonds, and hydrogen bonds might be the most important force in the microscopic mechanism of ice adhesion. Wenzel [
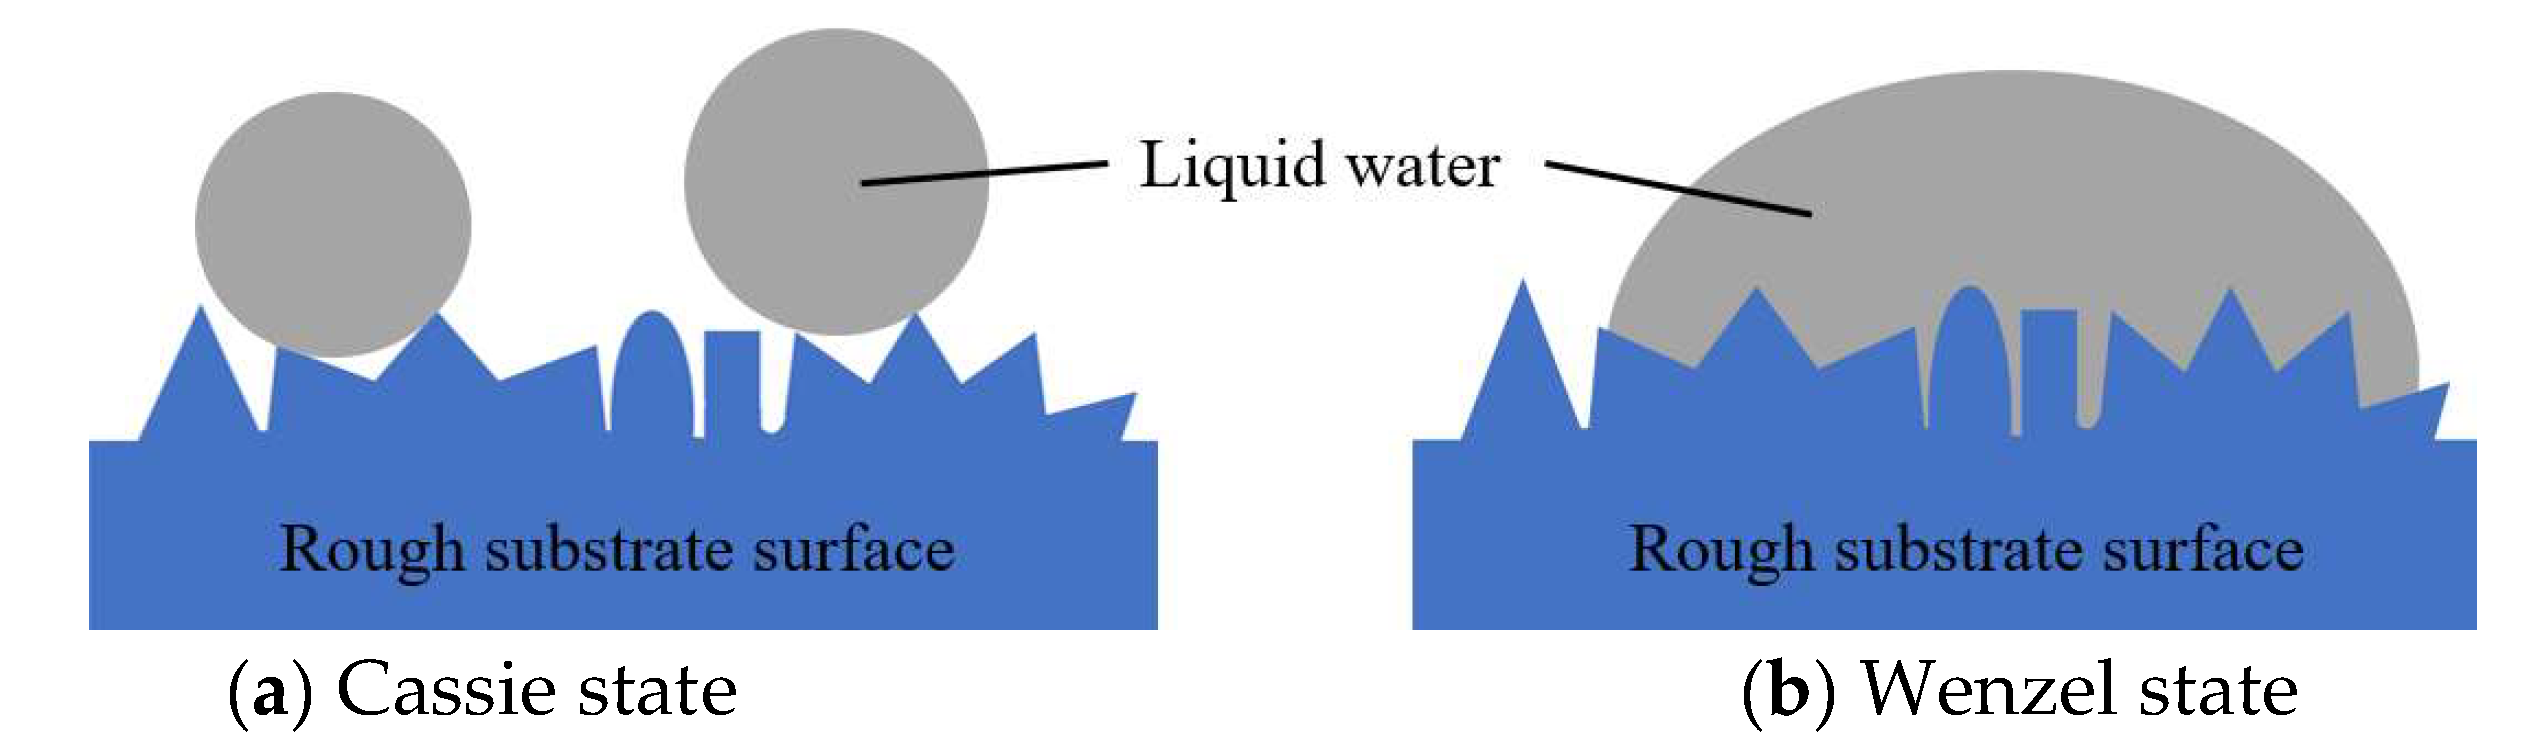
26] studied the relationship between surface roughness and contact angle. There are two states of contact between liquid water and the surface of the rough substrate [
5]. Specifically, when the droplet stayed on the surface structure of the rough substrate, the contact angle was larger. When the droplet wetted the surface structure of the rough substrate, the droplet was in full contact with the surface structure of the substrate, and the contact angle was small, which was in the Wenzel state.
Figure 17 shows two states of liquid water in contact with the rough substrate surface. When water froze on the surface of the rough substrate, if the surface tension of the water is less than the water pressure, the liquid water would enter the uneven micro grooves on the surface of the rough substrate. As the temperature decreases, the liquid water undergoes a phase change, and the ice formed by the liquid water that wets the surface of the substrate and the tiny part of the surface of the substrate produce a mechanical anchoring effect. This mechanical anchoring effect and the microscopic force of the ice and the tire substrate coexist, making the ice adhere to the surface of the tire sample substrate.
As shown in
Figure 12,
Figure 13,
Figure 14 and
Figure 15, when the temperature was relatively high (−20–30 °C), the increase in the adhesion shear strength caused by the decrease of the freezing temperature was relatively small. With further reduction, the increase in adhesion shear strength of seawater samples under static icing became increasingly larger—that is, the lower the freezing temperature, the more significant the influence of temperature changes on the adhesion shear strength of seawater samples under static icing. In the experiments, this phenomenon was the most obvious in the Zhuhai seawater sample.
During the seawater freezing process, brine will be precipitated. Seawater ice is composed of salt-free ice and a cavity containing brine [
9]. In this study, the seawater sample was gradually cooled from 4 °C to the experimental temperature. During the cooling process, a part of ice was formed first. As the temperature further decreased, the water in the cavity continued to freeze on the inner wall of the cavity, which caused the salinity of the water in the cavity to continue to rise. After the water in the cavity froze, the volume of the ice was greater than the volume of the original liquid water. This caused a part of the liquid water with higher salinity to be discharged from the cavity, and a part of the discharged water reached the interface between the ice sample and the tire substrate. Thus, a saltwater layer was formed at the interface between the ice sample and the tire substrate. The original solid-solid contact interface between the ice sample and the tire substrate was destroyed by the solid-liquid-solid contact form. The presence of the saltwater layer would reduce the adhesion of the ice sample on the tire substrate surface. As the temperature decreased, the amount of saltwater discharged from the cavity of the ice sample itself increased, which increased the thickness of the saltwater layer; on the other hand, due to the decrease in temperature, part of the discharged saltwater continued to freeze, the amount of saltwater decreased, and the thickness of the saltwater layer became thinner. Under the combined action of the two factors, the thickness of the saltwater layer reached a maximum value at a certain temperature.
The ice adhesion is closely related to the thickness of the saltwater layer. The thinner the saltwater layer, the greater the ice adhesion. At a relatively high experimental temperature, there was relatively more saltwater at the interface. As the experimental temperature decreased, the saltwater at the interface further froze, and the thickness of the saltwater layer decreased, which was manifested by the increased adhesion of the ice sample on the surface of the tire substrate. When the experimental temperature was low enough (below −40 °C), the saltwater layer was almost completely frozen, and the adhesion was significantly increased. In this experiment, as the temperature decreased, there was no inflection point of the minimum value of adhesion, that was, the thickness of the saltwater layer did not reach the maximum value. Presumably, it might be because in the seawater samples selected in experiment, the temperature at which the thickness of the saltwater layer reached the maximum value was higher (above −20 °C).
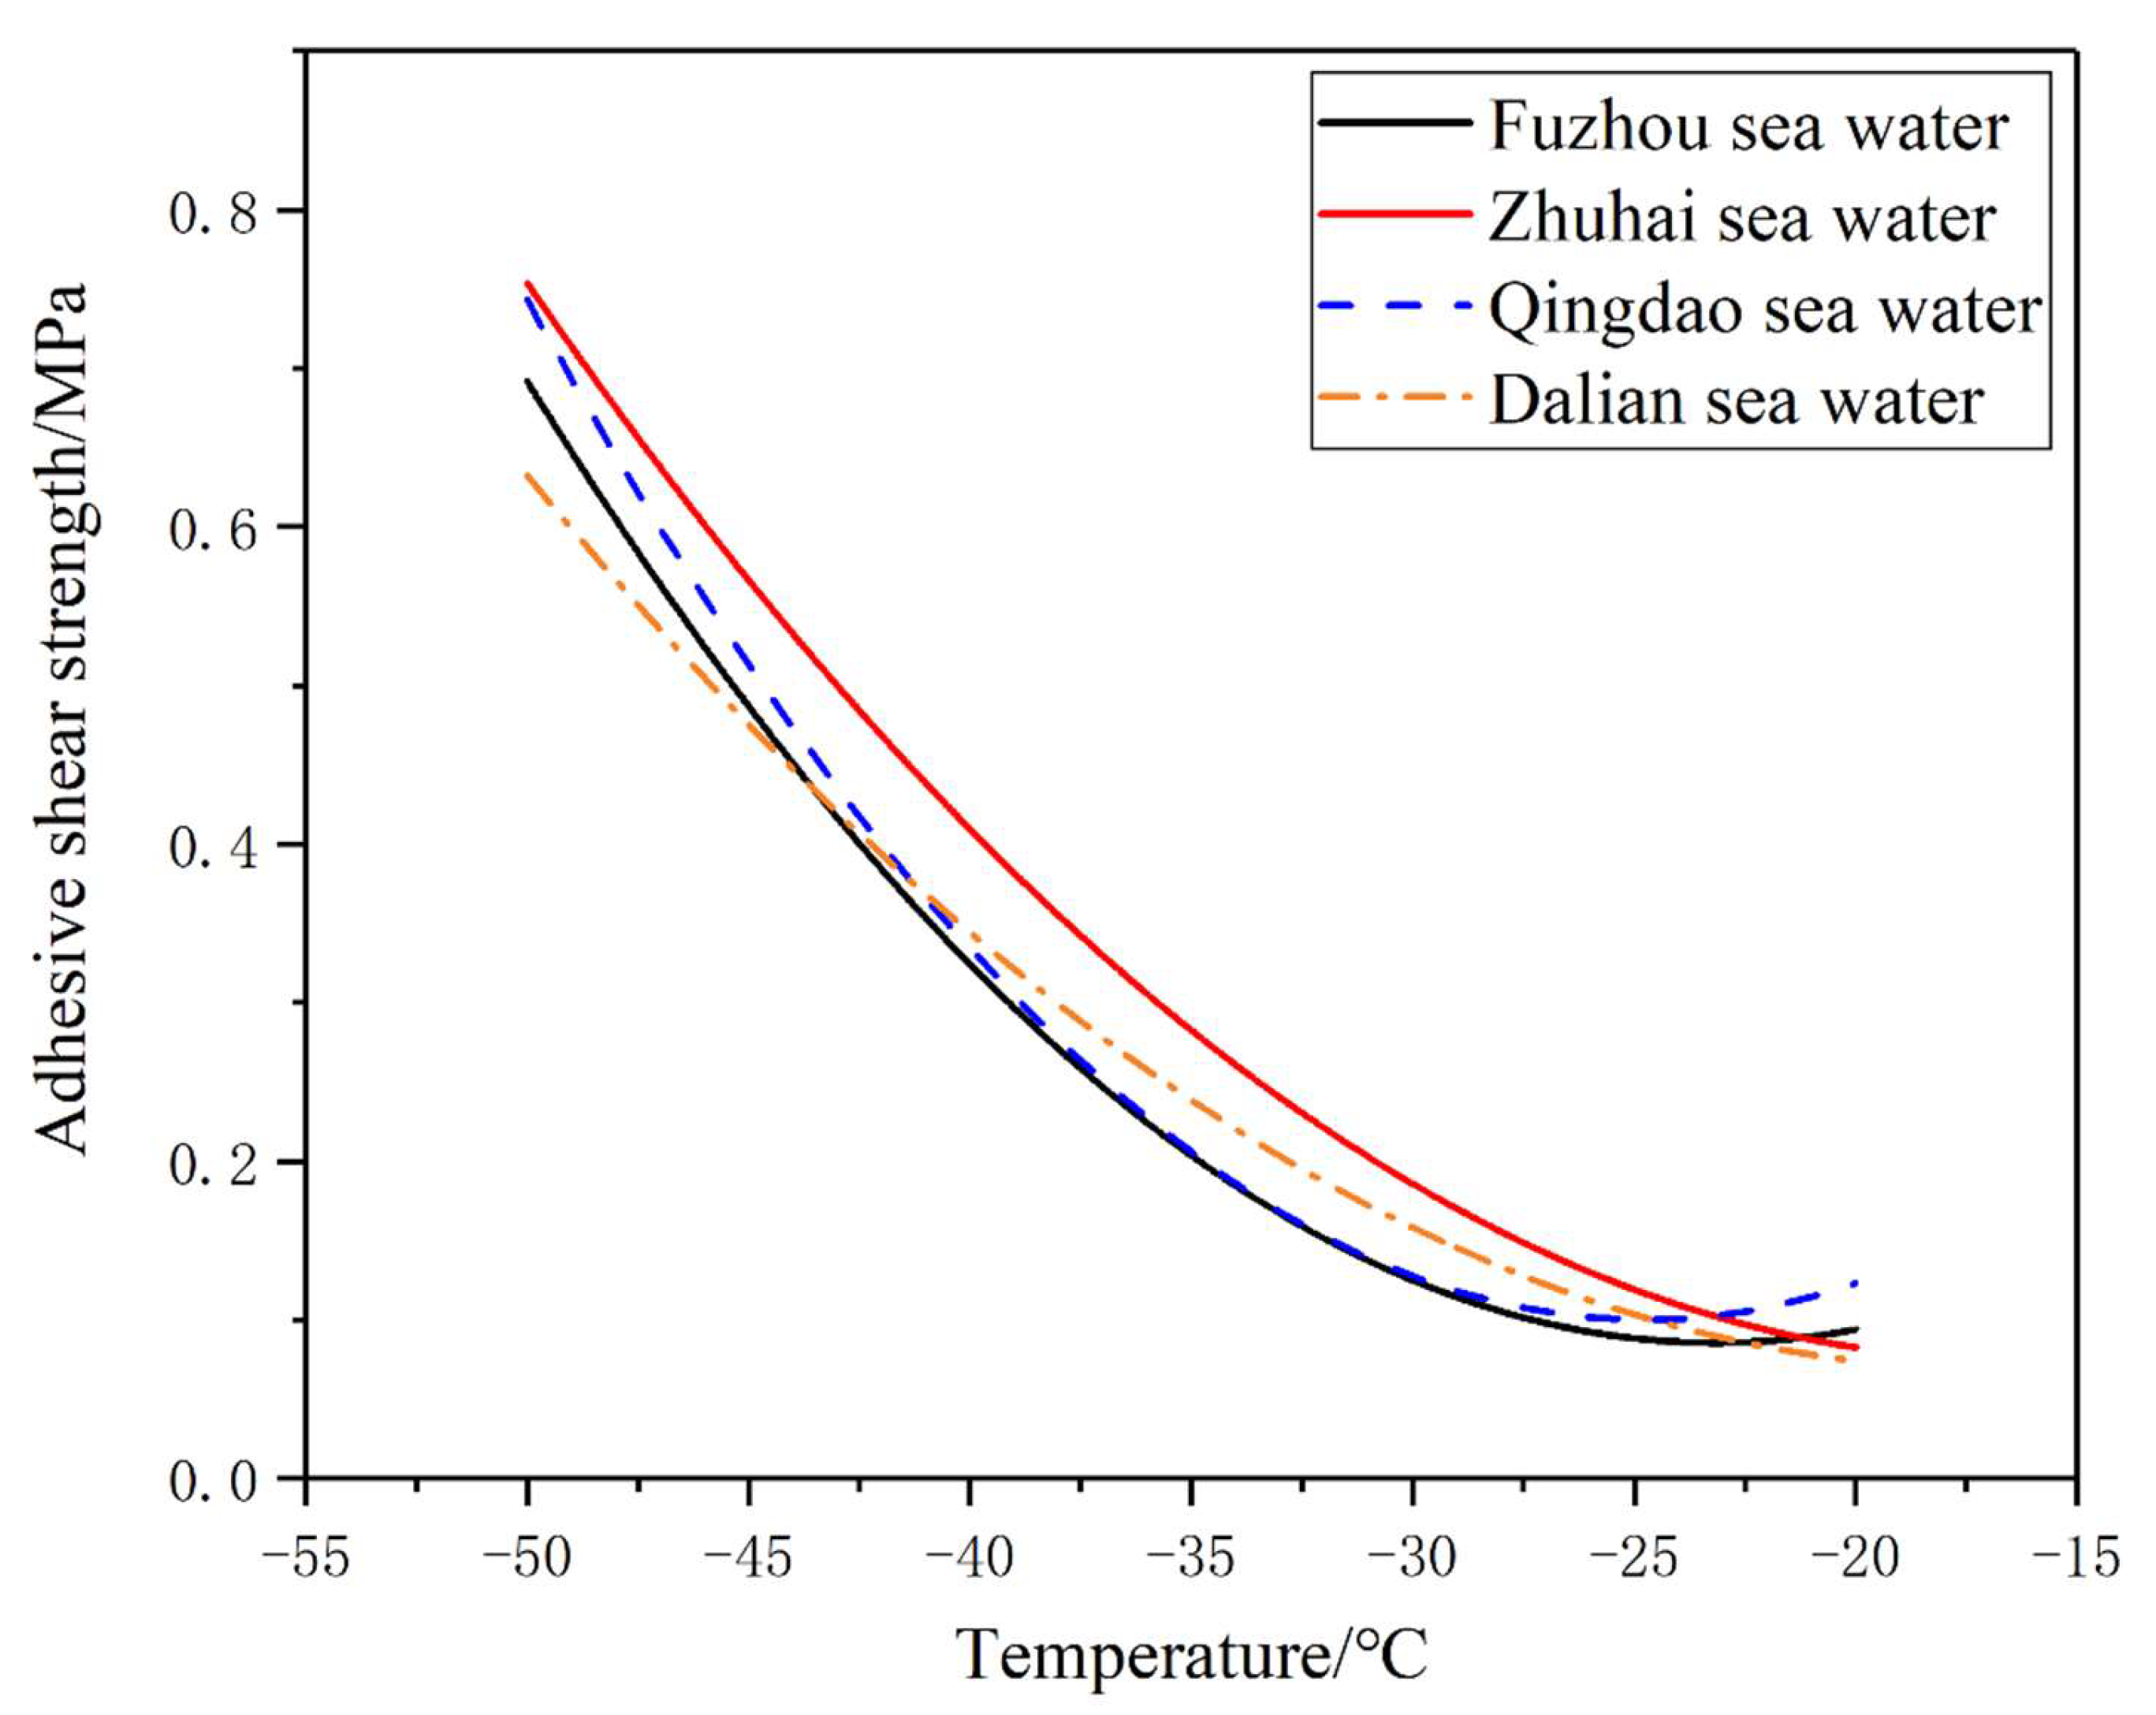
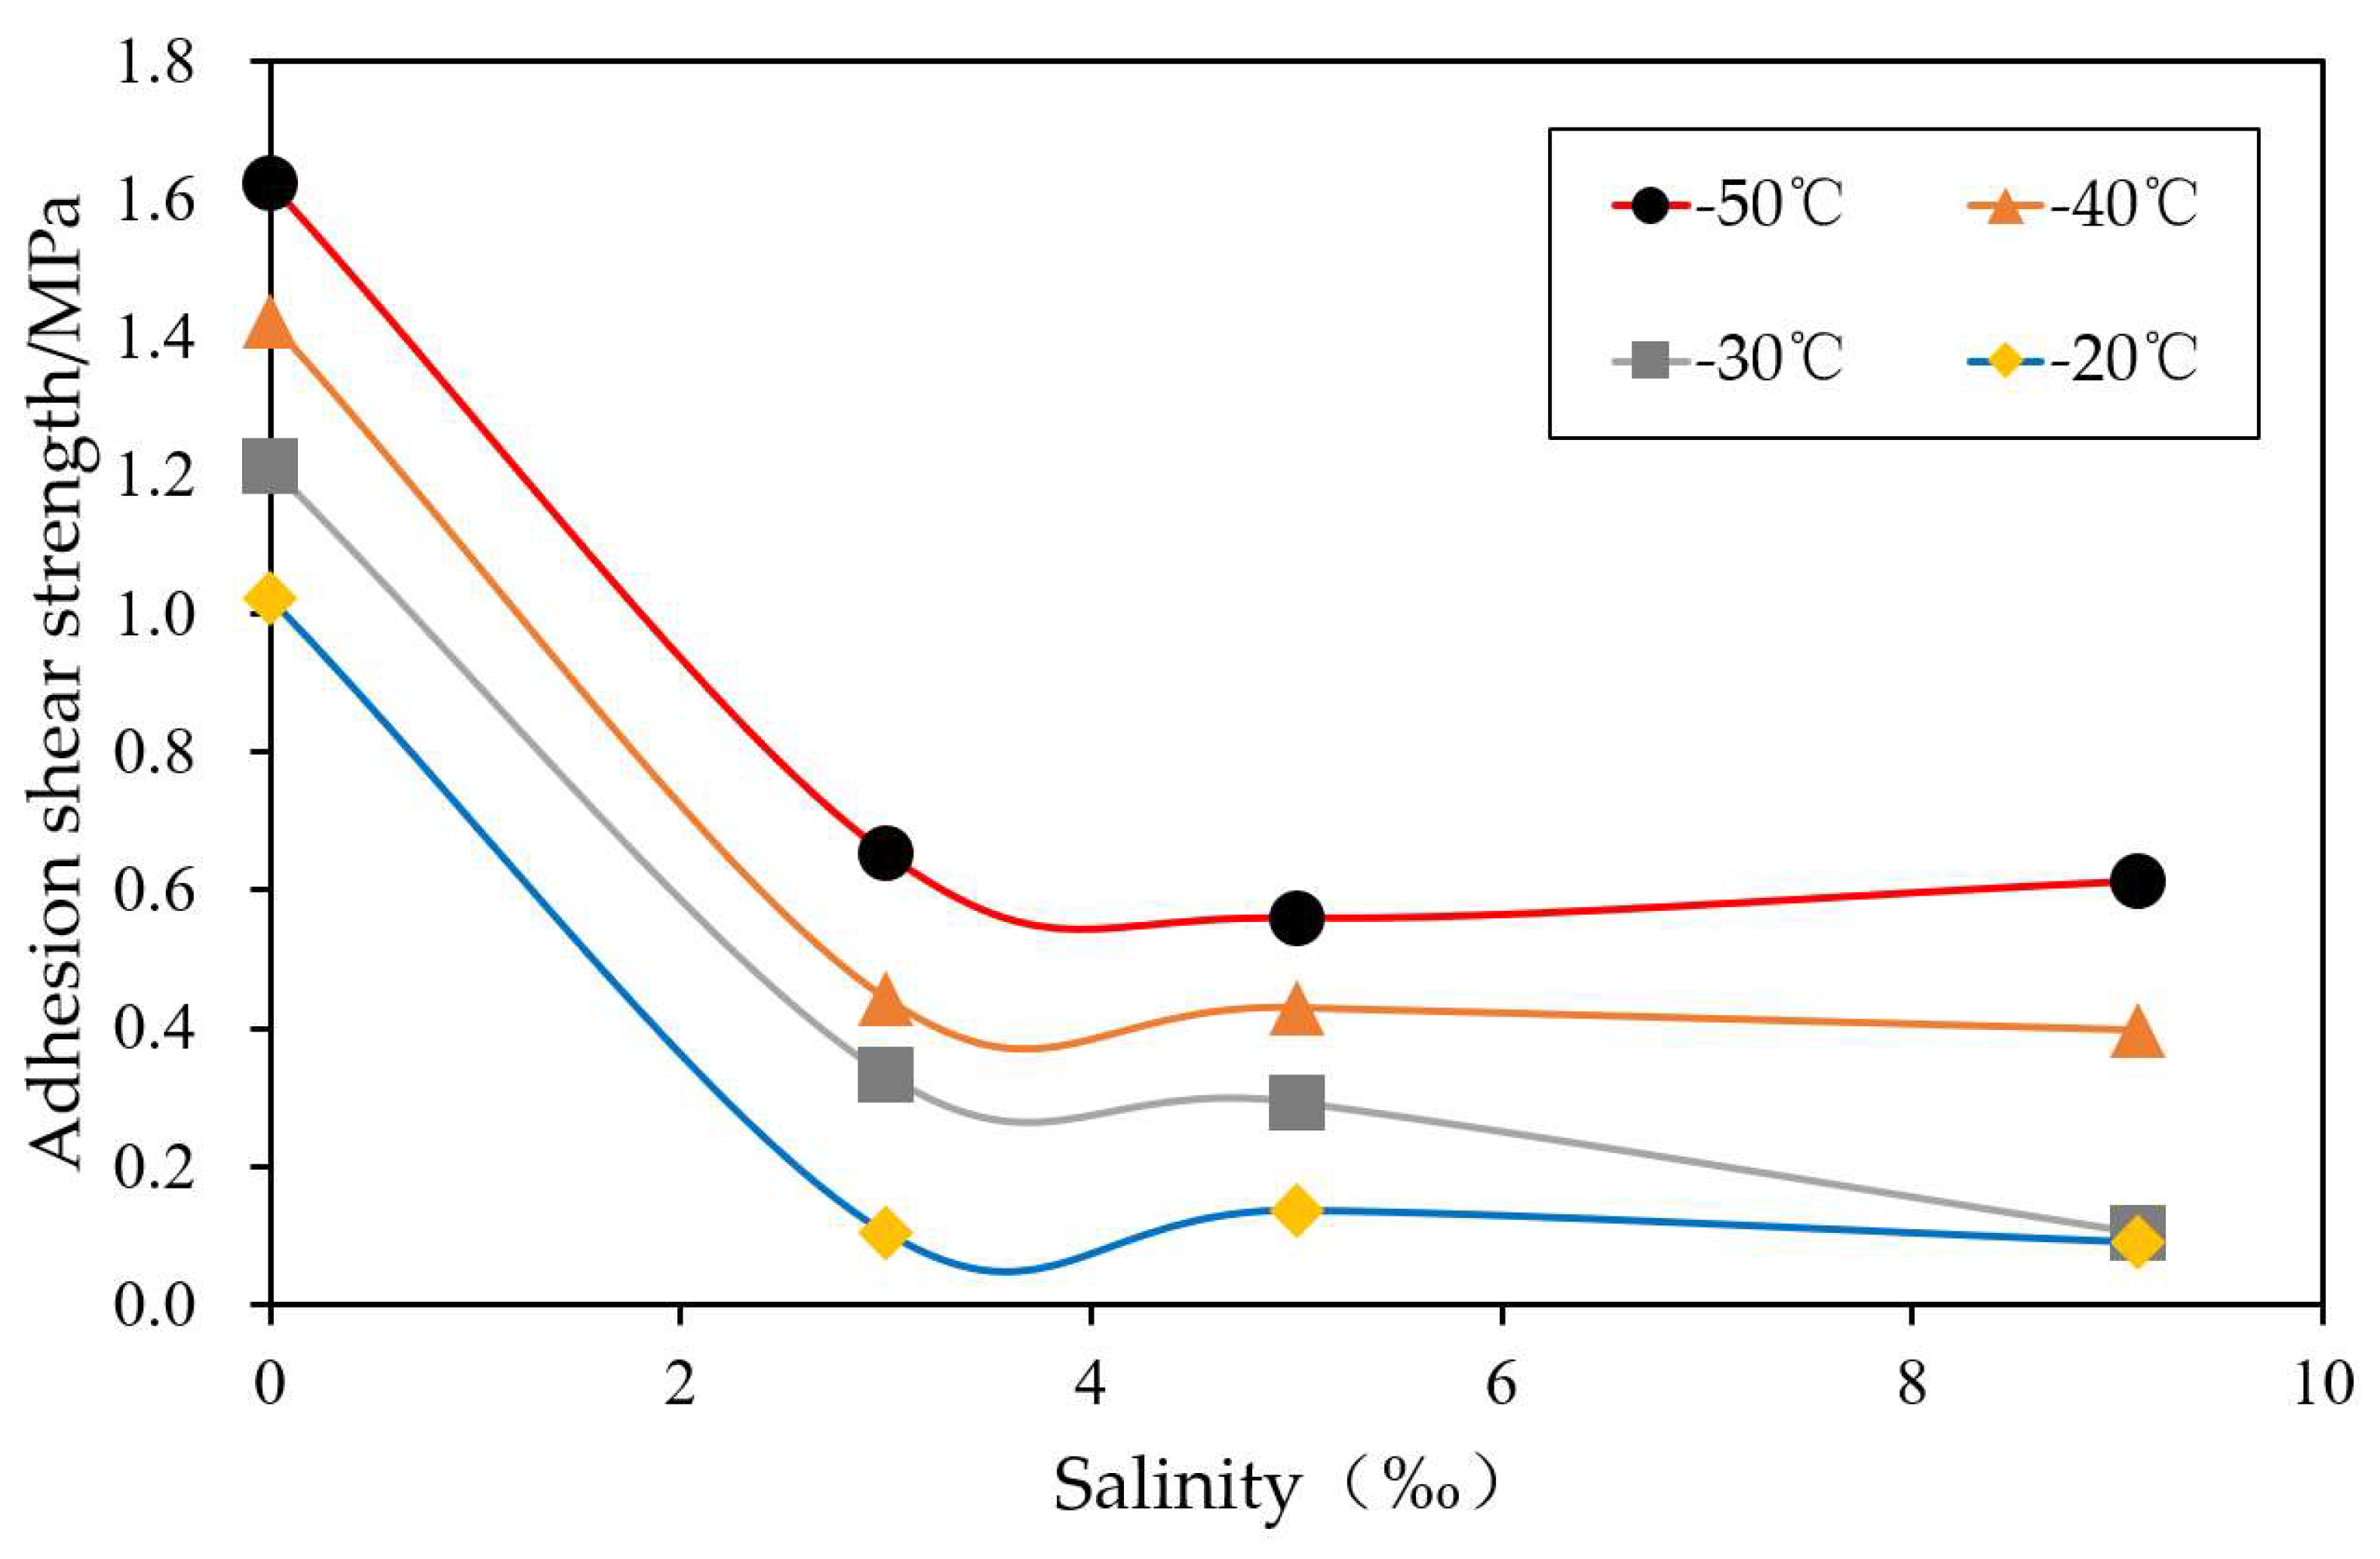
Comparing the measurement results, it was found that the adhesion shear strength of the Dalian, Qingdao, and Fuzhou seawater samples was less distinguishable from each other (
Figure 16), and slightly lower than that of the Zhuhai seawater sample, while the salinity of the Zhuhai seawater sample was lower than that of the other three seawater samples. Based on the freezing temperature experiment, we should further study the effect of the salinity of the freezing water sample on the adhesion shear strength.


