1. Introduction
Towards the end of designing a control system, its tolerance to errors of sensors used in the system can be checked. The outcomes verify reliability and provide information on how it affects the accuracy of the designed system. It is very important to investigate how and to what extent sensor errors change the behavior of the system.
This article focuses on the impact of errors on a flight stabilization system using trimmers designed for the single engine, turboprop trainer aircraft [
1,
2,
3]. This system relieves pilots during flight, so there is no need to trim the aircraft every time when changing flight parameters. The Trimmers Stabilization System (TSS) has two modes—the first one is the STAB mode, which is used to maintain the altitude and heading of the aircraft; for this purpose, the control system calculates the deflection of elevator and aileron trimmers. The second one, the ATSK mode, is responsible for elimination of the side-slip effect caused by the propeller; in this case, only the rudder trimmer is used [
4]. It was necessary to investigate how the accuracy and robustness of sensors can influence the behavior of the designed system.
For the operation of control systems, flight parameters such as airplane heading, altitude, bank angle, and pitch are essential. It is necessary to constantly check for errors between the set and measured controlled parameters. The Inertial Measurement Unit (IMU) is responsible for providing data on the acceleration acting on an object and the angular velocities to determine its orientation and position (so-called dead reckoning). One of the disadvantages of this type of navigation is sensitivity to the accuracy of the sensors used and their errors. They can lead to malfunctioning of the system. There are many IMUs available on the market; they differ in accuracy, range of measurements and, above all, price. From an economic point of view, the best solution would be to use the cheapest IMU with the highest measurement accuracy, which would ensure correct measurements throughout the flight. Therefore, a compromise between these factors is an important task. This is possible by checking which sensor error values negatively affect the operation of the system.
The aim of this work is to investigate which type of sensor errors have the most significant impact on the quality of the system and what are the critical values of the error parameters. This information is important for the validation of the designed control system.
There are many articles describing this problem. Luu describes the errors which mostly occur in Mems IMUs [
5]. Tripathi presents the sensitivity analysis of various types of sensor errors, such as bias, misalignment, and scale factor and their impact on tactical flight navigation [
6]. Ayre-Sampaio describes the outcomes of comparing three IMUs for strapdown airborne gravimetry [
7].
This work takes into account the influence of the most common sensor errors occurring in such systems. The present article is distinguished by the fact that different IMUs with different accuracy classes are compared. The error parameters were collected from their datasheets and implemented in the model.
The performed tests showed that the IMU of the best and middle class of accuracy did not significantly affect the control system; the efficiency of the system was still acceptable. Critical values of error parameters were presented and the operation of the control system was examined. Differences in the use of various IMUs with miscellaneous accuracy classes are shown [
8].
The structure of this paper is as follows:
Section 2 describes the tools used to conduct the test. Then the test plan is introduced, and the problems are described.
Section 3 presents the obtained research results.
Section 4 summarizes the results obtained and discusses the consequences, along with a description of subsequent research plans.
2. Materials and Methods
This research was conducted at the Avionics Department of Institute of Aviation. MATLAB/Simulink r2019b was used to model and design the aircraft and the flight control system.
A test was planned to check the behavior of STAB and ATSK modes with occurrence of the chosen sensors’ errors. The test plan is presented in the points below:
Altitude hold test with occurrence of white noise from gyroscopes during a steady flight;
Altitude hold test with occurrence of white noise from gyroscopes during a flight disturbed by the appearance of altitude error;
Heading hold test with occurrence of white noise from gyroscopes during a stable flight;
Heading hold test with occurrence of white noise from gyroscopes during a flight disturbed by the appearance of heading error;
ATSK mode test with occurrence of drift error of Torque Sensor on the Shaft (TSoS) during a stable flight;
ATSK mode test with occurrence of white noise from Torque Sensor on the Shaft (TSoS) during a stable flight.
The simulation logs were imported from each simulation; then, the simulation data were presented and the specific variables analysed using graphs.
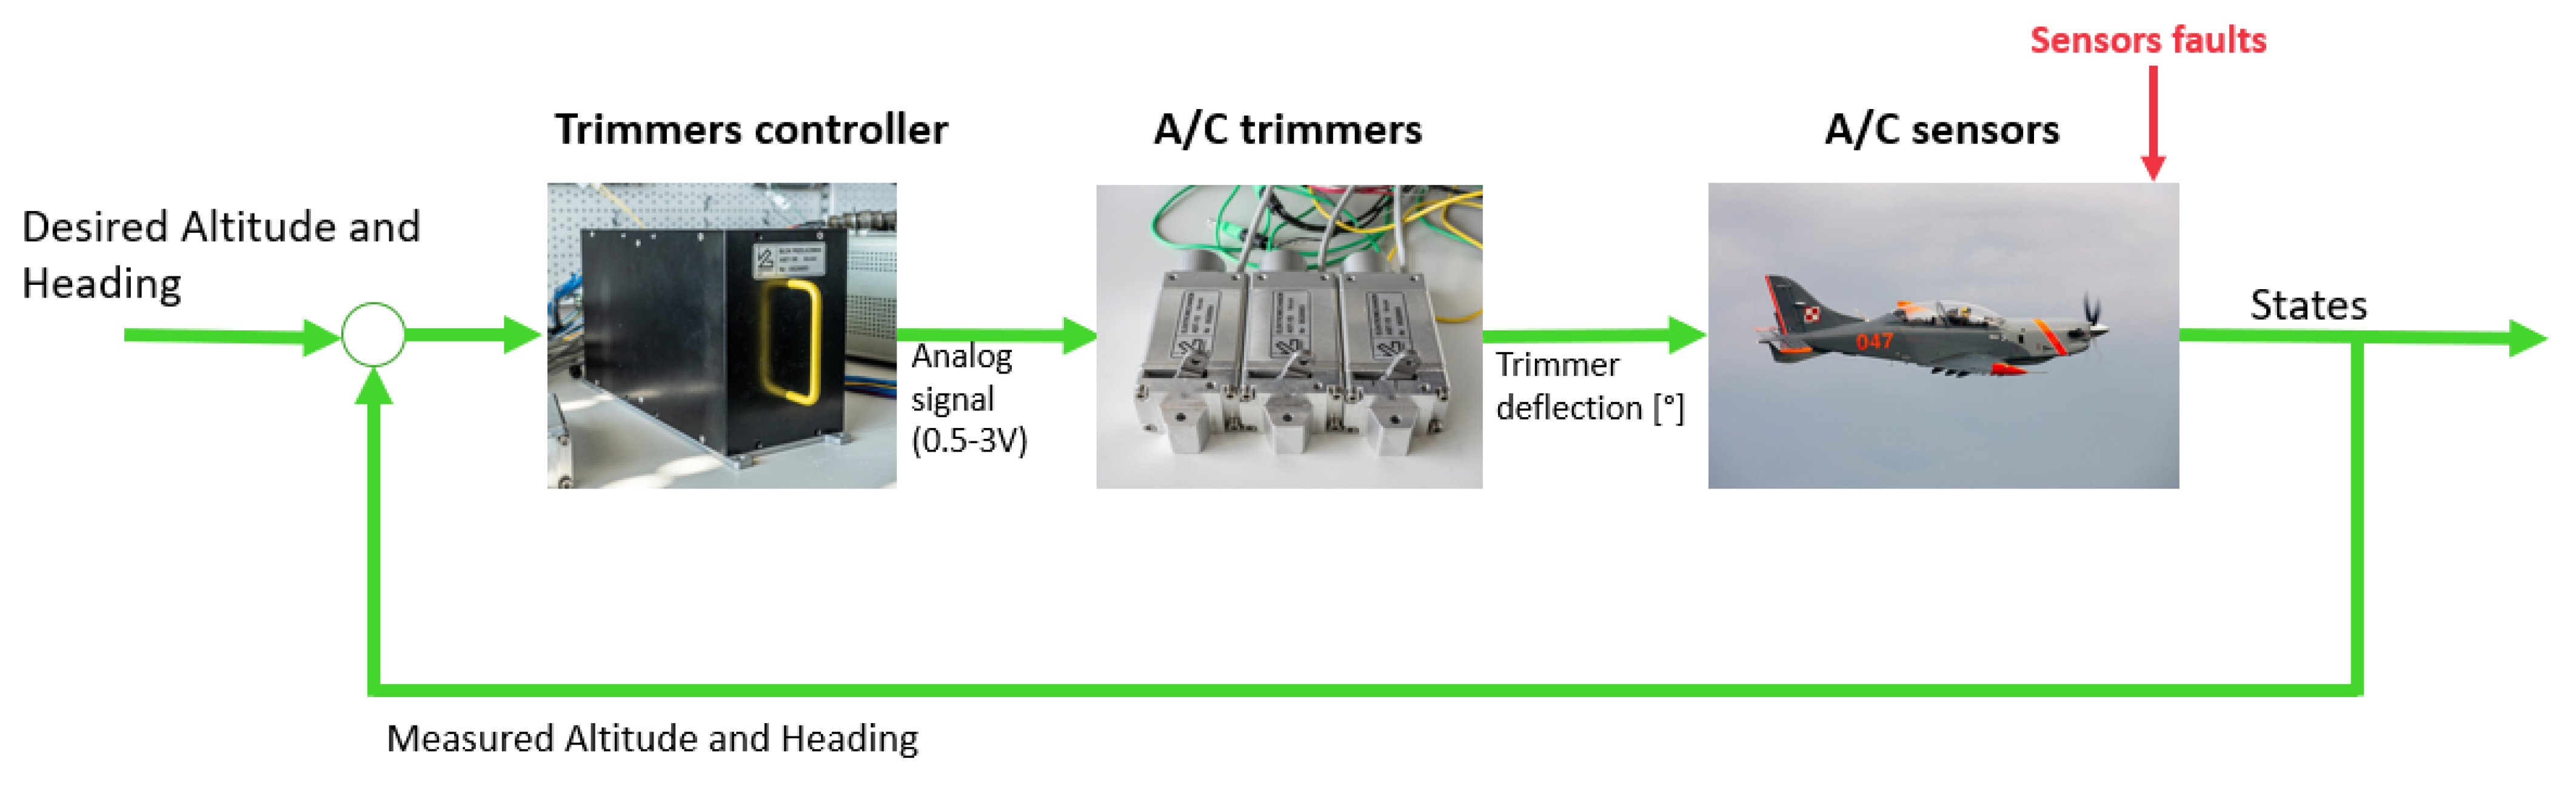
The general structure of the TSS system is shown in
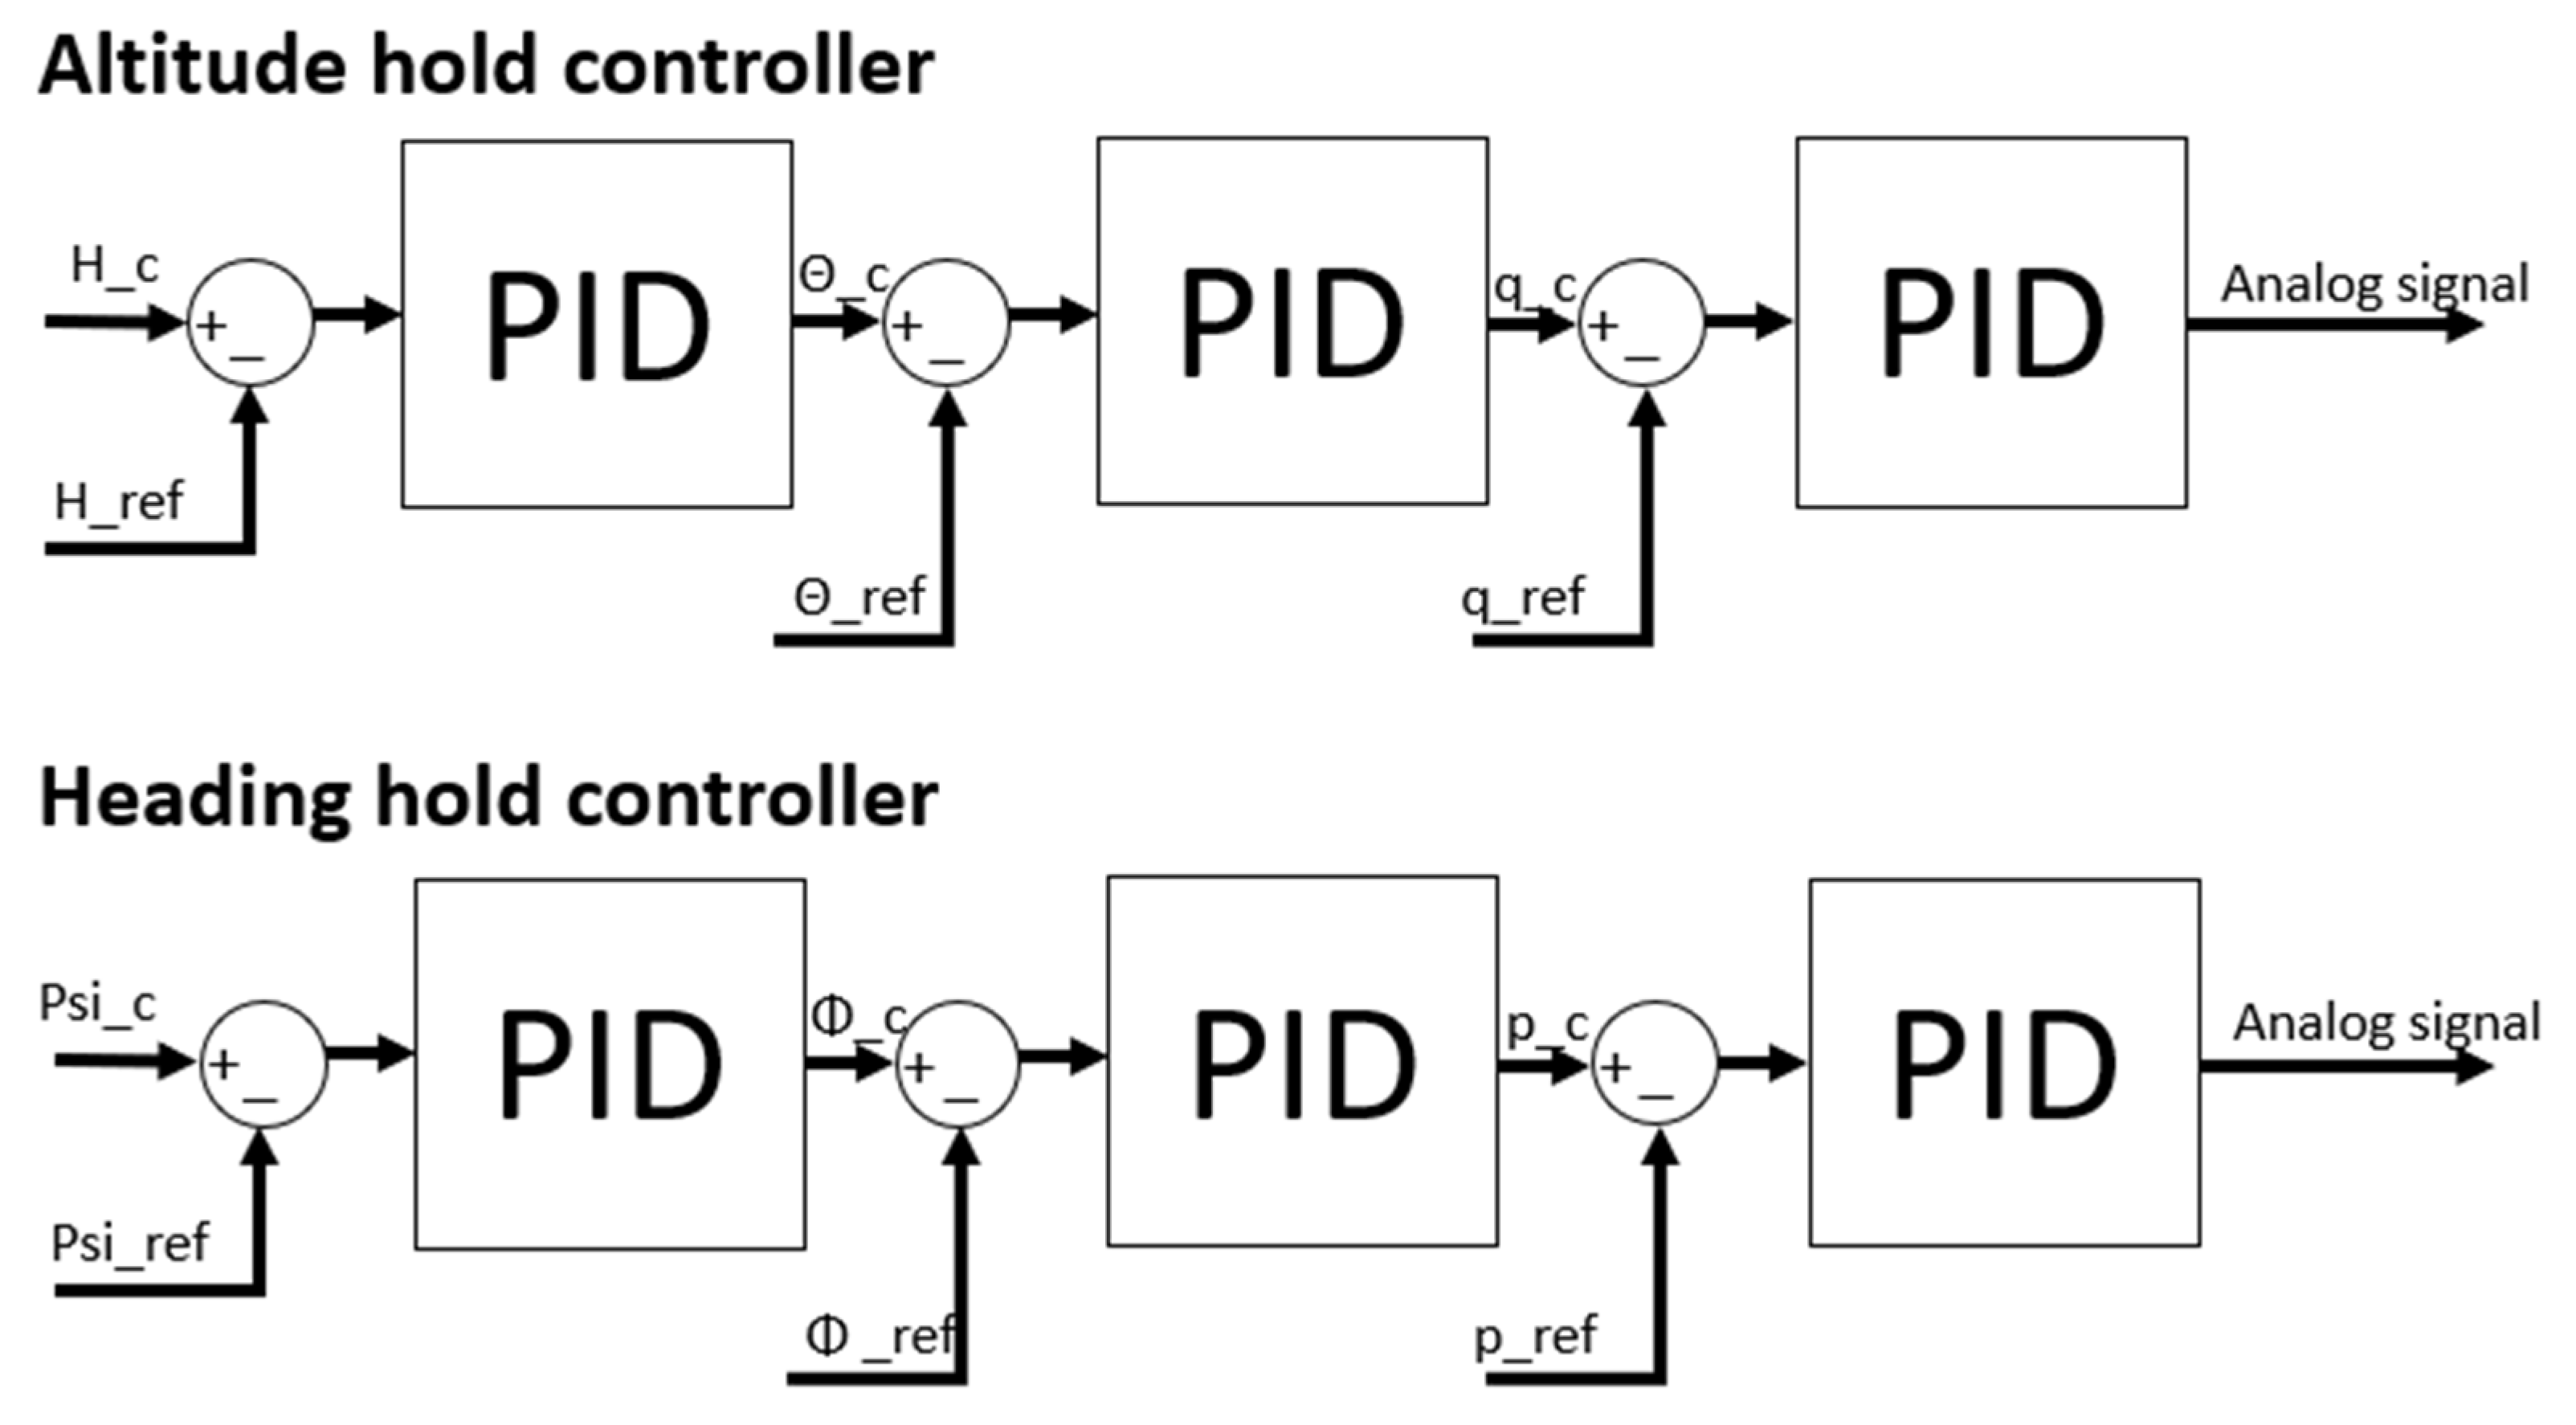
Figure 1. The trimmer controller calculates the deflections of trimmers to ensure stable flight of the airplane. The algorithm implemented inside is based on the PID controller, which is responsible for maintaining the altitude and heading of the aircraft. A simple scheme of the controller is shown in
Figure 2. The signal then goes to the trimmers causing the rotation of the aircraft; signals from sensors distorted by all kinds of errors go to the trimmer controller.
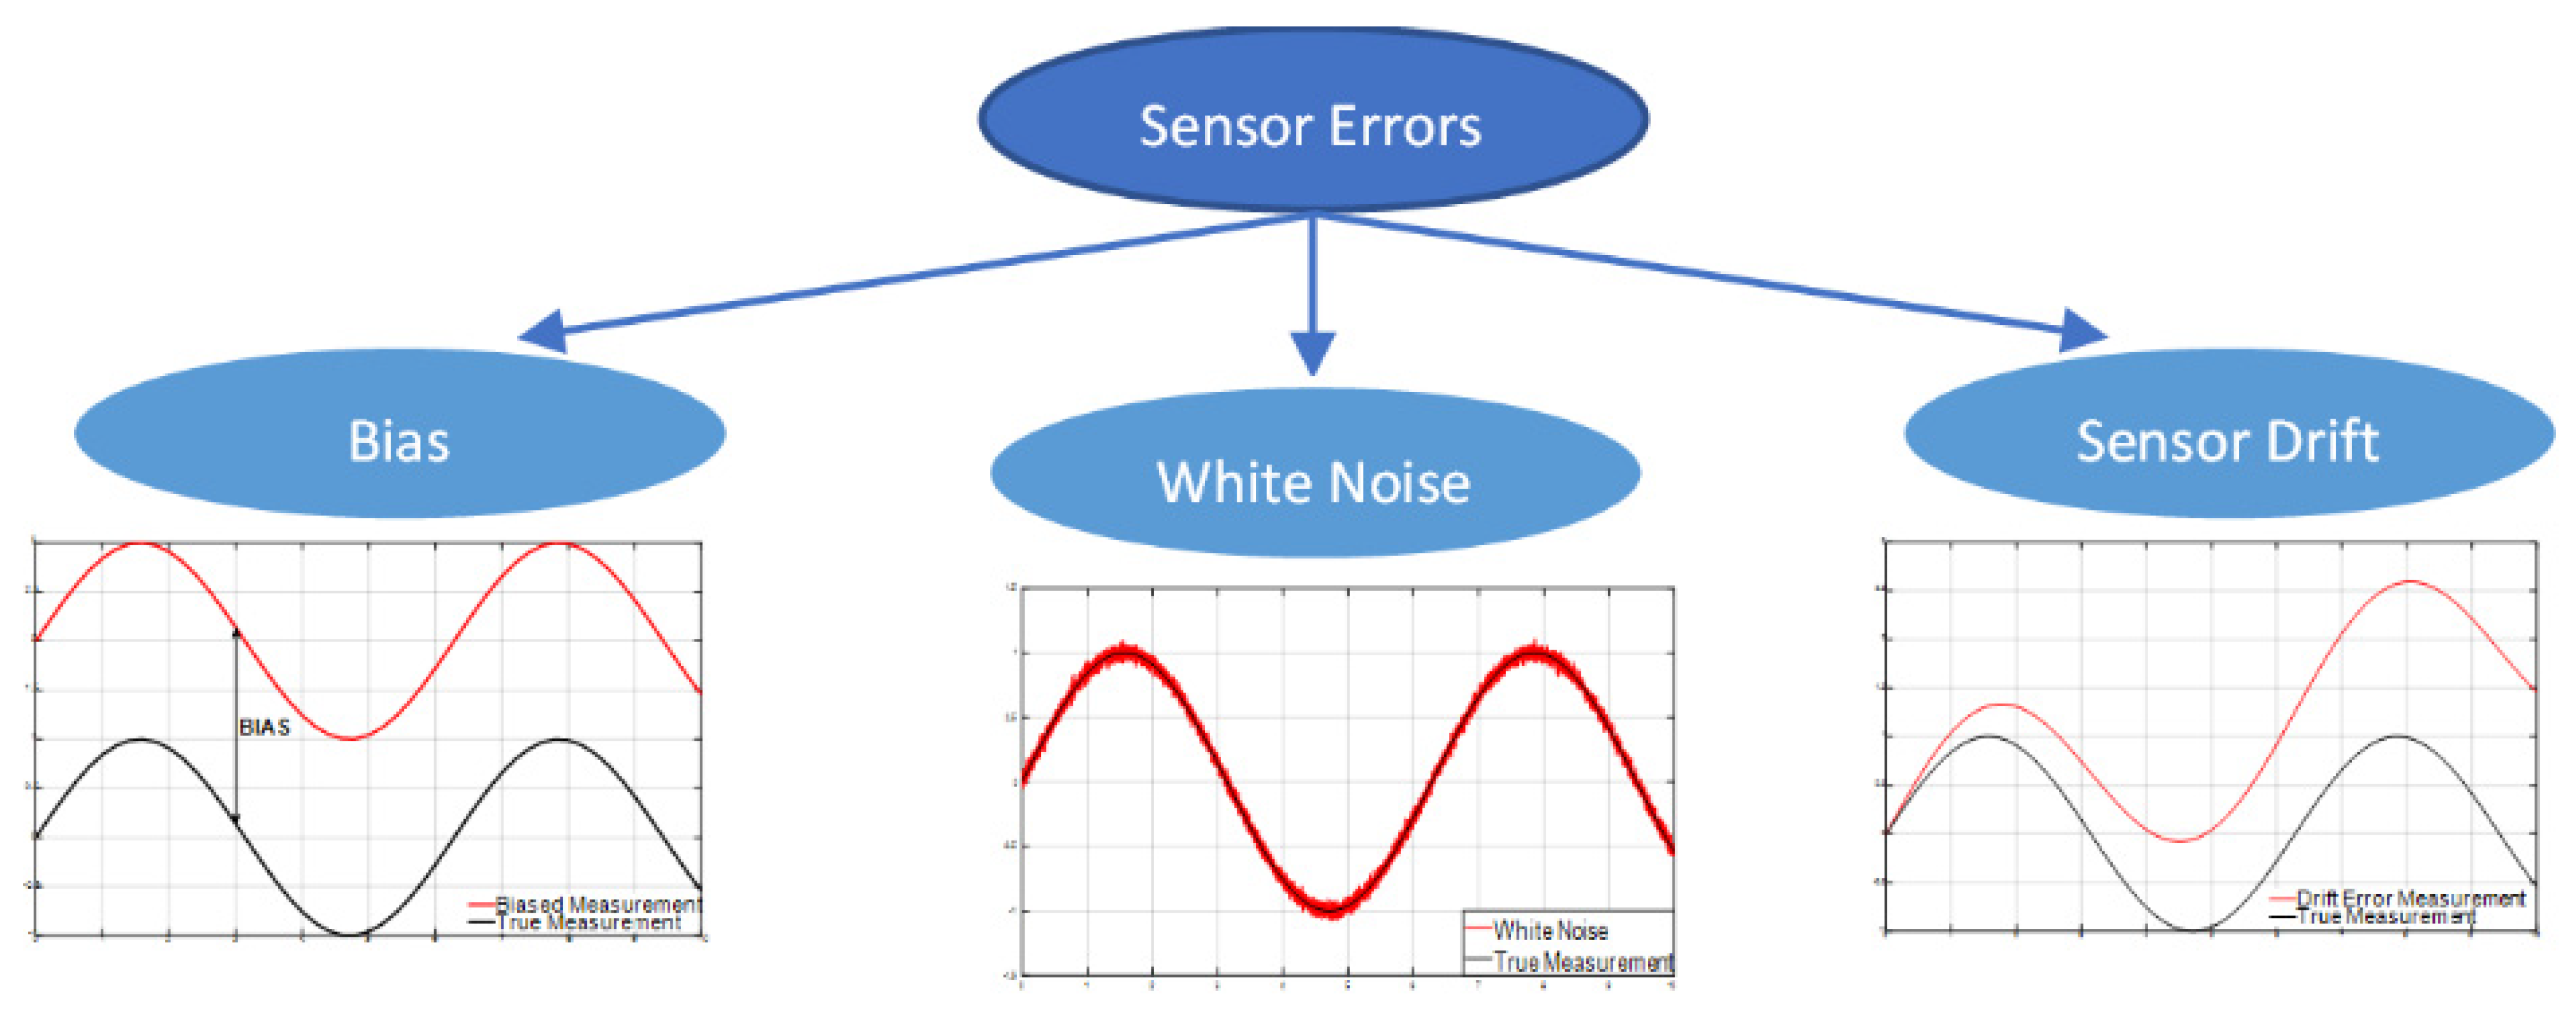
During the tests, white noise, bias error, and sensor drift were applied to the modelled sensors [
9]. The white noise was represented by a random signal with equal strength at different frequencies. The sensors were disturbed with a constant value of power spectral density during the tests. The bias error is a systematic error that usually occurs when the sensor is incorrectly calibrated, characterized by a constant deviation of the sensor indications from the real values. Sensor drift causes an increasing error over time. The tests were planned to check the impact of each error on the system operation.
Figure 3 shows the types of applied errors [
10].
The white noise error was parametrized by the constant value of PSD (Power Spectral Density) [
11]:
where
is the Fourier transform of the signal
xT,
f is a frequency, and
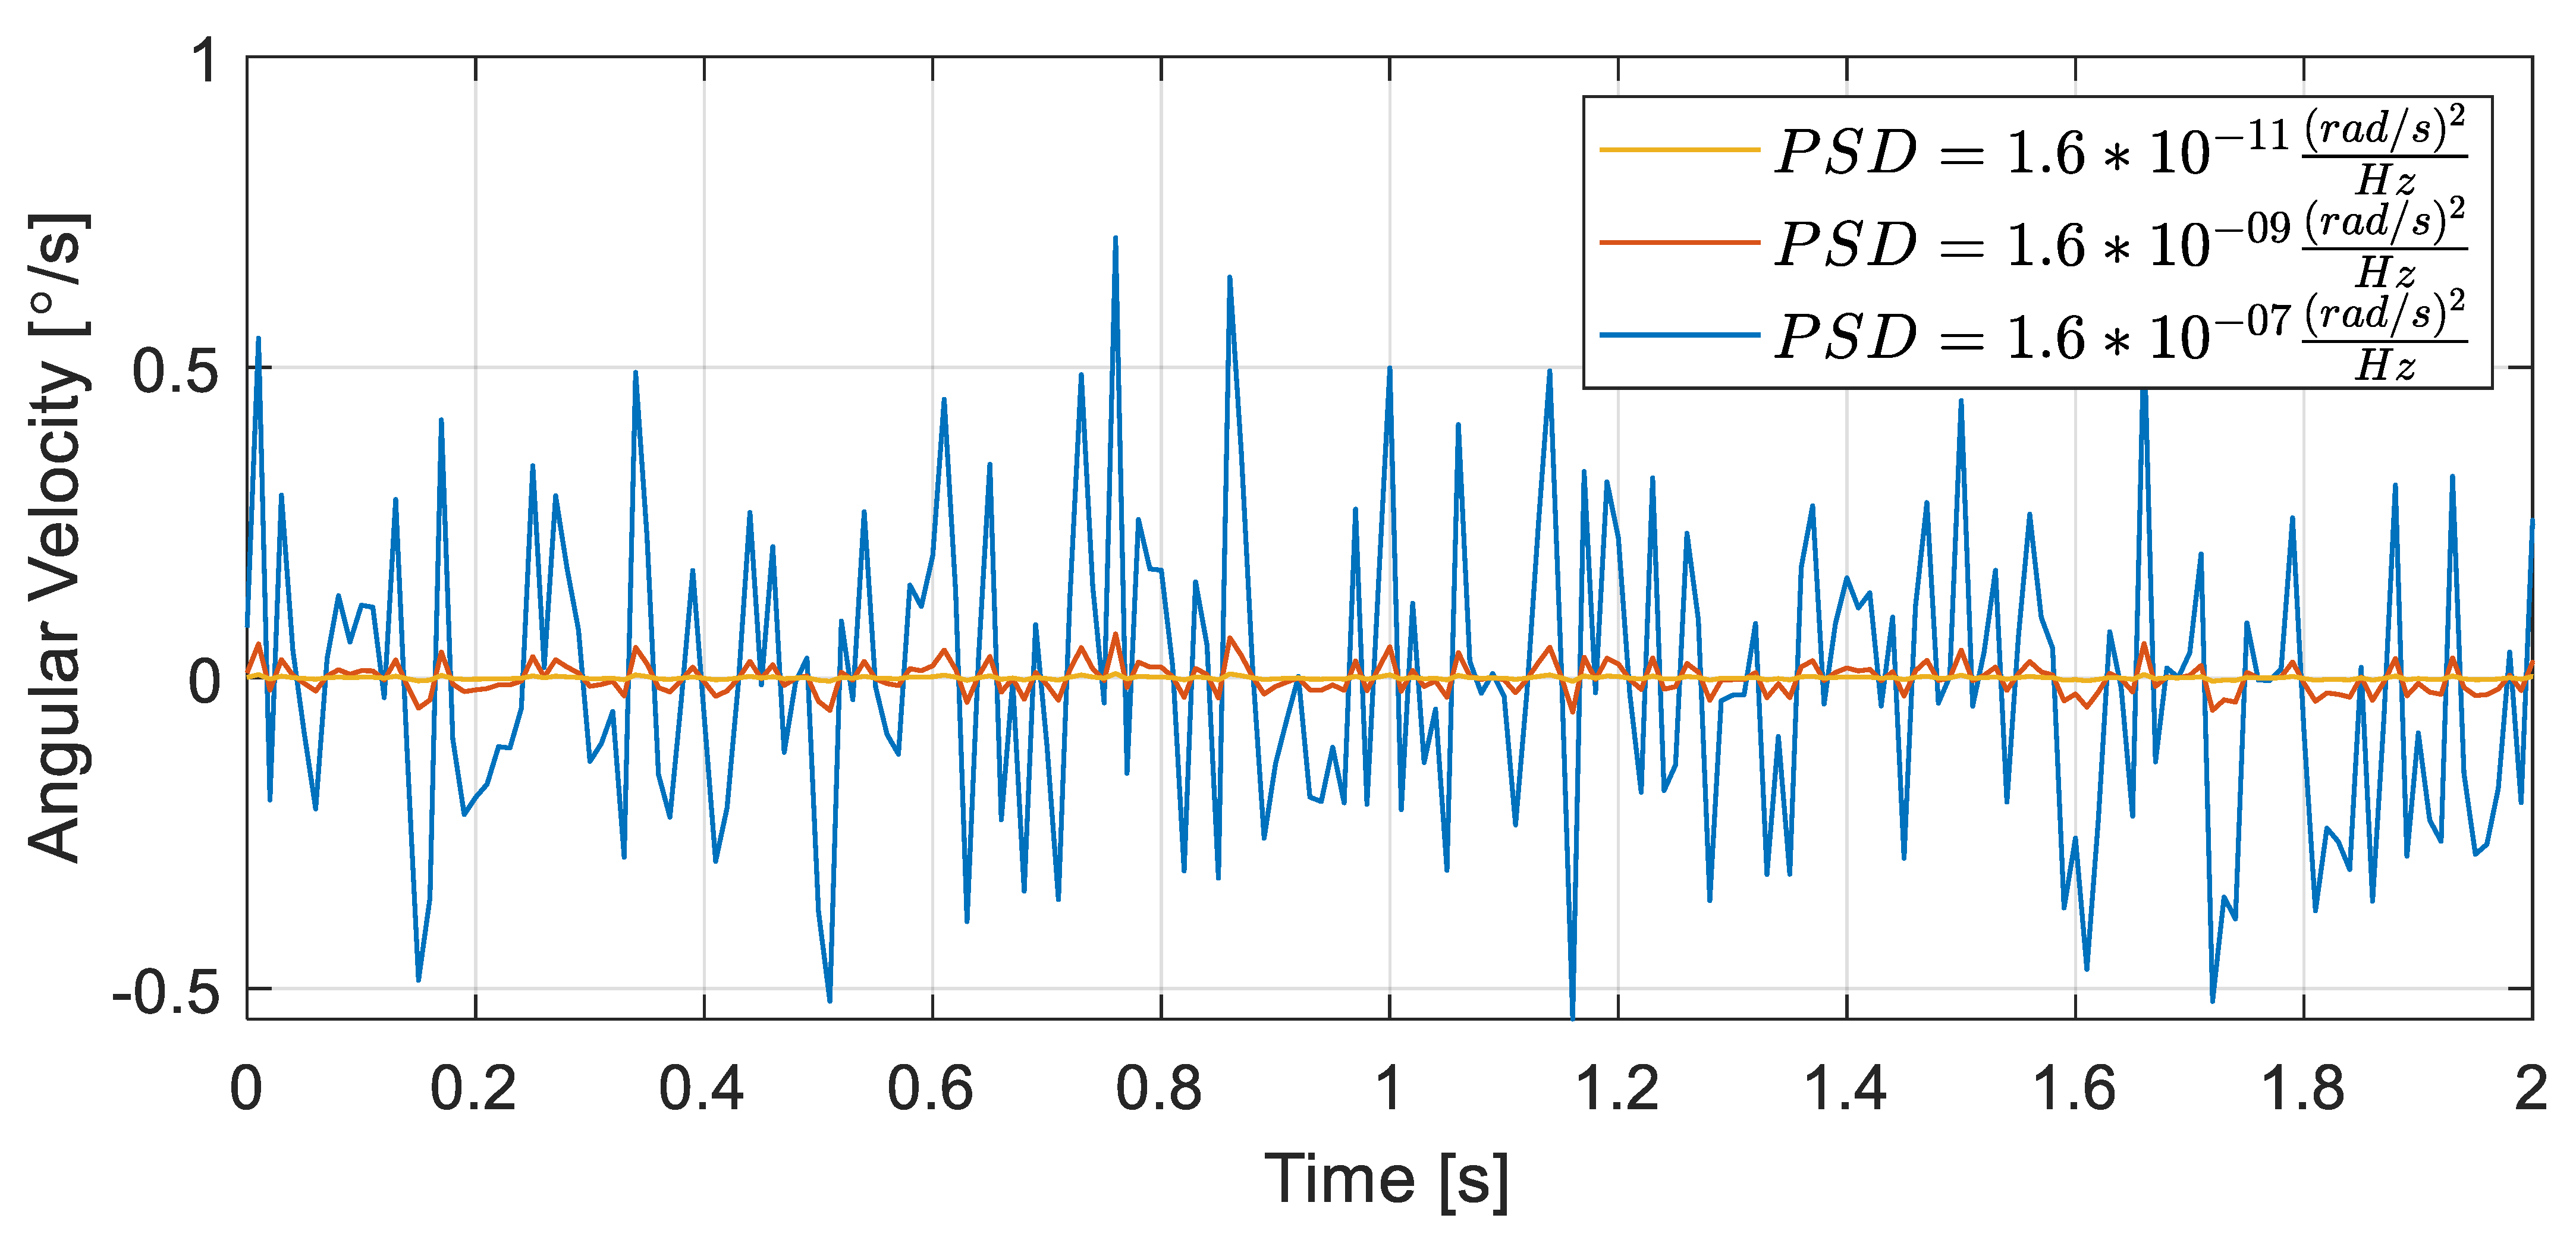
T is the period of signal. In the test, three different values of PSD were taken into consideration; the values are presented in the table below.
The first value is taken from KVH P-1775 IMU which was tested in our laboratory. The value of PSD was calculated from data obtained from those measurements [
12]. Other values of PSD correspond to IMUs with worse parameters than the KVH P-1775 IMU [
13,
14]. The presented IMU consists of three fibre optic gyroscopes, which provide high accuracy class measurements. In addition, the 3-axis magnetometer is included to compensate the magnetic field and high performance 3-axis accelerometer with measurements up to 30 g. This IMU can be implemented in any type of aircraft or vehicle. The outcomes from sensors are used to calculate the position and orientation of the object. To detect the described errors, such as drift error, it was necessary to install the device on a rotary table, where it was possible to check the accuracy of the measurements. The white noise of the gyroscopes was tested with an IMU installed on a stable table and the value of PSD (Power Spectral Density) was calculated; therefore, it was possible to simulate the performance of sensors during the tests. Then, two gyroscopes with a worse class of performance were selected; a comparison of the signals is presented in
Figure 4. The signal colored with yellow represents the signal from KVH P-1775 IMU.
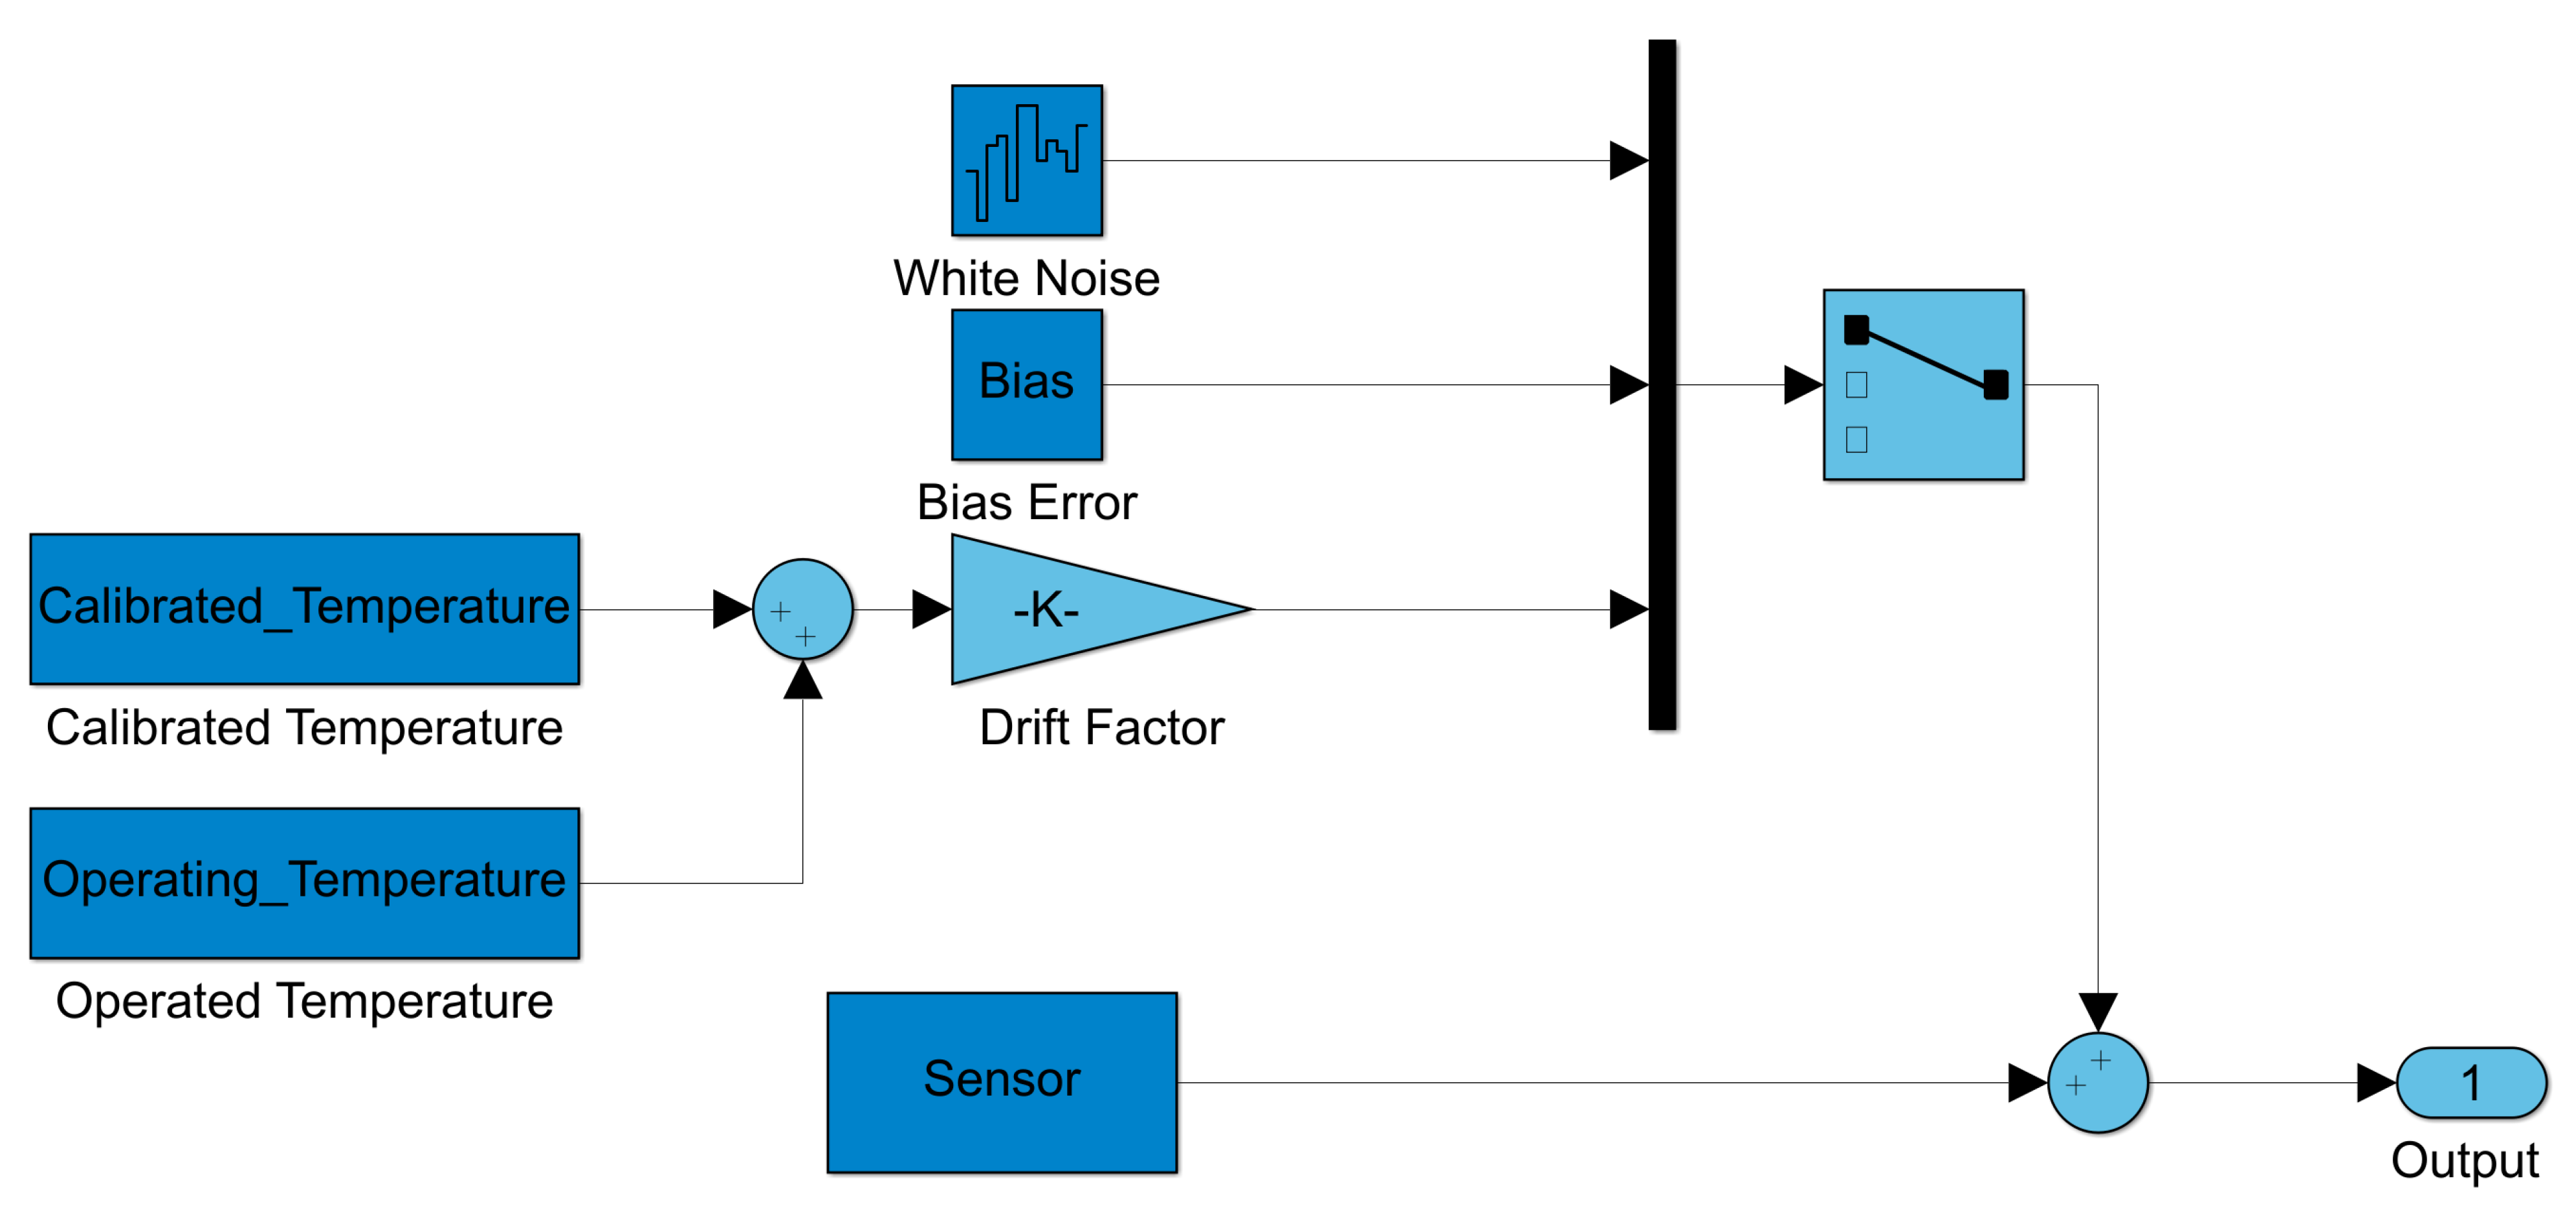
Sensor errors are modelled and added to sensors models, as shown in
Figure 5. This is a simplified diagram simulating sensors with the discussed errors. The signals of white noise and bias error come from square blocks colored with dark blue; the drift error is shown as the result of temperature change during the operation. Error signals go to the selector, which chooses between errors selected for the specific test. Then, the signal goes to the sum block, where the specific error is added to the sensor model, presented as dark blue rectangle, which represents the states from the six degrees of freedom equations implemented by the Simulink library block. The output represents measurements with specified errors.
To maintain the attitude of the controlled aircraft, the measurements from gyroscopes were used to calculate the orientation of the object. To simplify the simulation, the angular velocities signals were directly integrated into the pitch, roll, and yaw angles. Simulations were carried out in Simulink with initial velocity and altitude of the aircraft in order to be able to ensure a stable flight during the tests.
While testing the STAB mode, five scenarios were established: first, altitude maintenance was tested. During the stable flight, the measurements of pitch angular velocity were interrupted by white noise. The aim of TSS was to continue the stable flight of the aircraft. Then, the TSS was tested to cope with the occurrence of an abrupt altitude error with the same sensor errors as in the previous test. The next two tests were carried out analogously to the previous one. This time, the task of TSS was to maintain constant heading during the flight. The last test of the STAB mode was carried out with bias error of the pitch angular velocity sensor during the stable flight.
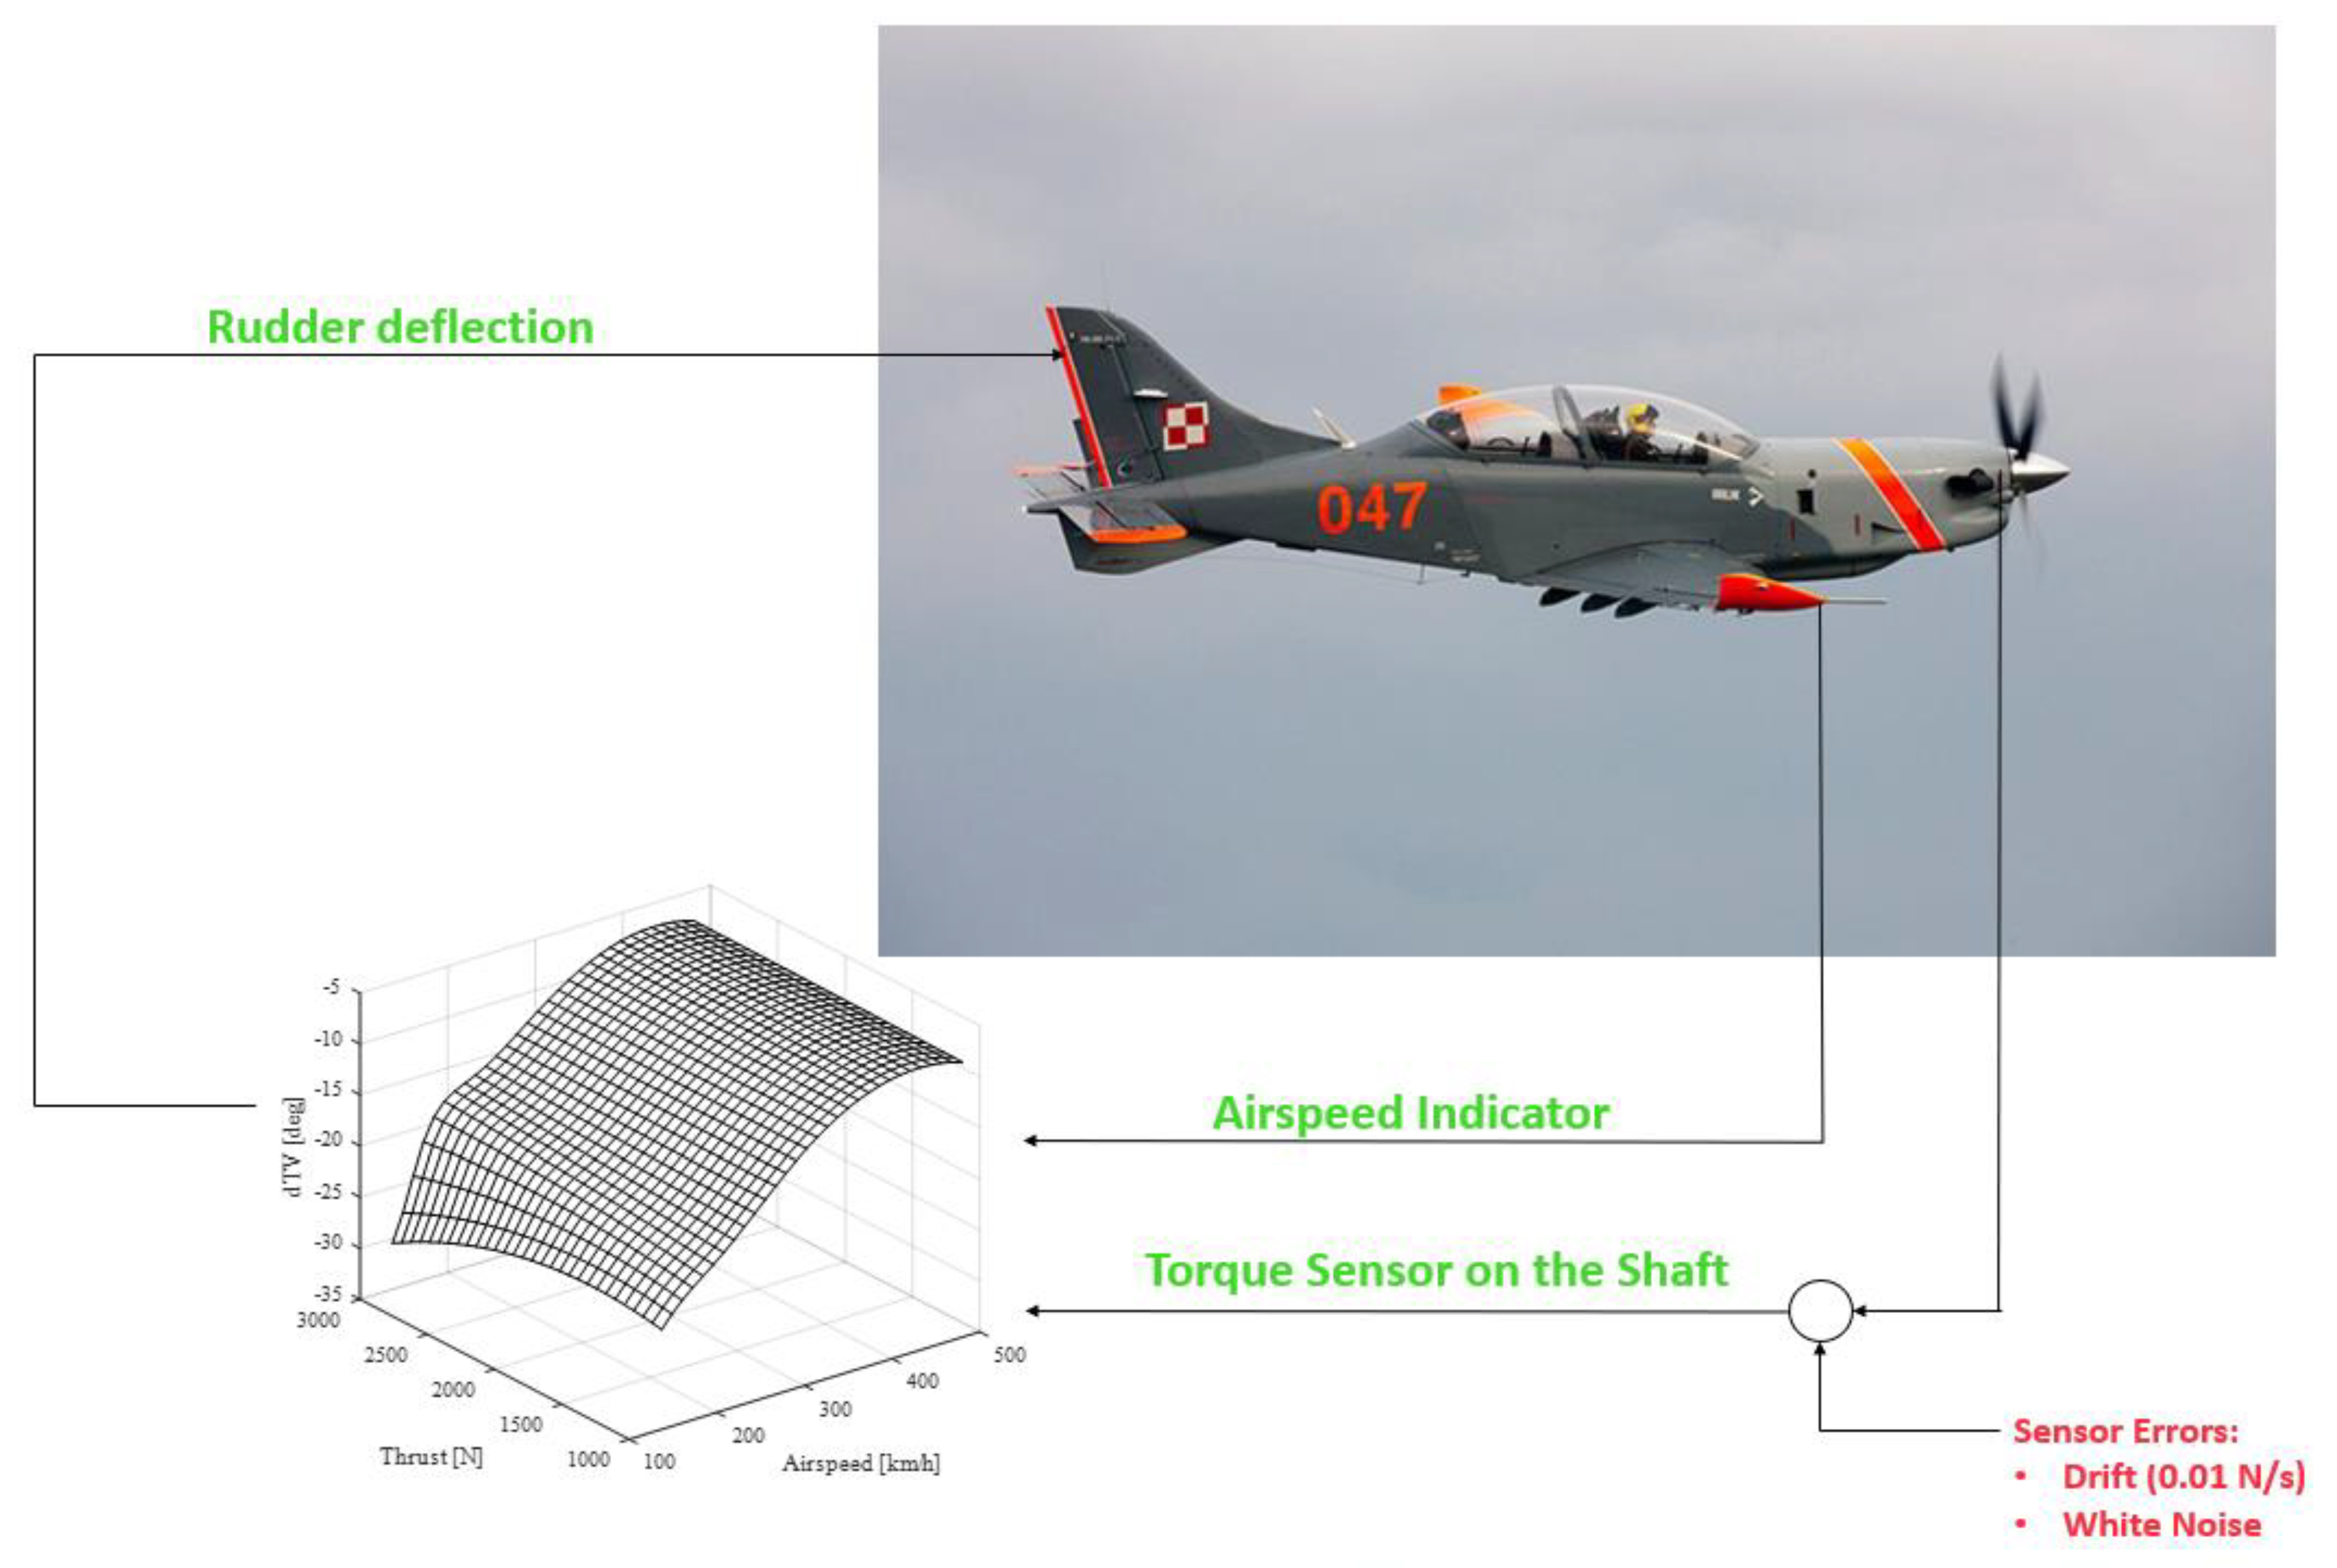
The ATSK mode was then tested. In
Figure 6, the structure of the ATSK mode is shown. Based on values of airspeed and torque on the engine shaft, the TSS calculates the deflection of the rudder trimmer. During the test, white noise and sensors’ drift were applied to the torque sensor on the shaft.
For the system to meet its requirements, the error must not exceed 1 m for the altitude hold mode and 0.1 degree for the heading hold mode.
3. Results
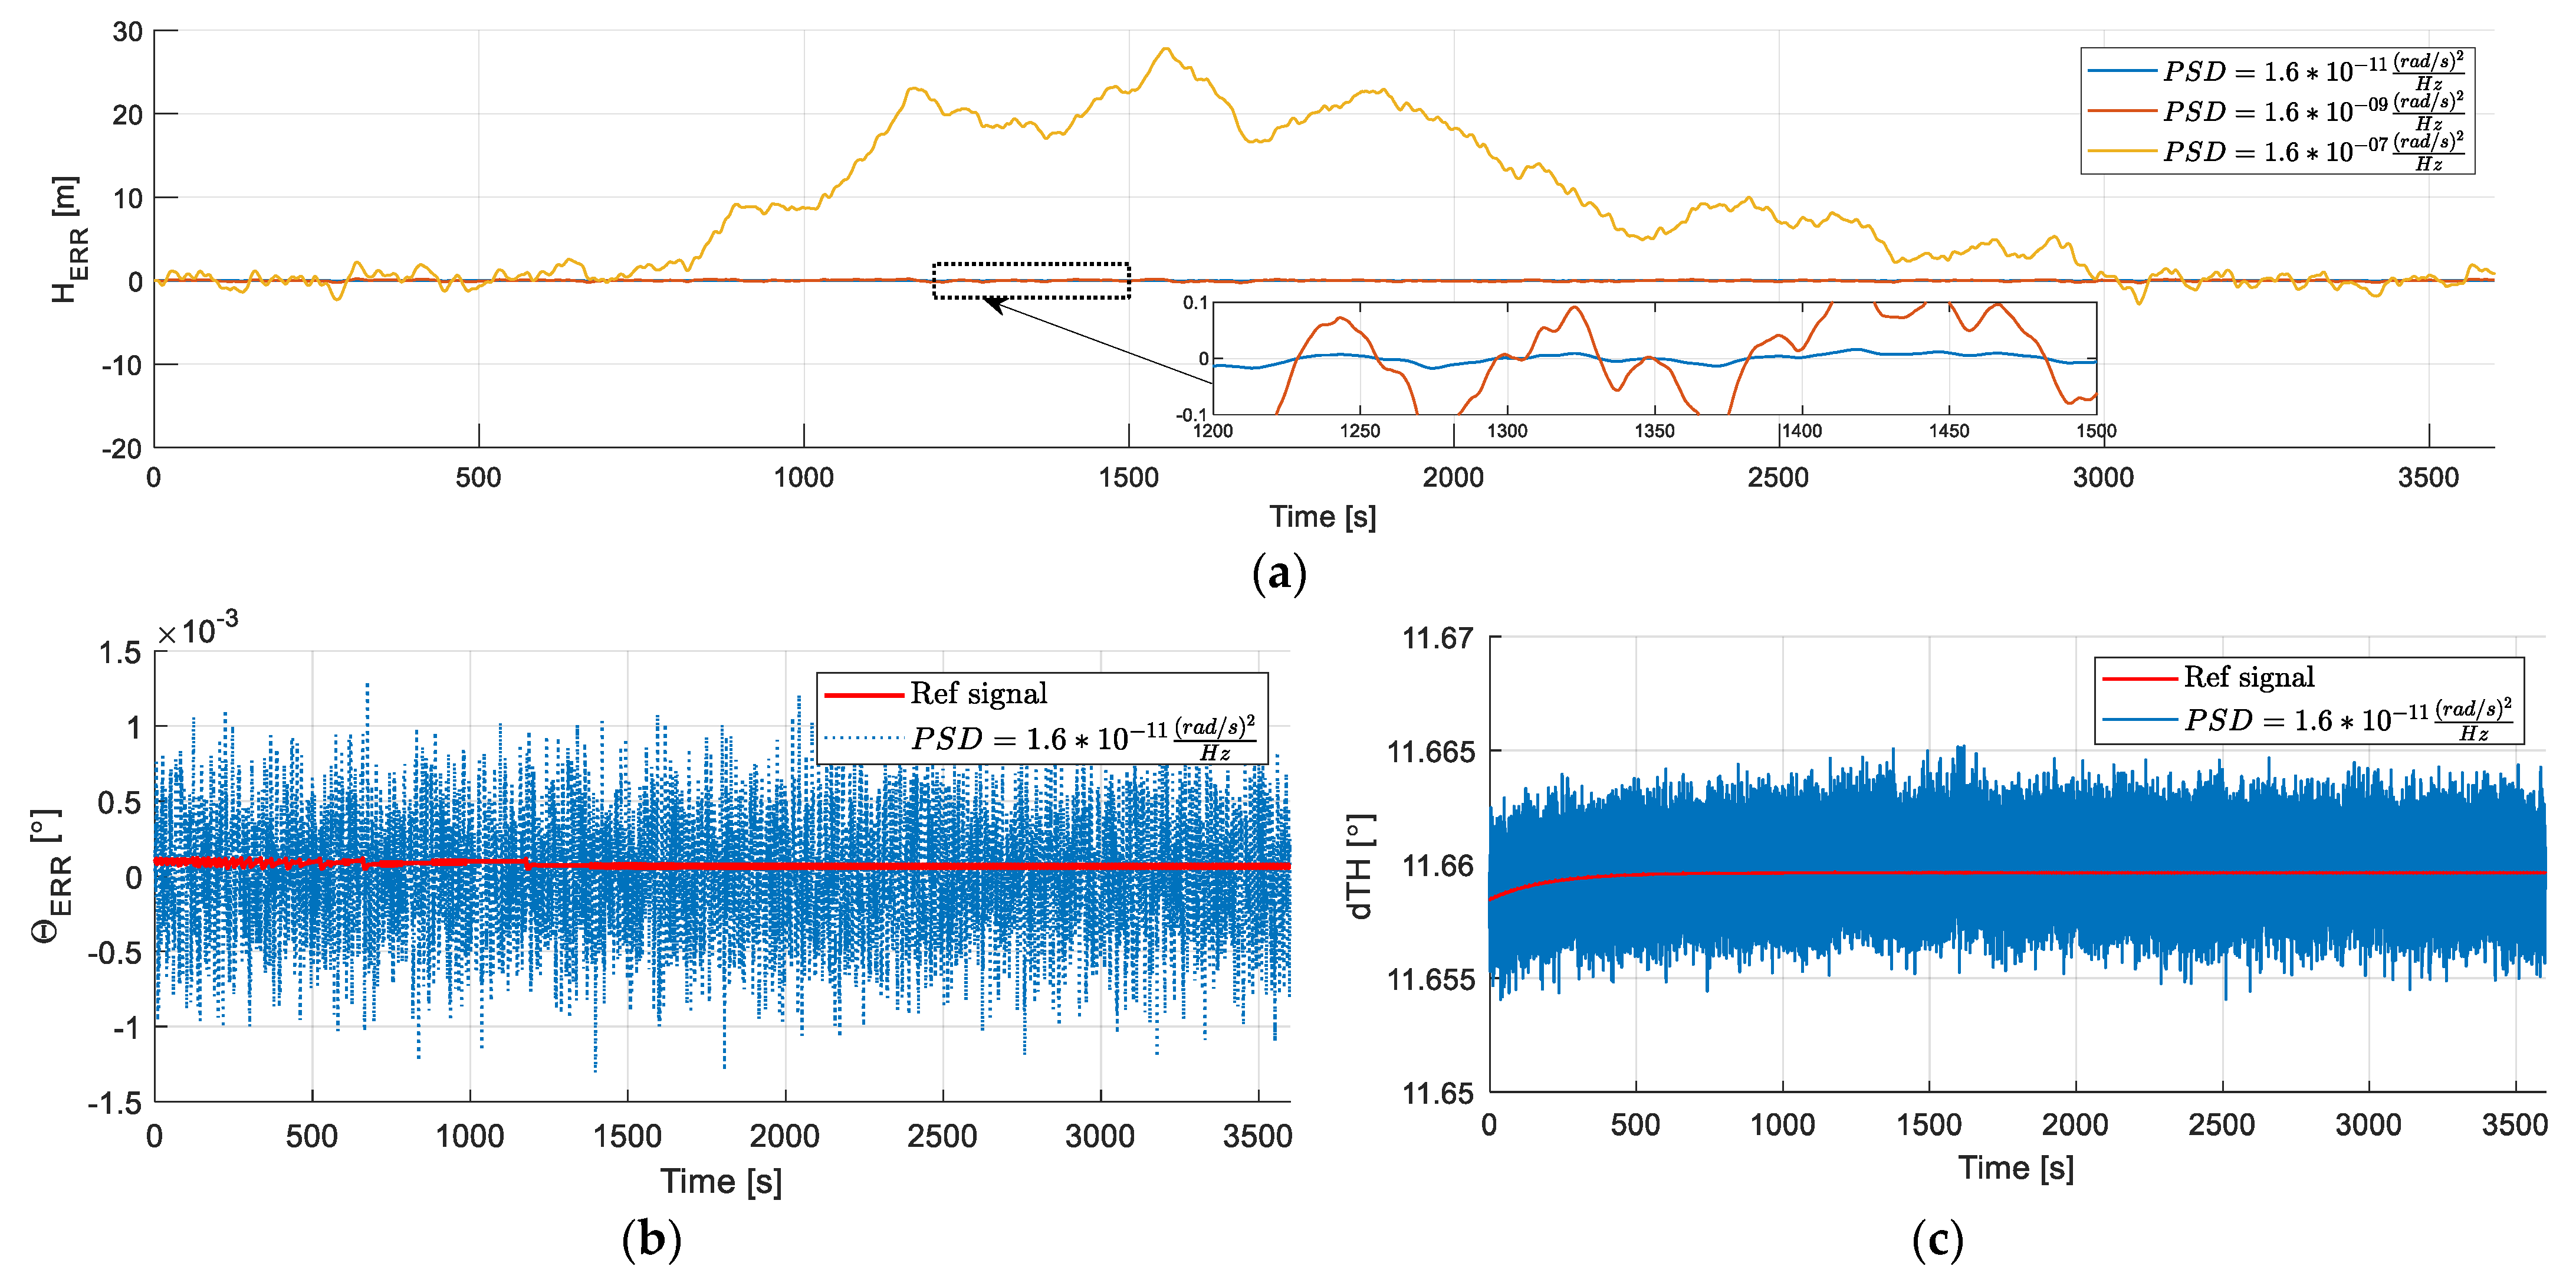
In this section, the results of the tests are presented. First, the influence of white noise on three axis gyroscopes in STAB mode is shown. In
Figure 7, the outputs of simulation are presented; in
Figure 7a, the change in altitude is shown. There are three signals, each corresponding to IMUs with a different class of accuracy, which is determined by the value of the PSD parameter. The blue one represents the IMU tested in our laboratory, the yellow signal represents the IMUs where the PSD of white noise causes the TSS to malfunction, resulting in altitude error that exceeds the assumed limits equal to 1 m. In the zoomed area, the signals of the two other simulations are shown. The values of both signals are acceptable; the error is less than1 m and does not cause incorrect operation of the TSS. The amplitudes of these signals do not exceed ±0.2 degrees. In
Figure 7b, the pitch angle error during the simulation is shown. This graph presents the data calculated from IMU with gyroscopes’ measurements distorted with white noise with PSD value equal to 1.6 × 10
−11 [rad
2/s]; a non-distorted signal has been added for comparison. The difference between these signals is negligible.
Figure 7c shows the deflection of the elevator trimmer set by the trimmer controller, calculated from the distorted and non-distorted IMUs gyroscopes. It should be noted that these signals come from the trimmer regulator and deflections of trimmers vary from these. The amplitude of noise presented in the graph is small enough to not cause movement of the trimmer.
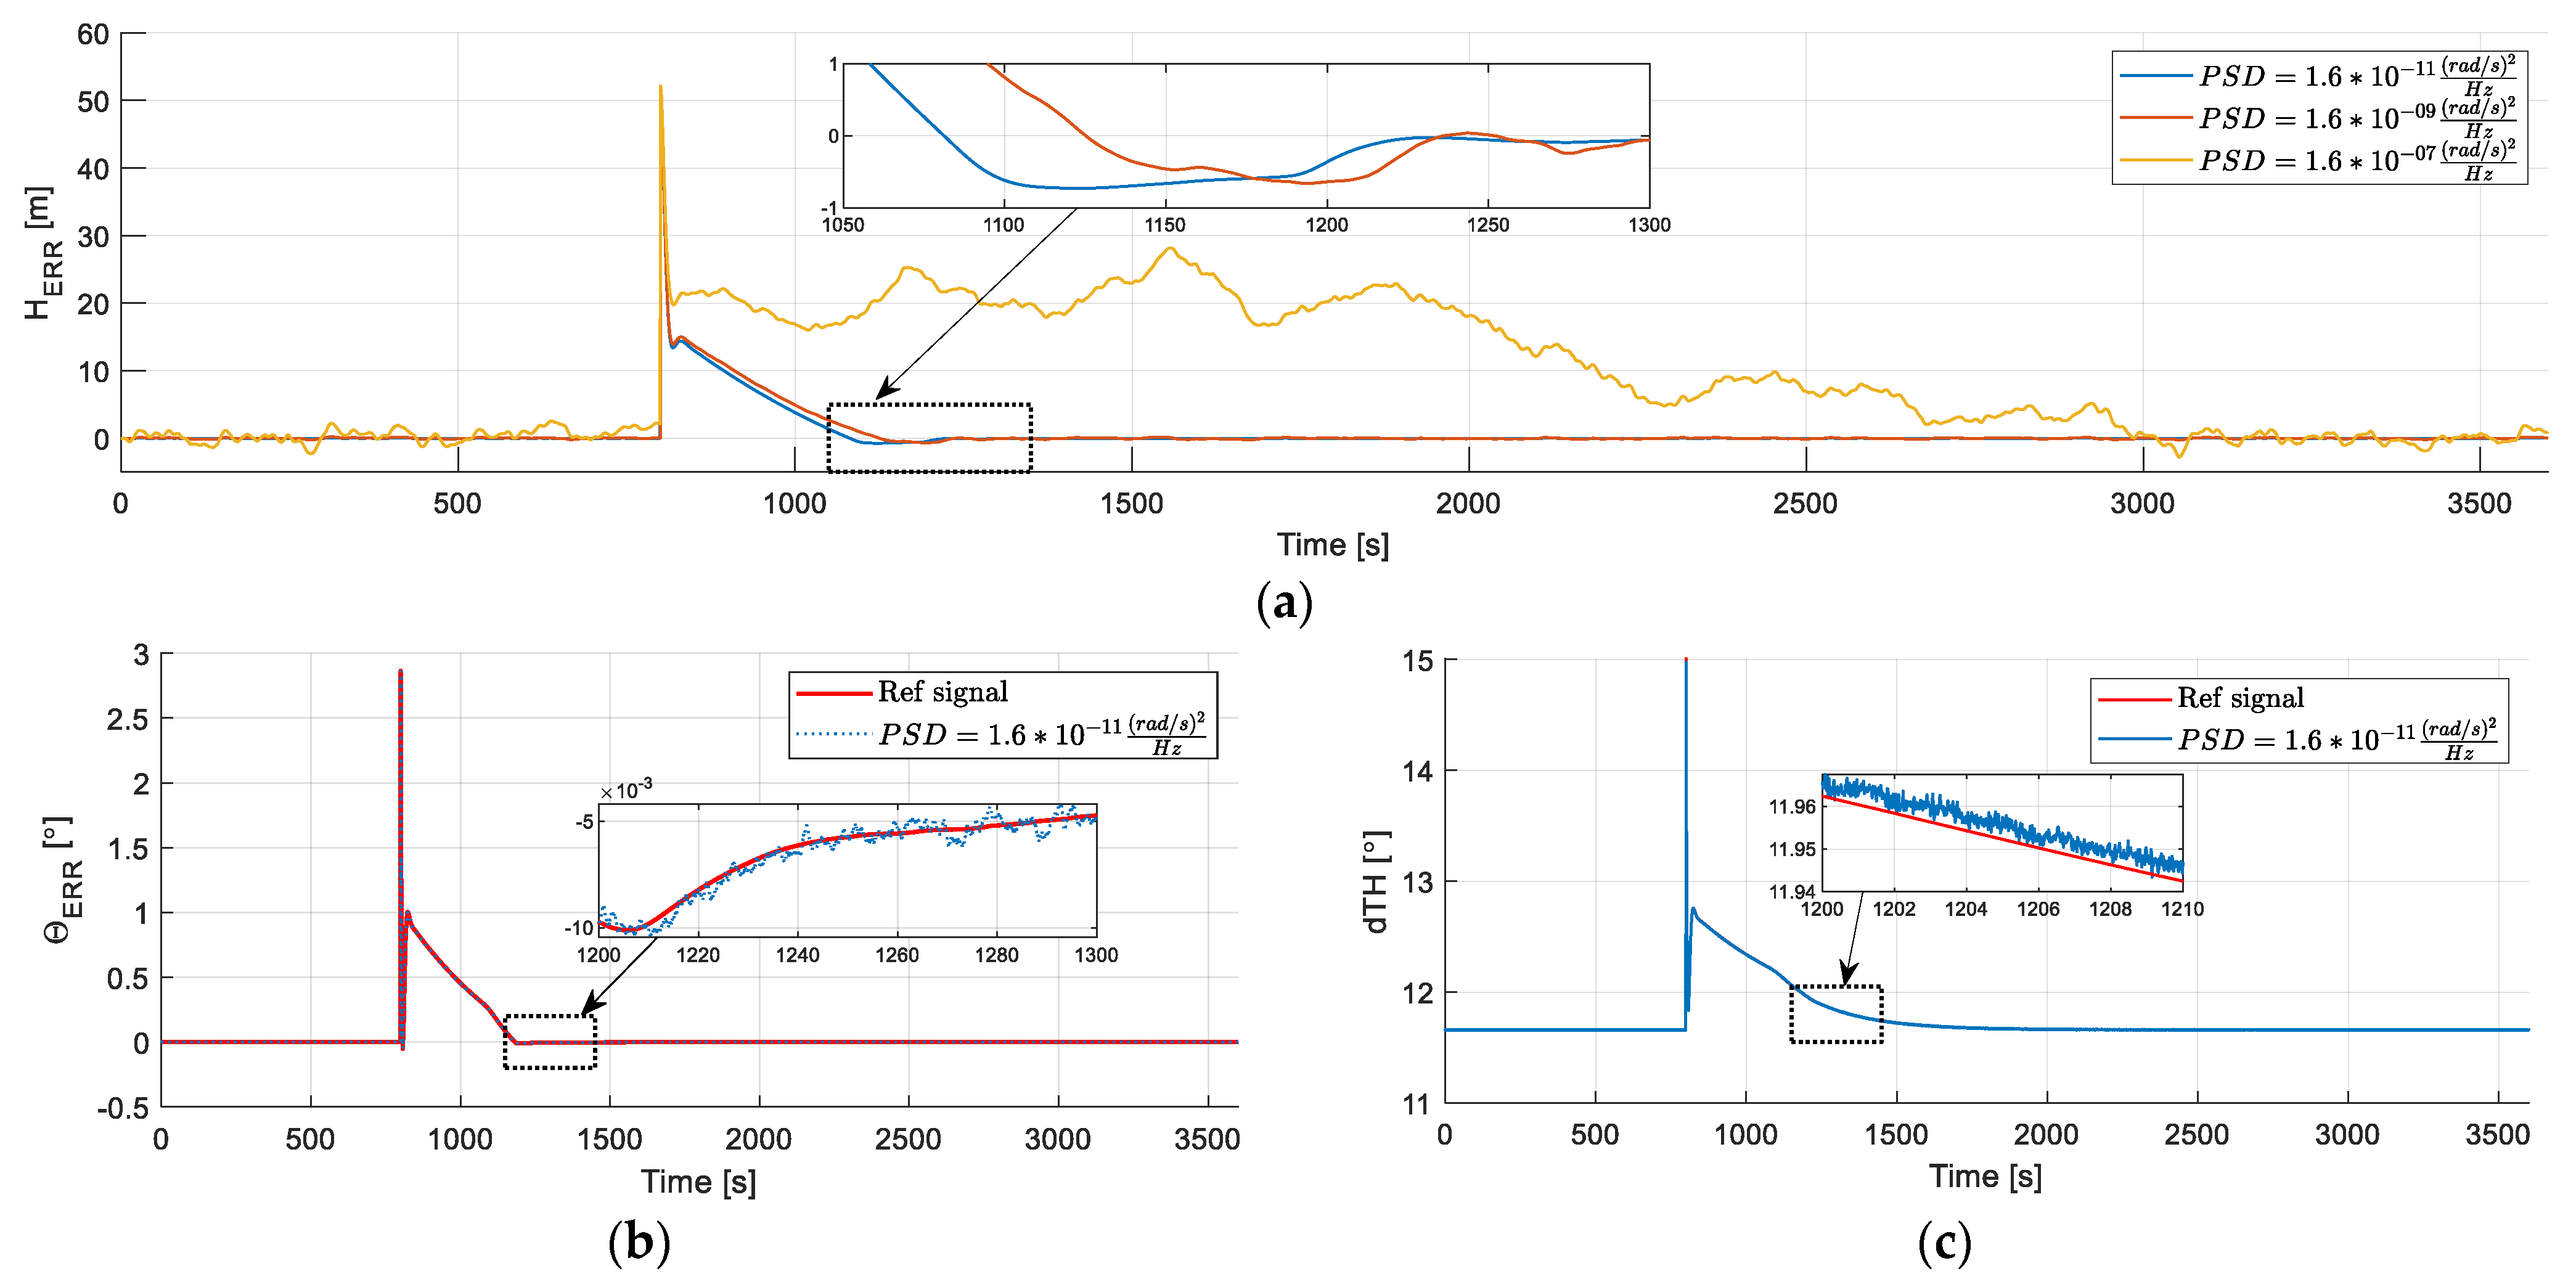
Figure 8 shows three graphs with data collected from simulation where a sudden altitude error occurred. In
Figure 8a, the change in altitude is shown. The three signals, each one from different simulations, are compared. The yellow signal represents the data from IMU with the lowest class of accuracy. From
Figure 8a, the fastest settling time is 300 s and this value meets the stated requirements. The settling time of the system using the IMU with the lowest class of accuracy is about 2200 s and is higher than the others. Like in the previous figure,
Figure 8b,c show the pitch angle and deflection of the elevator trimmer. The differences between signals presented in
Figure 8b are negligible.
Figure 8c, similar to the previous chart, shows small differences between two signals—the elevator trimmer deflection signal of the distorted and not-distorted system.
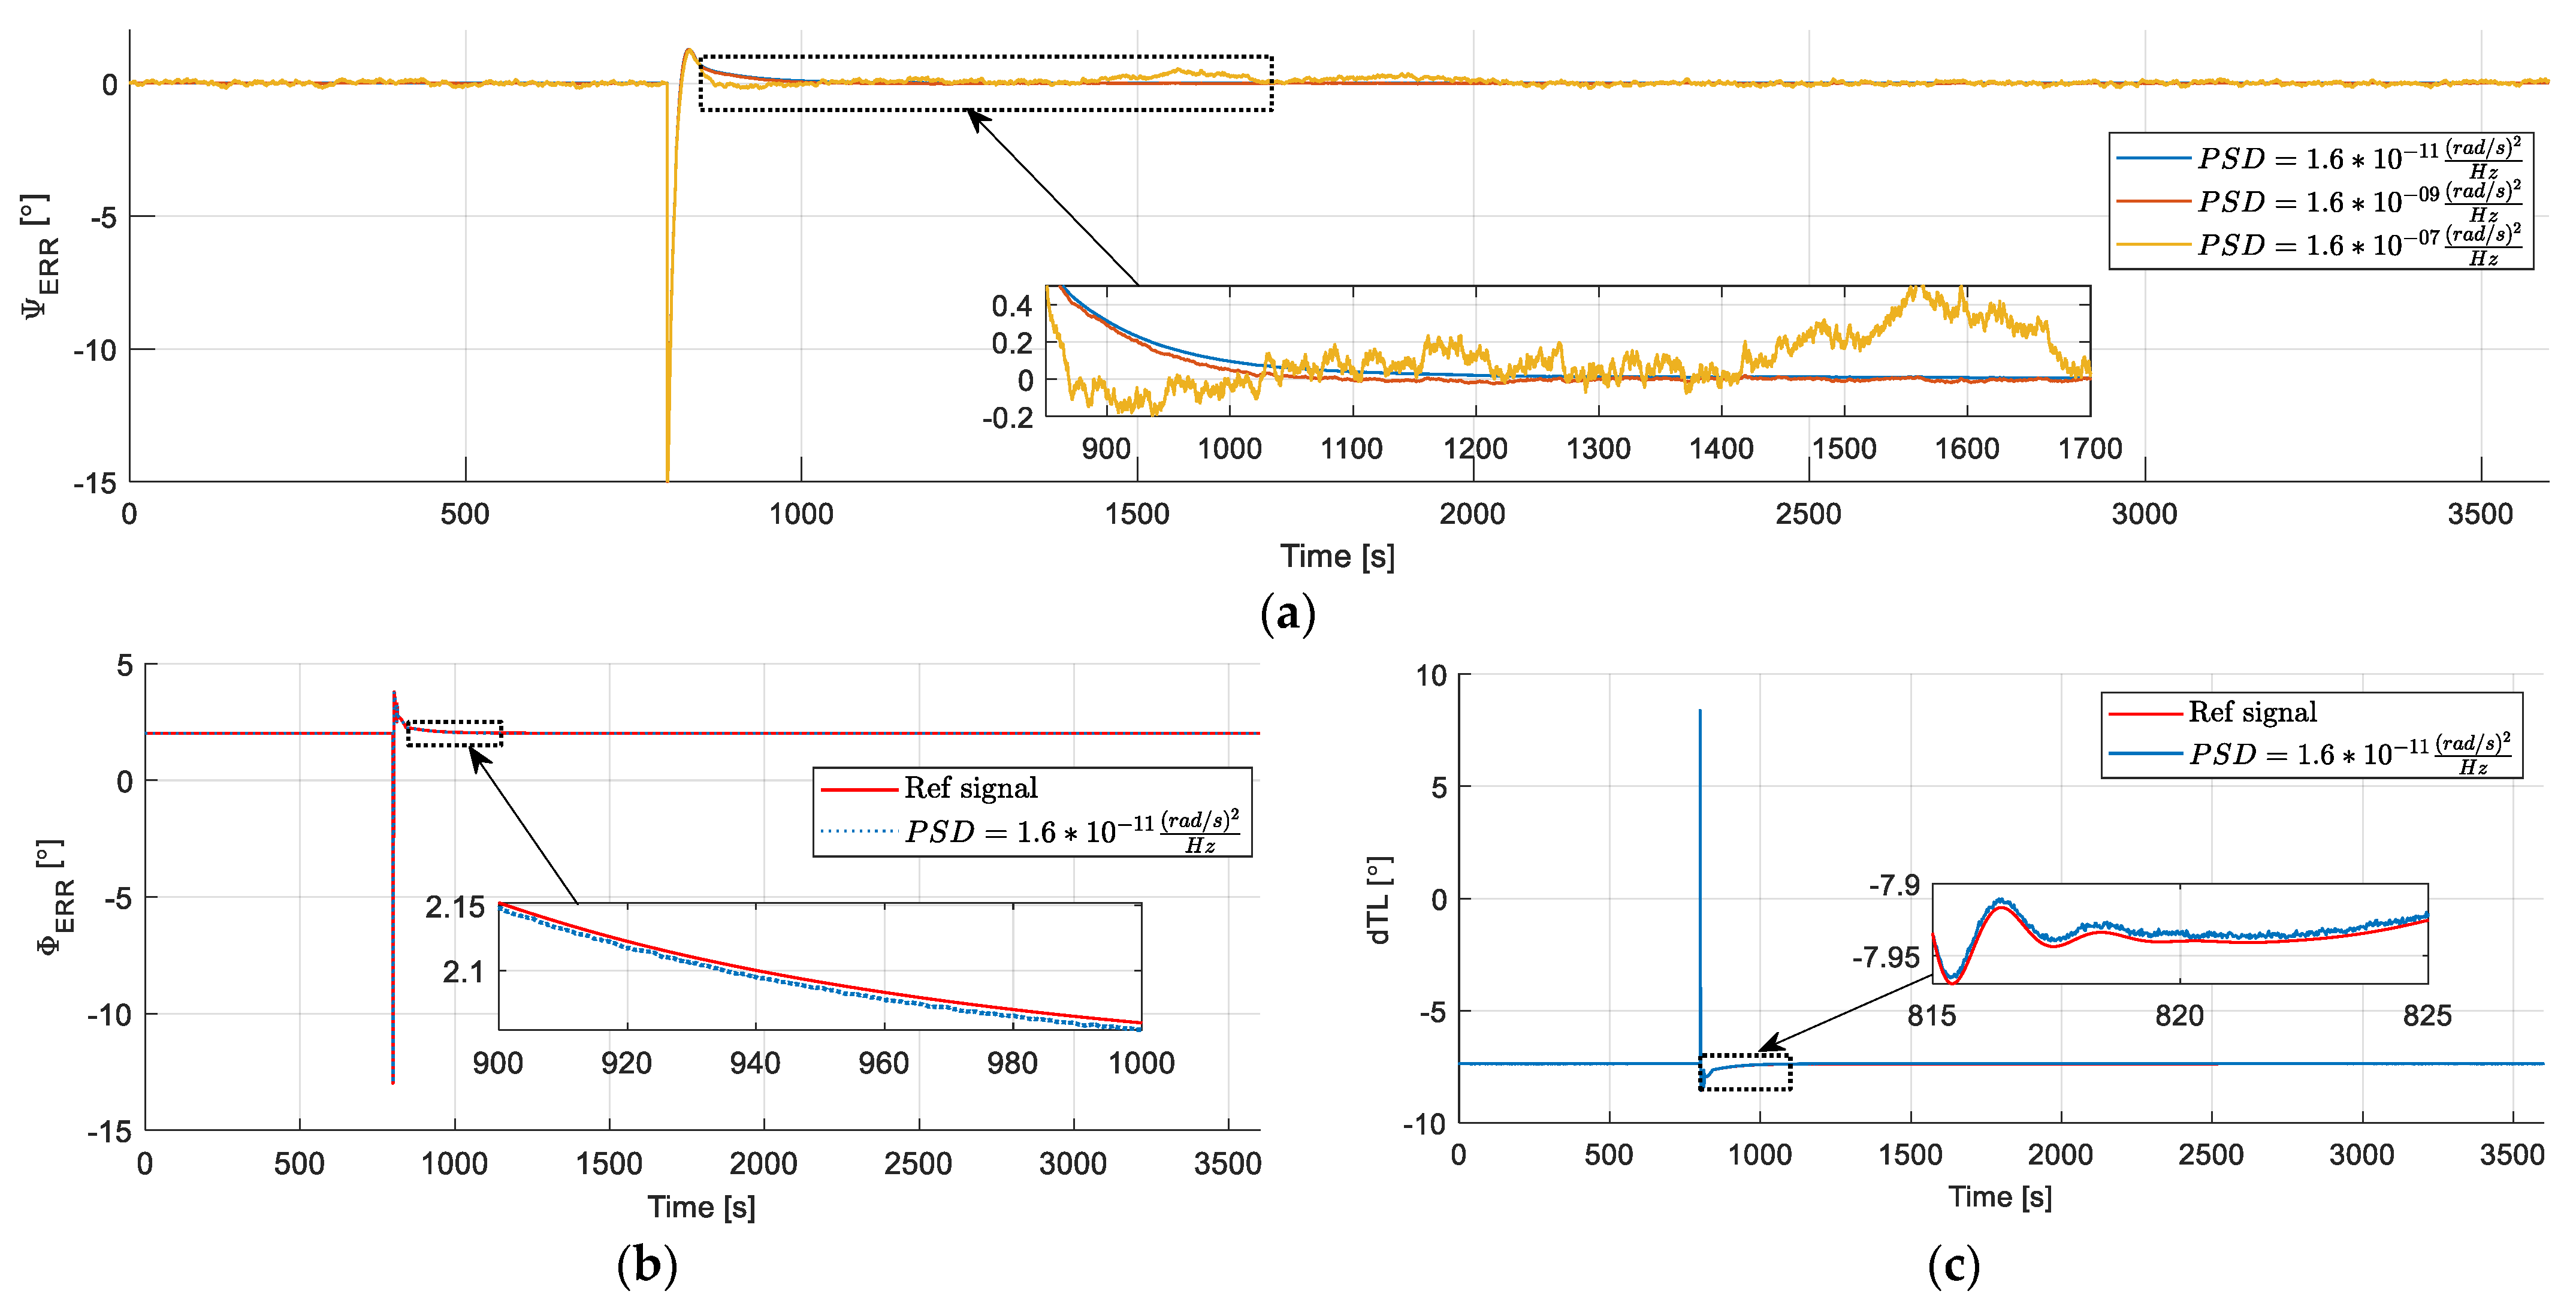
Figure 9 shows the outcomes from simulations in which the heading hold was tested in the STAB mode. The outcomes contain the data calculated from three different IMUs. In
Figure 9a, the heading errors are compared. During the steady flight, the TSS was supposed to maintain a constant heading equal to 0. The heading error of yellow signal deviates less than 0.8 degrees from 0 during the flight; other signals oscillate around 0 degree with amplitude equal to 0.2 degrees. Then,
Figure 9b,c show heading error and calculated aileron trimmer deflection obtained from the simulation, in which the highest class of accuracy IMU was used. These signals are compared to outcomes from the simulation where no sensor errors were implemented. The difference between them does not exceed ±0.015 for the phi error and ±0.02 degrees for the aileron trimmer deflection.
Figure 10 contains the data from simulated flights where TSS was tested with heading error scenario. Same as before, three simulations with different IMUs were carried out. To compare the performance of each of the IMU, signals of heading error are shown in
Figure 10a. The results of all the simulations hover around 0 degrees; the error ranges from −0.2 to 0.6 degrees.
Figure 10b,c contain data of phi error and aileron deflections for simulation where the IMU with the highest class of accuracy was used. The signal differences do not exceed ±0.1 degrees for the phi error and ±0.02 degrees for the elevator trimmer deflection. It can be assumed that the differences in both cases are negligible.
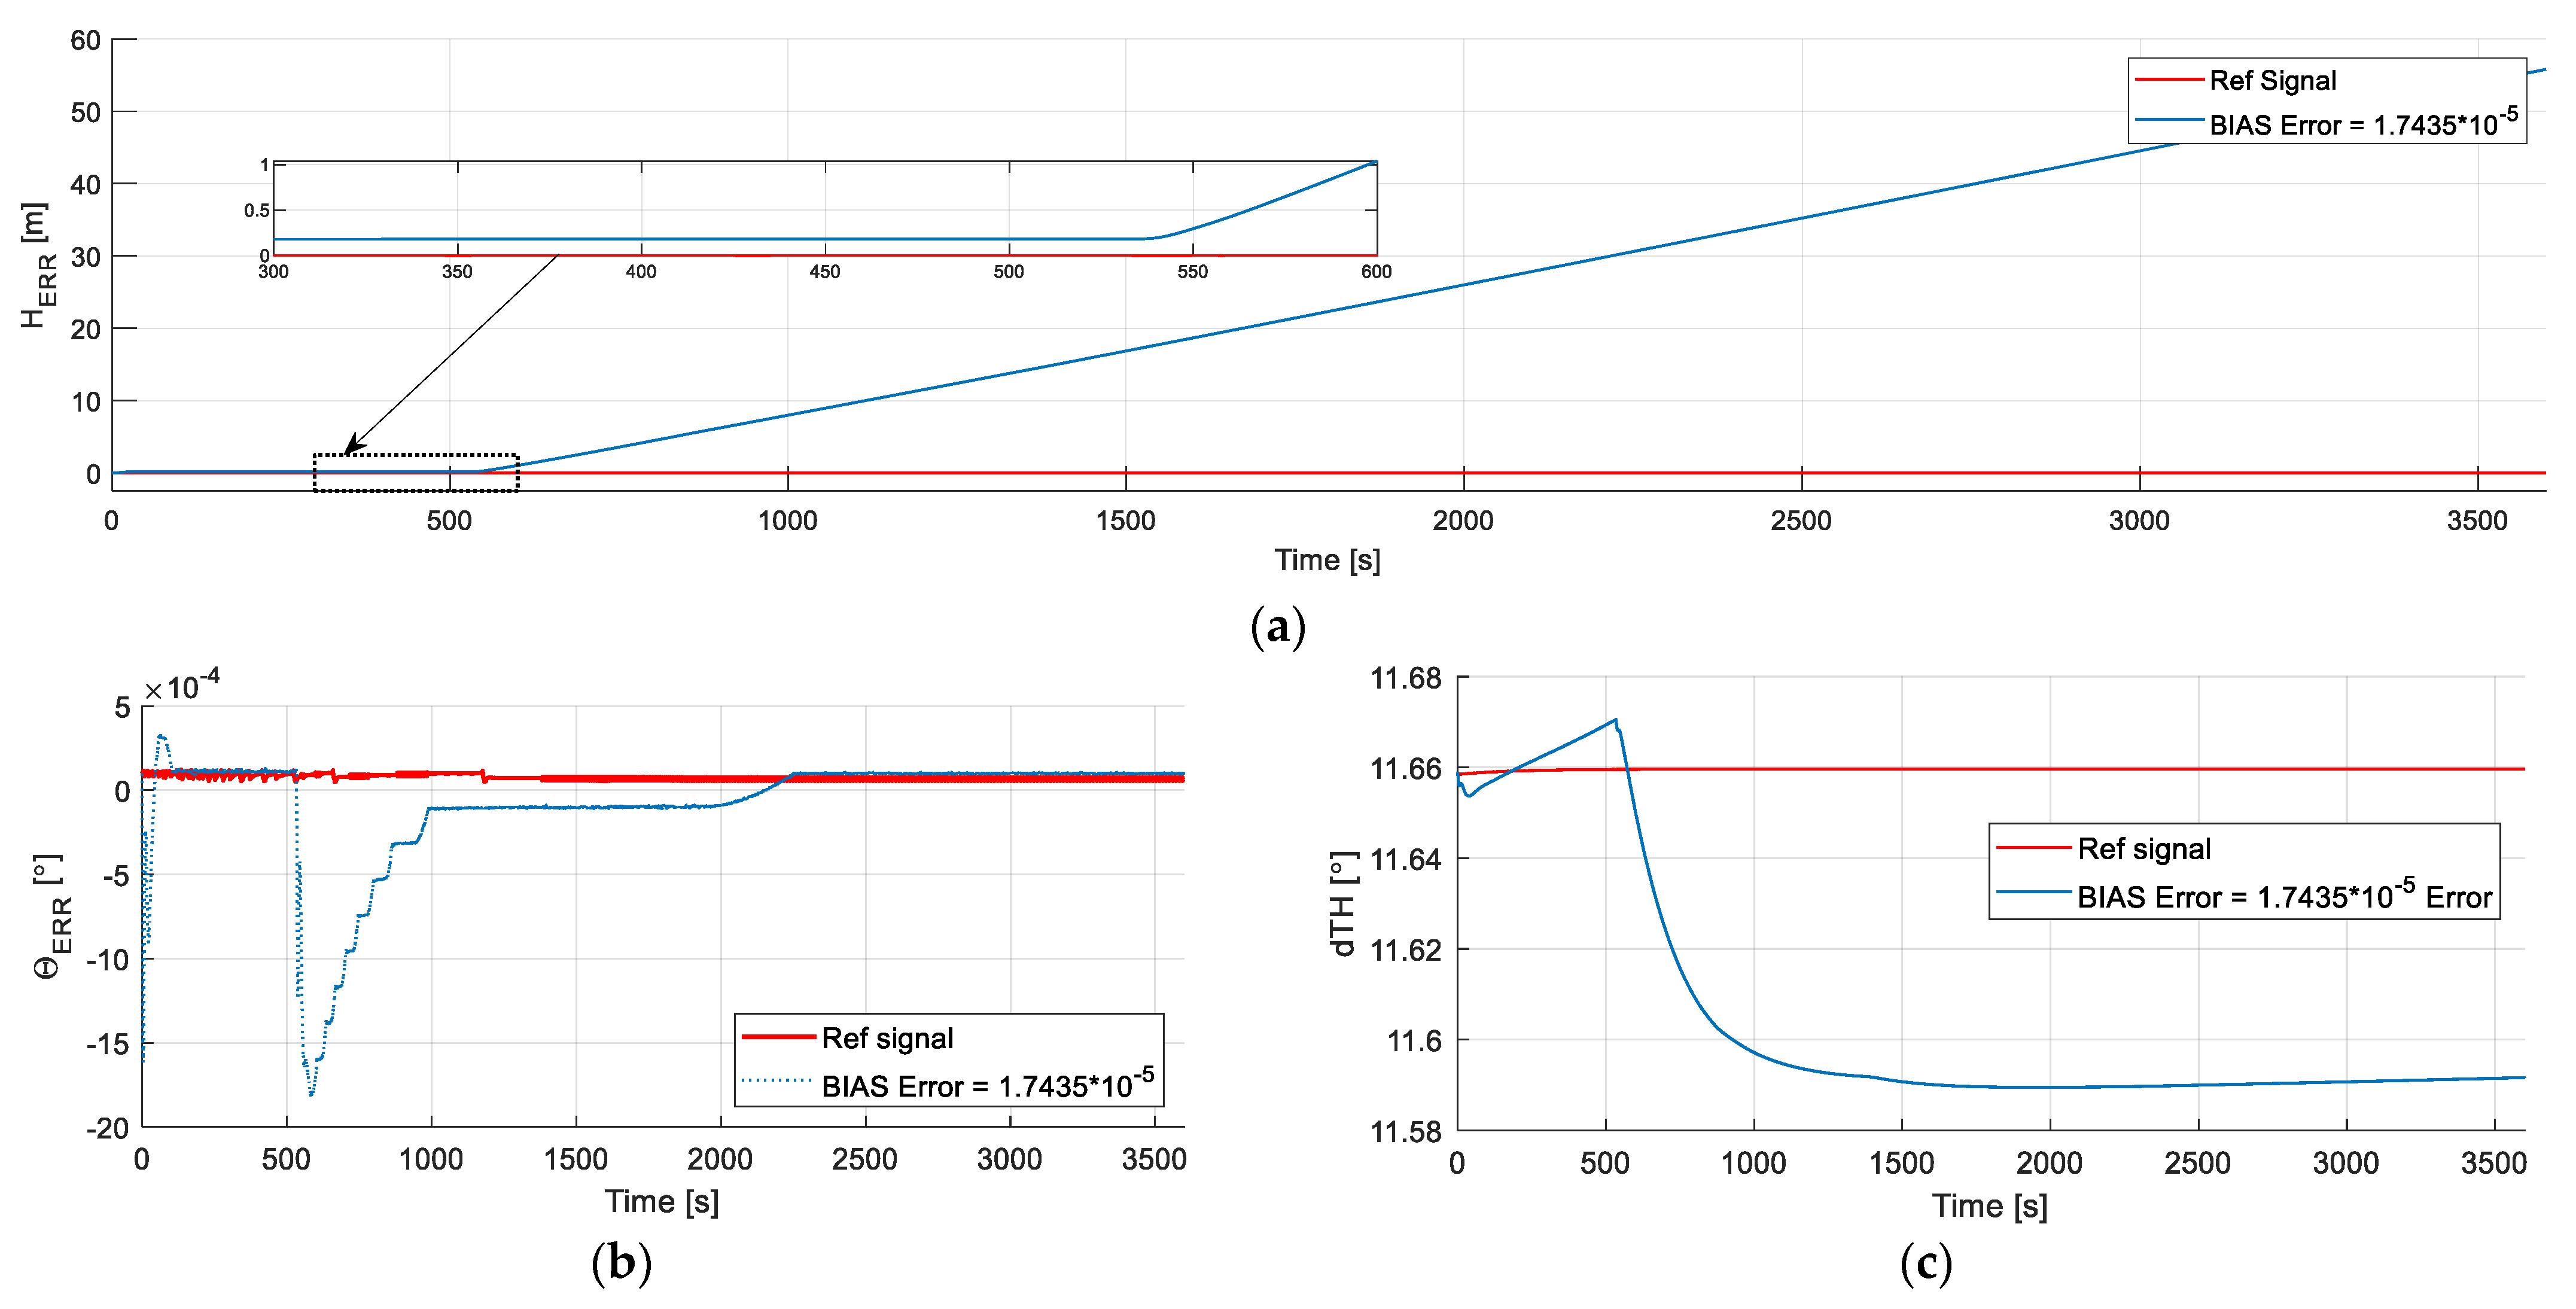
Figure 11 shows the results of the steady flight. The red signal represents the outcomes from simulation with not-distorted sensors, the blue one represents the outcomes from the simulation where the gyroscopes were distorted by error bias equals to 1.7435 × 10
−5 m.
Figure 11a shows that altitude error occurred during the flight. Up to approximately 500 s, the error keeps the value constant; then the error increases with time. The constant value of altitude error in the first 500 s is the result of the controller counteracting the angular velocity bias error until the regulator integral is saturated; then the altitude error increases with time.
Figure 11b shows the pitch angle error comparison; the difference between the two values is negligible.
Figure 11c represents the deflection of the elevator trimmer. There is a slight difference between two signals—less than 0.1 degrees.
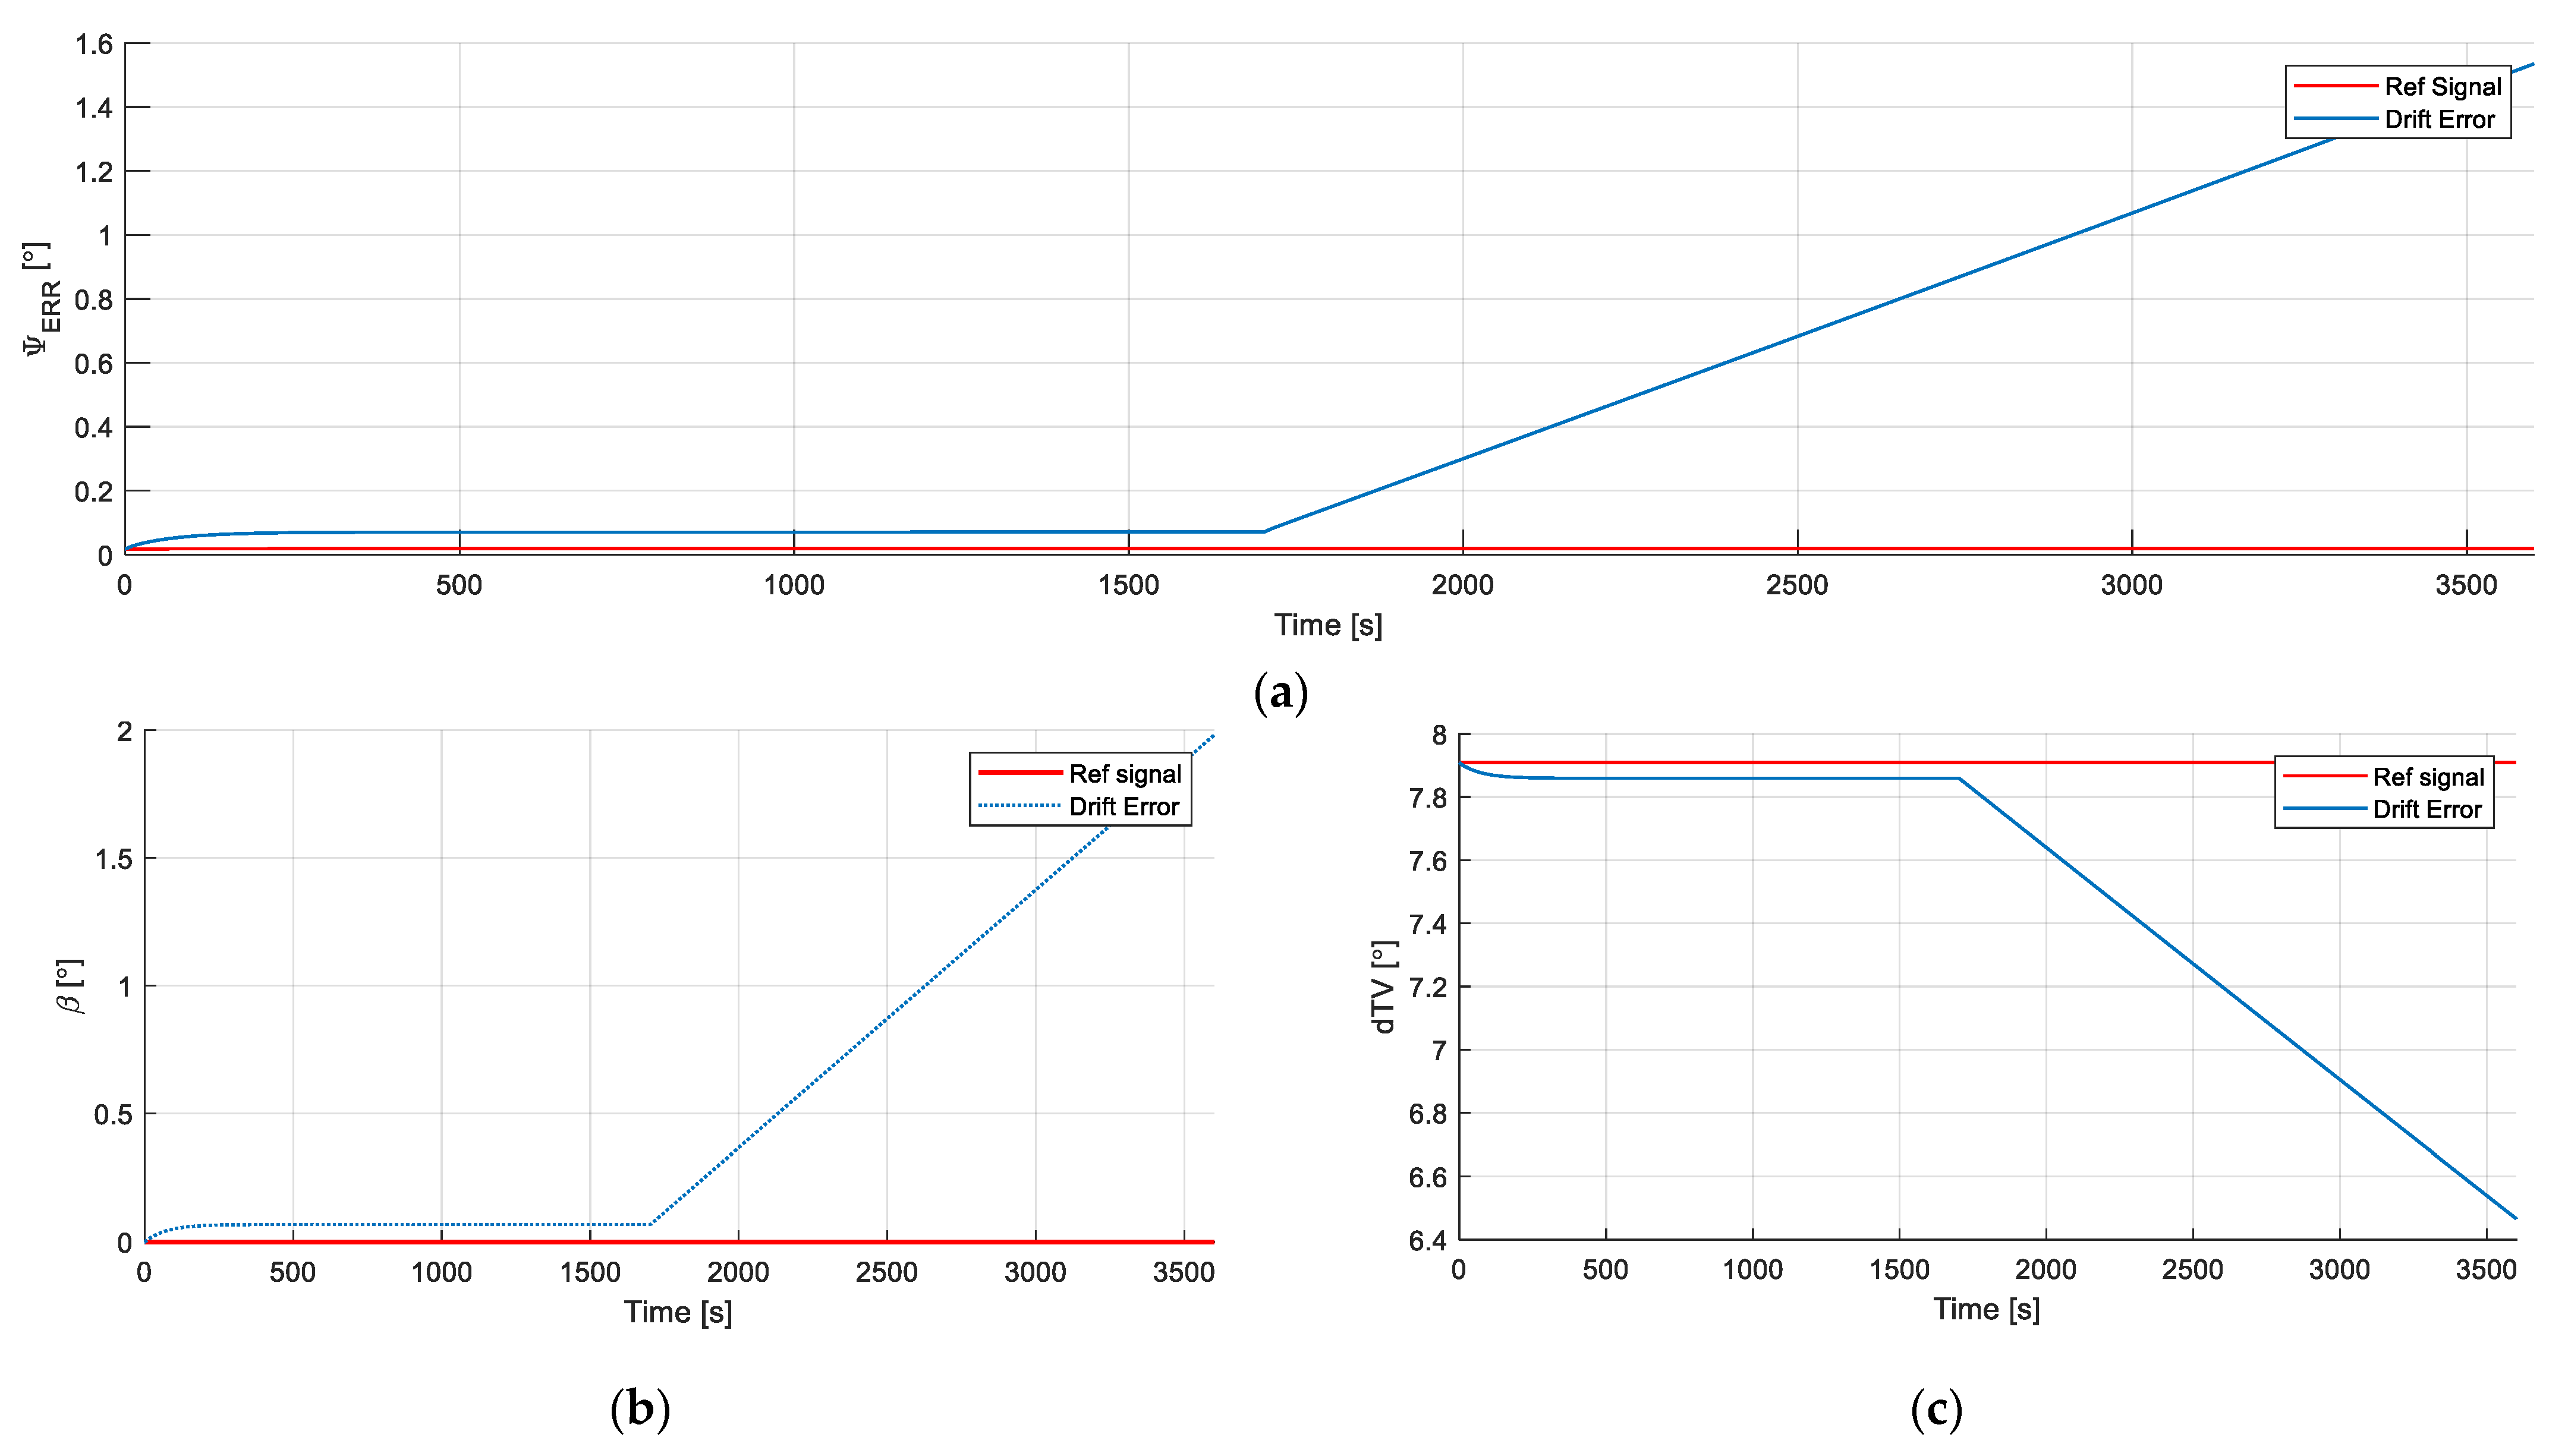
Figure 12 contains the graphs which show the differences between the simulations with distorted and non-distorted torque sensors on the shaft. Here, the drift with 0.001 N/s error is presented.
Figure 12a shows the differences in heading error. Similar to the previous outcomes, the difference remains constant and then increases with time. The value of heading error remains constant until the integrator reaches its saturation; then the error increases over time. The same behavior can be noticed in the angle of sideslip, which is shown in
Figure 12b, and in the deflection of the rudder trimmer, which is shown in
Figure 12c.
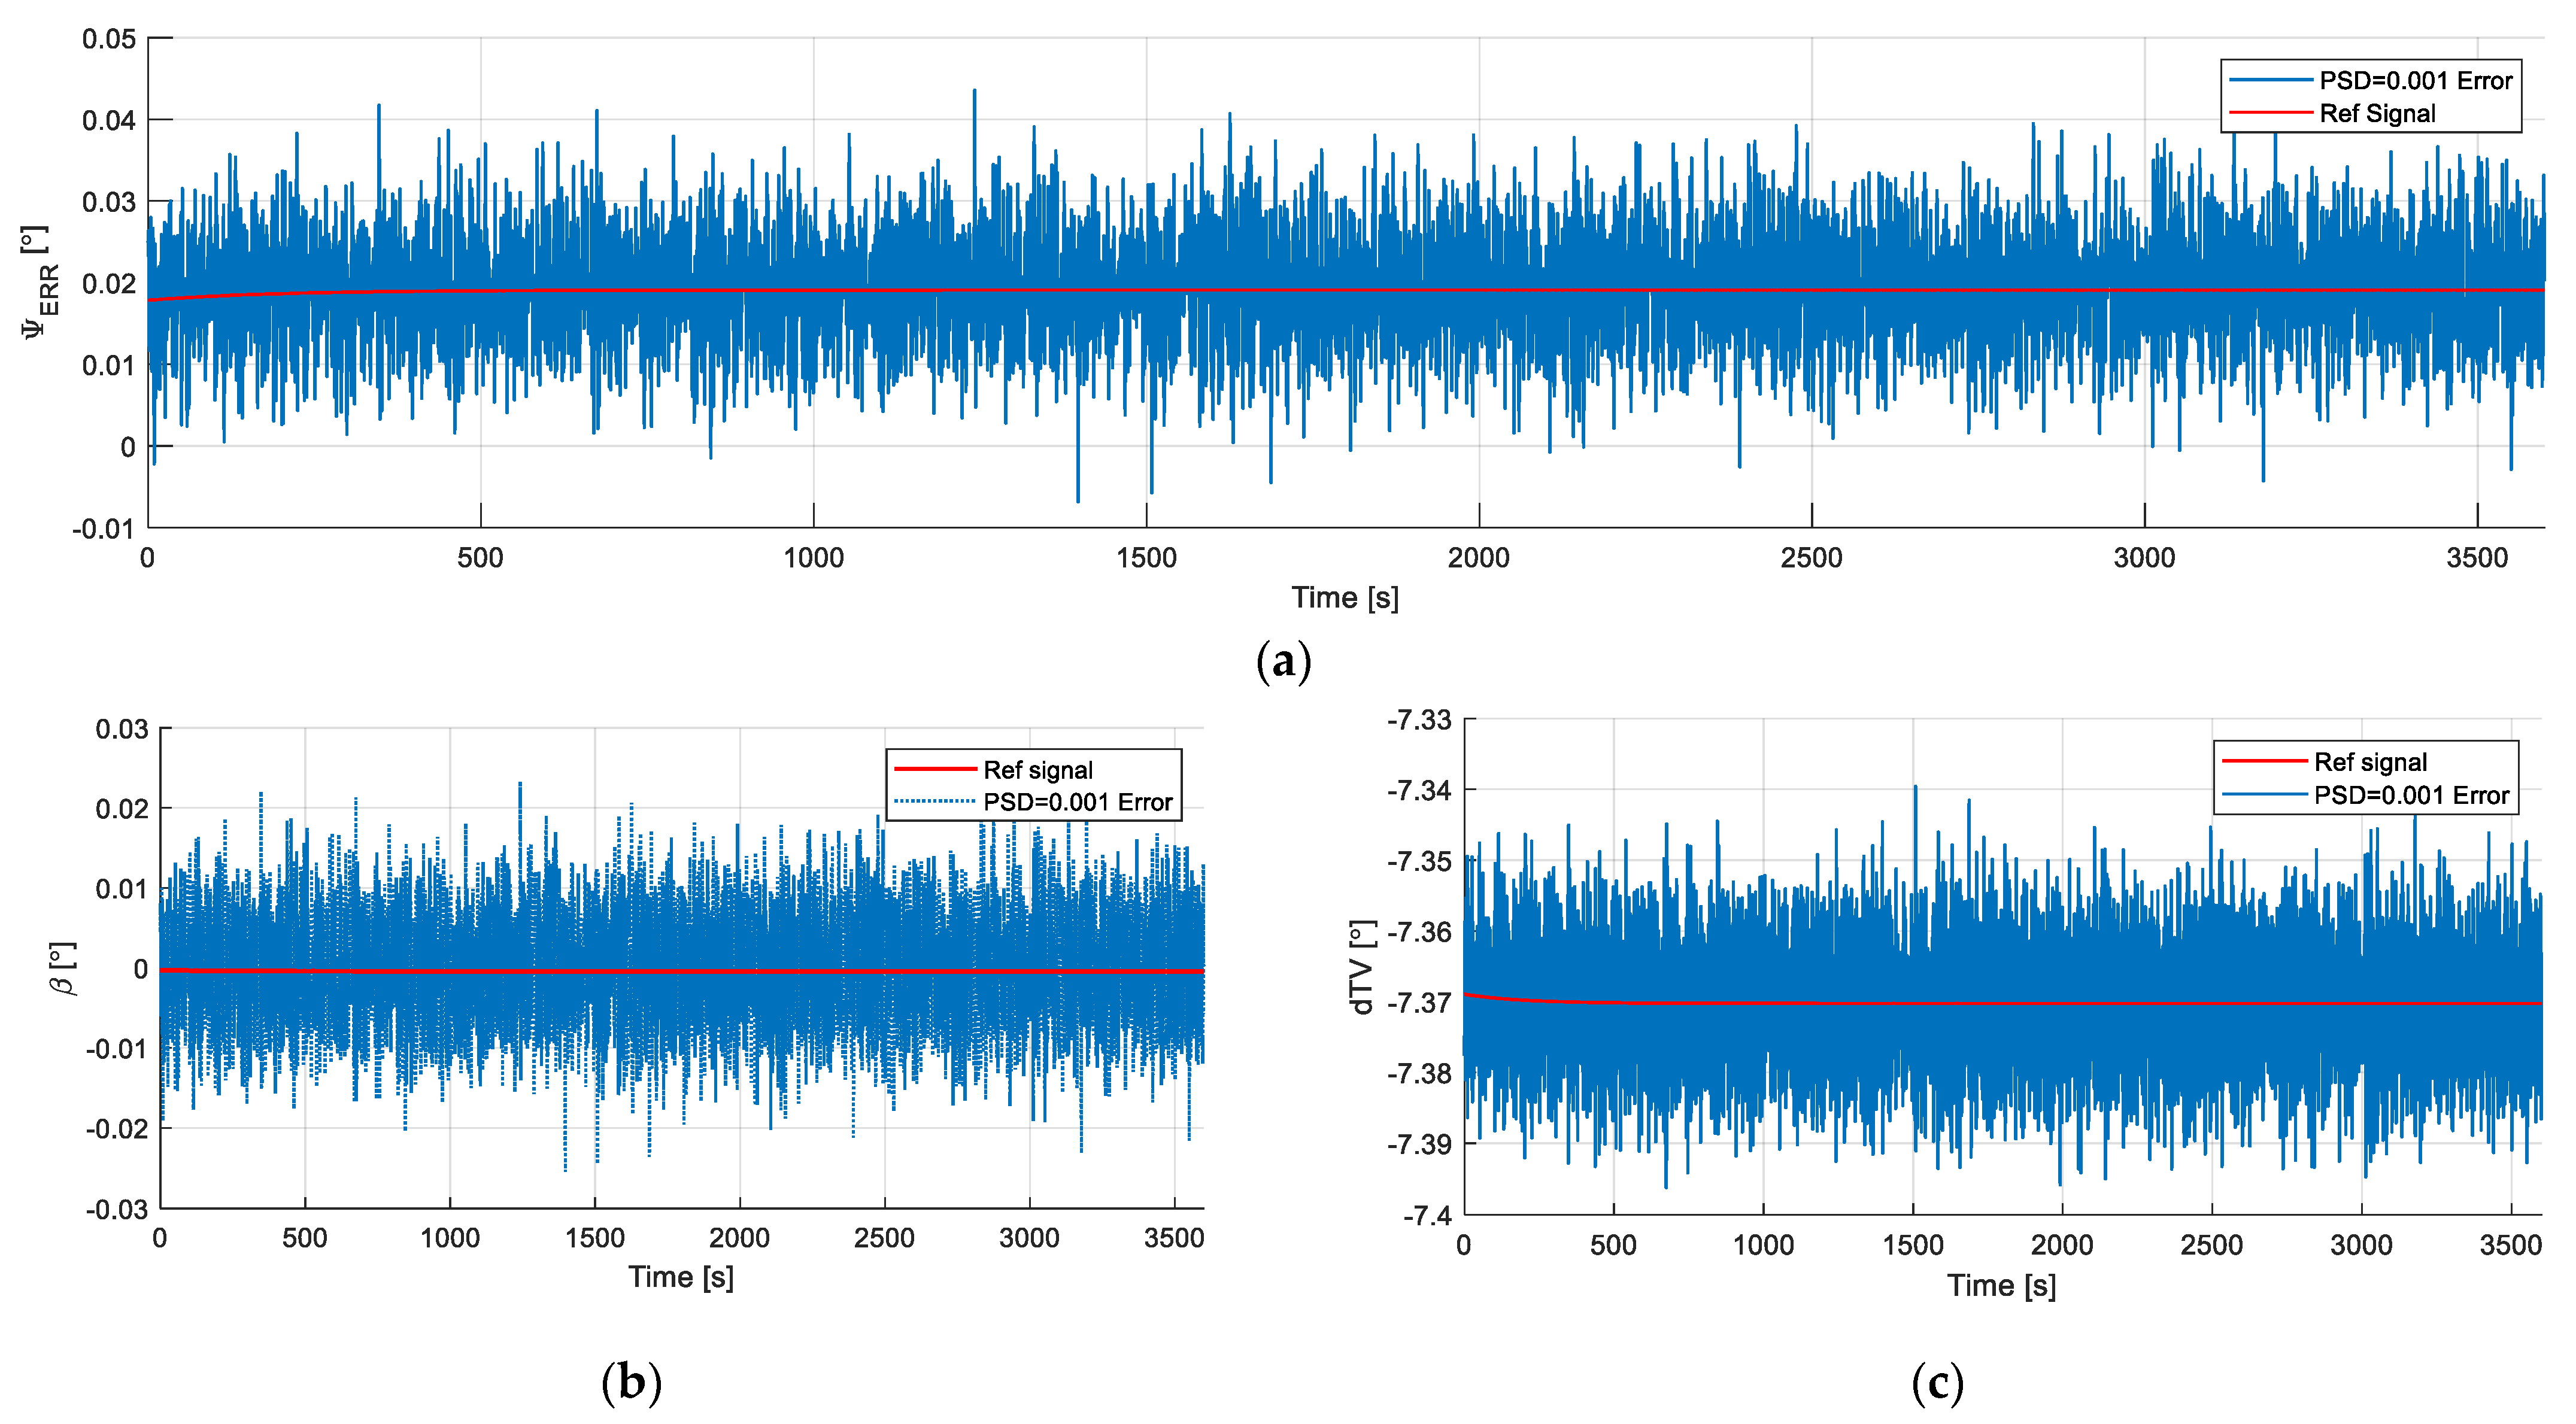
The last set of graphs, presented in
Figure 13, shows the comparison of two simulations with distorted and non-distorted sensor of torque on the shaft. The sensor is disturbed by white noise with PSD equal to 0.001 [rad
2/s]. The change in heading error is shown in
Figure 13a.
Figure 13b shows the angle of sideslip during the flight and
Figure 13c shows the commanded deflection of the rudder trimmer. In each of the graphs, the parameters are distorted by white noise from the torque sensor on the shaft.
The figures presented above contain data obtained during the tests. The discussion about the results and general conclusions are in the next section.
Table 1 below summarizes the results shown in
Figure 11,
Figure 12 and
Figure 13.
4. Discussion and Conclusions
The results presented in this article are an answer to the question of how sensor errors affect TSS performance. During the tests, the impact of sensor errors on flight stability was assessed. The tests were limited to checking the three most common errors. Taking into account the above results, it can be concluded that IMUs with a measurement white noise of PSD equal to 1.6 × 10⁻⁹ rad2·s−2·Hz−1 do not cause malfunctioning of the system. The altitude error does not exceed a value of 1 m and heading error was less than 0.1 degree during flight. When white noise with a PSD equal to 1.6 × 10⁻⁷ [rad2/s] was applied, the system did not work properly; the errors exceeded the values of 1 m for altitude and 0.1 degree for heading. The bias and drift errors caused malfunctioning of the system; after saturation of integrals, the heading and altitude errors exceeded the limits of the proper operation of the system. The white noise applied to torque sensor on the shaft (TSoS) caused slight disruptions in rudder trimmer deflection.
These results are the next step towards testing the TSS on real aircraft. The obtained results provided information on the system’s resistance to sensor errors. They prove that white noise of IMUs, where PSD value is not greater than 1.6 × 10⁻⁹ rad2·s−2·Hz−1, does not degrade the control quality of the flight control system. In the future, research may be extended to include tests of flight control system resistance to a broader range of errors.


