
Experimental and Numerical Study on Residual Strength of Honeycomb Sandwich Composite Structure after Lightning Strike


Abstract
:1. Introduction
2. Simulated Lightning Strike Test
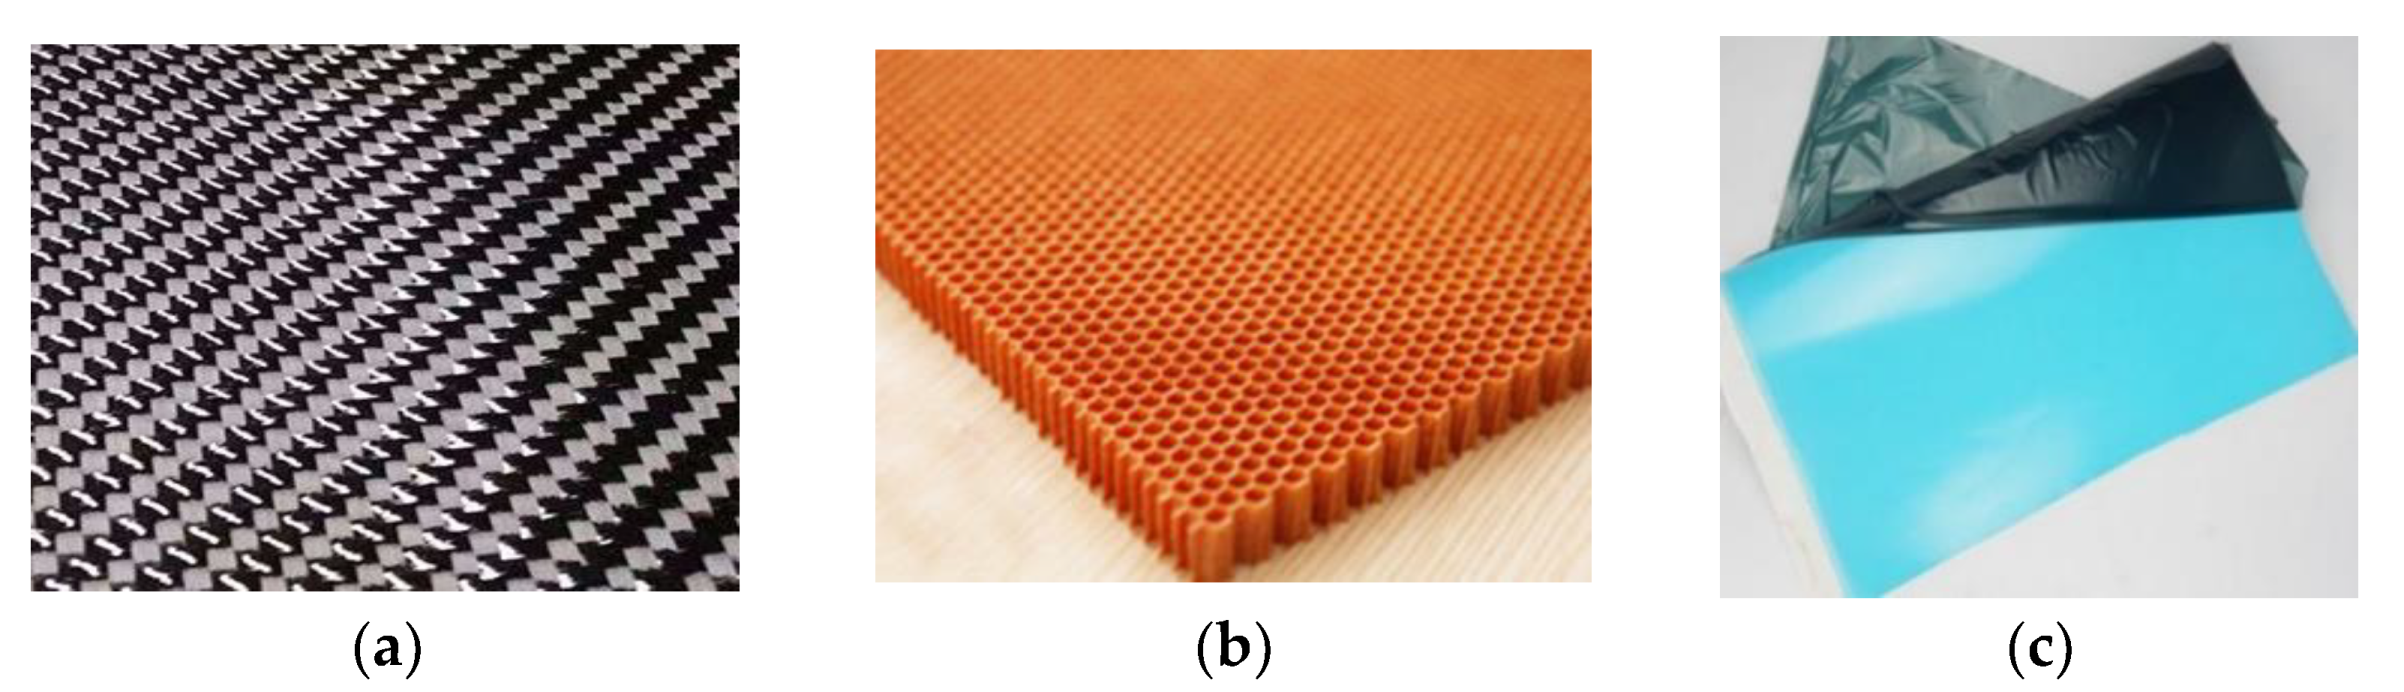
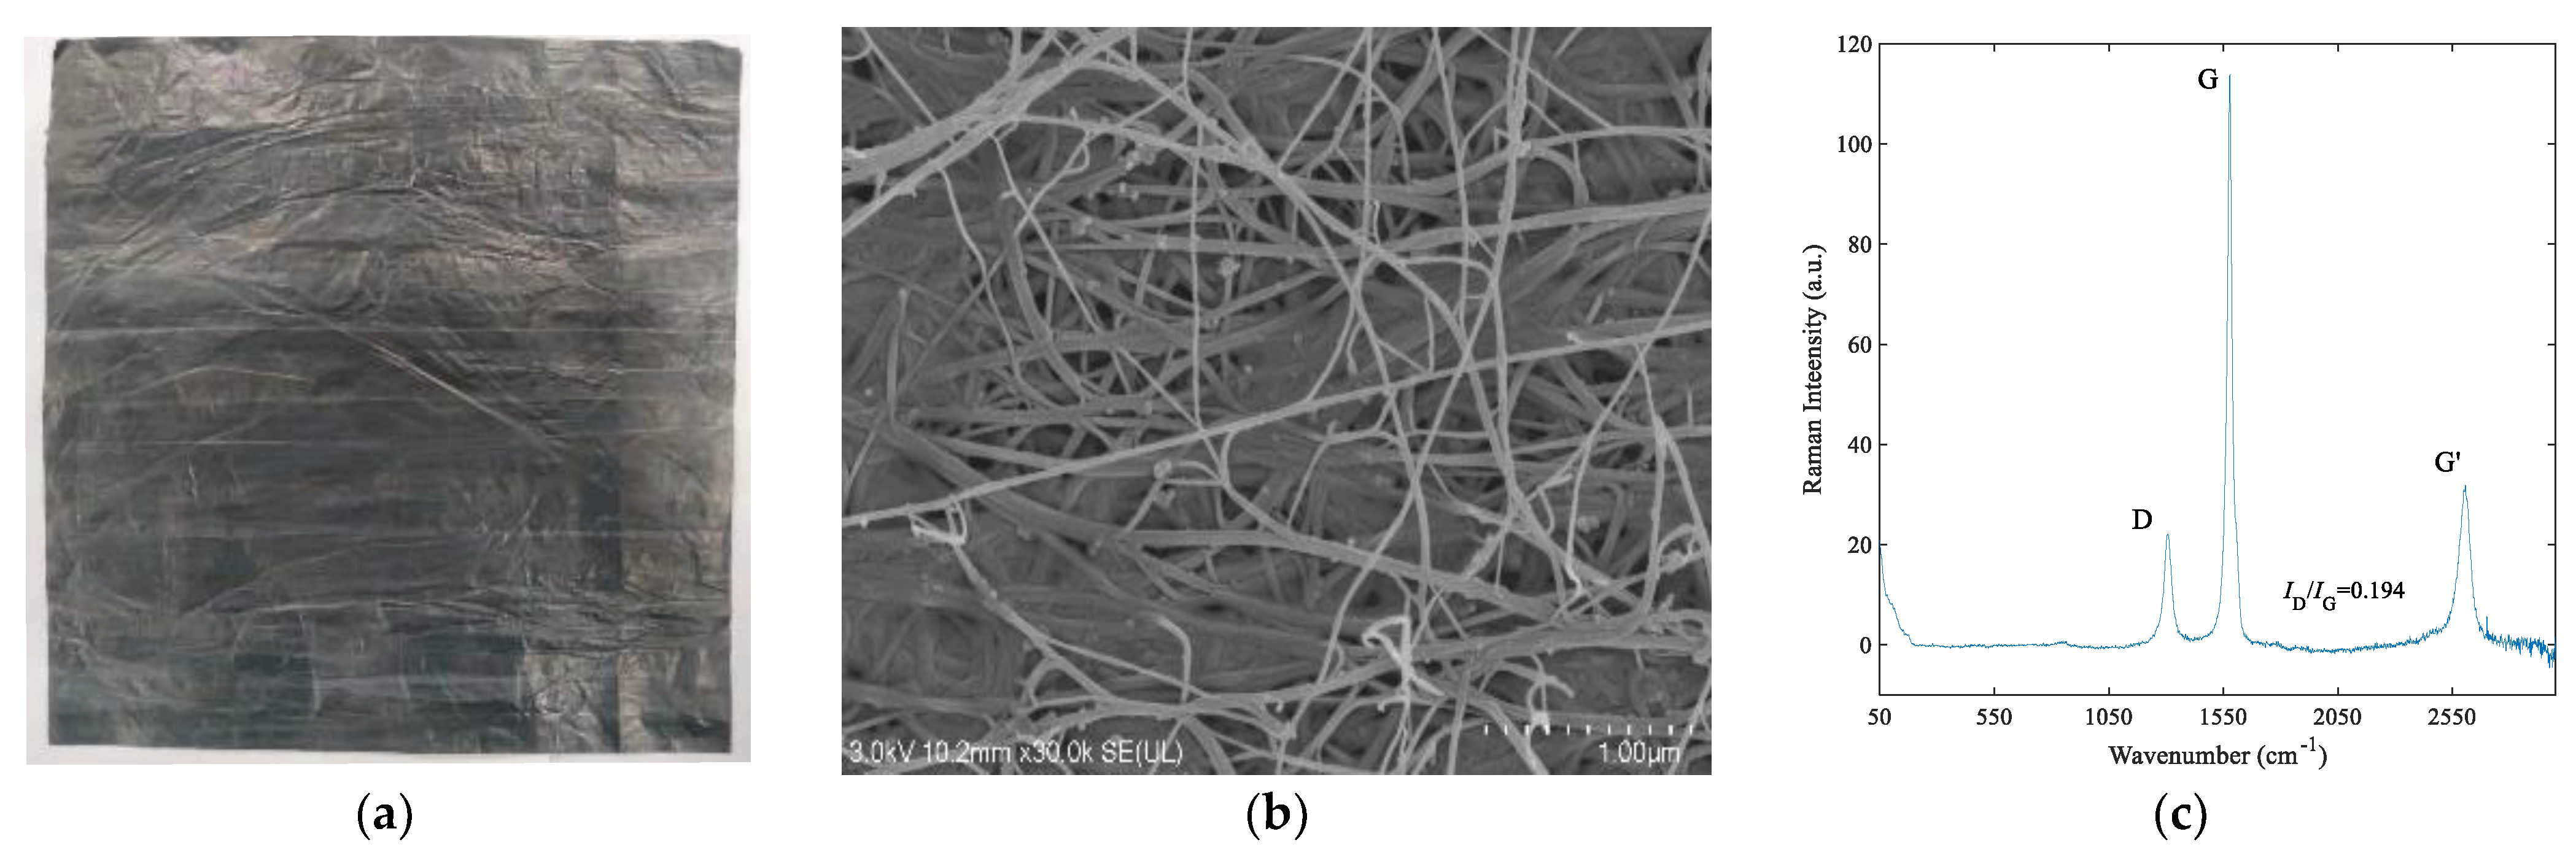
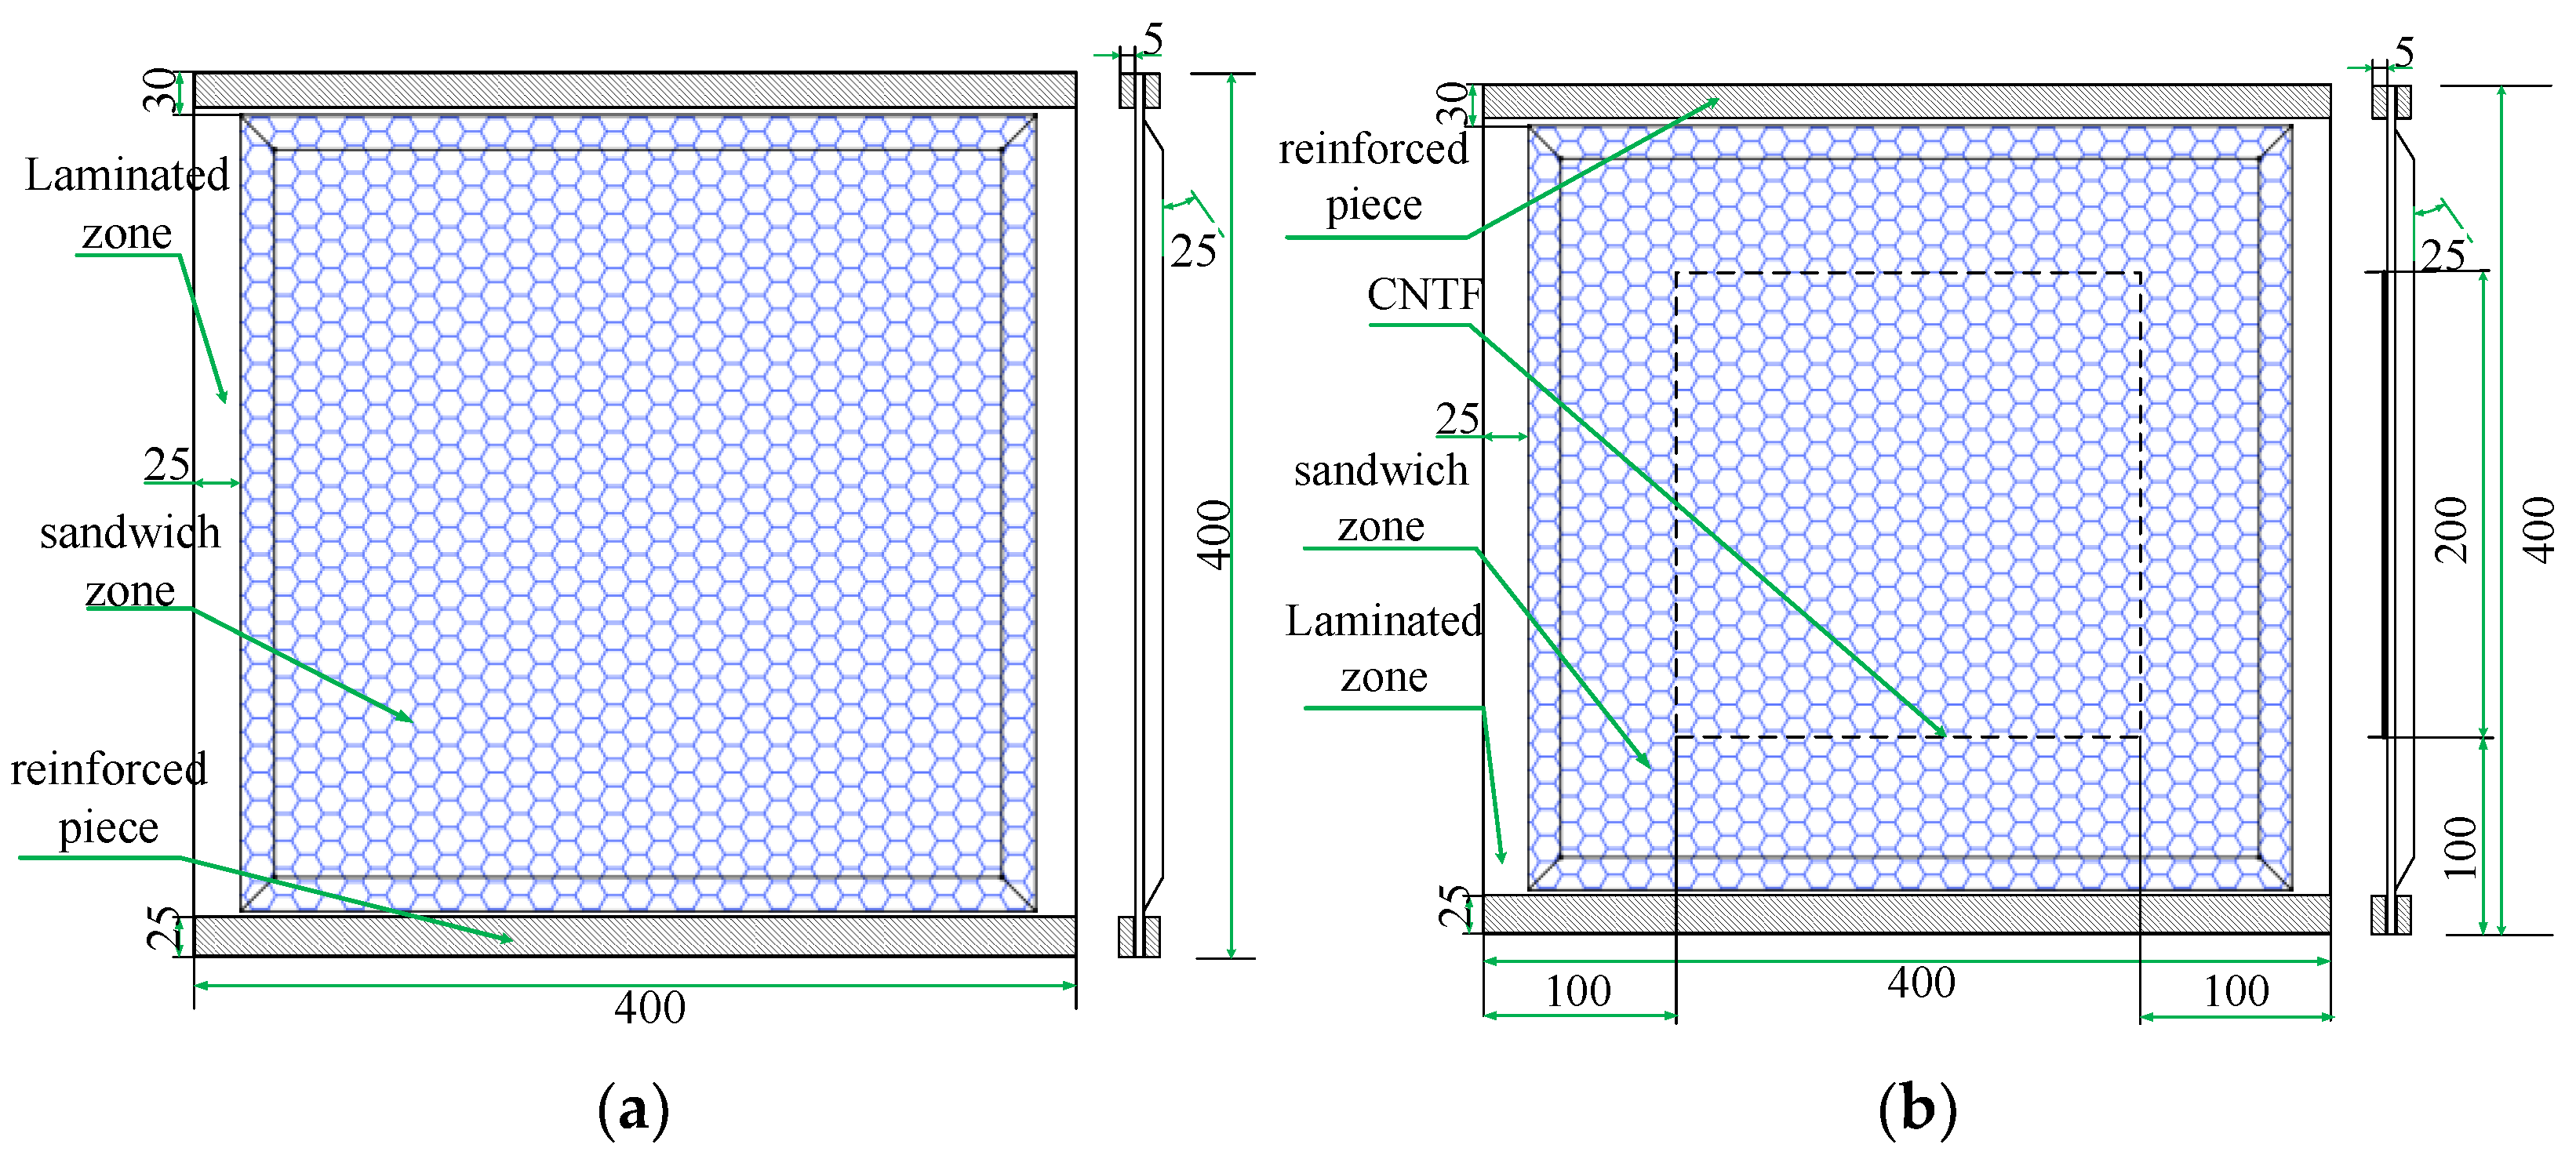
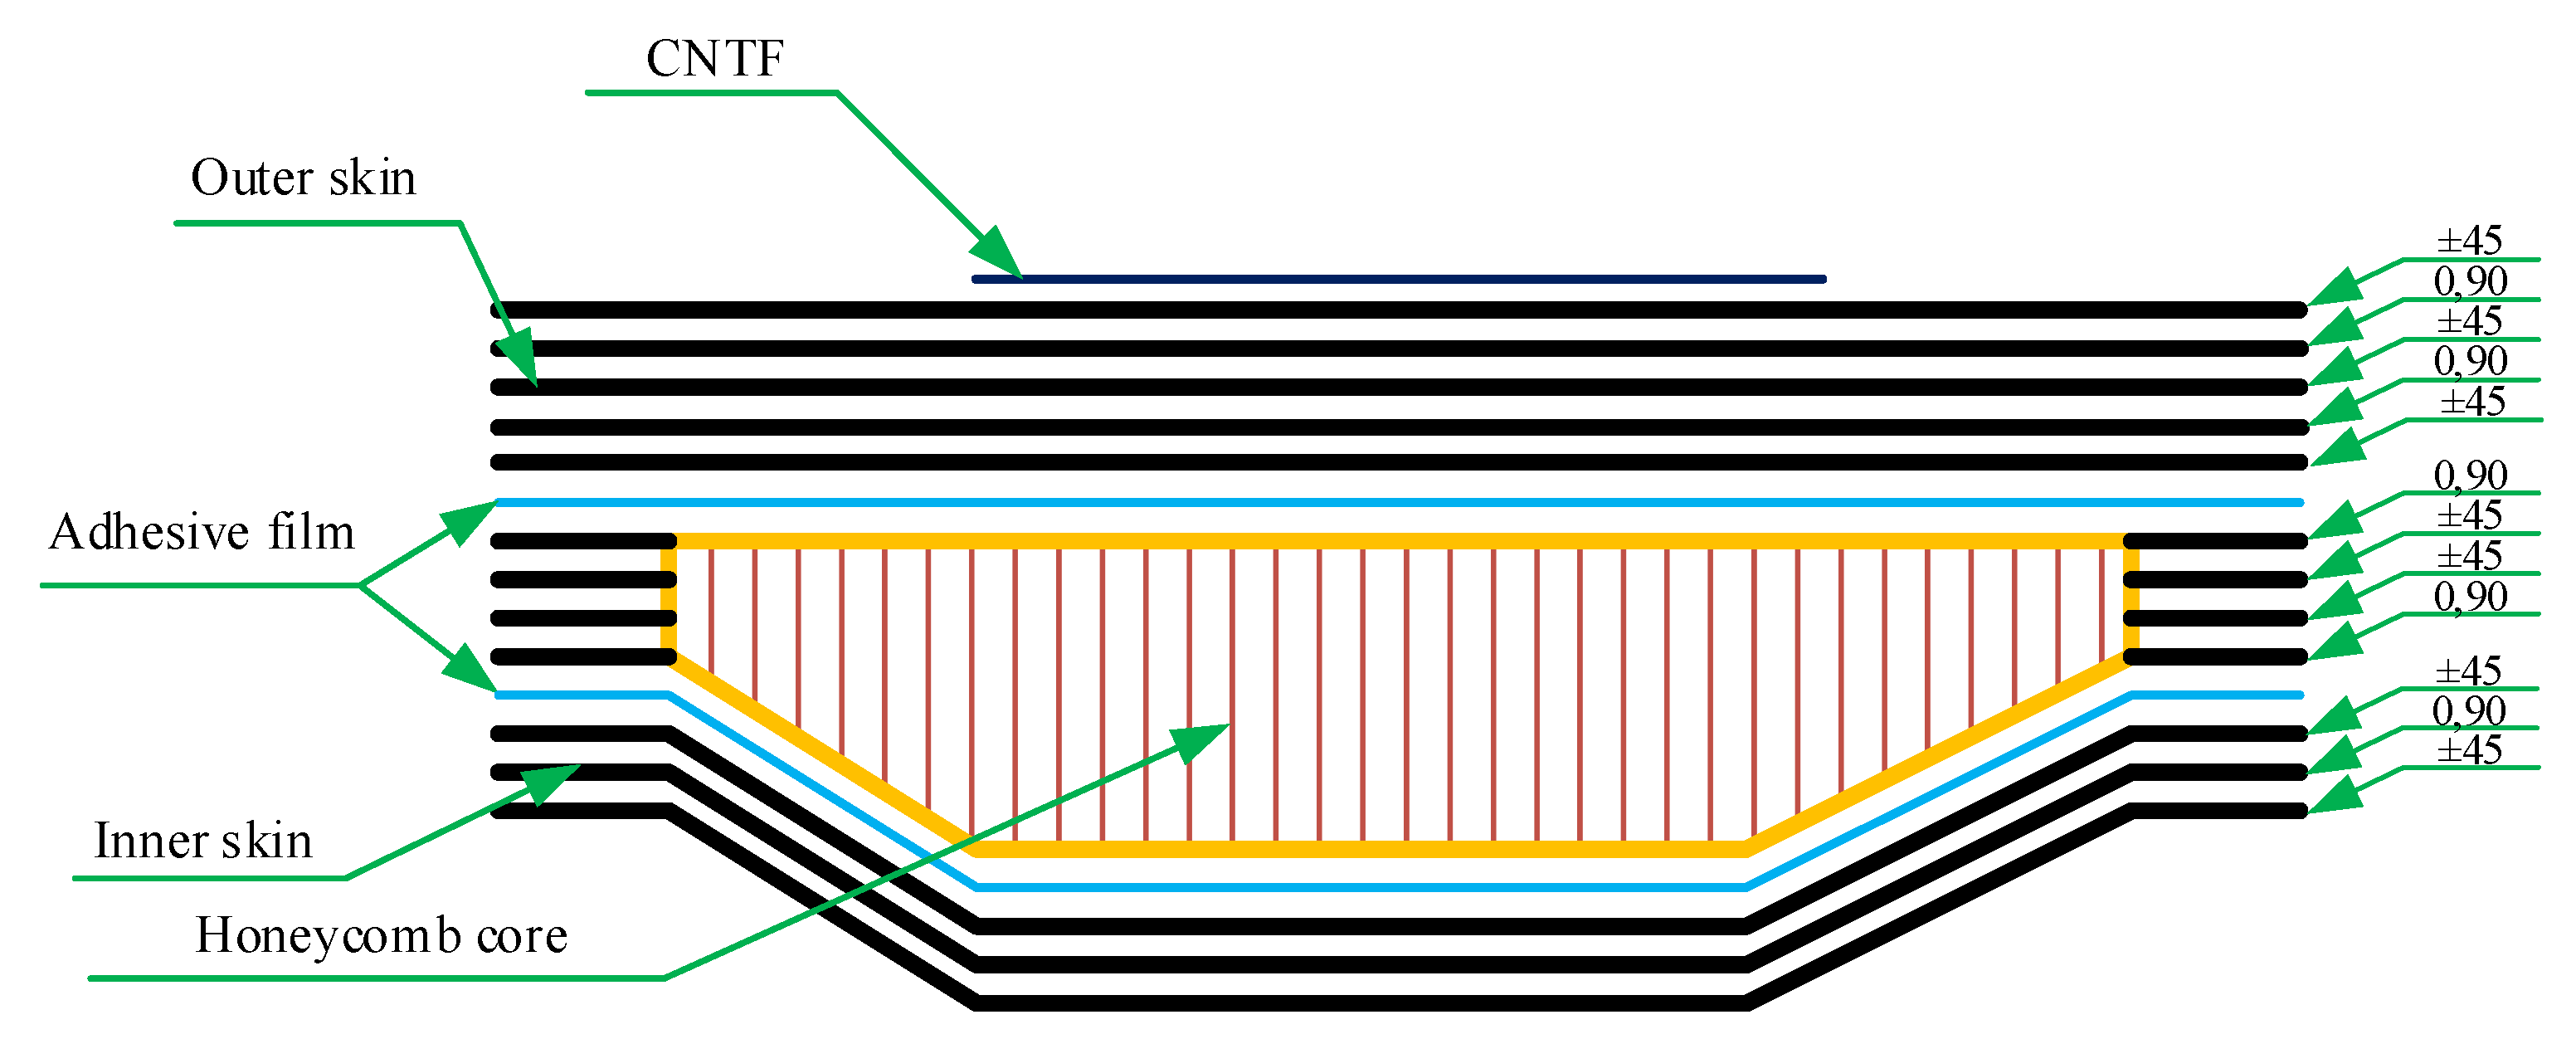
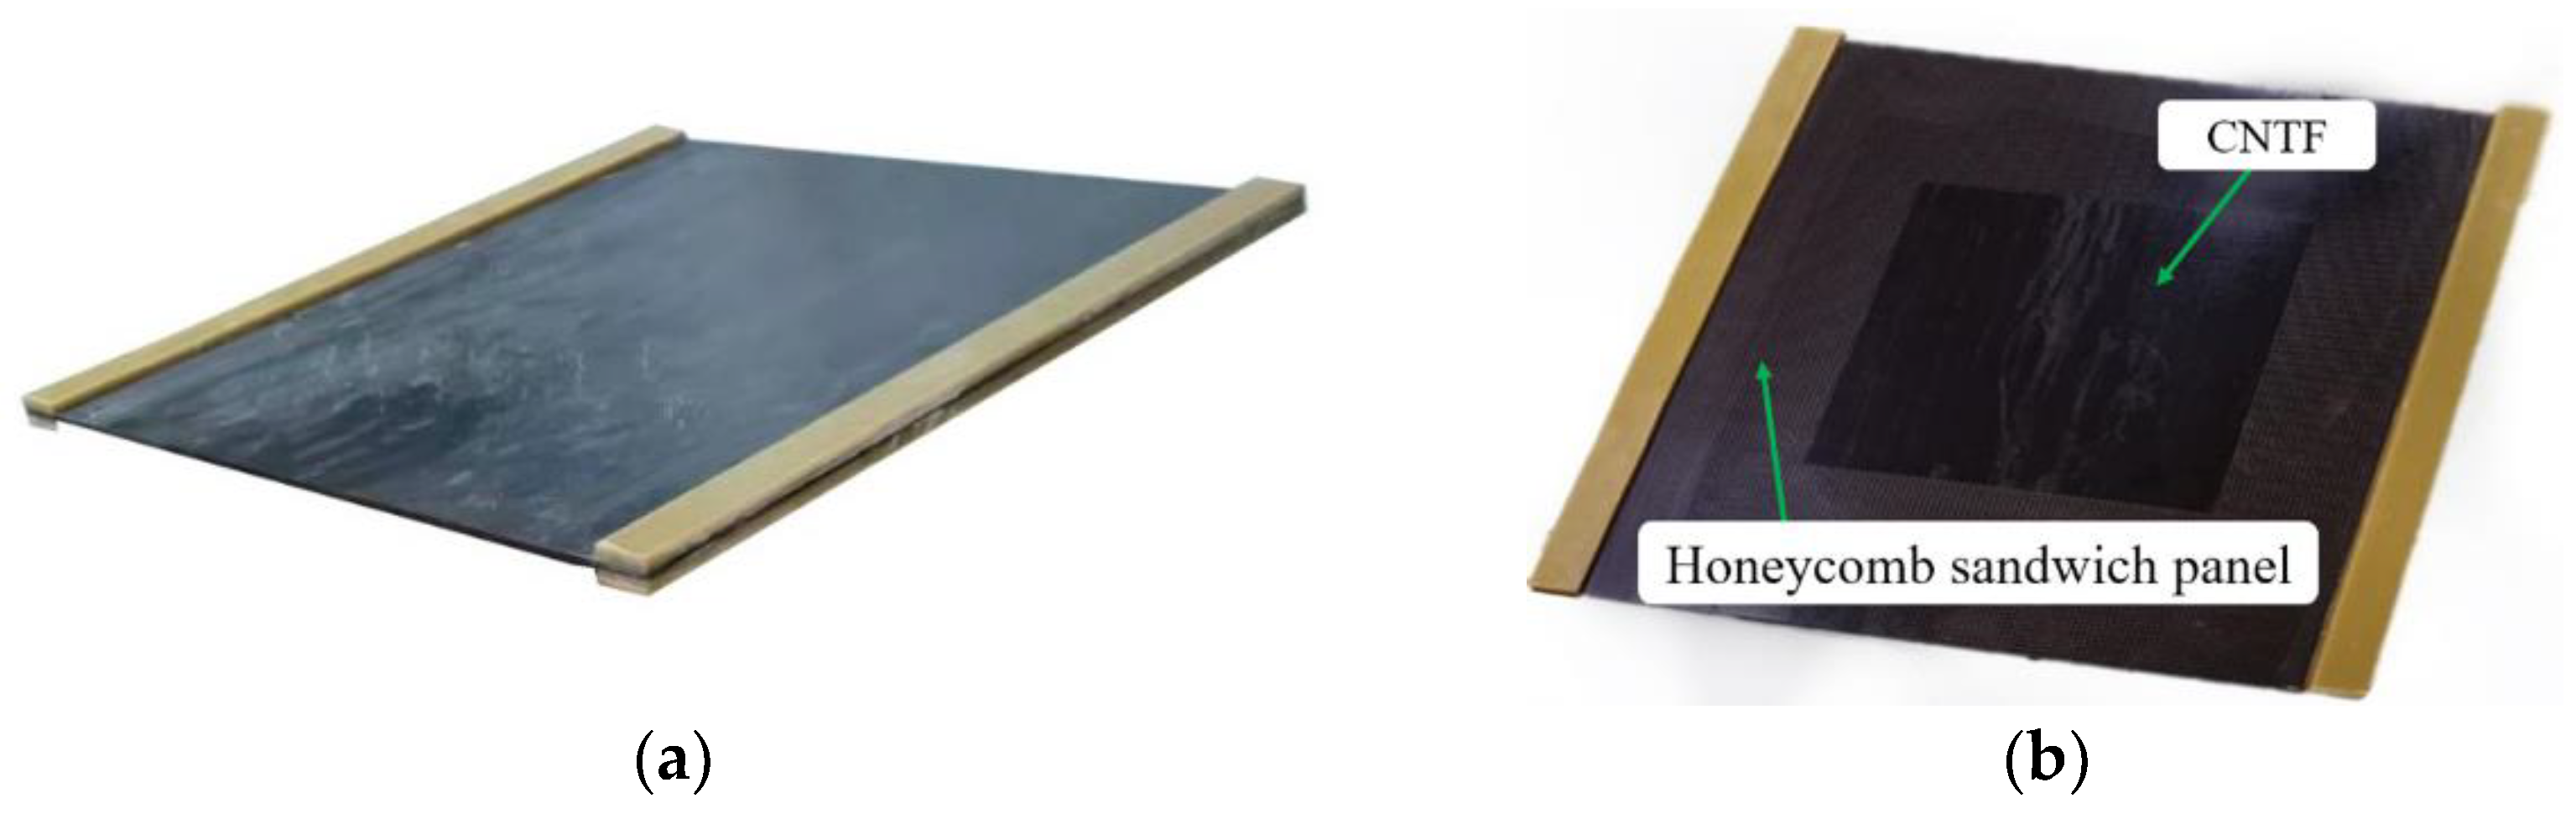
2.1. Materials and Specimens
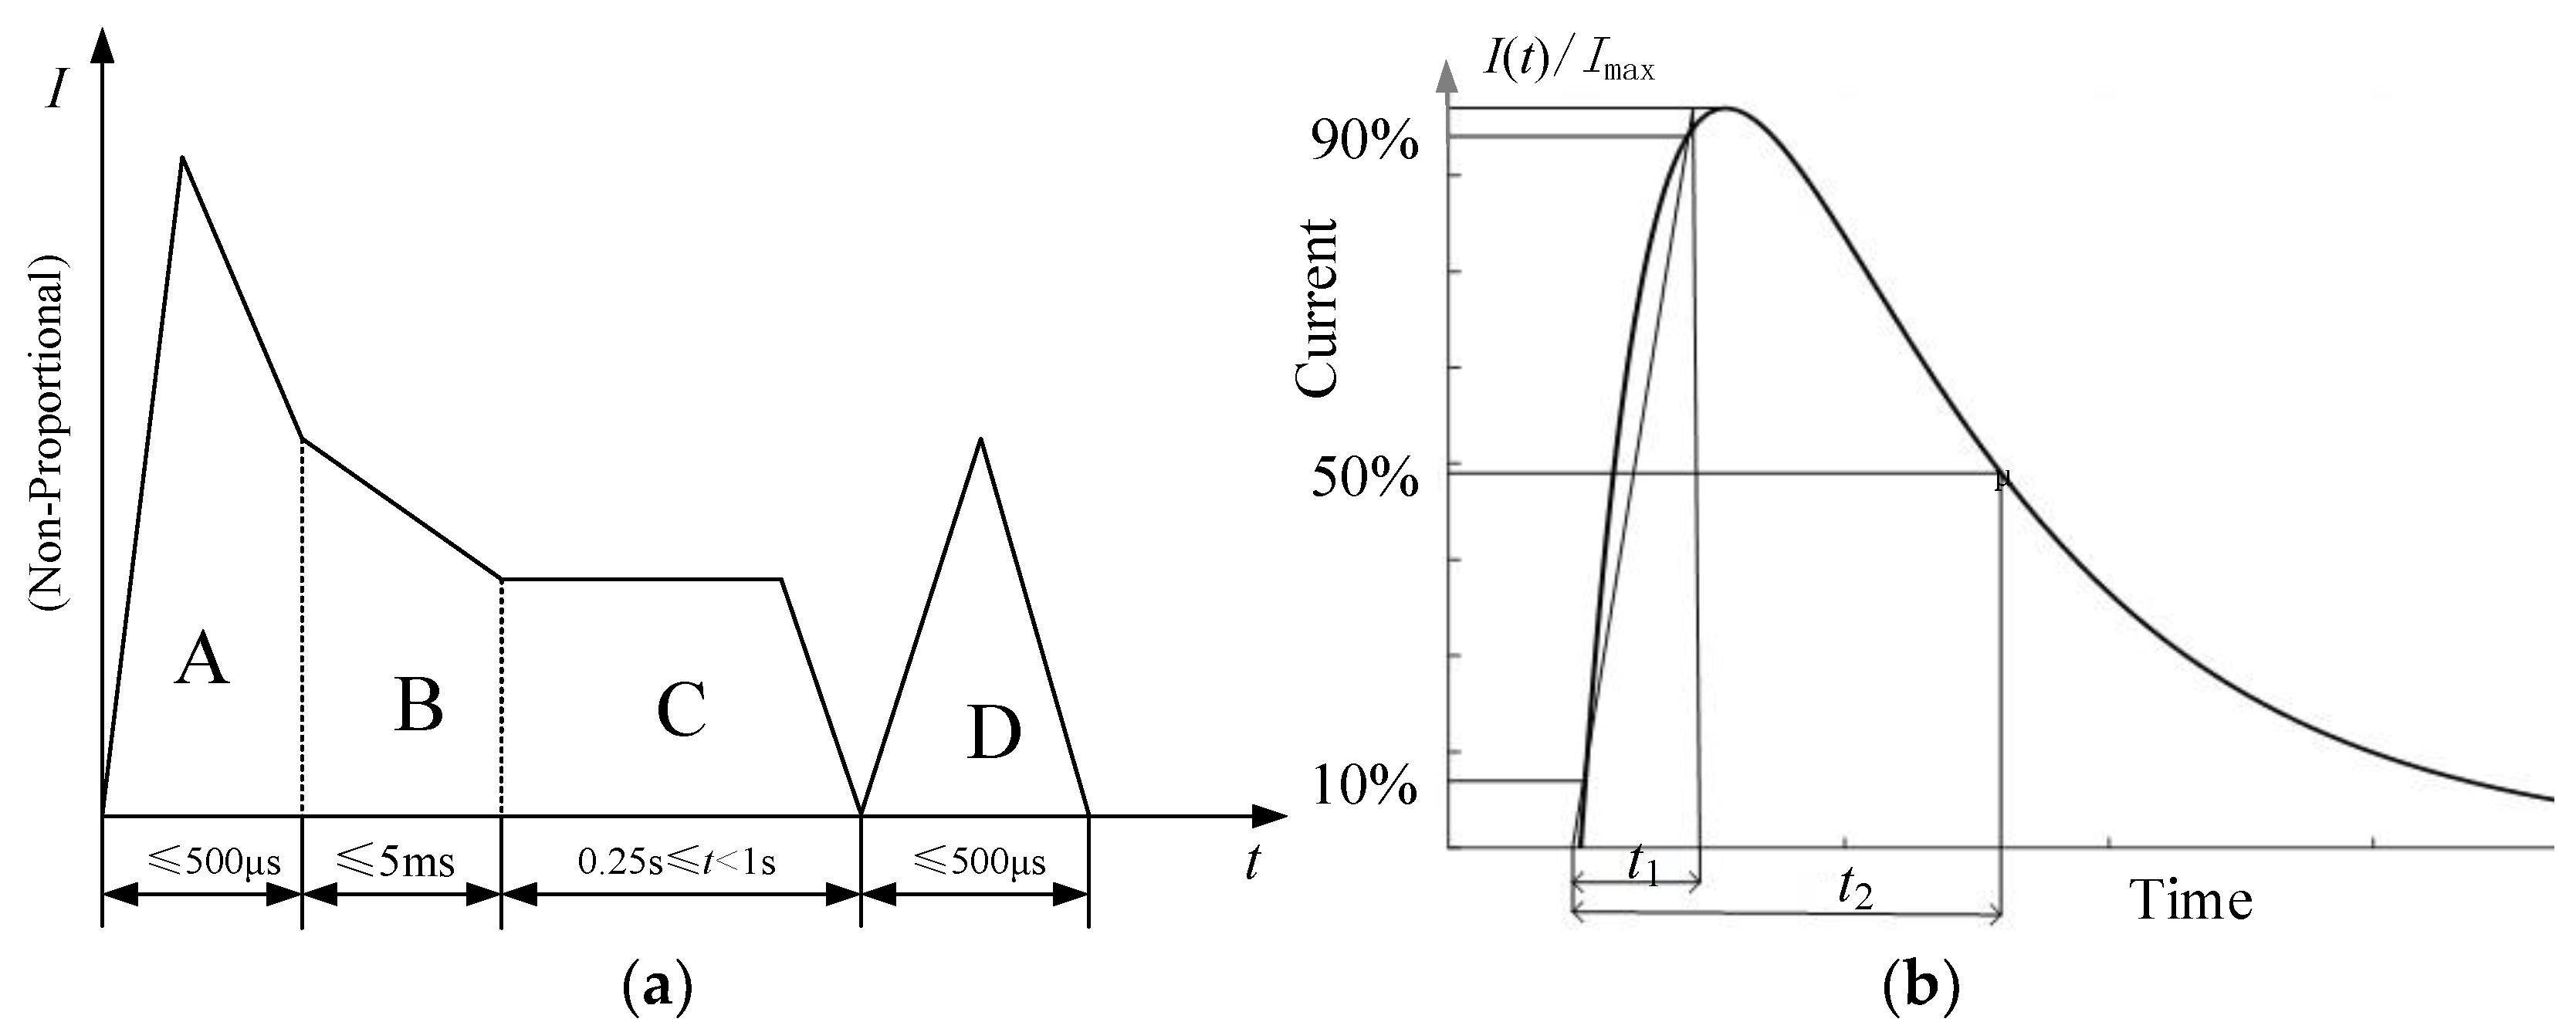
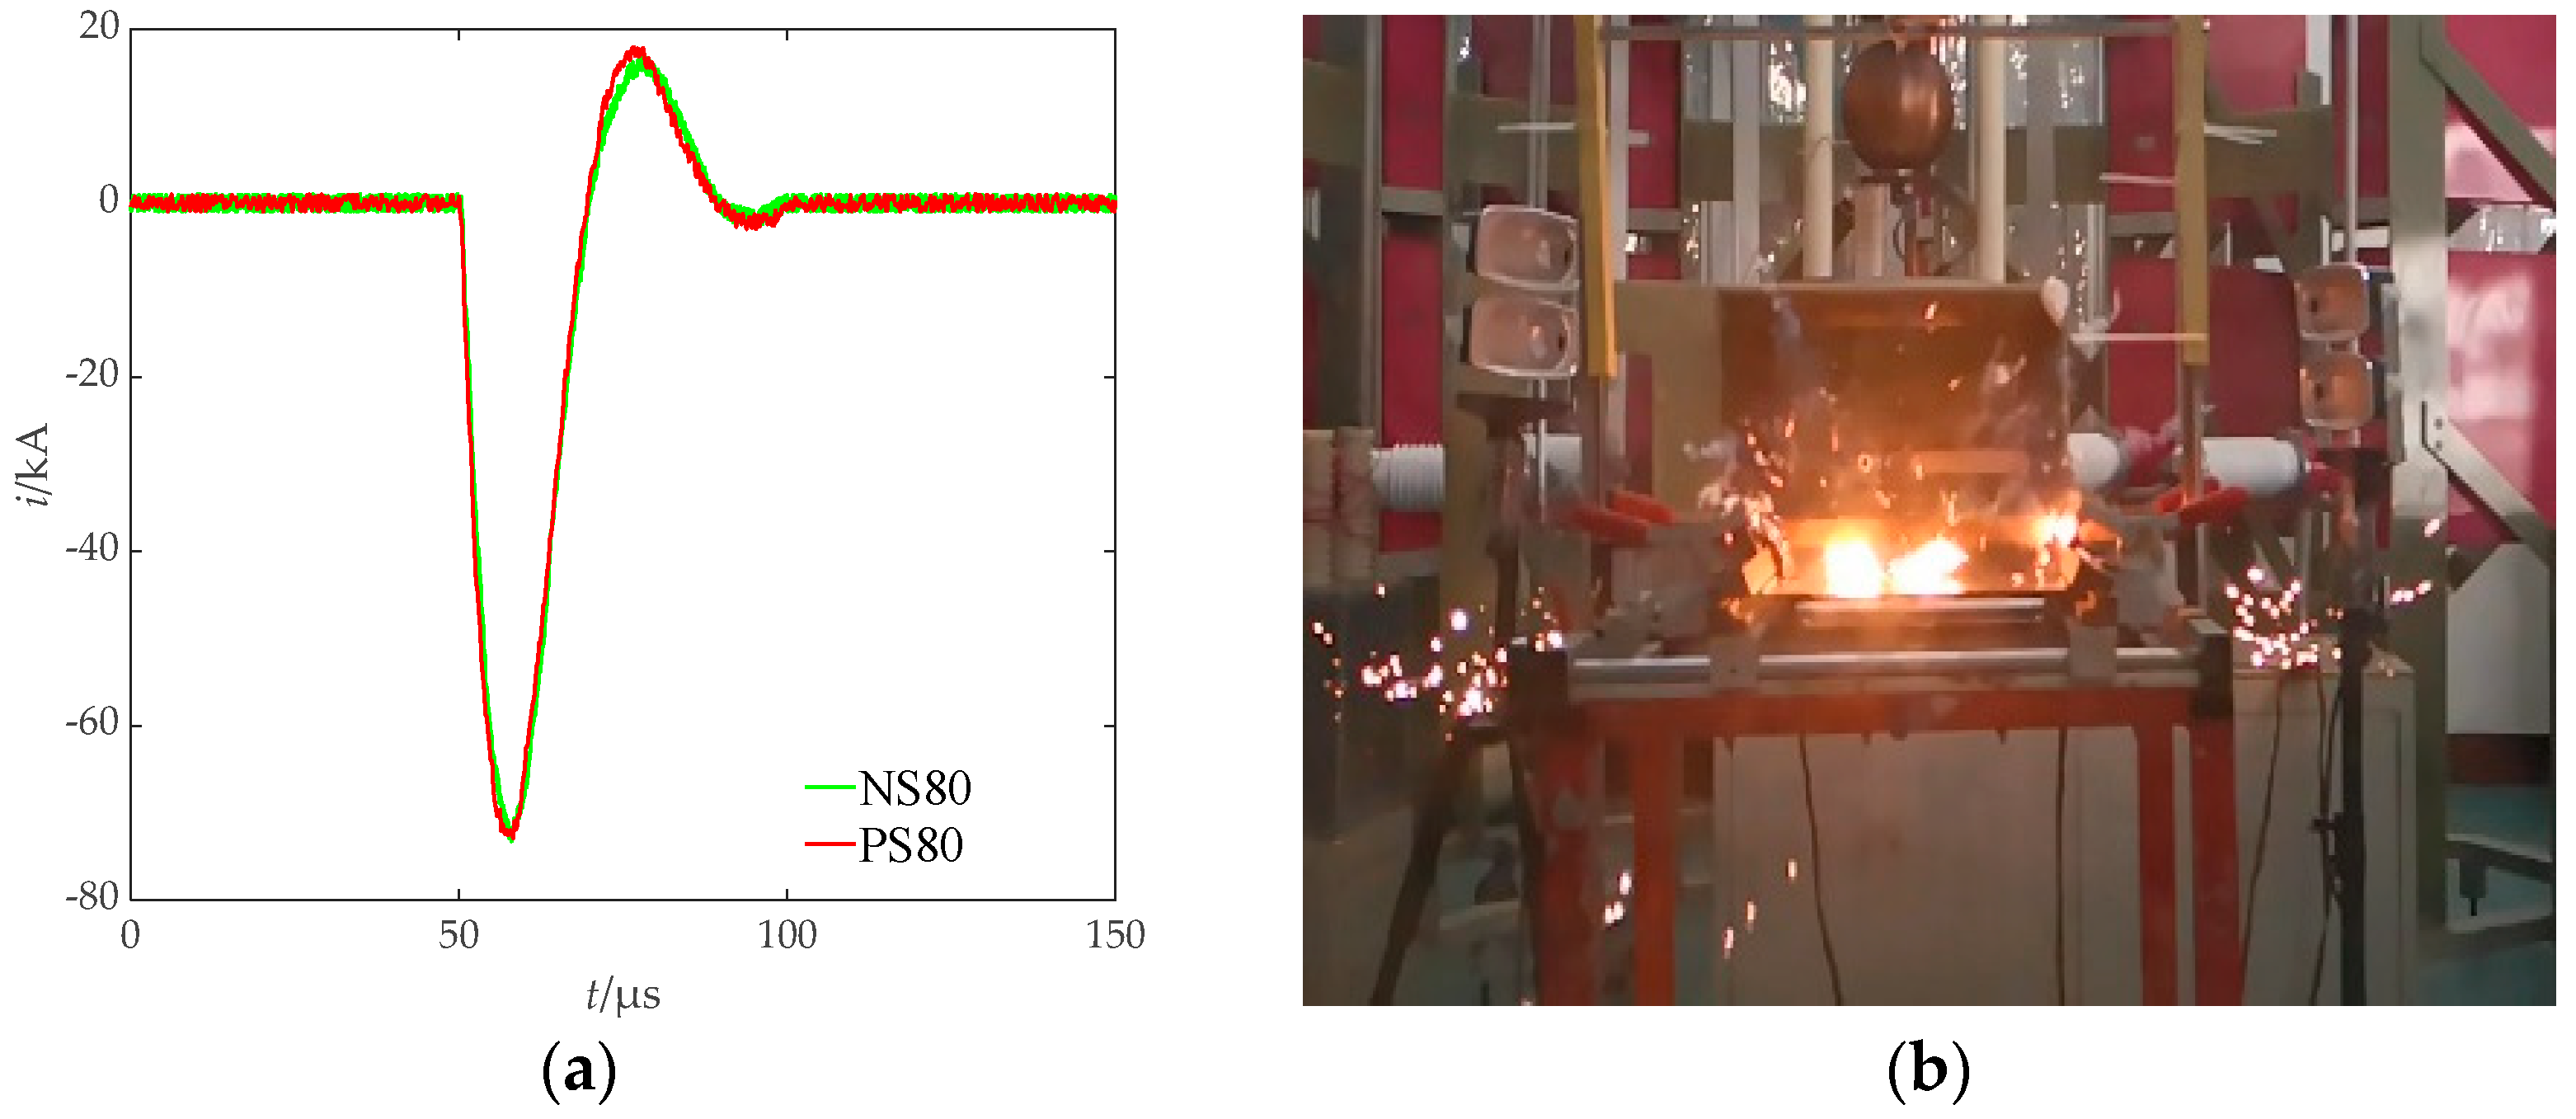
2.2. Test Setup
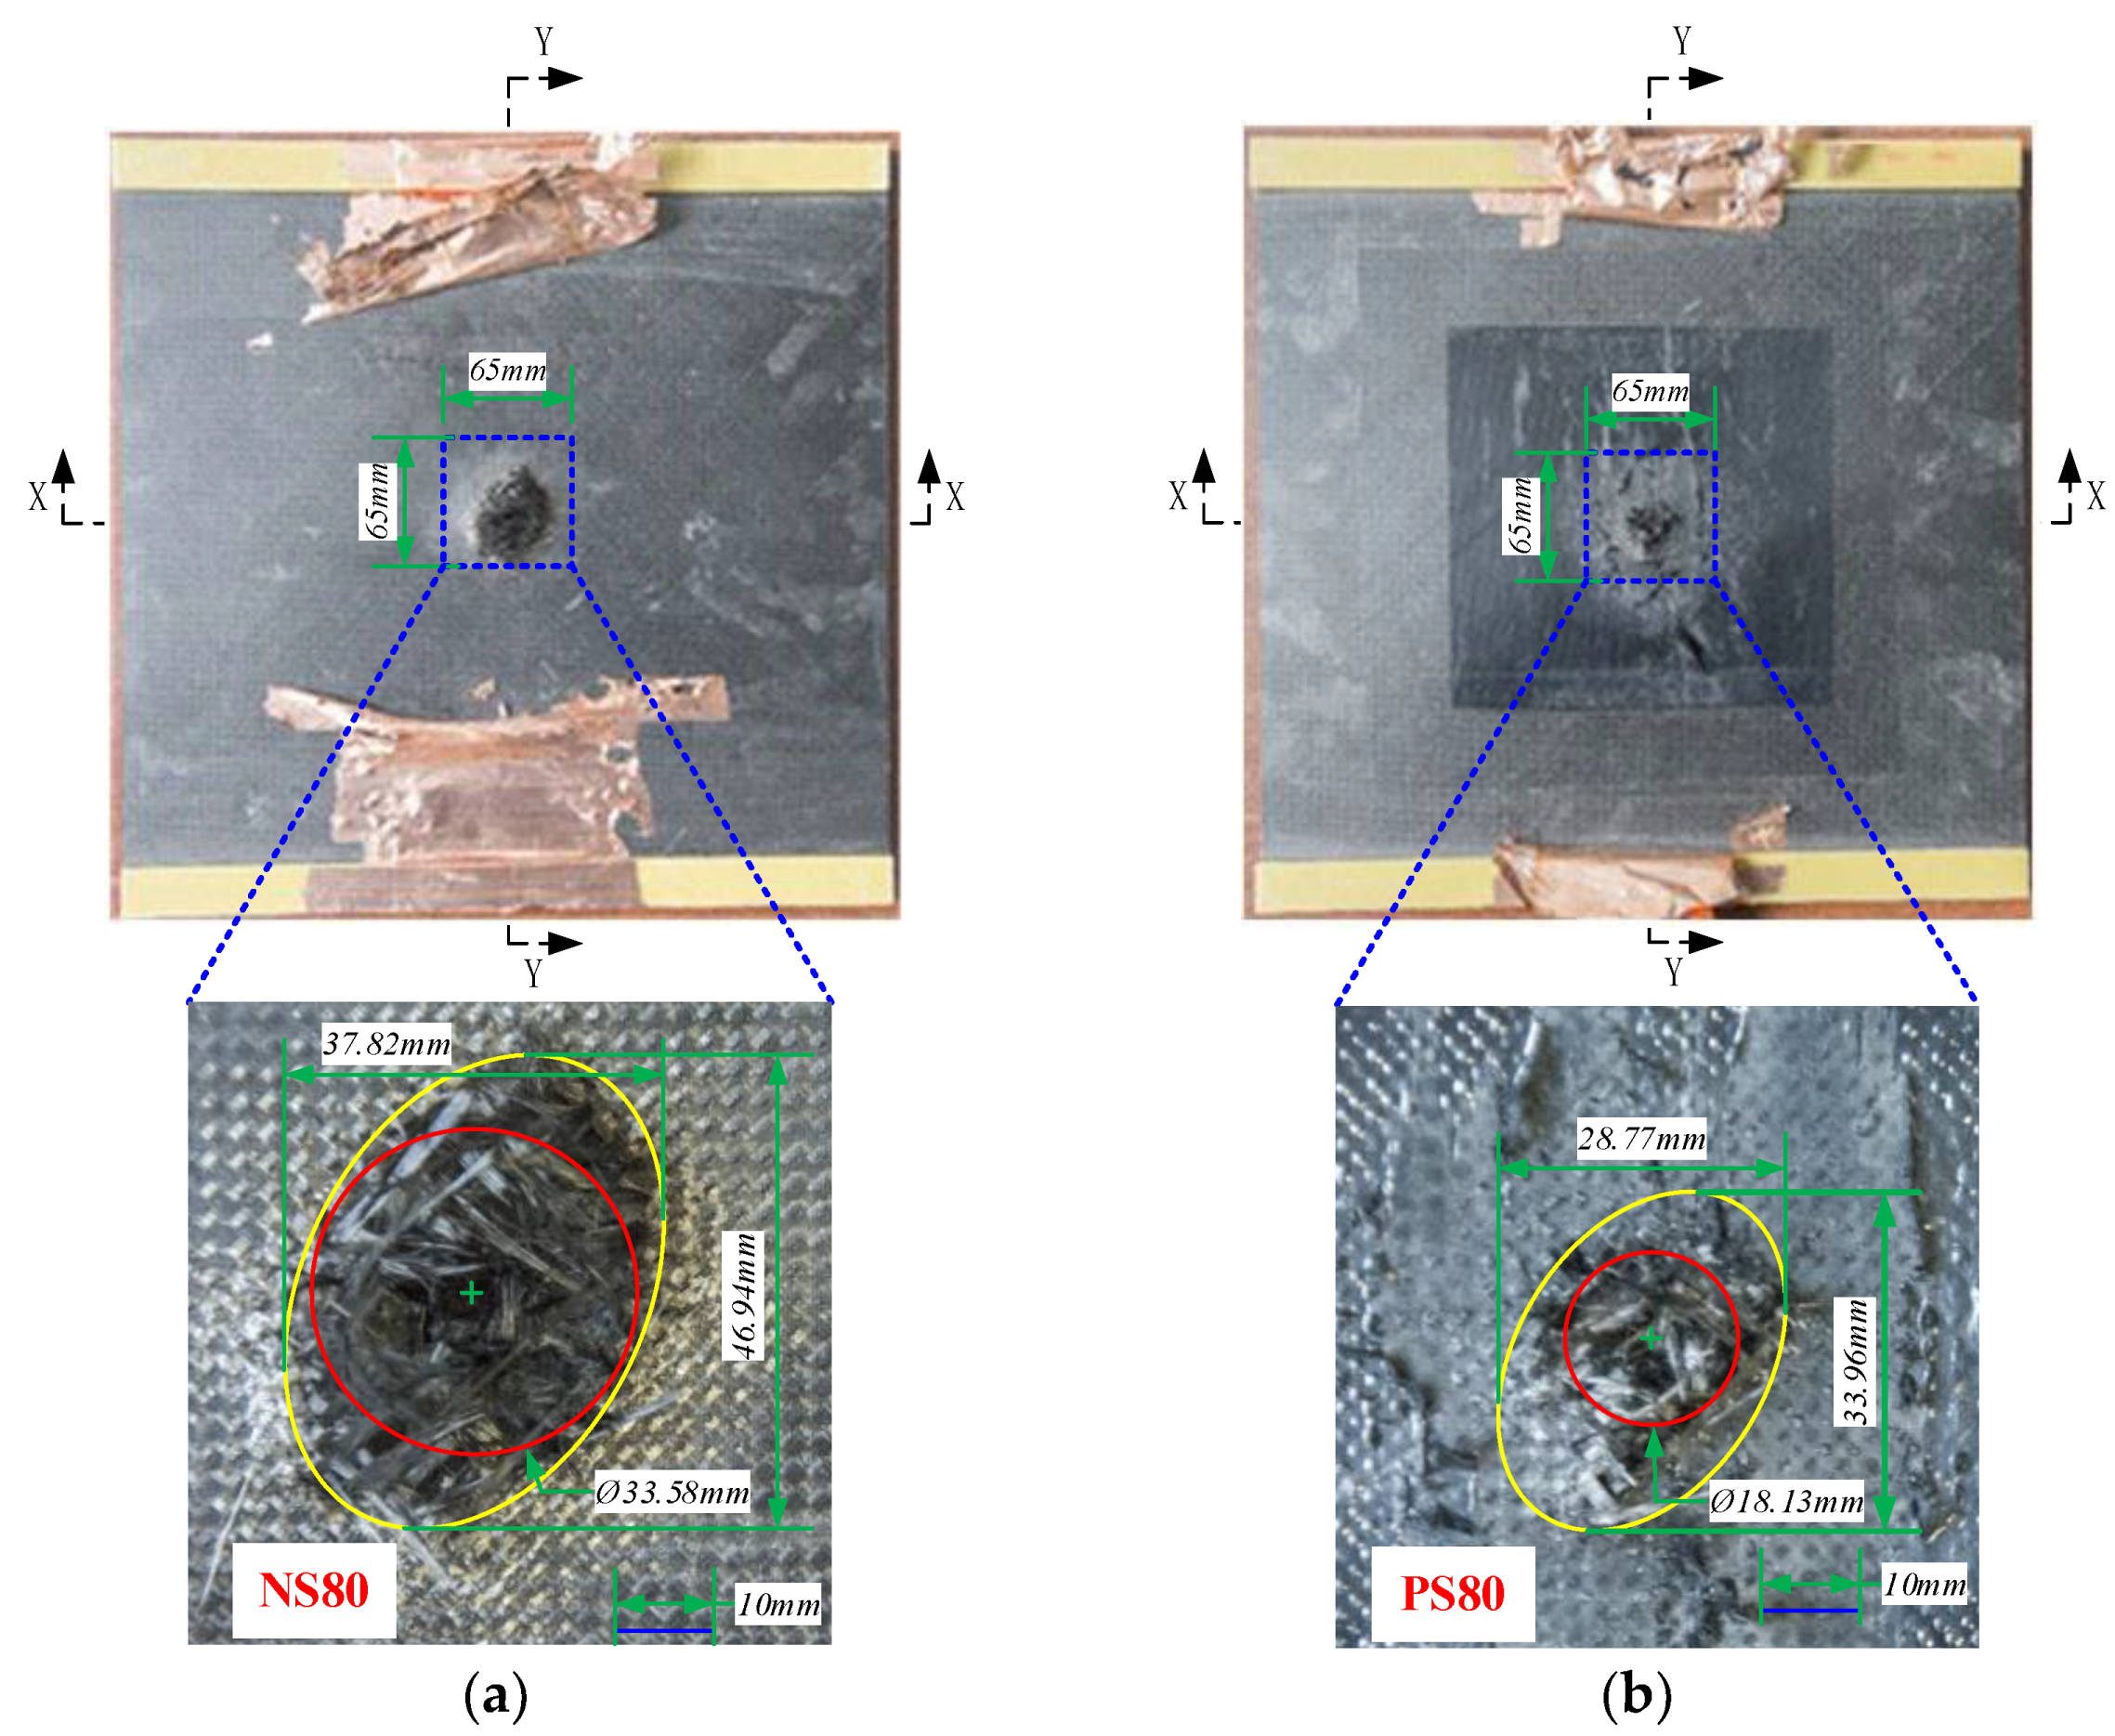
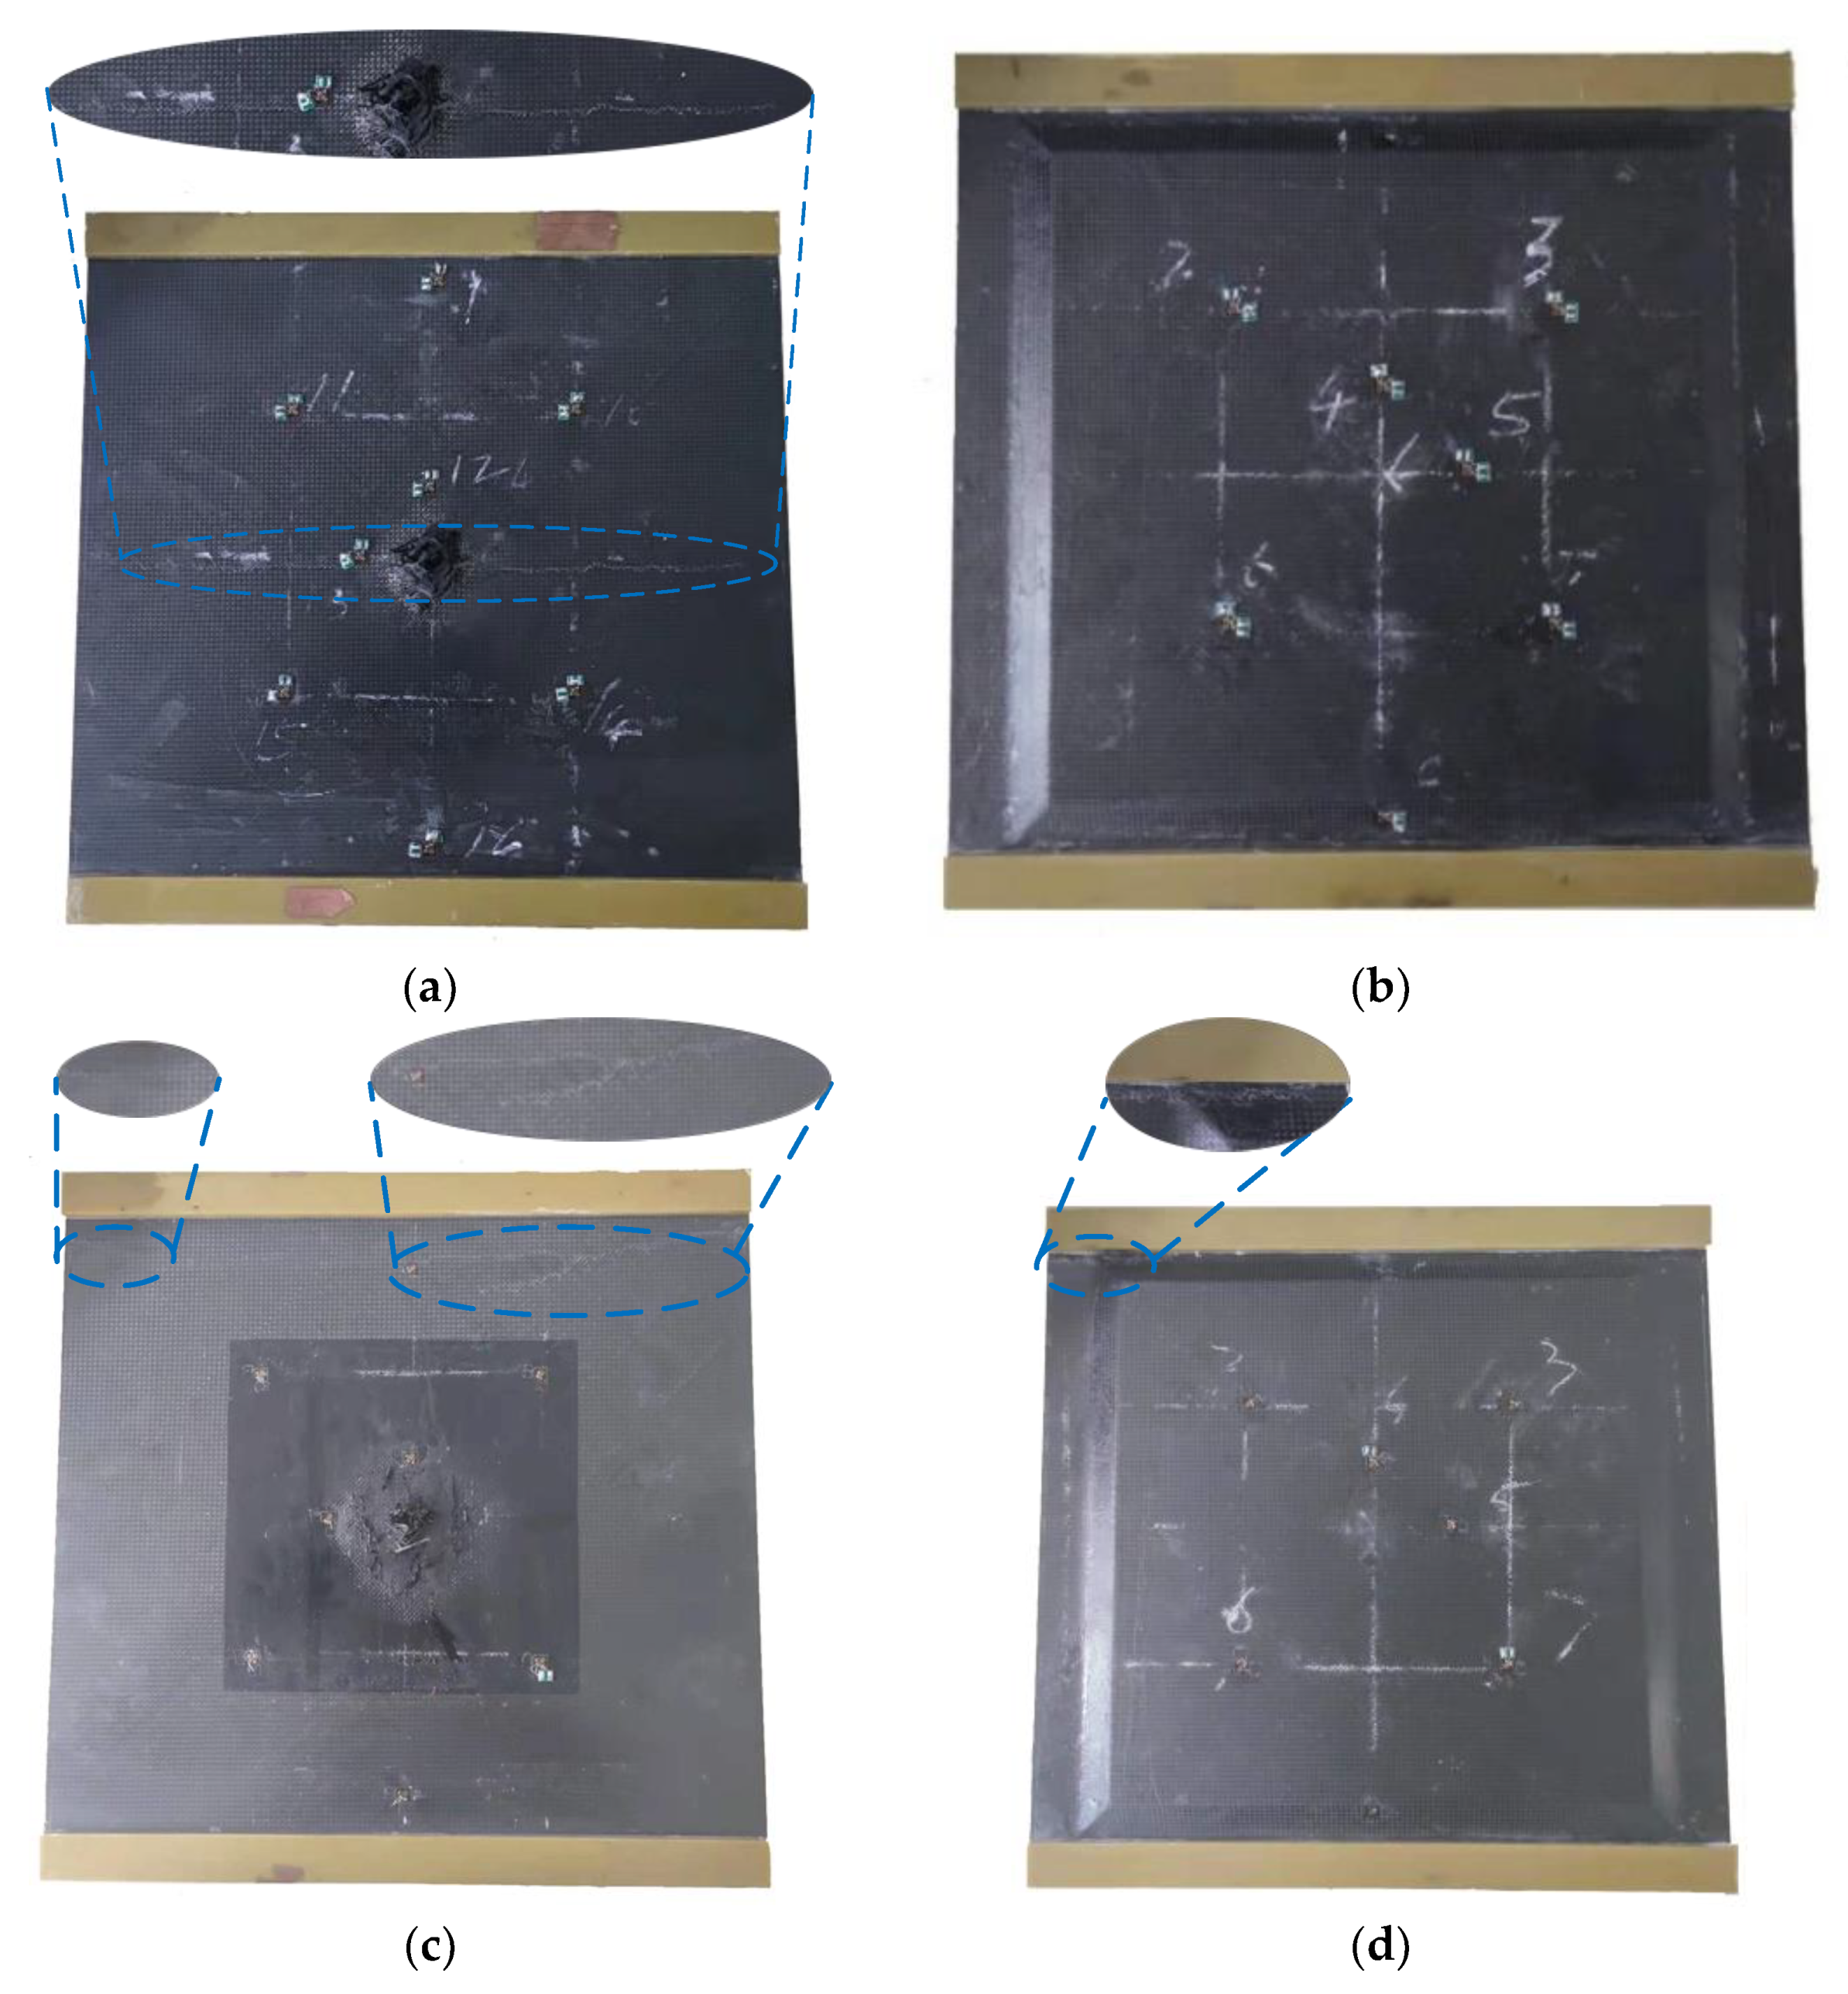
2.3. Results and Discussion
3. Axial Compression Test
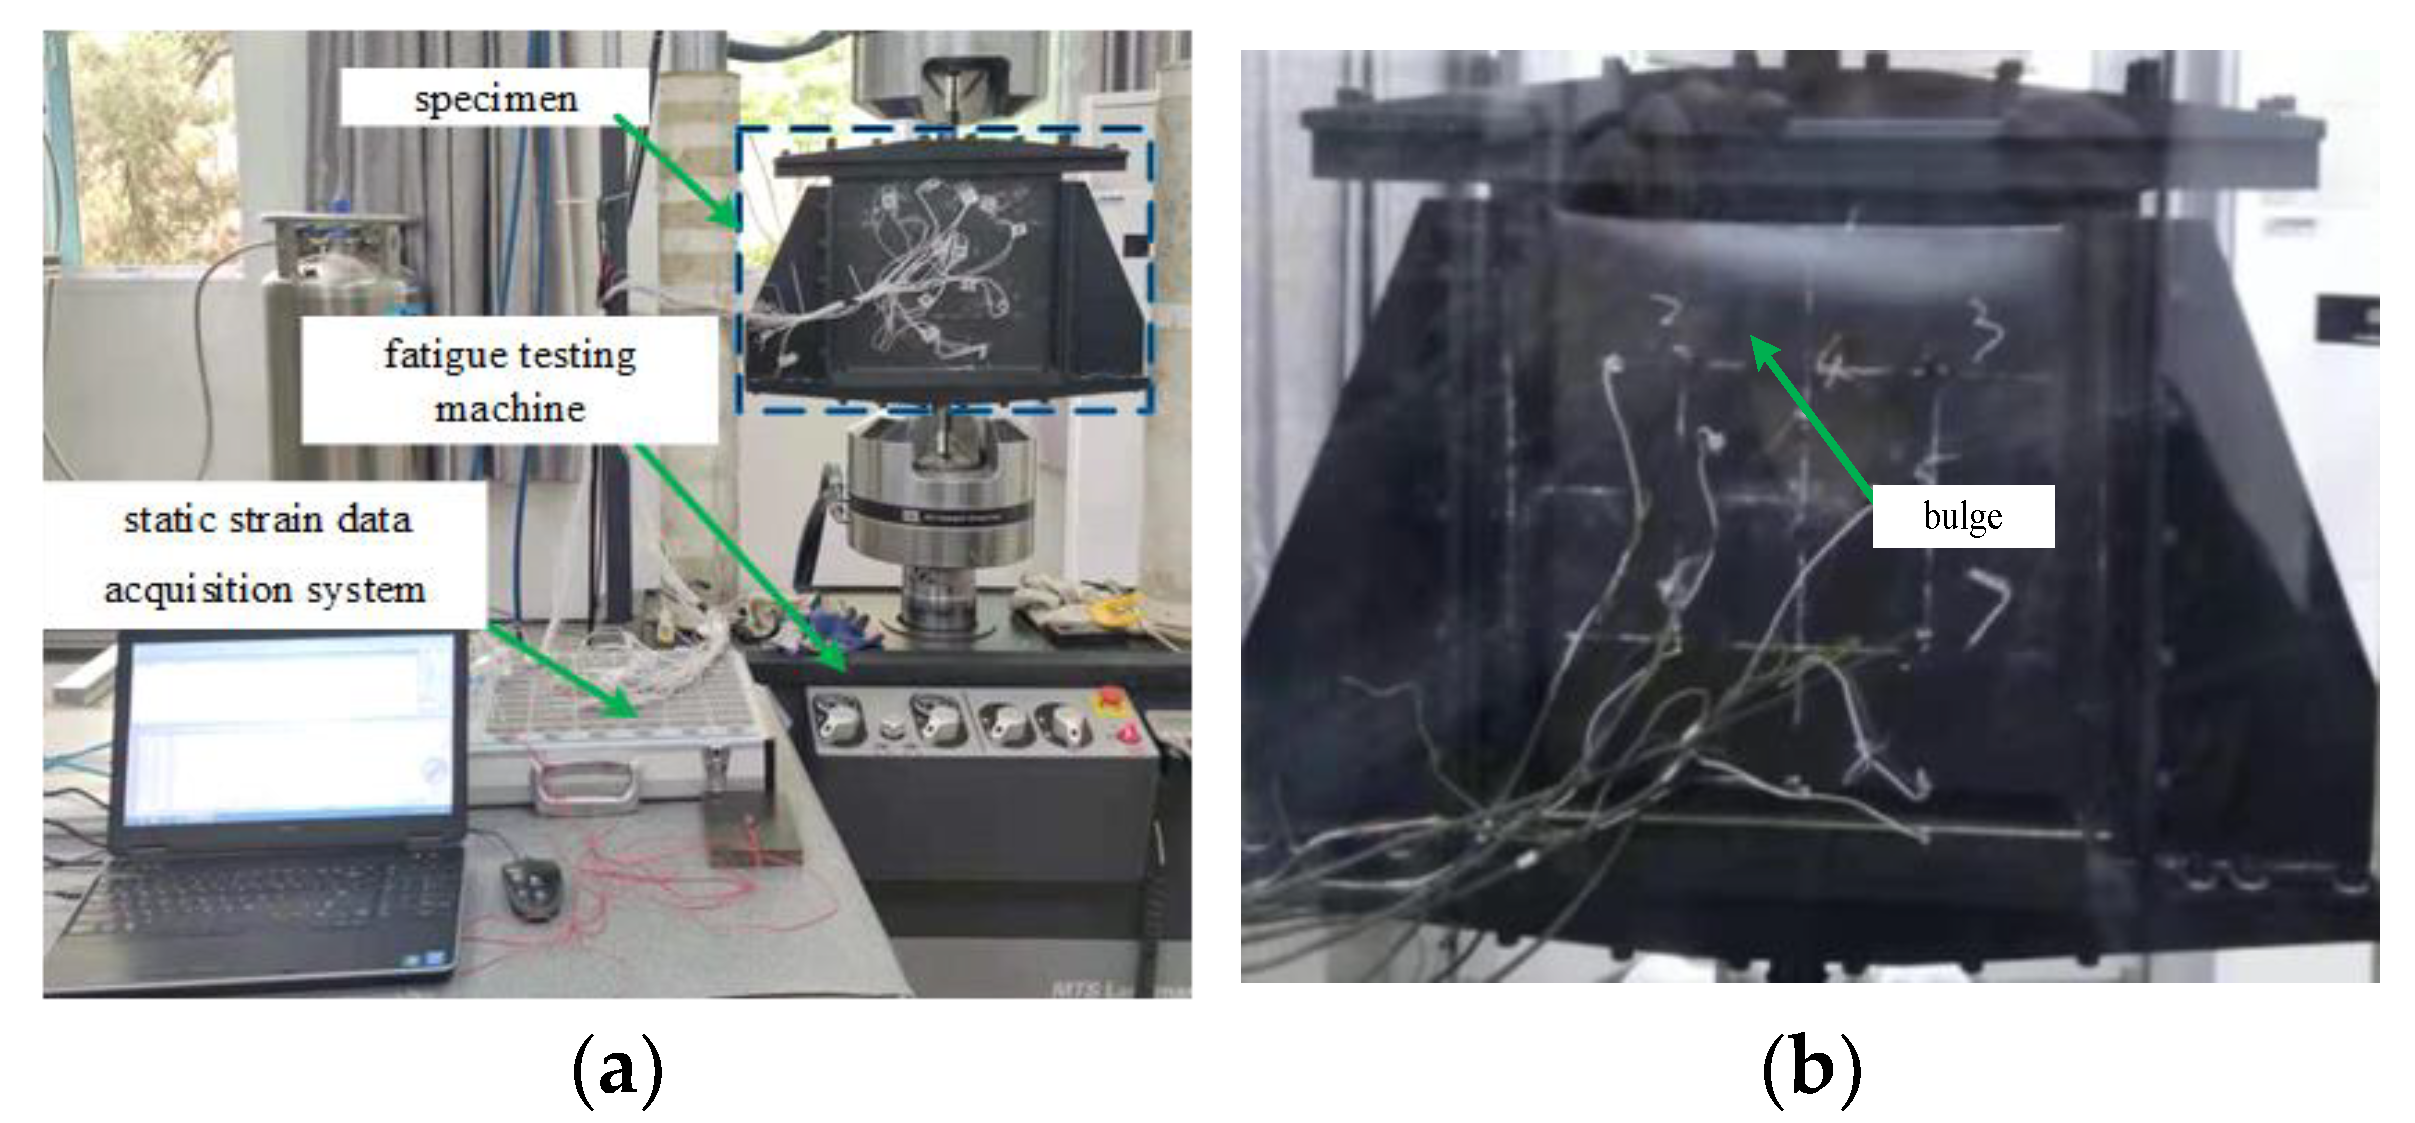
3.1. Test Setup
3.2. Results and Discussion
4. Numerical Simulation
4.1. Failure Criteria and Material Degradation
4.1.1. Mechanical Properties of Materials
4.1.2. Skin Damage
4.1.3. Honeycomb Core Damage
4.1.4. Adhesive Film Damage
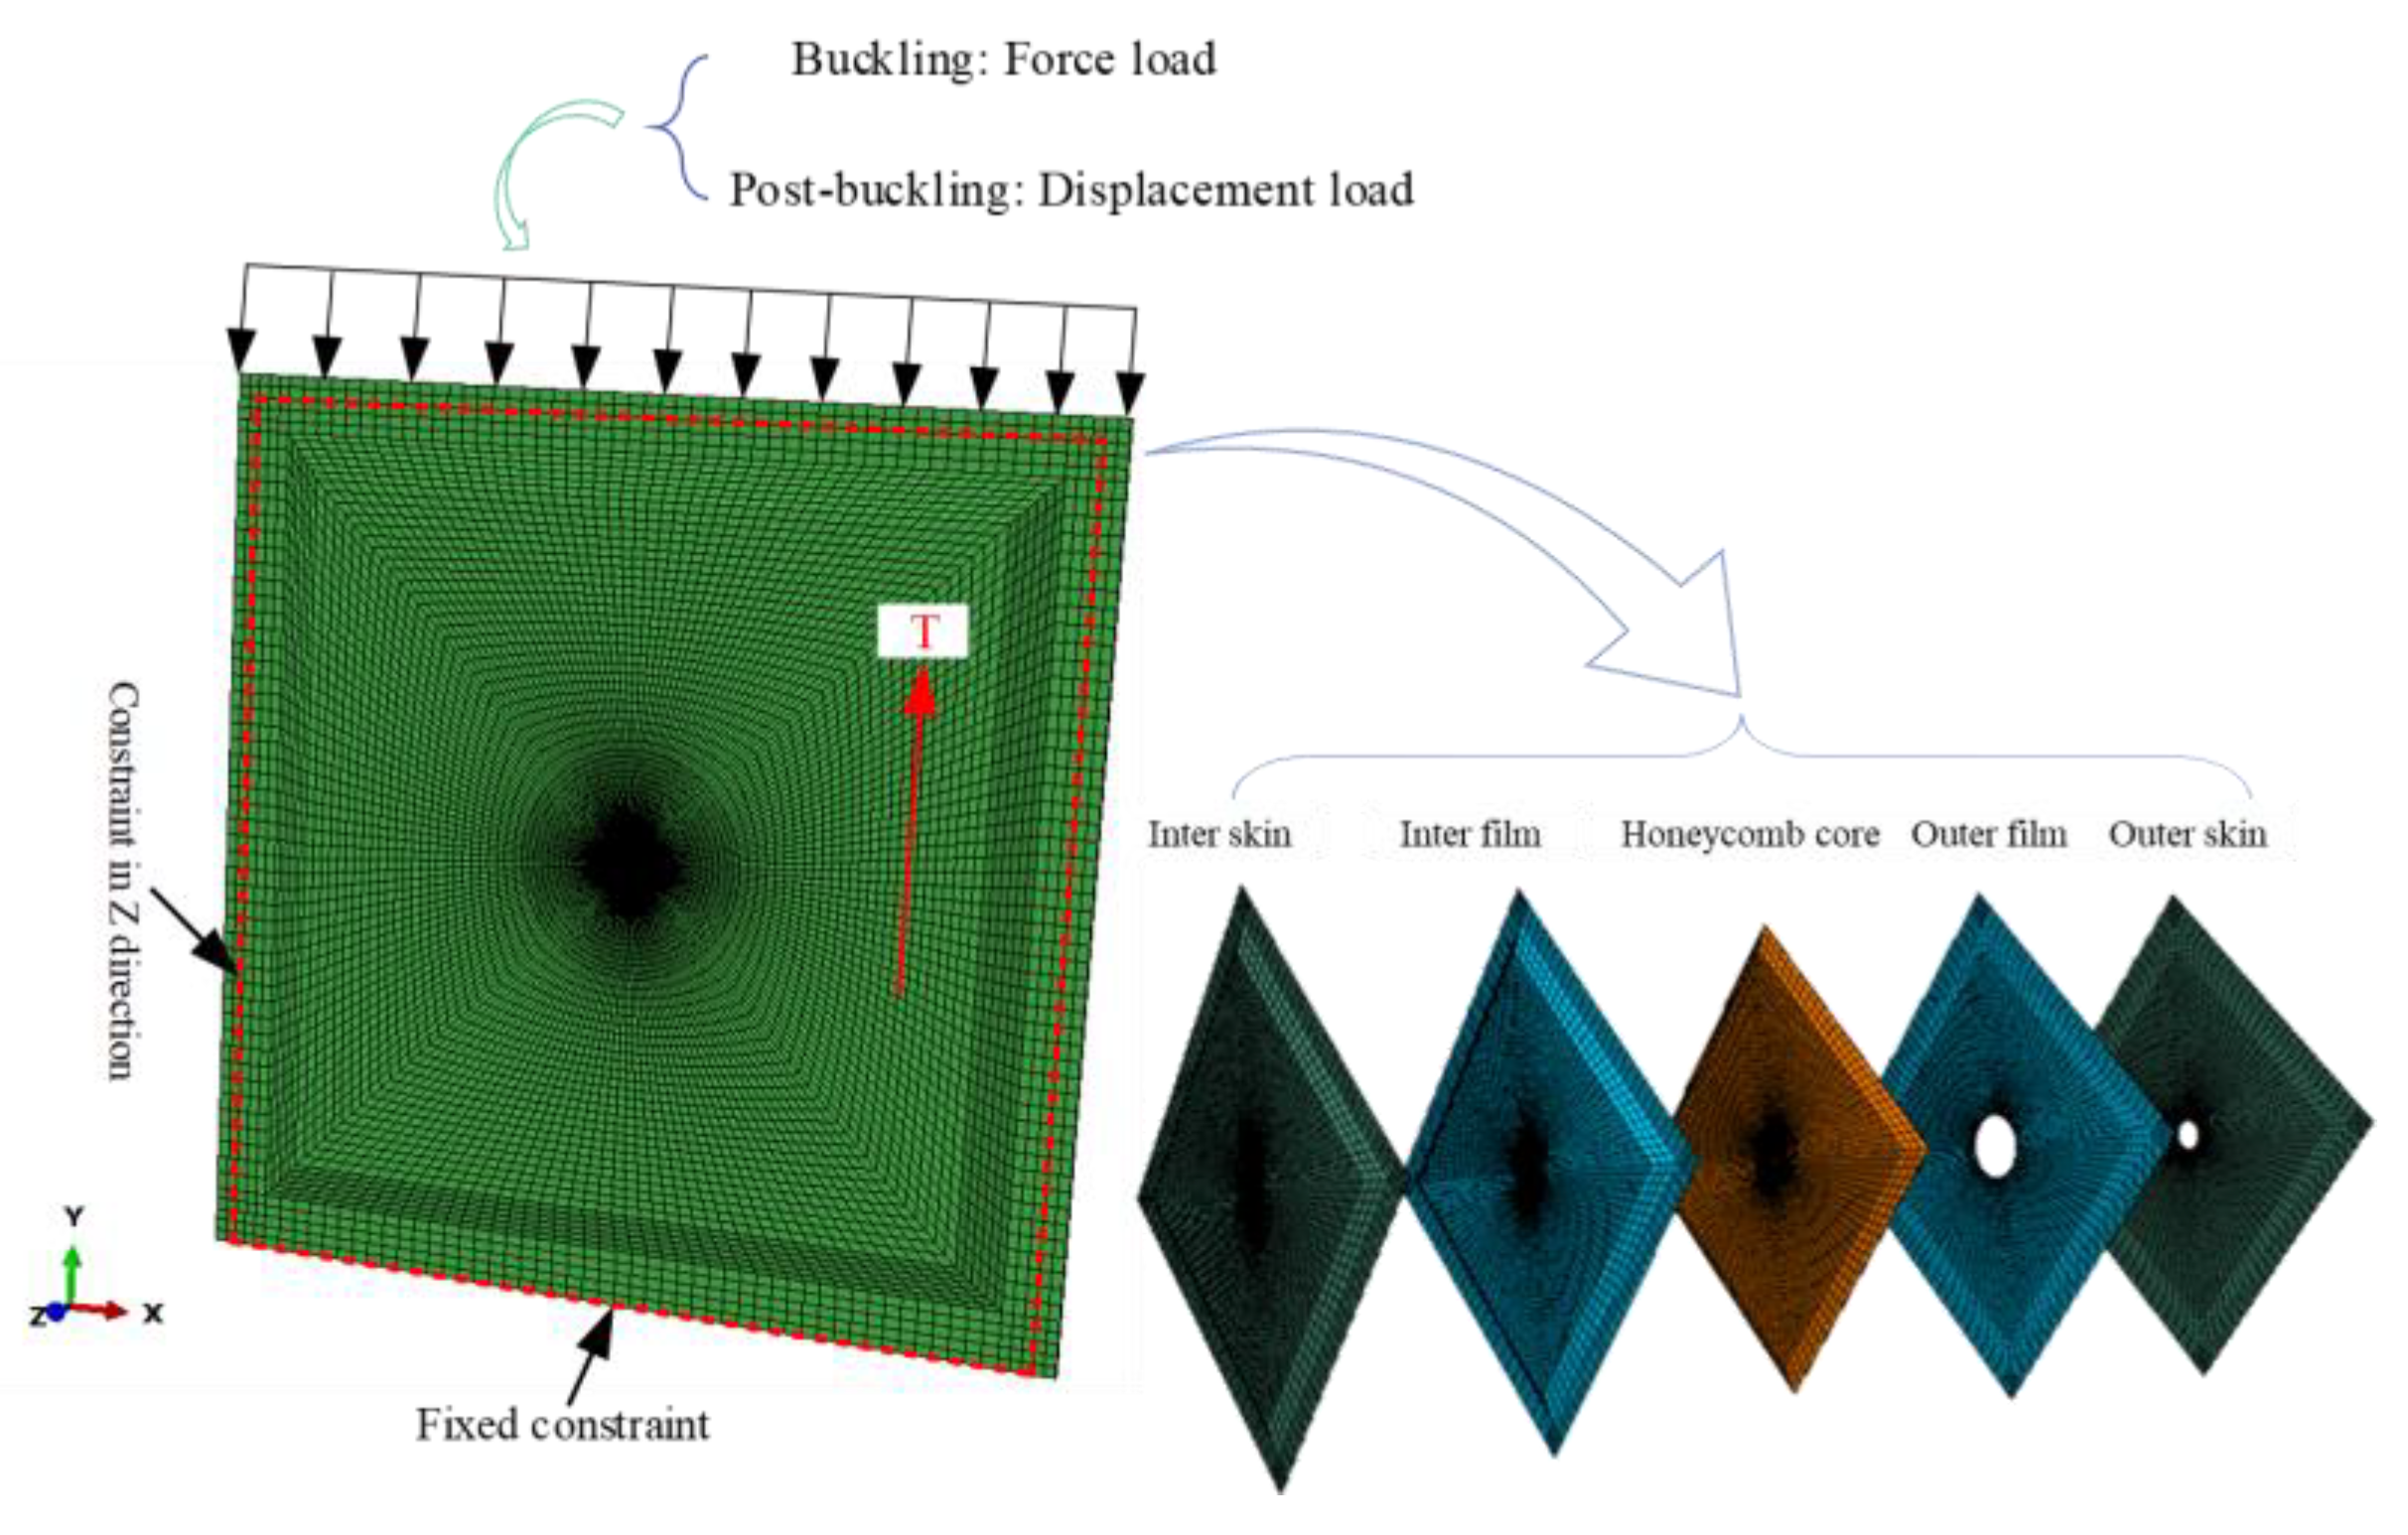
4.2. Finite Element Model and Boundary Conditions
4.3. Results and Discussion
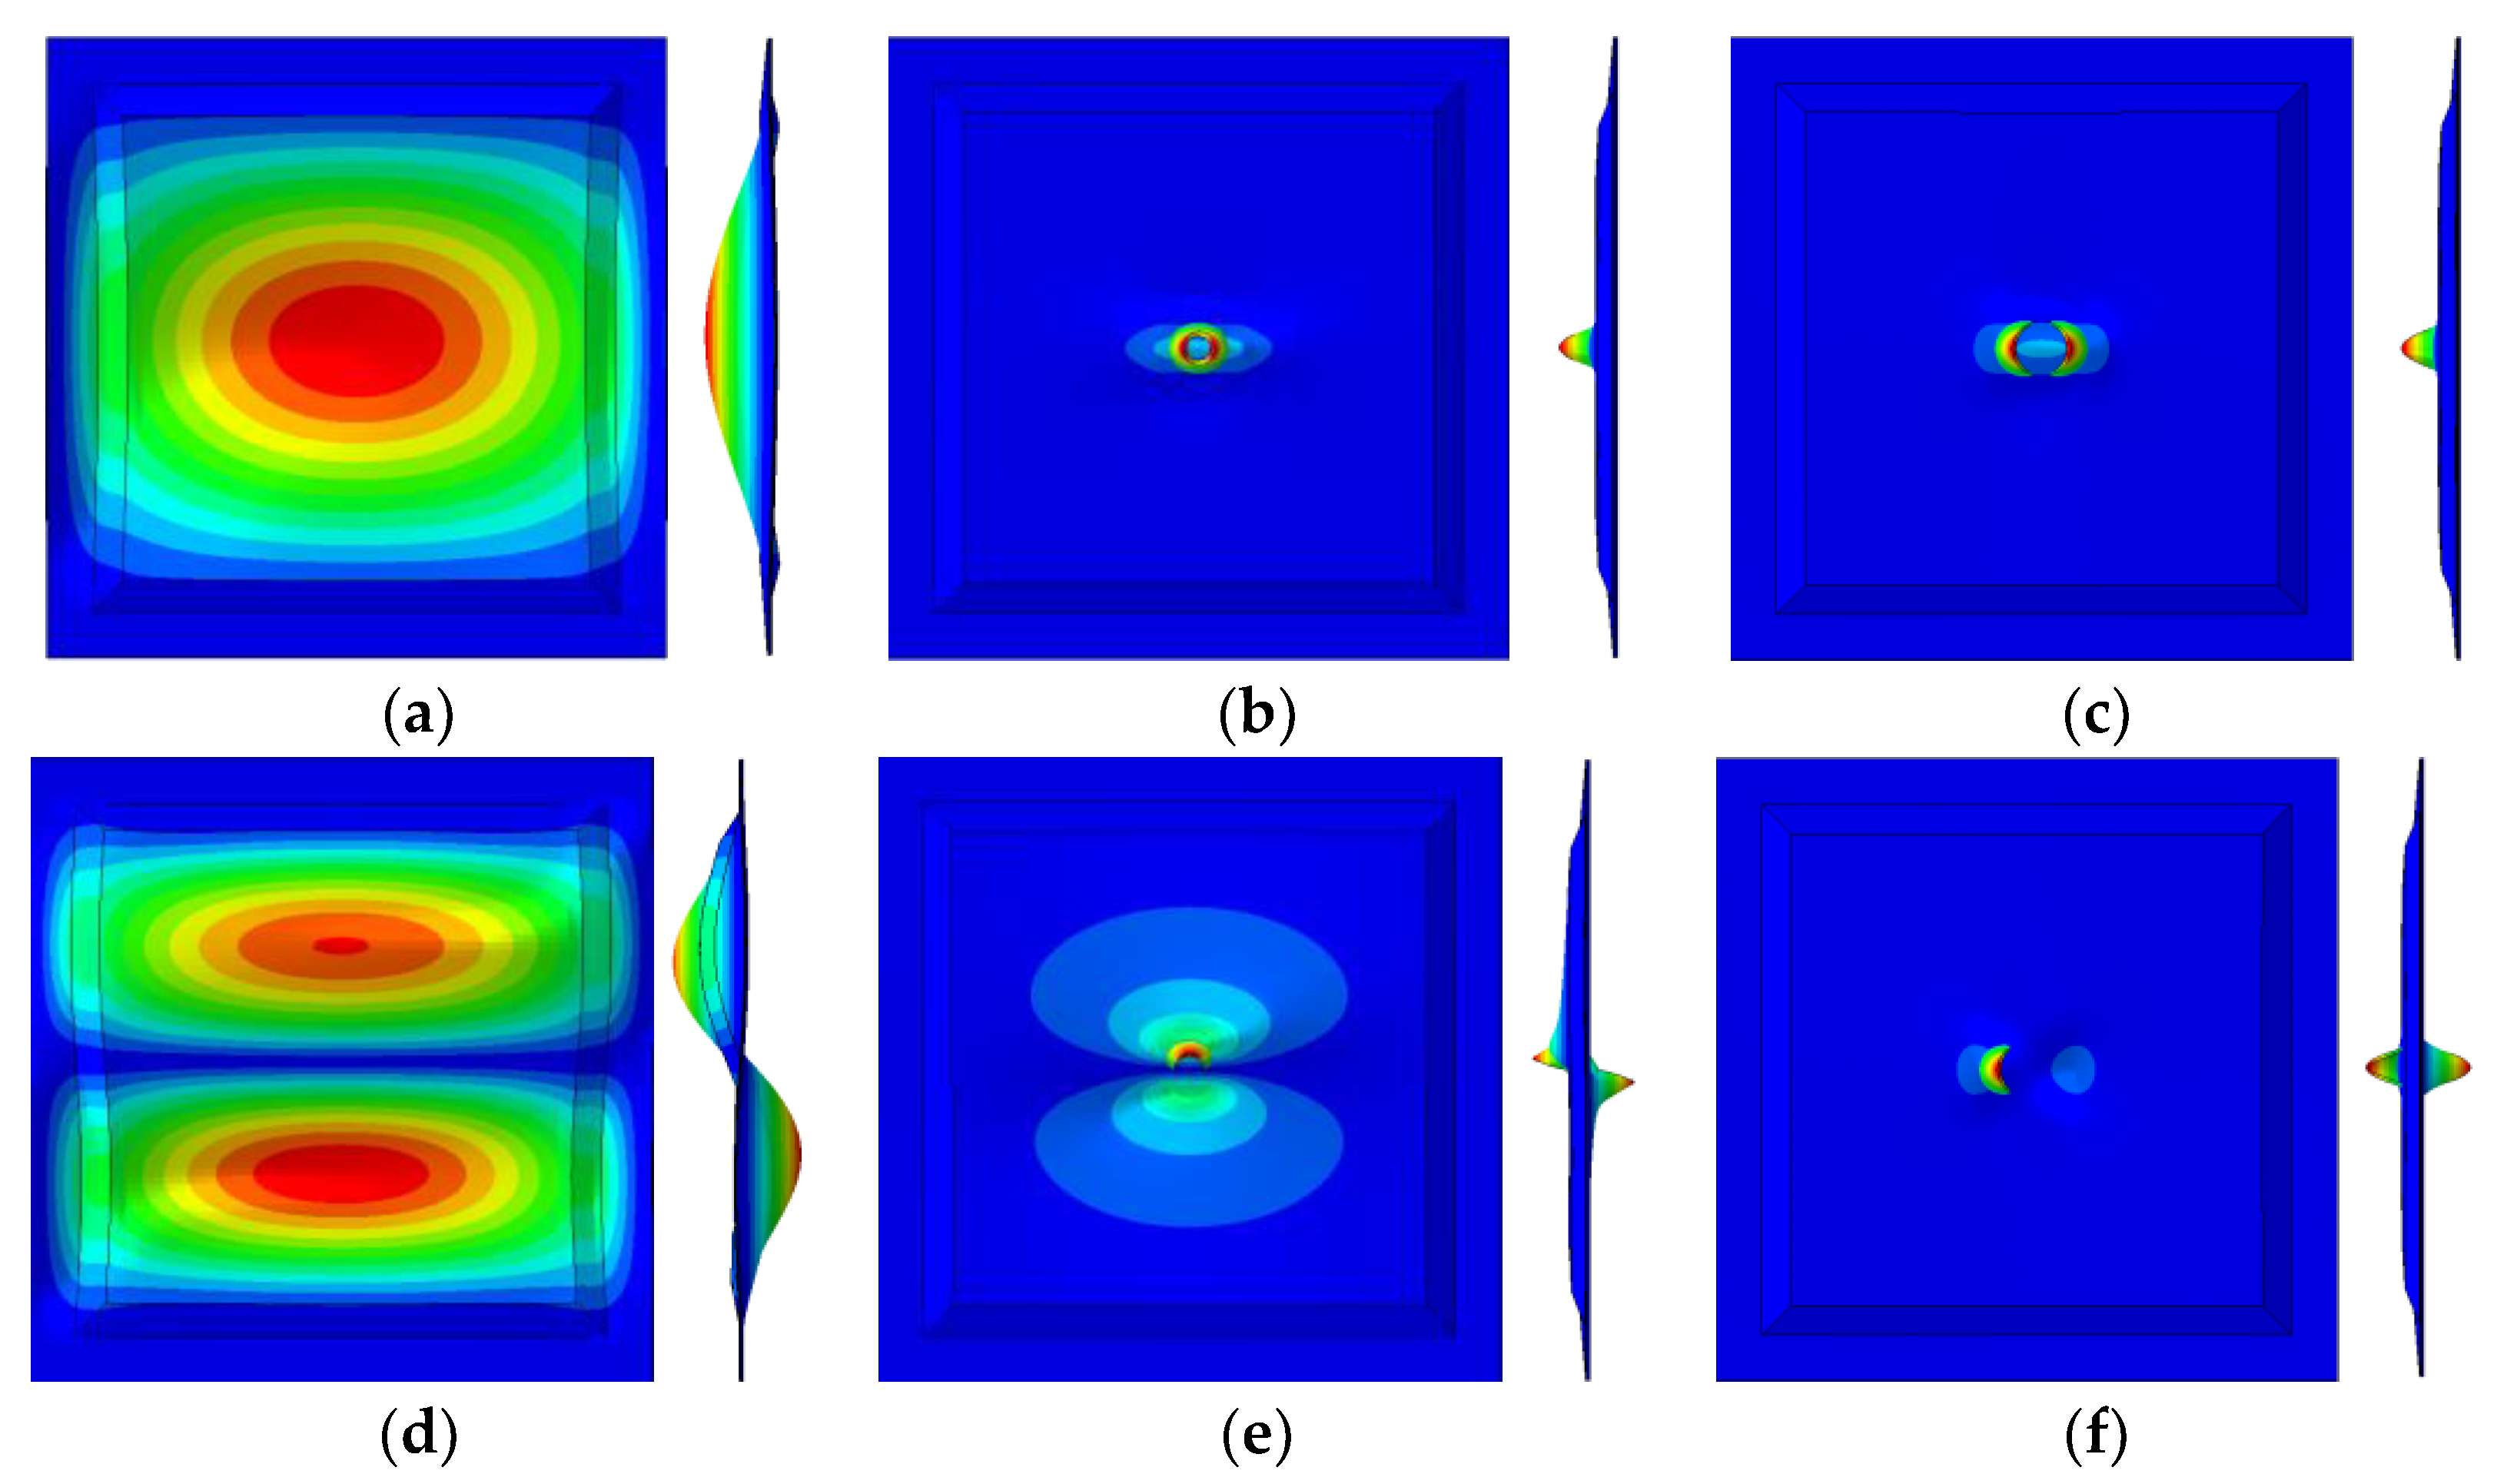
4.3.1. Effect of Lightning Damage Degree on Stability
4.3.2. Effect of Damage Size and Extent on Residual Strength
5. Conclusions
- (1)
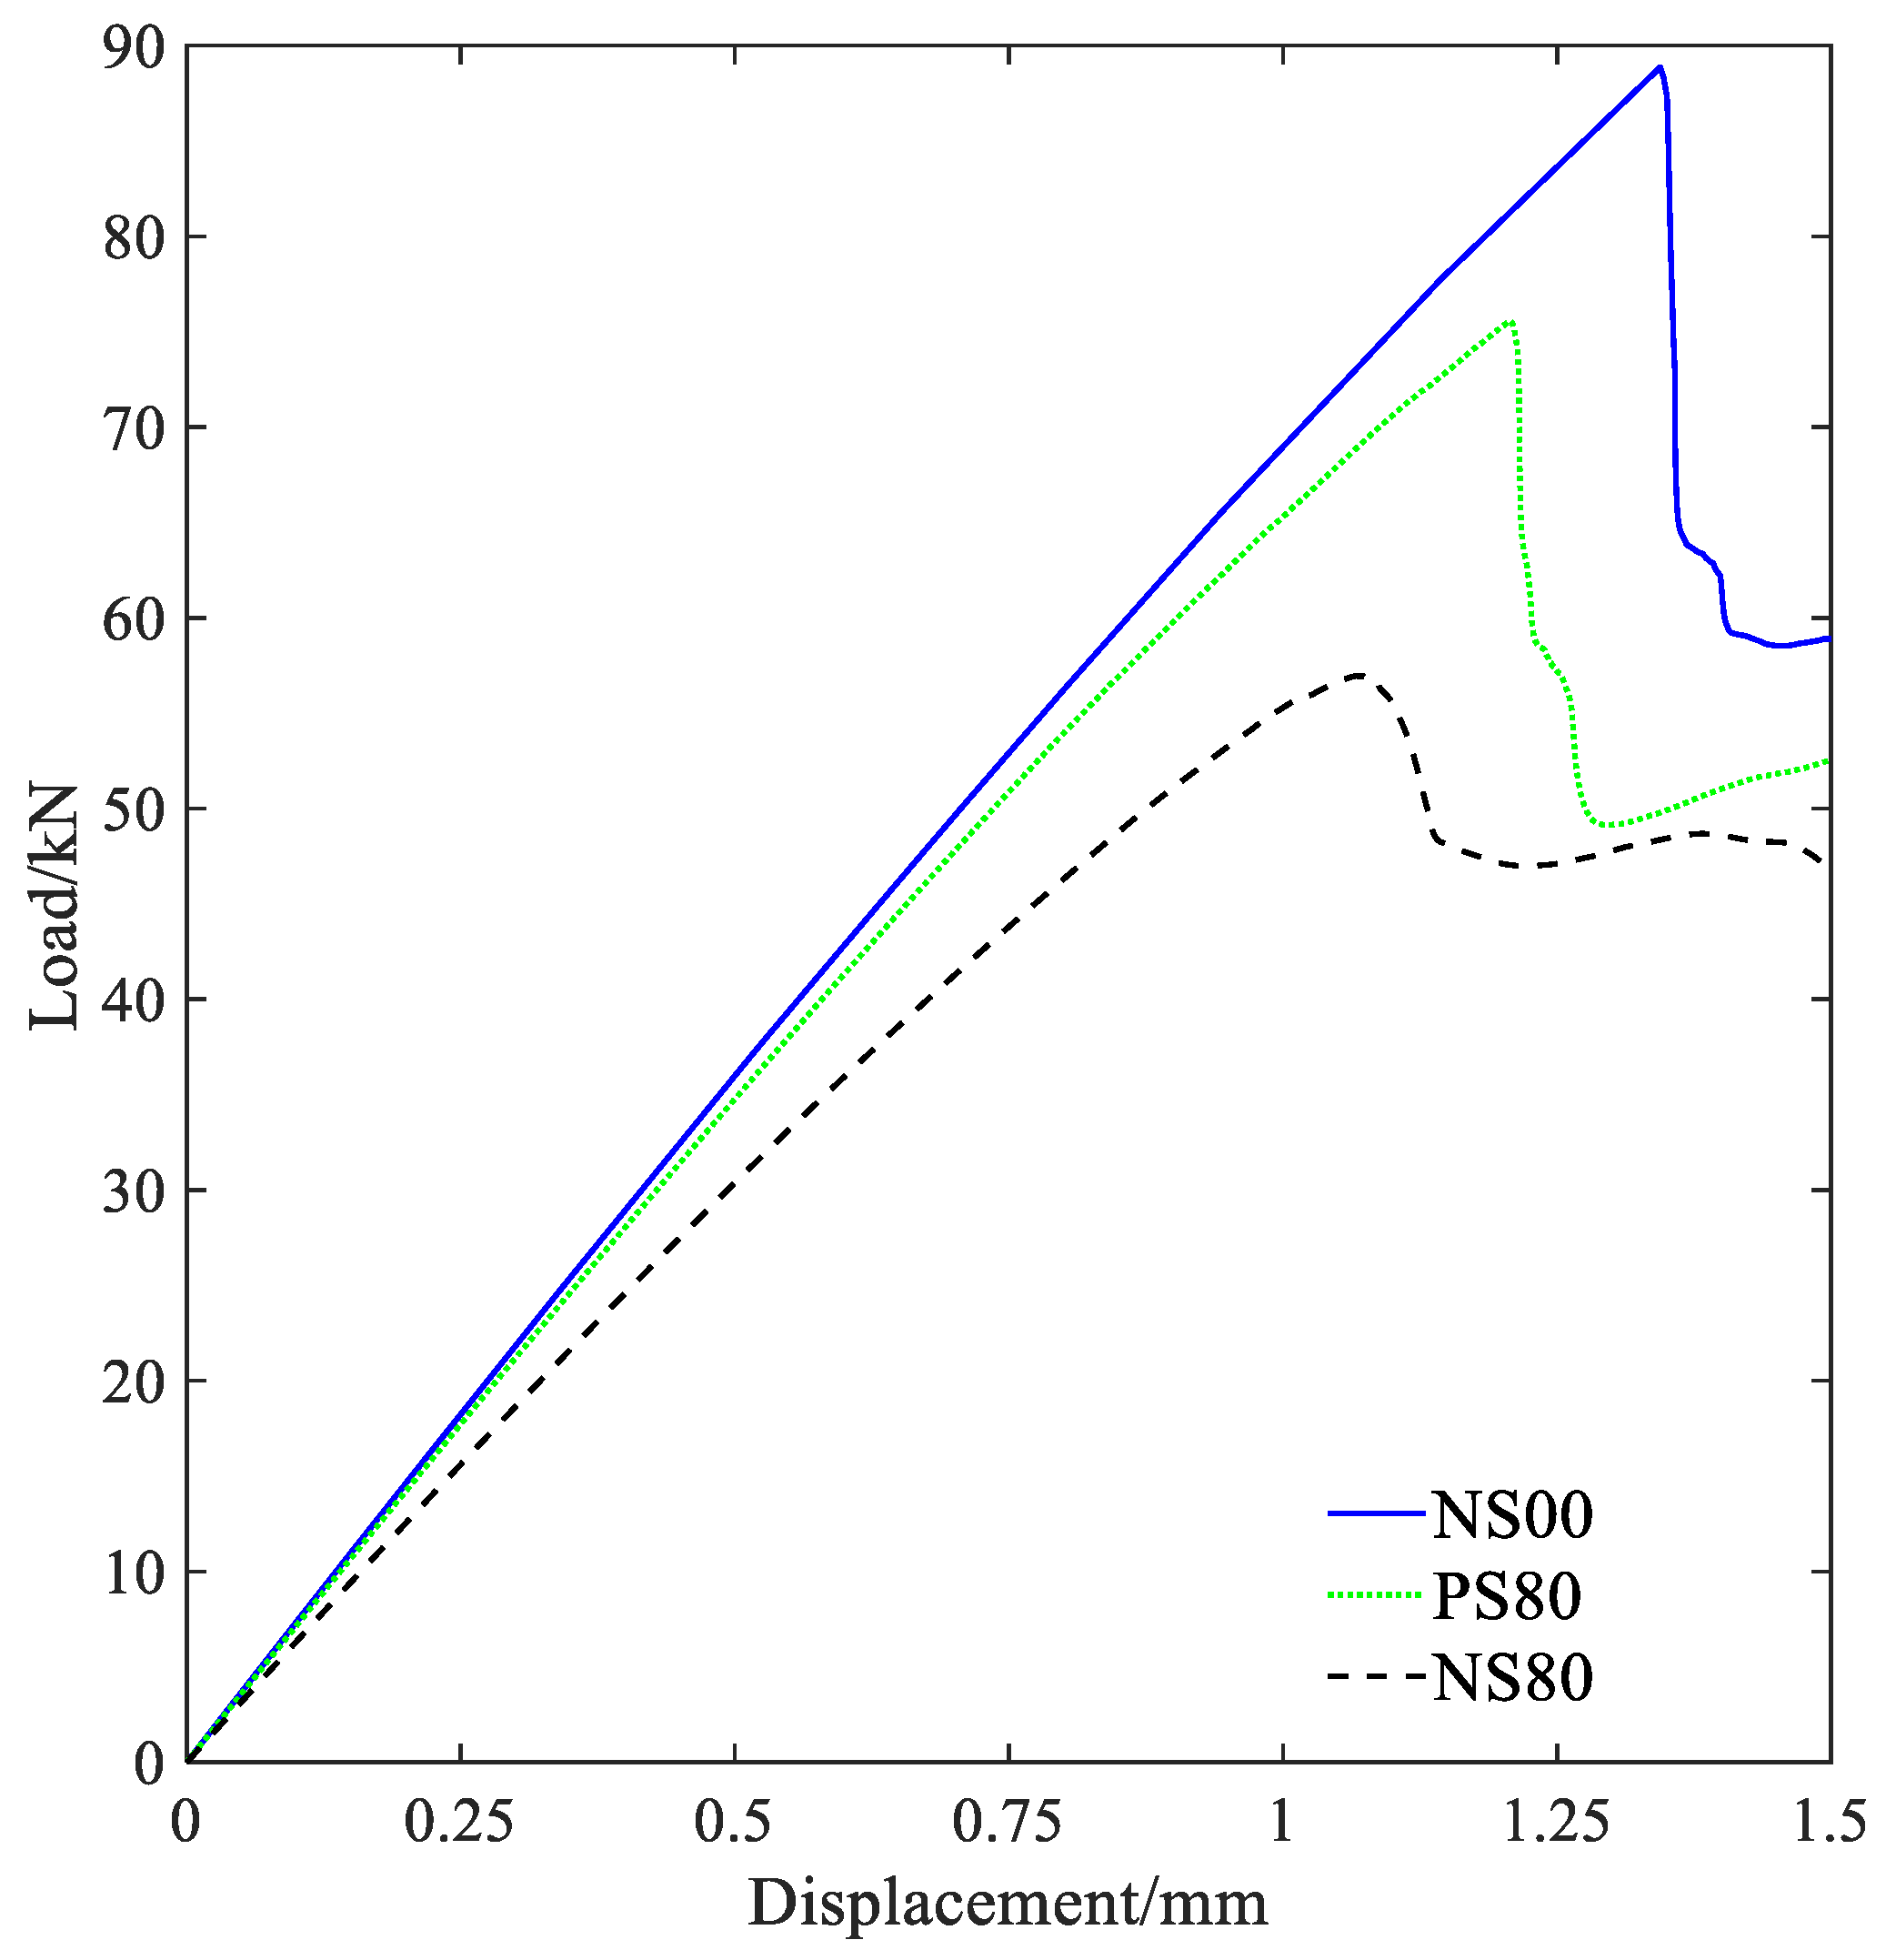
- Lightning strike damage can seriously reduce the bearing capacity of honeycomb sandwich composite structure, while the surface CNTF can reduce lightning damage to a certain extent and improve the residual bearing capacity of composite after lightning strike.
- (2)
- The compression failure modes of honeycomb sandwich panel with closed edge were dependent on the size and extent of the lightning damage. When the lightning damage was small, the compressive failure modes of the specimen were similar to those of the undamaged specimen, and the failure mainly occurred in the chamfering zone of the panel. When the lightning damage was large, the failure of the specimen mainly occurred in the lightning damage zone of the panel.
- (3)
- When lightning was strong enough to completely penetrate the surface skin of the honeycomb sandwich structure, the lightning damage on the skin can be simplified to hole damage with appropriate diameter. Under the proper failure criterion and stiffness degradation rule, the residual strength calculated by progressive damage analysis agrees with the residual strength obtained by testing, which proves the effectiveness of the simulation method to a certain extent.
Author Contributions
Funding
Institutional Review Board Statement
Informed Consent Statement
Data Availability Statement
Conflicts of Interest
References
- Gagné, M.; Therriault, D. Lightning strike protection of composites. Prog. Aerosp. Sci. 2014, 64, 1–16. [Google Scholar] [CrossRef]
- Zhang, X.; Chen, Y.; Hu, J. Recent advances in the development of aerospace materials. Prog. Aerosp. Sci. 2018, 97, 22–34. [Google Scholar] [CrossRef]
- Kumar, V.; Sharma, S.; Pathak, A.; Singh, B.P.; Dhakate, S.R.; Yokozeki, T.; Okada, T.; Ogasawara, T. Interleaved MWCNT buckypaper between CFRP laminates to improve through-thickness electrical conductivity and reducing lightning strike damage. Compos. Struct. 2019, 210, 581–589. [Google Scholar] [CrossRef]
- Katunin, A.; Krukiewicz, K.; Herega, A.; Catalanotti, G. Concept of a conducting composite material for lightning strike protection. Adv. Mater. Sci. 2016, 16, 32. [Google Scholar] [CrossRef] [Green Version]
- Gou, J.; Tang, Y.; Liang, F.; Zhao, Z.; Firsich, D.; Fielding, J. Carbon nanofiber paper for lightning strike protection of composite materials. Compos. Part B Eng. 2010, 41, 192–198. [Google Scholar] [CrossRef]
- Wang, F.; Ji, Y.; Yu, X.; Chen, H.; Yue, Z. Ablation damage assessment of aircraft carbon fiber/epoxy composite and its protection structures suffered from lightning strike. Compos. Struct. 2016, 145, 226–241. [Google Scholar] [CrossRef]
- Hirano, Y.; Katsumata, S.; Iwahori, Y.; Todoroki, A. Artificial lightning testing on graphite/epoxy composite laminate. Compos. Part A Appl. Sci. Manuf. 2010, 41, 1461–1470. [Google Scholar] [CrossRef]
- Feraboli, P.; Kawakami, H. Damage of carbon/epoxy composite plates subjected to mechanical impact and simulated lightning. J. Aircr. 2010, 47, 999–1012. [Google Scholar] [CrossRef]
- Kawakami, H.; Feraboli, P. Lightning strike damage resistance and tolerance of scarf-repaired mesh-protected carbon fiber composites. Compos. Part A Appl. Sci. Manuf. 2011, 42, 1247–1262. [Google Scholar] [CrossRef]
- Kumar, V.; Yokozeki, T.; Okada, T.; Hirano, Y.; Goto, T.; Takahashi, T.; Hassen, A.A.; Ogasawara, T. Polyaniline-based all-polymeric adhesive layer: An effective lightning strike protection technology for high residual mechanical strength of CFRPs. Compos. Sci. Technol. 2019, 172, 49–57. [Google Scholar] [CrossRef]
- Zhang, X.; Zhang, J.; Cheng, X.; Huang, W. Carbon nanotube protected composite laminate subjected to lightning strike: Interlaminar film distribution investigation. Chin. J. Aeronaut. 2021, 34, 620–628. [Google Scholar] [CrossRef]
- Liu, Z.Q.; Yue, Z.F.; Wang, F.S.; Ji, Y.Y. Combining analysis of coupled electrical-thermal and blow-off impulse effects on composite laminate induced by lightning strike. Appl. Compos. Mater. 2015, 22, 189–207. [Google Scholar] [CrossRef]
- Ogasawara, T.; Hirano, Y.; Yoshimura, A. Coupled thermal–electrical analysis for carbon fiber/epoxy composites exposed to simulated lightning current. Compos. Part A Appl. Sci. Manuf. 2010, 41, 973–981. [Google Scholar] [CrossRef]
- Dong, Q.; Guo, Y.; Sun, X.; Jia, Y. Coupled electrical-thermal-pyrolytic analysis of carbon fiber/epoxy composites subjected to lightning strike. Polymer 2015, 56, 385–394. [Google Scholar] [CrossRef]
- Guo, Y.; Xu, Y.; Wang, Q.; Dong, Q.; Yi, X.; Jia, Y. Eliminating lightning strike damage to carbon fiber composite structures in zone 2 of aircraft by Ni-coated carbon fiber nonwoven veils. Compos. Sci. Technol. 2019, 169, 95–102. [Google Scholar] [CrossRef]
- Li, Y.; Li, R.; Lu, L.; Huang, X. Experimental study of damage characteristics of carbon woven fabric/epoxy laminates subjected to lightning strike. Compos. Part A Appl. Sci. Manuf. 2015, 79, 164–175. [Google Scholar] [CrossRef]
- Zhao, Z.; Ma, Y.; Yang, Z.; Yu, J.; Wang, J.; Tong, J.; Yi, X.; Moreira, P.; Sguazzo, C. Light weight non-metallic lightning strike protection film for CFRP. Mater. Today Commun. 2020, 25, 101502. [Google Scholar] [CrossRef]
- Yamashita, S.; Hirano, Y.; Sonehara, T.; Takahashi, J.; Kawabe, K.; Murakami, T. Residual mechanical properties of carbon fibre reinforced thermoplastics with thin-ply prepreg after simulated lightning strike. Compos. Part A Appl. Sci. Manuf. 2017, 101, 185–194. [Google Scholar] [CrossRef]
- Das, S.; Kumar, V.; Lee, J.; Yokozeki, T.; Okada, T. Thickness threshold study of polyaniline-based lightning strike protection coating for carbon/glass fiber reinforced polymer composites. Compos. Struct. 2022, 280, 114954. [Google Scholar] [CrossRef]
- Wang, F.; Ding, N.; Liu, Z.; Ji, Y.; Yue, Z. Ablation damage characteristic and residual strength prediction of carbon fiber/epoxy composite suffered from lightning strike. Compos. Struct. 2014, 117, 222–233. [Google Scholar] [CrossRef]
- Kumar, V.; Yokozeki, T.; Okada, T.; Hirano, Y.; Goto, T.; Takahashi, T.; Ogasawara, T. Effect of through-thickness electrical conductivity of CFRPs on lightning strike damages. Compos. Part A Appl. Sci. Manuf. 2018, 114, 429–438. [Google Scholar] [CrossRef]
- Zhao, Z.; Xian, G.; Yu, J.; Wang, J.; Tong, J.; Wei, J.; Wang, C.; Moreira, P.; Yi, X. Development of electrically conductive structural BMI based CFRPs for lightning strike protection. Compos. Sci. Technol. 2018, 167, 555–562. [Google Scholar] [CrossRef]
- Wang, F.; Yu, X.; Jia, S.; Li, P. Experimental and numerical study on residual strength of aircraft carbon/epoxy composite after lightning strike. Aerosp. Sci. Technol. 2018, 75, 304–314. [Google Scholar] [CrossRef]
- Rajesh, P.; Sirois, F.; Therriault, D. Damage response of composites coated with conducting materials subjected to emulated lightning strikes. Mater. Des. 2018, 139, 45–55. [Google Scholar] [CrossRef]
- Dhanya, T.; Yerramalli, C.S. Lightning strike effect on carbon fiber reinforced composites–effect of copper mesh protection. Mater. Today Commun. 2018, 16, 124–134. [Google Scholar] [CrossRef]
- Guo, Y.; Xu, Y.; Zhang, L.; Wei, X.; Dong, Q.; Yi, X.; Jia, Y. Implementation of fiberglass in carbon fiber composites as an isolation layer that enhances lightning strike protection. Compos. Sci. Technol. 2019, 174, 117–124. [Google Scholar] [CrossRef]
- Kumar, V.; Yokozeki, T.; Karch, C.; Hassen, A.A.; Hershey, C.J.; Kim, S.; Lindahl, J.M.; Barnes, A.; Bandari, Y.K.; Kunc, V. Factors affecting direct lightning strike damage to fiber reinforced composites: A review. Compos. Part B Eng. 2020, 183, 107688. [Google Scholar] [CrossRef]
- Xia, Q.; Mei, H.; Zhang, Z.; Liu, Y.; Liu, Y.; Leng, J. Fabrication of the silver modified carbon nanotube film/carbon fiber reinforced polymer composite for the lightning strike protection application. Compos. Part B Eng. 2020, 180, 107563. [Google Scholar] [CrossRef]
- Han, J.-H.; Zhang, H.; Chen, M.-J.; Wang, D.; Liu, Q.; Wu, Q.-L.; Zhang, Z. The combination of carbon nanotube buckypaper and insulating adhesive for lightning strike protection of the carbon fiber/epoxy laminates. Carbon 2015, 94, 101–113. [Google Scholar] [CrossRef]
- Herrmann, A.S.; Zahlen, P.C.; Zuardy, I. Sandwich Structures Technology in Commercial Aviation; Springer: Dordrecht, The Netherlands, 2005. [Google Scholar]
- Jérôme, P. Composite Materials in the Airbus A380. From History to Future. In Proceedings of the 13th International Conference on Composite Materials (ICCM-13), Beijing, China, 25–29 June 2001; Volume 1, pp. 25–29. [Google Scholar]
- SAE ARP-5416; Aircraft Lightning Test Methods. SAE Aerospace Group: Washington, DC, USA, 2005.
- Pan, S. Research on Damage and Scarf Repair of Edge Closed Honeycomb Sandwich Panels. Master’s Thesis, Nanjing University of Aeronautics and Astronautics, Nanjing, China, 2019. [Google Scholar]
- Hashin, Z. Failure criteria for unidirectional fiber composites. J. Appl. Mech. 1980, 47, 329–334. [Google Scholar] [CrossRef]
- Zhang, F.; Mohmmed, R.; Sun, B.; Gu, B. Damage behaviors of foam sandwiched composite materials under quasi-static three-point bending. Appl. Compos. Mater. 2013, 20, 1231–1246. [Google Scholar] [CrossRef]
- Yuan, J.; Zhang, L.; Huo, Z. An equivalent modeling method for honeycomb sandwich structure based on orthogonal anisotropic solid element. Int. J. Aeronaut. Space Sci. 2020, 21, 957–969. [Google Scholar] [CrossRef]
- Hu, N.; Wang, W.; Leng, G. Study on equivalent modeling of honeycomb sandwich panels for large radio telescopes. Lect. Notes Inf. Technol. 2012, 15, 2012. [Google Scholar]
- Besant, T.; Davies, G.; Hitchings, D. Finite element modelling of low velocity impact of composite sandwich panels. Compos. Part A Appl. Sci. Manuf. 2001, 32, 1189–1196. [Google Scholar] [CrossRef]
- Fan, X.L.; Wang, T.J.; Sun, Q. Damage evolution of sandwich composite structure using a progressive failure analysis methodology. In Proceedings of the 11th International Conference on the Mechanical Behavior of Materials (ICM11), Como, Italy, 5–9 June 2011. [Google Scholar]
- Camanho, P.P.; Davila, C.G.; De Moura, M. Numerical simulation of mixed-mode progressive delamination in composite materials. J. Compos. Mater. 2003, 37, 1415–1438. [Google Scholar] [CrossRef]
- Benzeggagh, M.L.; Kenane, M. Measurement of mixed-mode delamination fracture toughness of unidirectional glass/epoxy composites with mixed-mode bending apparatus. Compos. Sci. Technol. 1996, 56, 439–449. [Google Scholar] [CrossRef]
- Tafreshi, A.; Oswald, T. Global buckling behaviour and local damage propagation in composite plates with embedded delaminations. Int. J. Press. Vessel. Pip. 2003, 80, 9–20. [Google Scholar] [CrossRef] [Green Version]


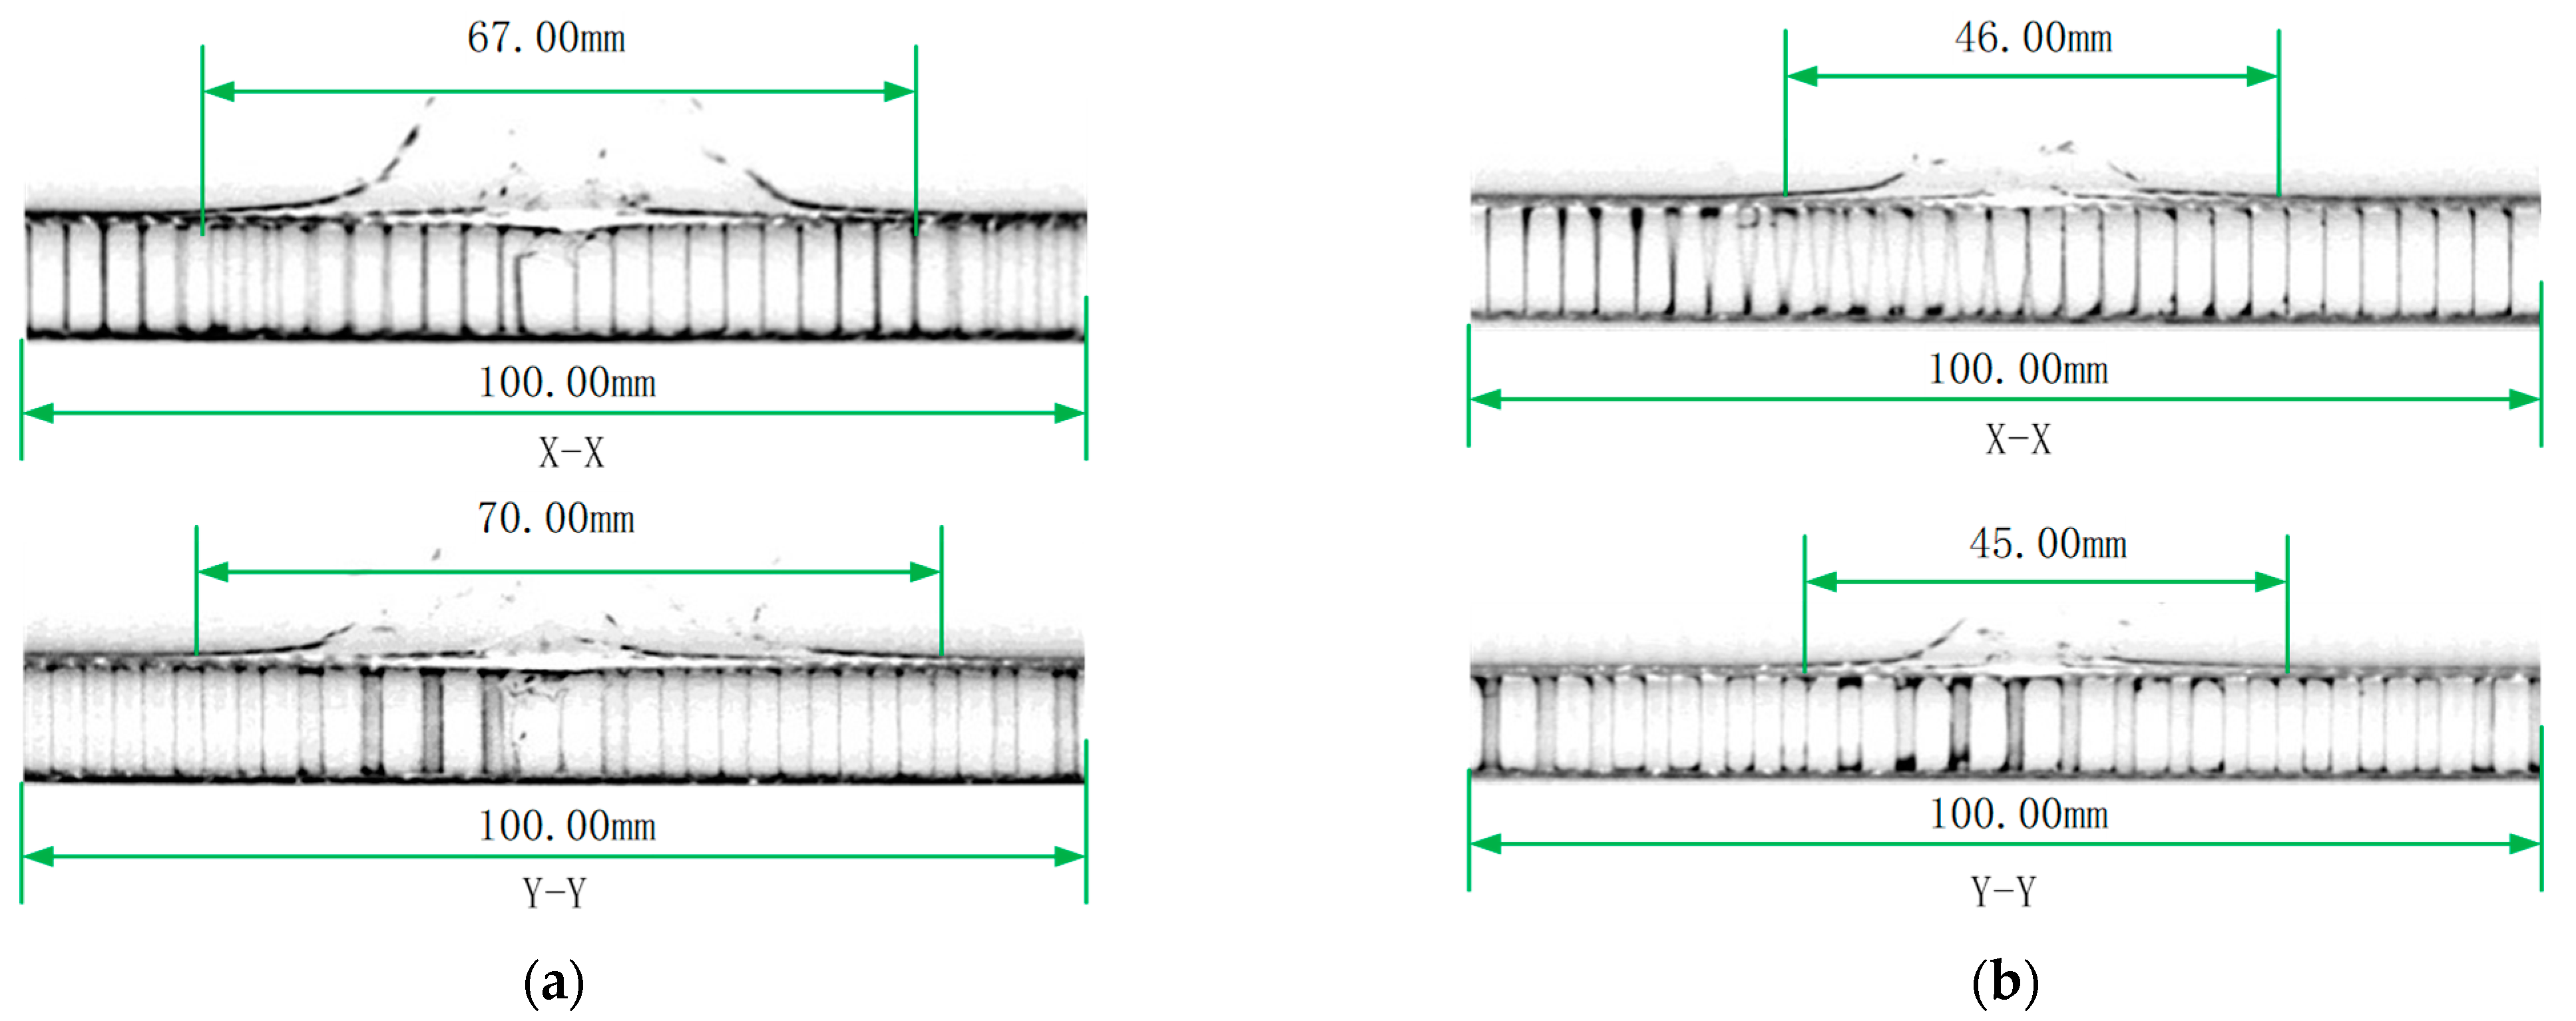
| Specimen | Damage Area/mm2 | Delamination Length/mm |
|---|---|---|
| NS80 | 1313 | 70 |
| PS80 | 742 | 46 |
| Damage reduction rate | 43.49% | 34.29% |
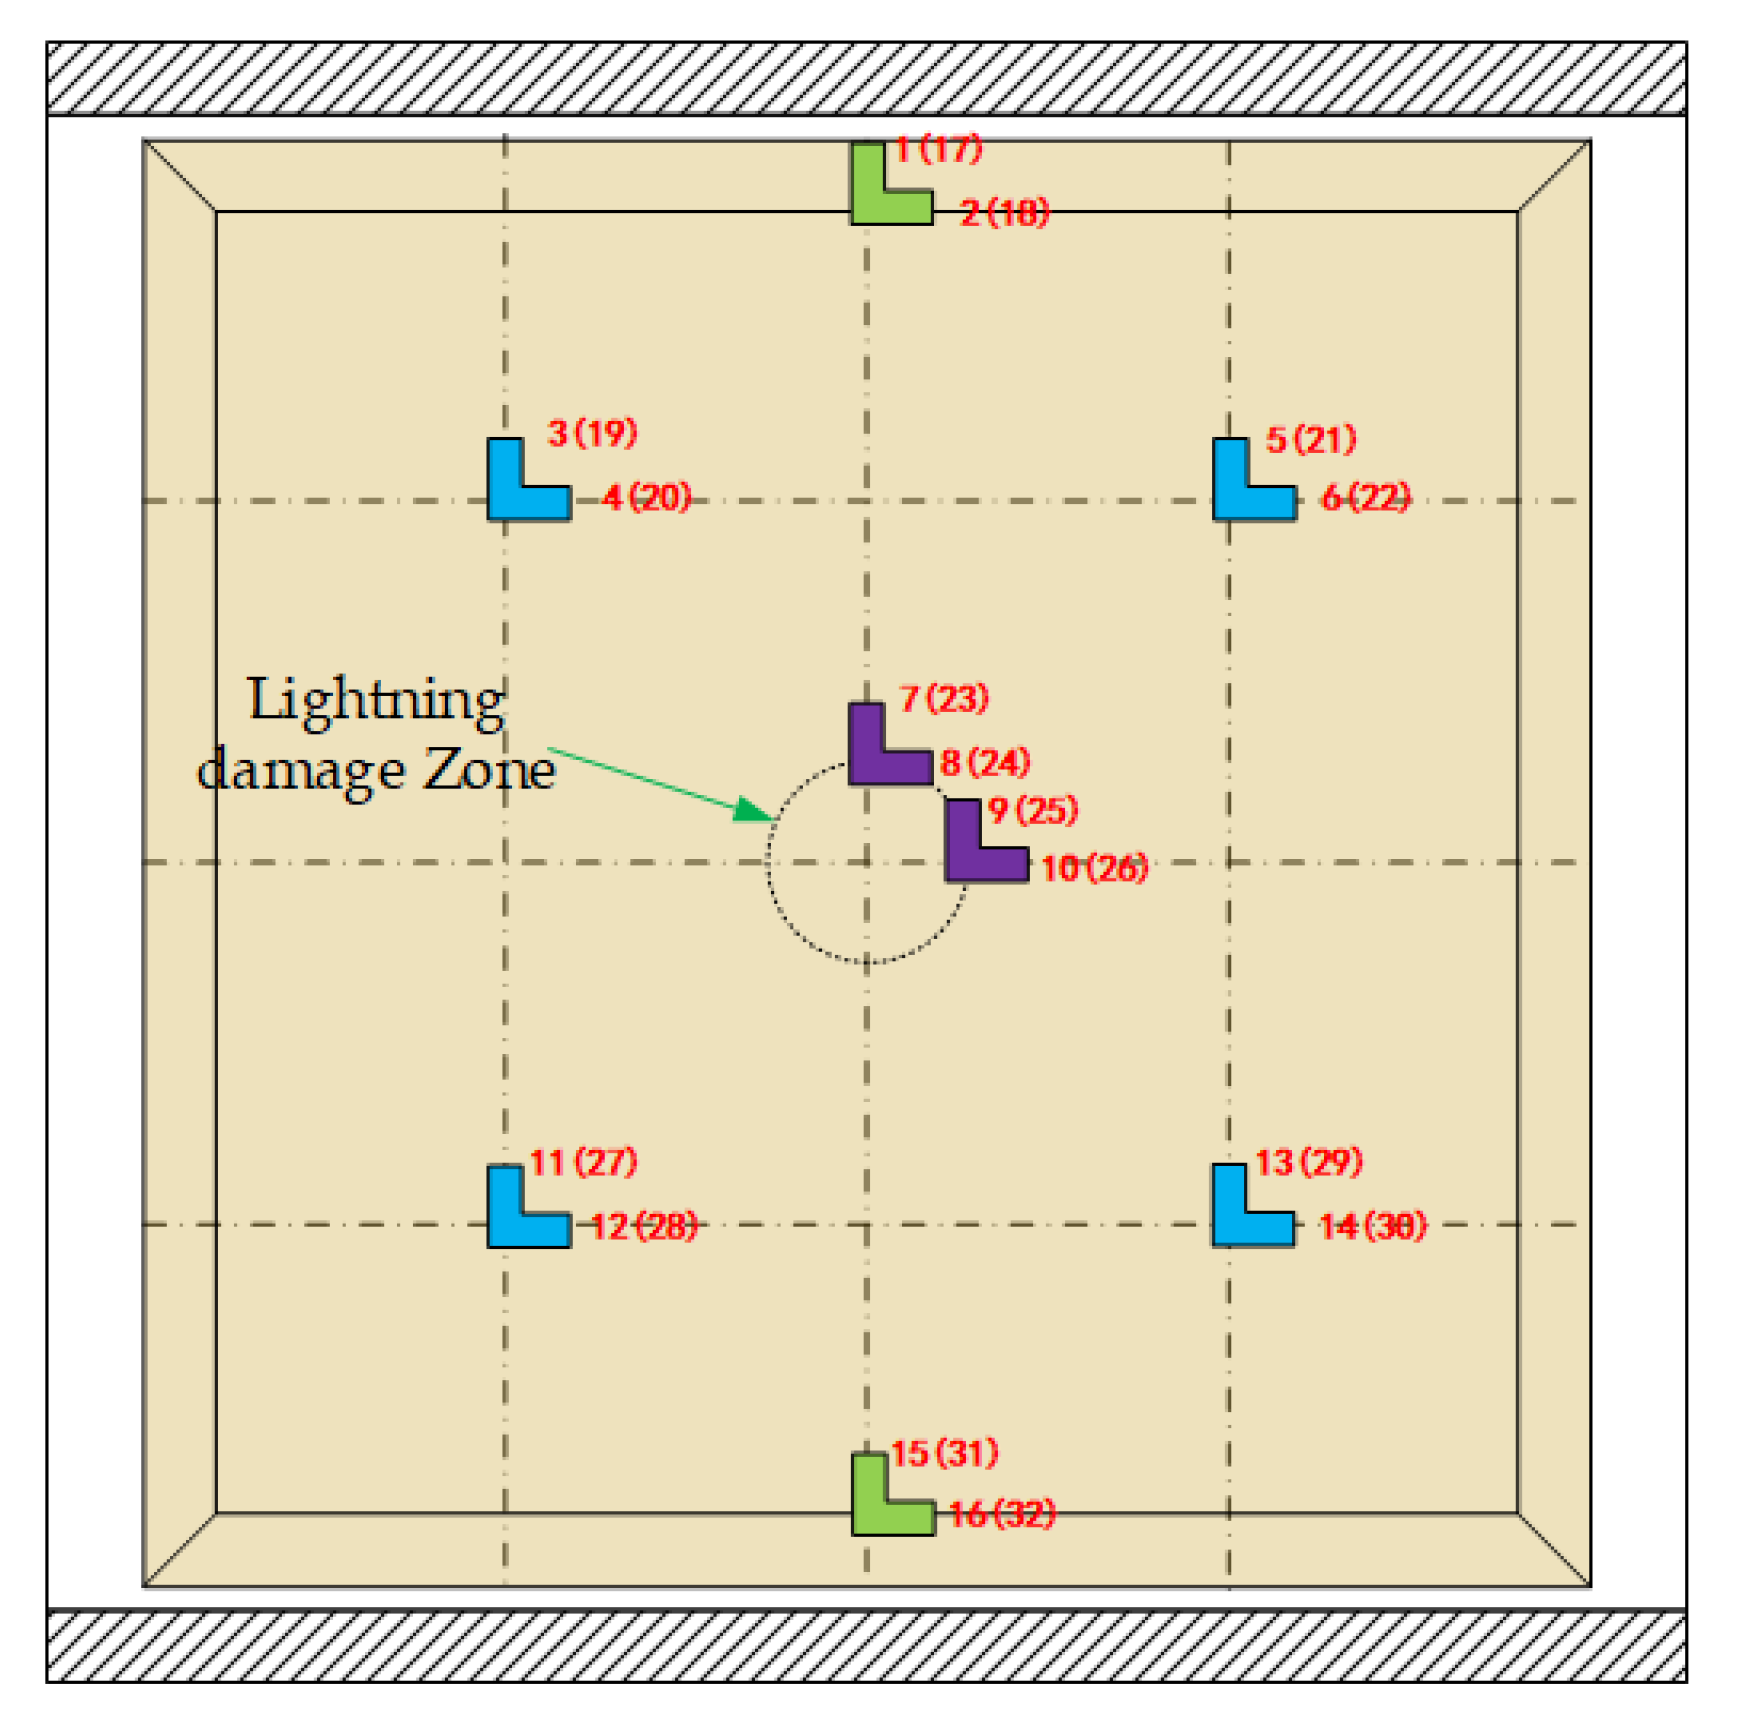
| First Group Strain | Second Group Strain | Third Group Strain | |
|---|---|---|---|
| Number | 1(17)\2(18) 15(31)\16(32) | 3(19)\4(20)\5(21)\6(22) 11(27)\12(28)\13(29)\14(30) | 7(23)\8 (24) 9 (25)\10 (26) |
| Position | Chamfer | 1/4 honeycomb core | Lightning damage around |
| Specimen | NS00 | NS80 | PS80 |
|---|---|---|---|
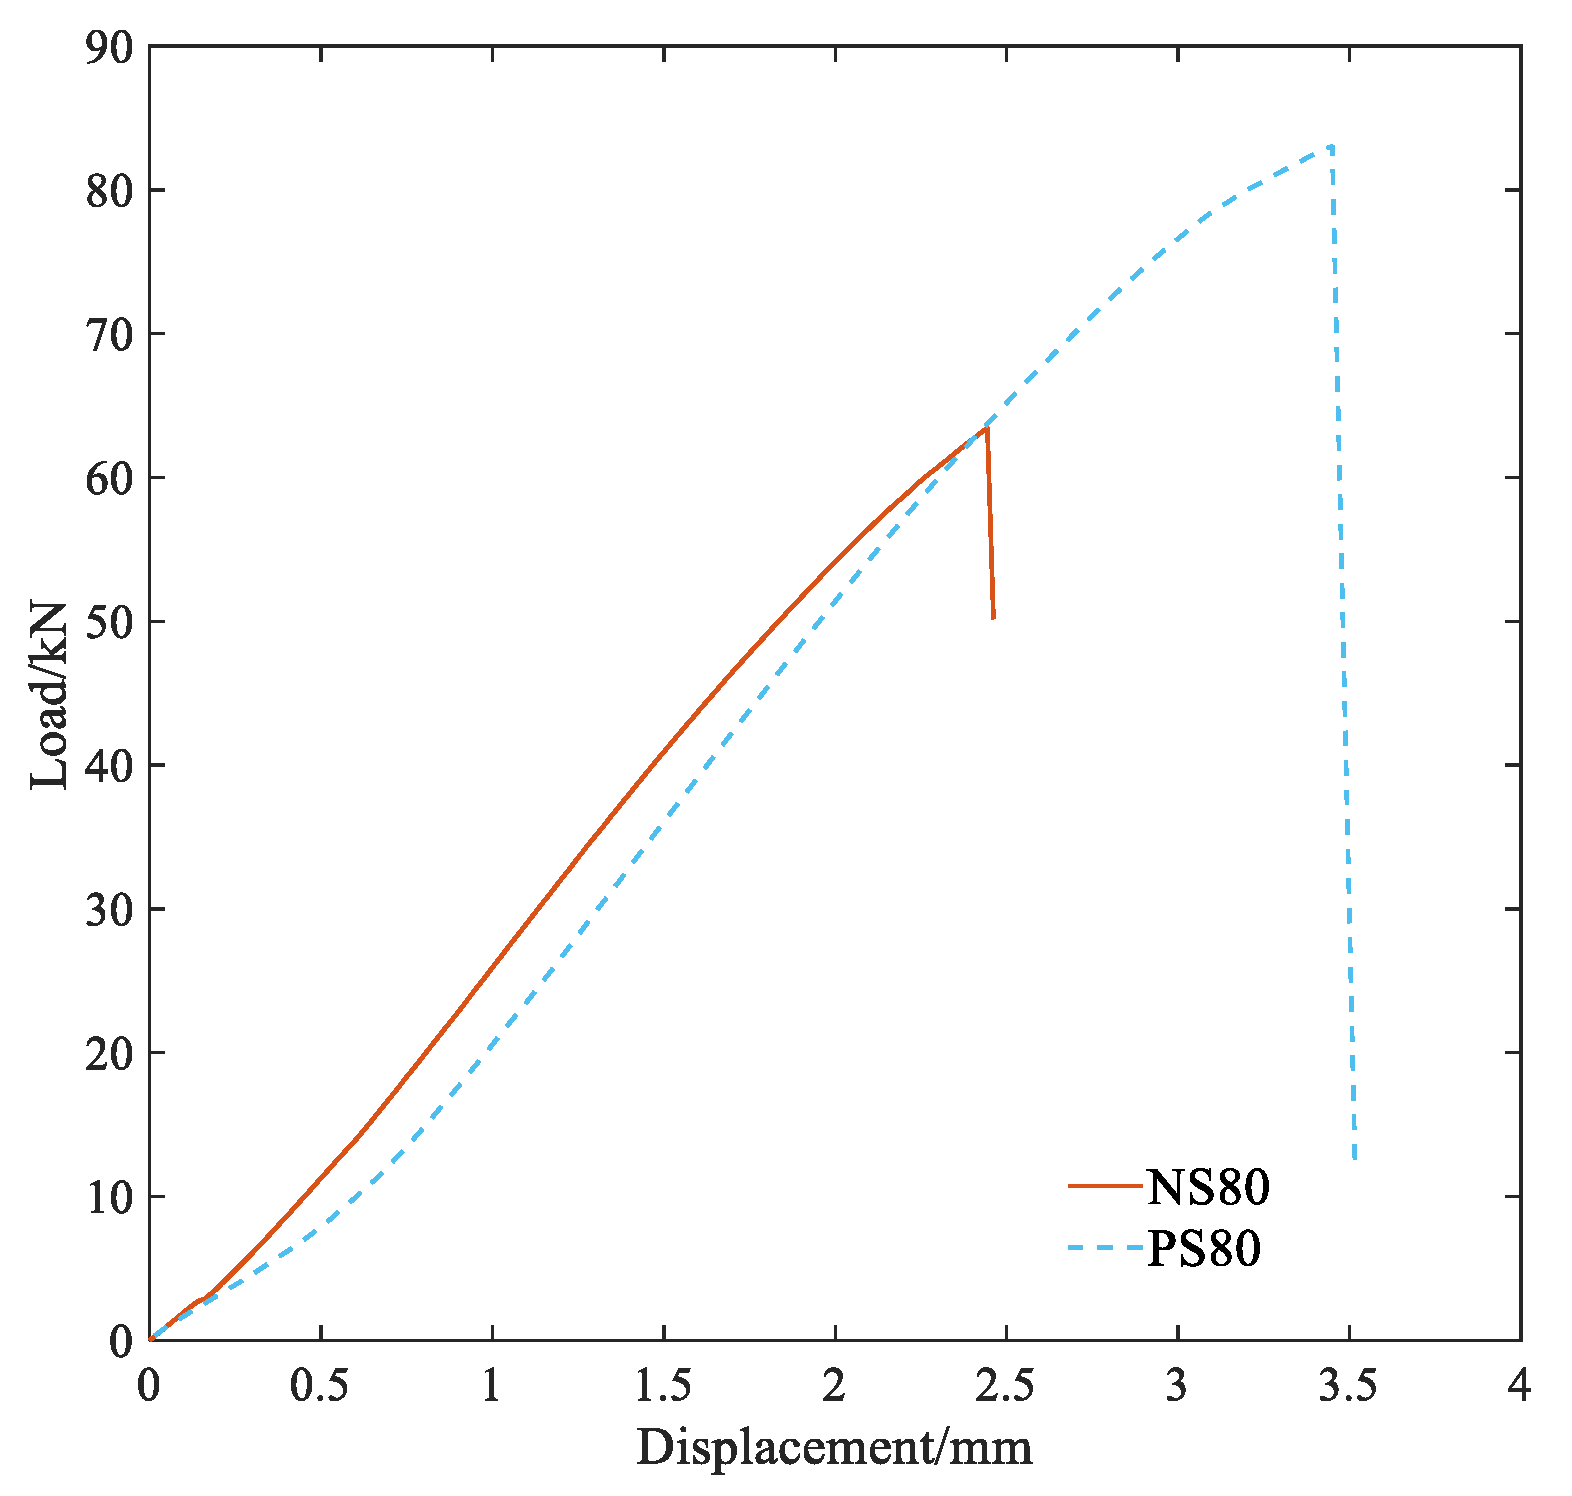
| Peak load/kN | 96.05 | 63.44 | 83.04 |
| Residual strength | 100% | 66.05% | 86.45% |
| E1/GPa | E2/GPa | G12/GPa | G13 = G23/GPa | ν12 |
| 58 | 58 | 5 | 2.5 | 0.044 |
| XT/MPa | XC/MPa | YT/MPa | YC/MPa | S12/MPa |
| 549 | 384 | 504 | 362 | 85 |
| E1/MPa | E2/MPa | E3/MPa | G12/MPa | G13/MPa | G23/MPa | ν12 | ν13 = ν23 |
| 0.1953 | 0.1953 | 136 | 0.073 | 40 | 23 | 0.94 | 0.0003 |
| XTT/MPa | SLT/MPa | SWT/MPa | |||||
| 1.93 | 1.26 | 0.62 | |||||
| E/GPa | G/GPa | ν | tn/MPa | ts = tt/MPa | Gn/N·mm−1 | Gs = Gt/N·mm−1 |
| 3.2 | 1.23 | 0.3 | 58 | 65 | 0.744 | 3.816 |
| Specimen | NS00 | NS80 | PS80 |
|---|---|---|---|
| Diameter of damage of outer film/mm | 0 | 70 | 46 |
| Diameter of outer skin damage/mm | 0 | 34 | 18 |
| Specimen | NP00 | P80 | NP80 |
|---|---|---|---|
| Test value/kN | 96.05 | 83.04 | 63.44 |
| Prediction value/kN | 88.86 | 75.57 | 56.96 |
| Relative error | −7.49% | −8.90% | −10.21% |
Publisher’s Note: MDPI stays neutral with regard to jurisdictional claims in published maps and institutional affiliations. |
© 2022 by the authors. Licensee MDPI, Basel, Switzerland. This article is an open access article distributed under the terms and conditions of the Creative Commons Attribution (CC BY) license (https://creativecommons.org/licenses/by/4.0/).
Share and Cite
Wang, Y.; Zhou, D.; Yan, G.; Wang, Z. Experimental and Numerical Study on Residual Strength of Honeycomb Sandwich Composite Structure after Lightning Strike. Aerospace 2022, 9, 158. https://doi.org/10.3390/aerospace9030158
Wang Y, Zhou D, Yan G, Wang Z. Experimental and Numerical Study on Residual Strength of Honeycomb Sandwich Composite Structure after Lightning Strike. Aerospace. 2022; 9(3):158. https://doi.org/10.3390/aerospace9030158
Chicago/Turabian StyleWang, Yongwei, Deng Zhou, Gang Yan, and Zhuangjie Wang. 2022. "Experimental and Numerical Study on Residual Strength of Honeycomb Sandwich Composite Structure after Lightning Strike" Aerospace 9, no. 3: 158. https://doi.org/10.3390/aerospace9030158