Article

Ground Test and Numerical Simulation of Aerodynamic Interference of the Marsupial UAS

School of Aeronautic Science and Engineering, Beihang University, Beijing 100191, China
*
Author to whom correspondence should be addressed.
Aerospace 2023, 10(2), 175; https://doi.org/10.3390/aerospace10020175
Submission received: 6 December 2022 / Revised: 31 January 2023 / Accepted: 10 February 2023 / Published: 14 February 2023
(This article belongs to the Collection Unmanned Aerial Systems)

Abstract

:
The marsupial unmanned aircraft system (UAS) consists of a large parent unmanned aerial vehicle (UAV) and multiple small children UAVs that can be launched and recovered in the air. The employment of marsupial UAS can expand the mission range of small UAVs and enhance the collaborative capabilities of small UAVs. However, the serious aerodynamic interference between the parent UAV and the child UAV will affect the flight safety during the launch and recovery process. In this paper, the interference characteristics of marsupial UAS is investigated through ground tests and CFD simulation. Ground tests compared the lift and power of the child UAV with and without parent UAV interference in different areas, and the simulation extended the experimental scope. Three specific interference regions above the parent UAV are defined, including the area above the rotors, the area above body and the transition area. In the first two aeras, the variation of the disturbed lift is more than 30% of the child UAV weight. In the transition aera, the child UAV will be subjected to significant lift variations and asymmetric moments. According to the interference characteristics of different regions, the safe flight boundaries and the appropriate paths of children UAVs are proposed.

1. Introduction

In recent years, small unmanned aerial vehicles (UAVs) have developed rapidly in military and civilian applications due to their strong survivability, good maneuverability, and low manufacturing cost with small size. However, due to the limit of energy technology, small UAVs have some shortcomings, such as low flight speed, poor endurance, and limited load capacity. As a result, the mission range of small UAVs in practical applications is small, it is difficult to be quickly maneuvered and deployed before the mission begins. At the same time, the security and reliability of small UAVs are relatively awful.
With the development of intelligent technology, beginning in 2016, the US Defense Advanced Research Projects Agency (DARPA) launched the development of the “Gremlins” drone, seeking to use a large aircraft as carrier to recover, transport, and deploy small UAVs for expanding the mission range of small UAVs. This breakthrough technology enabled a dispersion of assets while maintaining concentrated effects [1]. In late October 2021, DARPA successfully captured a Pixie drone using a C-130 transport aircraft. It was the first airborne recover of the marsupial UAS, although another child drone was damaged during the test. So far, the aerial recovery of children-UAVs is still a difficult problem to be solved.
In order to solve the problem of aerial collaborative recover of the marsupial unmanned aircraft system (UAS), the multi-rotor UAV is used as the parent flying platform. The children UAVs are launched and recovered from the top of the parent UAV to reduce the aerodynamic interference of the marsupial UAS and improve the flight safety of the system. UAV visual precision landing technology is adopted to land inside the parent UAV. Multi-rotors have proven to be a versatile platform for a variety of missions [2]. Multi-rotors are ideal for disaster management and assessment, rescue search missions, mapping, photography, and surveillance missions in remote and hazardous areas [3,4,5,6].
The difficulty in the air-launch and recovery of the marsupial UAS depends on the coordinated flight of the parent UAV and the children UAVs. Therefore, it is necessary to study the aerodynamic interference in the launch and recovery process, so as to break through the UAS collaborative control technology under multi-drone aerodynamic interference. There are two challenges in the aerodynamic analysis of the marsupial UAS. First, both parent UAV and the child UAV contain multiple rotors and body, and the aerodynamic interference is complex. Secondly, there are few relevant studies available for reference since the marsupial system is a new unmanned heterogeneous aerial platform.
The rotor aerodynamic analysis method, which is the basis of the research of the aerodynamic interference of marsupial UAS, has been extensively studied in helicopter aerodynamics [2]. However, research interest in multi-rotors has only grown recently. Related research is mainly divided into two categories: one is to study the interference between rotors and components of multi-rotor aircraft to optimize the overall design of the aircraft or to guide flight control [7,8,9]. Based on the Navier-Stokes (N-S) method, Kang and Sun [10] introduced the source term to simulate the flow field of single, tandem, side-by-side, and coaxial rotors operating near the ground. Using a detached-eddy simulation model, Misiorows [8] compared the performance of the plus and cross configurations under lateral flight conditions. Chiew [11] studied the influence of rotor spacing on wake interference in hovering state, and determined the optimal configuration.
The other is to study the interaction between the aircraft and the environment, such as ground effect, near-surface effect [12,13,14,15]. The wake propagation and flow development of multi-rotor are studied. Operating a multi-rotor approaching an obstacle in practical applications can lead to catastrophic mission failure without adequate understanding of proximity effects [16]. Raza [17] used time-accurate large eddy simulations to simulate the wind field behind the building and studied its influence on stable flight control of the quadrotor. Paz [18] used a numerical simulation method based on a dynamic mesh to analyze the influence of different flight speeds on the aerodynamic characteristics when the quadrotor is flying over obstacles. Casalino [19,20] studied the acoustic impact of rotors in urban traffic based on the LB/VLES method, revealing the importance of multiple vortex-body interactions in a complex multi-rotor system. Vladimir et al. [21] took into account the ground-reflected upwash at the rotor disk level and proposed a real-time simulation method that can be used for flight dynamics. A deep understanding of wake propagation is critical for accurate predictions, as it can adversely affect the stability of the drone [2].
There is little research on the aerodynamic interference between different multi-rotors drones. The only relevant ones found are studies by Jain and Fortmuller [22]. By measuring the position and attitude of the UAV below in the downwash, they calculated the force and moment of the UAV below. They obtained the downwash velocity distribution of the UAV above based on the established UAV kinetic model.
However, when the parent UAV below is relatively large (such as marsupial UAS), or when the two UAVs are nearby (such as a multi-rotor formation), the aerodynamic interference caused by the UAV below cannot be ignored. In this paper, a ground test was built to measure the extent of the interference effect between the small child UAV and the large parent UAV. A quasi-steady analysis method of momentum source based on the N-S equation is used to analyze interference mechanism and expand the test scope. This numerical method converts the propeller action effect into the source term, which can greatly reduce the number of computational grids and improve computational efficiency.
The remainder of this paper is organized as follows. The second part mainly describes the research model of marsupial UAS. The experimental setup and the numerical simulation method are presented in detail. In the third part, based on the experimental and simulation results, the interference mechanism of different interference regions is demarcated. Based on the change in disturbed force, the safe flight boundary of the child UAV is divided. Finally, in the fourth part, the main conclusions of this paper are summarized.

2. Methodology and Research Models

2.1. Ground Test Experiment

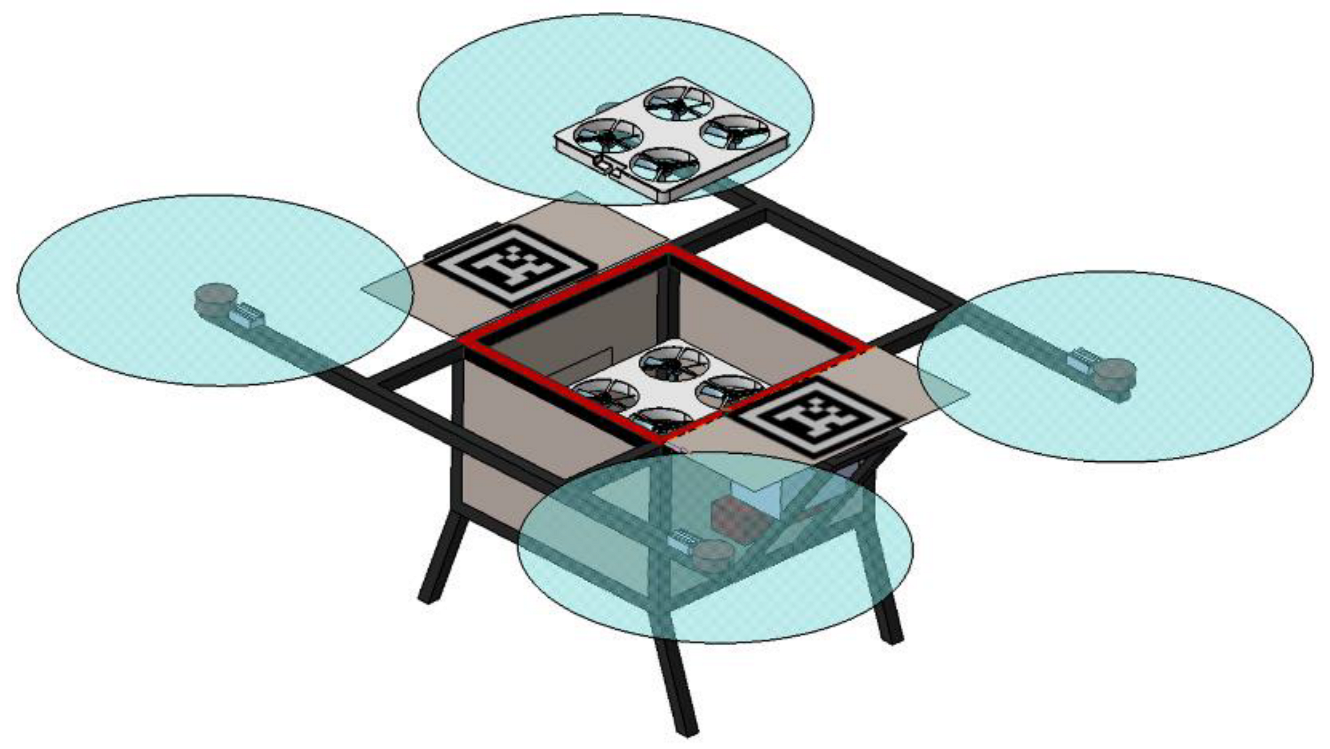
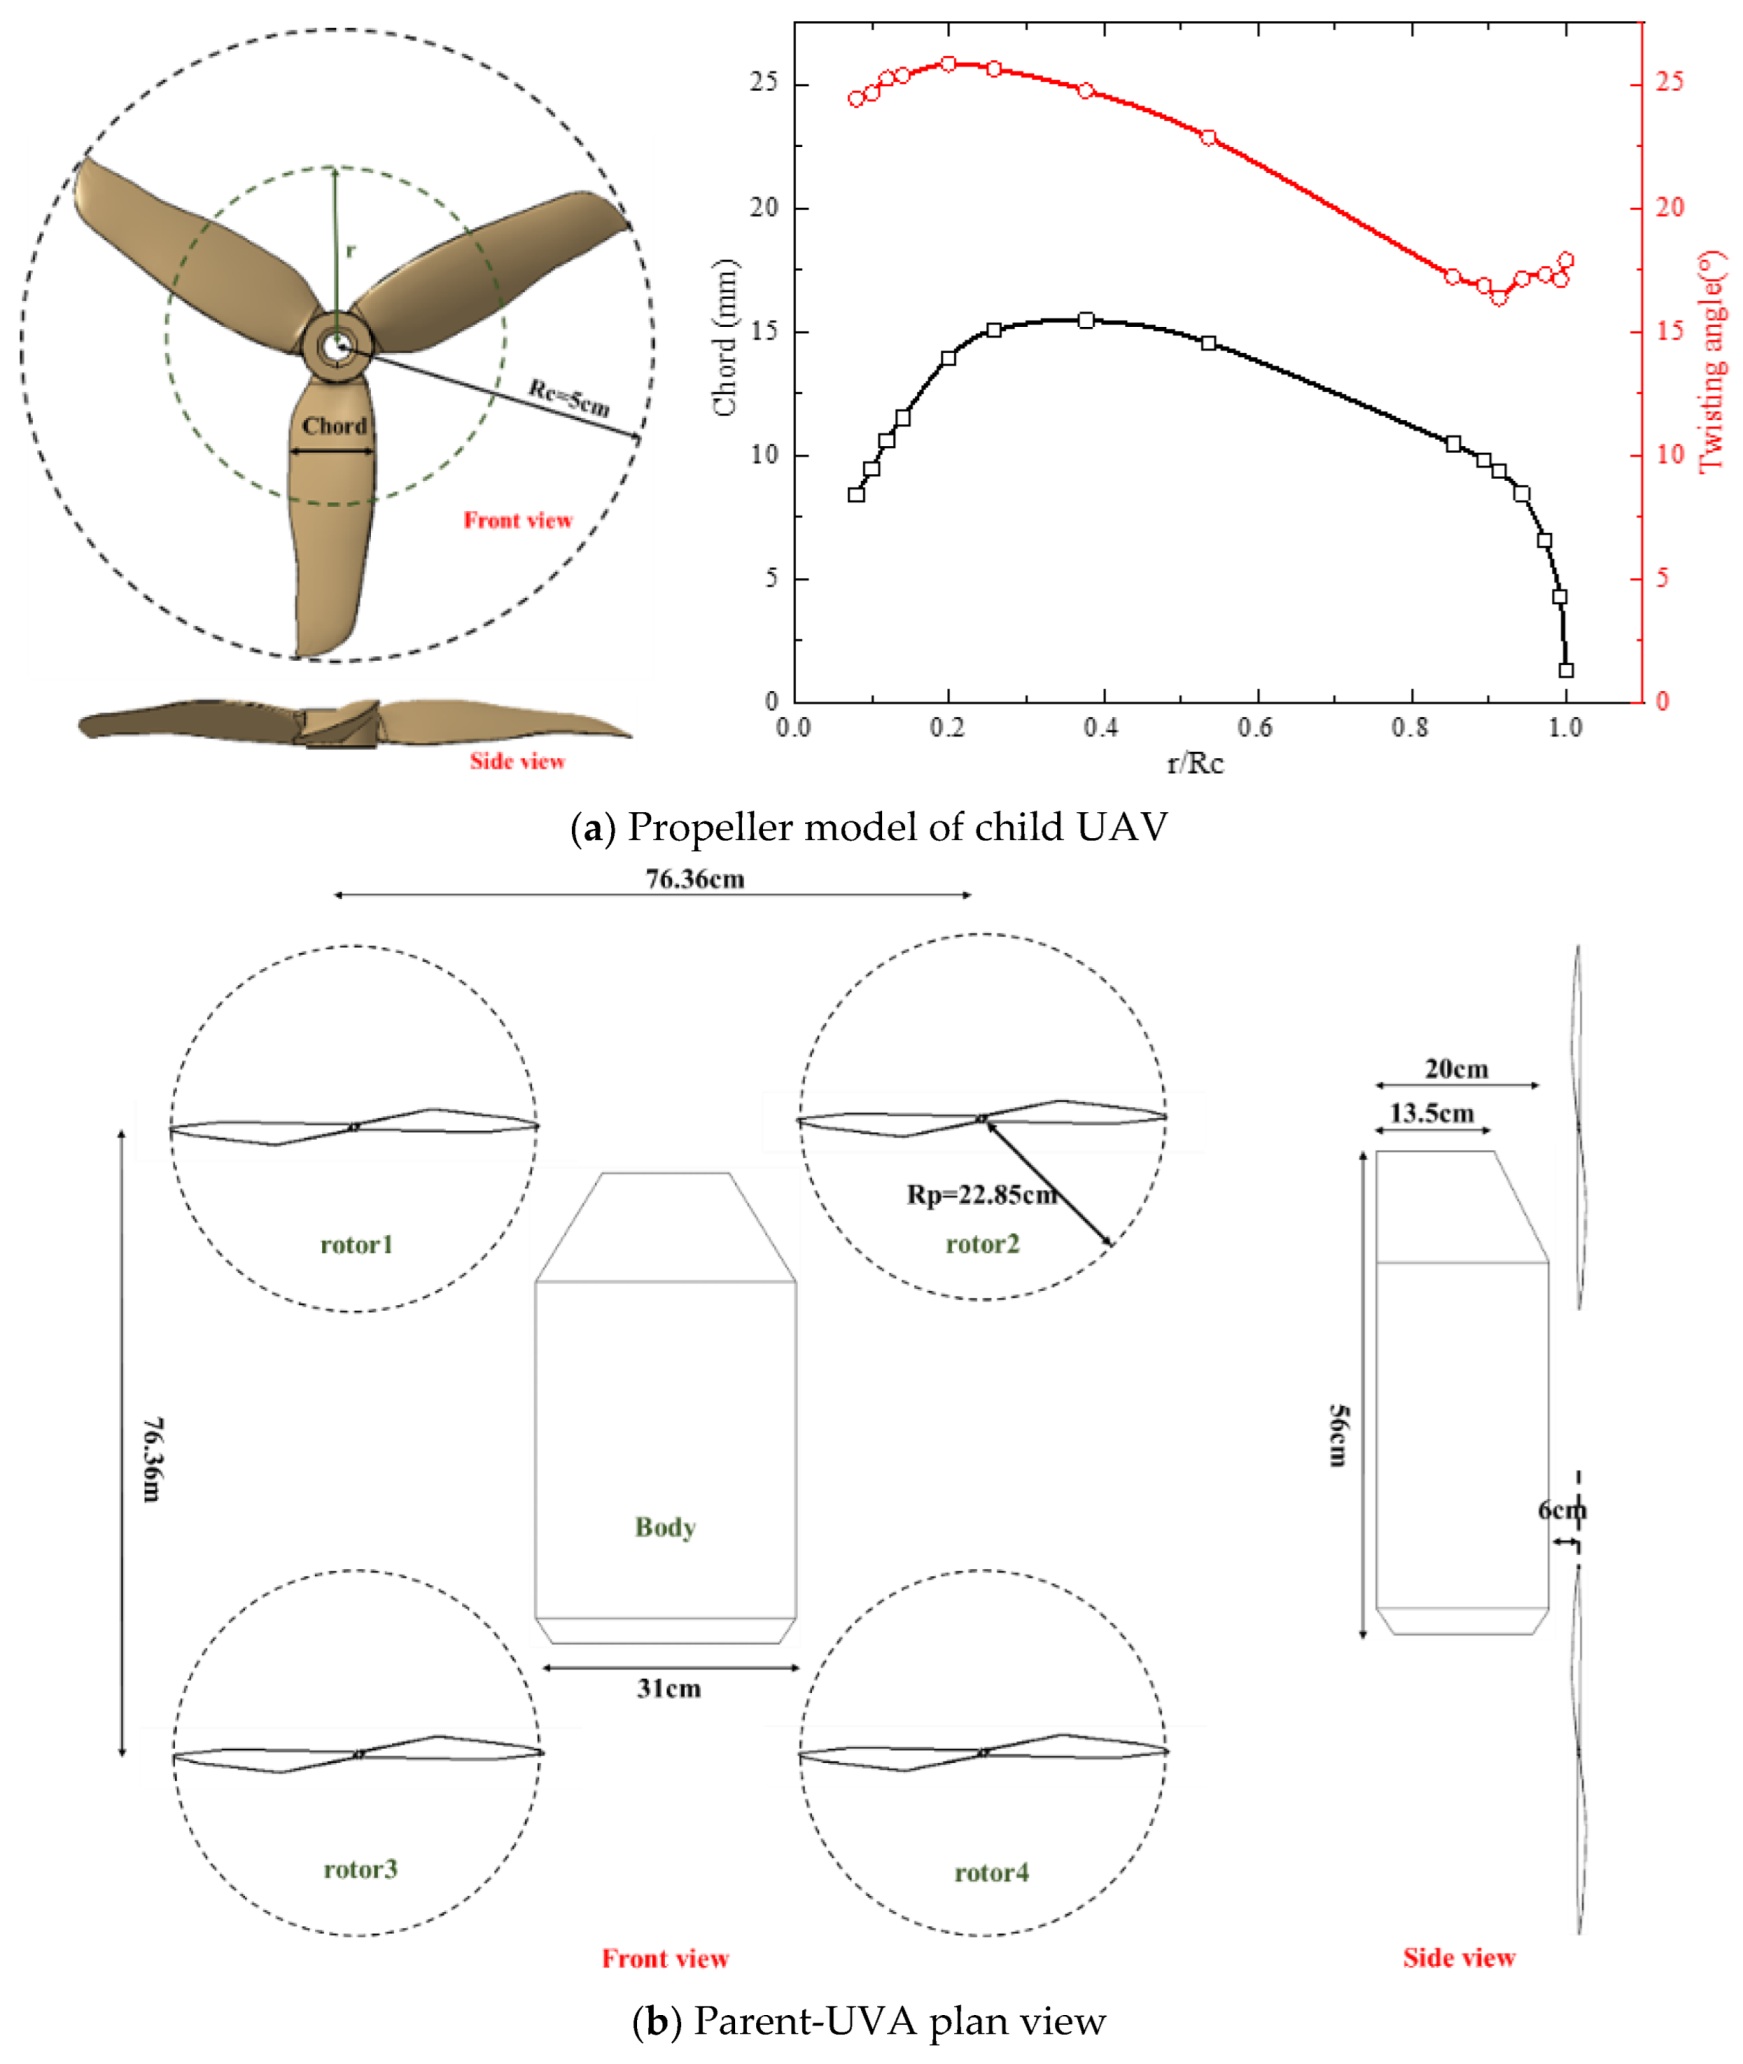
2.1.1. Research Models

In the design of the marsupial UAS, we want the parent UAV to carry as many child UAVs as possible for long-distance flights, and the system has distributed communication capability. The parameters of the child UAV and the parent UAV are shown in the Table 1. The launch and recovery process of the marsupial UAS is shown in Figure 1.
The child UAV model is a ducted small quadrotor. The duct can reduce the mutual interference between the rotors, increase the lift of the aircraft, and increase the flight safety to a certain extent. The propeller blade shape of the child UAV is shown in the Figure 2a and the rotor airfoil adopts DAVIS airfoil. The thickness of the child UAV is 2.7 cm. The parent UAV is a large X-type quadrotor. The pitch of its carbon fiber propellers is 14 cm. In this study, only the main components of the system are retained, such as the rotors and the body. The parent UAV model is shown in the Figure 2b.
Low relative velocity of the child UAV and parent UAV due to the high requirements on the coordination ability of the child UAV and the parent UAV during the launch and recovery process is observed. In addition, the unsteady effect of the rotors has little effect on the time-averaged force. In this paper, the quasi-steady method is mainly used to study the aerodynamic interference of the marsupial UAS.

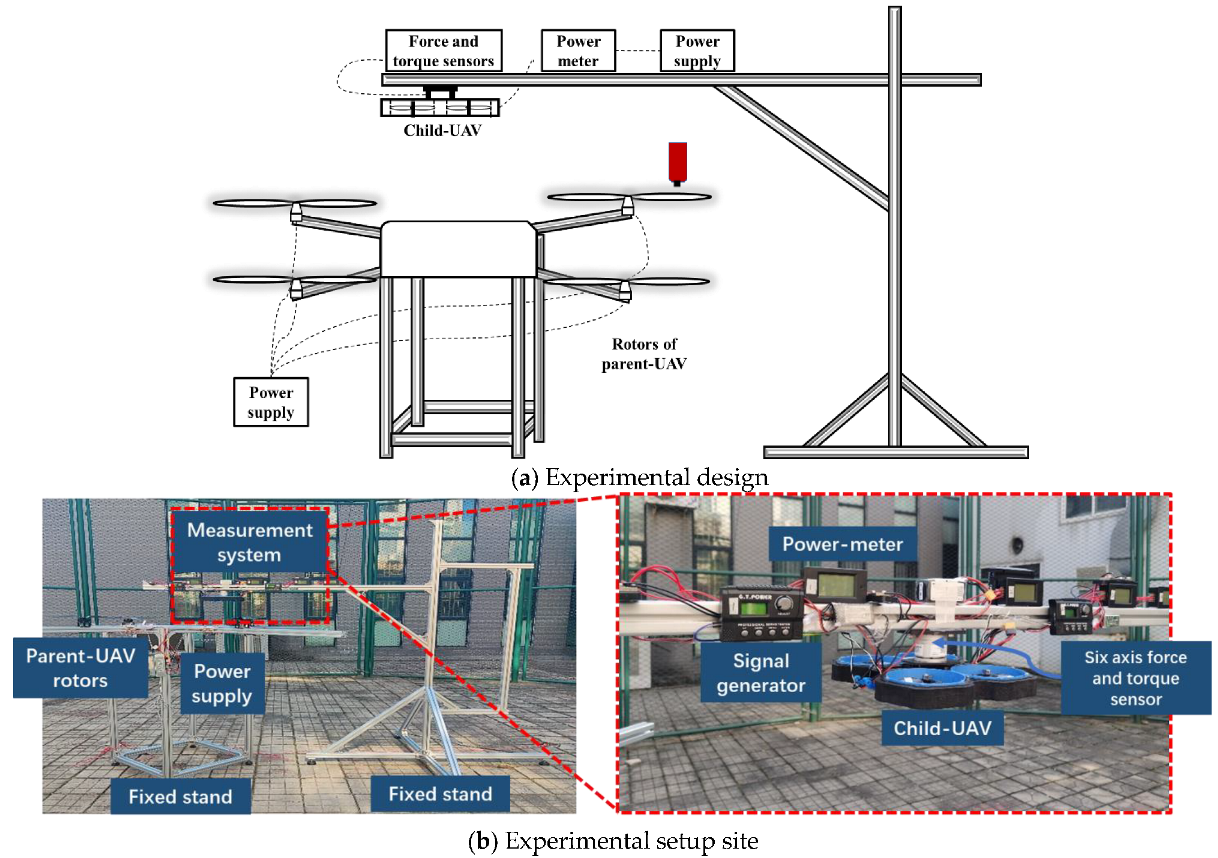
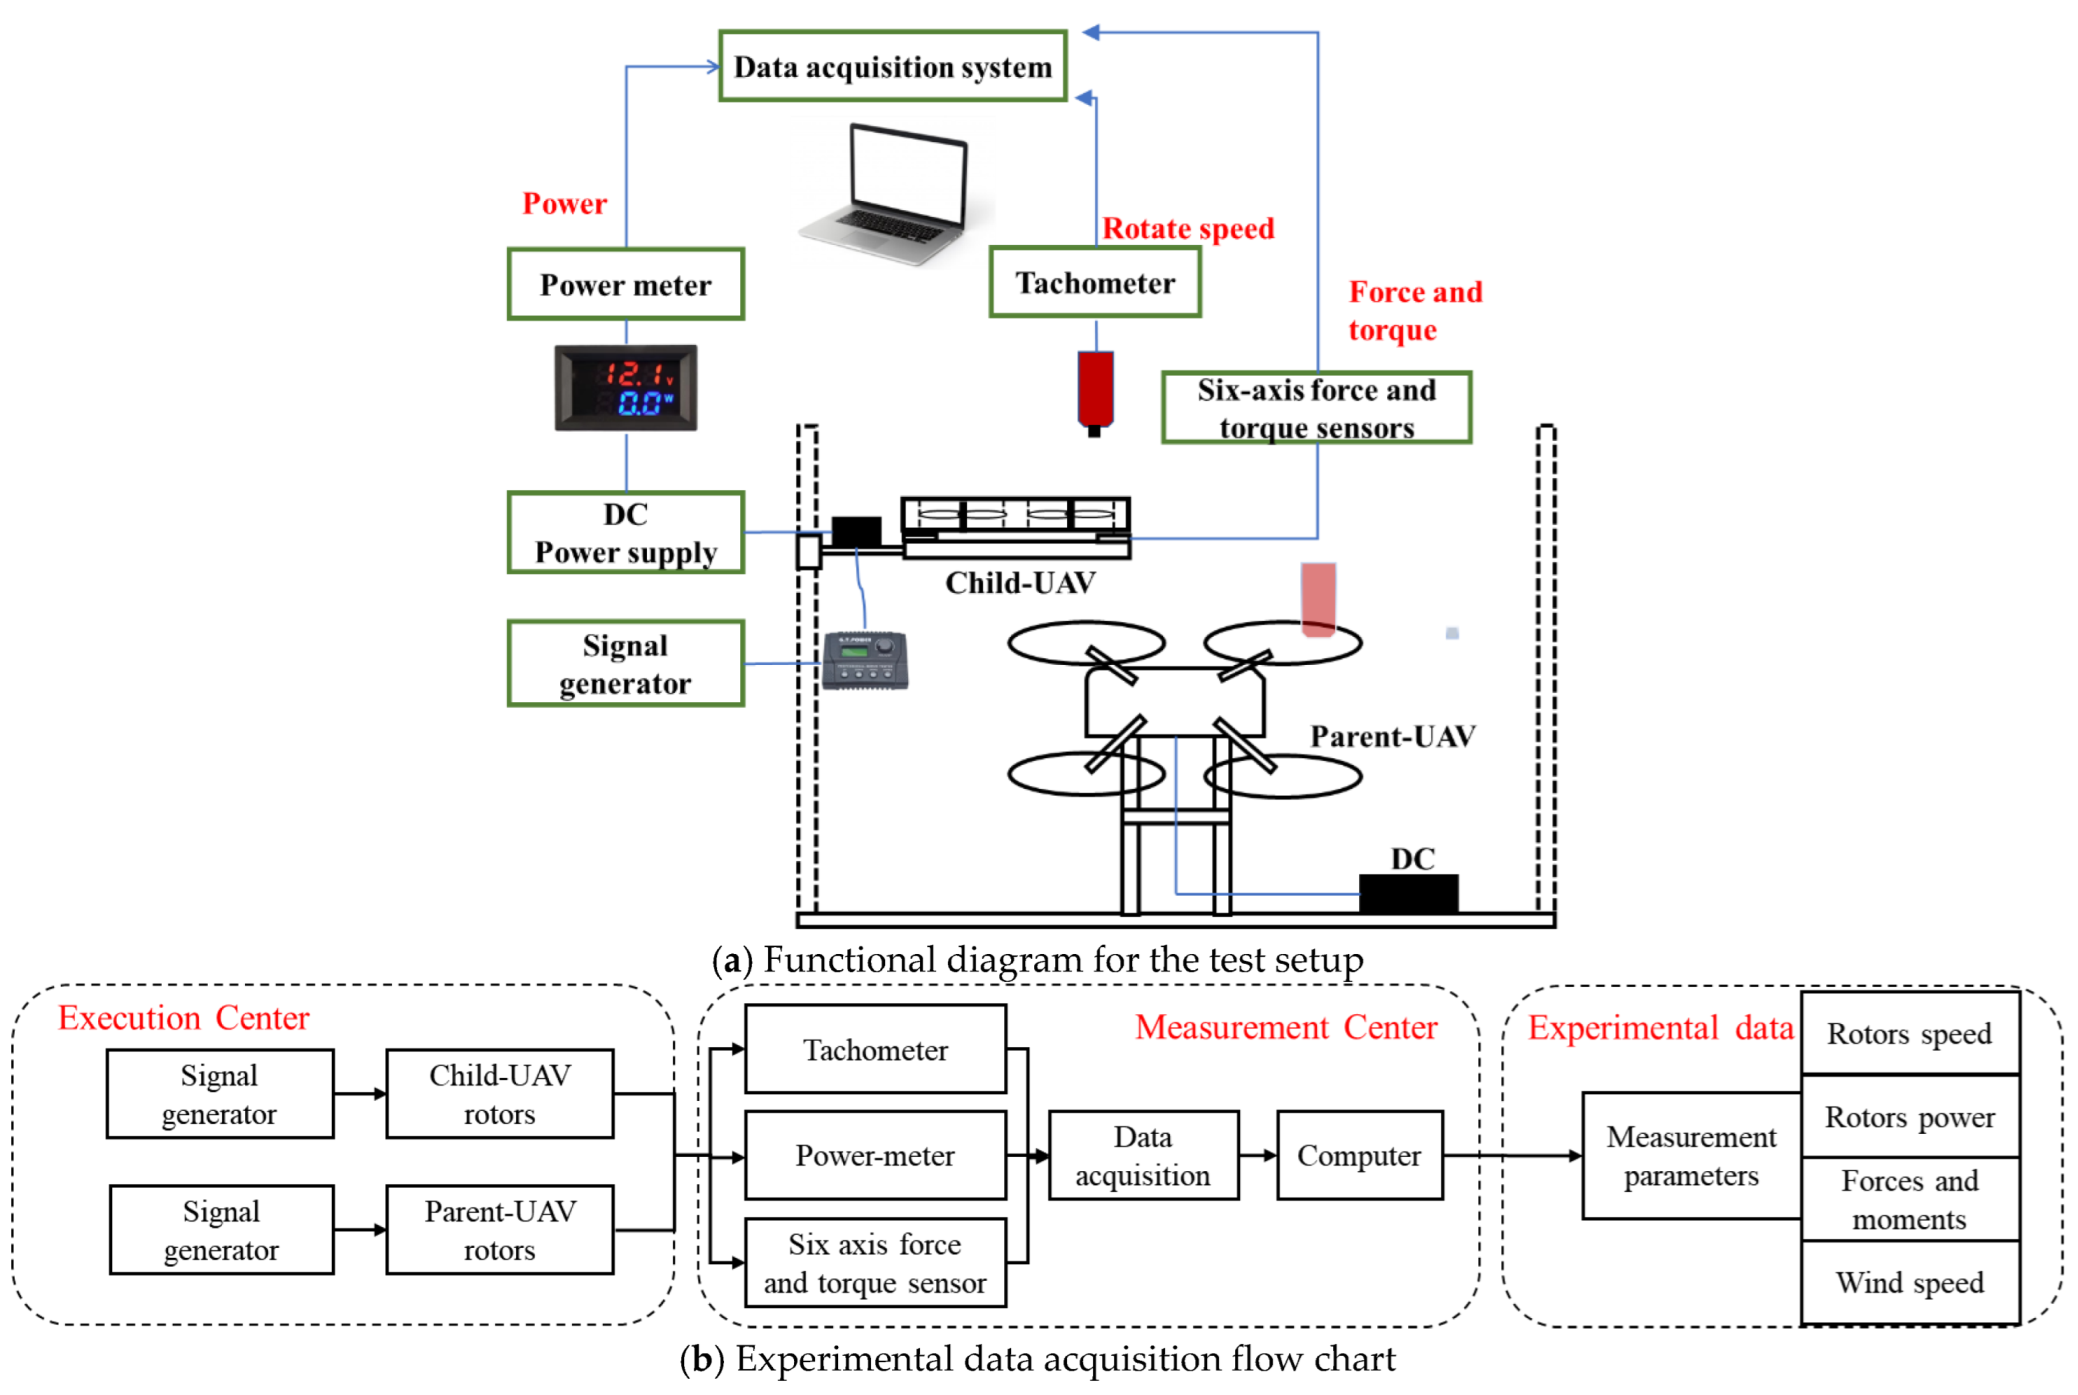
2.1.2. Experimentation Setup

Both the child UAV and the parent UAV were fixed on the ground test shelves. The measurement stands of marsupial UAS are shown in Figure 3. The rotor of the parent UAV was fixed at 120 cm from the ground (about 5.2 times the Rp), and the influence of ground effect can be ignored in this situation. The rotors of the parent UAV were driven by a high-power brushless motor, and the rotation speed was adjusted by a signal generator.
A six-axis force and torque sensor and four power meters were connected with the child UAV to measure the changes of the force, torque, and power in real time. The sampling rate of the sensor used in the test was 1000 Hz. The measurement errors of force and torque were 0.5 N and 1.2 × 10⁻³ N·m, respectively. The measurement error of the power meter was about 0.6 W. The flight control of the child UAV was removed, and the rotor speed was controlled by using four PWM signal generators to ensure the same speed of the four rotors. At the same time, a tachometer was used to record the actual rotation speed of the rotor. An anemometer was used to record the ambient wind field.
The mechanical properties of the power components were calibrated before the experiment. Therefore, the propeller thrust was almost the same under the same signal input. In the experiment, the rotation speed of the parent UAV rotors and the child UAV rotors were, respectively, 13,220 rpm and 3410 rpm, corresponding to 60 N lift for the parent UAV rotor and 4.09 N lift for child UAV. The process of experimental data acquisition is shown in Figure 4. The test data in the article were the average of multiple measurements, and each measurement was averaged over multiple time periods.

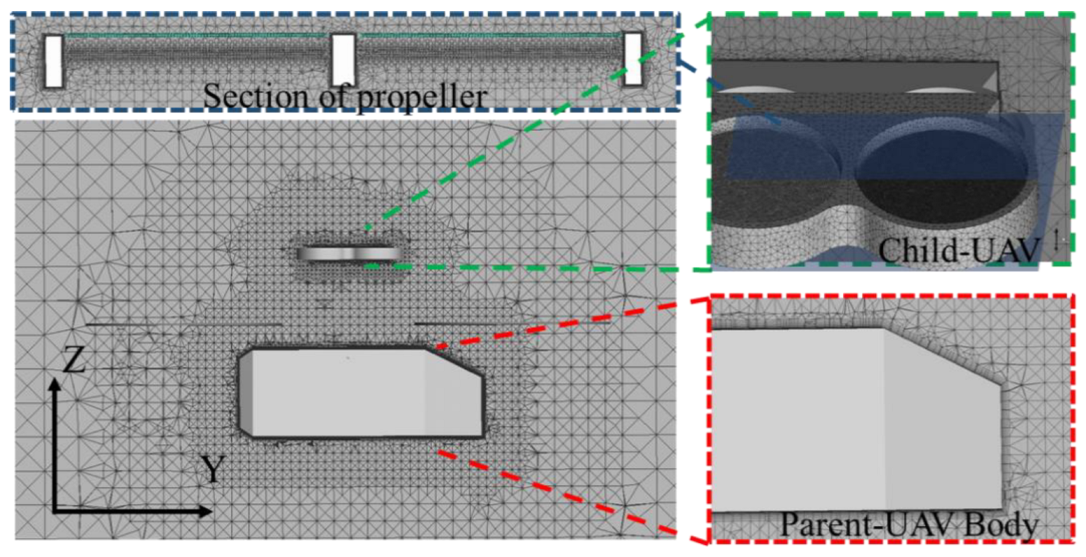
2.2. CFD Numerical Method

The analysis methods of aerodynamic interference for muti-rotors are mainly divided into experimental method [12] and simulation method. Experimentation offers important benefits such as the realism of the situations, but also presents some drawbacks, such as the complexity of the infrastructure and the measuring devices, and the economic costs. Numerical simulation methods can quickly predict analysis results with less cost, but it is difficult to fully reproduce the real environment.
Simulation methods include rotor vortex theory [23], body-fitted meshes boundary method [7,8,9], and momentum source methods [24,25,26]. Additionally, this paper adopts the rotor aerodynamic simulation method based on momentum source. Using this method, the rotor is replaced by a thin disc, and the element force of the blade during the rotation is replaced by the momentum source term. The periodic flow is transformed into a quasi-steady flow state by the method of time averaging. This method ignores the time-varying flow details close to the blade, which reduces the difficulty of grids generation. It requires less computational resources and faster solution speed under the premise of high computational accuracy [25].
The aerodynamic force generated by the propeller is calculated using the blade element theory, as shown in Equation (1). After the coordinate transformation (Equation (2)), the aerodynamic forces are equated into the form of momentum source terms added at the corresponding grid through UDF (user-defined function).
Aerodynamic force of blade section:
d L = N × 1 2 ρ V r 2 C r k 1 C l α , R e r d r d D = N × 1 2 ρ V r 2 C r k 2 C d α , R e r d r
where, N is the number of blades, C r is the section chord length. V r is the relative velocity ( V r = ω r + V a i r ), V a i r is the projected velocity of the local airflow velocity of the section, and ω r is the section velocity due to rotation. C l and C d are the lift and drag coefficients of airfoil associated with α and R e r , respectively. The airfoil lift and drag data used are from XFOIL software. α is the actual attack angle of the blade element, as shown in the Figure 5. α = θ r β , where θ r is the installation angle of the blade section, β represents the angle between the relative velocity of the blade element and the XY plane. R e r is the Reynolds number of the blade section, R e r = ρ V r C r μ . The range of Reynolds number in this research was about 0–240,000. k 1 and k 2 are constants for the correction of the lift and drag coefficients based on the test results.
Aerodynamic coordinate conversion:
f X = d L · s i n β + d D · c o s β · s i n φ f Y = d L · s i n β + d D · c o s β · c o s φ f Z = d L · c o s β d D · s i n β
where φ is the angle between the grid vector position and the coordinate axis. The momentum source terms in the X, Y, Z directions are S X = f X d V , S Y = f Y d V , S Z = f Z d V , respectively, where dV is the local grid volume. The governing equations used in this work are the incompressible three-dimensional Navier–Stokes equations.
Continuity equation:
U i x i = 0
Momentum equation:
U i t + U j U i x j = 1 ρ P x i + ν 2 U i x i x j + 1 ρ ( ρ u i u j ¯ ) x j
where U i denotes the velocity tensor, and ρ u i u j ¯ denotes the Reynolds stress.
The CFD solver used in this paper is the commercial software FLUENT. The simulation uses the k-epsilon turbulence model, which performs well for rotor aerodynamic calculations [27,28,29]. The ideal gas model and the Sutherland viscosity model are also used.
The validity of the momentum source method was verified comparing the experimental data from the literature [30]. In the test, the pressure distribution under the propeller was measured for a single propeller. A comparison of the simulation and test results is shown in Figure 6. The dynamic pressure distribution at 0.104 times rotor radius under the propeller is consistent with the experimental results [30], verifying the accuracy of the method in simulating the rotor flow field. The momentum source method does not require body-fitted mesh of rotor, which can save a lot of computational resources. The number of grids cells in the rotor domain is about 40 thousand, and the total grid cells of the simulation is about 80 thousand.
In this research, the computing domain has a total of about 6 million grids cells for simulating marsupial UAS, and the grids are shown in Figure 7. The computational domain is a cuboid with a size of 40 Rp × 40 Rp × 80 Rp (Rp represents the radius of parent UAV rotors). The boundary conditions for the upper and lateral surface of the far filed are set as pressure inlet, while the lower surface is set as a pressure outlet, and the propeller boundary is a non-slip wall. The turbulent intensity of the inlet and outlet was set to 5%, and the turbulent viscosity ratio is 10. In this paper, some simplifications are made according to the actual model, and only the characteristics of the body and the rotors are retained.
In the simulation, the rotation speed of the child UAV and the rotor lift of parent UAV are set to remain unchanged. The extent of aerodynamic interference will be obtained through simulation when the child UAV is located in different areas.

3. Results and Discussions

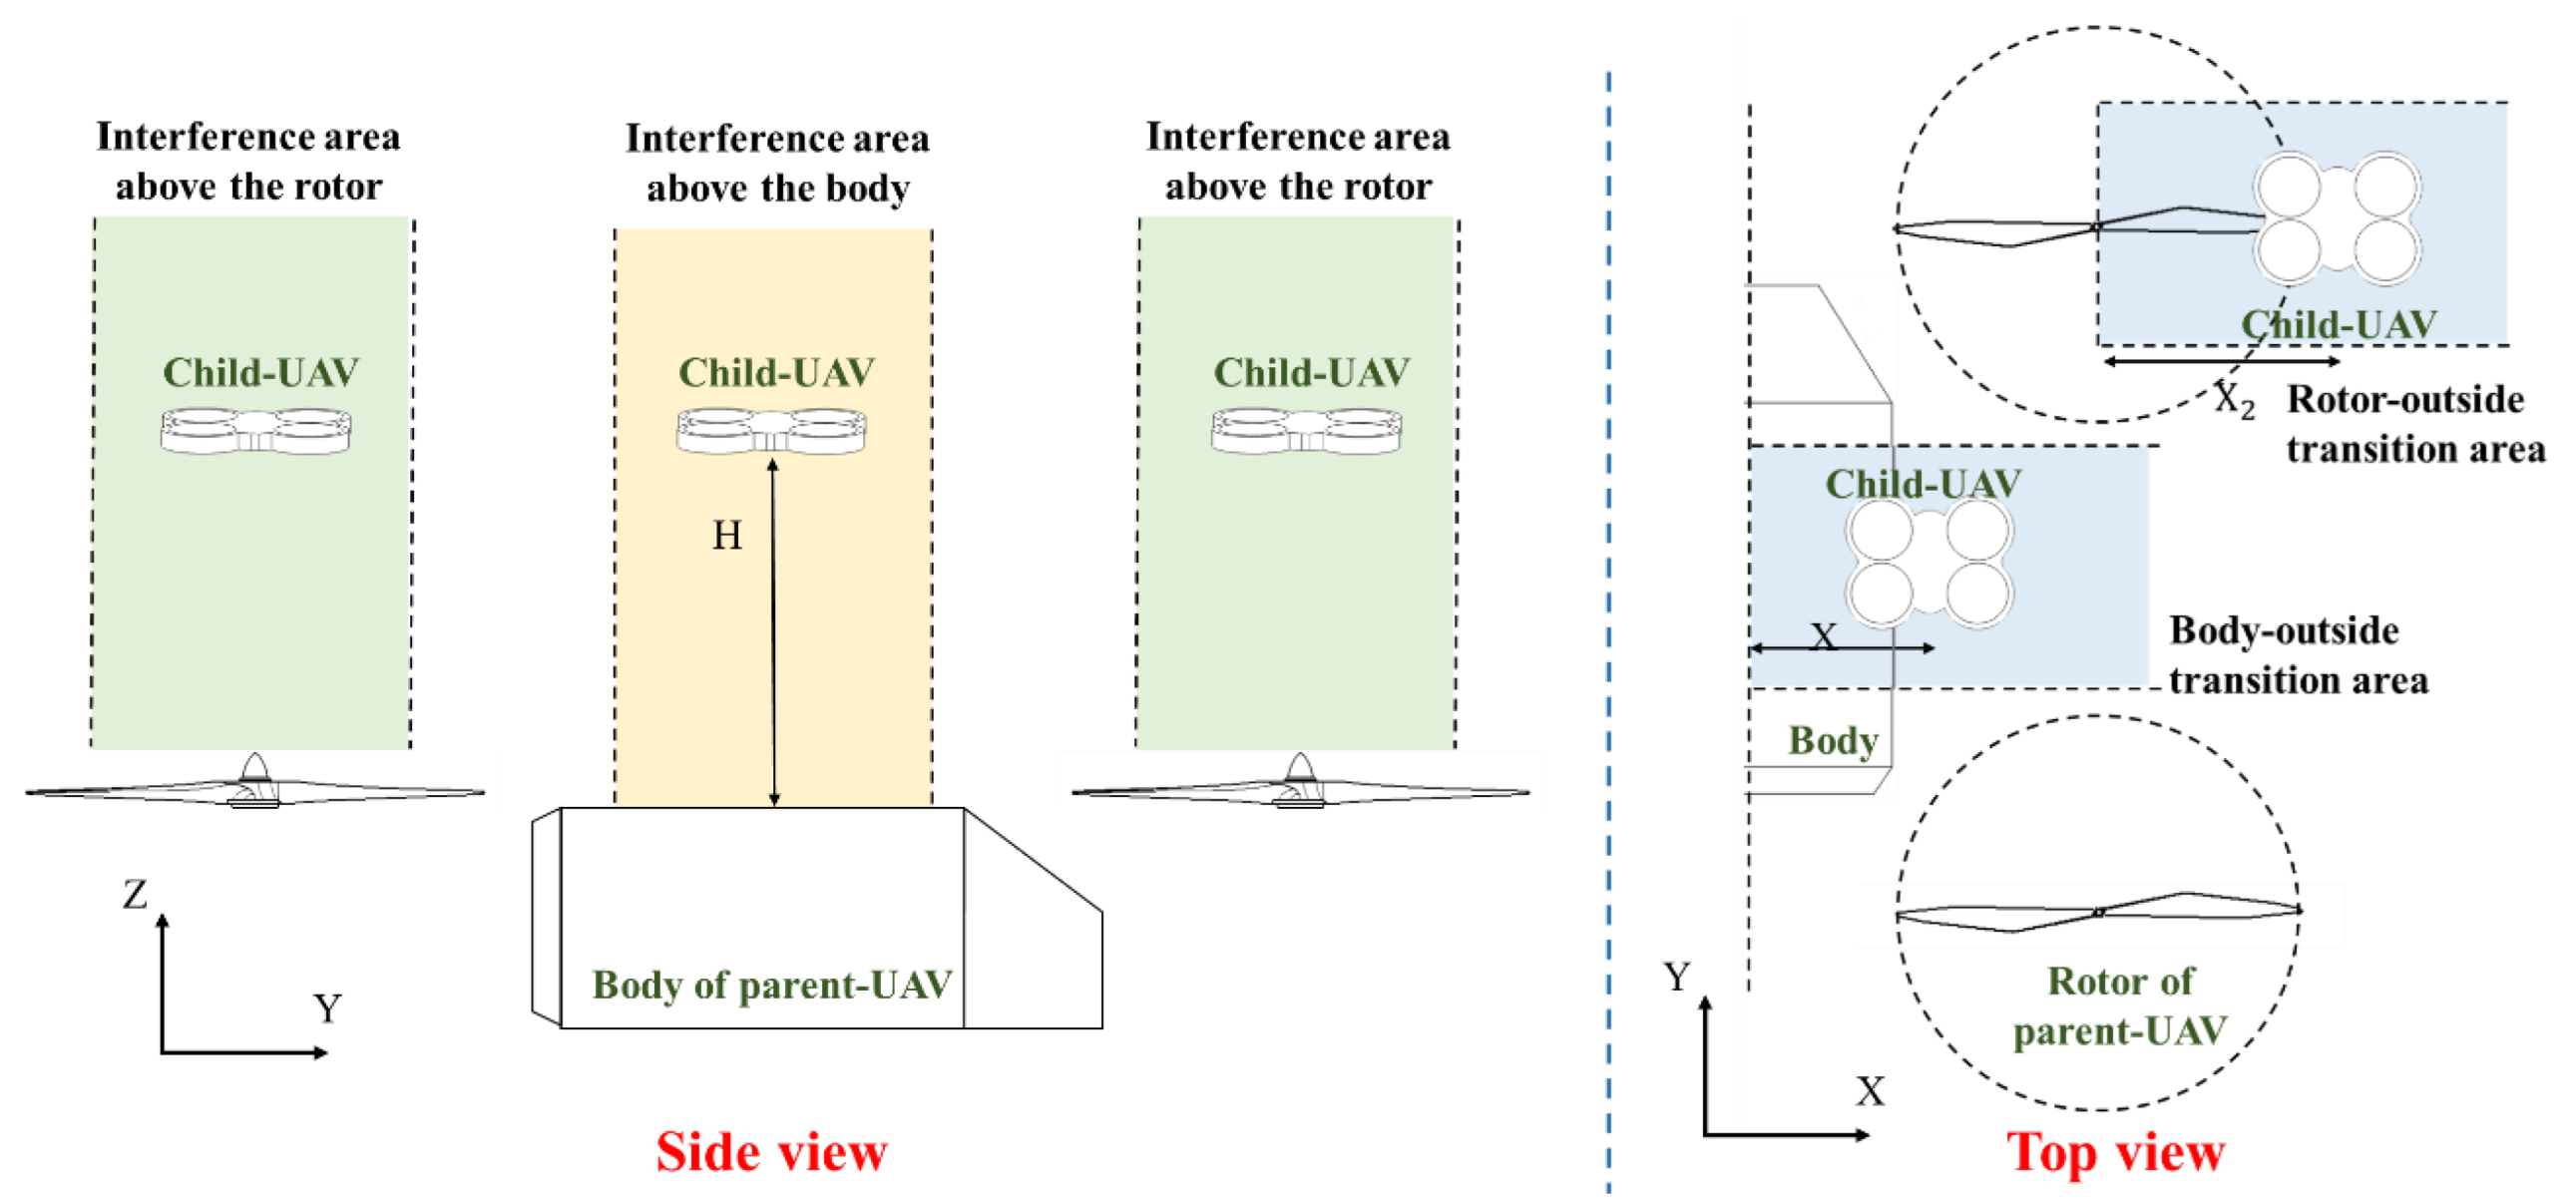
3.1. The Aerodynamic Interference in the Launch and Recovery Process

According to the position of the child UAV, the area above the parent UAV is divided into three parts: the interference area above the body, the interference area above rotors, and the transition area. The scope of the study for the three interference areas are shown in Figure 8. The characteristics of the three regions will be introduced below. Because the size and anti-disturbance ability of the parent UAV are significantly stronger than that of the child UAV, the research in this paper mainly focuses on the influence on the child UAV under the disturbance by parent UAV.

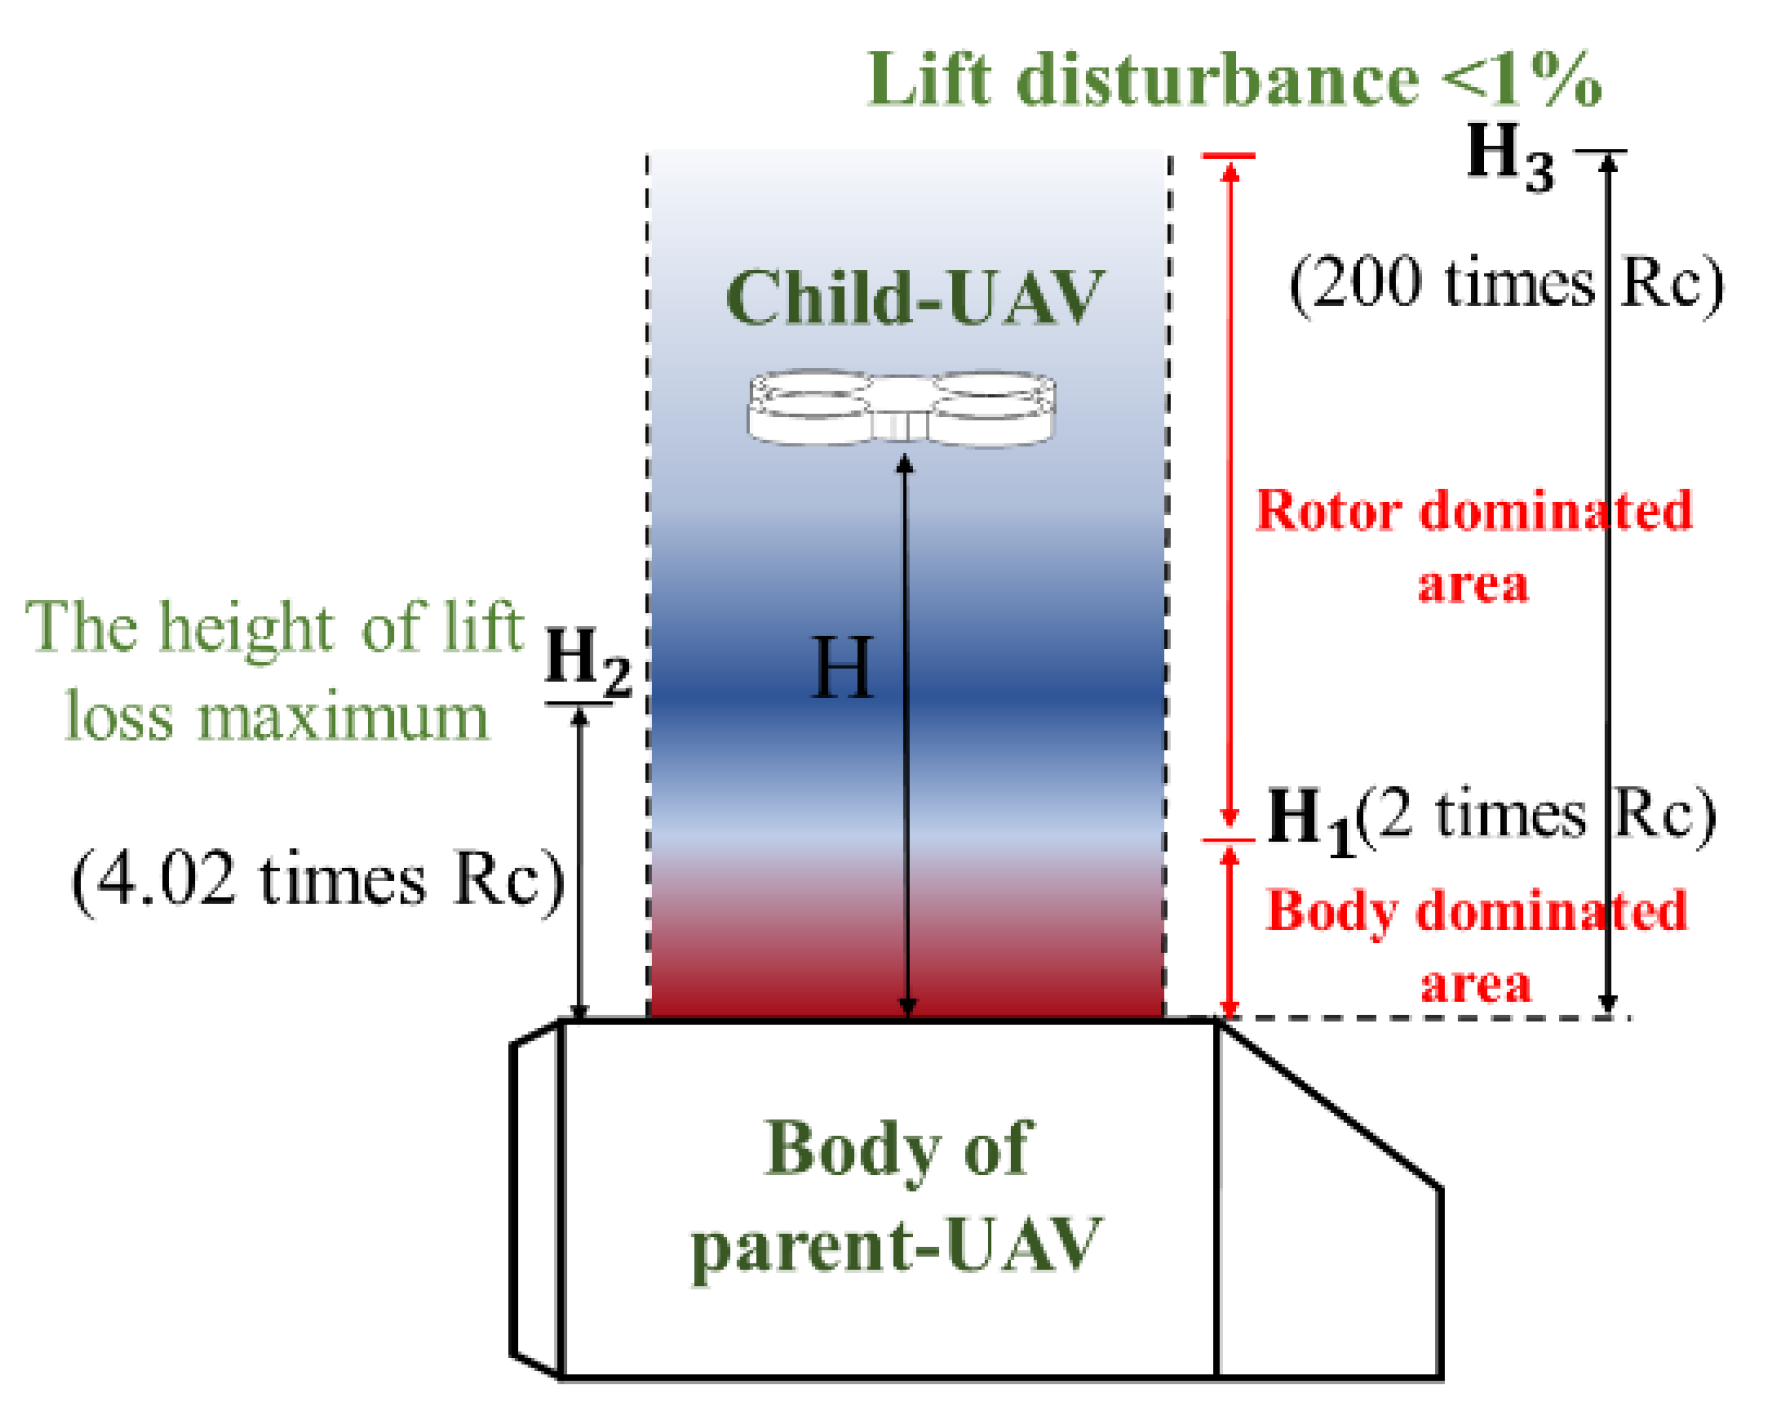
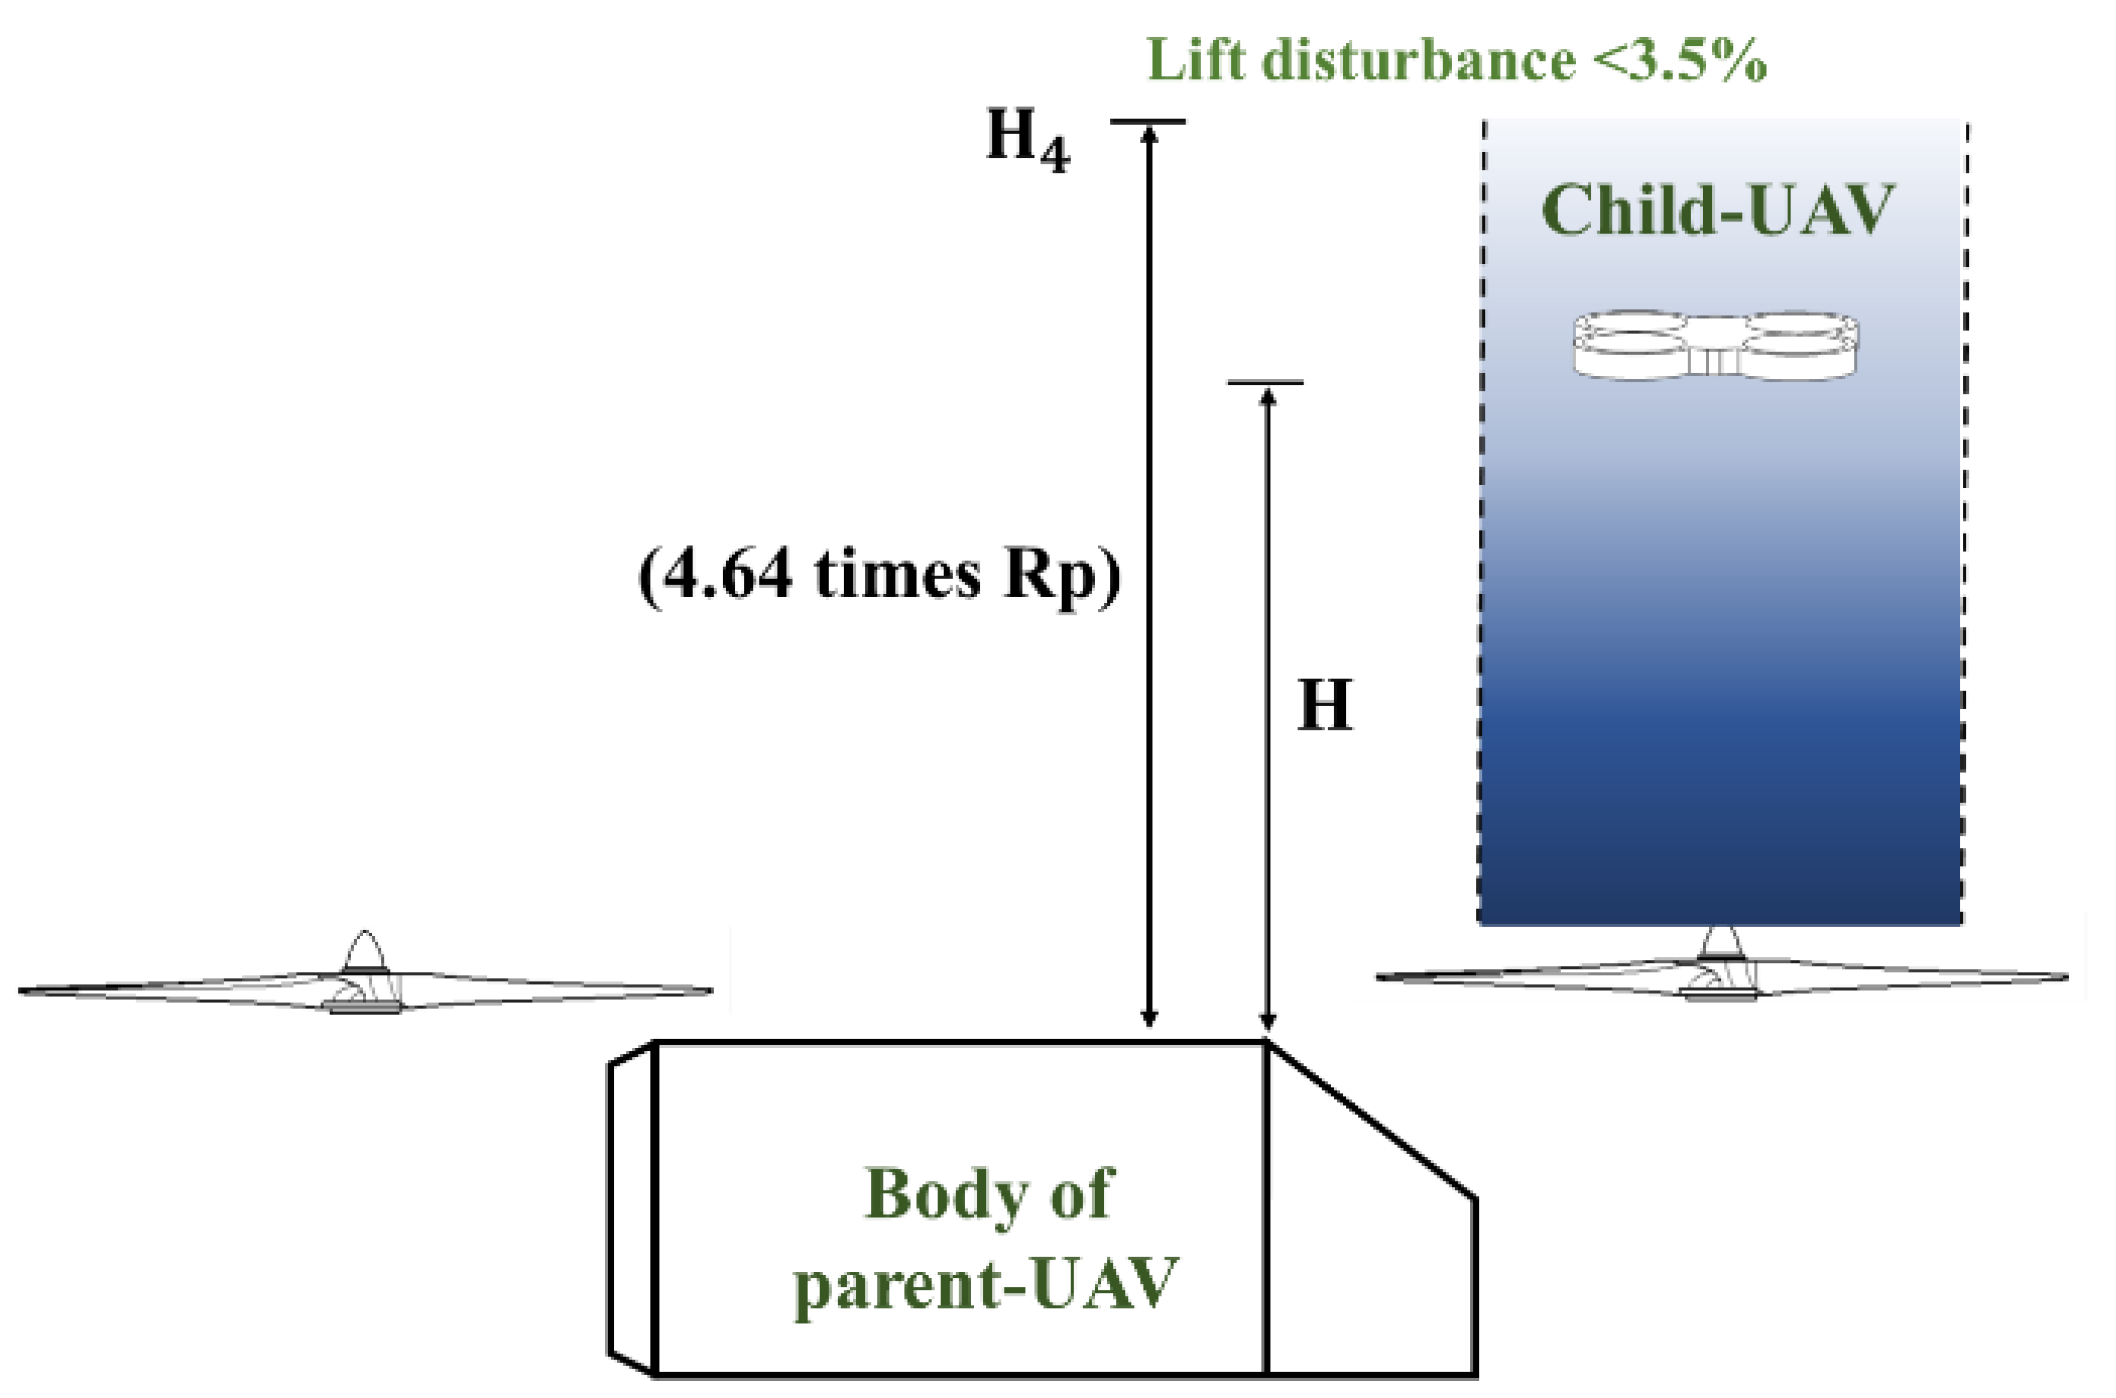
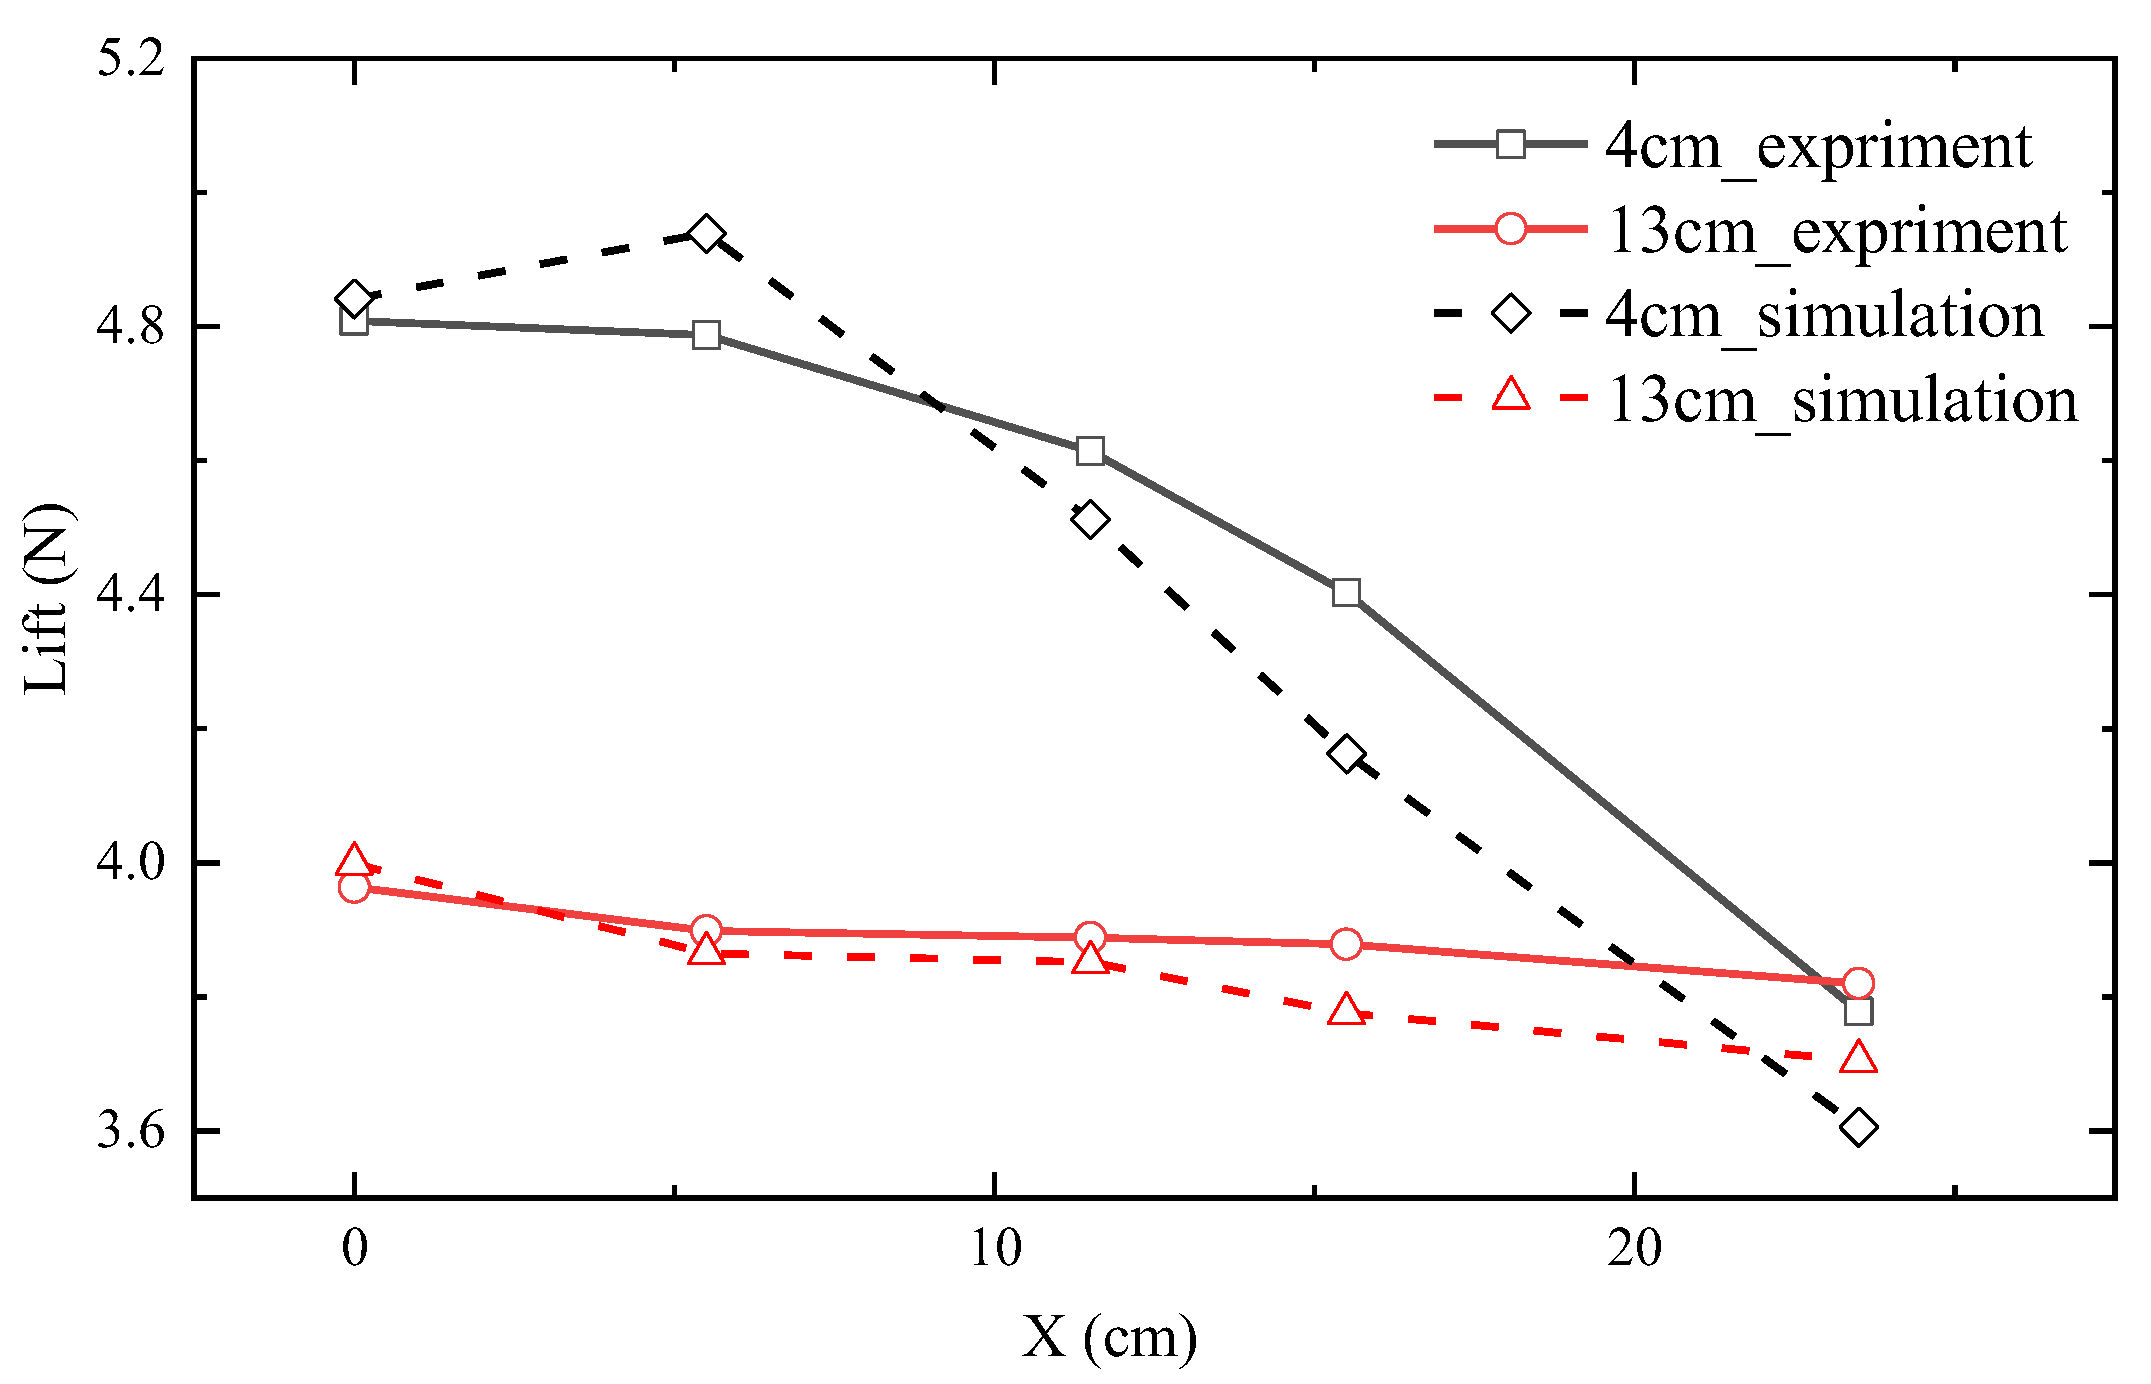
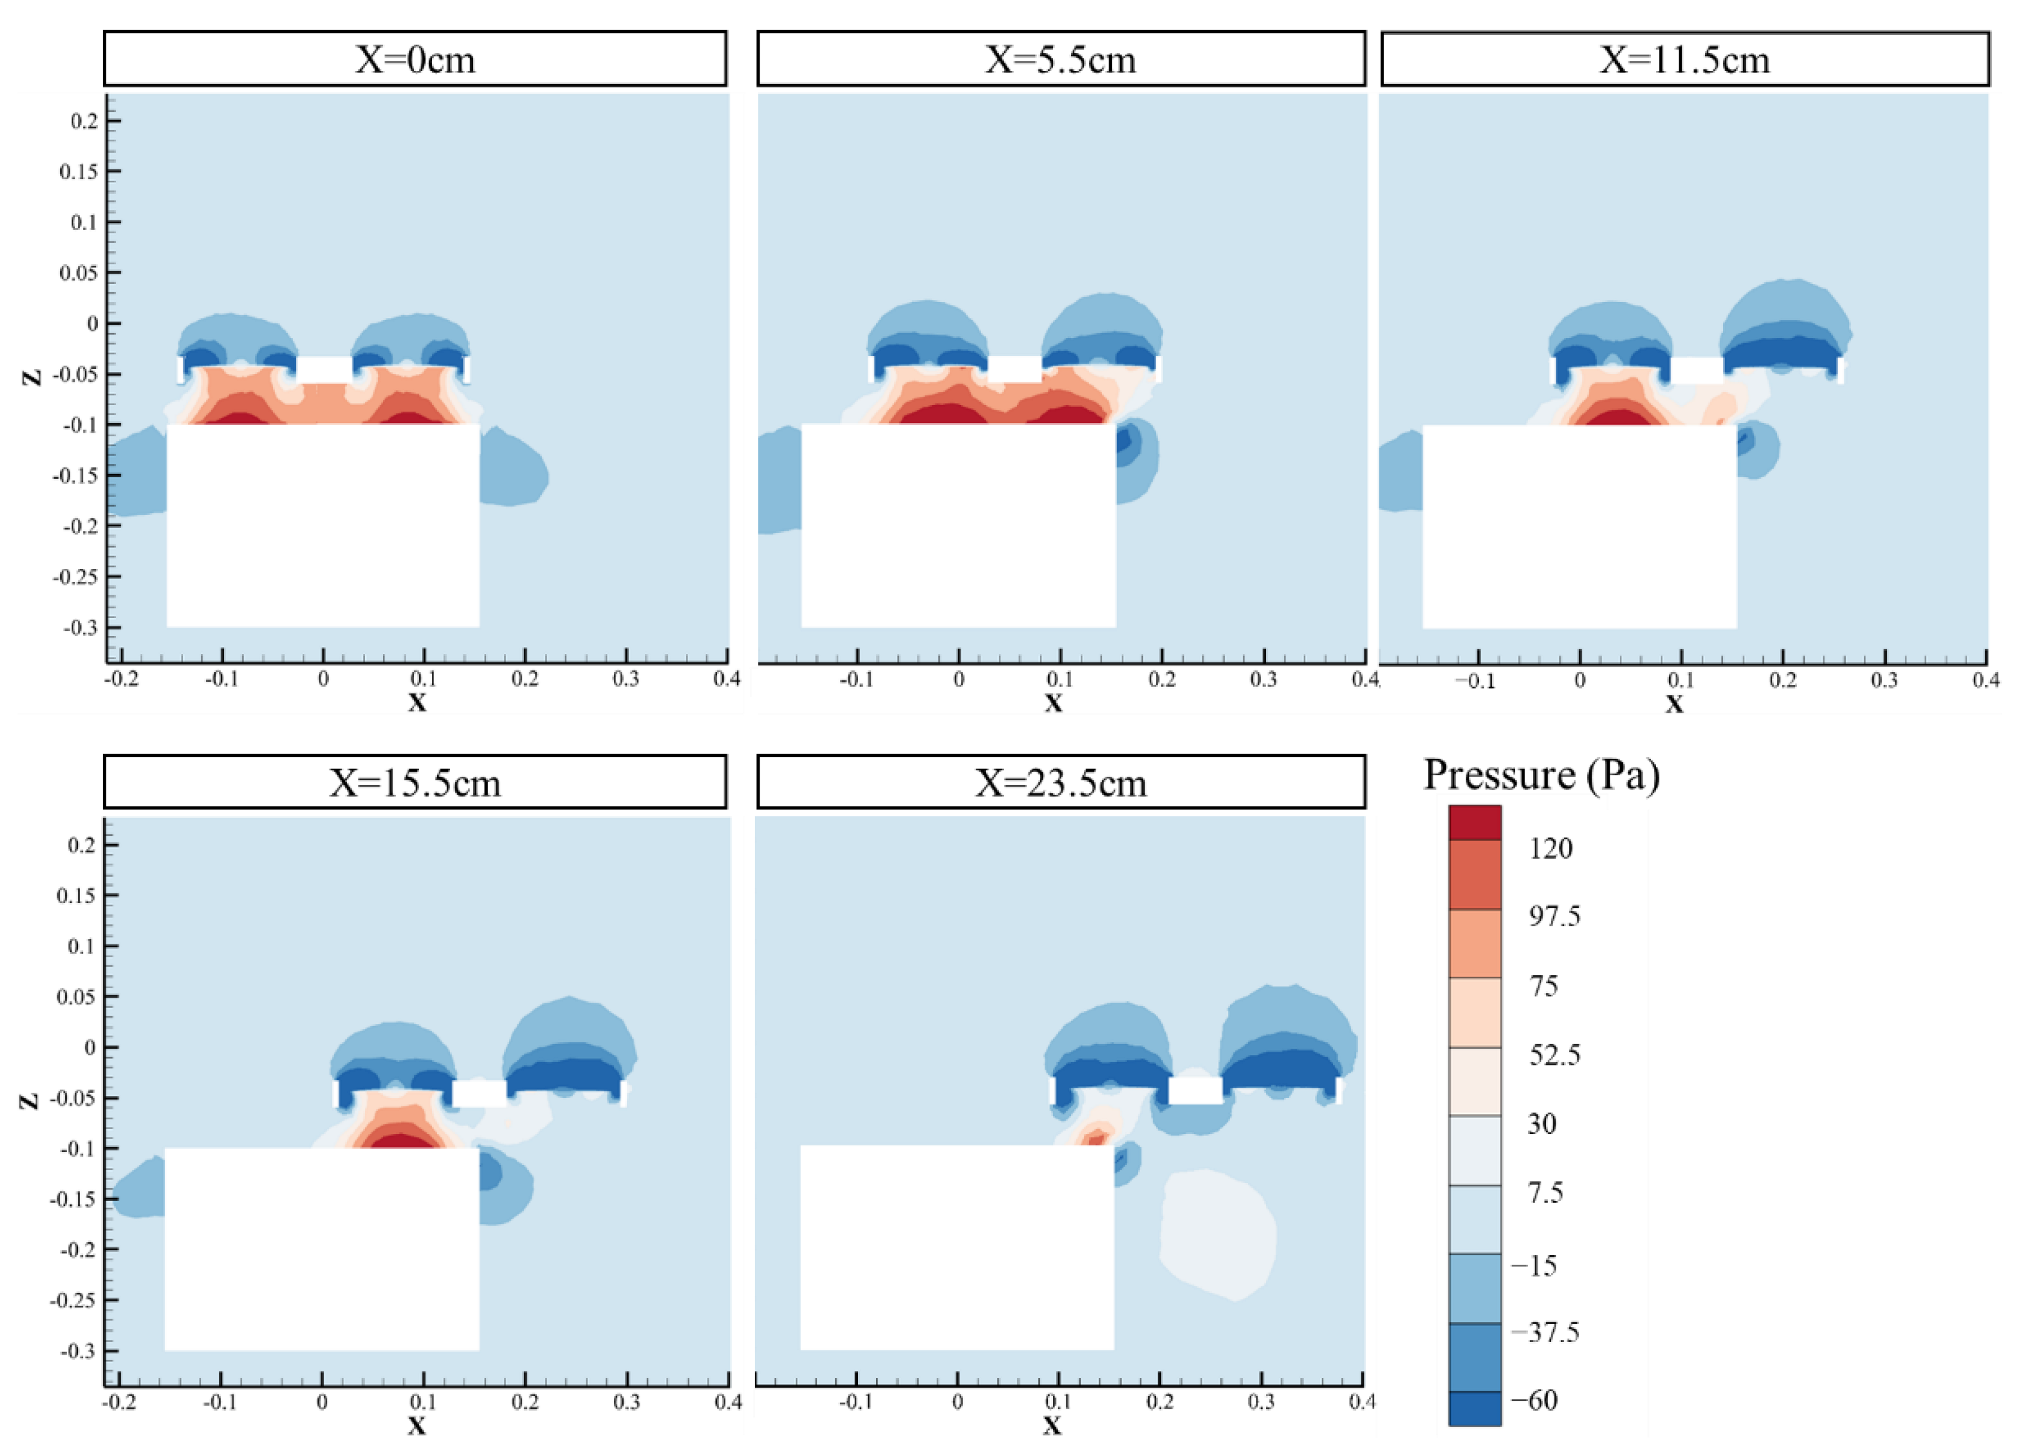
3.1.1. The Interference Area above the Body

The disturbance of the parent UAV is described in this section when the child UAV is located above the body. The effect of the parent body and parent rotors on the thrust and power of the child will be discussed respectively.
First, the body of parent UAV increases the lift of the child UAV. The curves in Figure 9 quantify the effect of the parent UAV on the lift of the child UAV. When the rotors of parent UAV do not rotate, it is approximated that only the body works. Under this circumstance, the lift of the child UAV changes dramatically to the height, which approximates exponential law. When the child UAV is 2 cm above the parent UAV body (H = 2 cm), the lift of the child UAV increases by 27.4%. The simulation results show that the “limited ground effect” of the body can be ignored at the position of H = 21 cm (4.02 times Rc).
Second, the rotors of parent UAV reduce the lift of the child UAV. It also can be seen from the curve of the child UAV lift with the parent rotors in Figure 9. The effect of the parent rotor on the lift of the child UAV increases and then decreases with the increase in relative height. The lift of the child UAV is reduced by 3.5% at a relative height of 2 cm. At a height of 21 cm (4.02 times Rc), the rotor downwash effect reaches its maximum, with a lift loss of about 10%.
According to the influence intensity of the parent body and the parent rotors, the rotor dominant area and the body dominant area are divided. Figure 10 shows the influence extent of the interference area above the body. Red represents the area where the lift of the child UAV increases, and blue represents the area where the lift decreases. It also means that in the blue area, the role of the parent-rotors is stronger than the role of the parent body, and in the red area, the role of the body is dominant. H1, H2, and H3 are characteristic heights corresponding to those marked in Figure 9.
This paper also compares the law of the child UAV power under undisturbed conditions and disturbed conditions by the parent UAV rotors, as shown in Figure 11. Affected by the body of the parent UAV, the efficiency of rotors will increase. This is attributed to the fact that ground effects can significantly reduce the induced power and the profiling power is almost unaffected which is similar to the previous conclusion [21]. Affected by the rotation of the parent UAV rotors, the power of the child UAV will be reduced in some degree under the same rotation speed of the child UAV, but the reduction of pulling force is greater than the reduction of power. The reduction of the rotor power of the child UAV is due to the reduction of the profile power, which is greater than the increase in the induced power. Therefore, in the case of the same pulling force of the child UAV, the total power required will be larger due to the influence of the downwash.

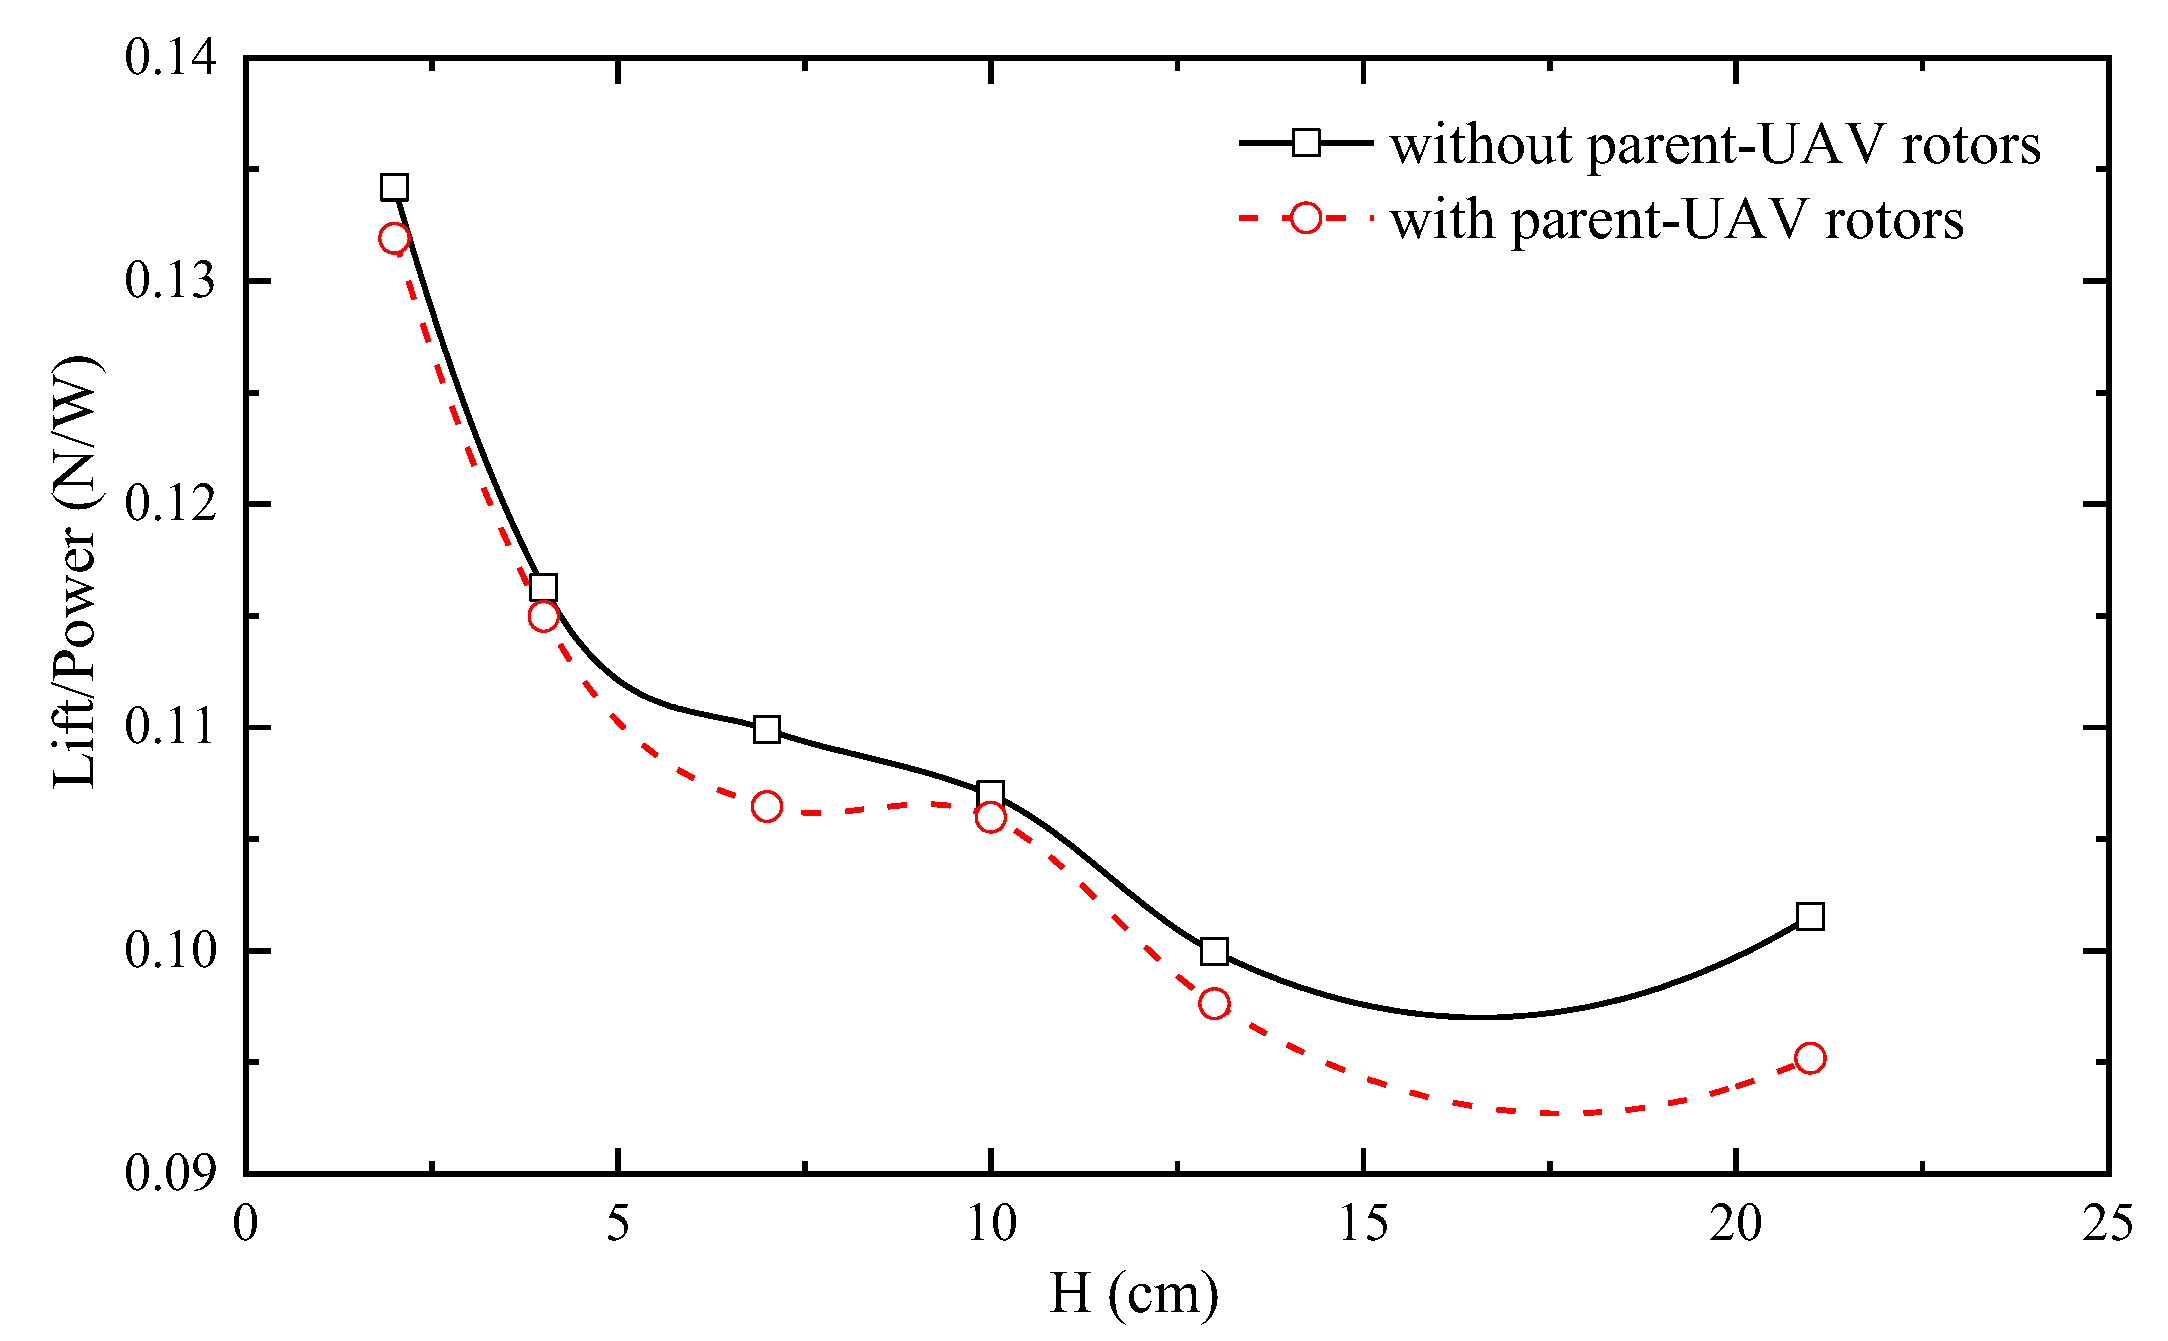
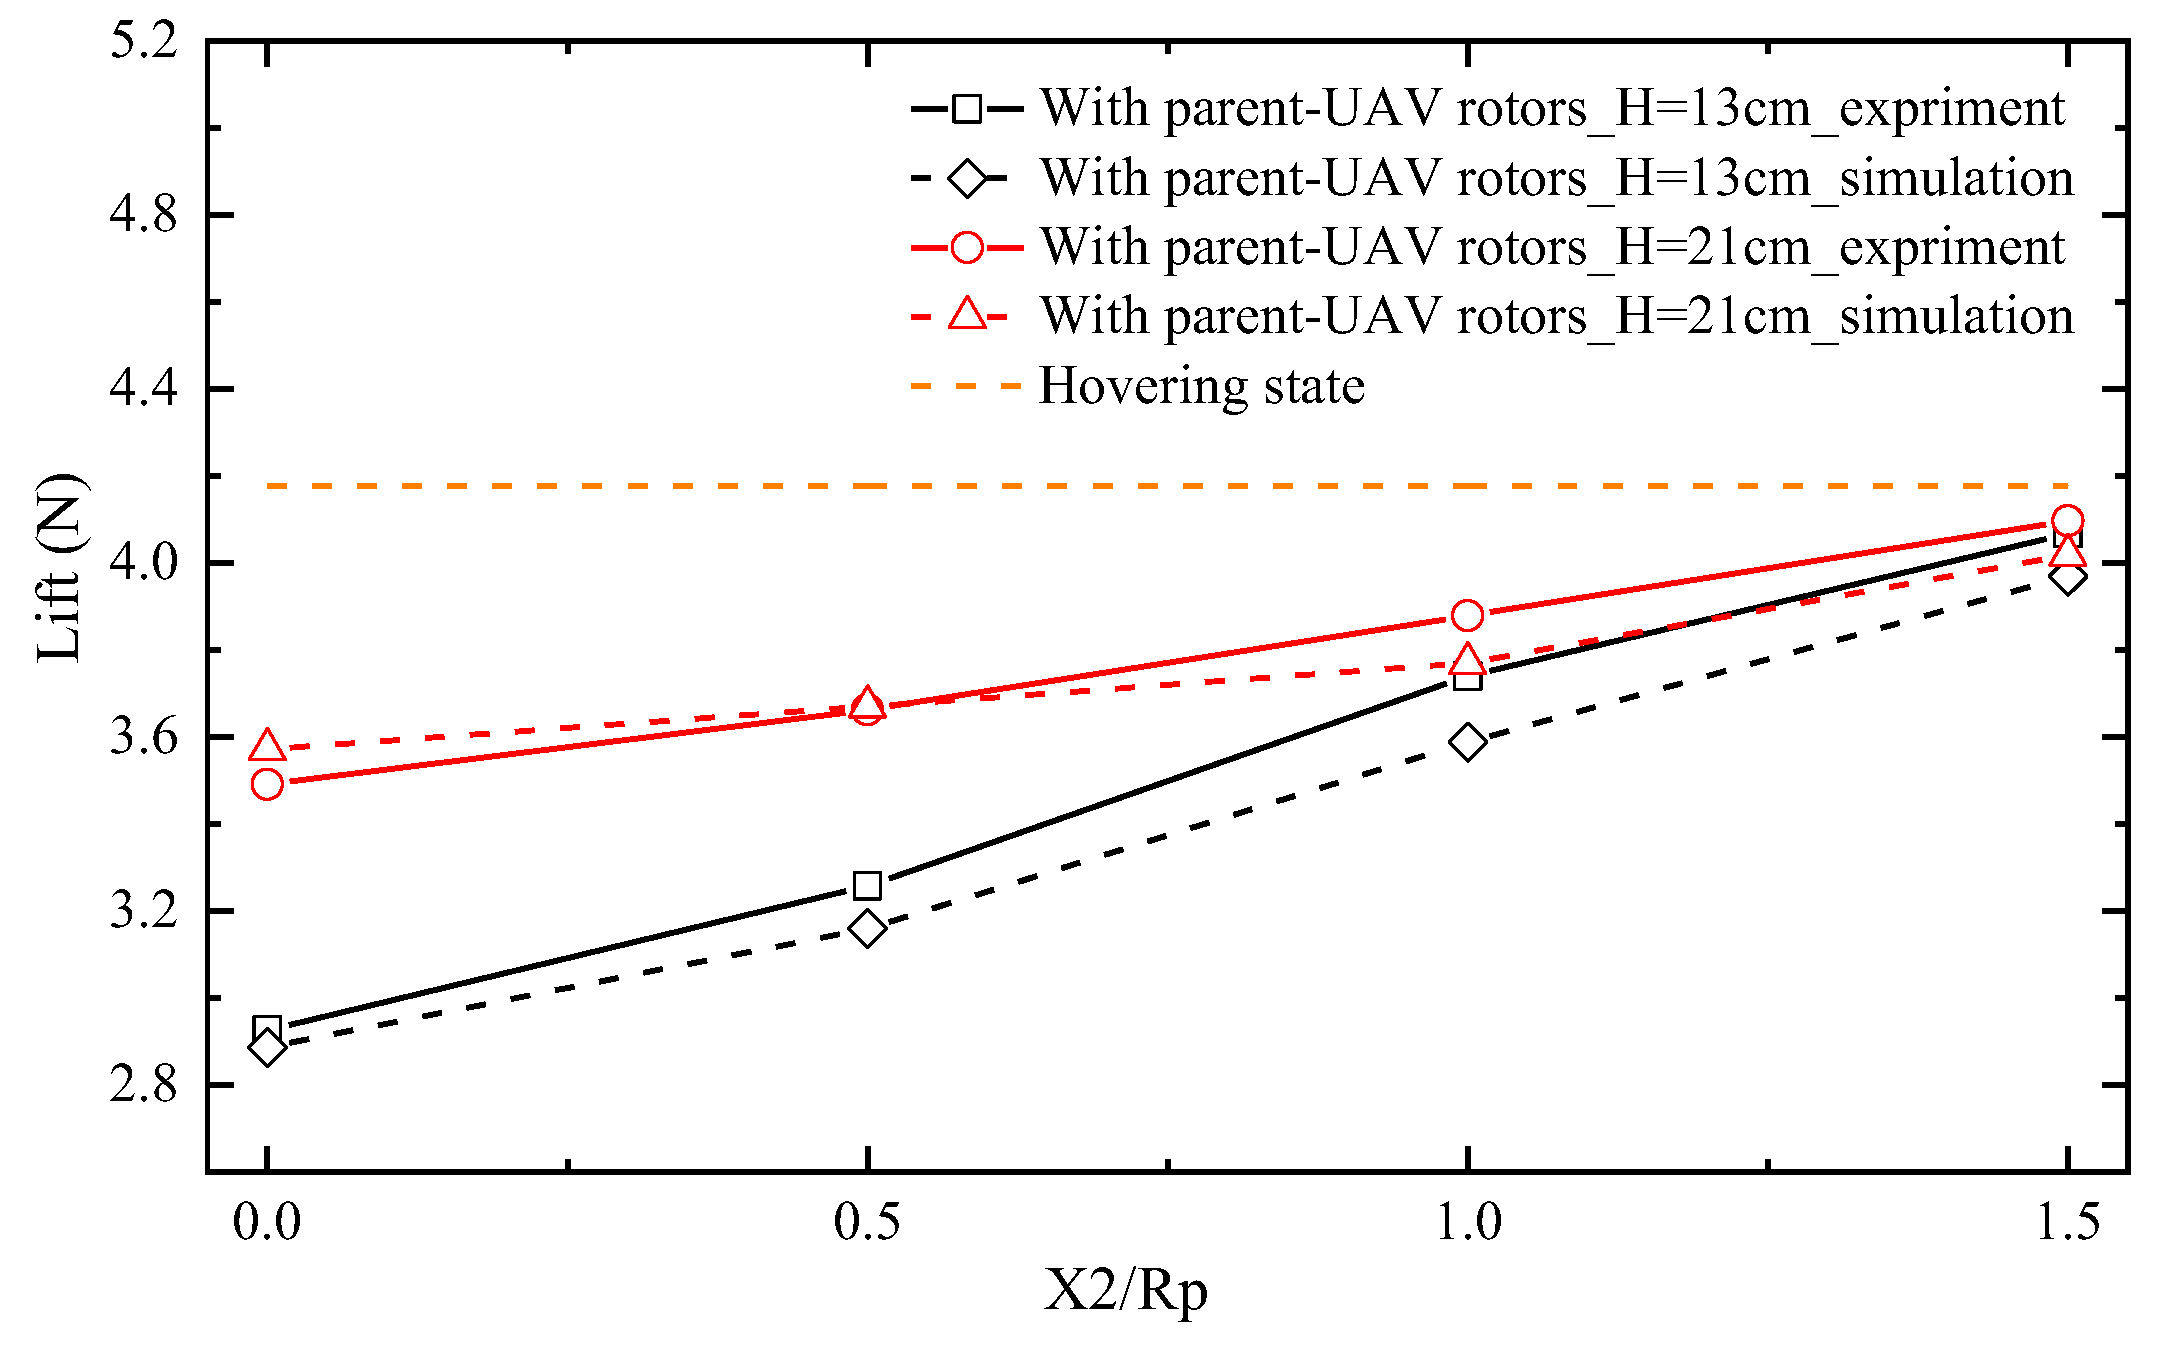
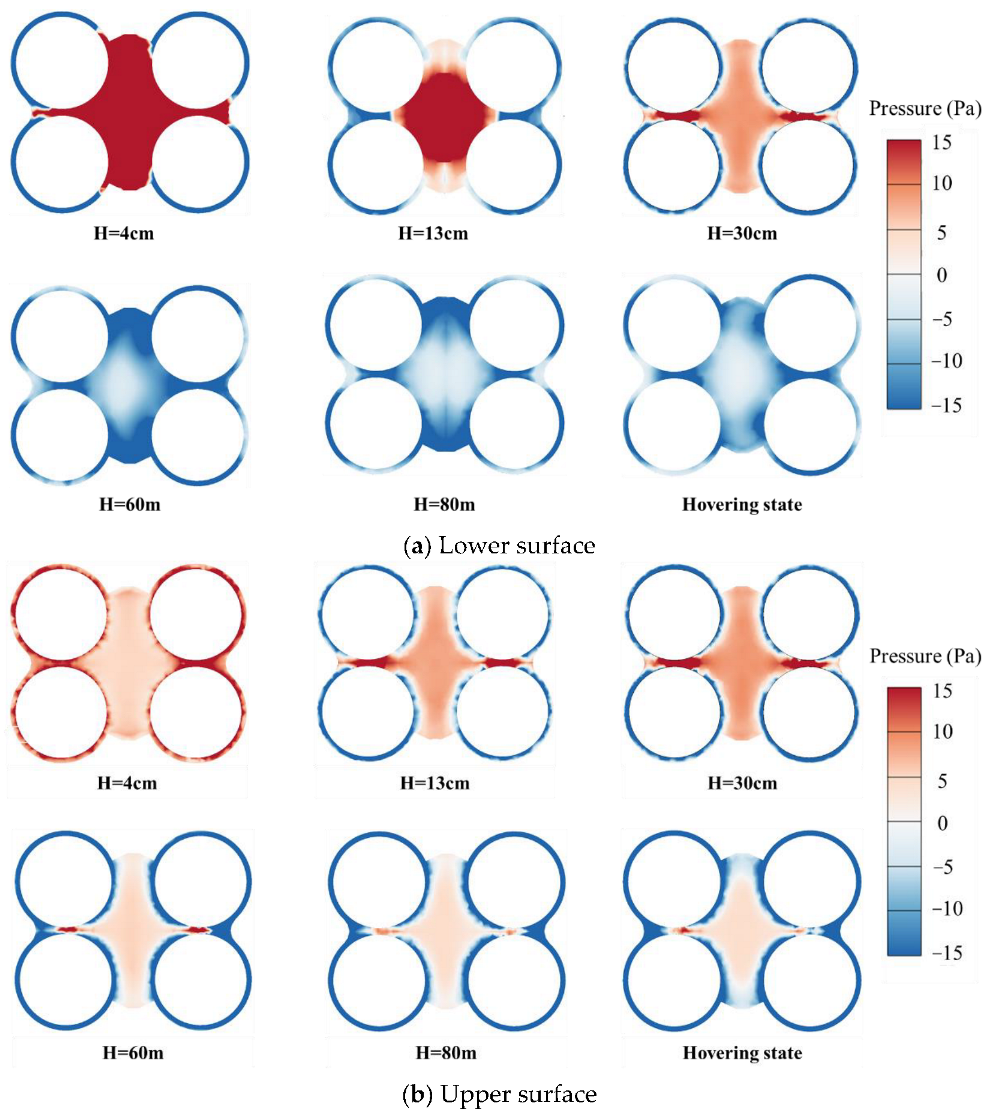
3.1.2. The Interference Area above Rotors

When the child UAV is located right above the parent UAV rotors, it is mainly affected by the rotors. The pressure below the child UAV is lower than that above, reducing the lift of the child UAV.
Figure 12 shows the lift curve of the child UAV in the interference area above a parent-rotor. The lift of the child UAV decreases rapidly with the increase in relative height. In this study, the maximum loss of lift is about 31%, corresponding to a relative height of 13 cm. When H = 106 cm (4.64 times Rp), the effect of downwash flow on the lift is less than 3.5%. The simulation results are in good agreement with the experimental results, with an error of less than 10%.
Different from the drastic reduction in lift, the power reduction of the child UAV at different relative heights is less than 5%. The lift/power of the child UAV in this interference area as shown in Figure 13. The power results in this research are measured from the experiment. It means that the child UAV needs more power to maintain flight in this interference area. The influence extent of the interference area above a rotor is shown in Figure 14.

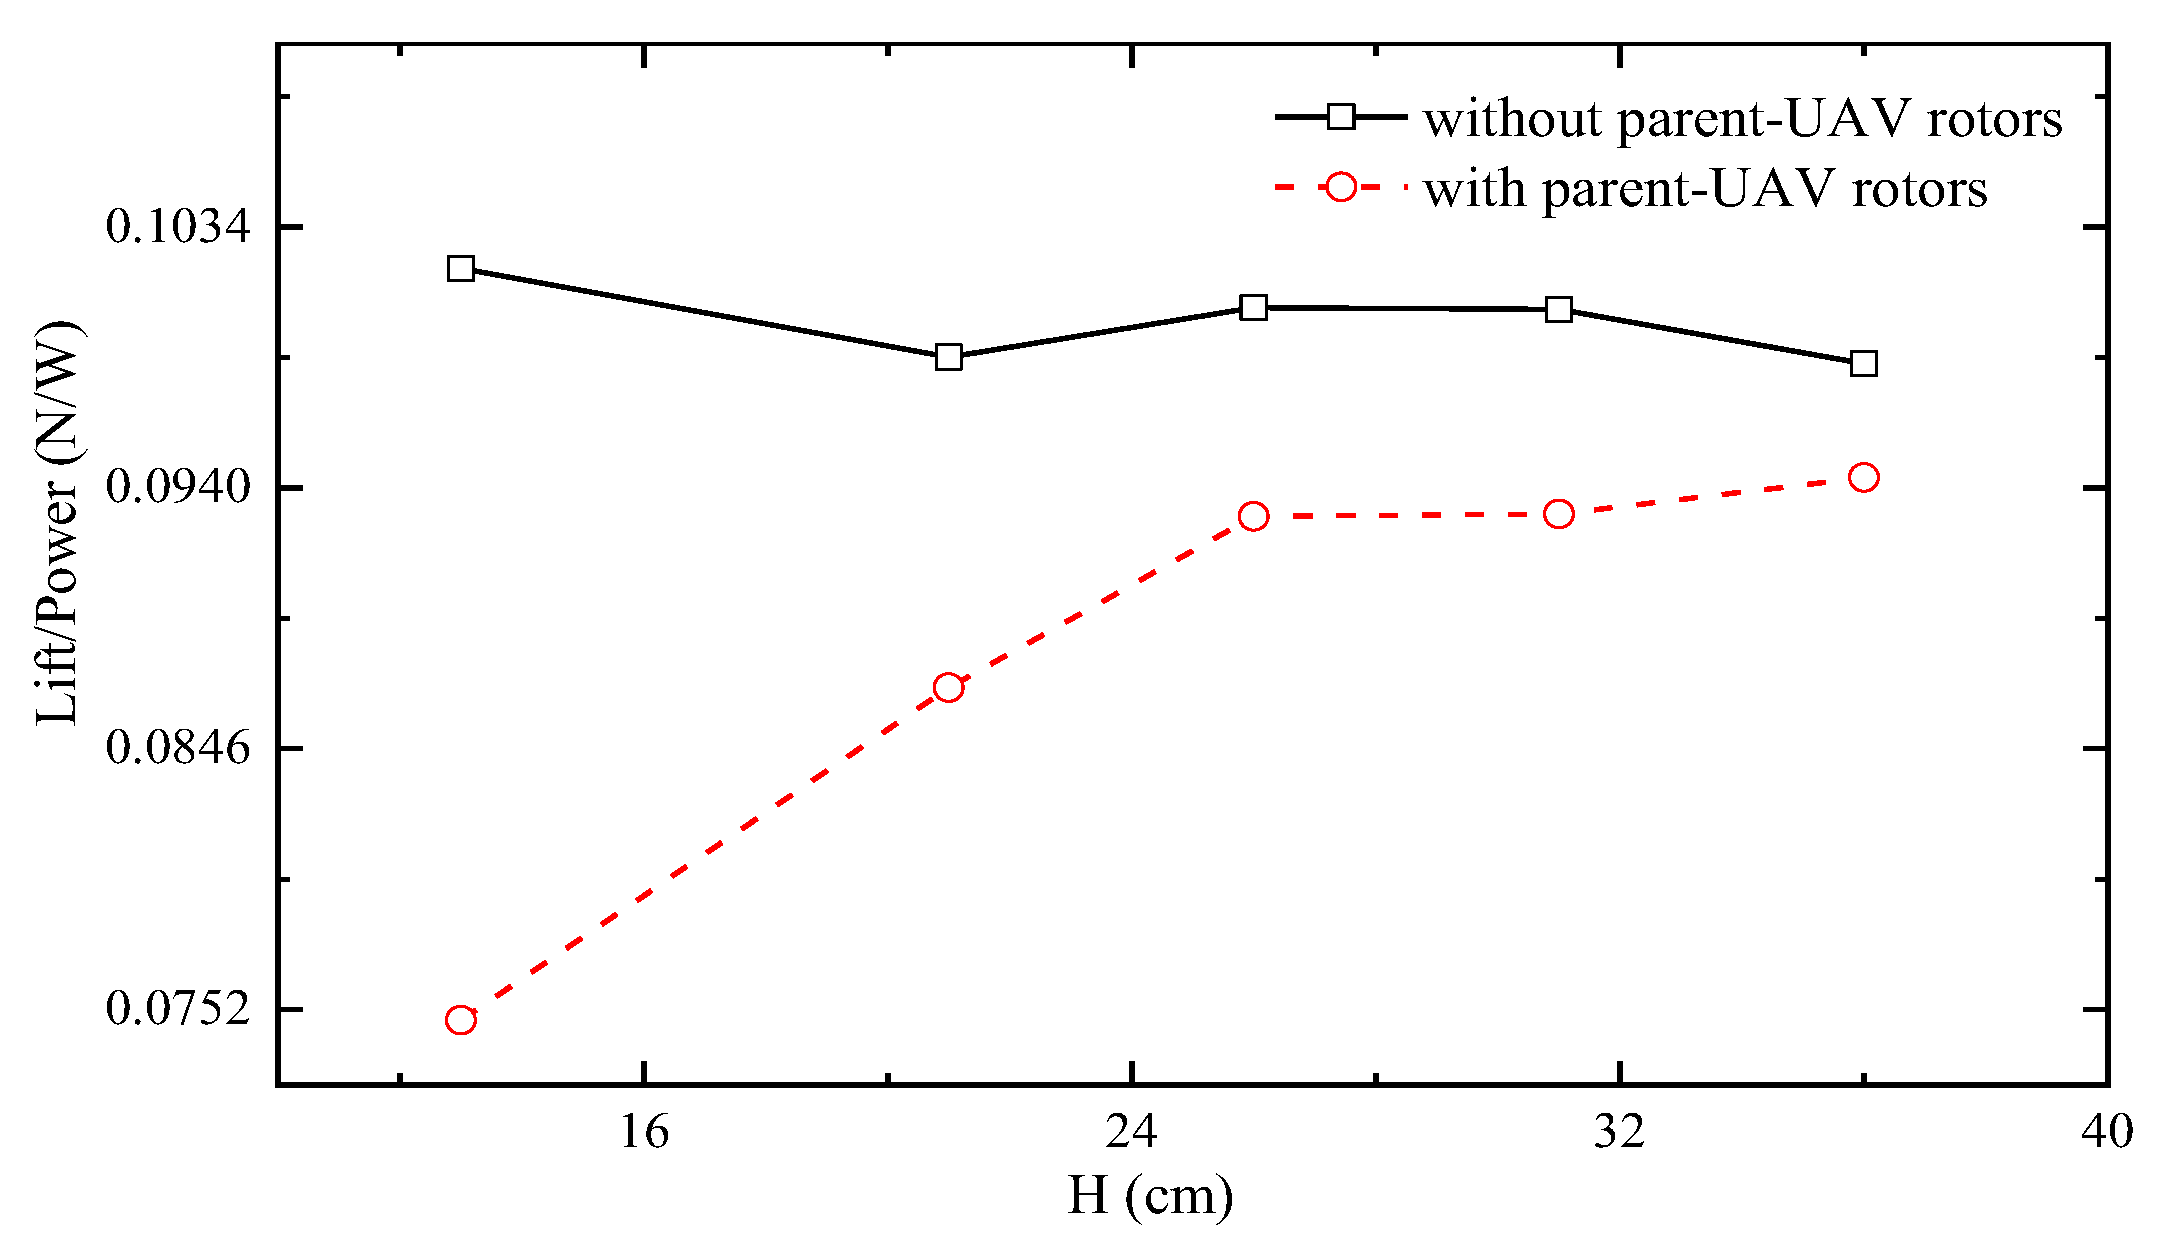
3.1.3. The Transition Area

The transition area includes the body-outside transition area and the rotor-outside transition area. This section mainly studies the impact when the child UAV horizontal direction changes. The force characteristics of the transition area can clearly reflect the joint action of the body and rotors of parent UAV. In the following study, the aerodynamic characteristics of the child UAV moving outward along the X-direction are studied.
When the projection of the child UAV on the body of parent UAV gradually decreases, the lift changes most obviously, as shown in Figure 15. In this interference area, the flow field is asymmetric. Both the suction of the nearby parent UAV rotor and the parent UAV body cause a lateral moment towards the nearby rotor, which will increase as the child UAV moves outward. The lift and lateral moment change insignificantly beyond the body dominant area, as shown in Figure 16.
When the child UAV moves from the center of the parent UAV rotor to the outside, the effect of the downwash flow on lift decreases approximately linearly. The lift gradient increases as the relative height decreases as shown in Figure 17. Due to the suction effect by the nearby parent UAV rotor, the child UAV is subjected to a significant lateral moment, as shown in Figure 18, and this lateral moment will increase first and then decrease with distance. The asymmetric lateral moment reaches the maximum when the child UAV is located at the tip of the rotor of parent UAV, which may pose a threat to the flight safety. According to the interference extent in the transition aera, the influence extents are shown in Figure 19.

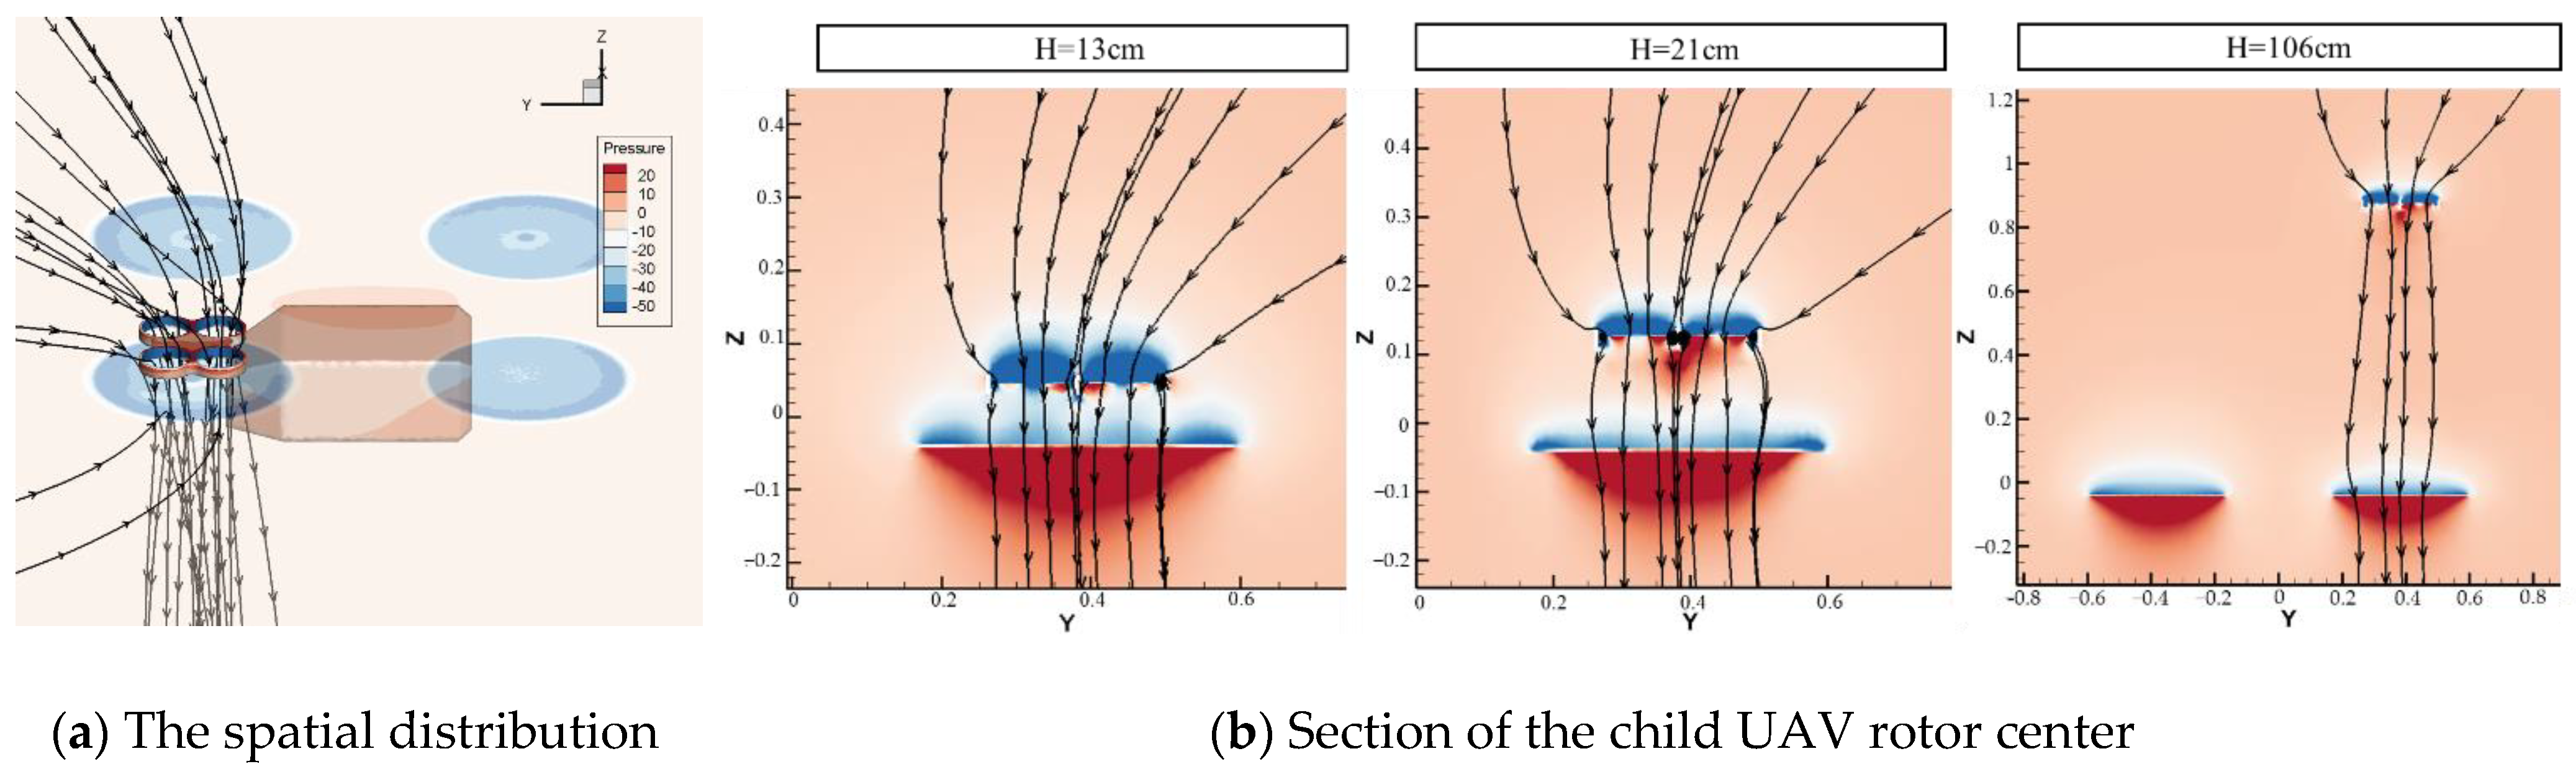
3.2. Mechanism Analysis of Aerodynamic Interference

The following describes the influence mechanism of the body and rotors by means of CFD flow field visualization. When the distance between the child UAV and the body is relatively close, the airflow accelerated by child UAV rotors is blocked by the body, which causes a redirection of the flow, and it becomes parallel to the body. The airflow below the child UAV is squeezed, which leads to a significant pressure increase, as shown in Figure 20. Affected by this, the positive pressure of the child UAV body and rotors increases. The pressure change on the lower surface of the child UAV body is shown in Figure 21a. Therefore, the lift of child UAV becomes larger than hovering state. Meanwhile, due to the limited size of the body, part of the airflow continues to flow downward along the outside of the body, which reduces the pressure above the parent UAV. At the same time, a lower pressure area is formed at the nose and tail of the body. These result in a slight decrease in lift.
The downwash effect of the parent-rotors causes a reduction in lift of both the rotors and the body of the child UAV. On the one hand, according to the blade element theory, the downwash flow increases the induced velocity into the child UAV rotors. The relative angle of attack at the rotors decreases, resulting in a slight lift decrease in the child UAV rotor. On the other hand, the downwash acts on the upper surface of the child UAV, which increases the pressure on the upper, thus forming a negative lift.
The pressure on the upper surface of the child-body increases with height and then decreases, as shown in the Figure 21b. The pressure on the upper surface is combined by the downwash of the rotors and the pressurization of the body. When the child UAV is closer to the parent-body, due to the shading of the parent-body, the pressure around the child UAV is large, blocking the influence of the downwash. As a result, the pressure on the upper surface is slightly higher than the pressure in the hovering state. As the relative height of the child UAV and the parent UAV increases, the impact of the parent-body drops dramatically, and the downwash effect of the parent-rotors is enhanced, resulting in a gradual increase in the pressure on the upper surface of the child UAV. With the relative height continues to increase, the influence of the rotors of parent UAV gradually decreases until it is close to the no-interference state.
When the child UAV is above the rotor of the parent UAV, the airflow accelerated by the child UAV rotors pass through the parent UAV rotor, which changes the pressure distribution of the parent UAV rotor and reduces the lift of the parent UAV rotor, as can be seen in Figure 22. The influence of the upper rotor on the lower rotor has been studied in the research on coaxial rotors [31].
As the child UAV moves to the outside in body-outside transition area, the wake also gradually moves to the outside. The wake has been fully developed in the hovering state. The change in pressure distribution under the child UAV during the movement of the child UAV is shown in Figure 23. On the one hand, the body effect of parent UAV is obviously weakened. The airflow passing through the child UAV propellers is more likely to bypass the body of the parent UAV and flow downward, so that the pressure below is reduced. On the other hand, the “downwash effect” caused by parent UAV rotors is strengthened. The increase in the downward velocity above the child UAV not only increases the pressure on the upper surface, but it also causes the induced power of child UAV rotors to gradually become larger. The reduced “body effect” and the increased “rotor effect” lead to a continuous lift reduction of the child UAV. Paz’s research on the process of UAV flying over obstacles has similar conclusions, pointing out that this process has a considerable impact on the flight stability [18].

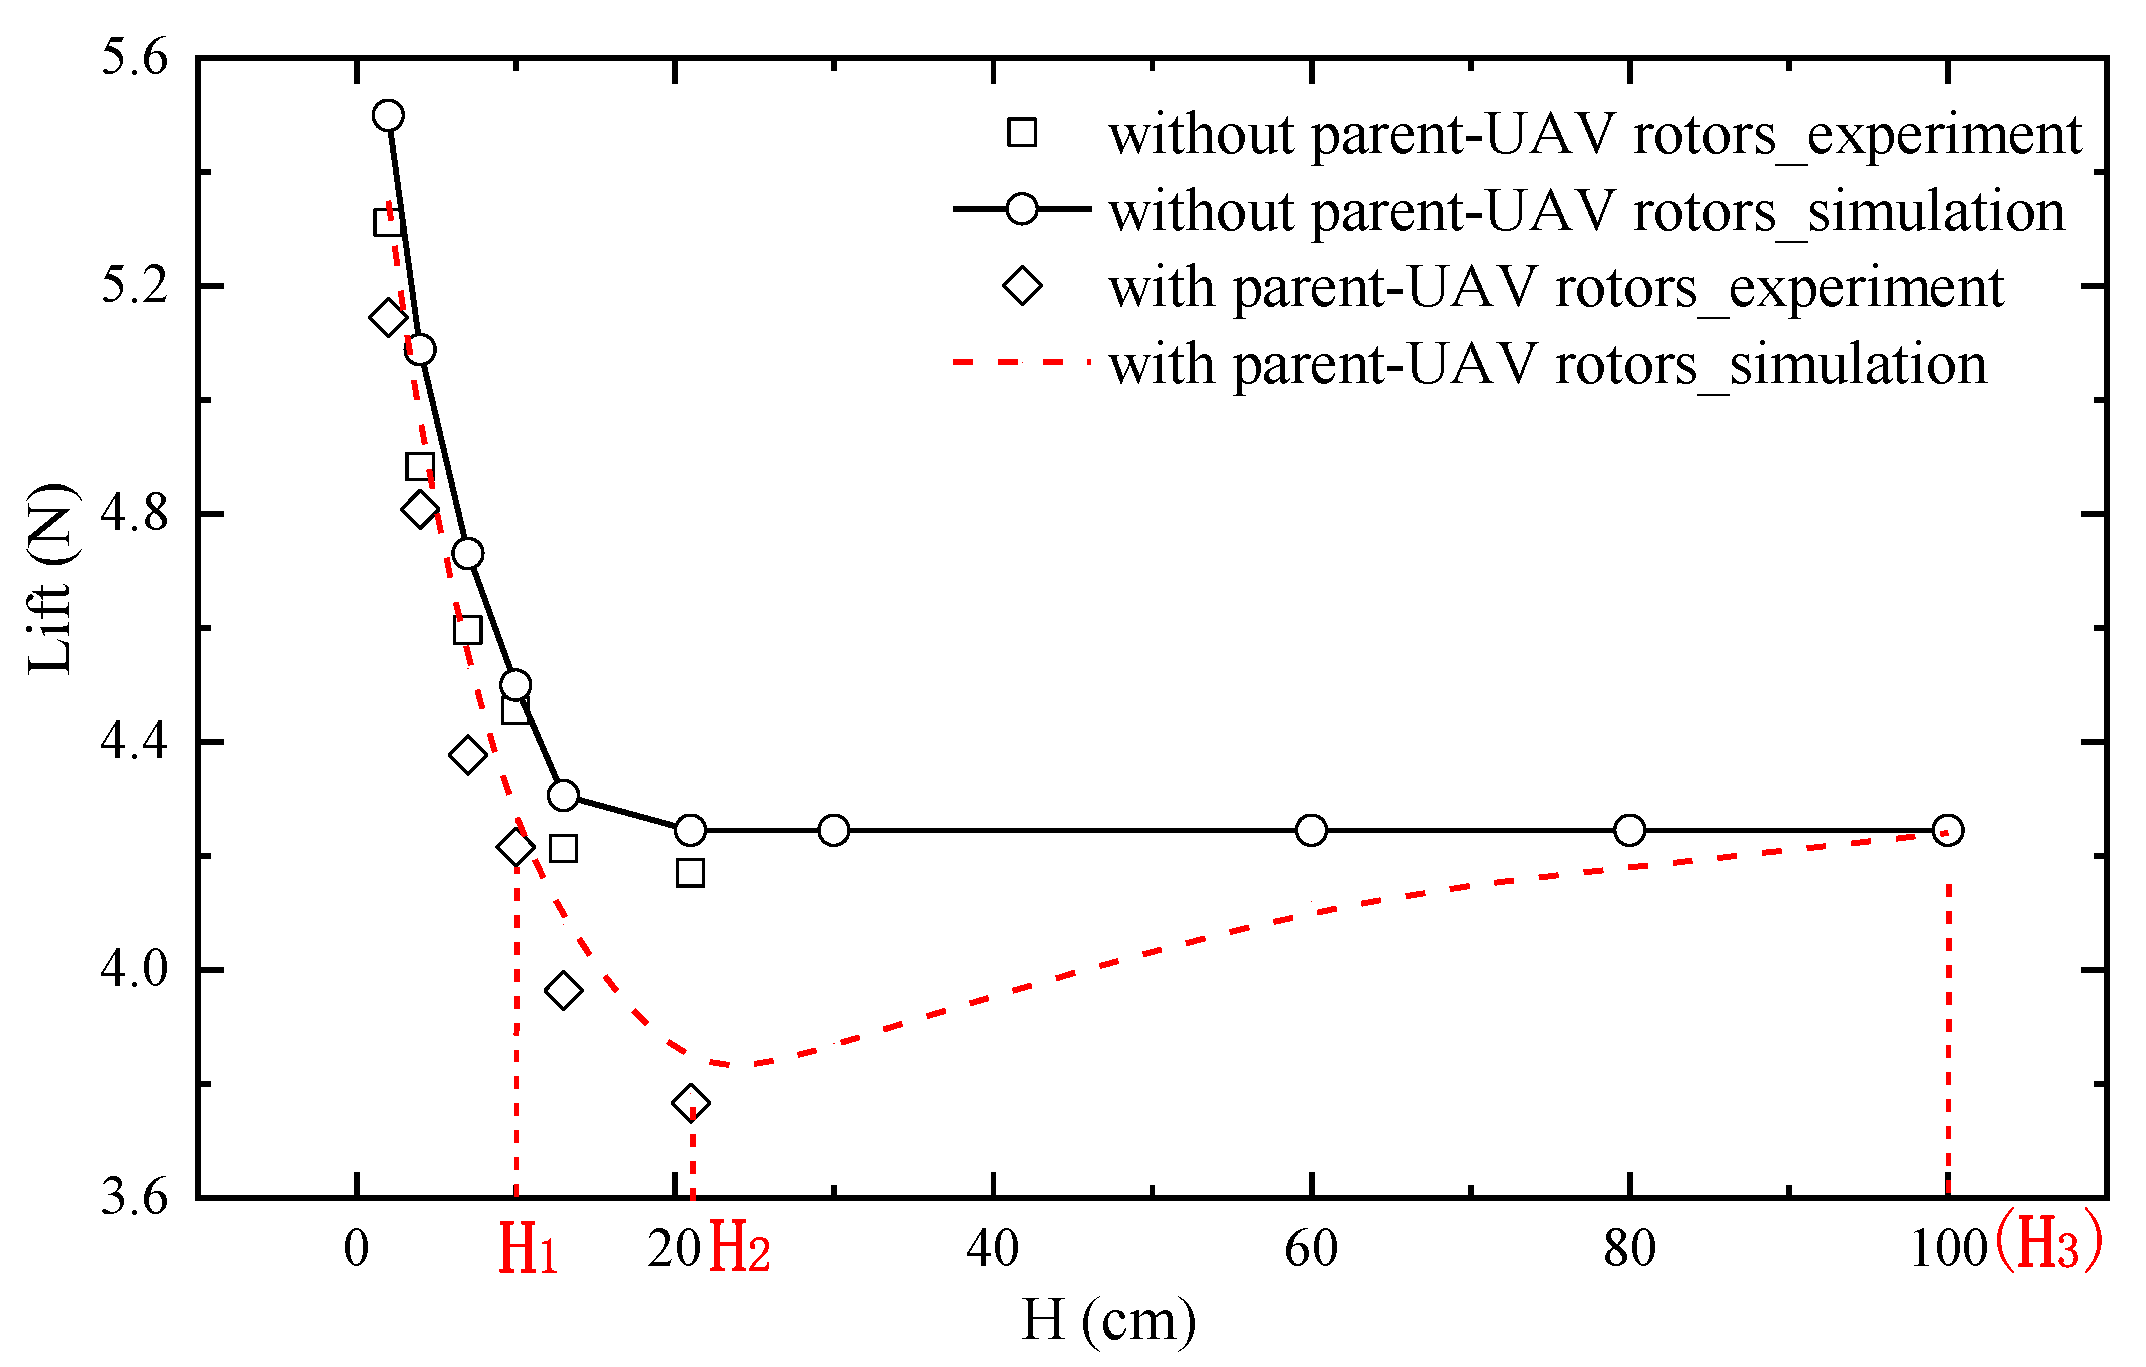
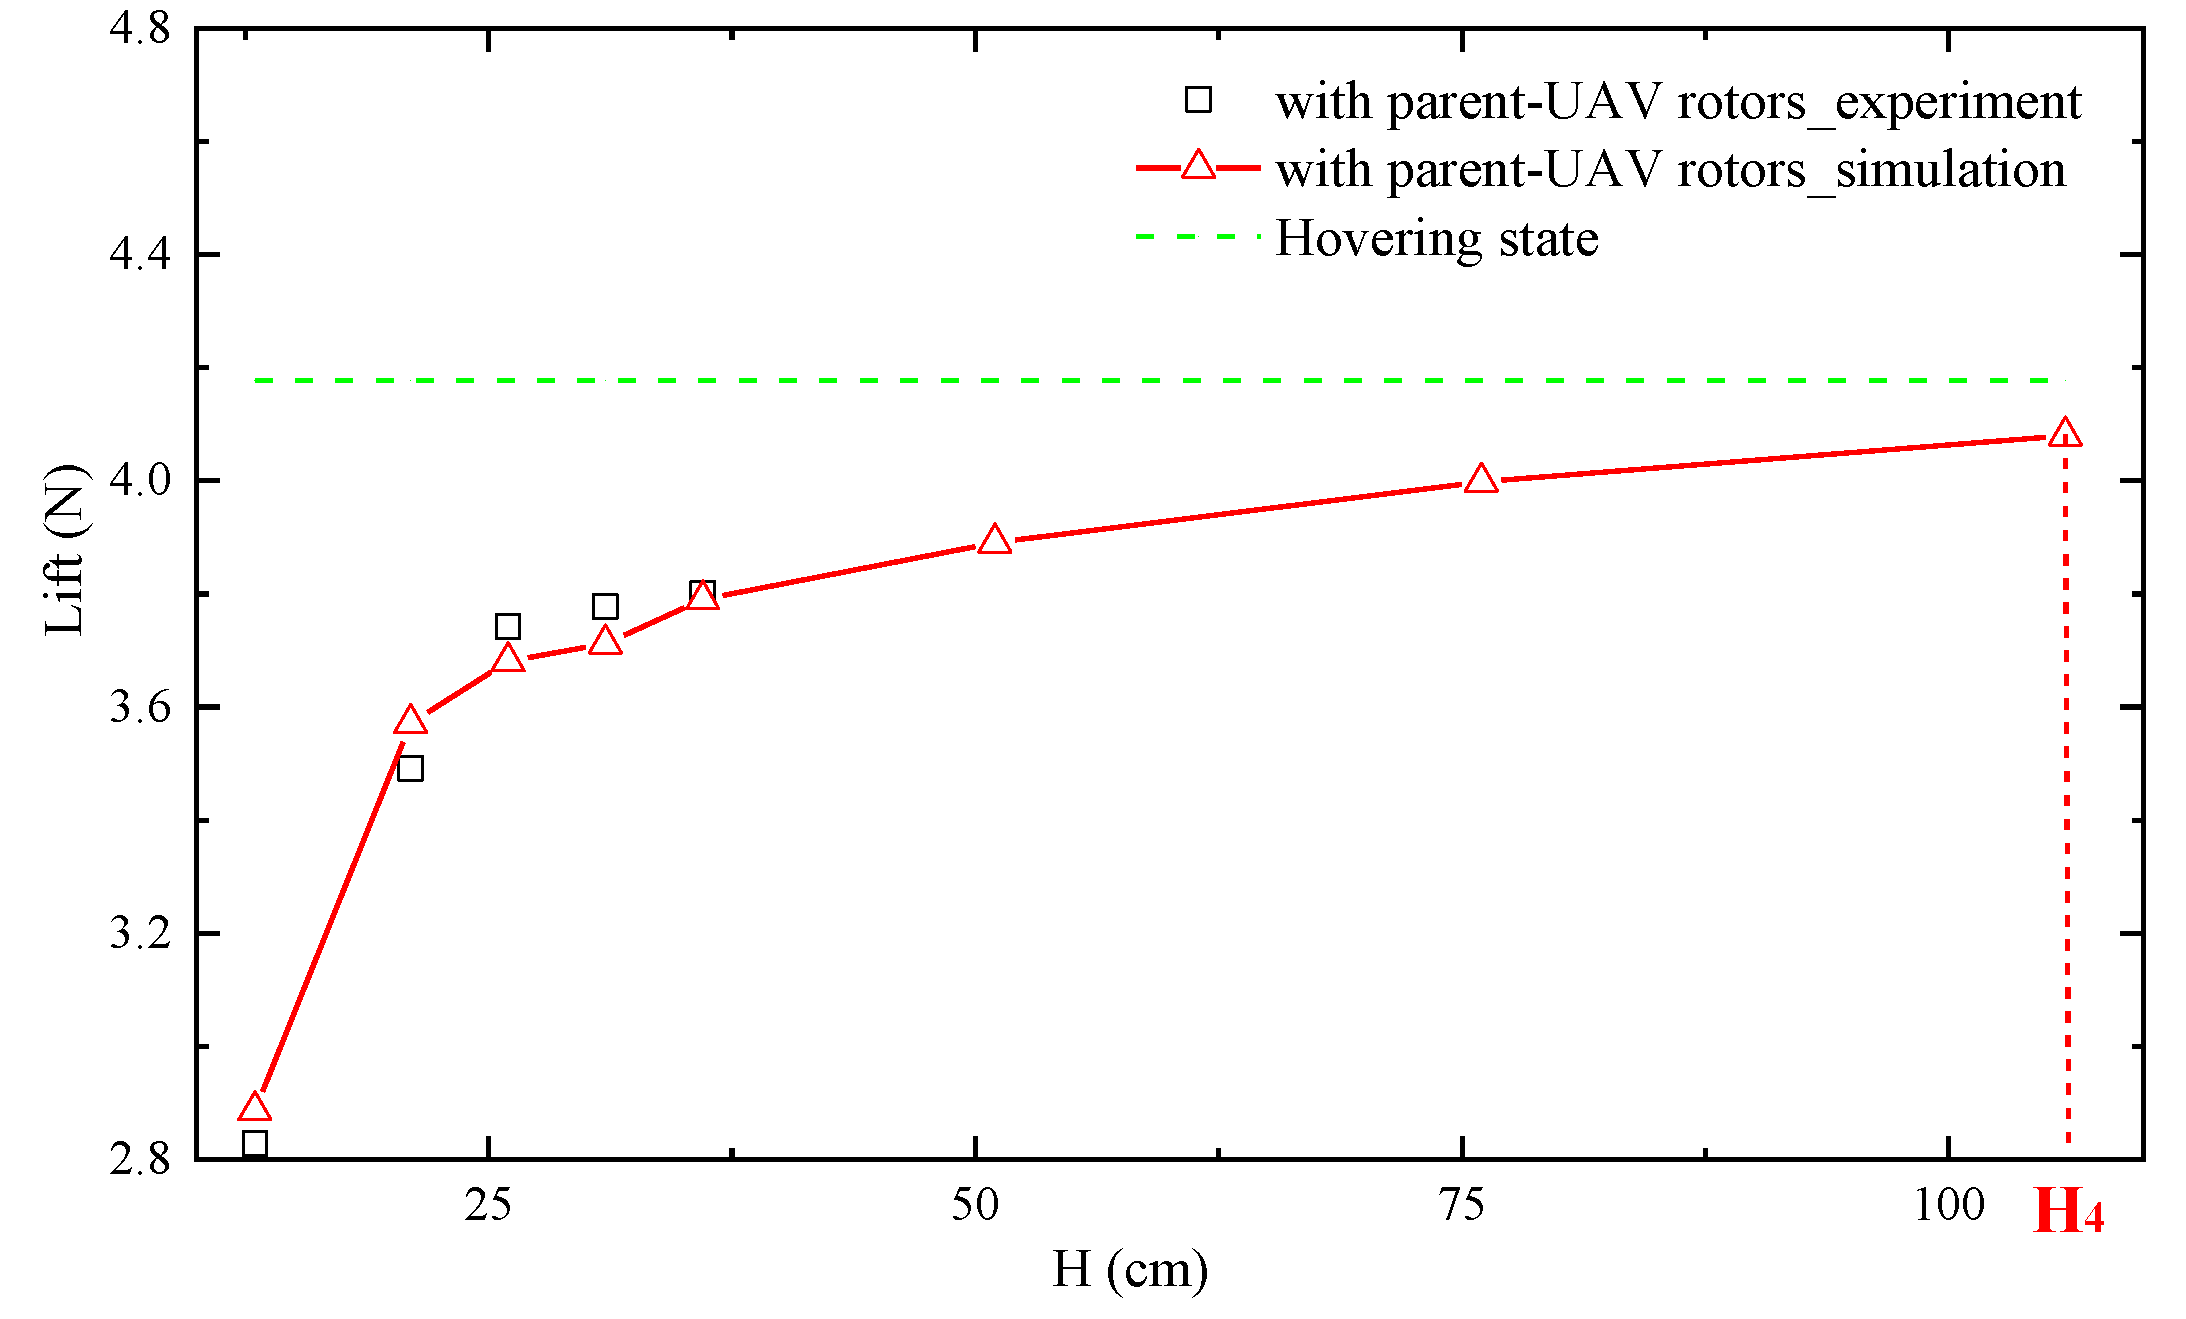
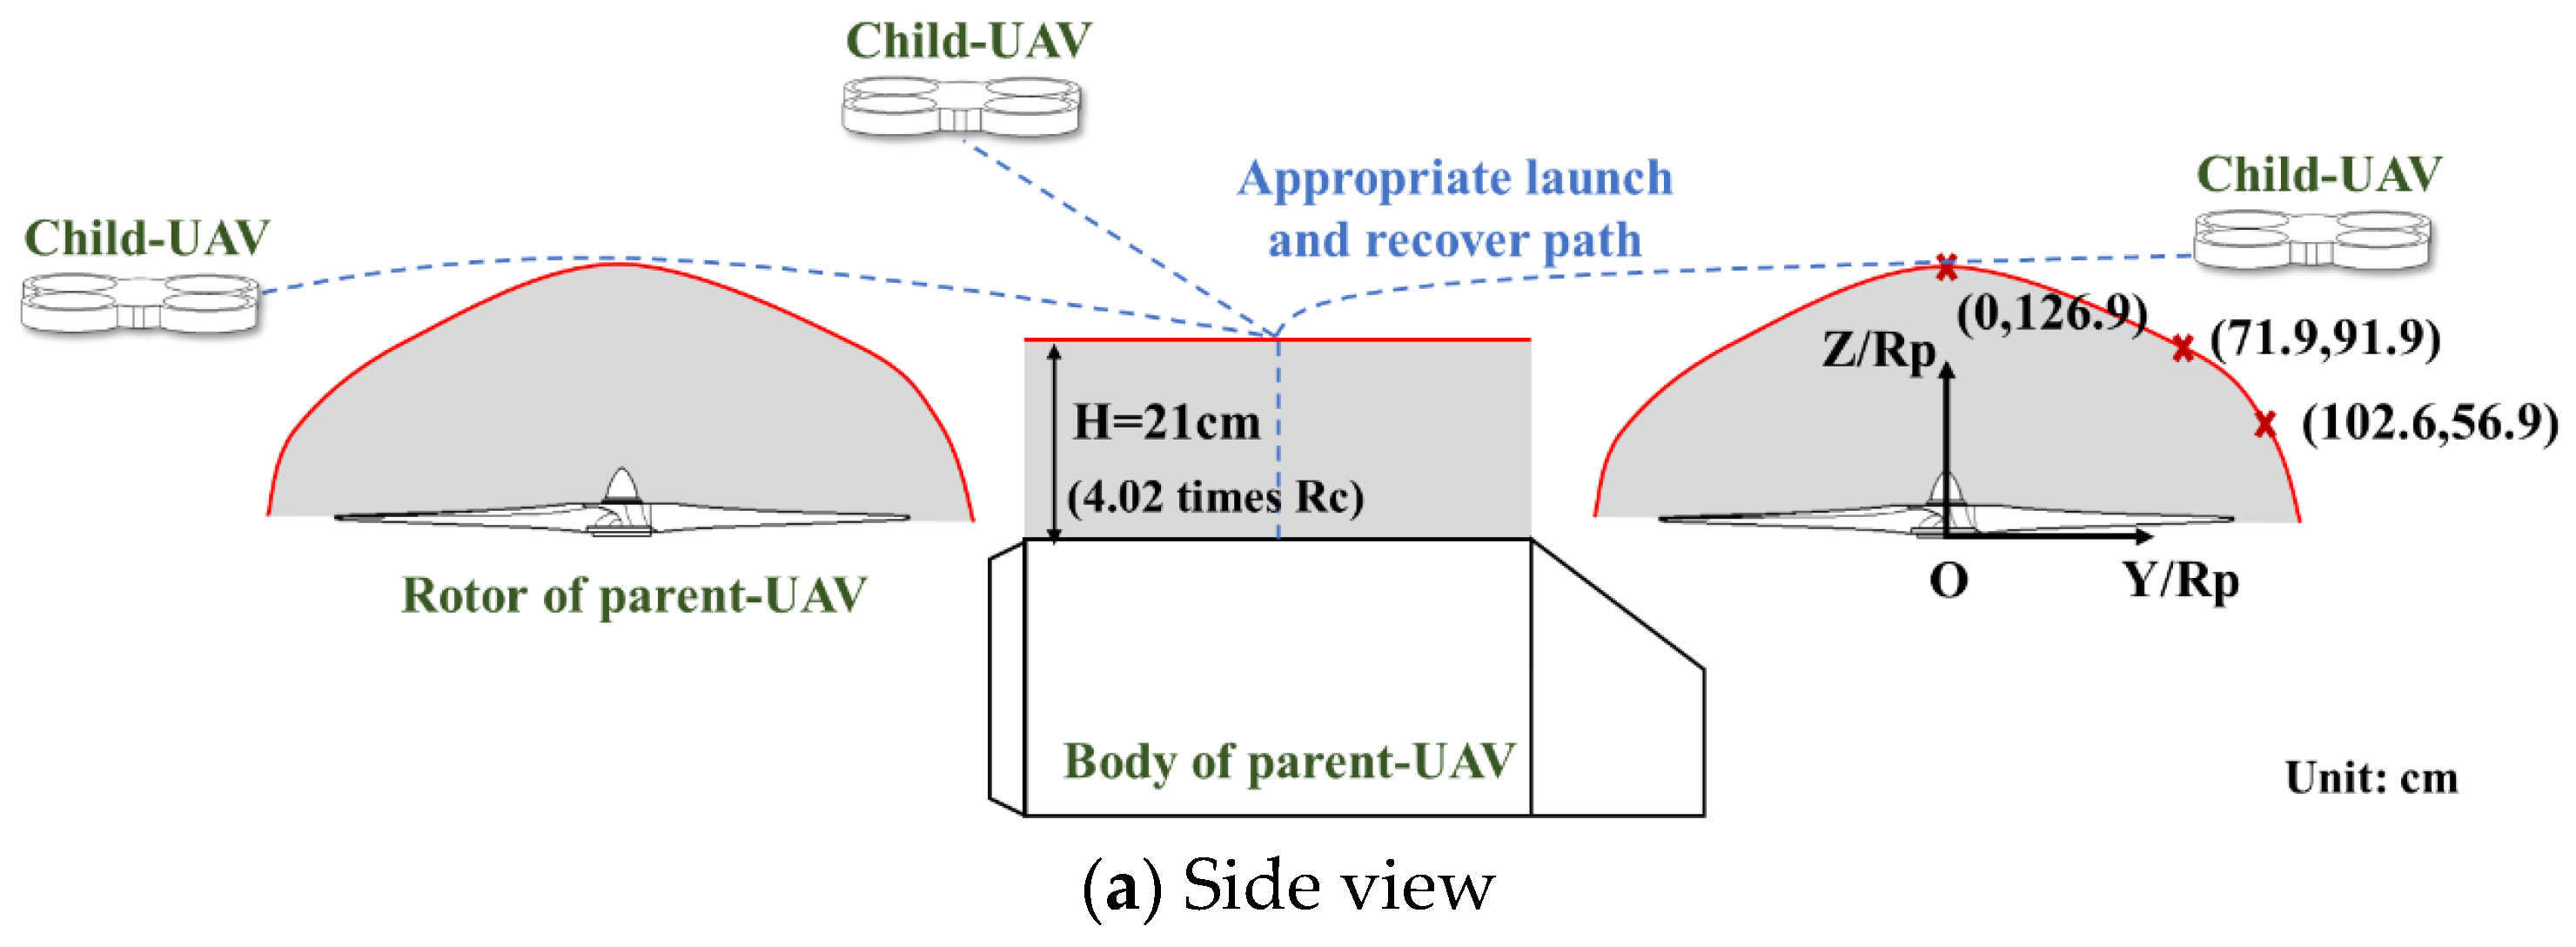
3.3. Analysis of the Safe Flight Boundary of the Child UAV

When the child UAV is in a position with a large lift loss or a fast lift change, the stable flight control of the child UAV in the launch and recovery process may be challenged. In this paper, we define a dimensionless parameter γ to describe the rate of change in the lift with position, γ = d L · R c / d x · G , where d L / d x is the rate of lift change in the child UAV over the flight path, R c is the rotor radius of child UAV, and G is the weight of the child UAV. The lift loss <10% and γ < 0.3   are used as indicators to plan the safe flight boundary for the child UAV. This boundary is the minimum flight distance for the child UAV to be safely launched and recovered.
In the interference area above the body, when H < 6 cm, the disturbed lift of the child UAV is greater than 10% of the hovering lift. However, when H < 21 cm, the lift of the child UAV changes rapidly, which has a significant effect on flight safety. The lift of the interference area around the rotor is interpolated while ignoring the influence of the body of parent UAV, and the safe flight boundary near the rotor is obtained. These areas should be avoided as much as possible during the launch and recovery process. The appropriate release and recovery paths and the safe flight boundary are shown in Figure 24.

4. Conclusions

(1)
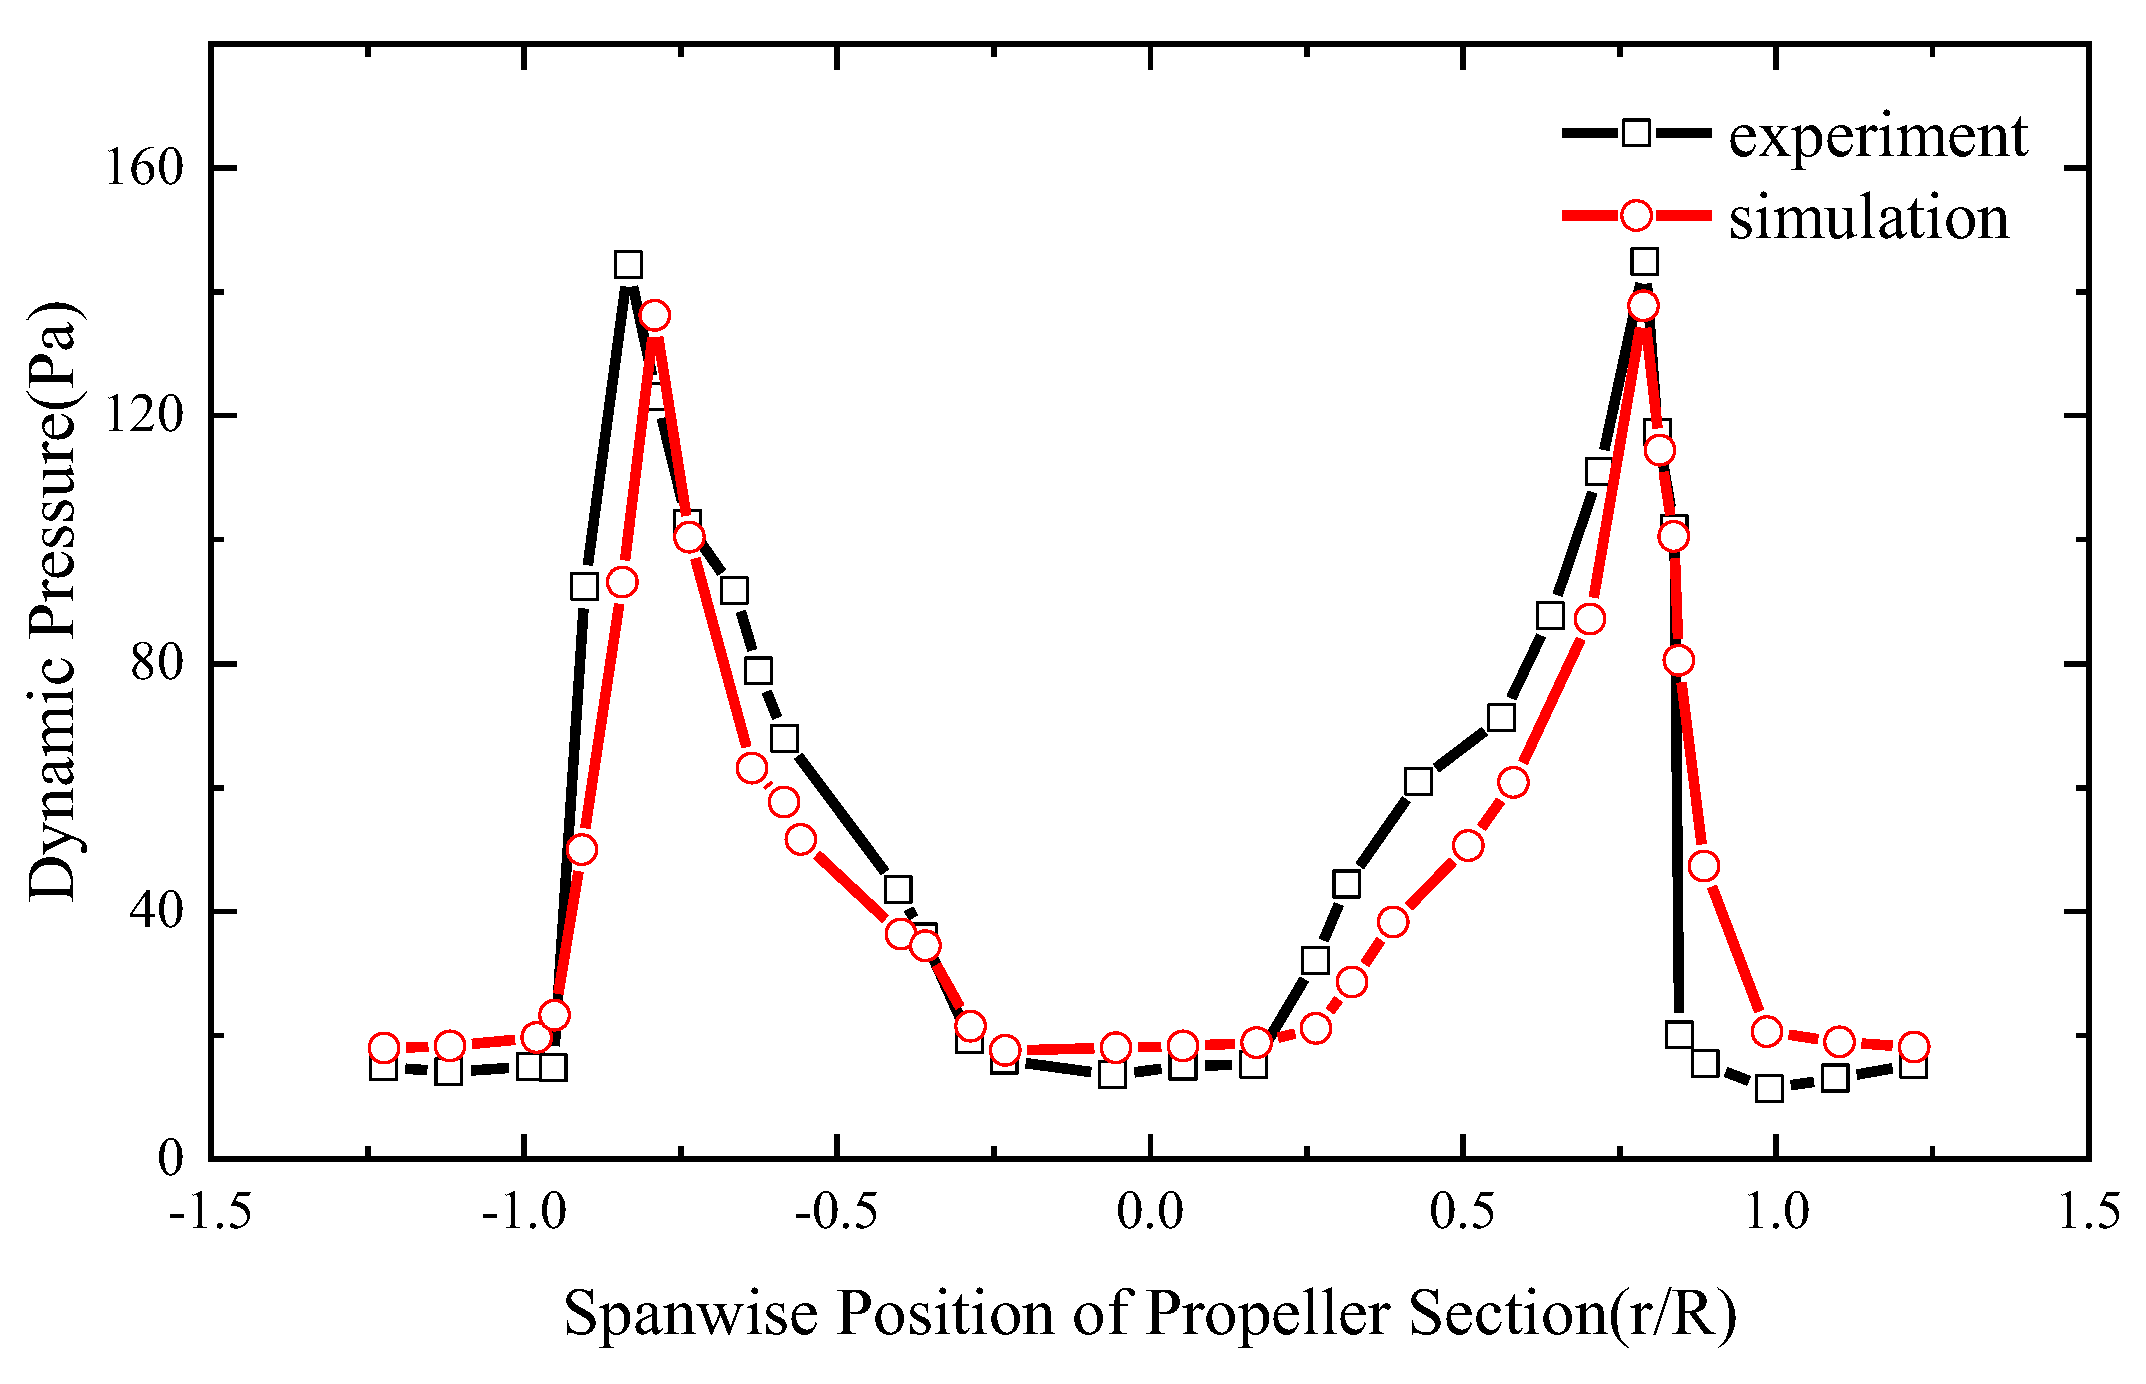
The momentum source simulation method used in this paper is in good agreement with the experimental results. It can be used as a quasi-steady method to calculate the effects of multi-UAV aerodynamic disturbances.
(2)
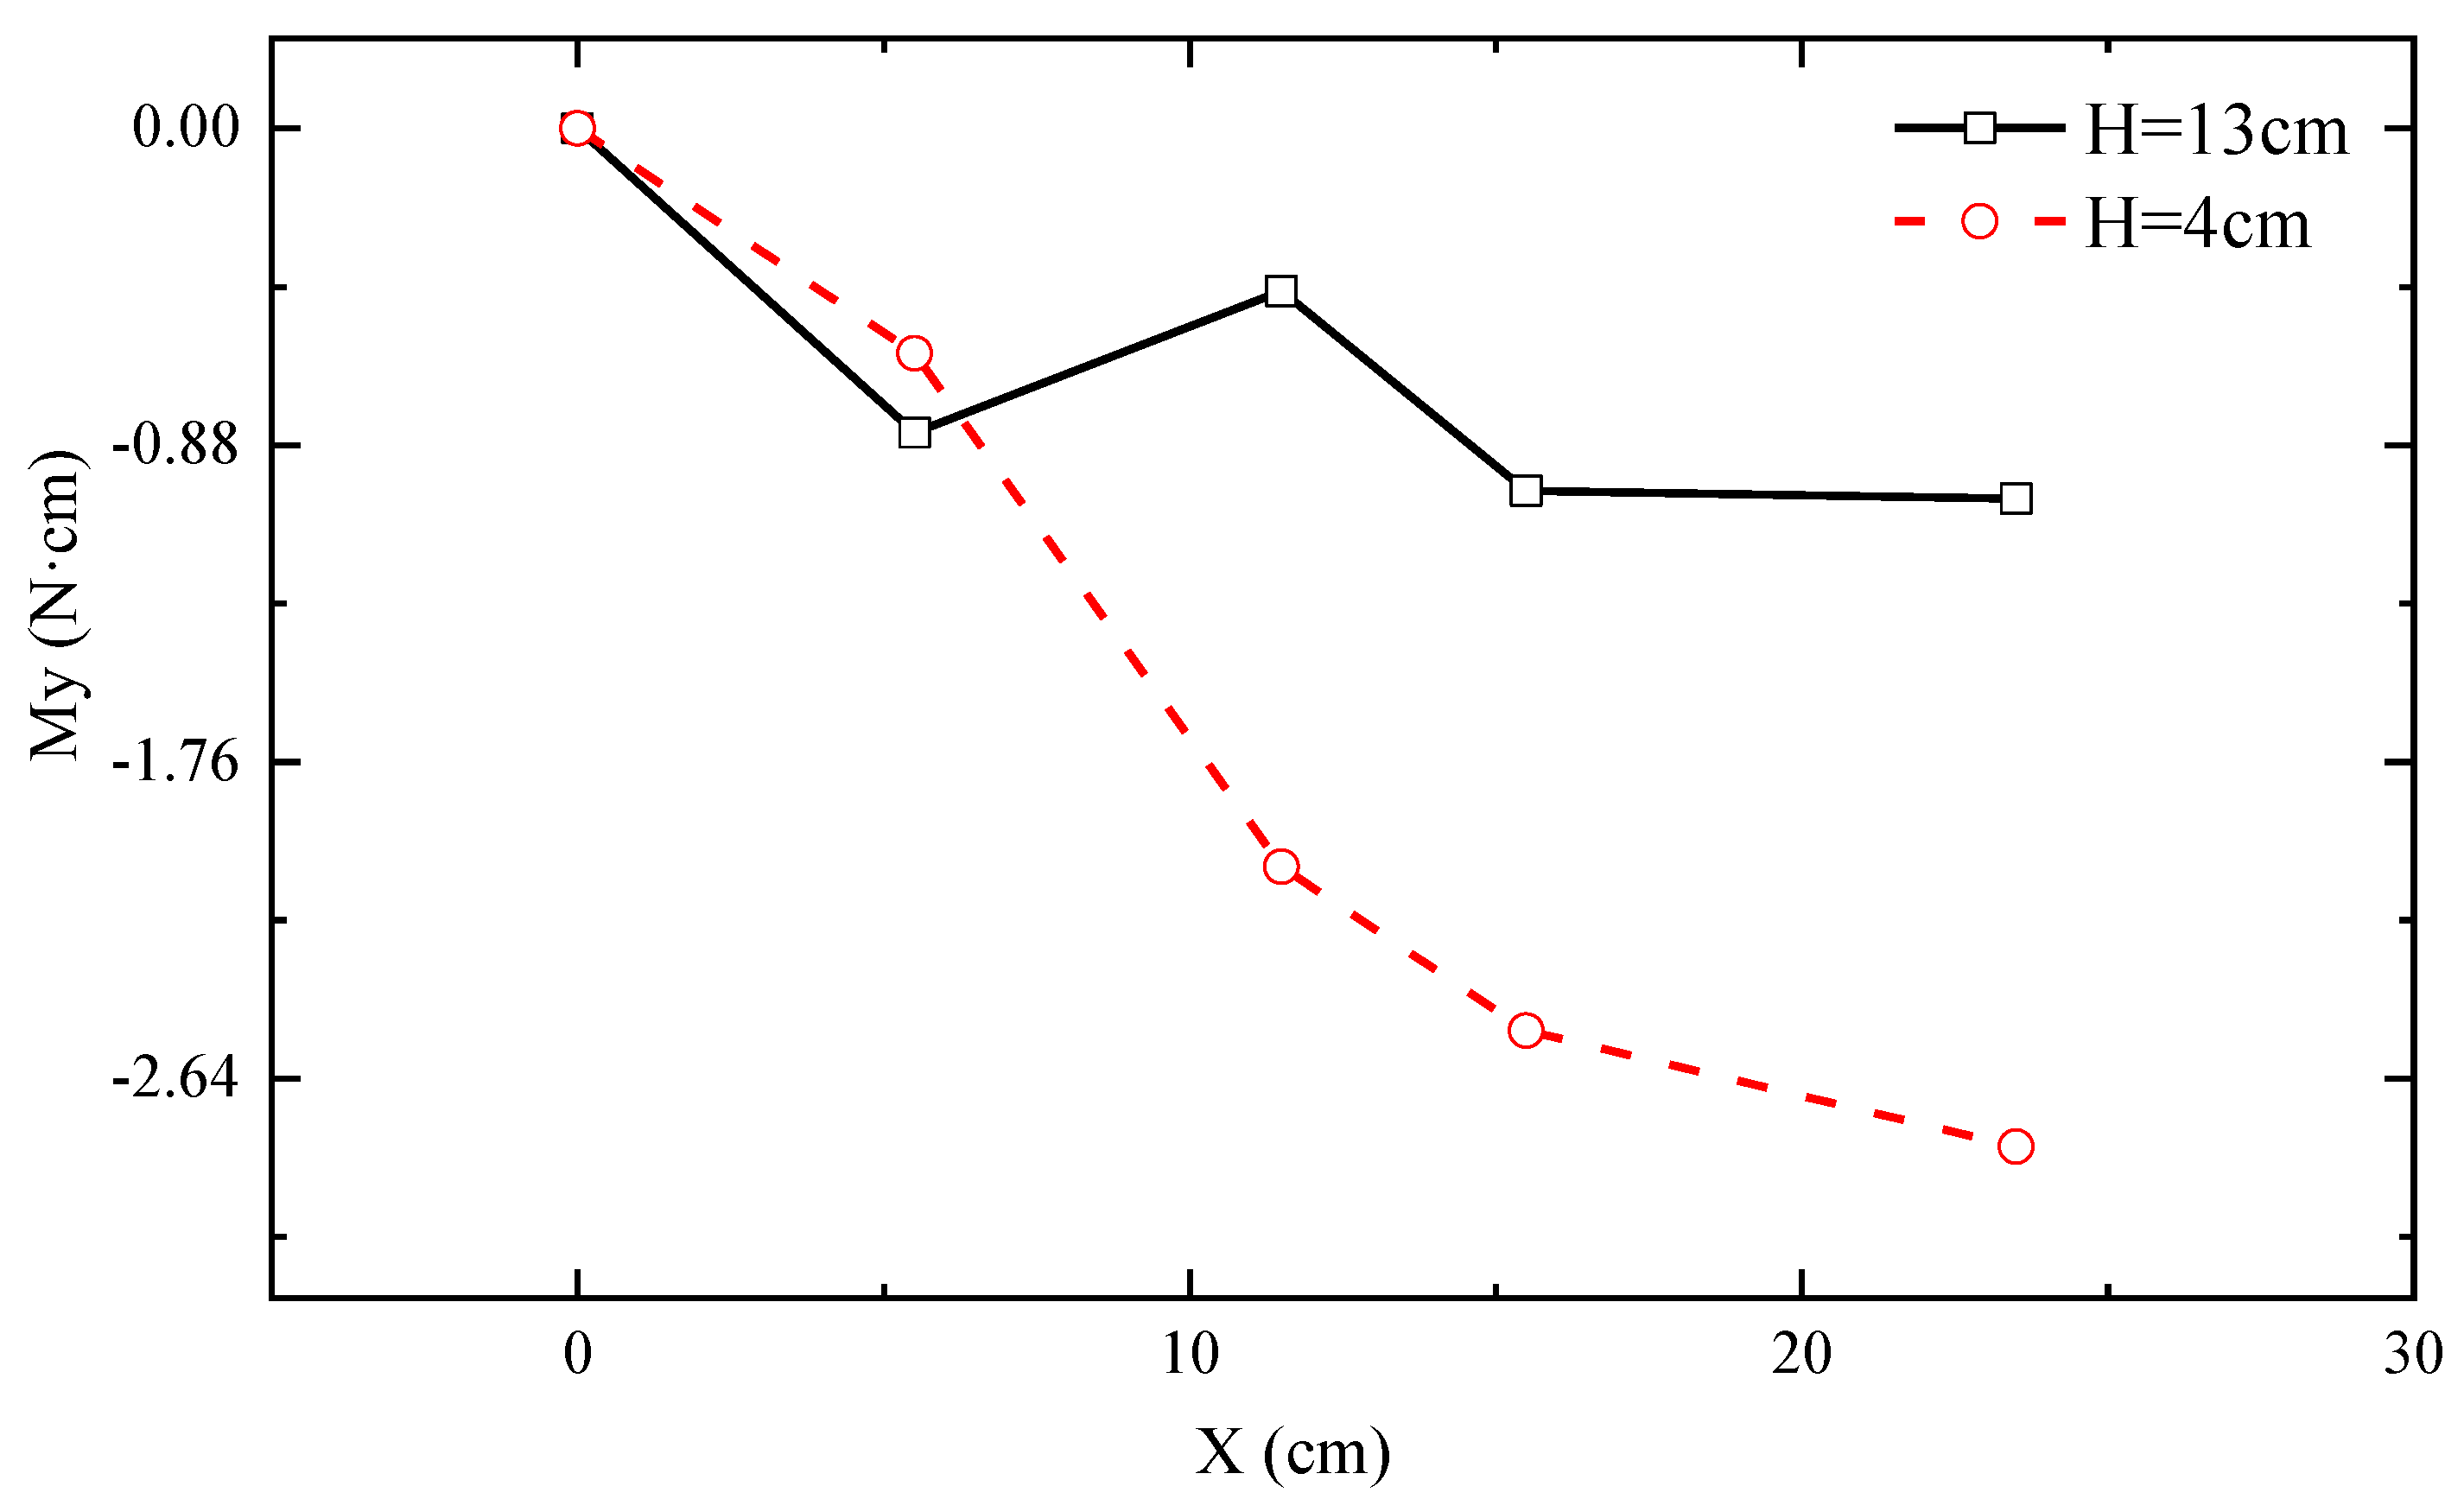
The results show that the influence of the lower parent UAV on the upper child UAV cannot be ignored. In the longitudinal direction, there is a strong aerodynamic disturbance above the parent rotors, with a maximum lift loss of 33% of the child UAV. In the aera above the body of parent UAV, the lift of child UAV changes rapidly, from a 27.4% increment to a 10% lift loss. In the horizontal direction, the lift of the child UAV decreases significantly, and there is an asymmetric moment pointing to the nearest parent UAV rotor. These interferences may lead to instability of the child UAV, and this may even lead to collision between the child UAV and the parent UAV when the system does not respond properly.
(3)
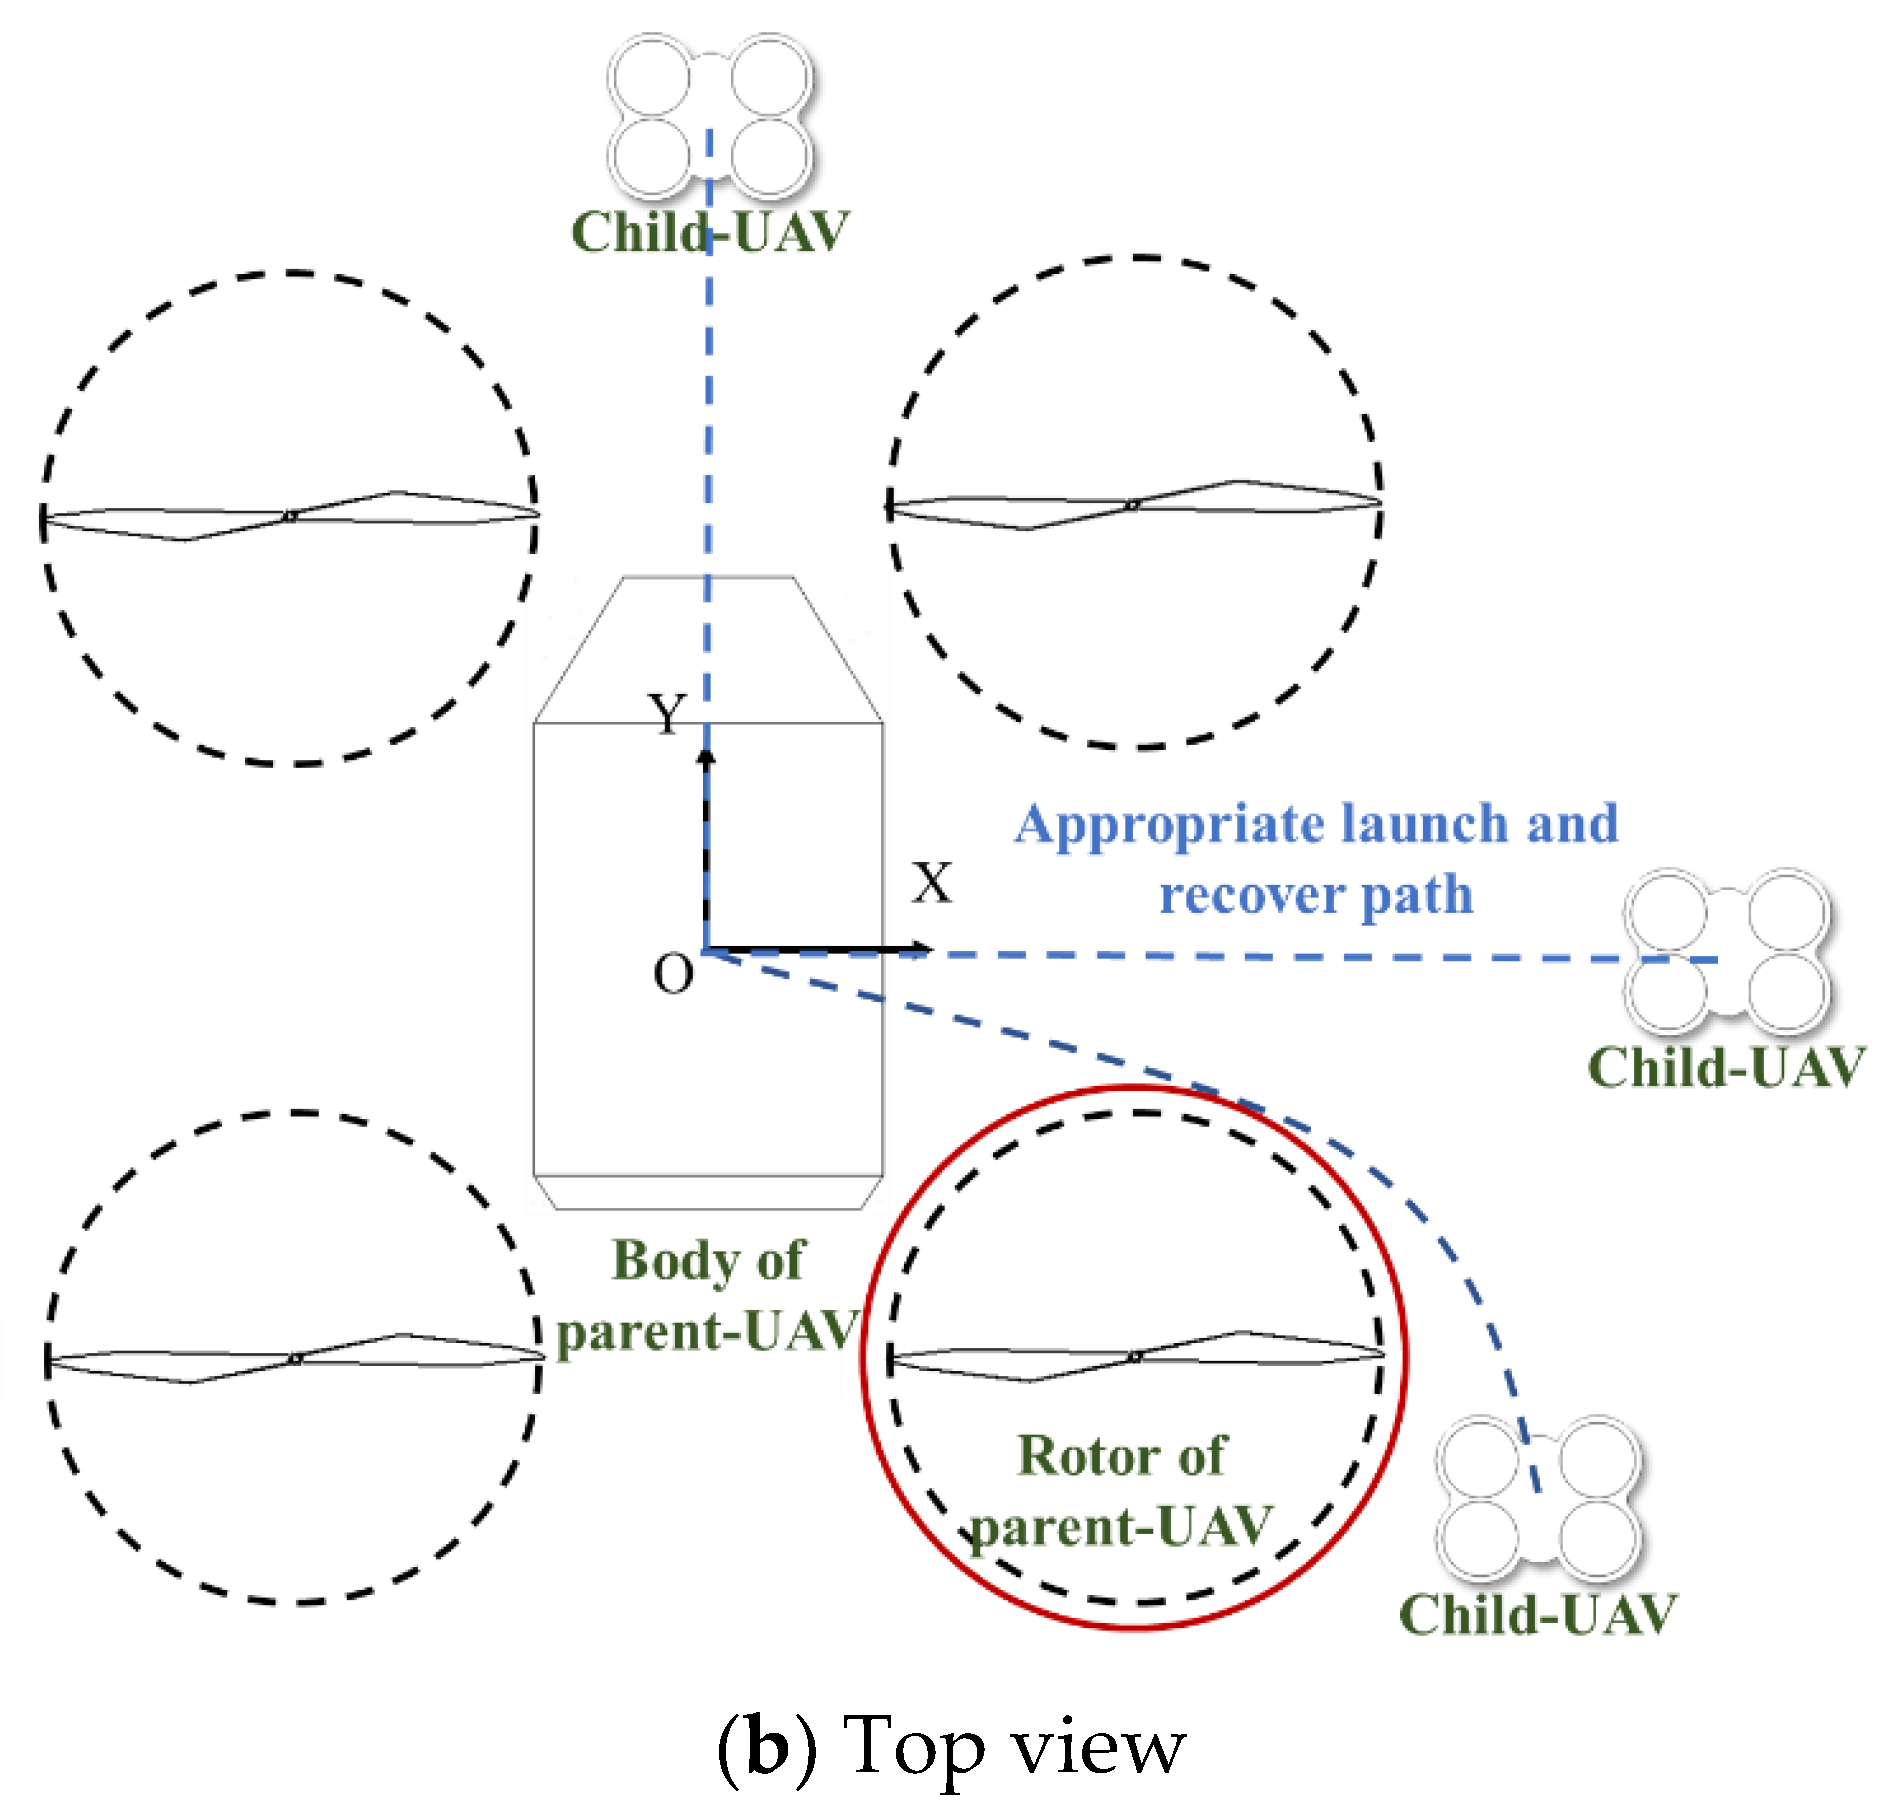
A static safe flight boundary and recommended paths in the launch and recovery progress have been concluded in this paper. This research of aerodynamic interference between multi-UAVs provides a reference for the safe flight strategy in the progress of air launch and recovery.

Author Contributions

Conceptualization, H.L. and D.L.; methodology, H.L.; software, H.L. and Y.L.; validation, Y.L.; formal analysis, H.L. and D.B.; investigation, H.L.; resources, D.L.; data curation, H.L.; writing original draft preparation, H.L.; writing review and editing, D.B. and Z.K.; visualization, H.L.; supervision, Z.K.; project administration, Z.K.; funding acquisition, D.L. All authors have read and agreed to the published version of the manuscript.

Funding

This research was funded by the National Key Research and Development Project, grant number 2020YFC1512500.

Institutional Review Board Statement

Not applicable.

Informed Consent Statement

Not applicable.

Data Availability Statement

Not applicable.

Conflicts of Interest

The authors declare no conflict of interest.

Abbreviations

The following abbreviations are used in this manuscript:
UASunmanned aircraft system
UAVsunmanned aerial vehicles

References

  1. Calhoun, M.P. DARPA Emerging Technologies. Strateg. Stud. Q. 2016, 10, 91–114. [Google Scholar]
  2. Throneberry, G.; Hocut, C.M.; Abdelkefi, A. Multi-Rotor Wake Propagation and Flow Development Modeling: A Review. Prog. Aerosp. Sci. 2021, 127, 100762. [Google Scholar] [CrossRef]
  3. Savkin, A.V.; Huang, H. A Method for Optimized Deployment of a Network of Surveillance Aerial Drones. IEEE Syst. J. 2019, 13, 4474–4477. [Google Scholar] [CrossRef]
  4. Cacace, J.; Finzi, A.; Lippiello, V.; Furci, M.; Mimmo, N.; Marconi, L. A Control Architecture for Multiple Drones Operated via Multimodal Interaction in Search & Rescue Mission. In Proceedings of the 2016 IEEE International Symposium on Safety, Security, and Rescue Robotics (SSRR), Lausanne, Switzerland, 23–27 October 2016; pp. 233–239. [Google Scholar] [CrossRef]
  5. Ruwaimana, M.; Satyanarayana, B.; Otero, V.; Muslim, A.M.; Muhammad Syafiq, A.; Ibrahim, S.; Raymaekers, D.; Koedam, N.; Dahdouh-Guebas, F. The Advantages of Using Drones over Space-Borne Imagery in the Mapping of Mangrove Forests. PLoS ONE 2018, 13, e0200288. [Google Scholar] [CrossRef] [PubMed]
  6. Chowdhury, S.; Emelogu, A.; Marufuzzaman, M.; Nurre, S.G.; Bian, L. Drones for Disaster Response and Relief Operations: A Continuous Approximation Model. Int. J. Prod. Econ. 2017, 188, 167–184. [Google Scholar] [CrossRef]
  7. Gecgel, M. Modeling and Simulation of Coaxial-Rotor Helicopter Aerodynamics in Hover and Forward Flight. In Proceedings of the 7th Ankara International Aerospace Conference, Ankara, Turkey, 13–15 September 2018. [Google Scholar]
  8. Misiorowski, M.; Gandhi, F.; Oberai, A.A. Computational Study on Rotor Interactional Effects for a Quadcopter in Edgewise Flight. AIAA J. 2019, 57, 5309–5319. [Google Scholar] [CrossRef]
  9. Hwang, J.Y.; Jung, M.K.; Kwon, O.J. Numerical Study of Aerodynamic Performance of a Multirotor Unmanned-Aerial-Vehicle Configuration. J. Aircr. 2015, 52, 839–846. [Google Scholar] [CrossRef]
  10. Kang, N.; Sun, M. Simulated Flowfields in Near-Ground Operation of Single- and Twin-Rotor Configurations. J. Aircr. 2000, 37, 214–220. [Google Scholar] [CrossRef]
  11. Chiew, J.J.; Aftosmis, M.J. Efficient Simulation of Multi-Rotor Vehicles with Low Reynolds Number Propellers. In Proceedings of the 2018 Applied Aerodynamics Conference, Atlanta, GA, USA, 25–29 June 2018. [Google Scholar] [CrossRef]
  12. Bardera Mora, R.; Matías García, J.C. Helicopter Rotor Ground Effect and Frigate Interaction Investigated by Particle Image Velocimetry. AIAA J. 2021, 1–15. [Google Scholar] [CrossRef]
  13. Nakata, T.; Phillips, N.; Simões, P.; Russell, I.J.; Cheney, J.A.; Walker, S.M.; Bomphrey, R.J. Aerodynamic Imaging by Mosquitoes Inspires a Surface Detector for Autonomous Flying Vehicles. Science 2020, 368, 634–637. [Google Scholar] [CrossRef] [PubMed]
  14. Pasquali, C.; Serafini, J.; Bernardini, G.; Milluzzo, J.; Gennaretti, M. Numerical-Experimental Correlation of Hovering Rotor Aerodynamics in Ground Effect. Aerosp. Sci. Technol. 2020, 106, 106079. [Google Scholar] [CrossRef]
  15. Cheeseman, I.C.; Bennett, W.E. The Effect of the Ground on a Helicopter Rotor in Forward Flight. Aeronaut. Res. Counc. Rep. Memo. 1955, 3021, 12. [Google Scholar]
  16. Aich, S.; Ahuja, C.; Gupta, T.; Arulmozhivarman, P. Analysis of Ground Effect on Multi-Rotors. In Proceedings of the 2014 International Conference on Electronics, Communication and Computational Engineering (ICECCE), Hosur, India, 17–18 November 2014; pp. 236–241. [Google Scholar] [CrossRef]
  17. Raza, S.A.; Sutherland, M.; Etele, J.; Fusina, G. Experimental Validation of Quadrotor Simulation Tool for Flight within Building Wakes. Aerosp. Sci. Technol. 2017, 67, 169–180. [Google Scholar] [CrossRef]
  18. Paz, C.; Suárez, E.; Gil, C.; Baker, C. CFD Analysis of the Aerodynamic Effects on the Stability of the Flight of a Quadcopter UAV in the Proximity of Walls and Ground. J. Wind Eng. Ind. Aerodyn. 2020, 206. [Google Scholar] [CrossRef]
  19. Casalino, D.; van der Velden, W.C.P.; Romani, G. Community Noise of Urban Air Transportation Vehicles. In Proceedings of the AIAA Scitech 2019 Forum, San Diego, CA, USA, 7–11 January 2019. [Google Scholar] [CrossRef]
  20. Casalino, D.; van der Velden, W.C.P.; Romani, G.; Gonzalez-Martino, I. Aeroacoustic Analysis of Urban Air Operations Using the Lb/Vles Method. In Proceedings of the 25th AIAA/CEAS Aeroacoustics Conference 2019, Delft, The Netherlands, 20–23 May 2019. [Google Scholar] [CrossRef]
  21. Khromov, V.; Rand, O. Ground Effect Modeling for Rotary-Wing Simulation. In Proceedings of the 26th International Congress of the Aeronautical Sciences, Anchorage, Ak, USA, 14–19 September 2008; Volume 6, pp. 511–520. [Google Scholar]
  22. Jain, K.P.; Fortmuller, T.; Byun, J.; Makiharju, S.A.; Mueller, M.W. Modeling of Aerodynamic Disturbances for Proximity Flight of Multirotors. In Proceedings of the 2019 International Conference on Unmanned Aircraft Systems (ICUAS), Atlanta, GA, USA, 11–14 June 2019; pp. 1261–1269. [Google Scholar] [CrossRef]
  23. Gennaretti, M.; Bernardini, G. Novel Boundary Integral Formulation for Blade-Vortex Interaction Aerodynamics of Helicopter Rotors. AIAA J. 2007, 45, 1169–1176. [Google Scholar] [CrossRef]
  24. Cao, Y.; Zhao, M.; Hu, A. Numerical Simulation of Rotor-Fuselage-Cylinder Interaction in Forward Flight. J. Aircr. 2010, 47, 1426–1430. [Google Scholar] [CrossRef]
  25. Guntupalli, K.; Rajagopalan, R.G. Development of Discrete Blade Momentum Source Method for Rotors in an Unstructured Solver. In Proceedings of the 50th AIAA Aerospace Sciences Meeting including the New Horizons Forum and Aerospace Exposition, Nashville, TN, USA, 9–12 January 2012; pp. 1–23. [Google Scholar] [CrossRef]
  26. Guntupalli, K.; Helitek, S. Development, Validation and Verification of the Momentum Source Model for Discrete Rotor Blades. Ph.D. Thesis, Iowa State University, Ames, IA, USA, 2011. [Google Scholar]
  27. Kakimpa, B.; Hargreaves, D.M.; Owen, J.S.; Martinez-Vazquez, P.; Bakers, C.J.; Sterling, M.; Quinn, A.D. CFD Modelling of Free-Flight and Auto-Rotation of Plate Type Debris. Wind. Struct. Int. J. 2010, 13, 169–189. [Google Scholar] [CrossRef]
  28. Joo, S.; Choi, H.; Lee, J. Aerodynamic Characteristics of Two-Bladed H-Darrieus at Various Solidities and Rotating Speeds. Energy 2015, 90, 439–451. [Google Scholar] [CrossRef]
  29. Mohamed, O.S.; Ibrahim, A.A.; Etman, A.K.; Abdelfatah, A.A.; Elbaz, A.M.R. Numerical Investigation of Darrieus Wind Turbine with Slotted Airfoil Blades. Energy Convers. Manag. X 2020, 5, 100026. [Google Scholar] [CrossRef]
  30. McKee, W.; Naeseth, R.L. Experimental Investigation of the Drag of Flat Plates and Cylinders in the Slipstream of a Hovering Rotor; NASA: Washington, DC, USA, 1958; Volume NACA TN 4239. [Google Scholar]
  31. Yoon, S.; Chan, W.M.; Pulliam, T.H. Computations of Torque-Balanced Coaxial Rotor Flows. In Proceedings of the 55th AIAA Aerospace Sciences Meeting, Grapevine, TX, USA, 9–13 January 2017; pp. 1–12. [Google Scholar] [CrossRef]
Figure 1. Schematic diagram of the launch and recovery process of the marsupial UAS.
Aerospace 10 00175 g001
Figure 2. Research model and parameters.
Aerospace 10 00175 g002
Figure 3. Experiment setup of aerodynamic interference.
Aerospace 10 00175 g003
Figure 4. Experimental functional diagram.
Aerospace 10 00175 g004
Figure 5. Schematic representation of the conversion of the blade force.
Aerospace 10 00175 g005
Figure 6. Z-velocity distribution in the section of y = 0.175 span.
Aerospace 10 00175 g006
Figure 7. Mesh detail.
Aerospace 10 00175 g007
Figure 8. Three interference areas in this study.
Aerospace 10 00175 g008
Figure 9. The lift curve of the child UAV in the body interference area.
Aerospace 10 00175 g009
Figure 10. Schematic diagram of the influence extent above the body.
Aerospace 10 00175 g010
Figure 11. The lift/power of the child UAV in the body interference area.
Aerospace 10 00175 g011
Figure 12. The lift of the child UAV in the interference area above a rotor.
Aerospace 10 00175 g012
Figure 13. The lift/power of the child UAV in the interference area above a rotor.
Aerospace 10 00175 g013
Figure 14. Schematic diagram of the influence extent above a rotor.
Aerospace 10 00175 g014
Figure 15. The lift of child UAV in body-outside transition area.
Aerospace 10 00175 g015
Figure 16. The lateral moment of child UAV in body-outside transition area.
Aerospace 10 00175 g016
Figure 17. The lift of child UAV in rotor-outside transition area.
Aerospace 10 00175 g017
Figure 18. The lateral moment of child UAV in rotor-outside transition area.
Aerospace 10 00175 g018
Figure 19. Schematic diagram of the influence extent above a rotor.
Aerospace 10 00175 g019
Figure 20. Pressure contours in body interference area.
Aerospace 10 00175 g020aAerospace 10 00175 g020b
Figure 21. Pressure distribution of child UAV in different height.
Aerospace 10 00175 g021
Figure 22. Flow field figure when the child UAV is right above the parent UAV rotor.
Aerospace 10 00175 g022
Figure 23. The flow filed of body-outside transition area.
Aerospace 10 00175 g023
Figure 24. The safe flight boundary and appropriate path of children-UAVs.
Aerospace 10 00175 g024aAerospace 10 00175 g024b
Table 1. Marsupial UAS parameters.
ParametersData
Rotor radius of child UAV(Rc)/cm5.0
Rotor radius of parent UAV(Rp)/cm22.85
Diagonal size of child UAV/cm20.4
Diagonal size of parent UAV/cm108.0
Size of child UAV/cm29.0 × 27.0 × 2.7
Size of parent UAV/cm122.0 × 122.0 × 45.0
Weight of child UAV/kg0.418
Weight of parent UAV/kg6.0
Disclaimer/Publisher’s Note: The statements, opinions and data contained in all publications are solely those of the individual author(s) and contributor(s) and not of MDPI and/or the editor(s). MDPI and/or the editor(s) disclaim responsibility for any injury to people or property resulting from any ideas, methods, instructions or products referred to in the content.

